Article

Handwritten Signature Generation Using Denoising Diffusion Probabilistic Models with Auxiliary Classification Processes

1
Information Convergence Engineering Department, Pusan National University, 2 Busandaehak-ro 63beon-gil, Geumjeong-gu, Busan 46241, Republic of Korea
2
Department of Artificial Intelligence Convergence, Pukyong National University, Yongso-ro 45, Nam-gu, Busan 48513, Republic of Korea
*
Authors to whom correspondence should be addressed.
Appl. Sci. 2024, 14(22), 10233; https://doi.org/10.3390/app142210233
Submission received: 9 October 2024 / Revised: 30 October 2024 / Accepted: 4 November 2024 / Published: 7 November 2024

Abstract

:
Automatic signature verification has been widely studied for authentication purposes in real life, but limited data availability still poses a significant challenge. To address this issue, we propose a method with a denoising diffusion probabilistic model (DDPM) to generate artificial signatures that closely resemble authentic ones. In the proposed method, we modified the noise prediction process of the DDPM to allow the generation of signatures specific to certain classes. We also employed an auxiliary classification process to ensure that the generated signatures closely resemble the originals. The model was trained and evaluated using the CEDAR signature dataset, a widely used collection of offline handwritten signatures for signature verification research. The results indicate that the generated signatures exhibited a high similarity to the originals, with an average structural similarity index (SSIM) of 0.9806 and a root mean square error (RMSE) of 0.1819. Furthermore, when the generated signatures were added to the training data and the signature verification model was retrained and validated, the model achieved an accuracy of 94.87% on the test data, representing an improvement of 0.061 percentage points compared to training on only the original dataset. These results indicate that the generated signatures reflect the diversity that original signatures may exhibit and that the generated data can enhance the performance of verification systems. The proposed method introduces a novel approach to utilizing DDPM for signature data generation and demonstrates that the auxiliary classification process can reduce the likelihood of generated data being mistaken for forged signatures.

1. Introduction

A signature is a behavior-based biometric characteristic that is unique to an individual. It is widely used across various fields, such as finance, administration, and law, as a crucial method for verifying personal identity and conferring legal validity. Since each individual has a unique signature style, it is not a physical characteristic but can still be used to distinguish identity. Since a signature is not a physical characteristic of an individual, it is relatively easier to forge compared to other security elements. Because determining the authenticity of signatures is difficult due to variations in signature styles and the expertise of forgers, many researchers have been attempting to devise signature verification systems.
Recent signature verification systems have employed methods such as hidden Markov models [1], support vector machines [2,3,4], and neural networks or deep learning [5,6,7,8,9,10,11,12,13,14]. These systems demonstrate good verification performance, but a limitation of these systems is the requirement of multiple signatures from the actual user in training in order to verify the user’s signature data.
This drawback is particularly pronounced in deep learning-based methods, which require large datasets. To address this issue, data augmentation techniques are being employed, and various methods have been proposed in order to artificially generate signature data and augment training data. Mitchell et al. [15] and Gupta et al. [16] proposed signature verification models utilizing transfer learning. They addressed the issue of data scarcity by augmenting the data using traditional image processing techniques, such as rotation, scaling, and flipping. Najda et al. [17] proposed an online signature augmentation method using sinc interpolation, Gaussian noise addition, signal scaling and rotation, and time warping. Maruyama et al. [18] proposed an offline signature augmentation method using linear delta, interpolation–extrapolation, and random noise addition.
Numerous studies have also explored the generation of artificial signature data. Galbally et al. [19] introduced a method for creating a signature database using a signature generation algorithm based on spectral analyses. Arab et al. [20] proposed generating data via duplicating signature features through a synthetic feature generation method based on an artificial immune system rather than augmenting signature images. Venkata et al. [21] developed a method for synthesizing offline signatures, which is inspired by the mortal neuromotor model. Their model is divided into a neuromotor converse model process, which replicates directional planning based on the sigma log-normal model, motor equivalence theory, and kinematic theory. Hameed et al. [22] presented a signature generation model using a generative adversarial network (GAN), demonstrating the creation of signatures that closely resemble original signatures.
Although these studies have demonstrated the feasibility of generating signatures that closely resemble original ones, and they have shown that the generation of signature data can positively impact signature verification performance, they largely rely on relatively simple techniques, such as geometric transformations and noise addition. This limits their ability to produce data, such as signatures that truly mimic new signatures created by the same individual. Furthermore, while GAN-based signature synthesis techniques effectively generate new data, the signatures tend to closely resemble training data with respect to the curve shape and stroke length, resulting in a lack of diversity and flexibility. As a result, similarly to earlier methods, the expectation that these techniques can produce signatures that convincingly appear as if they are newly created by the signer is ambitious.
In this study, we propose a method for generating signature data using the denoising diffusion probabilistic model (DDPM) [23]. DDPM is a generation model that learns complex data distributions by gradually adding noise to the data and then restoring it, demonstrating excellent performance in image generation. During the restoration process, DDPM generates data from Gaussian distribution noise, enabling the creation of new synthetic data that reflect the characteristics of the training data. This approach allows for the generation of more flexible and varied signature images. Additionally, we incorporated an auxiliary classification process into the generated model’s training process in order to produce generated signatures that closely resemble the original, making them suitable for training signature recognition systems. By training the proposed model with the CEDAR dataset [24] and generating signatures, we confirmed that the model can produce synthetic signatures with new forms while preserving the fine details present in the training data.
The main contribution of this study is the proposal of a method for generating signature images using a DDPM-based generative model, which includes an auxiliary classification process to compensate for data scarcity. The proposed model can learn detailed features of signatures, such as curves, line flow, and style, enabling it to produce signatures that closely resemble those used in training. This approach offers one possible solution to the challenge of requiring a large number of user signatures in the process of creating signature recognition systems.
This paper is organized as follows: Section 2 presents an explanation of the DDPM and the proposed auxiliary classification process, along with the model and generation model for this process. Section 3 describes the dataset used for the experiments and reports and evaluates the experimental results. Finally, Section 4 presents the conclusion and discusses future research directions.

2. Methodology

2.1. Denoising Diffusion Probabilistic Model

DDPM is a powerful generation model that can learn the probability distribution of data and generate new samples. Its basic structure comprises two processes: a diffusion forward process and a reverse process. In the diffusion forward process, noise is gradually added to the input data, progressively corrupting it. In the reverse process, the model works to restore the corrupted data to their original state. This process allows the model to learn the complex feature distribution of the data.
The diffusion forward process starts with the data x 0 and gradually adds noise to reach x T . At each step, the data x t are generated by adding noise to the data from the previous step, x t 1 . This noise follows a Gaussian distribution with an average of x t 1 1 β t and a variance of β t I , where I is the identity matrix. Through this process, x t gradually moves away from the original data, eventually transforming into almost pure noise. The forward process can be expressed via the following equations:
q ( x 1 : T | x 0 ) = t = 1 T q ( x t | x t 1 )
q ( x t | x t 1 ) = N ( x t ; x t 1 1 β t , β t I )
Parameter β t governs the amount of noise added to the data at each time step t. It increases linearly at each step, introducing small increments of noise during the early stages of the diffusion forward process and larger amounts in the later stages. β t is defined as follows:
β t = β start + t β end β start T
The reverse process gradually reconstructs original data x 0 from the noise-corrupted data x T . The process of recovering the previous step x t 1 from the data x t at time step t, denoted as p θ ( x t 1 | x t ) , is expressed via the following equation. Here, θ represents the model’s parameters.
p θ ( x t 1 | x t ) = N ( x t 1 ; μ θ ( x t , t ) , σ t 2 I )
In the reverse process, the model follows a Gaussian distribution with an average of μ θ ( x t , t ) and a variance of σ t 2 I . The variance σ t 2 I is calculated as follows:
σ t 2 = 1 α ¯ t 1 1 α ¯ t β t
Here, α t represents the data retention rate, and at each step, α t is calculated as follows:
α t = 1 β t
α ¯ t is the cumulative retention rate, which is the product of all α values up to time step t. When expanded, it can be expressed as follows:
α ¯ t = s = 1 t α s = α 1 · α 2 · α 3 · α t 1 · α t
In Equation (4), the model average μ θ ( x t , t ) is expressed as shown below, where ϵ θ ( x t , t ) represents the predicted noise. In a standard DDPM model, a U-Net-based neural network is used to predict the noise.
μ θ ( x t , t ) = 1 α t x t β t 1 α ¯ t ϵ θ ( x t , t )
The entire reverse process is expressed as shown below. This equation represents the probability distribution of the full process, starting from generating initial noise data x T and progressively removing noise at each step to restore the original data x 0 .
p θ ( x 0 : T ) = p θ ( x T ) t = 1 T p θ ( x t 1 | x t )
The process of reconstructing the previous step x t 1 from data x t at time step t, p θ ( x t 1 | x t ) , can be summarized as follows by substituting Equation (8) into Equation (4).
p θ ( x t 1 | x t ) = N x t 1 ; 1 α t x t β t 1 α ¯ t ϵ θ ( x t , t ) , σ t 2 I

2.2. Proposed Signature Image Generation Model
The overall framework of the proposed signature image generation model is shown in Figure 1. In the diffusion forward process of the DDPM, Gaussian noise N is used to create noise β t for time step t, and noise is added to the training data x t 1 to create the noisy image x t . During the restoration process, the neural network model, trained to predict the noise β t added during the diffusion forward process, generates the predicted noise β ˜ t . This predicted noise is then used to restore x t to x ˜ t 1 . The key aspect of the DDPM training process is to train the neural network model in order to generate β ˜ t , which is most similar to β t for all time steps t.
As mentioned earlier, neural network models based on U-Net architecture are primarily used for noise prediction. U-Net [25] is a neural network architecture that is commonly used in computer vision, particularly excelling in tasks such as image restoration and segmentation. U-Net architecture involves downsampling the input image through multiple stages and then upsampling the information, allowing it to leverage local and global information within the image.
Additionally, DDPM employs time embedding to provide the noise prediction model with information about time step t. This type of time embedding informs the model with respect to which time step it is predicting noise for, guiding it to perform appropriate noise removal at each step. Typically, a positional encoding method based on sine–cosine periodic functions is used to transform integer time step t into an embedding vector.
The transformation process is as follows: d represents the size of the embedding vector, and i is the index corresponding to each dimension of the embedding vector.
TimeEmbedding ( t ) = sin t 10000 2 i d , cos t 10000 2 i d i = 1 d / 2
DDPM can generate images from a trained domain, starting with Gaussian noise, by incorporating time embedding into a U-Net-based noise prediction model. In the proposed method, three strategies were employed to develop a DDPM-based signature image generation model.
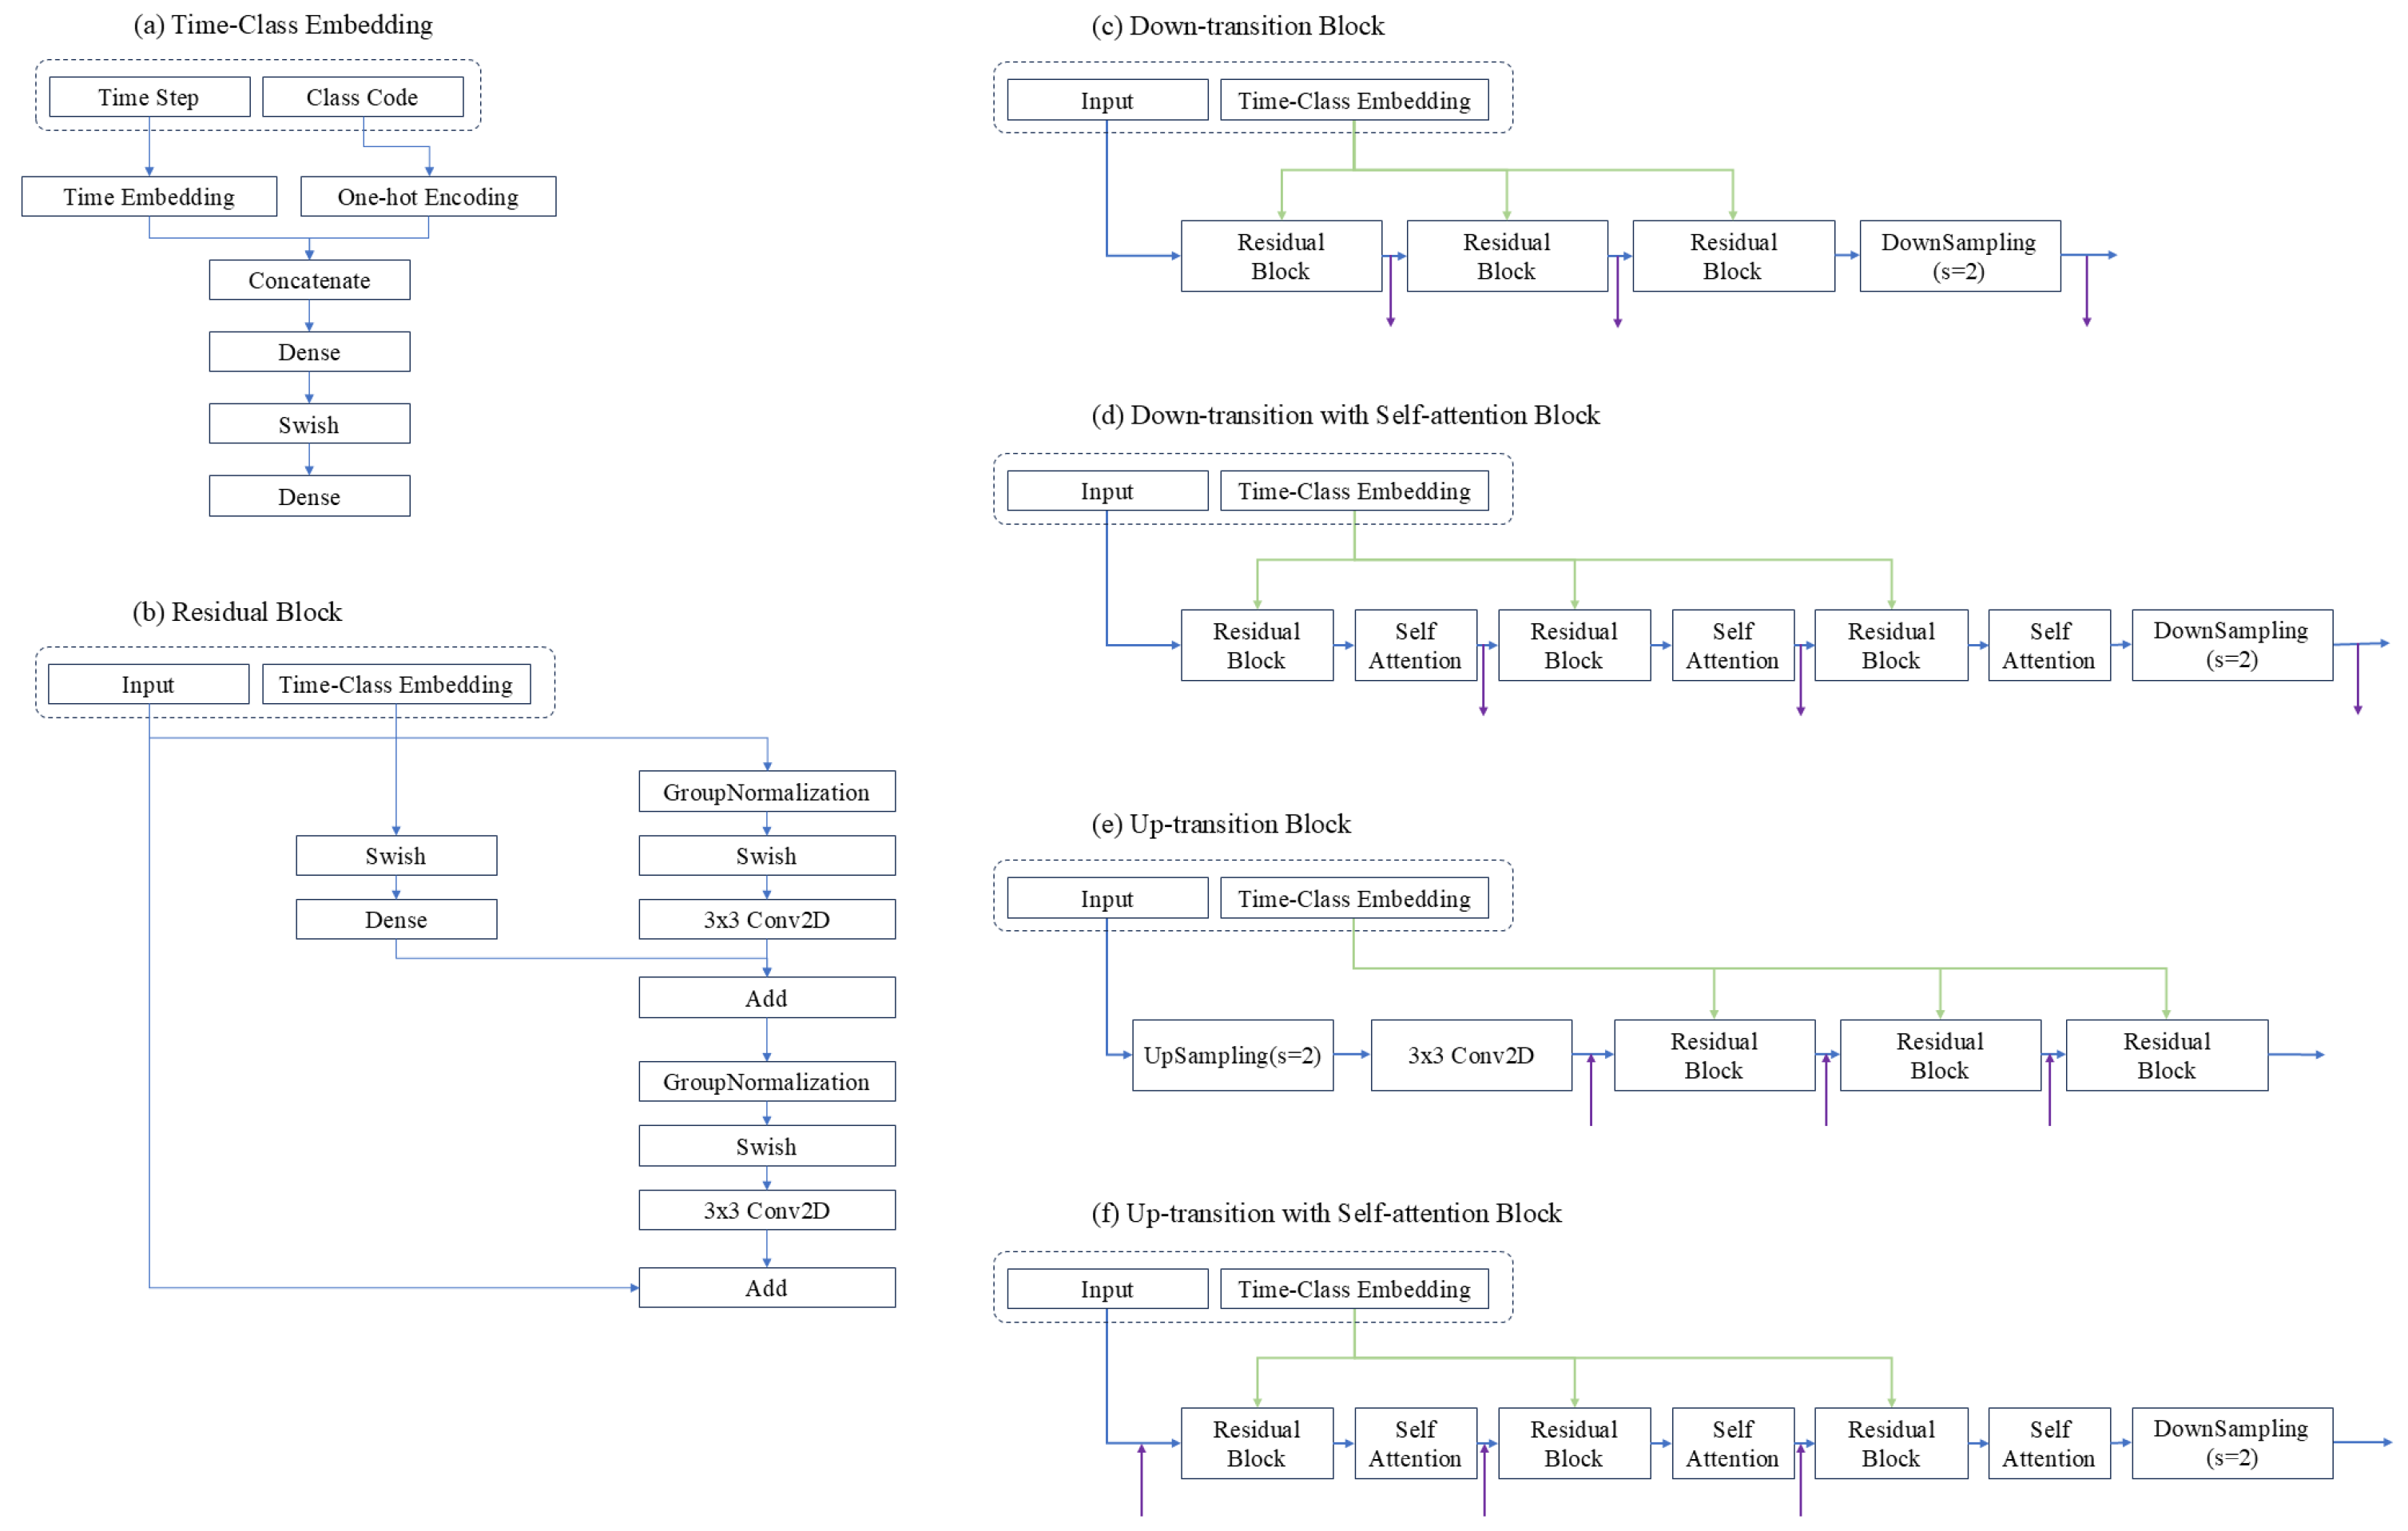
The first strategy is to guide the generation model to produce signatures for specific individuals. A typical DDPM learns and generates data without any special conditions; hence, when used as is, it can generate signatures arbitrarily for all individuals in the trained dataset without distinguishing between signers. However, since signature images are generally used to identify the signer, there are often cases where only the signatures of specific individuals are needed. When considering each signature as a distinct class, to enable the DDPM to generate signatures for a particular class, conditional predictions must be carried out to predict noise differently based on the class. By concatenating the class code with the time embedding calculated from time step t, we created a new time-class embedding and fed it into the prediction model to facilitate conditional generation. The time-class embedding is generated by a relatively small neural network layer, as depicted in Figure 3a.
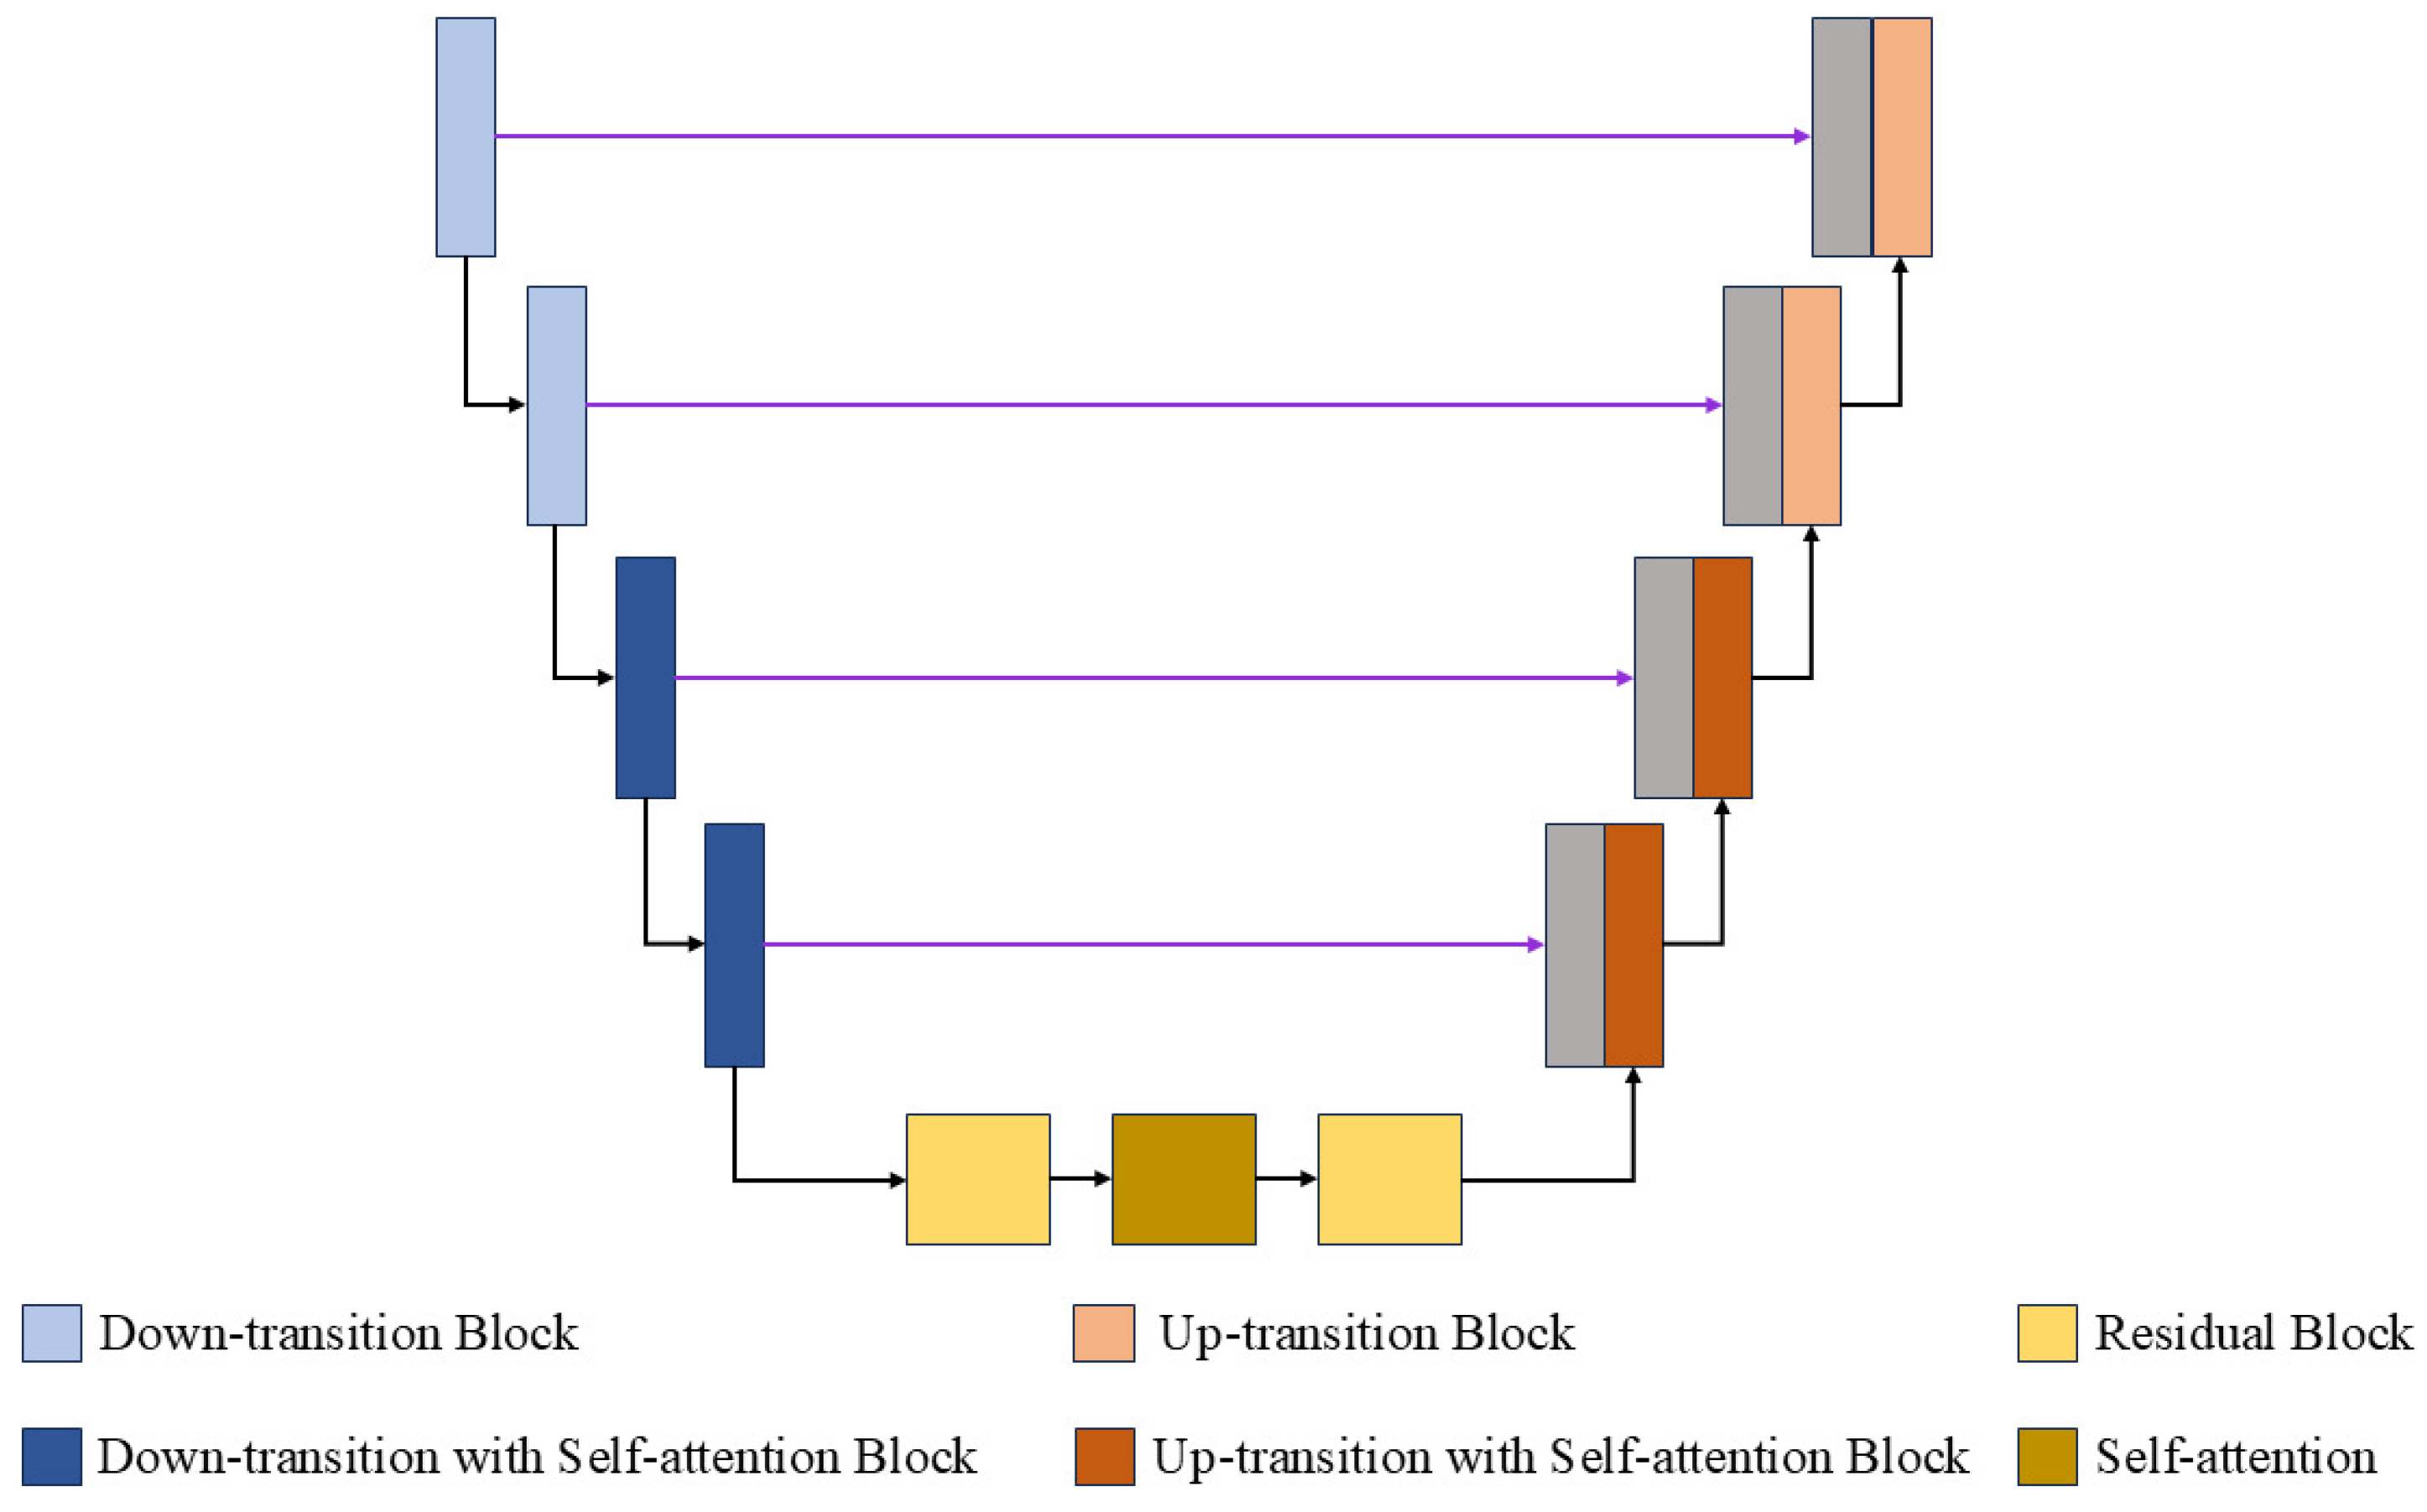
The second strategy is the improvement of the U-Net-based noise prediction module. In a typical U-Net structure, only the outputs of the last layers of the downsampling and upsampling paths at the same resolution are concatenated. In the proposed method, the noise prediction module contains an equal number of residual blocks at each resolution. In addition to the output of the last layer, concatenation is added between all corresponding blocks of the other residual blocks, increasing the number of skip connections. This approach is inspired by DenseNet [26], which demonstrates that dense connections between layers alleviate the vanishing gradient problem and facilitate a smooth transfer of information even with small-sized feature maps. Additionally, a self-attention mechanism [27] was incorporated into the residual blocks at deeper levels to address the long-term dependency issues that may arise in deep models. The noise prediction module has a sampling depth of 5, making it a deep and complex neural network model with 60 convolution layers included in the residual blocks. By addressing the long-term dependency problem through the self-attention mechanism, the model can effectively preserve and transmit the detailed information necessary for effective noise prediction. Figure 2 and Figure 3 illustrate the overall structure of the noise prediction module and the detailed structure of the blocks used within the module.
As the final strategy, the proposed method incorporates a classifier to distinguish forged signatures, which results in the generation of signature images that are similar to the original images. The classifier is pre-trained to differentiate between original and forged signature images before training the neural network model included in the DDPM. During the training process of the DDPM, when the time step t is 1, the model generates a noise-free signature image x ˜ 0 . Thus, the classifier receives x 0 and x ˜ 0 to determine whether the generated signature image possesses the characteristics of the original signature. The classifier is trained to output a value close to zero when it identifies an image as original and a value close to one if otherwise. To incorporate the classifier’s output into the signature generation model, we set the model’s loss function L to the sum of the mean squared error (MSE) between the predicted noise ϵ θ and actual ϵ and the classifier’s output C ( x 0 , x ˜ 0 ) . The weight λ for the classifier loss was set to one in this study. The details of the classifier are provided in Section 2.3.
L = MSE ( ϵ θ , ϵ ) + λ · C ( x 0 , x ˜ 0 )
Figure 2. Overall structure of the noise prediction module used in the generation model.
Applsci 14 10233 g002
Figure 3. Detailed structure of the blocks used in the noise prediction module.
Applsci 14 10233 g003

2.3. Classifier for Distinguishing Forged Signatures

The proposed signature generation model uses original signature images as training data, producing signatures that closely resemble the originals. However, in real-world scenarios, forged signatures present a significant challenge. Although forgeries can closely mimic authentic signatures, subtle differences, such as the pen’s pressure, spacing, and layout, can be used to differentiate them. To ensure our model generates signatures that closely replicate even these subtle characteristics, we trained a classifier to distinguish between original and forged signature images. By integrating the classifier’s output into the loss function, we aimed to enhance the similarity between the generated and original signatures from a classification perspective.
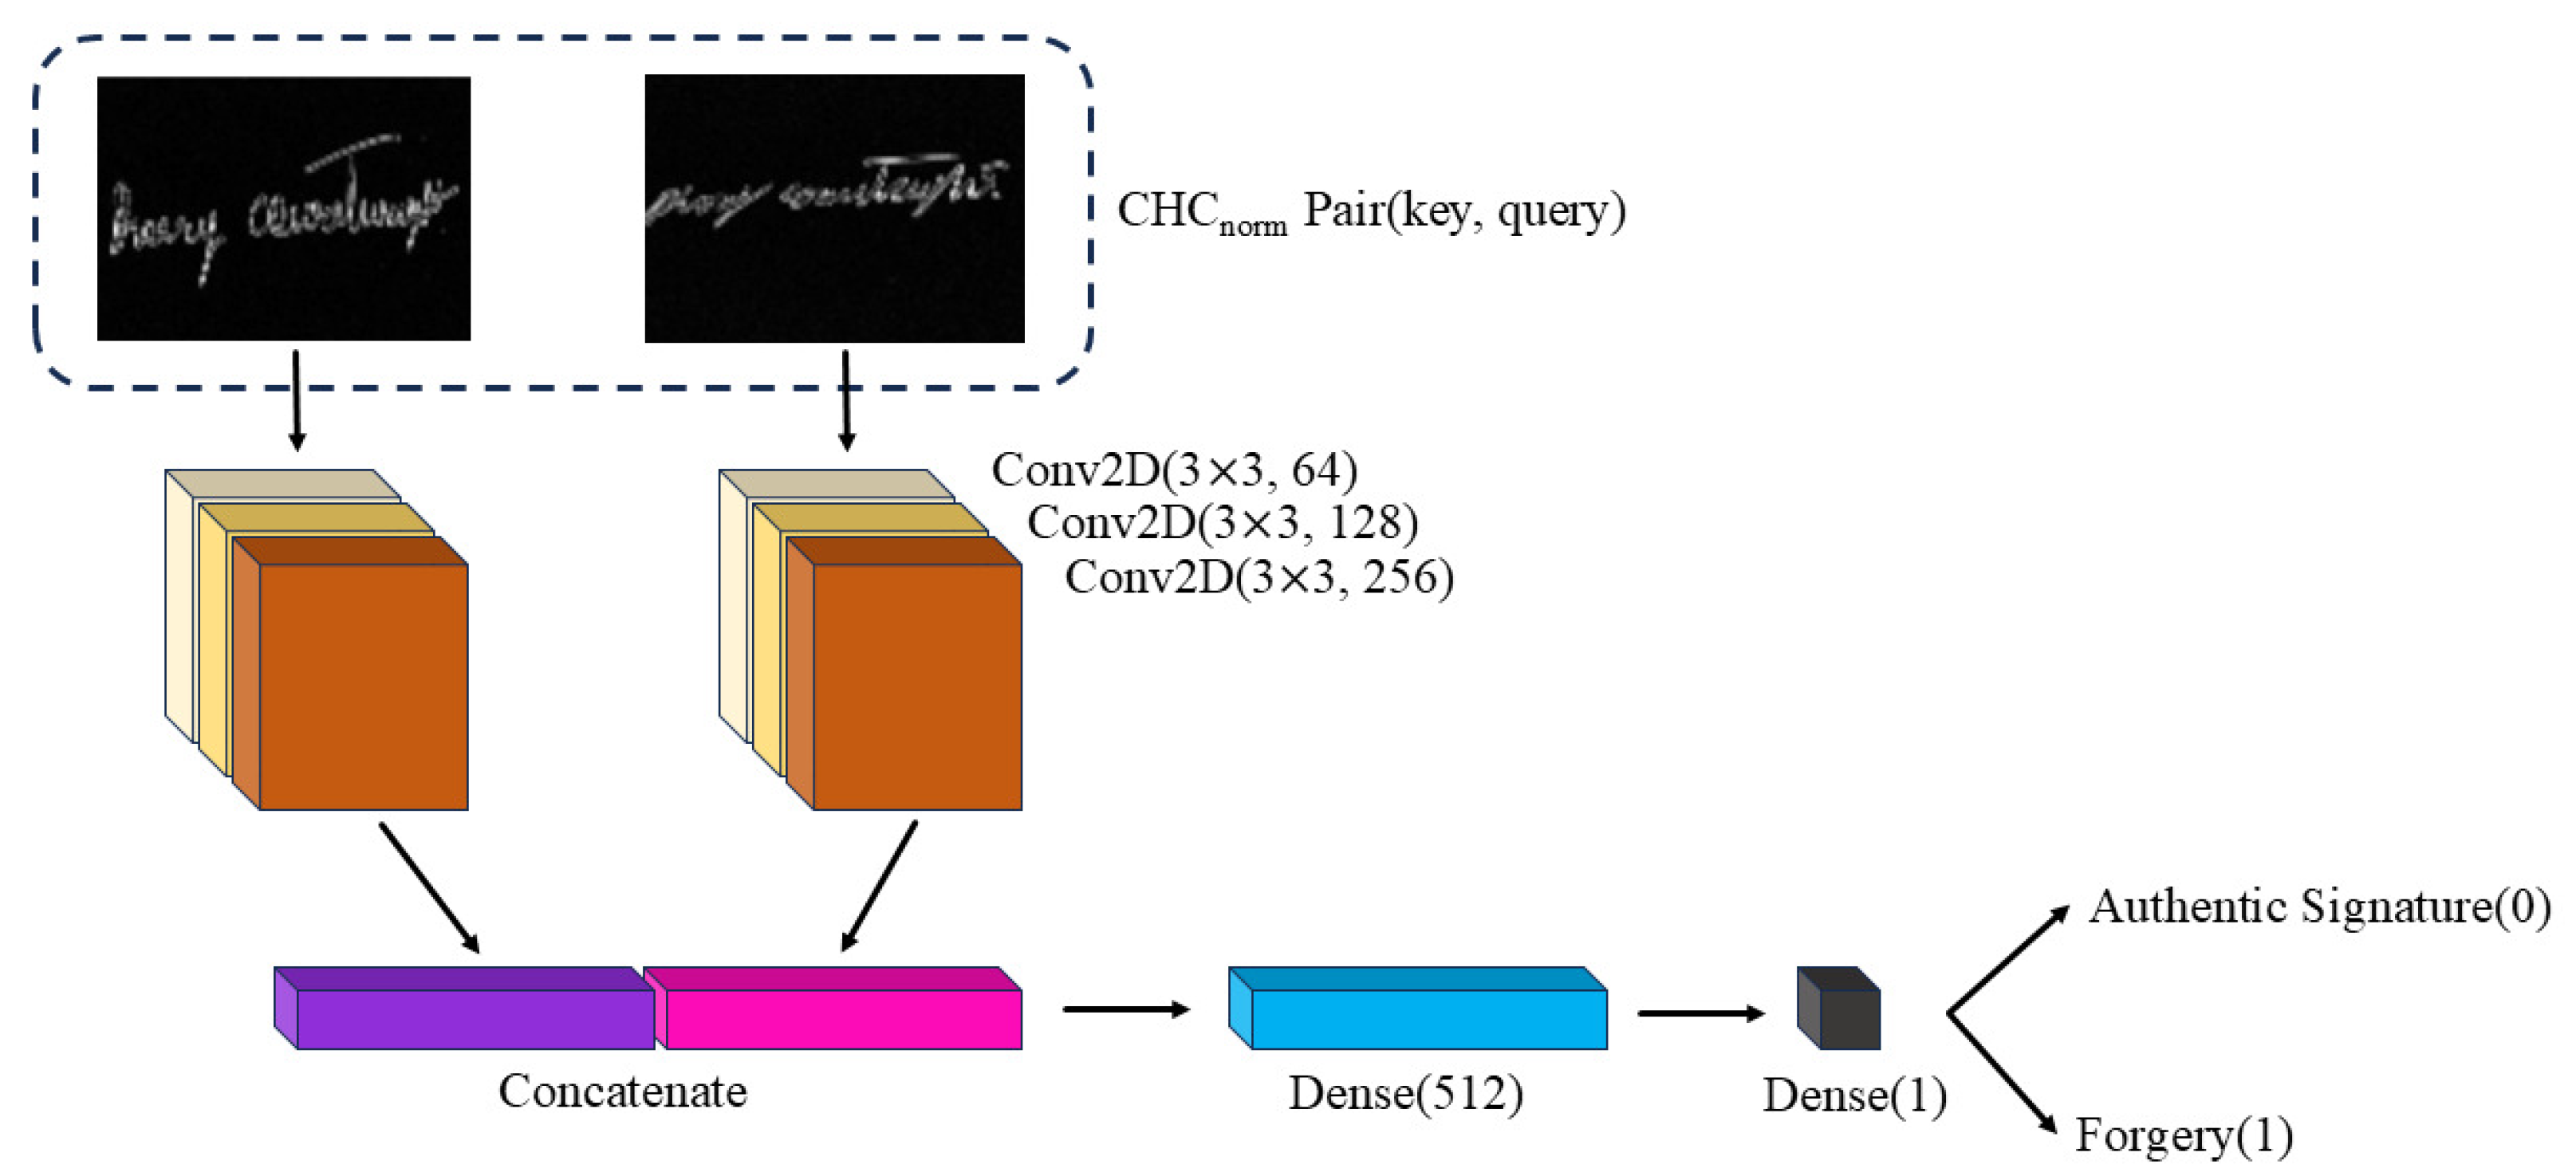
The classifier takes an image pair as input, which comprises either two original images or an original and a forged image, and classifies them accordingly. During this process, the signature image undergoes a wavelet transform to isolate the high-frequency components in the vertical, horizontal, and diagonal directions. After excluding the low-frequency band, the high-frequency components are combined and converted back into an image, which is then fed into the classifier. The original and forged signature images from the CEDAR dataset exhibit different background brightness levels. If used as training data without preprocessing, this background difference could impact classification results.
While methods such as thresholding [28] or optical flow algorithms [29] can be used to reduce background variations, our proposed method employs a preprocessing step using the wavelet transform [30] to emphasize the structural features of the signature. This is because thresholding or optical flow algorithms can blur the endpoints or boundaries of the signature, resulting in the loss of detailed information and negatively affecting classification performance. By applying the wavelet transform to the signature image, we extract high-frequency components c H , c V , and c D in the vertical, horizontal, and diagonal directions, respectively, and create a normalized combined high-coefficient C H C n o r m image. The process of creating C H C n o r m is determined via the following equation:
C H C = c H 2 , c V 2 , c D 2
C H C n o r m = C H C min ( C H C ) max ( C H C ) min ( C H C )
The C H C n o r m images generated for the original and forged signatures are passed to the classifier model as pairs of original signatures and pairs of original and forged signatures. The classifier determines whether the input image pairs are original signature pairs or not. In the convolution and dense layers, the activation function used is LeakyReLU, while the final layer employs a sigmoid function (Figure 4).

3. Results

3.1. Dataset

To verify whether the proposed method can generate signature images, we utilized the CEDAR signature dataset. This dataset, widely used in handwritten signature recognition and verification research, comprises 1320 original signatures (written in English) from a total of 55 individuals, with each individual providing 24 signatures. Additionally, the dataset includes 1320 forged signatures created by some of the participant’s imitation of other signatures. The signature images are grayscale images of size (155, 220). To facilitate smooth sampling during the training process of the noise prediction module, the image size was adjusted to (128, 256) for the experiments. We randomly selected 12 original and 12 forged signatures for each class, resulting in 660 original and 660 forged signatures as the training data, while the remaining 660 original and 660 forged signatures were used as the test data. For a single class, 132 pairs of original signature pairs and original–forged signature pairs can be created. Since the CEDAR dataset consists of 55 classes in total, the training and test data include 7260 signature pairs.

3.2. Implementation Details

The classifier was pre-trained for 100 epochs to distinguish between original signature pairs and pairs comprising an original and a forged signature. The noise prediction module receives input images of size (128, 256, 3). The input images are halved in size through downsampling or upsampling at each transition block, with filters doubling in number. As shown in Figure 2, the input image is transformed into a feature vector of half the original size and with 64 filters at the first down-transition block. This process is repeated four times, resulting in a feature vector that is one-eighth of the original size and has 512 filters. After passing through the residual block and self-attention layer, the feature vector returns to the original image size through up-transition blocks. In the residual block and self-attention layer located at the model’s center, the feature vector size remains unchanged. The feature vector size is maintained in all Conv2D blocks, with resizing occurring only in the downsampling or upsampling blocks. Additionally, all transition blocks require a time-class embedding, with the dense layer in the time-class embedding determining the vector size. In the proposed method, the output size of the dense layer was set to 512 for experimentation.
As mentioned in Equation (12), MSE is measured as the loss for the noise prediction module, and the binary cross-entropy loss is measured for the auxiliary classifier. The total loss function is calculated as the sum of these two losses and optimized using adaptive moment estimation (Adam) [31]. Adam, which combines RMSprop and momentum techniques, is widely used in neural network training due to its ability to accelerate learning and reduce gradient oscillations, resulting in faster and smoother convergence. The noise prediction module was trained for 3000 epochs. The time step was set to 1000 to ensure fine-grained noise prediction performance. The parameters used in the noise prediction module are detailed in Table 1.

3.3. Data Generation Results

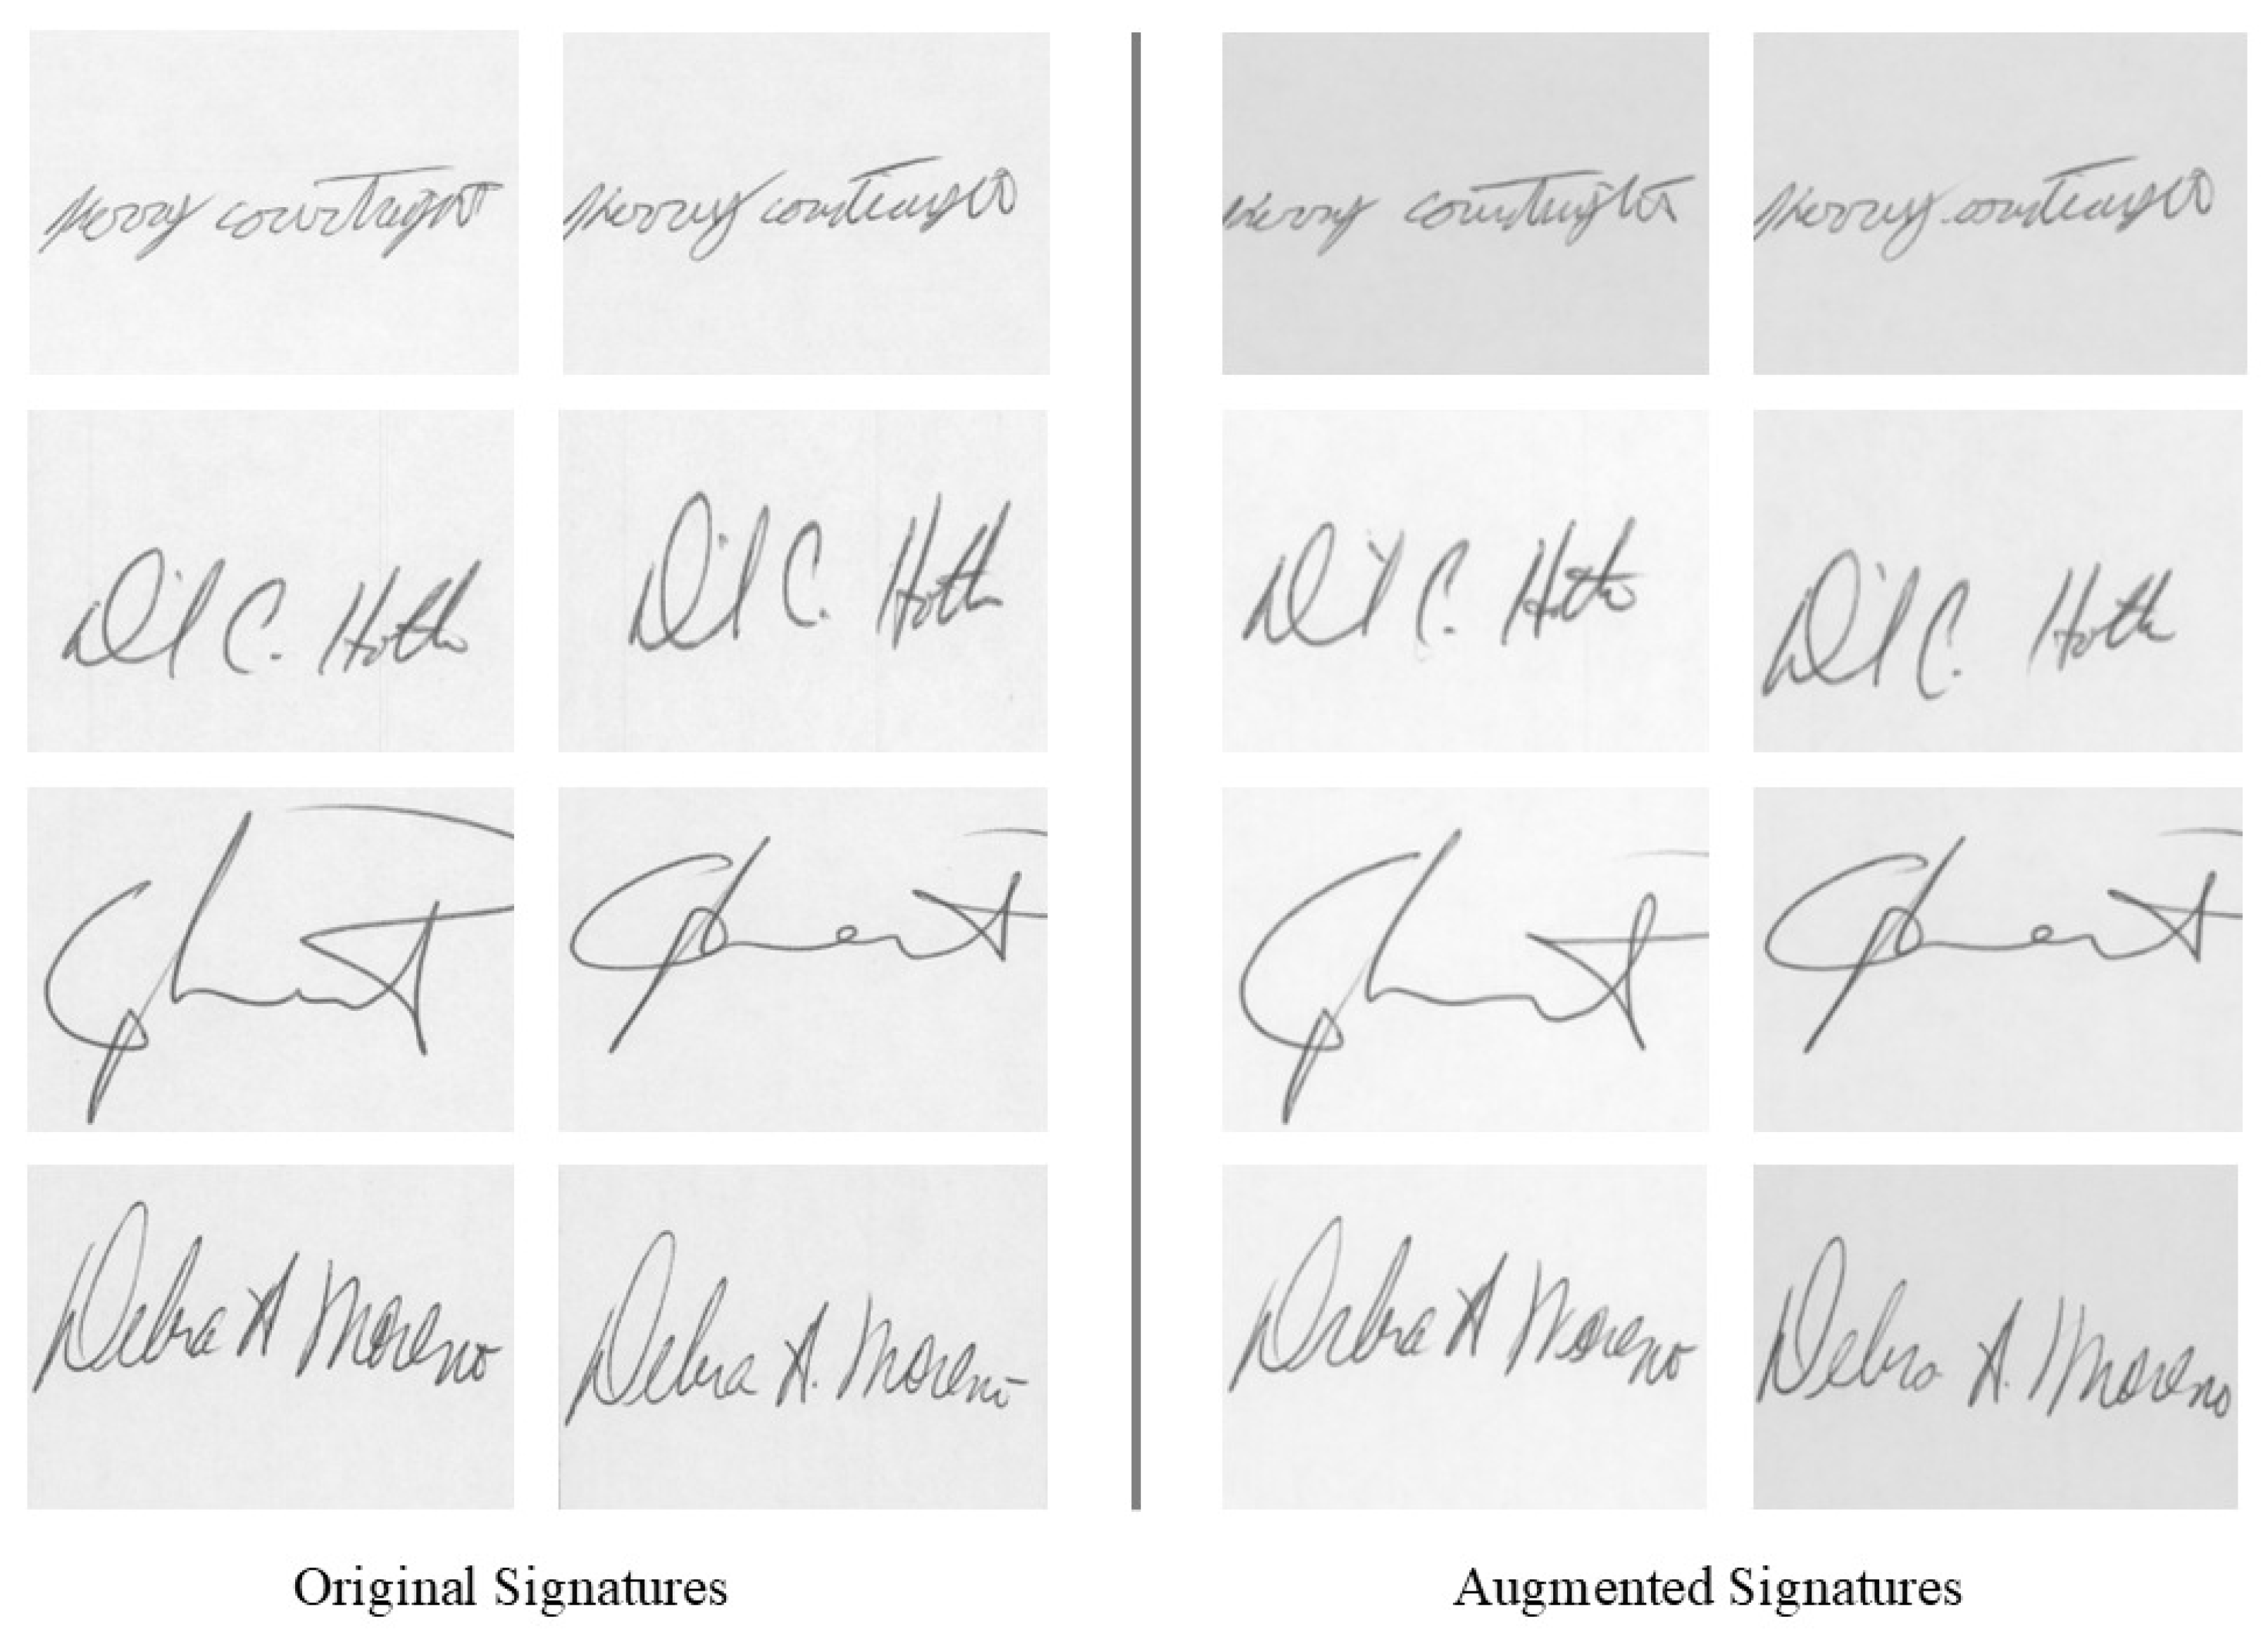
We evaluate how similar the generated signatures produced by our proposed method are to the original signatures. Since the dataset included in the CEDAR signature lacks crucial information, such as pen pressure, signing time, and speed variations, only visual comparisons can be performed. Visual comparison elements include line flow, thickness, signing style, and characteristic curves or angles. Figure 5 shows how similar the original and generated signatures can appear from a macroscopic perspective.
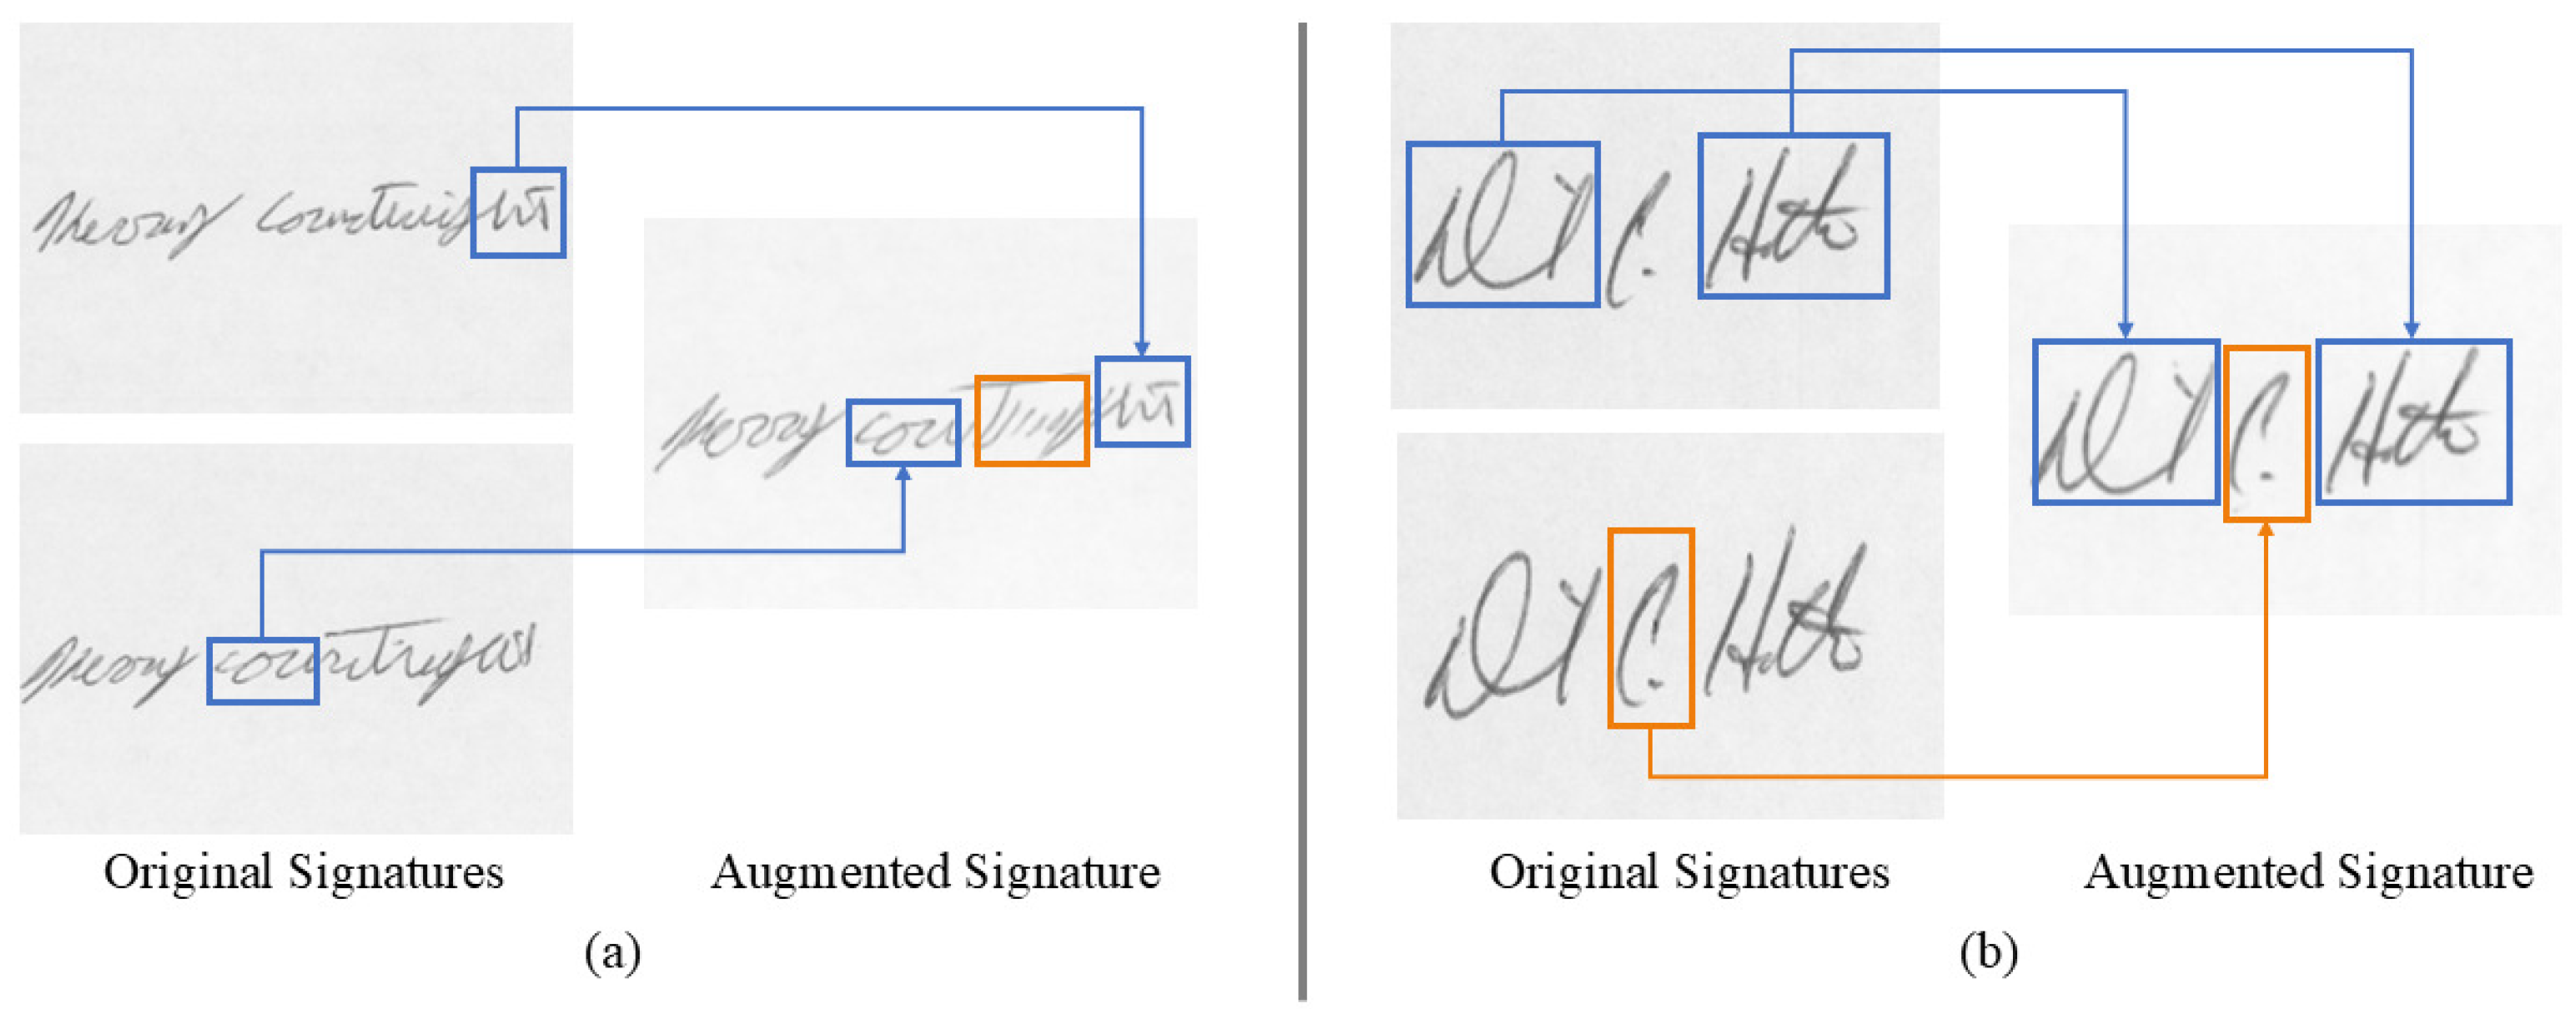
We observed that the signatures generated using our proposed method closely mimic the curves and line patterns found in the original signatures used for training. Figure 6a,b illustrates the similarities between the original and generated signatures for two different signature types. The blue boxes and arrows in Figure 6a,b highlight the regions where the original and generated signatures exhibit a high degree of similarity. We found that the curves, the width of the ovals corresponding to the handwritten signatures, and the shape of the serifs were well preserved.
The visual elements of the generated signatures were primarily composed of multiple features observed from various original signatures. This indicates that the proposed method can generate new signatures that incorporate the characteristics of original signatures rather than creating exact replicas. The orange boxes in Figure 6a,b highlight the flow of lines that were not observed in the original signatures. In Figure 6a, a blurred and roughly drawn line progression is observed, while in Figure 6b, although the curve’s swoop and dot positions are similar, a new form with a shorter lower curve length can be observed.

3.4. Evaluation Metrics

To perform a quantitative evaluation of the generated signatures, we employed both the structural similarity index measure (SSIM) and the root mean square error (RMSE) as evaluation metrics. Hameed et al. [22] also assessed the performance of their GAN-based signature generation model by calculating the SSIM between the original signature input to the model and the generated signature. SSIM is a method for assessing the similarity between two images. Unlike conventional methods that simply compare pixel-wise differences, SSIM measures the degree of the preservation of structural information. This can be calculated using Equation (15), with values ranging from −1 to 1. A value of 1 indicates that the two images are identical, while a value of 0 signifies that they are completely different. A value of −1 indicates that the structures are identical but the pixel values are inverted:
SSIM ( x , y ) = ( 2 μ x μ y + C 1 ) ( 2 σ x y + C 2 ) ( μ x 2 + μ y 2 + C 1 ) ( σ x 2 + σ y 2 + C 2 )
In Equation (15), x and y represent the two images being compared. μ x and μ y denote the average brightness of each image, while σ x 2 and σ y 2 represent the variance of each image, and σ x y is the covariance between the two images. C 1 and C 2 are constants for stability, calculated as follows: generally, K 1 and K 2 are set to 0.01 and 0.03, respectively, and L represents the dynamic range of the pixel values.
C 1 = ( K 1 L ) 2 , C 2 = ( K 2 L ) 2
Zhou et al. [32] utilized RMSE to assess how accurately the model predicts output values given specific inputs in nonlinear systems. RMSE is the square root of the mean of the squared differences between the pixel values of two images, where a smaller value indicates higher similarity between the images. RMSE is the square root of the mean of the squared differences between the pixel values of two images, where a smaller value indicates higher similarity between the images.
RMSE = 1 N i = 1 N ( x i y i ) 2
In this equation, x i and y i represent the i t h pixel values of the original and generated signatures, respectively, and N is the total number of pixels. RMSE quantifies the pixel-wise differences between the two signatures, providing insight into how visually similar the generated signature is to the original.
In this study, we computed both the SSIM and RMSE after applying a preprocessing step to the comparison signature pairs. This preprocessing involved a high-frequency synthesis process based on the wavelet transform used in the auxiliary classification process.
In Table 2, the rows labeled “Org-Forg” in the Model category represent the measurement results for the original–forged signature pairs included in the CEDAR dataset. The Train Set Case shows the maximum, minimum, and average SSIM values, as well as the average RMSE value for all original–forged signature pairs used in training. The Highest Class Case presents the maximum, minimum, and average SSIM values and the average RMSE value only for the class with the highest SSIM. The class with the highest SSIM among the original–forged pairs used in training was Class 46.
For the original–forged signature pairs used in training, the highest SSIM observed was 0.9976, the lowest was 0.9749, the average was 0.9915, and the average RMSE was 0.1658. When only considering Class 46, which had the highest SSIM among the pairs, the highest SSIM was 0.9976, the average was 0.9955, the lowest was 0.99, and the average RMSE was 0.1427.
In Table 2, the model labeled “Aux” represents the model with the auxiliary classification process, while “Non-Aux” refers to the model without this process. To calculate SSIM and RMSE for the generated signatures, we used the original signature from each class that had the highest SSIM in the original–forged pairs as the reference sample.
The All Classes Case shows the maximum, minimum, and average SSIM and RMSE values across all classes, and the Highest Class Case presents the measurements only for the class with the highest SSIM. In the model with the auxiliary classification process, the highest SSIM was observed in Class 41, while in the model without it, the highest SSIM was observed in Class 46.
Analyses of the measurement results revealed that the highest SSIM in the Highest Class Case for the model with the auxiliary classification process was 0.9999, with an average RMSE of 0.1219, indicating an increase of 0.0023 in SSIM and a decrease of 0.0208 in RMSE compared to the highest values in the original–forged signature pairs. These findings suggest that the generated signatures produced by the proposed method successfully capture the structural and visual characteristics of the original signatures.
To provide an example of selecting the highest SSIM pair in the original–forged image pairs for each class and comparing it to the generated signature, we selected the original sample 02 and forged sample 18 from Class 46, which had the highest SSIM in the CEDAR dataset. Using sample 02 from Class 46 as the reference, we calculated the SSIM between the forged sample and the generated signature sample produced by the proposed model, with the results summarized in Table 3.
For the reference sample and the forged samples, the SSIM values ranged from a maximum of 0.9976 to a minimum of 0.9900, with an average of 0.9955. In comparison, when calculating the SSIM between the reference sample and generated signatures, the sample generated by the model with the auxiliary classification process recorded a maximum SSIM of 0.9980, showing higher similarity than the highest SSIM of the forged samples. However, the average and minimum SSIM values were lower than those of the forged samples. This suggests that while the signatures generated by the proposed method may sometimes exhibit less structural similarity than signatures forged by an imitator, the overall range of SSIM values remains quite consistent, indicating that the generated signatures still capture key characteristics of the original signatures. Additionally, the model incorporating the auxiliary classification process achieved a relatively higher SSIM compared to the model without it, demonstrating that the auxiliary classification process significantly contributes to the generation of images with structures that are more similar to the original signatures.

3.5. Signature Verification Results

We conducted an additional quantitative evaluation to analyze the impact of generated signatures on a signature verification model. The signature verification model used in the experiment has the same structure as the classifier employed in the auxiliary classification process. We evaluated the model based on the precision, recall, accuracy, and equal error rate (EER). Precision indicates the proportion of predicted original pairs that are actual original pairs, and recall represents the proportion of actual original pairs that were correctly predicted. Accuracy reflects the rate of correctly predicted original and forged pairs. Additionally, we used EER as a key metric to assess the performance of the verification model.
Anmol et al. [11] utilized EER as a metric for detecting forged signatures and evaluating similarity. EER, commonly used in biometric systems, represents the error rate at the point where the false positive rate (FPR) and false negative rate (FNR) are equal. FPR is the rate of incorrectly accepting forged signatures as original, while FNR is the rate of incorrectly rejecting original signatures as forged. The threshold at which FPR equals FNR is denoted as θ EER . A lower EER indicates higher accuracy and better distinction between genuine and forged signatures. The calculation of EER is expressed as follows:
EER = FPR ( θ EER ) = FNR ( θ EER )
In our experiments, when the classifier was trained on the same data used for the generation model, it achieved an accuracy of 94.26% and an EER of 0.0570 on the test data. We then retrained the classifier with a larger dataset by adding 12 generated signature images per class, resulting in a total of 21,780 signature pairs with 14,520 new pairs. Including generated signatures in the training data resulted in a classifier accuracy of 94.87% on the test data and an EER of 0.0518, demonstrating a slight improvement in performance (Table 4).
By adding generated signatures to the original dataset, the accuracy of the model increased from 94.26% to 94.87%, and the EER decreased from 0.0570 to 0.0518. These results indicate that including generated signature data in training helps the verification model in more effectively distinguishing between genuine and forged signatures. The diversity of the training data increased with the inclusion of generated signatures, better allowing the model to generalize to new samples. Additionally, we confirmed that using the signatures generated by the proposed model with an auxiliary classifier resulted in improved verification performance compared to not using the classifier. This suggests that a high-quality signature generation model trained with a classifier can significantly enhance verification performance.

4. Discussion

In this study, we proposed a signature data generation method using the DDPM and a classifier, and we evaluated its performance using the CEDAR signature dataset. The proposed method aims to generate signatures that are similar to the originals based on existing signature images, thereby addressing data shortages and enhancing the performance of signature recognition systems.
The signature generation model using DDPM has demonstrated its ability to learn detailed features such as curves, line flow, and style from only the digital signature images, enabling the creation of signatures that closely resemble the originals. It successfully generated new signature images that reflect characteristics observed in multiple original signatures. Moreover, a classifier was employed alongside the signature generation model during the training process to differentiate between forged and original signatures. This approach helped produce generated signatures that are more similar to the originals, thereby reducing the likelihood of misidentification as forged signatures.
To quantitatively evaluate the signatures generated by the proposed method, we calculated the SSIM and RMSE for the reference samples in each class and tracked the performance changes in the signature verification model when the generated signatures were added to the training data. Experimental results showed that the proposed model achieved an average SSIM of 0.9806 and an RMSE of 0.1819, indicating that it can produce images with characteristics that are very similar to the original signatures. When the generated signatures were added to the training data in the verification model learning process, the verification model achieved an accuracy of 94.87% and an equal error rate (EER) of 0.0518, marking a 0.61 percentage point increase in accuracy and a decrease of 0.0052 in EER compared to the model without the generated signatures. These results demonstrate that the signatures generated by the proposed method capture a variety of characteristics that original signatures can exhibit, contributing to improvements in the verification system’s performance. We expect this approach to be applicable not only to handwritten signatures but also to other biometric fields where data collection is challenging.
In this study, we used only the CEDAR dataset as the experimental data. As an initial study on handwritten signature image generation, we focused on generating alphabetic handwritten signatures, which are widely used and accessible, and therefore employed the CEDAR dataset. However, since the signatures included in the CEDAR dataset do not reflect the characteristics of all alphabetic handwritten signatures, improvement in verification performance is not guaranteed across all datasets. This is a limitation of our study. Future research will aim to extend the model to generate signatures in various languages, and we intend to collaborate with other research groups to validate our model across multiple signature image databases.
Another limitation is the large number of signature images required to train the generation model. To address the challenge of collecting a substantial number of user signatures in real applications, we intentionally used only half of the CEDAR dataset for training. Nevertheless, 12 original and 12 forged signatures per class were used, which may still be too many for practical applications. In future studies, we plan to address this issue by improving our model based on well-established few-shot learning algorithms.

Author Contributions

Conceptualization, D.-J.H. and W.-D.C.; methodology, D.-J.H. and W.-D.C.; software, D.-J.H.; investigation, D.-J.H.; validation, D.-J.H.; resources, D.-J.H., W.-D.C. and E.-Y.C.; writing—original draft preparation, D.-J.H. and W.-D.C.; writing—review and editing, D.-J.H., W.-D.C. and E.-Y.C.; visualization, D.-J.H.; project administration, D.-J.H., W.-D.C. and E.-Y.C.; funding acquisition, W.-D.C. All authors have read and agreed to the published version of the manuscript.

Funding

This work was partly supported by the National Research Foundation of Korea (NRF) grant funded by the Korea government (MSIT) (No. RS-2024-00334159), and by the technology transfer and commercialization program through INNOPOLIS Foundation funded by the Ministry of Science and ICT (2023-BS-RD-0061/Developing technologies to advance and commercialize intelligent security surveillance systems).

Institutional Review Board Statement

Not applicable.

Informed Consent Statement

Not applicable.

Data Availability Statement

The CEDAR Dataset presented in this study are openly available in Kaggle at https://www.kaggle.com/datasets/shreelakshmigp/cedardataset. The original dataset was available for reference at https://cedar.buffalo.edu/.

Conflicts of Interest

The authors declare no conflicts of interest.

References

  1. Julian, F.; Javier, O.G.; Daniel, R.; Joaquin, G.R. HMM-based on-line signature verification: Feature extraction and signature modeling. Pattern Recognit. Lett. 2007, 28, 2325–2334. [Google Scholar] [CrossRef]
  2. Narwade, P.N.; Sawant, R.R.; Bonde, S.V. Offline signature verification using shape correspondence. Int. J. Biom. 2018, 10, 272–289. [Google Scholar] [CrossRef]
  3. Okawa, M. Synergy of foreground-background images for feature extraction: Offline signature verification using Fisher vector with fused KAZE features. Pattern Recognit. 2018, 79, 480–489. [Google Scholar] [CrossRef]
  4. Sharif, M.; Khan, M.A.; Faisal, M.; Yasmin, M.; Fernandes, S.L. A framework for offline signature verification system: Best features selection approach. Pattern Recognit. Lett. 2020, 139, 142–149. [Google Scholar] [CrossRef]
  5. Ghosh, R. A Recurrent Neural Network based deep learning model for offline signature verification and recognition system. Expert Syst. Appl. 2021, 168, 114249. [Google Scholar] [CrossRef]
  6. Jain, A.; Singh, S.K.; Singh, K.P. A Handwritten signature verification using shallow convolutional neural network. Multimed. Tools Appl. 2020, 79, 19993–20018. [Google Scholar] [CrossRef]
  7. Wei, P.; Li, H.; Hu, P. Inverse Discriminative Networks for Handwritten Signature Verification. In Proceedings of the IEEE/CVF Conference on Computer Vision and Pattern Recognition, Long Beach, CA, USA, 16–20 June 2019; pp. 5764–5772. [Google Scholar]
  8. Jain, C.; Singh, P.; Rana, P. Offline signature verification system with Gaussian mixture models (GMM). Int. J. Comput. Technol. 2013, 10, 1700–1705. [Google Scholar] [CrossRef]
  9. Liu, L.; Huang, L.; Yin, F.; Chen, Y. Offline signature verification using a region based deep metric learning network. Pattern Recognit. 2021, 118, 108009. [Google Scholar] [CrossRef]
  10. Vorugunti, C.S.; Pulabaigari, V.; Gorthi, R.K.S.S.; Mukherjee, P. OSVFuseNet: Online Signature Verification by feature fusion and depth-wise separable convolution based deep learning. Neurocomputing 2020, 409, 157–172. [Google Scholar] [CrossRef]
  11. Anmol, C.; Vansh, J.; Rajas, B. SigScatNet: A Siamese + Scattering based Deep Learning Approach for Signature Forgery Detection and Similarity Assessment. In Proceedings of the 2023 International Conference on Modeling, Simulation & Intelligent Computing, Dubai, United Arab Emirates, 7–9 December 2023; pp. 480–485. [Google Scholar] [CrossRef]
  12. Jaouhar, F.; Feriel, S.; Mohamed, M.; Ridha, G.; Emil, P.; Baha, E.L. Handwritten Signature Recognition using Parallel CNNs and Transfer Learning for Forensics. In Proceedings of the 2024 10th International Conference on Control, Decision and Information Technologies (CoDIT), Vallette, Malta, 1–4 July 2024; pp. 1697–1702. [Google Scholar] [CrossRef]
  13. Sudharshan, D.P.; Vismaya, R.N. Handwritten signature verification system using deep learning. In Proceedings of the 2022 IEEE International Conference on Data Science and Information System (ICDSIS), Hassan, India, 29–30 July 2022; pp. 1–5. [Google Scholar] [CrossRef]
  14. Huan, L.; Ping, W.; Ping, H. AVN: An Adversarial Variation Network Model for Handwritten Signature Verification. IEEE Trans. Multimed. 2022, 24, 594–608. [Google Scholar] [CrossRef]
  15. Mitchell, A.; Edbert, E.; Elwirehardja, G.N.; Pardamean, B. Offline signature verification using a region based deep metric learning network. ICIC Express Lett. 2023, 17, 359–366. [Google Scholar] [CrossRef]
  16. Gupta, Y.; Ankit; Kulkarni, S.; Jain, P. Handwritten signature verification using transfer learning and data augmentation. In Proceedings of the International Conference on Intelligent Cyber-Physical Systems, Jaipur, India, 16–18 April 2021; pp. 233–245. [Google Scholar]
  17. Najda, D.; Saeed, K. Impact of augmentation methods in online signature verification. Innov. Syst. Softw. Eng. 2024, 20, 477–483. [Google Scholar] [CrossRef]
  18. Maruyama, T.M.; Oliveira, L.S.; Britto, A.S.; Sabourin, R. Intrapersonal parameter optimization for offline handwritten signature augmentation. IEEE Trans. Inf. Forensics Secur. 2020, 16, 1335–1350. [Google Scholar] [CrossRef]
  19. Galbally, J.; Fierrez, J.; Martinez, M.; Ortega, J. Synthetic generation of handwritten signatures based on spectral analysis. In Proceedings of the Optics and Photonics in Global Homeland Security V and Biometric Technology for Human Identification VI, Orlando, FL, USA, 5 May 2009; pp. 443–452. [Google Scholar] [CrossRef]
  20. Arab, N.; Nemmour, H.; Chibani, Y. A new synthetic feature generation scheme based on artificial immune systems for robust offline signature verification. Expert Syst. Appl. 2023, 213, 119306. [Google Scholar] [CrossRef]
  21. Venkata, M.M.; Vempati, K. Generation of Synthesis Handwritten Signatures Using Image Processing Techniques for Biometrics. J. Eng. Sci. 2019, 10, 946–953. [Google Scholar]
  22. Hameed, M.M.; Ahmad, R.; Kiah, L.M.; Murtaza, G.; Mazhar, N. OffSig-Sin GAN: A Deep Learning-Based Image Augmentation Model for Offline Signature Verification. Comput. Mater. Contin. 2023, 76, 1267–1289. [Google Scholar] [CrossRef]
  23. Ho, J.; Jain, A.; Abbeel, P. Denoising diffusion probabilistic models. Adv. Neural Inf. Process. Syst. 2020, 33, 6840–6851. [Google Scholar]
  24. CEDAR Signature Database. Available online: http://www.cedar.buffalo.edu/NIJ/data/signatures.rar (accessed on 5 November 2024).
  25. Ronneberger, O.; Fischer, P.; Brox, T. U-net: Convolutional networks for biomedical image segmentation. In Proceedings of the Medical Image Computing and Computer-Assisted Intervention–MICCAI 2015: 18th International Conference, Munich, Germany, 5–9 October 2015; pp. 234–241. [Google Scholar]
  26. Huang, G.; Liu, Z.; Van, D.M.L.; Weinberger, K.Q. Densely connected convolutional networks. In Proceedings of the IEEE Conference on Computer Vision and Pattern Recognition, Honolulu, HI, USA, 21–26 July 2017; pp. 4700–4708. [Google Scholar]
  27. Shaw, P.; Uszkoreit, J.; Vaswani, A. Self-attention with relative position representations. arXiv 2018, arXiv:1803.02155. [Google Scholar]
  28. Leedham, G.; Chen, Y.A.N.; Takru, K.; Tan, J.H.N.; Mian, L. Comparison of Some Thresholding Algorithms for Text/Background Segmentation in Difficult Document Images. In Proceedings of the Seventh International Conference on Document Analysis and Recognition, Edinburgh, UK, 3 August 2003; pp. 859–864. [Google Scholar]
  29. Sevilla, L.; Sun, D.; Jampani, V.; Black, M.J. Optical flow with semantic segmentation and localized layers. In Proceedings of the IEEE Conference on Computer Vision and Pattern Recognition, Las Vegas, NV, USA, 27–30 June 2016; pp. 3889–3898. [Google Scholar]
  30. Shensa, M.J. The discrete wavelet transform: Wedding the a trous and Mallat algorithms. IEEE Trans. Signal Process. 1992, 40, 2464–2482. [Google Scholar] [CrossRef]
  31. Kingma, D.P. Adam: A method for stochastic optimization. arXiv 2014, arXiv:1412.6980. [Google Scholar]
  32. Zhou, H.; Zhang, Y.; Duan, W.; Zhao, H. Nonlinear systems modelling based on self-organizing fuzzy neural network with hierarchical pruning scheme. Appl. Soft Comput. 2020, 95, 106516. [Google Scholar] [CrossRef]
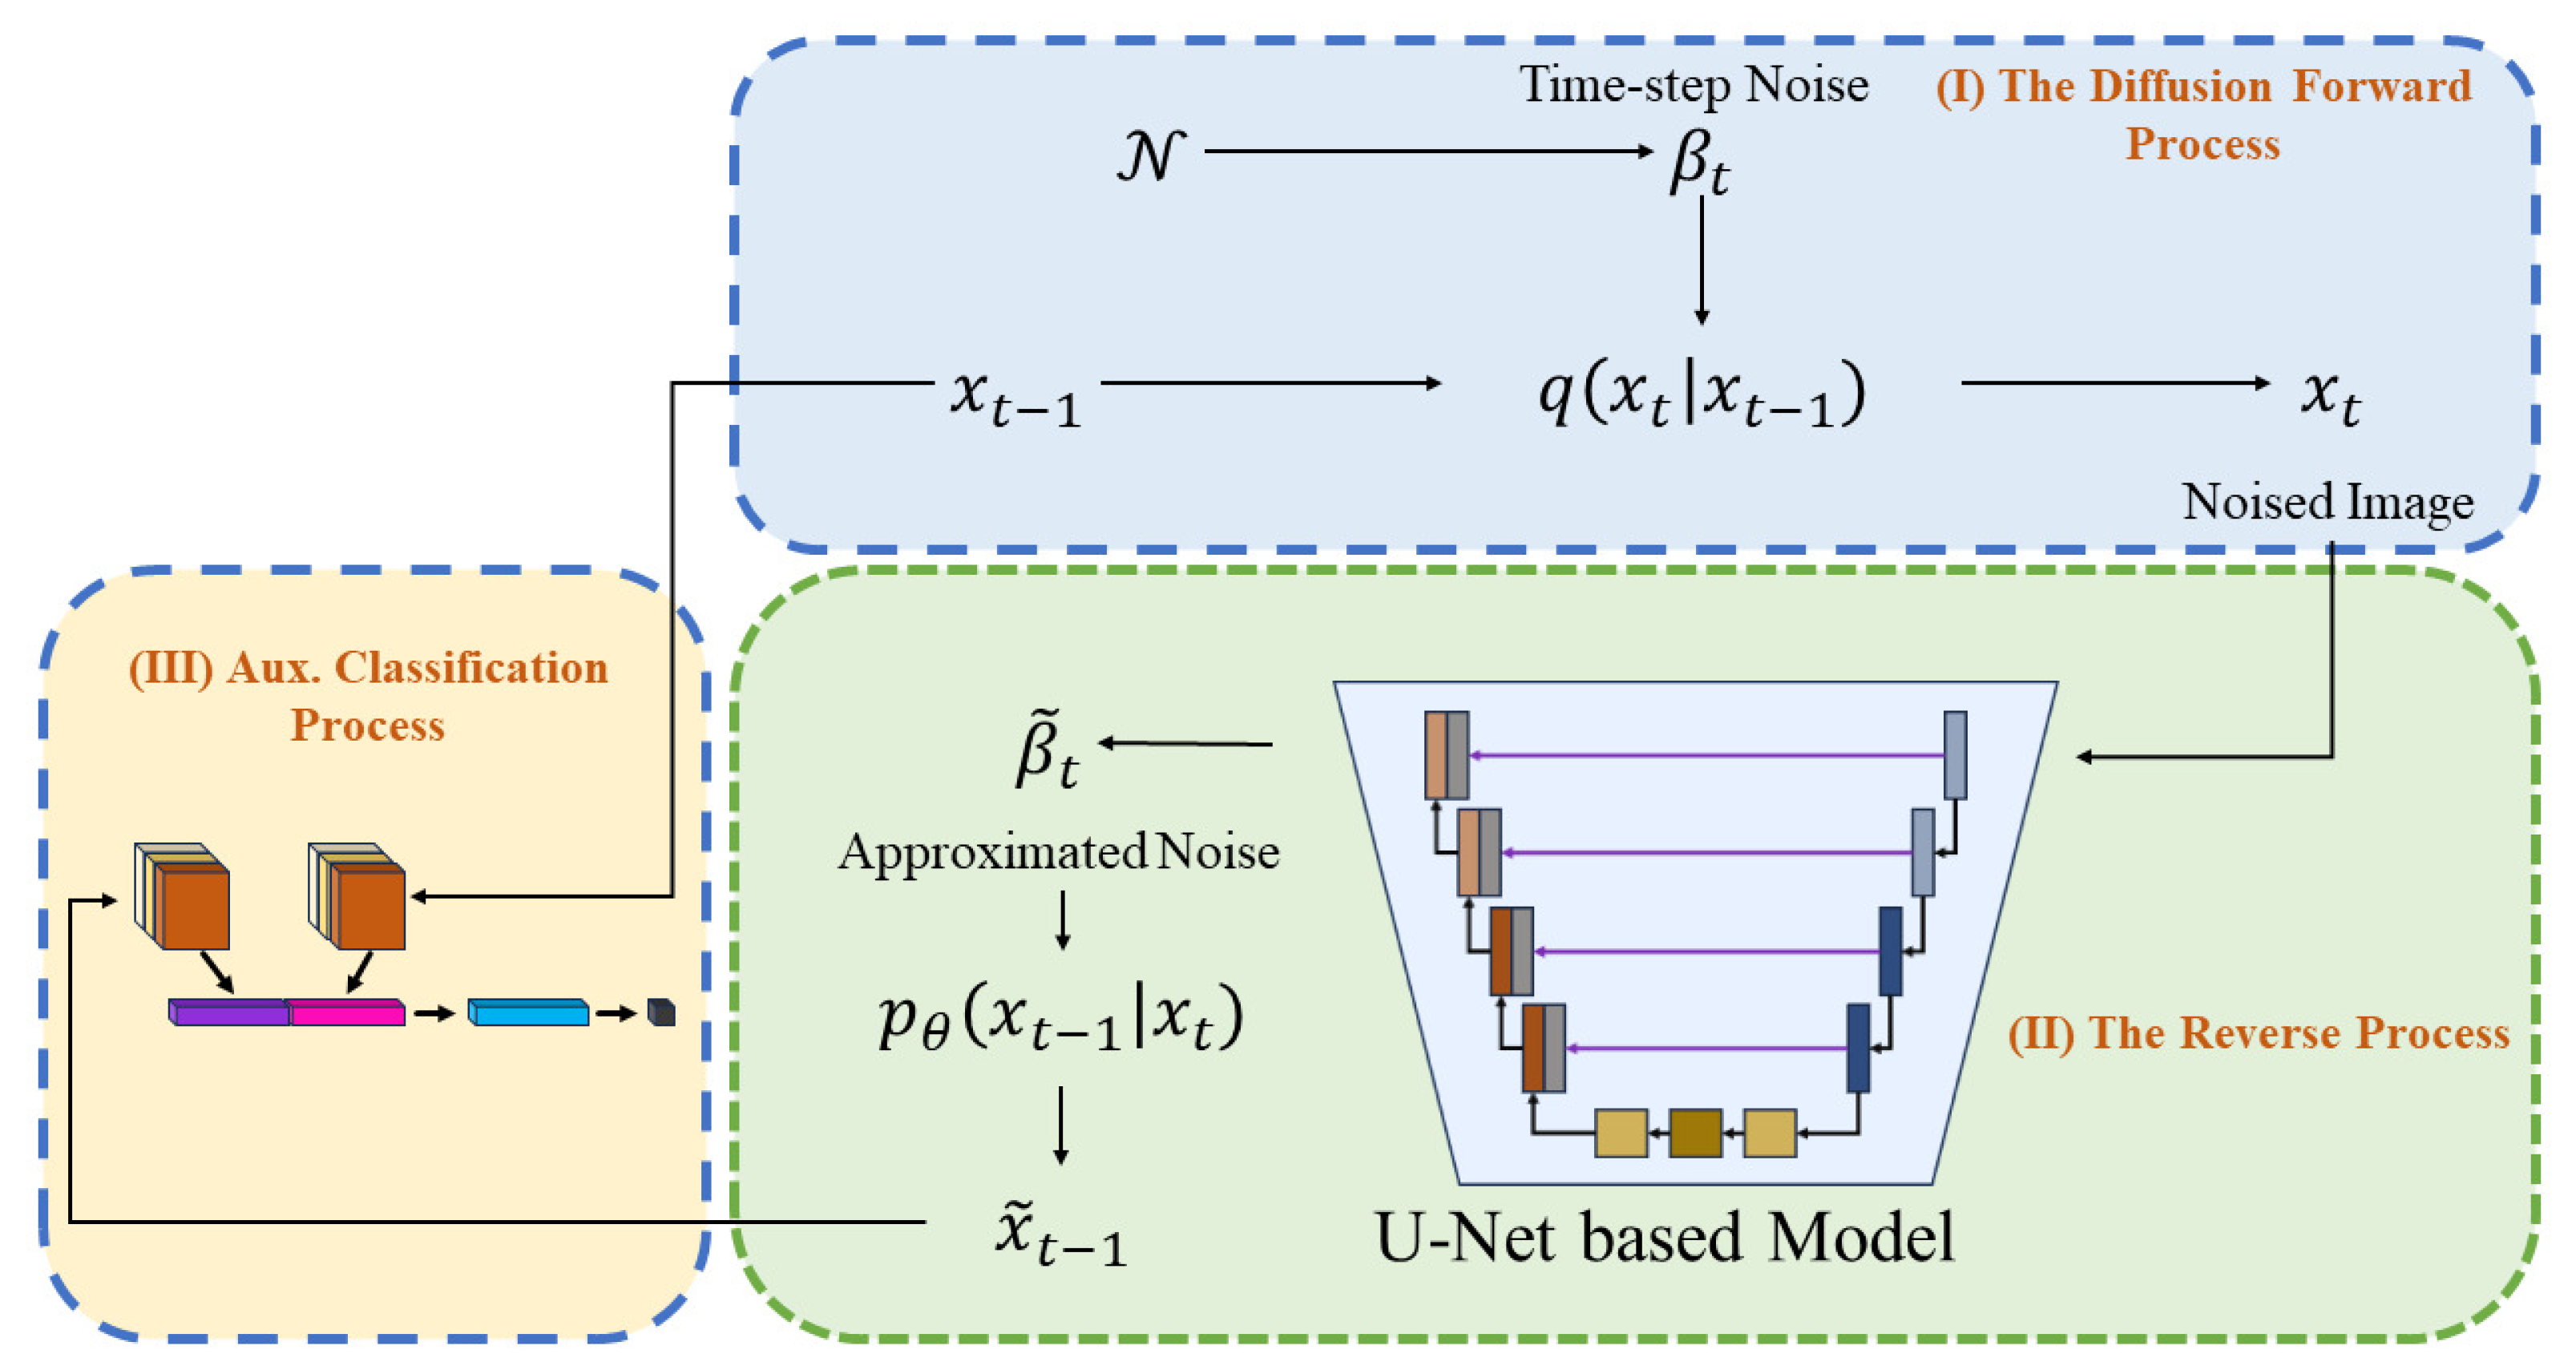
Figure 1. Overall framework of the proposed signature generation model.
Applsci 14 10233 g001
Figure 4. Classifier model structure.
Applsci 14 10233 g004
Figure 5. Comparison of the original signatures with signatures generated using the proposed method.
Applsci 14 10233 g005
Figure 6. Detailed comparison of original signatures and generated signatures.
Applsci 14 10233 g006
Table 1. Parameters used in the training process of the improved U-Net-based model.
HyperparameterValue
Input Image Size (H, W)(128, 256)
OptimizerAdam
Optimizer Learning Rate2 × 10−4
Number of Time Steps (T)1000
Beta ScheduleLinear
Beta Start1 × 10−4
Beta End0.02
Noise Schedule TypeLinear
Table 2. The maximum, minimum, and average SSIM values and the average RMSE results for the original–forged signature pairs from the CEDAR dataset and the original–generated signature pairs created using the proposed method.
ModelCasesMaxMinAvg.RMSE
Org-ForgTrain Set0.99760.97490.99150.1658
Org-ForgHighest Class (46)0.99760.99000.99550.1427
AuxAll Classes0.99990.84860.98060.1819
AuxHighest Class (41)0.99990.98990.99650.1219
Non-AuxAll Classes0.99670.84590.97220.2059
Non-AuxHighest Class (46)0.99670.98390.99210.1563
Table 3. SSIM comparison for sample 02 in Class 46 of the CEDAR dataset.
ModelCasesMaxMinAvg.
-Signatures included in Class 46 of forgery0.99760.99000.9955
AuxIncluding the auxiliary classification0.99800.96760.9870
Non-AuxNot including the auxiliary classification0.99670.98390.9921
Table 4. Comparison of signature verification performance via training data composition.
Train SetPrecisionRecallAcc. (%)ERR
Original train data0.96150.922094.260.0570
Included generated signatures0.95540.941494.870.0518
Included generated signatures (not using the classifier)0.93080.911892.200.0749
Disclaimer/Publisher’s Note: The statements, opinions and data contained in all publications are solely those of the individual author(s) and contributor(s) and not of MDPI and/or the editor(s). MDPI and/or the editor(s) disclaim responsibility for any injury to people or property resulting from any ideas, methods, instructions or products referred to in the content.