Article

Integrated Analysis of Rockfalls and Floods in the Jiului Gorge, Romania: Impacts on Road and Rail Traffic

1
Simion Mehedinți Doctoral School, Faculty of Geography, University of Bucharest, 010041 Bucharest, Romania
2
Department of Geomorphology-Pedology-Geomatics, Faculty of Geography, University of Bucharest, 010041 Bucharest, Romania
*
Author to whom correspondence should be addressed.
Appl. Sci. 2024, 14(22), 10270; https://doi.org/10.3390/app142210270
Submission received: 4 October 2024 / Revised: 2 November 2024 / Accepted: 6 November 2024 / Published: 8 November 2024

Abstract

:
This study examines the impact of rockfalls and floods on road and rail traffic in the Jiului Gorge, Romania, a critical transportation corridor. Using Sentinel-1 radar imagery processed through ESA SNAP and ArcGIS Pro, alongside traffic detection facilitated by YOLO models, we assessed susceptibility to both rockfalls and floods. The primary aim was to enhance public safety for traffic participants by providing accurate hazard mapping. Our study focuses on the area from Bumbești-Jiu to Petroșani, traversing the Southern Carpathians. The results demonstrate the utility of integrating remote sensing with machine learning to improve hazard management and inform more effective traffic planning. These findings contribute to safer, more resilient infrastructure in areas vulnerable to natural hazards.

1. Introduction

Rockfalls and flooding are significant threats to infrastructure, public safety, and the environment, particularly in mountainous regions (Brakenridge et al. [1]). These natural hazards are triggered by factors such as seismic activity, heavy rainfall, erosion, and geomorphological instability. The risks are compounded when rockfalls coincide with flooding, necessitating enhanced stabilization measures for vulnerable slopes. In Romania, the Jiului Gorge exemplifies this vulnerability, with frequent rockfalls and floods disrupting critical transport routes including roads and railways. This study adopts an integrated approach, employing advanced detection and mapping techniques to improve our understanding and management of these geological threats.
The Jiului Gorge, spanning from Bumbești-Jiu in Gorj County to Petroșani in Hunedoara County, is strategically located within the Southern Carpathians, dividing the Parâng and Vâlcan mountain ranges. This area is traversed by National Road 66, a 32 km stretch that is part of the European E 79 route. The E 79 is crucial for both national and international transportation, linking major Romanian cities and extending towards Greece. This road is vital for international freight, particularly due to restrictions on alternative routes like the Olt Valley, which redirect a substantial volume of traffic to E 79. The road’s role in regional trade and economy underscores the importance of addressing the hazards affecting it, especially as international traffic increases and infrastructure optimization becomes essential.
Additionally, the Jiu River, the principal watercourse in the region, is prone to flooding during heavy rainfall and snowmelt, exacerbating the area’s susceptibility to natural hazards (Didovets et al. [2]). The railway network, electrified in 1969–1970, historically facilitated coal transport from the Jiu Valley and has also supported international freight traffic. Notable services like the “Transbalkan” train, which once connected Romania to Hungary and other European countries, highlight the railway’s potential. Revitalizing this infrastructure could restore international connections and enhance capacity for both freight and passenger transport.
Currently, the daily train frequency on the Simeria–Petroșani–Târgu Jiu–Filiași route is significantly reduced compared to the 1990s, when it was a major conduit for goods and passengers. Modernizing this route could boost train numbers, improving efficiency and reinforcing its role as a key corridor for national and international traffic. Such developments would benefit the regional economy and strengthen connections between Central and Southeastern Europe.
In summary, this study aims to investigate the impact of rockfalls and flooding on infrastructure within the Jiului Gorge. By employing advanced detection and mapping techniques, including Sentinel-1 radar imagery for flood mapping and rockfall detection, this research seeks to provide a comprehensive analysis of geological hazards and their implications for transportation infrastructure. The following section outlines the specific materials and methods utilized to achieve these objectives, detailing data collection, processing techniques, and analytical approaches.

2. Materials and Methods

Study Area: This study focuses on a region from Bumbești-Jiu in Gorj County to the entrance of Petroșani in Hunedoara County, crossing the Southern Carpathians. This area (Figure 1) includes National Road 66, a railway network, and the Jiu River, making it crucial for understanding rockfall and flood hazards.
Data Collection:
Sentinel-1 Radar Imagery: For flood mapping, we used GRD-type Sentinel-1 radar images obtained from the Copernicus Open Access Hub. These images were processed with ESA SNAP software version 10.0.0 to generate interferograms necessary for distinguishing flooded areas from permanent water bodies (Zoccatelli et al. [3]). The processing steps included subset creation, data calibration, terrain correction, and RGB composite generation. The composite was produced by merging pre-flood and post-flood images, with the pre-flood image used for the red channel and the post-flood image for the blue and green channels, enhancing flood detection (Figure 2).
As can be seen in Figure 2, the SNAP software workflow for flood detection starts with the Sentinel-1 GRD product (left). The data are then calibrated and terrain correction is applied (second in grayscale). An RGB composite is created to differentiate the flood-affected area (the next two images). Finally, permanent water bodies are highlighted in black (right).
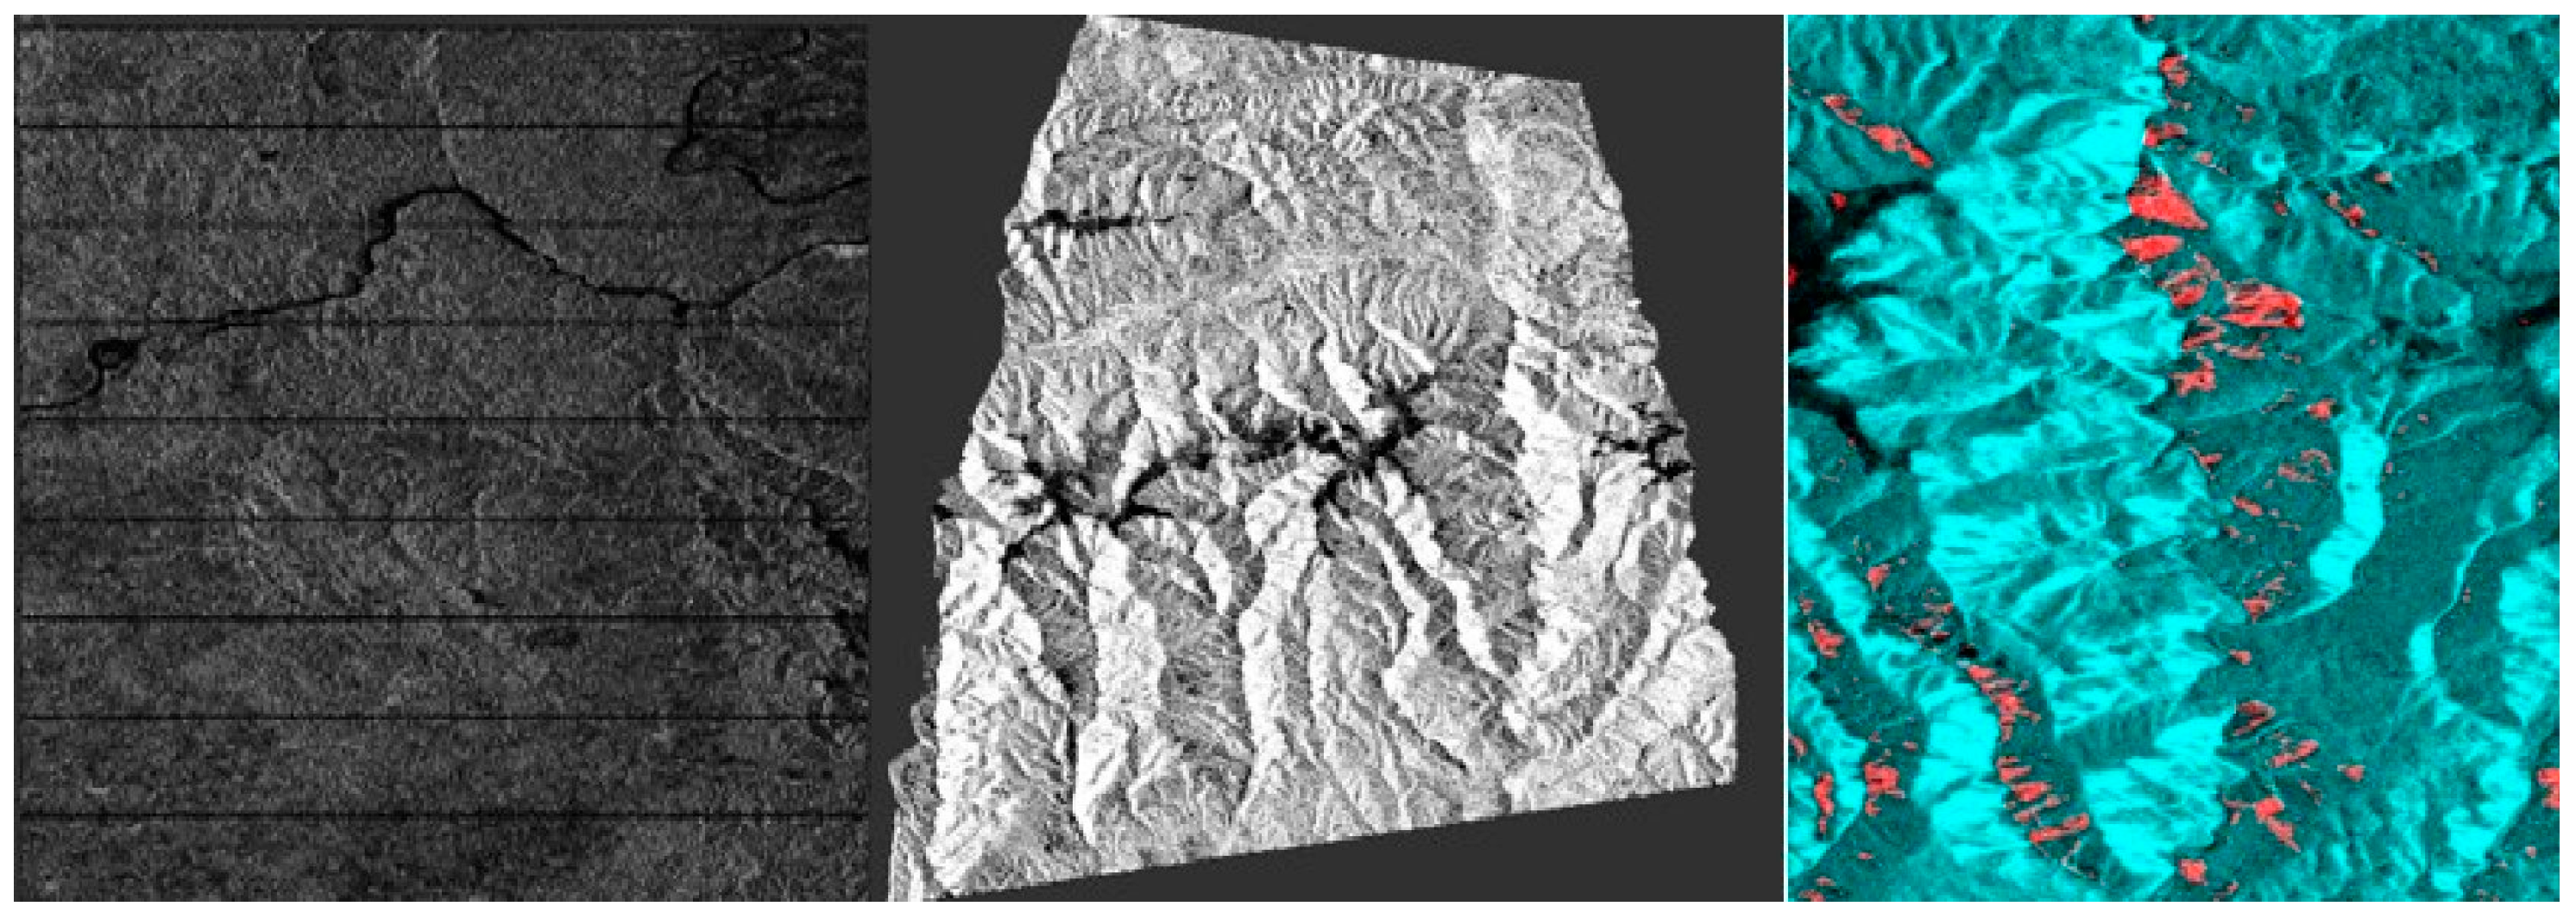
Rockfall Detection: For rockfall analysis, we used SLC-type Sentinel-1 radar images (Žabota et al. [4]; Žabota et al. [5]; Zhang, X. et al. [6]). Two images, taken before and after the event, were co-registered, interferometrically processed to capture ground deformation patterns, and geocoded to assign precise geographic coordinates (Figure 3).
As can be seen in Figure 3, the SNAP software workflow for rockfall detection starts with the Sentinel-1 SLC product (left). The images are then co-registered, interferometrically processed, and geocoded (middle). Finally, an RGB composite is applied to differentiate the rockfall-affected area (right).
Supplementary Data:
Digital Elevation Models (DEMs): 10 m resolution DEMs provided detailed topographic data essential for identifying rockfall-prone areas (Zhang, X. et al. [6]; Pánek et al. [7]; Zhang, Z. et al. [8]).
CORINE Land Cover 2018: This dataset was used to analyze land surface characteristics.
Precipitation Data: These were used to assess the impact of rainfall on slope stability.
Proximity to Streams: This was considered to evaluate flood susceptibility.
Data Integration and Analysis:
ArcGIS Pro: All data layers were integrated using ArcGIS Pro version 3.0.1. Weighted overlays were applied to generate susceptibility maps for rockfalls and floods (Tao et al. [9]; Zhang, X. et al. [6]). These maps visually represent hazard-prone areas, aiding in risk mitigation and disaster preparedness.
Artificial Intelligence for Traffic Detection:
YOLO Models: Pretrained YOLO models were used for traffic detection, analyzing videos captured along National Road 66 to extract data on traffic patterns and congestion. Additionally, a custom YOLO model was trained to detect rockfalls from news images (Zhang, Z. et al. [8]; Zhang, X. et al. [6]).
Overview of the ArcGIS-YOLO Interface:
The seamless integration of YOLO (You Only Look Once), a state-of-the-art real-time object detection system, with ArcGIS PRO, leading geographic information system (GIS) software version 3.0.1, plays a crucial role in hazard detection and infrastructure impact assessment. The following is a detailed explanation of this interface:
Data Preprocessing and Image Annotation:
Image Annotation: The process begins with annotating images for training the YOLO model. We used tools like LabelImg to label objects of interest (e.g., rockfalls or flooding signs) in training datasets. These annotations create bounding boxes that specify the spatial extent of each object, which are crucial for model accuracy.
Image Resizing: For efficient model performance, images were resized, and annotations were formatted to meet YOLO’s input requirements.
YOLO Model Training and Inference:
Training Phase: YOLO uses convolutional neural networks to learn patterns from annotated images. The model divides each input image into grids and predicts bounding boxes and class probabilities, making it highly efficient for large datasets such as satellite or UAV imagery.
Inference Phase: Upon deployment, the YOLO model processes new images, detecting objects and providing outputs in the form of bounding boxes and class labels. These outputs are converted into georeferenced data for integration with GIS.
Mapping YOLO Outputs to GIS Layers:
Python Script Integration: We developed Python scripts to bridge YOLO outputs with ArcGIS’s geoprocessing tools. These scripts translate the model’s bounding box coordinates into GIS layers, making them suitable for spatial analysis.
Postprocessing in ArcGIS: YOLO’s georeferenced outputs are imported into ArcGIS, where further spatial analysis is conducted. This step enables the visualization of detected hazards, the overlaying of risk maps, and the assessment of potential impacts on road and railway infrastructure.
Use Cases in Hazard Mapping:
Infrastructure Impact Assessments: The integration allows for the identification and mapping of risk-prone areas. This spatial analysis is crucial for understanding how natural hazards may affect transportation networks and for developing mitigation strategies (Amitha and Narayanan 2021 [10]; Al-qaness et al., 2021 [11]).

3. Results

The integration of advanced remote sensing techniques, GIS analysis, and AI models has enabled the production of several cartographic products that provide critical insights into natural hazards and their impacts on transportation infrastructure in the Jiului Gorge region.

3.1. Flood Mapping

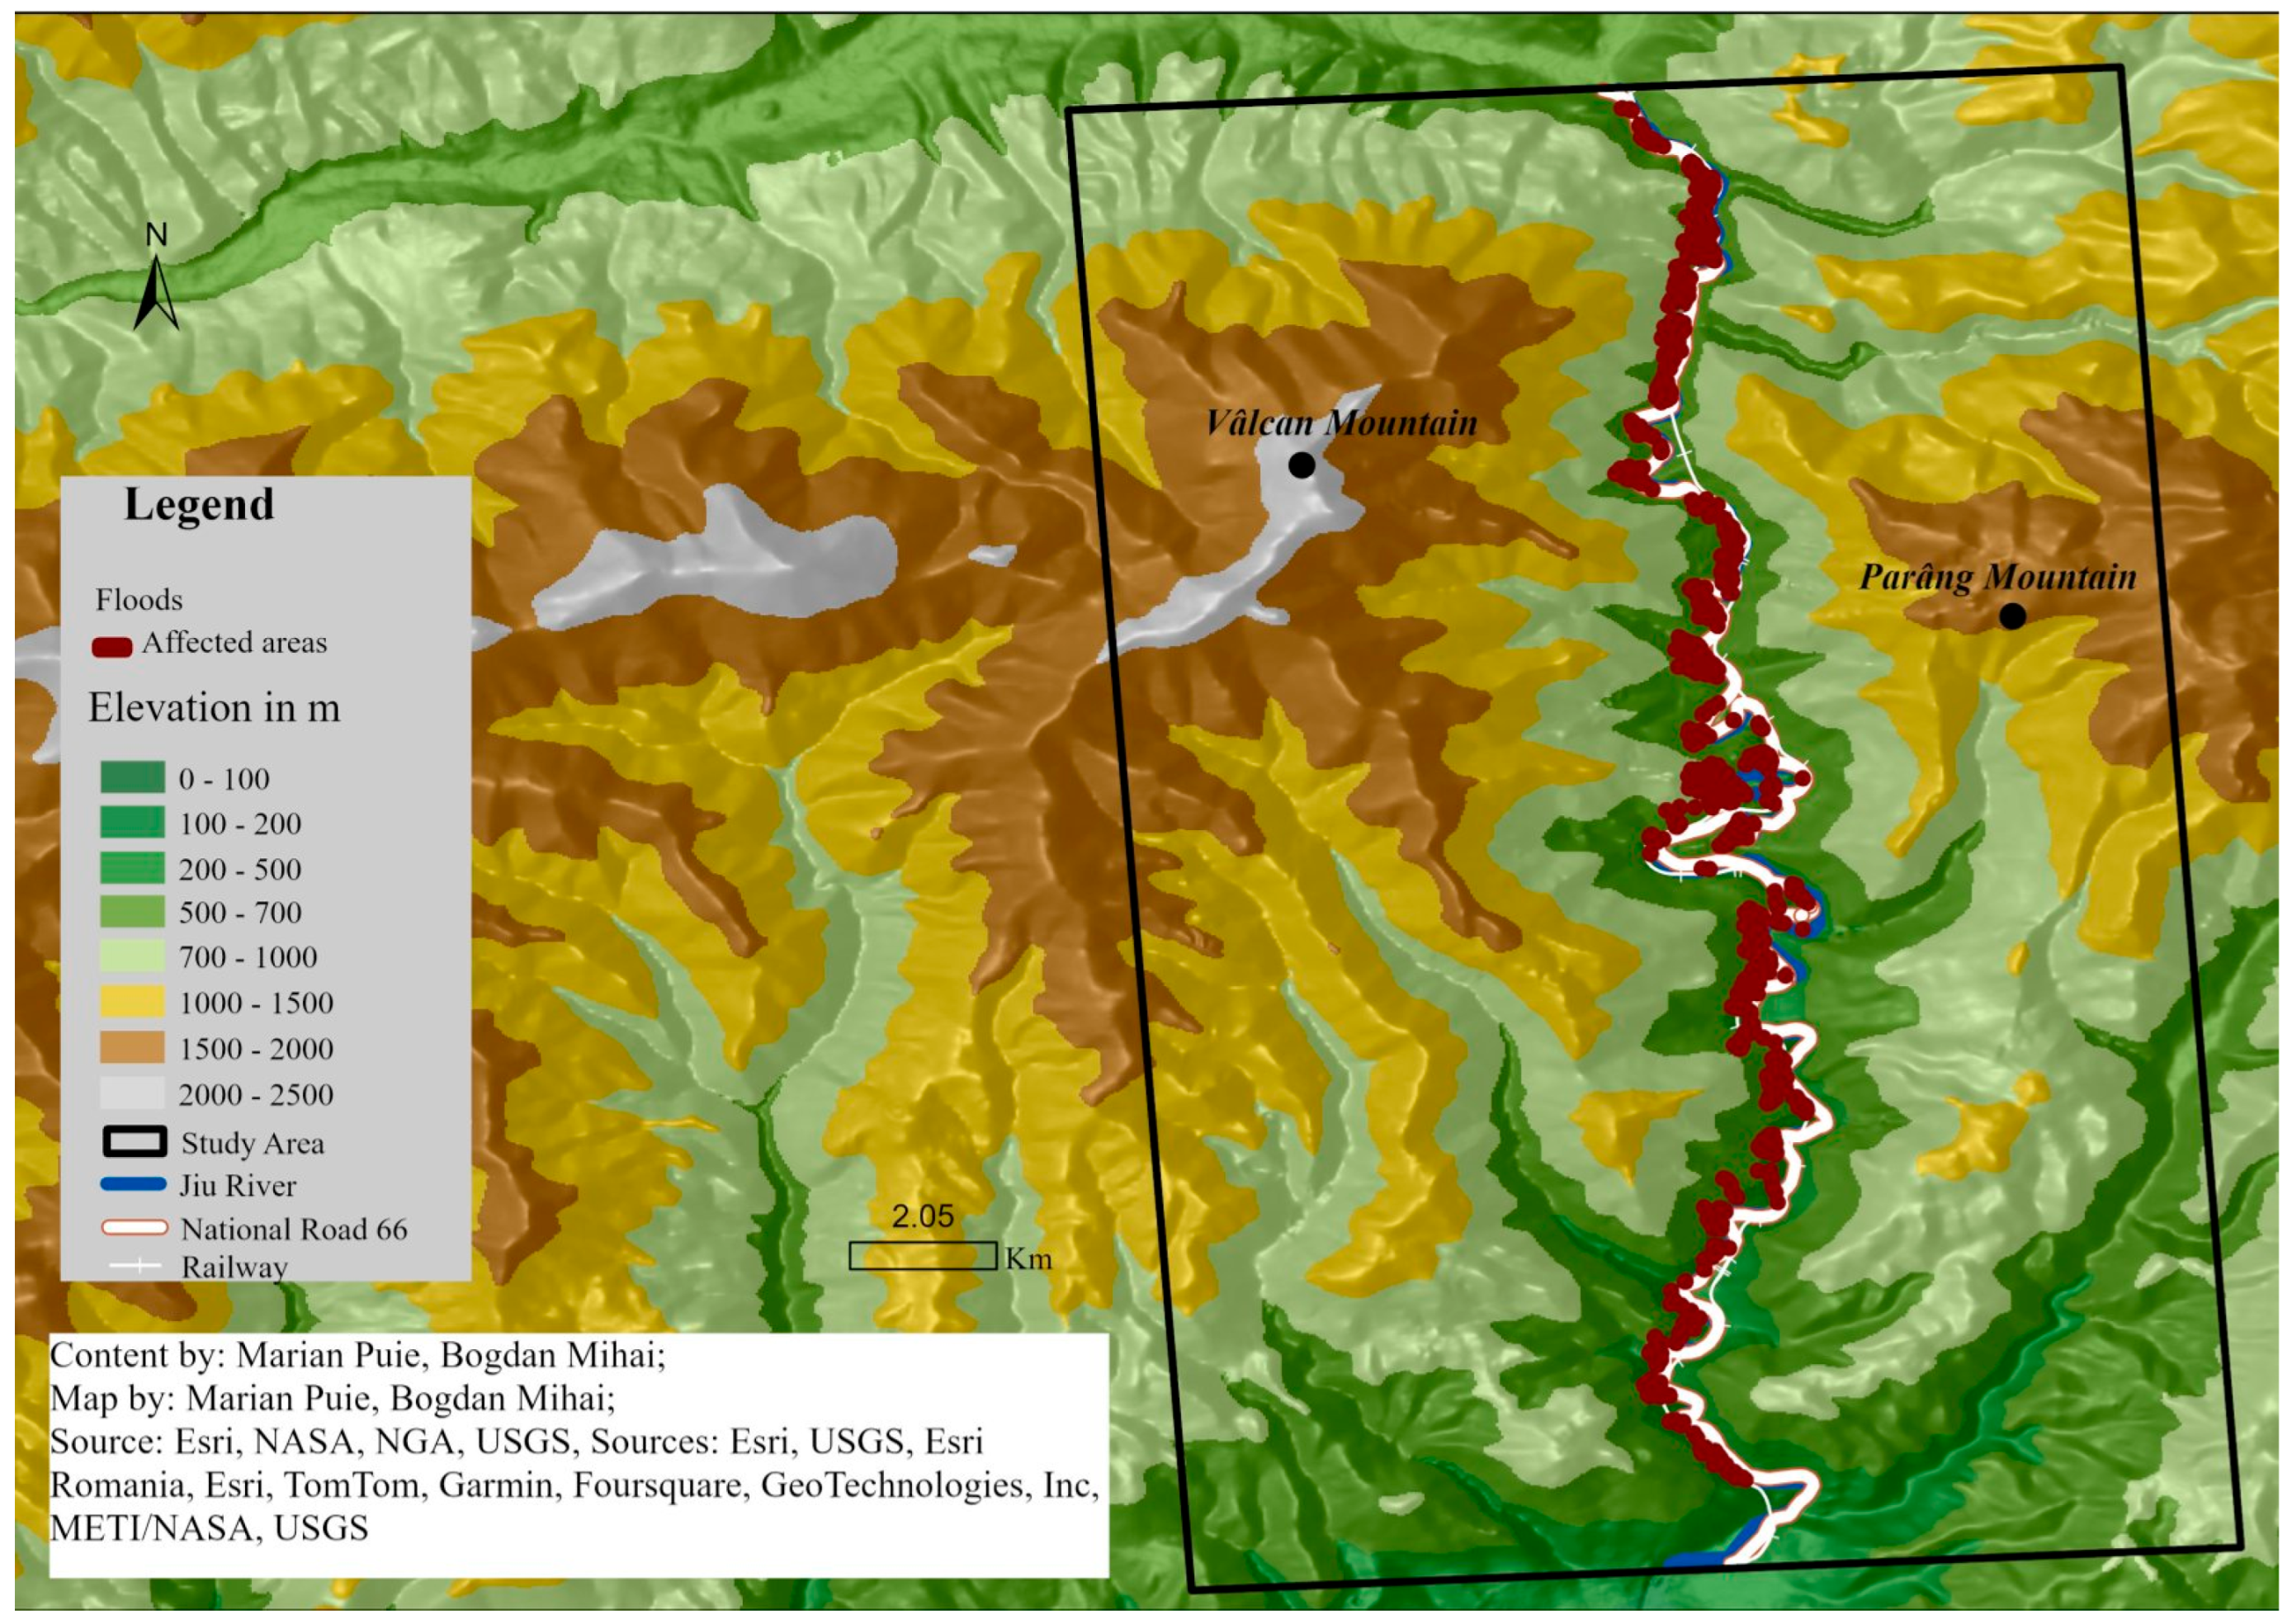
The integration of Sentinel-1 GRD radar images, processed with ESA SNAP software, enabled the creation of a detailed flood map for the Jiului Gorge region (Figure 4). The images were processed to produce interferograms that distinguished between flooded areas and permanent water bodies (Zoccatelli et al., 2010 [3]; Pettorelli et al., 2005 [12]; Gosar 2019 [13]). The processing workflow involved data calibration, terrain correction, and RGB composites, which enhanced image clarity and flood dynamics interpretation (Parajka et al., 2010 [14]; Bin Zuraimi and Kamaru Zaman 2021 [15]; Stumpf et al., 2013 [16]). RGB composites were created by merging pre-flood and post-flood images, assigning the red channel to the pre-flood image and the blue and green channels to the post-flood image.

3.2. Rockfall Mapping

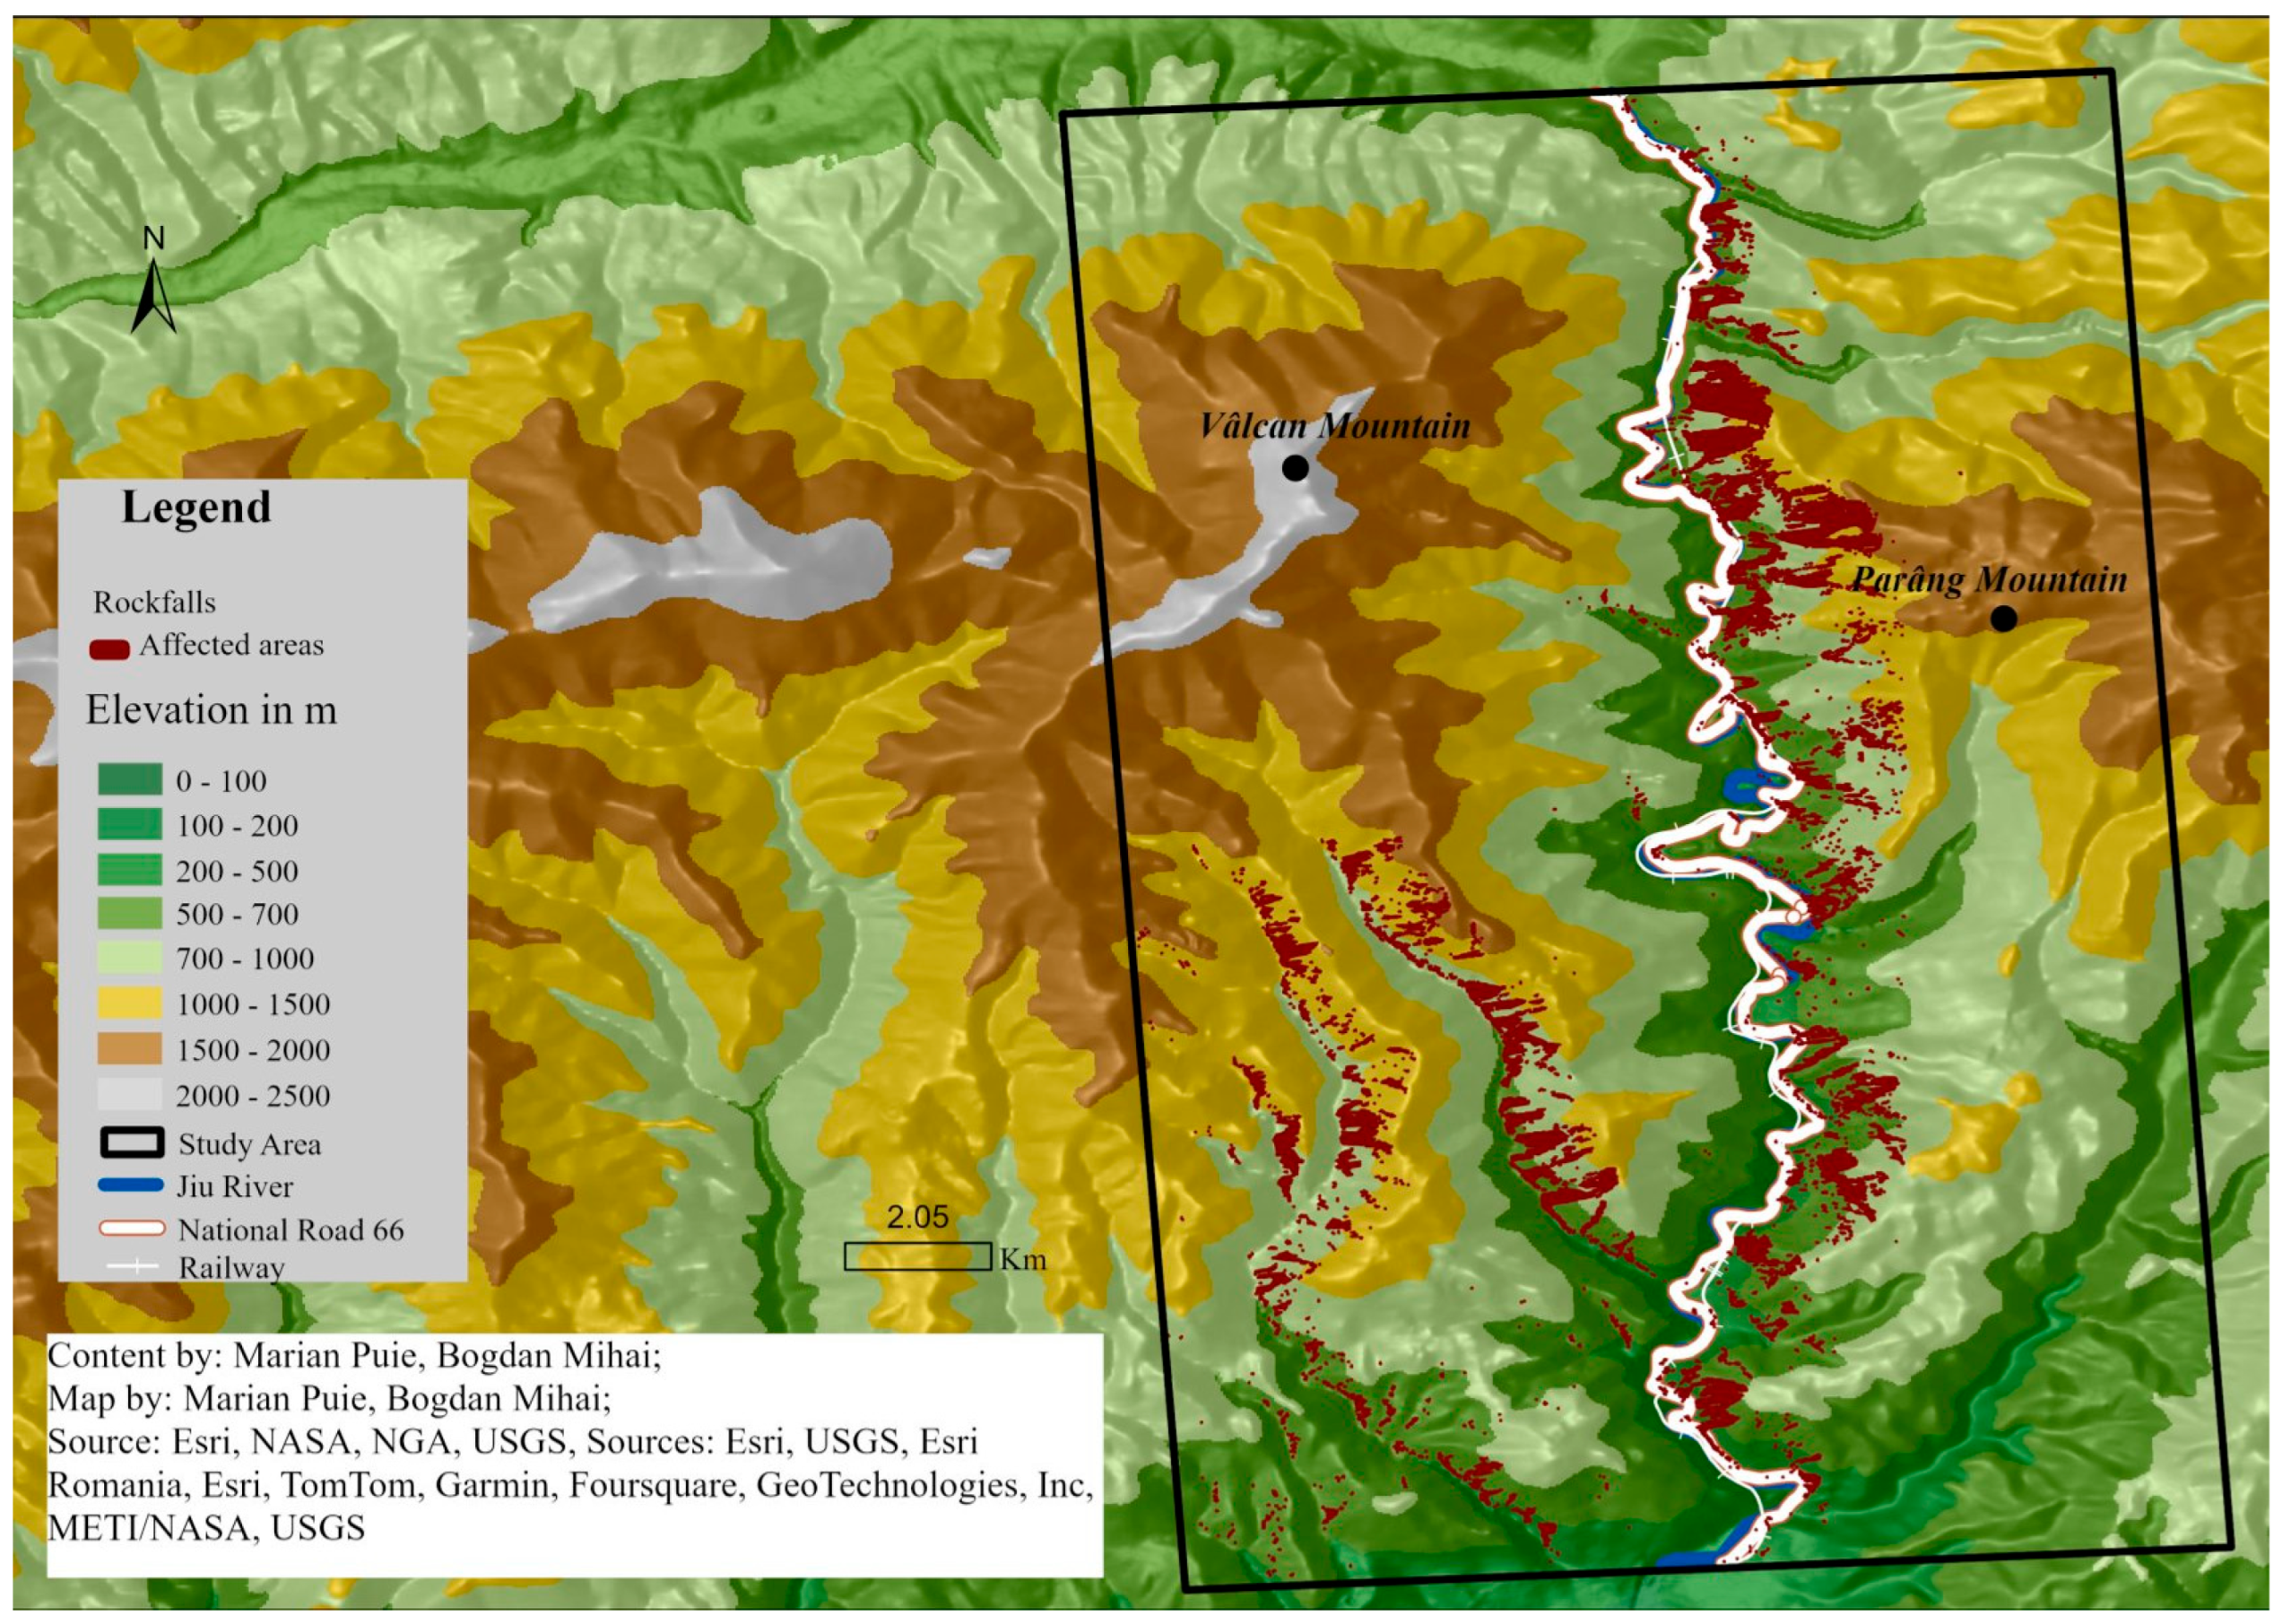
Rockfall detection utilized Sentinel-1 SLC radar images. Interferometric processing of co-registered images identified surface changes indicative of rockfalls, with accurate spatial representation ensured by geocoding (Stumpf et al., 2013 [16]; Žabota et al., 2019 [4]). The rockfall map (Figure 5) shows locations and incidents along National Road 66 and slopes for the following dates: 11 January, 22 March, 31 August, 16 September, 3 October, 28 November, and 2 October 2022.
Figure 5 presents a spatial analysis of rockfall incidents along National Road 66 and surrounding slopes within the Jiului Gorge. Leveraging Sentinel-1 radar imagery and interferometric processing techniques, the map pinpoints rockfall locations across specific dates (Gunnell et al., 2022 [17]; Gosar 2019 [13], Fidej et al., 2014 [18]). This visualization serves as a critical tool for understanding the spatial distribution of rockfall hazards in the region, aiding in risk assessment and potential mitigation strategies for the protection of transportation infrastructure.

3.3. Susceptibility Maps

  • The GIS-Based Approach Combined Various Datasets and Techniques to Assess Susceptibility to Floods and Rockfalls.
  • Digital Elevation Model (DEM) Analysis: DEM Data Provided Elevation Information for Terrain Classification into Low, Moderate, and High Slope Gradients, Indicating Erosion and Instability Risks (Guzzetti et al., 2006 [19]).
  • Flow Direction and Accumulation: Hydrological Models Identified Drainage Patterns and Potential Runoff Pathways (Tarolli and Tarboton 2006 [20]).
  • NDVI Calculations: NDVI from Satellite Imagery Assessed Vegetation Cover and Its Influence on Slope Stability (Pettorelli et al., 2005 [12]).
  • Weighted Overlays: Integration of DEM-Derived Slope Classifications, Land Cover Types, and Proximity to Water Bodies Produced Comprehensive Susceptibility Maps.
Figure 6 illustrates a susceptibility map that combines DEM-derived slope classifications, land cover types, and proximity to water bodies to depict areas that are highly susceptible to rockfall. At the same time, this classification shows a susceptible area with a high and very high degree, but with a much greater predominance in the upper area due to the much greater slopes of the gorge where several extensive slope stabilization works have been carried out over the years.
Figure 7 illustrates a susceptibility map that combines DEM-derived slope classifications, land cover types, and proximity to water bodies to depict areas that are highly susceptible to rockfall combined with extracted affected areas from radar images. Also, a higher degree of susceptibility can be observed, both from the data obtained with radar and from the classification obtained in ArcGIS Pro, in the upper part of the gorge due to the much higher slopes but also due to the orography because the Parâng Mountains are predominantly composed of limestone while the Vâlcan Mountains are composed of both limestone and crystalline shale. It is also not to be neglected that the communication networks, both the road and the railway, have been dug into the walls of the gorge, and the high and very high degrees of susceptibility to falling stones disrupt the smooth flow of traffic, meaning that participants face the unpleasant surprise of encountering rockfalls on cars (Figure 13), or rockfalls blocking the road (Figure 14) or railway.
Figure 8 illustrates a susceptibility map that combines DEM-derived slope classifications, land cover types, rainfall, and proximity to water bodies to describe areas that are highly susceptible to flooding. As can be seen, due to the narrowing of the gorge in the northern part of the study area, floods have a lower degree of occurrence. Once it begins to widen from the central part of the study area, a much higher susceptibility can already be observed, which continues in the southern part of the gorge where it widens much more and the slopes gradient decrease.
Figure 9 illustrates a susceptibility map that combines DEM-derived slope classifications, land cover types, rainfall, and proximity to water bodies to depict areas that are highly susceptible to flooding with affected areas drawn from radar images. As can be seen, due to the narrowing of the gorge in the northern part of the study area, floods have a lower degree of occurrence. Once it begins to widen from the central part of the study area, a much higher susceptibility can already be observed, which continues in the southern part of the gorge where it widens much more and the slopes decrease (Venegas-Cordero et al., 2022 [21]). Data were also extracted from the radar images which state that the central and southern area of the defile is much more prone to flooding, but at the same time, it cannot be overlooked that flooding also occurred in the upper area due to the more pronounced narrowing of the gorge; this disturbed the road traffic much more due to the fact that the road was flooded, and after the flood’s withdrawal it left much more sedimentary material that had to be cleaned in order for people to be able to drive under normal conditions.

3.4. Traffic Detection Using AI

Traffic dynamics along National Road 66 and the adjacent rail network were analyzed using YOLO models to enable real-time detection of vehicles and trains. This AI-driven approach provides critical insights into traffic flow patterns, which can be leveraged for both proactive and reactive measures during hazardous situations.
YOLO Model Implementation:
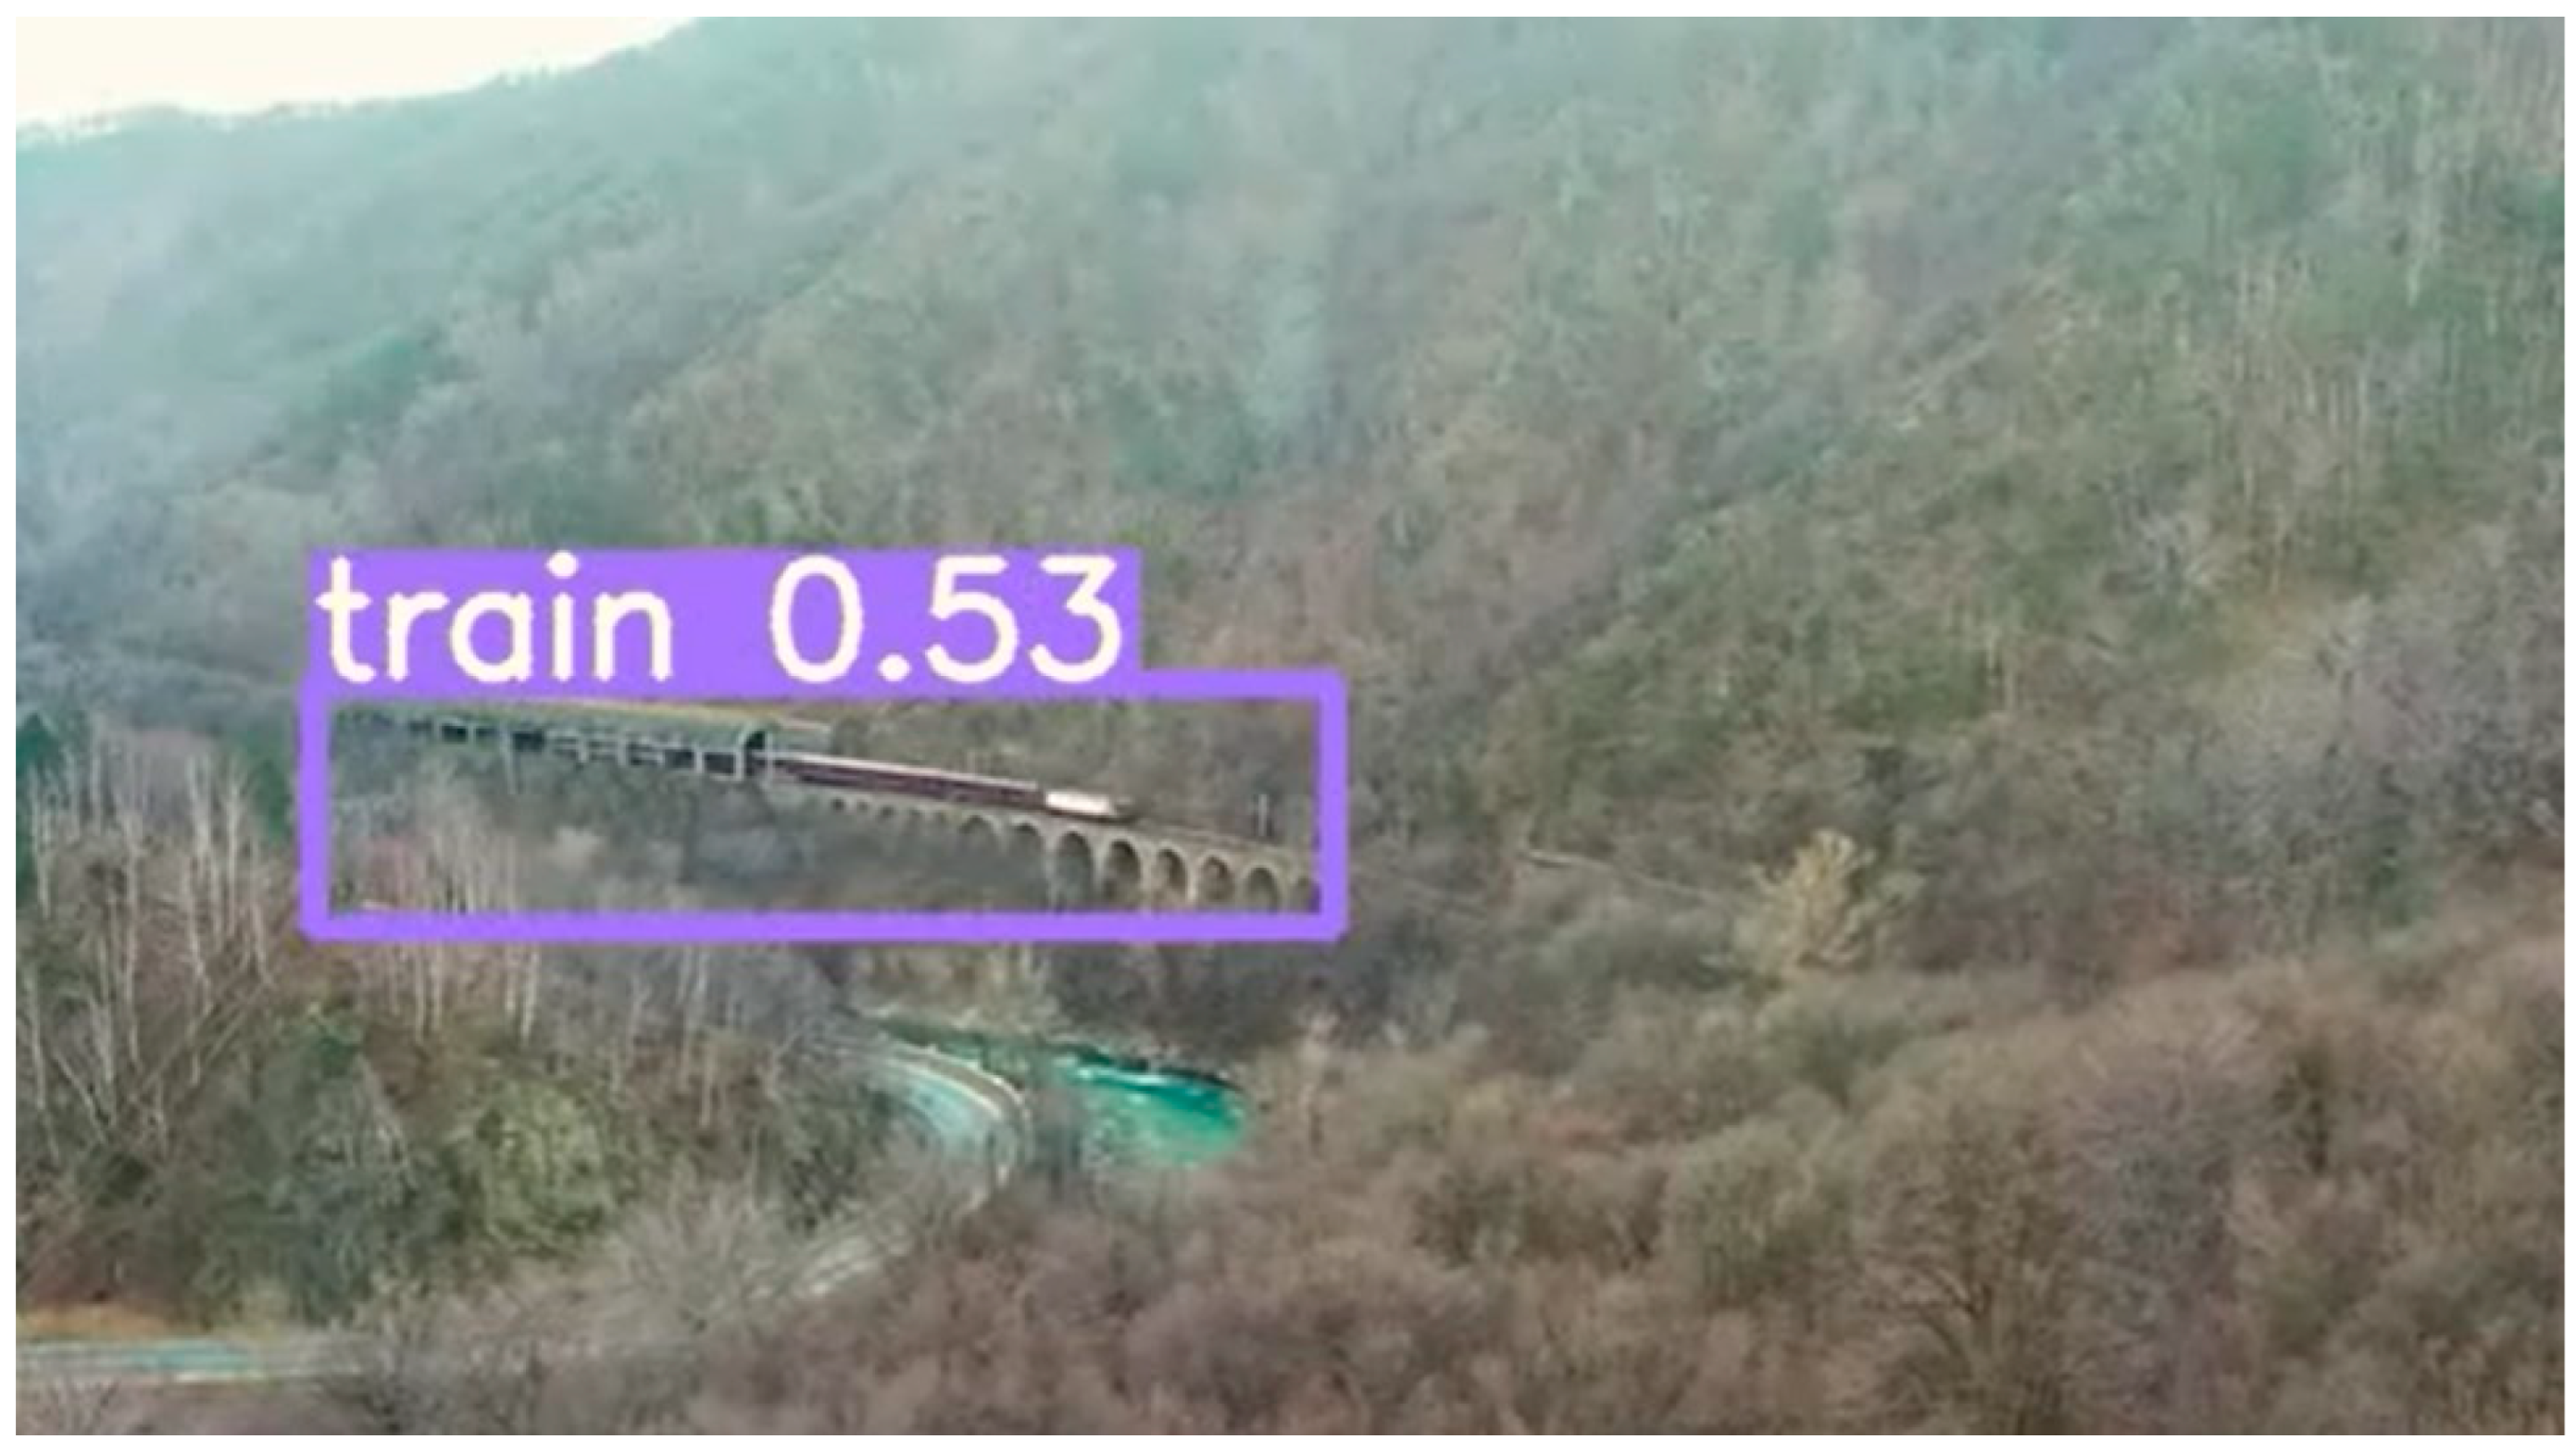
Pretrained YOLO models were utilized to identify vehicles and trains with varying detection accuracies influenced by factors such as visibility and object distance from the camera. While the images included in this section (Figure 10 and Figure 11) are from post-rockfall events, these visual examples primarily serve to illustrate the technical implementation of YOLO detection. However, it is important to highlight that YOLO’s intended use in this study extends beyond post-event recognition. The model is designed to operate continuously, providing real-time traffic monitoring that can detect anomalies indicative of impending or ongoing hazards (Yang and Zhang 2020 [22]).
For example, video data collected from strategically placed cameras along National Road 66 and the rail network were processed to evaluate traffic patterns dynamically (Amitha and Narayanan 2021 [10]; Al-qaness et al., 2021 [11]). When integrated with real-time hazard monitoring systems, YOLO models can help identify sudden traffic slowdowns, congestion, or deviations, which may signal a rockfall or related hazard. This preemptive detection capability is crucial for issuing timely alerts and informing emergency response strategies, thus enhancing road and rail safety.
Challenges and Potential Enhancements:
The deployment of YOLO models under varying environmental conditions—such as reduced visibility or during nighttime—revealed some limitations. For instance, Figure 10 demonstrates long-distance train detection, where accuracy declines with increased detection range and poor lighting. In contrast, Figure 11 showcases more precise vehicle detection in close-range scenarios, where YOLO models perform optimally.
Despite these challenges, the real-time monitoring capability of YOLO models is a significant asset for traffic management in hazardous areas. The models can continuously analyze traffic behavior, detect irregularities linked to potential or ongoing rockfall events, and facilitate immediate intervention. This proactive application underscores the value of enhancing traffic detection systems to safeguard both road and rail users in the Jiului Gorge region and similar environments.
Custom YOLO models were trained for rockfall detection, involving intensive work and precise control over datasets and parameters (Zoumpekas et al., 2021 [23]; Azimjonov and Özmen 2021 [24]; Lin and Jhang 2022 [25]). Training was conducted using Python 3.11 in Google Collab, and the results are depicted in Figure 12, Figure 13 and Figure 14.

4. Discussion

4.1. Insights from Integrated Analysis

The integration of remote sensing data, GIS modeling, and AI techniques in this study provided valuable insights into the interplay between floods and rockfalls in the Jiului Gorge, Romania, and their impact on transportation infrastructure (Bălteanu et al., 2012 [26], Ovreiu et al., 2024 [27]). The flood and rockfall maps generated, along with susceptibility assessments, offer a comprehensive overview of the region’s vulnerability to these hazards (Nguyen et al., 2017 [28]). This integrated approach has proven effective in identifying and mapping both flood and rockfall events, highlighting the region’s susceptibility to these natural hazards.

4.2. Effectiveness of Sentinel-1 Radar Imagery

Utilizing Sentinel-1 radar imagery was instrumental in detecting and mapping flood and rockfall events. The interferometric processing allowed for the differentiation of flooded areas from permanent water bodies, enhancing the accuracy of flood mapping in the region (Brakenridge et al., 2003 [1]). Similarly, the identification of surface changes indicative of rockfalls through co-registered radar images has significantly contributed to understanding rockfall occurrence and distribution (Stumpf et al., 2013 [16]). These findings underscore the value of radar imagery in hazard detection and mapping.

4.3. Validation of Models

The performance of our models was rigorously assessed using both qualitative and quantitative validation approaches. This included the analysis of independent data sources such as local and national news reports, which documented real-world events that impacted transportation infrastructure, including landslides, floods, and other mass movement phenomena.
Validation Methodology:
Temporal and Spatial Correlation: We systematically compared the high-risk zones identified by our models with the geographic and temporal data from news reports. By doing so, we ensured that the model predictions aligned closely with documented real-world mass movement events. Each event’s timestamp and precise location were essential to validating the model’s ability to forecast hazards effectively.
Visual Evidence: A qualitative assessment was performed by overlaying images from news sources onto the spatial predictions of our models. This visual comparison provided additional insights into the model’s accuracy. Furthermore, we processed radar satellite imagery, including Sentinel-1 Single Look Complex (SLC) and Ground Range Detected (GRD) formats, to refine our spatial analysis and validate the delineation of risk zones.
Quantitative Metrics:
Precision: We measured the percentage of accurately predicted high-risk zones compared to the total number of predictions.
Recall: The model’s ability to detect and identify events reported in media was evaluated.
F1 Score: This is a harmonic mean of precision and recall, providing a balanced assessment of the model’s performance.
Kappa Statistics: Although field validation was not directly feasible due to the challenges of the remote and extensive study area, the reliability of model predictions was enhanced by statistical analysis using Kappa metrics, where applicable.
Validation with Specific Events:
The validation approach involved cross-referencing the model-detected events with specific dates from media reports. For rockfall events, we focused on incidents documented on 11 January, 22 March, 31 August, 16 September, 3 October, 28 November, and 2 October 2022. Similarly, for flood events, we used reports from 20 January 2023, 5 January 2021, 26 June 2020, 17 September 2019, 15 November 2017, and 18 July 2016. By aligning our predictions with these events, we confirmed the spatial and temporal accuracy of our models.
Justification for Validation Approach:
While we acknowledge the importance of post-classification field validation, practical constraints such as the remoteness of certain sites and the broad temporal scope of our dataset made extensive fieldwork unfeasible. To compensate, we employed independent news sources and remote sensing data, establishing a robust validation framework that could be replicated in other regions. The alignment between our model predictions and documented incidents, supported by the processing of Sentinel-1 radar imagery and AI-based traffic detection, substantiates the model’s effectiveness.

4.4. Implications of Susceptibility Maps

The susceptibility maps, created through weighted overlay analysis of factors such as DEM and land cover (Guzzetti et al., 2006 [19]; Malczewski, 2006 [29]), provide essential tools for identifying areas prone to floods and rockfalls. These maps are instrumental for targeted risk mitigation and infrastructure planning. However, it is crucial to note that susceptibility maps represent potential hazards and do not guarantee the occurrence of events (Tošić et al., 2014 [30]). They should be used as part of a broader risk management strategy, considering other factors such as historical data and real-time monitoring.

4.5. AI Model Performance and Future Directions

The integration of AI models, specifically YOLO, for traffic detection and rockfall identification demonstrated promising potential. However, further development and refinement are necessary to achieve reliable real-time monitoring and early warning systems (Amitha and Narayanan 2021 [10]; Al-qaness et al., 2021 [11]). The challenges related to visibility and image quality highlight the need for continuous improvement in AI algorithms to enhance accuracy and timeliness (Ćorović et al., 2018 [31]; Zhang, Z. et al., 2024 [8]; Zhang, X. et al., 2024 [6]).

4.6. Challenges and Future Research

The mountainous terrain and complex geological conditions of the study area present unique challenges for hazard assessment and management (Mreyen et al., 2021 [32]). The findings of this research contribute to a better understanding of these challenges and provide a foundation for future studies (Gunnell et al., 2022 [17], Petje et al., 2005 [33]). Future research should focus on enhancing data integration, optimizing AI models, and implementing long-term monitoring systems to improve hazard management and mitigation efforts.

5. Conclusions

This study employed a comprehensive approach integrating remote sensing, GIS analysis, and artificial intelligence to assess flood and rockfall hazards in the Jiului Gorge, Romania, and their impacts on traffic infrastructure. The key findings are as follows:
Flood and Rockfall Mapping: Sentinel-1 radar imagery proved valuable for detecting and mapping both flood and rockfall events. Interferometric processing effectively distinguished flooded areas from permanent water bodies, while co-registered images aided in identifying surface changes indicative of rockfalls.
Susceptibility Assessments: Weighted overlay analysis of factors like DEM and land cover yielded susceptibility maps, crucial for pinpointing areas prone to these hazards and informing risk mitigation strategies.
AI-based Traffic Detection: YOLO models demonstrated potential in real-time traffic detection for road and rail networks. However, further development is necessary to address limitations associated with visibility and image quality.
This study highlights the effectiveness of integrating remote sensing, GIS, and AI for hazard assessment and infrastructure management. The susceptibility maps and validated AI models provide valuable tools for stakeholders involved in transportation planning, disaster preparedness, and risk mitigation efforts in the Jiului Gorge region.
Future research directions include the following:
Enhanced Data Integration: This involves exploring the fusion of various data sources, including historical records, real-time monitoring systems, and meteorological data, to improve hazard prediction and risk assessment.
AI Model Optimization: This involves refining YOLO models through techniques like transfer learning and hyperparameter tuning to enhance accuracy and robustness in diverse weather and lighting conditions.
Long-Term Monitoring Systems: Implementing long-term monitoring systems for continuous data collection and analysis facilitates a more comprehensive understanding of hazard dynamics and enables proactive risk mitigation strategies.

Author Contributions

Conceptualization, M.P. and B.-A.M.; methodology, M.P. and B.-A.M.; software, M.P. and B.-A.M.; validation, M.P. and B.-A.M.; formal analysis, M.P. and B.-A.M.; investigation, M.P. and B.-A.M.; resources, M.P. and B.-A.M.; data curation, M.P. and B.-A.M.; writing—original draft preparation, M.P.; writing—review and editing, B.-A.M.; visualization, M.P. and B.-A.M. All authors have read and agreed to the published version of the manuscript.

Funding

This research was funded by the University of Bucharest, Faculty of Geography, during PhD studies. This paper was supported by the Council for Doctoral Studies (CSUD), University of Bucharest.

Institutional Review Board Statement

Not applicable.

Informed Consent Statement

Not applicable.

Data Availability Statement

The original contributions presented in this study are included in the article; further inquiries can be directed to the corresponding author.

Acknowledgments

The authors thank SDN Deva INFO HD TV DEVA, Pro Tv, and INFO HD DEVA TELEVISION for letting us use images from the news in our detection. This paper was supported by the Council for Doctoral Studies (CSUD), University of Bucharest.

Conflicts of Interest

The authors declare no conflicts of interest.

References

  1. Brakenridge, G.R.; Anderson, E.; Nghiem, S.V.; Caquard, S.; Shabaneh, T.B. Flood warnings, flood disaster assessments, and flood hazard reduction: The roles of orbital remote sensing. In Proceedings of the 30th International Symposium on Remote Sensing of Environment, Honolu, HI, USA, 10–14 November 2003. [Google Scholar]
  2. Didovets, I.; Krysanova, V.; Bürger, G.; Snizhko, S.; Balabukh, V.; Bronstert, A. Climate change impact on regional floods in the Carpathian region. J. Hydrol. Reg. Stud. 2019, 22, 100590. [Google Scholar] [CrossRef]
  3. Zoccatelli, D.; Borga, M.; Zanon, F.; Antonescu, B.; Stancalie, G. Which rainfall spatial information for flash flood response modelling? A numerical investigation based on data from the Carpathian range, Romania. J. Hydrol. 2010, 394, 148–161. [Google Scholar] [CrossRef]
  4. Žabota, B.; Repe, B.; Kobal, M. Influence of digital elevation model resolution on rockfall modelling. Geomorphology 2019, 328, 183–195. [Google Scholar] [CrossRef]
  5. Žabota, B.; Trappmann, D.; Levanič, T.; Kobal, M. Reconstruction of rockfall activity through dendrogeomorphology and a scar-counting approach: A study in a beech forest stand in the Trenta valley (Slovenian Alps). Acta Silvae Ligni 2020, 121, 19–32. [Google Scholar] [CrossRef]
  6. Zhang, X.; Fu, Q.; Li, Y.; Han, Z.; Jiang, N.; Li, C. A Dynamic Detection Method for Railway Slope Falling Rocks Based on the Gaussian Mixture Model Segmentation Algorithm. Appl. Sci. 2024, 14, 4454. [Google Scholar] [CrossRef]
  7. Pánek, T.; Engel, Z.; Mentlík, P.; Braucher, R.; Břežný, M.; Škarpich, V.; Zondervan, A. Cosmogenic age constraints on post-LGM catastrophic rock slope failures in the Tatra Mountains (Western Carpathians). CATENA 2016, 138, 52–67. [Google Scholar] [CrossRef]
  8. Zhang, Z.; Chen, P.; Huang, Y.; Dai, L.; Xu, F.; Hu, H. Railway obstacle intrusion warning mechanism integrating YOLO-based detection and risk assessment. J. Ind. Inf. Integr. 2024, 38, 100571. [Google Scholar] [CrossRef]
  9. Tao, J.; Wang, H.; Zhang, X.; Li, X.; Yang, H. An object detection system based on YOLO in traffic scene. In Proceedings of the 2017 6th International Conference on Computer Science and Network Technology (ICCSNT), Dalian, China, 21–22 October 2017. [Google Scholar] [CrossRef]
  10. Amitha, I.C.; Narayanan, N.K. Object Detection Using YOLO Framework for Intelligent Traffic Monitoring. In Machine Vision and Augmented Intelligence—Theory and Applications; Springer: Singapore, 2021. [Google Scholar] [CrossRef]
  11. Al-qaness, M.A.A.; Abbasi, A.A.; Fan, H.; Ibrahim, R.A.; Alsamhi, S.H.; Hawbani, A. An improved YOLO-based road traffic monitoring system. Computing 2021, 103, 211–230. [Google Scholar] [CrossRef]
  12. Pettorelli, N.; Vik, J.O.; Mysterud, A.; Gaillard, J.-M.; Tucker, C.J.; Stenseth, N. Chr. Using the satellite-derived NDVI to assess ecological responses to environmental change. rends Ecol. Evol. 2005, 20, 503–510. [Google Scholar] [CrossRef]
  13. Gosar, A. The size of the area affected by earthquake induced rockfalls: Comparison of the 1998 Krn Mountains (NW Slovenia) earthquake (Mw 5.6) with worldwide data. Acta Geogr. Slov. 2019, 59, 51–61. [Google Scholar] [CrossRef]
  14. Parajka, J.; Kohnová, S.; Bálint, G.; Barbuc, M.; Borga, M.; Claps, P.; Cheval, S.; Dumitrescu, A.; Gaume, E.; Hlavčová, K.; et al. Seasonal characteristics of flood regimes across the Alpine–Carpathian range. J. Hydrol. 2010, 394, 78–89. [Google Scholar] [CrossRef] [PubMed]
  15. Bin Zuraimi, M.A.; Kamaru Zaman, F.H. Vehicle Detection and Tracking using YOLO and DeepSORT. In Proceedings of the 2021 IEEE 11th IEEE Symposium on Computer Applications & Industrial Electronics (ISCAIE), Penang, Malaysia, 3–4 April 2021. [Google Scholar] [CrossRef]
  16. Stumpf, A.; Malet, J.-P.; Kerle, N.; Niethammer, U.; Rothmund, S. Image-based mapping of surface fissures for the investigation of landslide dynamics. Geomorphology 2013, 186, 12–27. [Google Scholar] [CrossRef]
  17. Gunnell, Y.; Blondeau, S.; Jarman, D. Rock slope failure in the Southern Carpathians (Romania): Range-wide inventory and links with long-term mountain landscape evolution. Geomorphology 2022, 418, 108433. [Google Scholar] [CrossRef]
  18. Fidej, G.; Mikos, M.; Rugani, T.; Jez, J.; Kumelj, S.; Diaci, J. Assessment of the protective function of forests against debris flows in a gorge of the Slovenian Alps. Iforest-Biogeosci. For. 2014, 8, 73–81. [Google Scholar] [CrossRef]
  19. Guzzetti, F.; Galli, M.; Reichenbach, P.; Ardizzone, F.; Cardinali, M. 2006: Landslide hazard assessment in the Collazzone area, Umbria, Central Italy. Nat. Hazards Earth Syst. Sci. 2006, 6, 115–131. [Google Scholar] [CrossRef]
  20. Tarolli, P.; Tarboton, D.G. A new method for determination of most likely landslide initiation points and the evaluation of digital terrain model scale in terrain stability mapping. Hydrol. Earth Syst. Sci. 2006, 10, 663–677. [Google Scholar] [CrossRef]
  21. Venegas-Cordero, N.; Kundzewicz, Z.W.; Jamro, S.; Piniewski, M. Detection of trends in observed river floods in Poland. J. Hydrol. Reg. Stud. 2022, 41, 101098. [Google Scholar] [CrossRef]
  22. Yang, W.; Zhang, W. Real-time Traffic Signs Detection Based on YOLO Network Model. In Proceedings of the 2020 International Conference on Cyber-Enabled Distributed Computing and Knowledge Discovery (CyberC), Chongqing, China, 29–30 October 2020. [Google Scholar] [CrossRef]
  23. Zoumpekas, T.; Puig, A.; Salamó, M.; García-Sellés, D.; Blanco Nuñez, L.; Guinau, M. An intelligent framework for end-to-end rockfall detection. Int. J. Intell. Syst. 2021, 36, 6471–6502. [Google Scholar] [CrossRef]
  24. Azimjonov, J.; Özmen, A. A real-time vehicle detection and a novel vehicle tracking systems for estimating and monitoring traffic flow on highways. Adv. Eng. Inform. 2021, 50, 101393. [Google Scholar] [CrossRef]
  25. Lin, C.-J.; Jhang, J.-Y. Intelligent Traffic-Monitoring System Based on YOLO and Convolutional Fuzzy Neural Networks. IEEE Access 2022, 10, 14120–14133. [Google Scholar] [CrossRef]
  26. Bălteanu, D.; Jurchescu, M.; Surdeanu, V.; Ionita, I.; Goran, C.; Urdea, P.; Rădoane, M.; Sima, M. Recent Landform Evolution in the Romanian Carpathians and Pericarpathian Regions. In Recent Landform Evolution: The Carpatho-Balkan-Dinaric Region; Springer: Dordrecht, The Netherlands, 2021. [Google Scholar] [CrossRef]
  27. Ovreiu, A.-B.; Oprea, C.-R.; Andra-Topârceanu, A.; Pintilii, R.-D. Dendrogeomorphological Reconstruction of Rockfall Activity in a Forest Stand, in the Cozia Massif (Southern Carpathians, Romania). Forests 2024, 15, 122. [Google Scholar] [CrossRef]
  28. Nguyen, Q.-K.; Tien Bui, D.; Hoang, N.-D.; Trinh, P.T.; Nguyen, V.-H.; Yilmaz, I. A Novel Hybrid Approach Based on Instance Based Learning Classifier and Rotation Forest Ensemble for Spatial Prediction of Rainfall-Induced Shallow Landslides using GIS. Sustainability 2017, 9, 813. [Google Scholar] [CrossRef]
  29. Malczewski, J. GIS-based multicriteria decision analysis: A survey of the literature. Int. J. Geogr. Inf. Sci. 2006, 20, 703–726. [Google Scholar] [CrossRef]
  30. Tošić, R.; Dragićević, S.; Zorn, M.; Lovrić, N. Landslide susceptibility zonation: A case study of the Municipality of Banja Luka (Bosnia and Herzegovina). Acta Geogr. Slov. 2014, 54, 190–202. [Google Scholar] [CrossRef]
  31. Ćorović, A.; Ilić, V.; Ðurić, S.; Marijan, M.; Pavković, B. The Real-Time Detection of Traffic Participants Using YOLO Algorithm. In Proceedings of the 2018 26th Telecommunications Forum (TELFOR), Belgrade, Serbia, 20–21 November 2018. [Google Scholar] [CrossRef]
  32. Mreyen, A.-S.; Cauchie, L.; Micu, M.; Onaca, A.; Havenith, H.-B. Multiple geophysical investigations to characterize massive slope failure deposits: Application to the Balta rockslide. Geophys. J. Int. 2021, 225, 1032–1047. [Google Scholar] [CrossRef]
  33. Petje, U.; Ribičič, M.; Mikoš, M. Computer simulation of stone falls and rockfalls. Acta Geogr. Slov. 2005, 45, 93–120. [Google Scholar] [CrossRef]
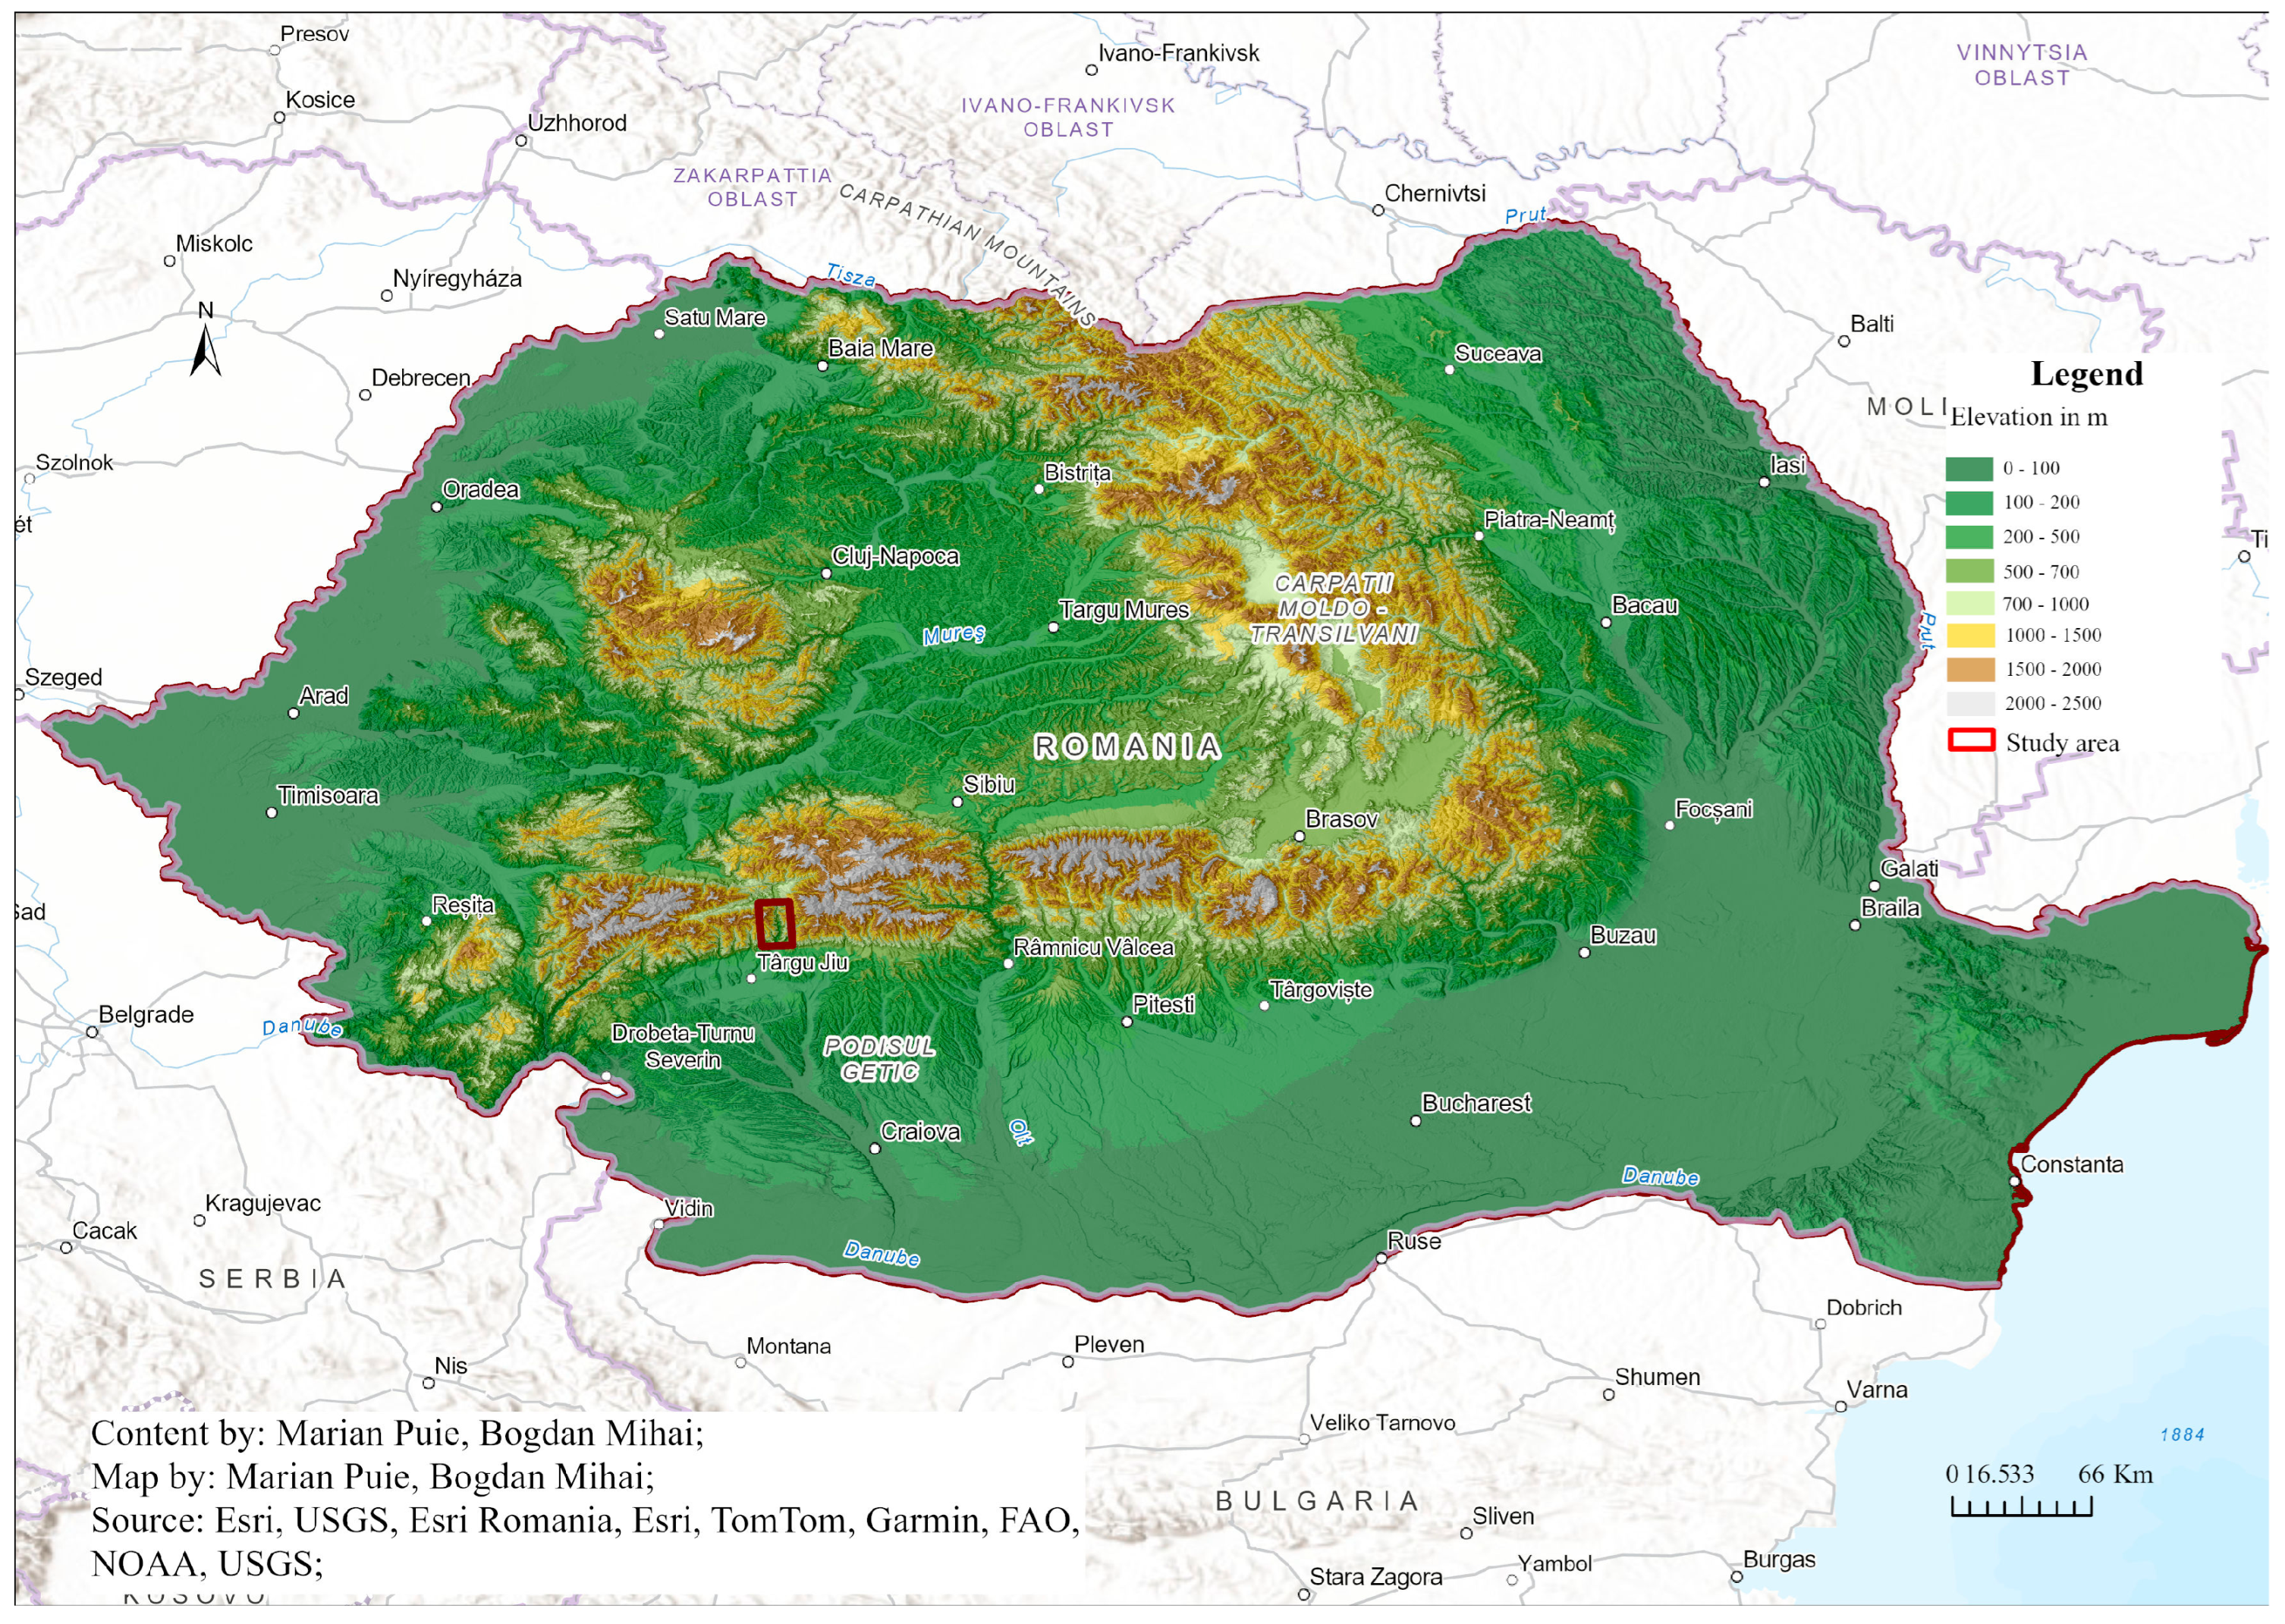
Figure 1. Geographical location of the study area.
Applsci 14 10270 g001
Figure 2. Sentinel 1 GRD images of study area from descending orbit (left, 20 January 2023), from ascending orbit (middle, 20 January 2023), RGB interferogram and processing software workflow.
Applsci 14 10270 g002
Figure 3. ESA SNAP software workflow image samples for rockfall detection from Sentinel-1 SLC product.
Applsci 14 10270 g003
Figure 4. Flood map of the Jiului Gorge region, illustrating the extent and severity of flood events based on Sentinel-1 GRD images.
Applsci 14 10270 g004
Figure 5. Rockfall map displaying incidents along National Road 66 and surrounding slopes for specified dates.
Applsci 14 10270 g005
Figure 6. Rockfall susceptibility map showing areas highly susceptible to rockfall, with a notable prevalence in the upper section of the gorge.
Applsci 14 10270 g006
Figure 7. Rockfall susceptibility map combined with affected areas from radar images, highlighting the upper part of the gorge with high susceptibility.
Applsci 14 10270 g007
Figure 8. Floods susceptibility map combining DEM-derived slope classifications, land cover types, rainfall, and proximity to water bodies, showing higher susceptibility in wider parts of the gorge.
Applsci 14 10270 g008
Figure 9. Floods susceptibility map combined with radar-detected flood areas, illustrating increased susceptibility in the central and southern parts of the gorge.
Applsci 14 10270 g009
Figure 10. Train detection and recognition using YOLO models, illustrating detection from a significant distance with reduced visibility.
Applsci 14 10270 g010
Figure 11. Road traffic element detection with greater precision due to closer camera proximity.
Applsci 14 10270 g011
Figure 12. Training results from YOLOv9 model, showcasing classes obtained after training.
Applsci 14 10270 g012
Figure 13. Detection results including several classes, highlighting various rockfall types.
Applsci 14 10270 g013
Figure 14. Detection results focusing on a single class, illustrating detailed rockfall identification.
Applsci 14 10270 g014
Disclaimer/Publisher’s Note: The statements, opinions and data contained in all publications are solely those of the individual author(s) and contributor(s) and not of MDPI and/or the editor(s). MDPI and/or the editor(s) disclaim responsibility for any injury to people or property resulting from any ideas, methods, instructions or products referred to in the content.