Article

Application of Machine Learning Algorithms in Real-Time Monitoring of Conveyor Belt Damage

1
Faculty of Mechanical Engineering, Casimir Pulaski Radom University, Stasieckiego 54, 26-600 Radom, Poland
2
Institute of Mechanical Science, Vilnius Gediminas Technical University, Sauletekio al. 11, LT-10223 Vilnius, Lithuania
3
Faculty of Mechanical Engineering, VSB-Technical University of Ostrava, 17. listopadu 2172/15, 70800 Ostrava, Czech Republic
*
Author to whom correspondence should be addressed.
Appl. Sci. 2024, 14(22), 10464; https://doi.org/10.3390/app142210464
Submission received: 23 October 2024 / Revised: 3 November 2024 / Accepted: 5 November 2024 / Published: 13 November 2024
(This article belongs to the Special Issue Artificial Intelligence in Fault Diagnosis and Signal Processing)

Abstract

:

Featured Application

This work can potentially be applied to industrial belt conveyors of any type. The tested system can be used for real-time monitoring in order to identify and prevent overloads, misalignments, growing damage to the belt in the early stages, and other trends that may cause failure.

Abstract

This paper is devoted to the real-time monitoring of close transportation devices, namely, belt conveyors. It presents a novel measurement system based on the linear strain gauges placed on the tail pulley surface. These gauges enable the monitoring and continuous collection and processing of data related to the process. An initial assessment of the machine learning application to the load identification was made. Among the tested algorithms that utilized machine learning, some exhibited a classification accuracy as high as 100% when identifying the load placed on the moving belt. Similarly, identification of the preset damage was possible using machine learning algorithms, demonstrating the feasibility of the system for fault diagnosis and predictive maintenance.

1. Introduction

It can be stated that belt conveyors are the most common type of conveyor since they are relatively cheap, versatile, and easy to maintain [1,2]. There are systems consisting of a single belt conveyor, but there are also long transport lines with a number of conveyors [3]. Belts are a crucial component of conveyor systems [4], which are subject to degradation and failure under normal work conditions due to the dynamic contact between the transported material on the belt’s surface and between the belt and its supporting components [5]. Degradation is increased and accelerated under multiple physical, chemical, or biological factors [6], but also under thermal shocks, humidity, or aging [7]. Apart from safety hazards, unplanned shutdowns lead to significant losses [8]. Thus, degradation must be continuously monitored by collecting real-time data from various sensors [9]. This task is not trivial since belts are one of the most complex and most difficult components to diagnose [10]. In general, there are two methods for the detection of conveyor belt damage: (i) contact methods with an extra mechanical component embedded into the conveyor belt’s components and (ii) non-contact methods like the ones based on machine vision [11] or acoustic emission analysis [12]. Monitoring the state and condition of the conveyor belt during its work is of great importance because it enables one to discover the appearance of possible damage and failure early on [13]. From the published data [14], it is known that expenses on conveyor monitoring equipment were, in 2018, as high as USD 200 million, and they are expected to exceed USD 0.25 trillion in 2024.
However, apart from collecting the signal from a monitoring system conveying the belt’s actual condition, a proper analysis of the registered signals should be performed, and the relevant decision should follow [15]. Among others, machine learning (ML) algorithms are widely applied for this purpose. For instance, Andrejiova and co-authors attempted to identify the correlations between significant damage to the rubber–textile material of the conveyor belt and some parameters, such as the type of material and the impact height [16]. Using multispectral imaging, Zhou et al. assessed a conveyor belt’s wear condition, classifying it into three wear states using a deep learning approach [17]. In order to prevent the belt from flipping over, Rumin, together with the team, proposed an algorithm based on machine learning and analytical algorithms to determine the forces acting on the individual components of the conveyor and subsequently make a decision on classifying the category of the obtained results [18]. Zhang and co-authors reported the application of a new detection method able to simultaneously detect multiple faults using a special dataset for various types of damage to the conveyor belt [19]. Guo and colleagues proposed a novel method for conveyor belt damage detection based on fusion knowledge distillation and a deep neural network using the data collected via an image acquisition module [20]. Signals obtained from both machine vision [21] and acoustic systems [22] were reported to be analyzed with a machine learning algorithm. Pulcini and Modoni proposed a digital twin to perform a predictive maintenance approach through the analysis of data collected from various sensors placed along an operating conveyor belt, exploiting a machine learning algorithm [23]. Also, Soares and co-authors reported the application of a combination of wavelet packet decomposition and gradient boosting decision tree for the diagnosis of failure modes, including the surface wear of laboratory belt conveyor idlers [24].
In this paper, a novel system for conveyor belt monitoring is presented based on strain gauges. Strain gauges provide a continuous signal corresponding to the belt’s tension in different work conditions. Considering some of the features of the registered signals, an attempt was undertaken to identify them using several machine learning algorithms.

2. Materials and Methods

The materials and methods consisted of a model of the belt conveyor, a measurement system for real-time monitoring, and machine learning algorithms that helped to classify the loads and damage types of the belt.

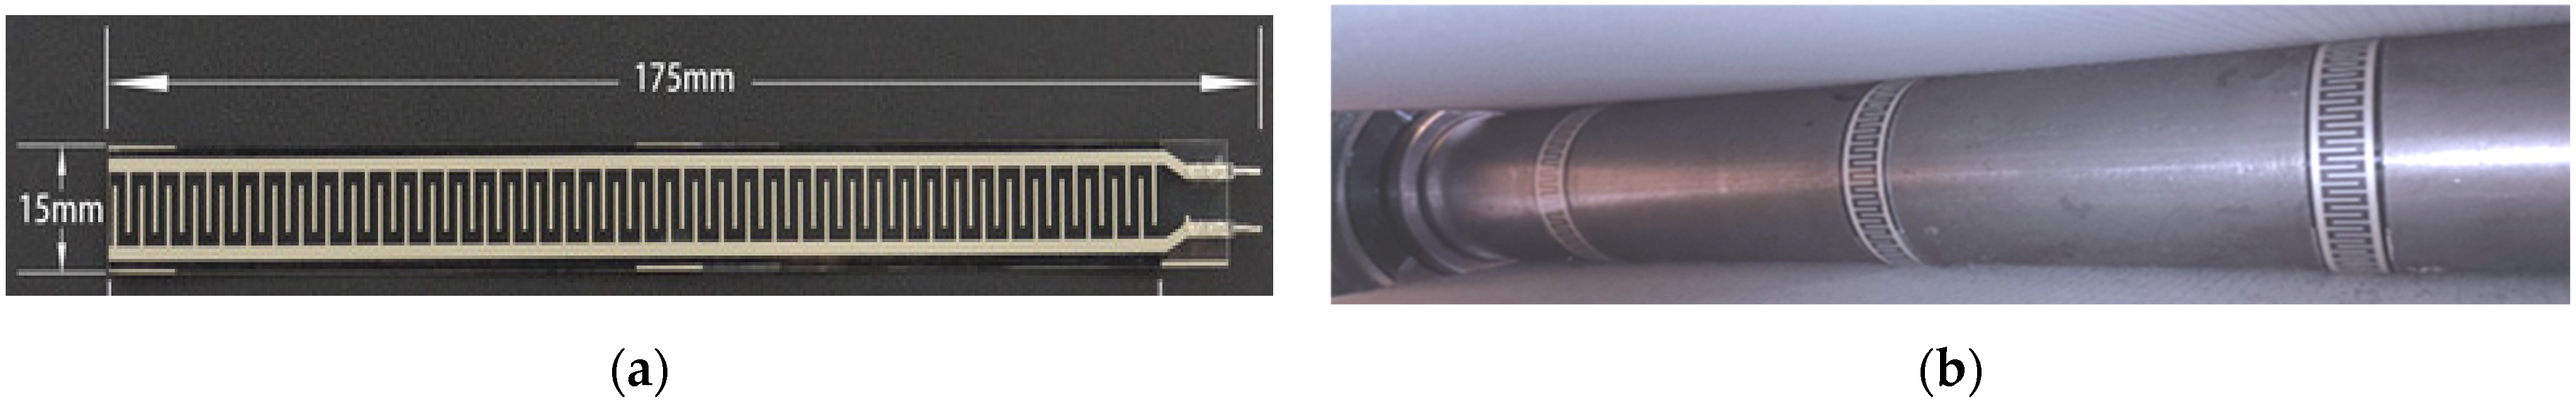
2.1. Monitoring System

The proposed monitoring system is a type of contact method for the detection of conveyor belt damage. It is based on strain gauges, exploiting the principle described in [25]. However, for the current research, the system was modified and patented [26]. In this solution, the long, flexible RP-L-170-type thin-film sensor [27] produced by DFRobot (Chengdu, China) was applied. Figure 1a illustrates the strain gauge, and Figure 1b shows its position on the tail pulley surface.
The resistance RT of a strain gauge is directly dependent on the pressing force applied by the belt RT = (Fn). To register the signal from the strain gauges, a special electronic unit was projected and built into the hollow tail pulley. Figure 2a shows the holder of the printed circuit board (PCB) fitted to the inside of the pulley. Figure 2b shows the PCB designed to collect, transmit, and process the signals initially so that the results can be presented in a remote laptop in the form of graphs and data tables for further analysis.
In principle, the electronic system was similar to the one described in [25]. Its tasks were to collect signals generated by the force F between the conveyor belt and the strain gauges placed on the pulley surface, to transmit the signal through the Bluetooth port, and to process collected data with a dedicated LabView program. The entire system underwent calibration as described in [28], and the Type A expanded uncertainty was below 1% of the measured value for the 99% gradient boosting decision tree, while the approximation error was ca. 8%. These results cover all of the uncertainty sources, including the electronic unit. The monitoring system was expected to support a predictive maintenance strategy able to safeguard the continuous operation of the conveyor and to minimize supply chain disruptions in agreement with the Industry 4.0 concept [29].

2.2. The Test Model of the Belt Conveyor

In order to perform the necessary experiments, the test rig was built. It consisted of a driving pulley with an adjustable electric motor and a tail pulley with a built-in strain gauge measuring system. Figure 3 demonstrates the end part of the test rig with the belt placed on the tail pulley.
The rubber belt enabled us to imitate the work conditions of a belt conveyor with different speeds, tensions, loads, and even damages. The inclinometer allowed for the registration of the rotational angle of the pulley, which was important because only part of the strain gauge underwent pressure.
In the experiments, a typical belt material, EDV08PB-AS 2.0, was used, made by Enitra Sp. z o.o. (Wałbrzych, Poland). Before the experiments, the material underwent a detailed analysis reported elsewhere [30]. Its important feature is the anisotropy of the strength characteristics, especially the ones related to damages. In particular, the samples with transverse preset damages exhibited ca. 60% lower breaking force than the ones with longitudinal preset damages.

2.3. Damages Identification

The work of the belt conveyor was imitated using the abovementioned test rig. The test campaign first included the work of the belt without loads and damages, and then the loaded work, and, finally, the work with intentionally made damages. The tests were performed at three different rotary speeds of the tail pulley, namely, n1 = 159 rpm, n2 = 318 rpm, and n3 = 520 rpm. Finally, the machine learning (ML) algorithms were tested for the rotary speed of n1 = 159 rpm, which corresponded with a linear belt speed of v1 = 0.5 m/s.
Since it is widely recognized that longitudinal and transverse tears belong to the main types of catastrophic failures, and the longitudinal ones appear more commonly than transverse ones [31], the damages were made in two stages as follows:
  • First, three cuts were made, namely, two longitudinal cuts through UW I and UW II, which were 50 mm and 70 mm long, respectively, and one partial longitudinal cut UW III, which was 45 mm long and 1 mm deep.
  • Then, two more cuts were added, namely, a longitudinal partial cut through UW IV which was 50 mm long and 1.5 mm deep, and a transverse cut through UP I, which was 10 mm long in the middle of the belt.
Thus, three different states of the belt were analyzed: the undamaged one, the one with three cuts, and the one with five cuts.
In order to avoid additional uncertainty propagation due to the calculations, rounding, and approximations, the data were analyzed in analog-to-digital units (ADUs) obtained from the analog-to-digital converter. It should be noted that a higher value in ADUs corresponded with smaller pressure on the strain gauge.
To train a machine learning (ML) model, usually a batch of data are used [32]. The respective data collected from the electronic system were analyzed from the perspective of belt state monitoring. Statistical parameters were calculated, including standard deviation and kurtosis, and the data were imported to MatLAb (R2024b). From the Classification Lerner application, 10 algorithms were used, and a typical number of folds for the cross-validation was chosen, namely, kv = 5 [33].
Then, the analysis of 18 features was performed with the Diagnostic Feature Designer application. The purpose of the test was to determine which features are the most significant for machine learning, and a one-way analysis of variance (ANOVA) model [34] was found to be useful for this analysis.

3. Results and Discussion

The results were analyzed in two stages. First, the graphical visualization of the registered signals in time t was studied, comparing the simultaneous indications of three strain gauges in order to assess the features related directly to the loads and damages. Then, the ML algorithms were tested, assessing their ability to classify the loads and damages.

3.1. Registered Monitoring Signal

An example of a registered signal is shown in Figure 4. It corresponds with the tail pulley rotary speed of n1 = 159 rpm. On the left, the strain gauge indications are expressed in ADUs, while on the right, they are recalculated to the force units N. However, it should be noted that these are the values of the force pressing directly on the strain gauge surface, not to be confused with the belt tension or the belt pressure on the pulley.
During the measurement time, some typical registered characteristics appeared, which can be seen in the graph in relation to the damages. The most noticeable one is the “jump” of all three strain gauge indications when the belt joint was in contact with the tail pulley after the fourth second of measurement. At that moment, the indication of strain gauge T1 jumped from ca. 700 ADU to ca. 2400 ADU, which corresponded with the drop in the pressing force. Quite predictably, the central strain gauge, T2, experienced a smaller drop in the pressing force, which corresponded with the increase in indications from 400 ADU to 1400 ADU.
Another obvious characteristic is the one related to the cut UP I in the middle of the belt width. This one reached the pulley at the seventh second of the experiment and caused a significant drop in the pressing force on the central strain gauge, T2, from ca. 42 N to almost 3 N. Gauge T2 was directly under the cut, so the pressing force was very small. Other preset damages had different impacts on each strain gauge, making it possible to identify their presence from a comparison of the three signals.

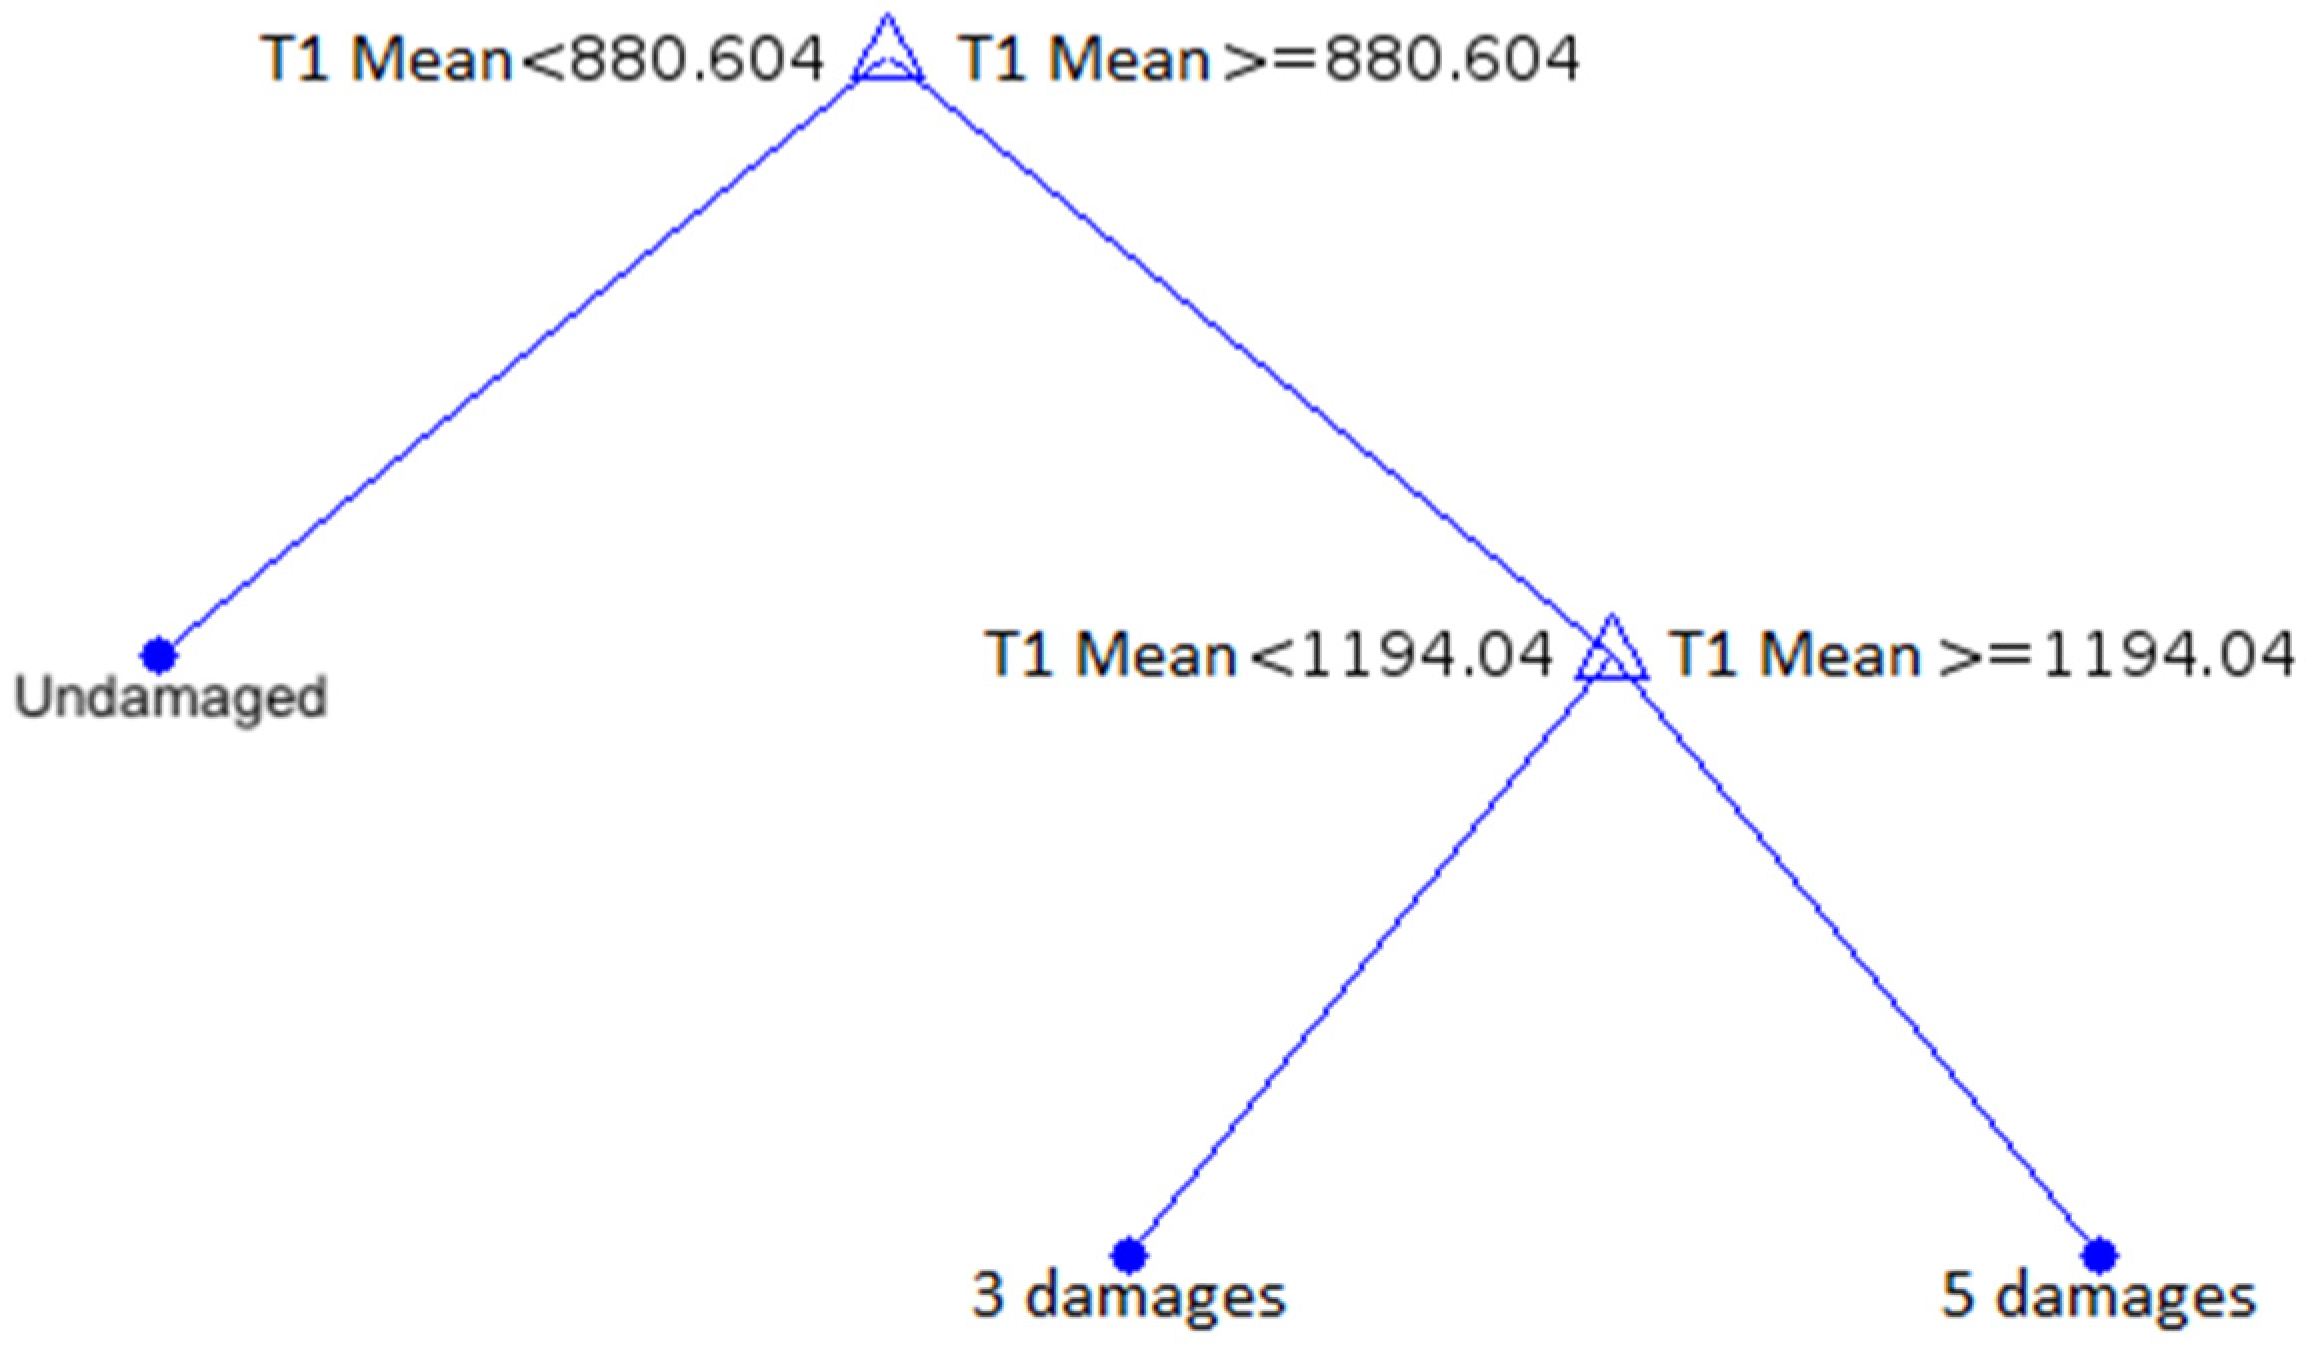
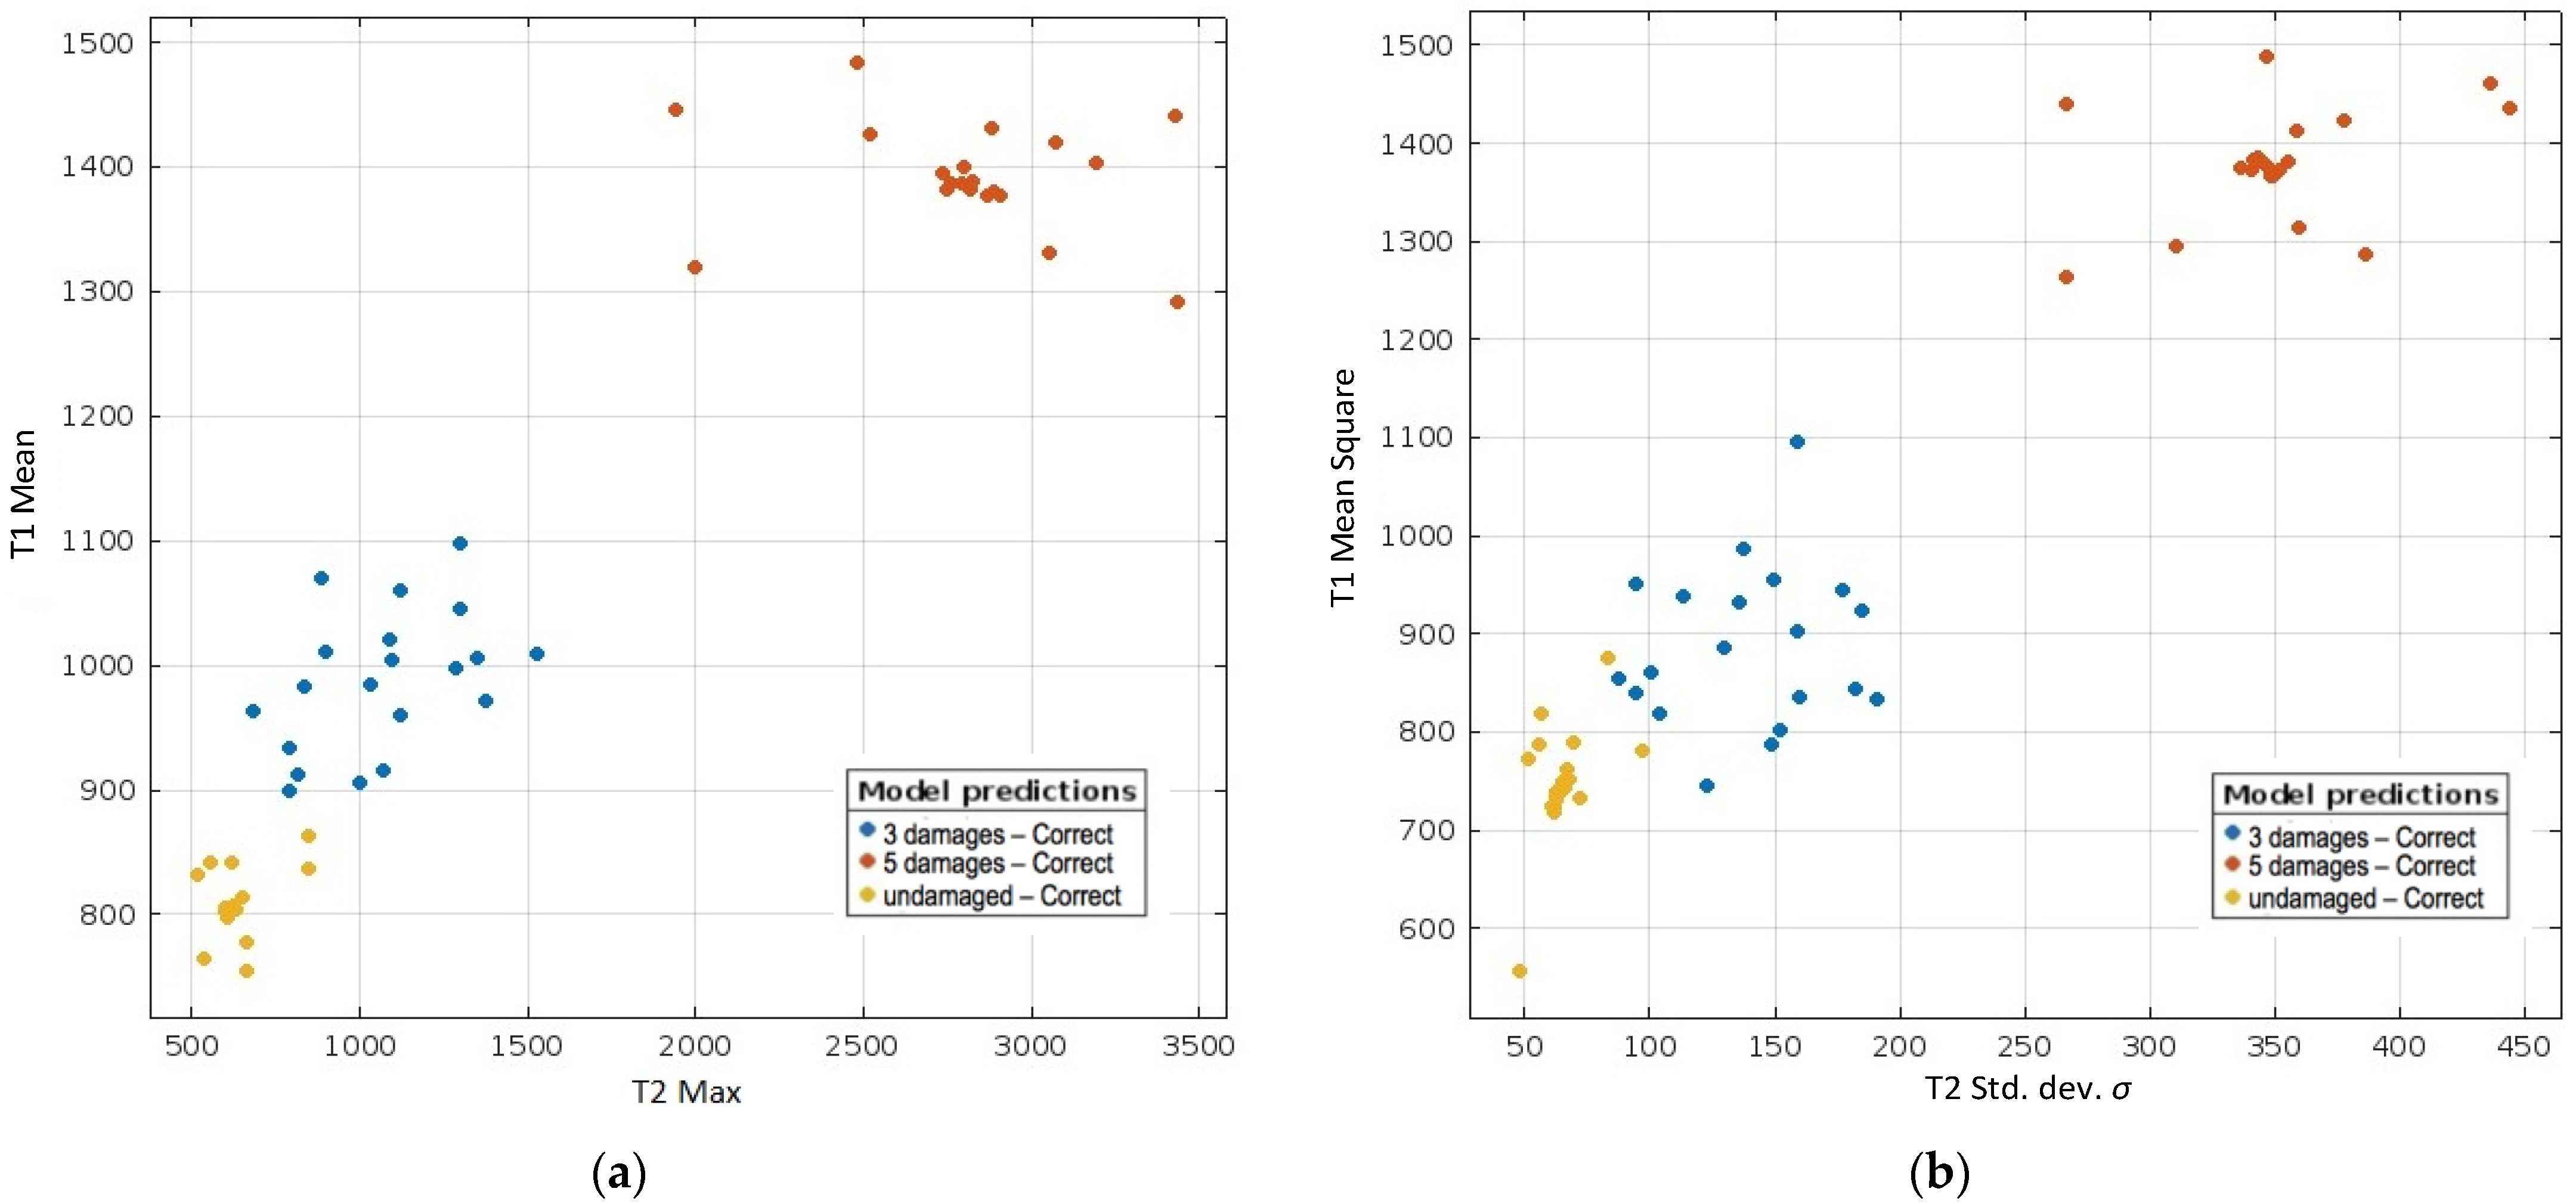
3.2. The Application of the Machine Learning Algorithms

The possibility of damage identification was tested using statistical data from the registered signal of each strain gauge, namely, T1, T2, and T3, for the belt without damage, the one with three defects, and the one with five defects, respectively, as described in Section 2.3. The statistical parameters were as follows: The mean value for each strain gauge is
x ¯ = 1 N n = 1 N x n ,
where x(n) is the amplitude of each sampling, and N is the number of samples.
The respective equations for the mean square value Xms, standard deviation σ, and kurtosis Xk for each strain gauge were used as follows:
X m s = 1 N n = 1 N x n 2 ,
σ = 1 N n = 1 N x n x ¯ 2 ,
X k = 1 N n = 1 N x n x ¯ 4 1 N n = 1 N x n x ¯ 2 2 .
Thus, with six statistical parameters for three strain gauges, 20 repetitions provided 360 statistical datapoints covering three states of the belt. Table 1 contains the data for repetitions No. 1, 19, and 20 for each parameter, calculated for each strain gauge. Table 2 presents the list of the algorithms tested, specifying the accuracy of damage identification and the respective numbers of the cases erroneously classified.
Notably, four algorithms based on a decision tree reached 100% of damage identification. It is known that “A decision tree is a hierarchical model composed of discriminant functions, or decision rules, that are applied recursively to partition the feature space of a dataset into pure, single class subspaces” [35].
As shown in Figure 5, decision trees have branch nodes represented by triangles, and each of them is the parent to two children leaf nodes represented by circles. A line between the parent and children nodes represents a decision pathway. In the present research, the single feature was T1_mean, with the boundary values of the features being 880.604 and 1194.04 ADU. The inequality expressions given close to the branch nodes describe the decision boundaries.
Thus, if the value of the new analyzed sample is smaller than 880.604 ADU, the sample travels the pathway and is directed to the leaf node to be classified as “undamaged” based on the set of training samples. Usually, “the class represented by the majority of training samples within the leaf node subspace dictates sample classification” [35].
The analysis of 18 features was performed using the Diagnostic Feature Designer application and a one-way ANOVA. This sort of test requires the assumptions of a normal distribution and homogeneity of variance for all groups. To test the effect of a single factor on the results, it assumes the presence of one independent variable, represented by the groups studied in the experiments, and one dependent variable, represented by the results of the study. Hypotheses regarding the equality of means are tested if there are more than two analyzed groups [36].
When the abovementioned assumptions are not met, the result may become unreliable. Data transformation can be a method that allows for data normalization and variance stabilization. However, when such actions do not provide a positive result, non-parametric tests become an alternative, e.g., the Kruskal–Wallis test, which is equivalent to a one-way analysis of variance [37]. The non-parametric Kruskal–Wallis test corresponds with the parametric one-way ANOVA test and allows for post hoc testing when the null hypothesis of equality of means in the analyzed groups is rejected. When the assumptions of a parametric test are met and the distribution is normal, parametric tests appear to be more powerful than the comparable non-parametric ones, i.e., a non-parametric test is less likely to correctly define a statistically significant result [38]. Thus, it is recommended to first apply a parametric test, and if it appears improper, then a non-parametric test should be used [37].
In this research, we decided to use the Laplacian Score, variance, and monotonicity tests. The Laplacian Score used the nearest neighboring graph to determine the local data structure and the respective value for each feature. A feature with a higher Laplacian Score indicated its importance for localization [39]. Variance is the classical method of differentiation for its evaluation and has no statistical interpretation. However, it can be used for the construction of other parameters, such as central moments or the standard deviation. It is expressed as the arithmetic mean of the squares of deviations of individual values of the feature from their arithmetic mean [40]. Monotonicity is the rating method available in Diagnostic Feature Designer, with values ranging from 0 to 1 to describe the trend of the given function during the system’s evolution.
The results of the tests obtained from the five different abovementioned models are shown in Figure 6, ranked in decreasing order for different features according to the results of the one-way ANOVA. Generally, all of the tests indicated similar trends in significance, even though the particular results differed greatly from one model to another.
It is seen in Figure 6 that the mean value from the T1 strain gauge was the most significant feature, which was confirmed by all four models applied. In turn, the kurtosis of the T3 strain gauge indications was found to be the least significant for the identification of the conveyor belt state. On the other hand, Laplacian Score method provided the highest values for test results, with one exception being the T2 Std.dev., while the ANOVA method gave the lowest values for the tested parameters with three exceptions.
Figure 7a,b show examples of distribution graphs for the features found to be highly significant. In Figure 7a, the results for the T2 Max and T1 Mean are collected, while in Figure 7b, the T2 standard deviation and T1 Mean Square points are presented. In both diagrams, the areas of concentration of the points can be clearly distinguished. These points were used for state identification and damage classification for the analyzed belt.
For better visualization of the performance of the tested algorithms, the results are also presented in the form of a confusion matrix in Figure 8. It represents the models that reached 100% of classification for all three cases, including the undamaged belt, the one with three defects, and the one with five defects. Each row represents the results of actual classification, and each column corresponds with a predicted class. For the cross-validation, the confusion matrix was calculated using the predictions for the validation observations.
The cells located diagonally in the matrix indicate where the actual and predicted classes match. In order to check the performance of the classifier in individual classes, the function was selected, showing the true positive rates (TPRs) and false negative rates (FNRs). The TPR represents the percentage of correctly classified observations per true class, while the FNR shows the percentage of incorrectly classified observations per true class. The obtained confusion matrix confirmed the possibility of identifying the state of the conveyor belt from the analysis of signals generated by the strain gauge-based monitoring system.
In order to compare the features of the obtained belt state observations and to illustrate the relationships between them, a parallel coordinate plot (PCP) is presented in Figure 9. PCPs are widely recognized as a powerful technique allowing for the visual analysis of large sets reaching some millions of datapoints with multiple parameters associated with them [41]. The range scaling method was used to make the data fit into a certain pre-defined interval with the same minimum and maximum limits. The graph shows predictions for the Coarse Tree model using eight features that exhibited the highest significance.
The most significant features were specified based on Figure 9. These features precisely show the ranges of values for three different states of the conveyor belt. The variables indicating a belt with five defects are marked in red. Apart from a dozen values, one distinctive area can be seen in the upper part of the graph. The values in the middle part have the greatest dispersion, and this area corresponds with the belt with three defects. The belt without damages is characterized by the variables in the lower part of the graph, which are marked in yellow and exhibited the smallest dispersion. In the graph, three areas corresponding with the states of the conveyor belt can be distinguished clearly, which overlapped only to a small extent.
The results indicate that the data collected from the strain gauge-based monitoring system are closely related to the actual state of the conveyor and the reflected condition of the rubber belt. As such, these data can also be analyzed for the speed and quality aspects of the manufacturing process in terms of a production efficiency analysis [42]. From the collection of records, major faults and critical failures can be assessed using the Fault Tree Analysis (FTA) method through a graphical representation of the faults’ causes and potential countermeasures [43]. Moreover, continually collected data can be used for the prediction of the remaining useful life and for appropriate optimized maintenance decisions [44].

4. Conclusions

The analysis proved that the strain gauge-based measurement system provided a reliable sequence of signals for the real-time monitoring of the conveyor belt work. As a result of continuous monitoring of the belt operation, the system generated a significant amount of data that underwent an extended analysis based on the machine learning (ML) algorithms. The signals were collected from three strain gauges, namely, T1, T2, and T3, after 20 repetitions, and statistical parameters were calculated accordingly. It was found that for damage monitoring, the most significant features were the arithmetic mean value from the T1 strain gauge, followed by the T1 Root Mean Square, T2 Root Mean Square T2 Mean, and T2 standard deviation. The results indicate the existence of an identifiable correlation between the actual condition of the rubber belt and the signal recorded by the strain gauge system. So, it was experimentally proven that the strain gauge-based system could be successfully used for the real-time monitoring of the conveyor belt operation.
A further analysis of 18 features was performed using 10 ML algorithms. Four of them were able to correctly classify the undamaged belt, the belt with three preset defects, and the one with five defects. Thus, it can be concluded that the system provided real-time information enabling the detection of the belt damages that appeared during the conveyor operation. It is planned to test more ML algorithms in future research. Moreover, it is important to investigate the possibility of detecting damages appearing and dynamically developing during the belt’s operation in order to prevent failures.

5. Patents

The work reported in this manuscript resulted in the Polish patent No. P.447569 Method and a device for the supervision of the tension and wear of conveyor rubber belts.

Author Contributions

Conceptualization, D.B., T.R. and A.K.; methodology, D.B., T.R., M.R. and L.C. (Lenka Cepova); software, L.C. (Leszek Chalko); validation, L.C. (Leszek Chalko), A.K. and L.C. (Lenka Cepova); formal analysis, D.B., L.C. (Leszek Chalko), M.R. and L.C. (Lenka Cepova); investigation, T.R. and J.M.; resources, T.R. and J.M.; data curation, L.C. (Leszek Chalko); writing—original draft preparation, M.R.; writing—review and editing, all authors; visualization, M.R., A.K. and J.M.; supervision, D.B.; project administration, M.R.; funding acquisition, D.B. and T.R. All authors have read and agreed to the published version of the manuscript.

Funding

This research received no external funding.

Institutional Review Board Statement

Not applicable.

Informed Consent Statement

Not applicable.

Data Availability Statement

The raw data supporting the conclusions of this article will be made available by the authors upon request.

Conflicts of Interest

The authors declare no conflicts of interest.

References

  1. Moran, S. Process Plant Layout, 2nd ed.; Butterworth-Heinemann: Amsterdam, The Netherlands, 2017; pp. 471–481. [Google Scholar] [CrossRef]
  2. Borucka, A.; Kozłowski, E.; Parczewski, R.; Antosz, K.; Gil, L.; Pieniak, D. Supply Sequence Modelling Using Hidden Markov Models. Appl. Sci. 2023, 13, 231. [Google Scholar] [CrossRef]
  3. Subba Rao, D.V. The Belt Conveyor: A Concise Basic Course; CRC Press: London, UK, 2021. [Google Scholar]
  4. Hou, C.; Qiao, T.; Dong, H.; Wu, H. Coal flow volume detection method for conveyor belt based on TOF vision. Measurement 2024, 229, 114468. [Google Scholar] [CrossRef]
  5. Ilanković, N.; Živanić, D.; Zuber, N. The Influence of Fatigue Loading on the Durability of the Conveyor Belt. Appl. Sci. 2023, 13, 3277. [Google Scholar] [CrossRef]
  6. Bortnowski, P.; Kawalec, W.; Król, R.; Ozdoba, M. Types and causes of damage to the conveyor belt—Review, classification and mutual relations. Eng. Fail. Anal. 2022, 140, 106520. [Google Scholar] [CrossRef]
  7. Rudawska, A.; Madleňák, R.; Madleňáková, L.; Droździel, P. Investigation of the Effect of Operational Factors on Conveyor Belt Mechanical Properties. Appl. Sci. 2020, 10, 4201. [Google Scholar] [CrossRef]
  8. Zheng, H.; Wu, H.; Yin, H.; Wang, Y.; Shen, X.; Fang, Z.; Ma, D.; Miao, Y.; Zhou, L.; Yan, M.; et al. Novel mining conveyor monitoring system based on quasi-distributed optical fiber accelerometer array and self-supervised learning. Mech. Syst. Signal Process. 2024, 221, 111697. [Google Scholar] [CrossRef]
  9. Chamorro, J.; Vallejo, L.; Maynard, C.; Guevara, S.; Solorio, J.A.; Soto, N.; Singh, K.V.; Bhate, U.; Ravi Kumar, G.V.V.; Garcia, J.; et al. Health monitoring of a conveyor belt system using machine vision and real-time sensor data. CIRP J. Manuf. Sci. Technol. 2022, 38, 38–50. [Google Scholar] [CrossRef]
  10. Kozłowski, T.; Wodecki, J.; Zimroz, R.; Błażej, R.; Hardygóra, M. A Diagnostics of Conveyor Belt Splices. Appl. Sci. 2020, 10, 6259. [Google Scholar] [CrossRef]
  11. Zeng, F.; Zhang, S.; Wang, T.; Wu, Q. Mini-Crack Detection of Conveyor Belt Based on Laser Excited Thermography. Appl. Sci. 2021, 11, 10766. [Google Scholar] [CrossRef]
  12. Wang, Y.; Miao, C.; Liu, Y.; Meng, D. Research on a sound-based method for belt conveyor longitudinal tear detection. Measurement 2022, 190, 110787. [Google Scholar] [CrossRef]
  13. Fedorko, G. Application possibilities of virtual reality in failure analysis of conveyor belts. Eng. Fail. Anal. 2021, 128, 105615. [Google Scholar] [CrossRef]
  14. Kirjanów-Błażej, A.; Jurdziak, L.; Błażej, R.; Rzeszowska, A. Calibration procedure for ultrasonic sensors for precise thickness measurement. Measurement 2023, 214, 112744. [Google Scholar] [CrossRef]
  15. Zhang, M.; Jiang, K.; Cao, Y.; Li, M.; Wang, Q.; Li, D.; Zhang, Y. A new paradigm for intelligent status detection of belt conveyors based on deep learning. Measurement 2023, 213, 112735. [Google Scholar] [CrossRef]
  16. Andrejiova, M.; Grincova, A.; Marasova, D. Identification with machine learning techniques of a classification model for the degree of damage to rubber-textile conveyor belts with the aim to achieve sustainability. Eng. Fail. Anal. 2021, 127, 105564. [Google Scholar] [CrossRef]
  17. Zhou, M.; Chen, Y.; Hu, F.; Lai, W.; Gao, L. A deep learning approach for accurate assessment of conveyor belt wear state based on multispectral imaging. Opt. Laser Technol. 2025, 181, 111782. [Google Scholar] [CrossRef]
  18. Rumin, P.; Kotowicz, J.; Hogg, D.; Zastawna-Rumin, A. Utilization of measurements, machine learning, and analytical calculation for preventing belt flip over on conveyor belts. Measurement 2023, 218, 113157. [Google Scholar] [CrossRef]
  19. Zhang, M.; Shi, H.; Zhang, Y.; Yu, Y.; Zhou, M. Deep learning-based damage detection of mining conveyor belt. Measurement 2021, 175, 109130. [Google Scholar] [CrossRef]
  20. Guo, X.; Liu, X.; Gardoni, P.; Glowacz, A.; Królczyk, G.; Incecik, A.; Li, Z. Machine vision based damage detection for conveyor belt safety using Fusion knowledge distillation. Alex. Eng. J. 2023, 71, 161–172. [Google Scholar] [CrossRef]
  21. Gao, Y.; Qiao, Y.; Zhang, H.; Yang, Y.; Pang, Y.; Wei, H. A contactless measuring speed system of belt conveyor based on machine vision and machine learning. Measurement 2019, 139, 127–133. [Google Scholar] [CrossRef]
  22. Liu, X.; Pei, D.; Lodewijks, G.; Zhao, Z.; Mei, J. Acoustic signal based fault detection on belt conveyor idlers using machine learning. Adv. Powder Technol. 2020, 31, 2689–2698. [Google Scholar] [CrossRef]
  23. Pulcini, V.; Modoni, G. Machine learning-based digital twin of a conveyor belt for predictive maintenance. Int. J. Adv. Manuf. Technol. 2024, 133, 6095–6110. [Google Scholar] [CrossRef]
  24. Soares, J.L.L.; Costa, T.B.; Moura, L.S.; Sousa, W.S.; Mesquita, A.L.A.; Mesquita, A.L.A.; de Figueiredo, J.M.S.; Braga, D.S. Fault diagnosis of belt conveyor idlers based on gradient boosting decision tree. Int. J. Adv. Manuf. Technol. 2024, 132, 3479–3488. [Google Scholar] [CrossRef]
  25. Bzinkowski, D.; Ryba, T.; Siemiatkowski, Z.; Rucki, M. Real-time monitoring of the rubber belt tension in an industrial conveyor. Rep. Mech. Eng. 2022, 3, 1–10. [Google Scholar] [CrossRef]
  26. Ryba, T.; Bzinkowski, D.; Rucki, M. Method and Device for Supervision of the Tension and Wear of the Conveyor Rubber Belts. Polish Patent No. P.447569, 22 January 2024. (In Polish). [Google Scholar]
  27. RP-L-170 Thin Film Pressure Sensor. Available online: https://www.dfrobot.com/product-1843.html (accessed on 22 October 2024).
  28. Ryba, T.; Rucki, M.; Siemiatkowski, Z.; Bzinkowski, D.; Solecki, M. Design and calibration of the system supervising belt tension and wear in an industrial feeder. Facta Univ. Ser. Mech. Eng. 2022, 20, 167–176. [Google Scholar] [CrossRef]
  29. Mallioris, P.; Aivazidou, E.; Bechtsis, D. Predictive maintenance in Industry 4.0: A systematic multi-sector mapping. CIRP J. Manuf. Sci. Technol. 2024, 50, 80–103. [Google Scholar] [CrossRef]
  30. Ryba, T.; Bzinkowski, D.; Siemiatkowski, Z.; Rucki, M.; Stawarz, S.; Caban, J.; Samociuk, W. Monitoring of Rubber Belt Material Performance and Damage. Materials 2024, 17, 765. [Google Scholar] [CrossRef]
  31. Wang, G.; Wang, Y.; Sun, H.; Yue, Q.; Zhou, Q. Study on Visual Detection Method of Multi-scale Damage to Conveyor Belt Under Complex Background. J. Fail. Anal. Prev. 2024, 24, 896–908. [Google Scholar] [CrossRef]
  32. Le-Nguyen, M.H.; Turgis, F.; Fayemi, P.E.; Bifet, A. Real-time learning for real-time data: Online machine learning for predictive maintenance of railway systems. Transp. Res. Procedia 2023, 72, 171–178. [Google Scholar] [CrossRef]
  33. Beyerer, J.; Richter, M.; Nagel, M. Pattern Recognition: Introduction, Features, Classifiers and Principles; De Gruyter: Berlin, Germany, 2017. [Google Scholar]
  34. Fox, W.P.; Sturdivant, R.X. Probability and Statistics for Engineering and the Sciences with Modeling Using R; CRC Press: Boca Raton, FL, USA, 2023. [Google Scholar]
  35. Myles, A.J.; Feudale, R.N.; Liu, Y.; Woodyand, N.A.; Brown, S.D. An introduction to decision tree modeling. J. Chemom. 2004, 18, 275–285. [Google Scholar] [CrossRef]
  36. Nowakowski, M. The ANOVA method as a popular research tool. Stud. Pr. WNEiZ 2019, 55, 67–77. [Google Scholar] [CrossRef]
  37. Sandurska, E.; Szulc, A. A method of statistical analysis in the field of sports science when assumptions of parametric tests are not violated. J. Educ. Health Sport 2016, 6, 275–287. [Google Scholar] [CrossRef]
  38. Politi, M.T.; Ferreira, J.C.; Patino, C.M. Nonparametric statistical tests: Friend or foe? J. Bras. Pneumol. 2021, 47, e20210292. [Google Scholar] [CrossRef] [PubMed] [PubMed Central]
  39. Chandra, B. Gene Selection Methods for Microarray Data. In Applied Computing in Medicine and Health; Al-Jumeily, D., Hussain, A., Mallucci, C., Oliver, C., Eds.; Morgan Kaufmann: Waltham, MA, USA, 2016; pp. 45–78. [Google Scholar]
  40. Ręklewski, M. Descriptive Statistics: Theory and Examples; Państwowa Uczelnia Zawodowa we Włocławku: Włocławek, Poland, 2020. (In Polish) [Google Scholar]
  41. Stumpfegger, J.; Höhlein, K.; Craig, G.; Westermann, R. GPU accelerated scalable parallel coordinates plots. Comput. Graph. 2022, 109, 111–120. [Google Scholar] [CrossRef]
  42. Chen, Z.; Xiao, Z.; Sun, Y.; Dong, Y.; Zhong, R.Y. Production efficiency analysis based on the RFID-collected manufacturing big data. Manuf. Lett. 2024, 41, 81–90. [Google Scholar] [CrossRef]
  43. Bujna, M.; Prístavka, M.; Lee, C.K.; Borusiewicz, A.; Samociuk, W.; Beloev, I.; Malaga-Toboła, U. Reducing the Probability of Failure in Manufacturing Equipment by Quantitative FTA Analysis. Agric. Eng. 2023, 27, 255–272. [Google Scholar] [CrossRef]
  44. Wang, L.; Li, B.; Zhao, X. Multi-objective predictive maintenance scheduling models integrating remaining useful life prediction and maintenance decisions. Comput. Ind. Eng. 2024, 197, 110581. [Google Scholar] [CrossRef]
Figure 1. The strain gauges used in the conveyor belt monitoring system: (a) view and dimensions; (b) the positioning of three strain gauges on the tail pulley surface.
Applsci 14 10464 g001
Figure 2. Details of the built-in electronic system: (a) a drawing of the PCB holder placed inside the tail pulley; (b) the printed circuit ready to be mounted into the pulley.
Applsci 14 10464 g002
Figure 3. A view of the test rig with the model of a belt conveyor.
Applsci 14 10464 g003
Figure 4. An example of the registered signal from strain gauges T1, T2, and T3.
Applsci 14 10464 g004
Figure 5. Decision tree.
Applsci 14 10464 g005
Figure 6. The ratings of the results for different features evaluated with different models.
Applsci 14 10464 g006
Figure 7. Examples of dispersion diagrams for significant features: (a) T1 Mean and T2 Max; (b) T1 Mean Square and T2 standard deviation.
Applsci 14 10464 g007
Figure 8. Confusion matrix for models that reached 100% classification.
Applsci 14 10464 g008
Figure 9. The parallel coordinate plot for the Coarse Tree model.
Applsci 14 10464 g009
Table 1. The characterization of the collected signals from three strain gauges, namely, T1, T2, and T3, after 20 repetitions, ADU.
Repetition 119201192011920
State Undamaged Belt3 Defects on the Belt5 Defects on the Belt
Mean
x ¯
T1862.6831.3765.21044.6959.31021.41440.31331.31419.4
T2406.3317.5316.2442.1385.3430.0668.1580.9668.3
T3735.9750.3761.4787.6751.5773.8856.0843.7863.4
MinT1569520487619637642828799848
T2223213222221193144247239209
T3580602615660625642670592671
MaxT1133012981376220915531907298723062505
T2845519538130111191087342930523073
T3113610661140103010691081132213371371
Mean square
Xms
T1876.4772.9555.9923.7932.2835.41460.11294.91423.5
T2414.7293.6226.0411.7391.8368.7784.7629.3755.8
T3744.8690.8543.6679.5725.3626.1850.0815.0860.8
Std. dev.
σ
T1155.0160.4182.3253.7154.2192.6361.1253.5275.3
T282.951.147.5184.8135.5159.8436.5310.5377.9
T3114.698.6109.070.782.389.8120.5125.2137.7
Kurtosis
Xk
T1−0.5−0.7−0.14.31.02.52.21.90.3
T23.60.62.33.35.41.513.218.310.2
T30.10.10.50.41.00.81.20.40.1
Table 2. Machine learning results for different algorithms.
AlgorithmClassification AccuracyNumber of Wrongly Classified Cases
Fine Tree100.00%0
Medium Tree100.00%0
Coarse Tree100.00%0
Ensemble Bagged Trees100.00%0
Ensemble Subspace KNN98.33%1
Linear Discriminant96.67%2
Coarse Gaussian SVM96.67%2
Coarse KNN33.33%40
Ensemble Boosted Trees33.33%40
Ensemble RUSBoosted trees33.33%40
Disclaimer/Publisher’s Note: The statements, opinions and data contained in all publications are solely those of the individual author(s) and contributor(s) and not of MDPI and/or the editor(s). MDPI and/or the editor(s) disclaim responsibility for any injury to people or property resulting from any ideas, methods, instructions or products referred to in the content.

