Article

Experimental Investigations on Repair and Permeability Reduction for Single Sandstone Fracture Using a Mixed CaCO3 and Fe(OH)3 Precipitate

1
The National and Local Joint Engineering Laboratory of Internet Application Technology on Mine, China University of Mining and Technology, Xuzhou 221008, China
2
IoT/Perception Mine Research Center, China University of Mining and Technology, Xuzhou 221008, China
3
State Key Laboratory of Water Resource Protection and Utilization in Coal Mining, Beijing 100011, China
4
State Key Laboratory for Fine Exploration and Intelligent Development of Coal Resources, China University of Mining and Technology, Xuzhou 221116, China
5
State Key Laboratory of Intelligent Construction and Healthy Operation and Maintenance of Deep Underground Engineering, China University of Mining and Technology, Xuzhou 221116, China
*
Author to whom correspondence should be addressed.
Appl. Sci. 2024, 14(22), 10617; https://doi.org/10.3390/app142210617
Submission received: 1 October 2024 / Revised: 13 November 2024 / Accepted: 14 November 2024 / Published: 18 November 2024

Abstract

:
In China, groundwater loss caused by underground coal mining is becoming increasingly serious. The key to groundwater restoration is to repair mining-induced water-conducting fractures (WCFs) in the overlying strata. In this study, the adsorption–consolidation sealing characteristics of chemical precipitates were used to conduct permeability reduction (PR) experiments, including adding mixed CaCO3 and Fe(OH)3 to a sandstone specimen with a single fracture at room temperature. An aqueous solution of Na2CO3 was used as the simulated groundwater, and a solution of mixed CaCl2 and FeCl2 was used as the repair reagent to simulate the water seepage conditions of a fractured rock mass. The two aqueous solutions were simultaneously injected into a single-fractured rock specimen at a constant flow rate. The experimental results show that the Fe(OH)3 colloid encapsulated CaCO3 crystals in a mixed precipitate, reducing the overall structural stability of the mixed precipitate and restricting repair and PR efficiency. However, the Fe(OH)3 precipitate had better PR efficiency in the initial stage of the experiment. Therefore, a better scheme was put forward to repair the WCF, utilizing a mixed Fe(OH)3 and CaCO3 precipitate with a molar ratio close to 1:4 in the early stage and a single CaCO3 precipitate in the later stage.

1. Introduction

The environmental destruction induced by large-scale coal mining in China cannot be ignored, with the most prominent associated problem being groundwater loss. Due to the extensive development of WCFs in the overlying strata, groundwater drains into the underground goaf in large quantities, resulting in a series of chain reactions, such as a decrease in the groundwater level, the degradation of surface vegetation, and regional ecological deterioration [1,2,3]. Therefore, the fracture channels that communicate with aquifers should be sealed through scientific means so that they cannot conduct water but instead isolate it. In this way, the problem of groundwater loss can be effectively solved to restore the function of ecological aquifers [4,5].
At present, grouting is widely used in many engineering fields to block water and repair fractured rock masses. Accordingly, numerous grouting materials and supporting processes suitable for different fractures and water-gushing environments have been developed, and remarkable results have been achieved [6,7,8,9,10]. In practice, existing traditional grouting methods boast excellent adaptability in fracture plugging and water inrush prevention in floor-based examples [11,12], but they usually face difficulties in plugging WCFs in roof-based examples. Due to large-area coal mining, WCFs are widely distributed in roof rock strata, possessing large macroscopic openings and strong hydraulic interconnectivity. The grouting environment of roof rock strata is worse than the relatively closed trap environment around the floor of fractured rock masses (except at the grouting end of the floor; the fractures do not communicate with other free spaces). Consequently, injected slurry often rushes into the goaf because of gravity flow, resulting in the “grout runout” phenomenon and, thus, a poor water-plugging effect [13]. In recent years, many studies have been conducted on organic polymer chemical materials that can easily “reside” in fracture channels [14,15,16,17]. However, the high costs and toxic pollution problems caused by massive grouting are inevitable [18]. Therefore, it is particularly important to seek reliable technologies or materials suitable for efficiently plugging WCFs that develop in large overburdened areas.
Many engineering studies [19,20,21] have found that chemical precipitates such as Fe(OH)3 and CaCO3 can form scales in fractures and other flow channels through “adsorption–consolidation”. This phenomenon undoubtedly provides a way to repair and reduce the permeability of WCFs in overburdened areas. Therefore, an aquifer ecological function restoration method was proposed [22]. This method promotes the formation of precipitates and plugs WCFs by injecting repair reagents that can react with groundwater in the fractured rock mass. Specifically, preliminary experimental research was conducted to verify the feasibility of using chemical precipitates to plug WCF channels in mining rock mass. On this basis, the repair and PR effects of CaCO3 and Fe(OH)3 precipitates in the same fractured rock sample were compared and studied [23]. The results indicate that this CaCO3 precipitate is typically crystalline, relying on seed adsorption and crystal growth to consolidate and nucleate. The formed consolidated body possesses a tight structure and good stability, and it can easily achieve good repair and PR effects in fractures. In contrast, Fe(OH)3 precipitate is typically amorphous, and it simply depends on the van der Waals force of the precipitated colloid to adsorb onto the fracture surface and consolidate. Once the water temperature is high, the van der Waals force can be reduced, resulting in a loose structure for the consolidated body. In this case, the consolidated body can hardly resist erosion from high water pressure, and the PR curve can easily show a “rebound” phenomenon in the repair process. When the test water temperature is lowered, the two precipitates can produce similar repair and PR effects. At the same time, experimental research on repair and PR for different fractured rock specimens was carried out using CaCO3 precipitate [24]. It was found that the PR rate and effect in fractured rock specimens are closely related to the scaling process of the precipitate’s adsorption, growth, and consolidation on the fracture surface. The greater the roughness/unevenness of the fracture surface, the smaller the macroscopic openness of the fracture, and the faster the precipitate grows on its surface. Meanwhile, the consolidated structure that is formed is more stable. Thus, the PR achieves higher efficiency and a better effect. When the concentration of key ions (such as CO32−) involved in the precipitate reaction exceeds a certain critical value, the repair and PR efficiency of CaCO3 on WCFs will no longer change obviously. The above experiments mainly focused on studying the PR law of a single chemical precipitate to repair WCFs. However, if there are multiple chemical precipitates in the environment, can they produce similar or better PR effects? Or, will certain chemical precipitates affect the adsorption–consolidation process of others? These questions are highly worthy of further study.
Therefore, a typical sandstone sample with a single fracture was selected in this study to conduct a PR experiment using a mixed Fe(OH)3 and CaCO3 precipitate. While simulating water conduction and seepage, repair reagents were injected into the fracture to generate the mixed precipitate. Then, the precipitate remediation and PR law under different mixing ratio conditions were explored to provide support and reference to future field applications and practices involving the chemical precipitate repair of mining-induced WCFs and the restoration of aquifers.

2. Testing Program

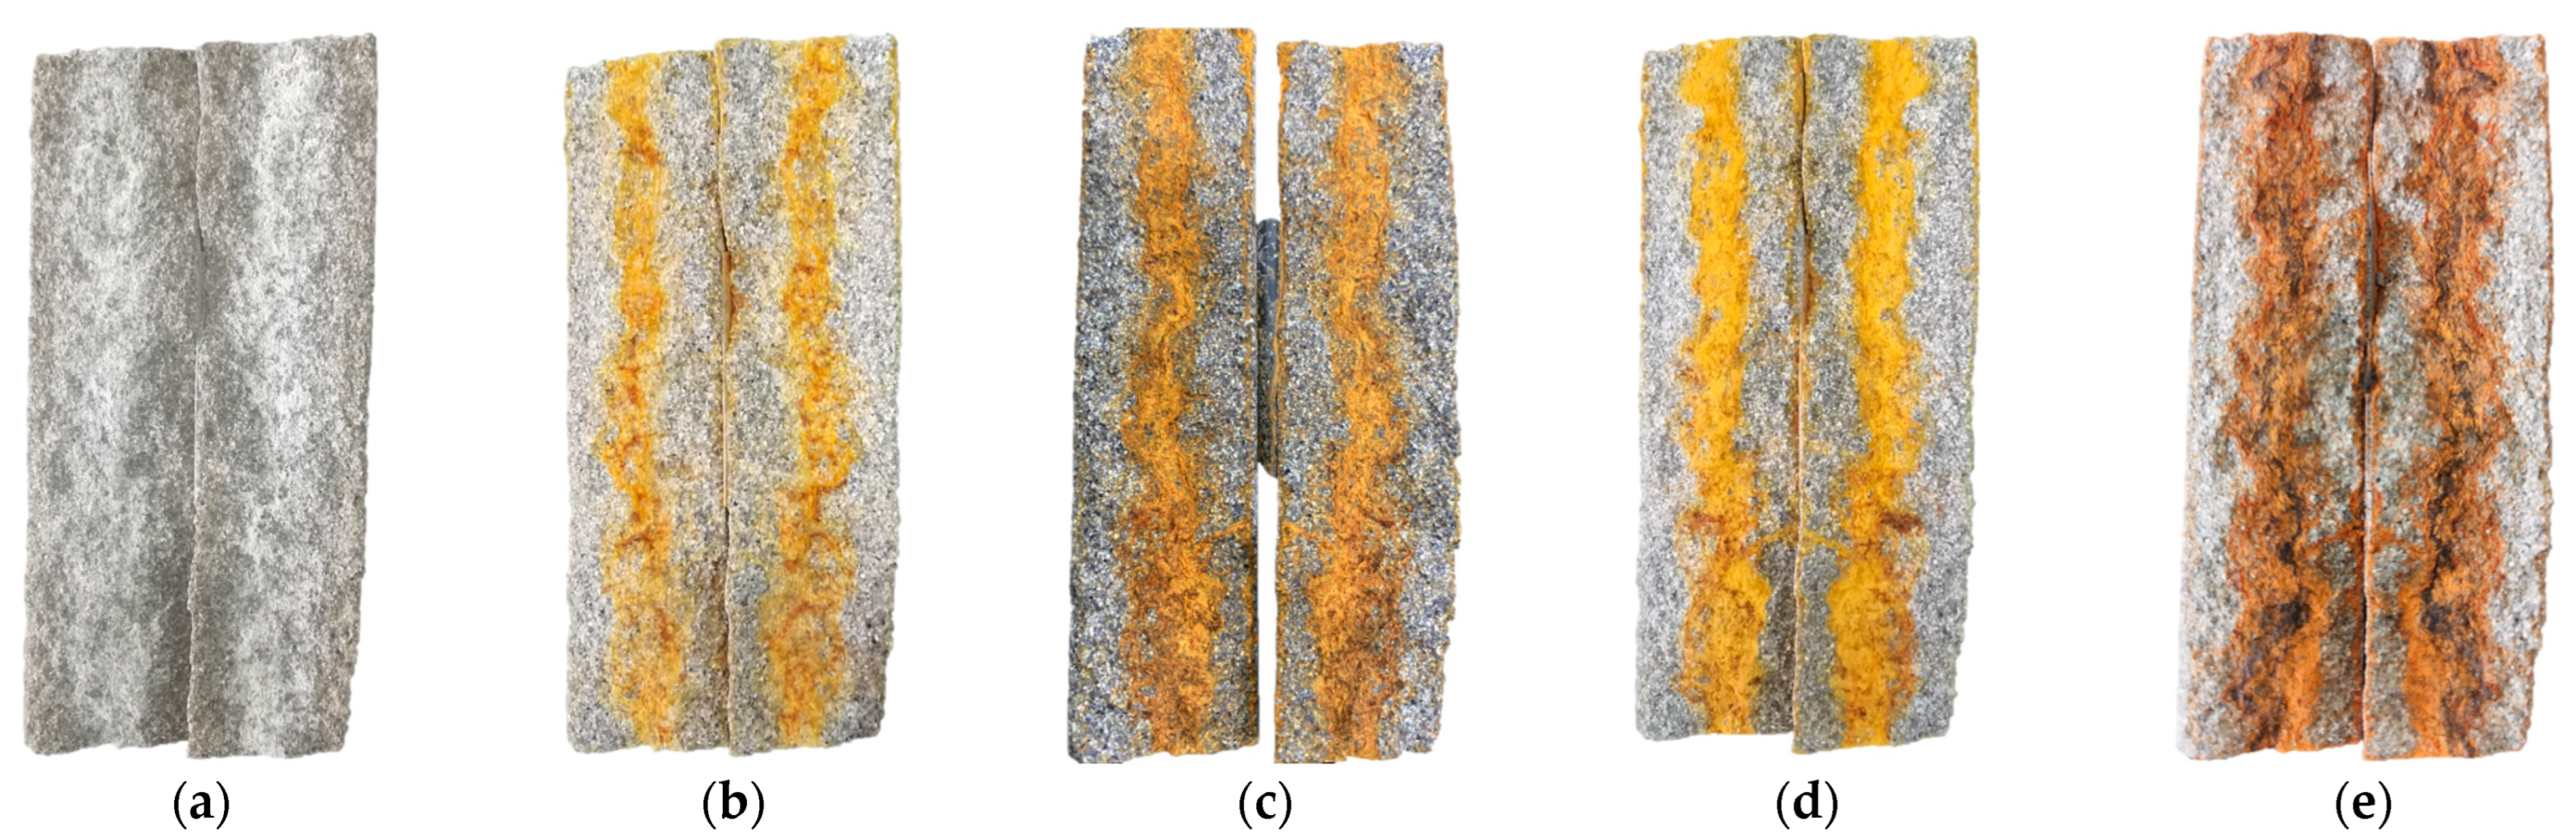
2.1. Preparation of Rock Specimen

In this study, gray-white sandstone collected from the Ordos area in Inner Mongolia was selected. The collected rock sample was located in the WCF zone of overburdened rock at a depth of 150–200 m underground. Its main mineral components are quartz, potash feldspar, plagioclase, and clay minerals. The rock sample was processed into a cylindrical specimen with a diameter of 25 mm and a height of 100 mm. According to the Brazilian splitting method, an MTS electro-hydraulic servo universal testing machine was used to load the specimen, adopting a uniaxial uniform loading mode (rate 1 mm/min). Then, a single fractured rock specimen was prepared, as shown in Figure 1.

2.2. Preparation of Aqueous Solution

Na2CO3 and deionized water were used to prepare alkaline-simulated groundwater containing CO32−; CaCl2 and FeCl2 were used to prepare a repair reagent that could produce CaCO3 and Fe(OH)3 chemical precipitates with simulated groundwater. The concentration of CO32− in the simulated groundwater was 500 mg/L, and the repair reagent was prepared according to the components of the chemical precipitates to be generated in different test schemes. The corresponding amounts of CaCl2 and FeCl2 were added to the ground so that they could fully react with CO32−. The simulated groundwater and repair reagent were designed to be injected at the same flow rate. Ca2+ and Fe2+ preparation concentrations corresponding to different test schemes are shown in Table 1.

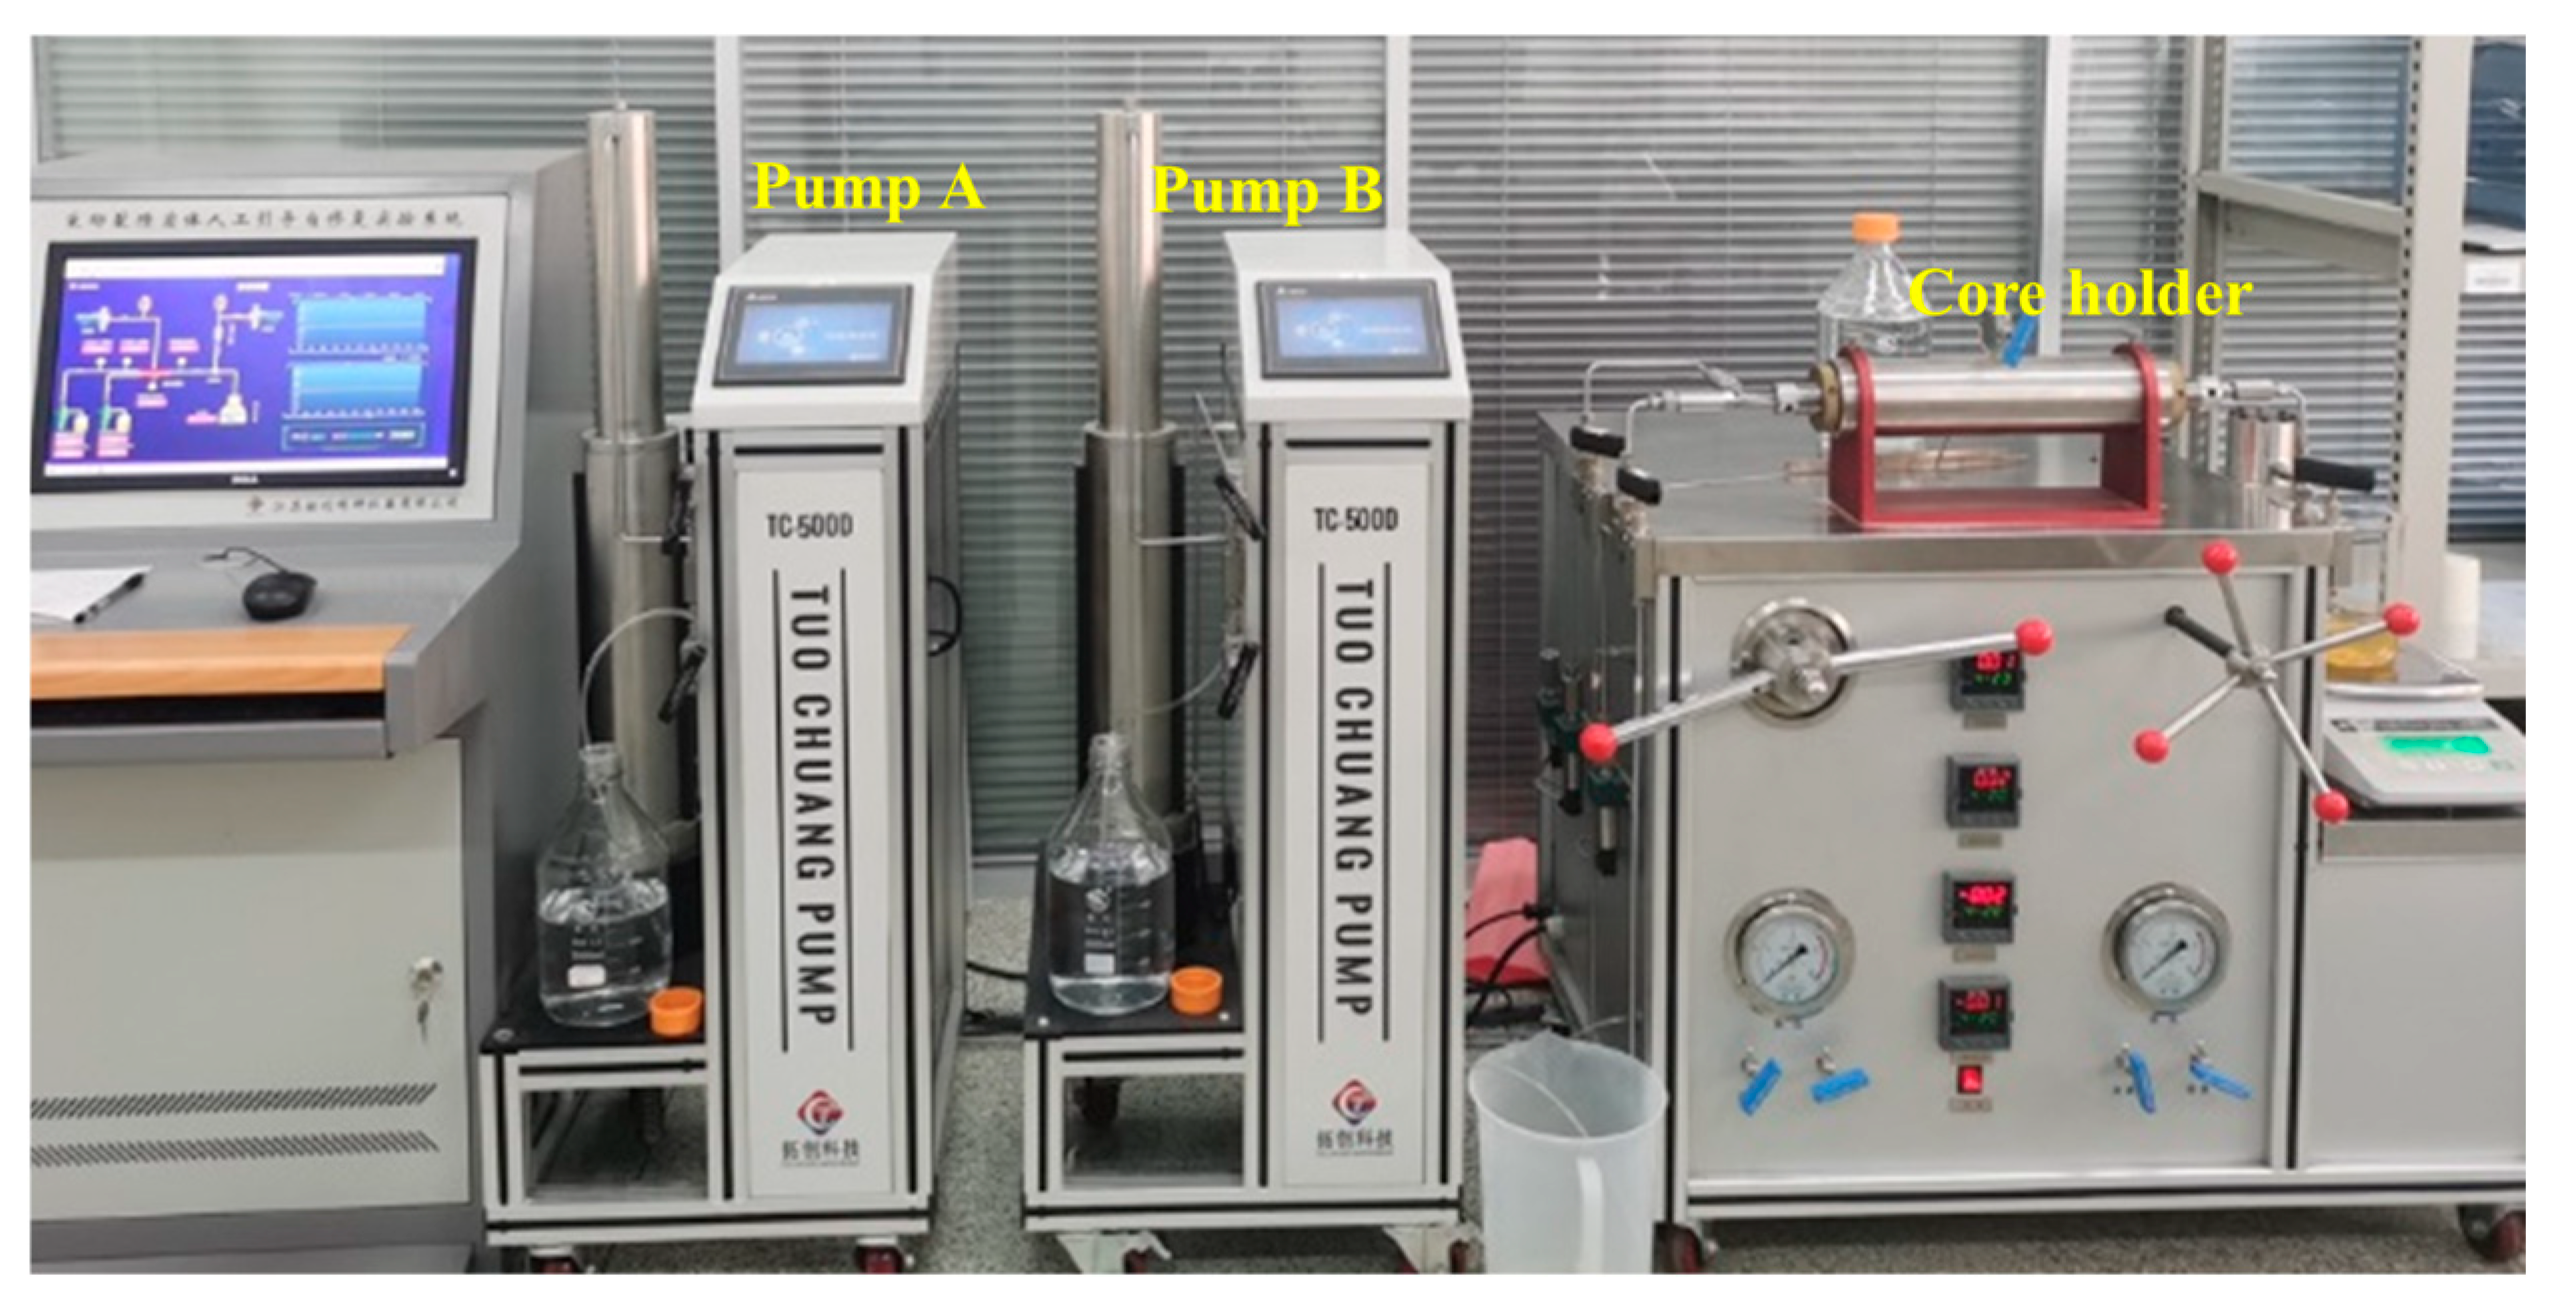
2.3. Experiment Process

The experiments were conducted in a constant temperature environment (28 °C), with the device shown in Figure 2. The testing system consisted of two constant pressure and constant speed pumps (constant pressure accuracy, ±0.1%; resolution, 0.001 mL), two intermediate vessels, one core holder (working pressure, 50 MPa), one ring pressure pump, and related valve groups and pipelines. Pump A was used to inject simulated groundwater and pump B to inject repair reagents.
To begin, we fully saturated the fractured rock specimen with water and loaded it into the core holder with a confining pressure of 5 MPa. We then turned on pump A to inject simulated groundwater into the fractured rock sample at a constant flow rate of 2 mL/min. When the pressure at the inlet and outlet ends of the core no longer obviously fluctuated, the seepage was deemed stable. Based on the monitored water pressure value, the initial permeability was calculated. No pressure was applied to the outlet end of the core holder in this test, so the water injection pressure at the inlet end was equivalent to the pressure difference between the inlet and outlet ends. Then, we reduced the injection flow rate of pump A to 1 mL/min and turned on pump B to inject repair reagent at a constant flow rate of 1 mL/min (keeping the total injection flow rate at 2 mL/min) to explore the permeability change law of the fractured rock sample under precipitate generation conditions. During the experiment, the water pressure changes at the injection end of the core holder were monitored in real time to reflect the effect of chemical precipitates on fracture plugging and repair. Finally, when the water injection pressure reached 5 MPa (equal to the confining pressure), the fracture repair was regarded as complete; pumps A and B were then turned off. The experiment was stopped and the rock specimen was taken out. After the rock specimen naturally dried, three consolidated sediment samples were collected from the fracture surface using a spatula or tweezers under a stereomicroscope. Then, the microscopic distribution of the sediment samples was observed using a scanning electron microscope (SEM) to investigate the adsorption–consolidation characteristics of precipitates in the fracture and to provide a basis for explaining the PR mechanisms of the fractured rock specimen after repair.
Notably, the same fractured rock specimen was used to ensure the comparability of the experiment results of each scheme. Therefore, every time a scheme was tested, a weak acid solution was used to dissolve and remove the precipitate on the fracture surface. This operation was carried out under a stereomicroscope. Once the precipitate dissolved and disappeared, the rock specimen was immediately rinsed with deionized water to prevent the acid from further reacting with the mineral, ensuring that the fracture surface morphology changed as little as possible. Then, the fractured rock specimen was used to carry out the next test scheme.

3. PR Characteristics of Rock Fracture Repaired by Precipitate

Figure 3 shows the precipitate adsorption and deposition morphology on the fracture surface after five experimental schemes were implemented. Because the fracture channel was plugged by the precipitate, obvious PR and pressure lifting (PL) can be noticed in each scheme, as shown in Figure 4. The water injection pressure reached 5 MPa (the critical condition to terminate the experiment) in all schemes except Scheme 5, though the time required varied. In Scheme 5, the experiment lasted for nearly 5000 min, but the water injection pressure only reached about 1.6 MPa and remained unchanged for a long period. In this case, the experiment had to be aborted. According to the experimental results of the five schemes, the time required to repair the fracture using a single CaCO3 precipitate in Scheme 1 was the shortest (only 289 min), whereas time increased after mixing in the Fe(OH)3 precipitate. Schemes 3 and 4 showed the most significant increases in time required, whereas Scheme 2 was close to Scheme 1 (345 min). The repair efficiency achieved by the single CaCO3 precipitate is the highest; mixing in the Fe(OH)3 precipitate significantly lowered the repair efficiency. However, this negative influence is not linearly related to the amount of Fe(OH)3 (the repair efficiency of Scheme 4 is higher than that of Scheme 3). Conversely, the Fe(OH)3 precipitate alone failed to achieve the final repair goal under the experimental conditions.
Figure 4 shows different stages of each scheme; the PL and PR curves of the fractured rock specimen show different trend characteristics due to the difference in the adsorption and consolidation degree of the precipitate in the fracture. The PR curve can be used as an example. Three typical permeability change trends can be obtained from the statistics: a steady PR trend, a flat permeability trend, and a fluctuating/oscillating PR trend. Figure 5 shows the duration distribution of the three trends corresponding to each scheme. In Scheme 1, the permeability first remains basically flat and then decreases steadily until the end of the experiment. The duration ratio of the two trends is basically 1:2. Similarly, only two trends are involved in Scheme 2. However, the permeability first experiences a steady reduction in the initial stage of the experiment. After nearly half of the total repair time, it experiences a fluctuating/oscillating PR, and the repair is completed in a very short time at the end (16 min). By contrast, in other schemes, the permeability shows a steady PR trend in the initial stage, but it begins to show other trend characteristics after less than 10% of the total duration. In the later stage, the other two trends appear alternately in all other schemes. In addition, the proportion of the stage where the permeability is basically flat in the total duration of Scheme 3 is basically the same as that of the fluctuation/oscillation PR stage in Scheme 4. The different permeability curve trends are closely related to the adsorption and consolidation characteristics of precipitates in the fracture. Specifically, when the precipitate continues to be adsorbed on the fracture surface, it shows a steady PR trend; when the newly generated precipitate fails to adsorb on the fracture surface, or the amount of precipitate adsorbed and eroded is basically balanced, the permeability remains basically flat. However, when the precipitate in the fracture has not been completely consolidated, and its structure is still unstable, it is easily damaged by hydraulic erosion, leading to rapid permeability “rebound”. With the adsorption and deposition of the new precipitate, the PR trend can continue. If these two processes alternate, a fluctuation/oscillation PR phenomenon will occur. Accordingly, it follows that different proportions of mixed precipitate will directly affect the consolidation stability of the fracture, ultimately affecting repairs and PR. This will be discussed specifically in the following section.

4. Discussion

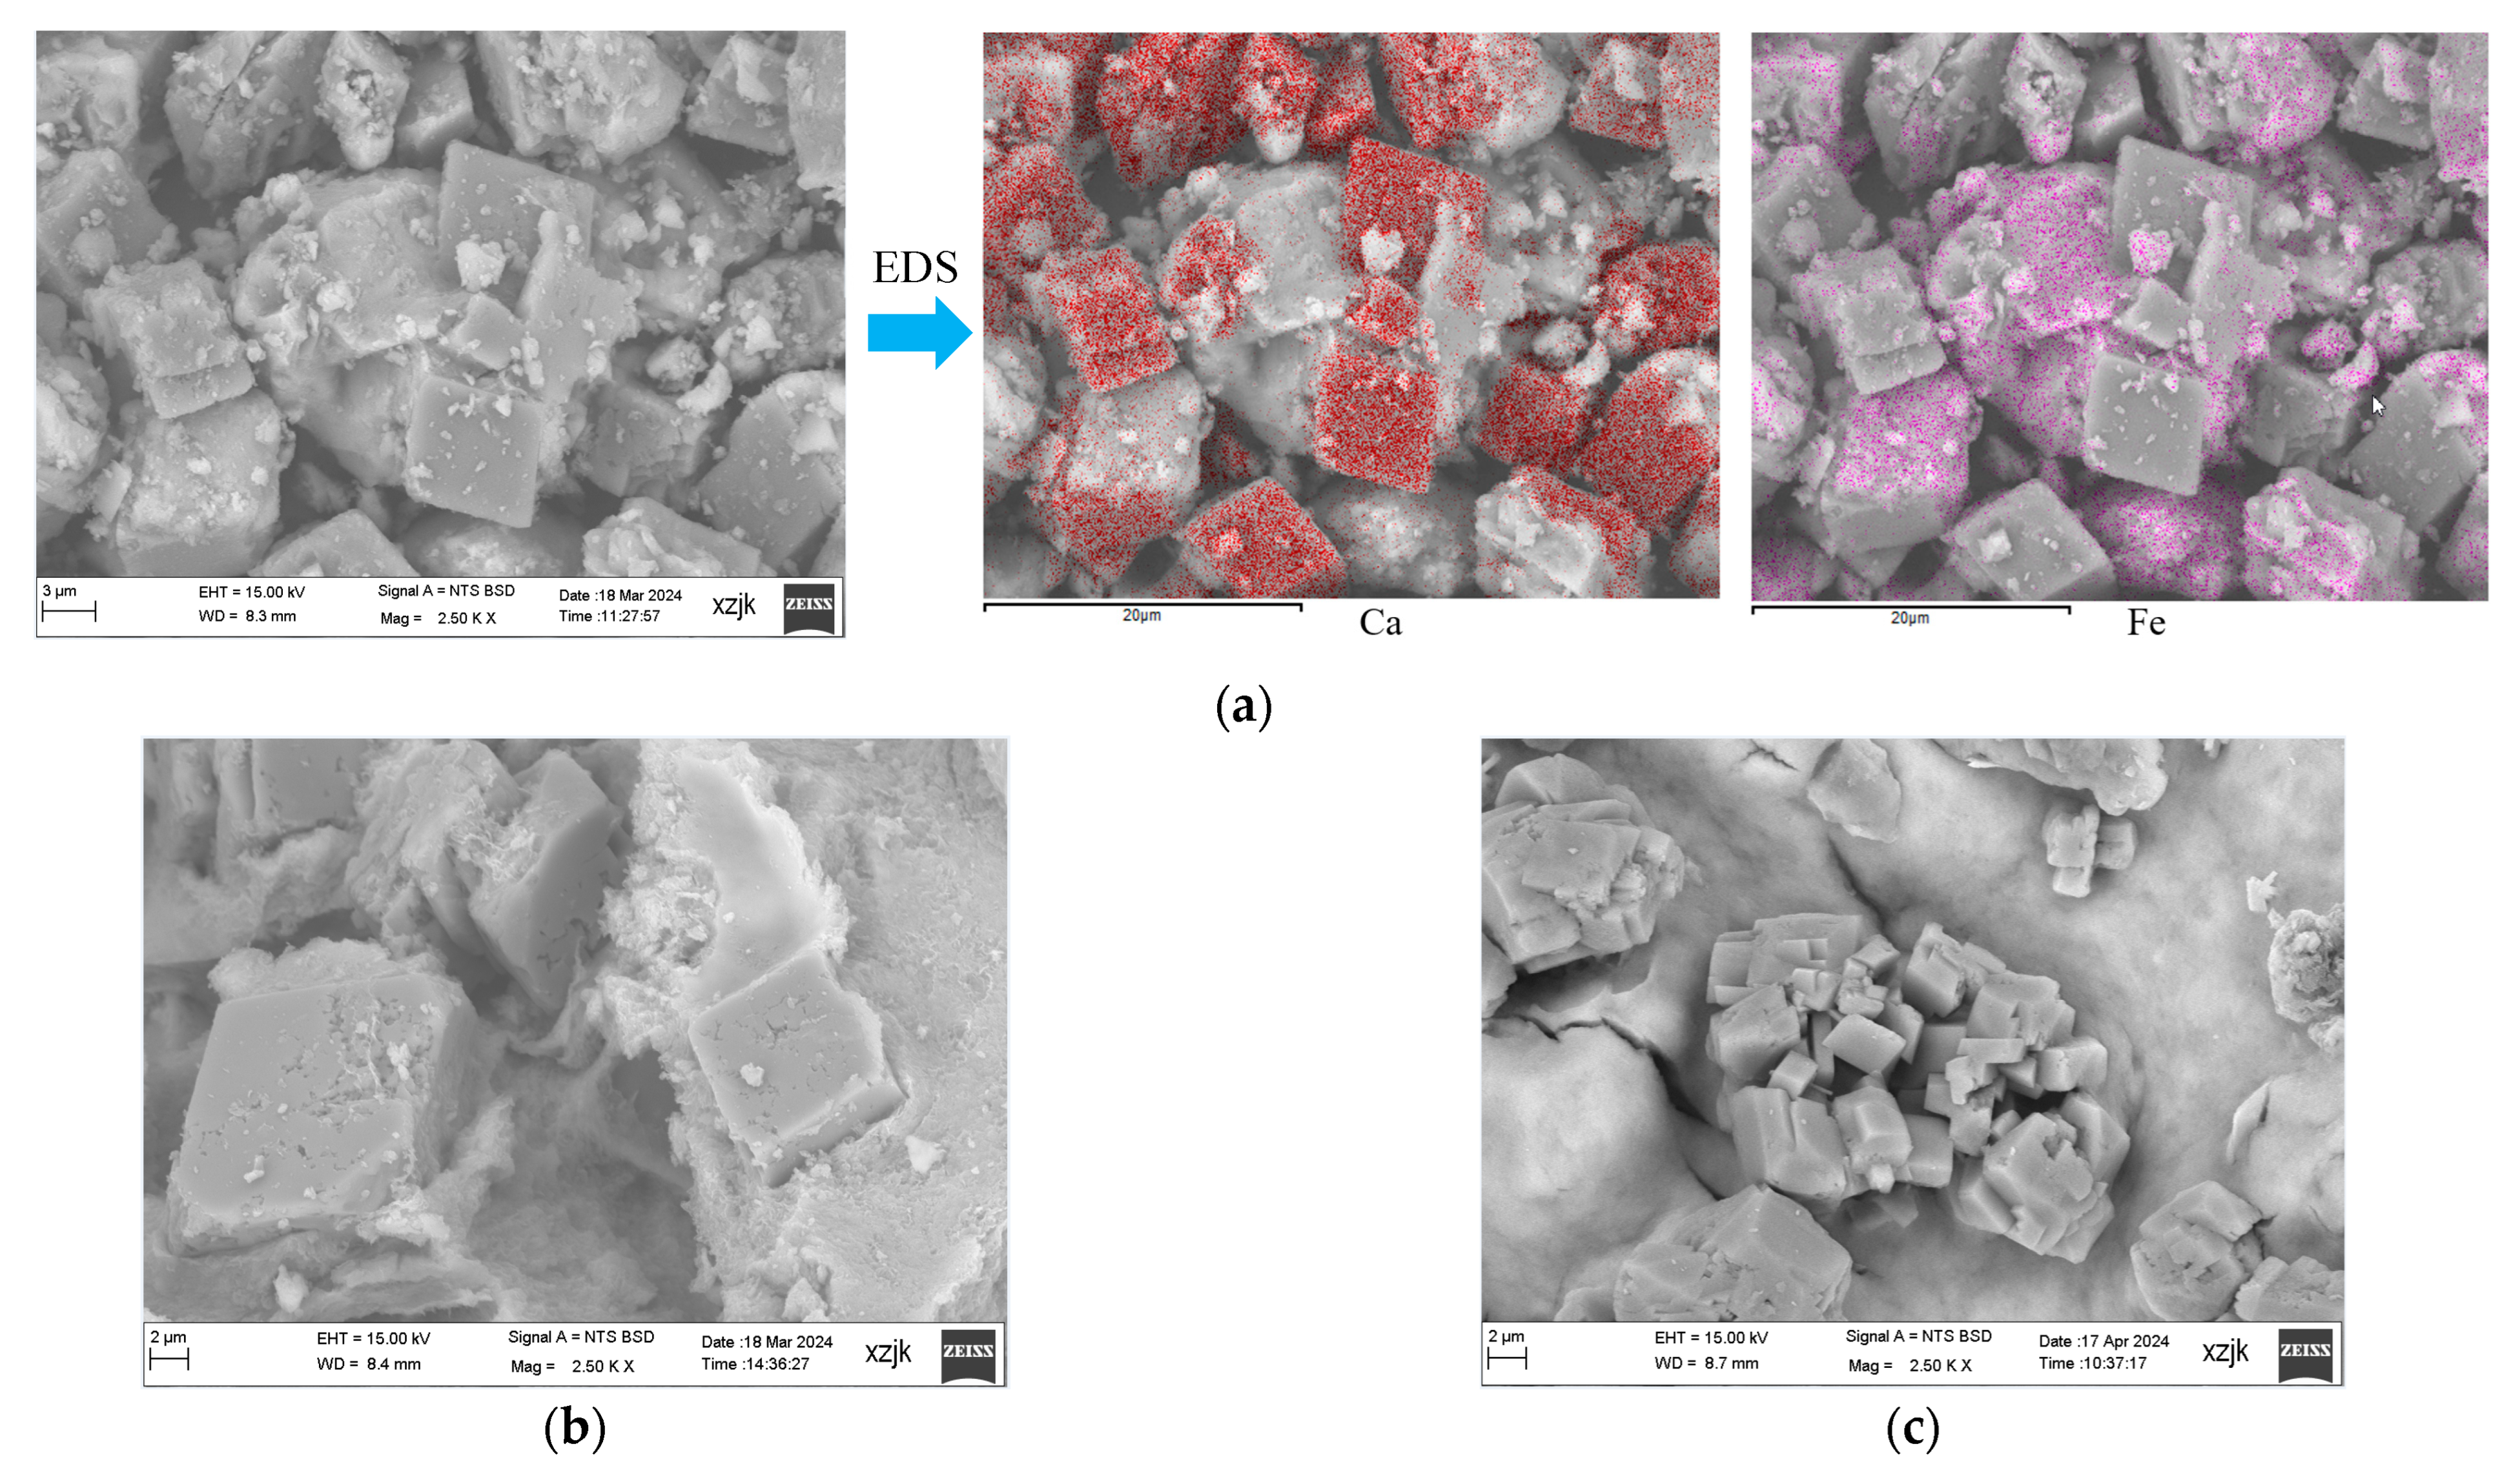
4.1. The Encapsulation of CaCO3 Crystals by Fe(OH)3 Colloid Is the Main Reason for the Decrease in Fracture Repair Efficiency Caused by the Mixed Precipitate

The experimental results show that no matter how large the mixed amount of Fe(OH)3 is, its final repair efficiency is always lower than that of the single CaCO3 precipitate. To explore the underlying mechanism, the mixed precipitate on the fracture surface corresponding to Schemes 2, 3, and 4 was sampled and tested via SEM. As shown in Figure 6a (Scheme 2), through the energy dispersion spectrum (EDS) analysis of Ca and Fe elements, it can be seen that the crystalline substance is the CaCO3 precipitate, while the debris or flake substance is the Fe(OH)3 precipitate. The microstructures of the mixed precipitates corresponding to the three schemes are compared. The number of CaCO3 crystals in the mixed precipitate of Scheme 2 is large and closely distributed, and Fe(OH)3 only sporadically covers the CaCO3 crystals or fills the spaces between the crystals. By contrast, in Scheme 3, CaCO3 crystals are rare, and most are wrapped in Fe(OH)3 precipitate, resulting in sparse crystal distribution. Although the number of CaCO3 crystals in Scheme 4 is increased compared with Scheme 3, the volume of a single crystal is obviously smaller (the volume ratio of the two is approximately 1:6). Even if many small crystals can be tightly bonded, they cannot nucleate as a whole due to the encapsulation of Fe(OH)3 precipitate. Accordingly, when the proportion of Fe(OH)3 in the mixed precipitate exceeds a certain degree, its “separation” effect on CaCO3 crystals can be highlighted. Then, the overall structural stability of the precipitate formed by mixing this scattered crystal into the colloid can ultimately affect the repair effect on the fractures.
According to [23,24], under the same conditions, the effect of a single CaCO3 precipitate on fracture repair and PR is significantly better than that of the Fe(OH)3 precipitate. The main reason for this is the strong adsorption–consolidation nucleation ability between CaCO3 crystals. Comparatively speaking, the Fe(OH)3 precipitate is mostly colloidal [25], and its ability to finally form a stable consolidated body is weak, despite its large volume. When the water injection pressure increases to a certain extent, the hydraulic erosion will directly disperse its colloidal structure, ultimately restricting the effect of PR. This is the main reason why Scheme 5 could not meet the end conditions of the experiment. Therefore, when the colloidal precipitate of Fe(OH)3 is mixed with the crystalline precipitate of CaCO3, the colloid will give full play to its volume advantage and form a package on the crystal, directly hindering the adsorption and nucleation of the crystal and other new crystals. At the same time, cations such as Na+ adsorbed on the colloid further repel the adsorption of Ca2+ and crystals. In this case, the overall stability of the mixed precipitate is naturally lower than that of the single CaCO3 precipitate, which will eventually reduce the efficiency of fracture repair and PR.
On the other hand, by comparing Schemes 3 and 4, it is not difficult to see that a further increase in Fe(OH)3 in the mixed precipitate actually improves the repair and PR efficiency. This indicates that as the mixed proportion of the Fe(OH)3 precipitate increases, the overall stability of the mixed precipitate also improves. According to the statistical results in Figure 5, the final repair time of Scheme 4 is shorter than that of Scheme 3. This is mainly because the frequency and cumulative durations of the “flat permeability” stage during the experiment are lower and shorter (the cumulative duration of this stage of Scheme 3 accounts for 65.7%, similar to that for the single Fe(OH)3 precipitate in Scheme 5). The reason for this can be seen in the microstructure photograph shown in Figure 6. The volume of the nodule formed by a plurality of small crystals in Scheme 4 is larger than that of the single crystal in Scheme 3 (about 2–3-times). Consequently, it is relatively less affected by the barrier adsorption wrapped in the Fe(OH)3 colloid. Therefore, when the water pressure is relatively high, it can still be adsorbed to the new precipitate to form a whole with it. In this case, it is difficult to prevent the permeability from changing. Accordingly, with the increase in the proportion of Fe(OH)3 in the mixed precipitate, its influence on the fracture repair efficiency fluctuates and is not linear.

4.2. Fe(OH)3 Precipitate Can Significantly Improve the Efficiency of PR in the Initial Stage of the Experiment

The PR and PL curves shown in Figure 4 demonstrate that although the overall time spent on fracture repair by the mixed precipitate is obviously longer, mixing in the Fe(OH)3 precipitate significantly improves the PR efficiency in the initial stage of the experiment. The partially enlarged view shows that the absolute permeability curves of Schemes 2 to 5 are always below the curve of Scheme 1 during the initial 4 h. This indicates that during this period, mixing in the Fe(OH)3 precipitate can achieve higher PR efficiency. Specifically, within 1 h of the initial stage, the repair efficiency achieved using a single Fe(OH)3 precipitate is the highest, directly proportional to the proportion of Fe(OH)3 in the mixed precipitate. Then, the PR in Schemes 3 and 5 begins to slow down, and the efficiency gradually becomes lower than that of Schemes 2 and 4. As the experiment continues for nearly 2 h, inflection points appear one after another in the PR curves of Schemes 2 to 5, with the curve trend tending to be gentle and the PR rate greatly reduced. When the experiment lasts for nearly 4 h, the repair efficiency of Scheme 1 begins to overtake the others.
This phenomenon may be related to the morphology of the two precipitates. Fe(OH)3 can quickly occupy the fracture channel space by virtue of its large colloid volume. Because the water injection pressure is not significant in the initial stage of the experiment, this advantage is more obvious. As the fracture channel gradually narrows and the water injection pressure gradually increases, the colloidal structure is prone to instability, and the PR is naturally no longer significant. This phenomenon corresponds to the “fluctuation/oscillation PR trend”. The statistical results in Figure 5 show that, regardless of the proportion of mixed precipitate, the absolute permeability begins to fluctuate when the water pressure reaches about 0.1 MPa. However, in the experimental scheme with the single Fe(OH)3 precipitate, the absolute permeability fluctuates only when the water pressure reaches about 0.2 MPa. This indicates that under these experiment conditions, the strength of the mixed precipitate’s hydraulic erosion resistance is about 0.1 MPa, while that of the Fe(OH)3 precipitate is 0.2 MPa. Thus, in practical engineering applications, the Fe(OH)3 precipitate can be prioritized when the repair requirements of WCFs are not high and the water pressure of the aquifer that needs to be repaired is not high.

4.3. Adopting a Mixed Fe(OH)3 and CaCO3 Precipitate with a Molar Ratio Close to 1:4 in the Early Stage and a Single CaCO3 Precipitate in the Later Stage Can Achieve Better Repair Efficiency

Fe(OH)3 precipitation significantly improved PR efficiency in the initial stage of the experiment. Thus, based on the five schemes, three new schemes (added Schemes 1, 2, and 3) were added to repair the fracture through different chemical precipitates in different stages. Each scheme was divided into two stages. Stage I is similar to what has already been described, using different proportions of mixed precipitate or single Fe(OH)3 precipitate for fracture repair, while Stage II continues the experiment with a single CaCO3 precipitate by replacing the aqueous solution in pump B. Figure 4 shows that when mixed precipitates are used for fracture repair, an inflection point generally appears in the PR curve when the experiment continues for about 2 h (the PR rate begins to slow down significantly). Accordingly, the duration of Stage I in the new schemes is also 2 h. Other procedures and methods are the same as those described above.
The PR curves of the three new schemes are shown in Figure 7. By comparing the PR curves of the two stages with curves corresponding to the similar schemes mentioned above, some rules can be observed. In Stage I, although the precipitate composition adopted in the added scheme is the same as that of the corresponding schemes (the three added schemes correspond to Schemes 2, 4, and 5, respectively), only the PR curve presented by added Scheme 1 is consistent with that of Scheme 2. By contrast, the corresponding curves of the other two added schemes display obvious deviations, directly leading to the low PR efficiency achieved by these two added schemes in Stage I compared with the first schemes. Therefore, it can be inferred that when the Fe(OH)3 precipitate participates in fracture repair, its repair effect may be random. As for Stage II, Figure 8 shows that the PR curves of the three added schemes, especially added Schemes 2 and 3—accounting for a small proportion of CaCO3 precipitate in Stage I—are all very similar to that of Scheme 1, with their curves basically overlapping. This shows that the effect of channel size and morphology on fracture repair caused by the Fe(OH)3 precipitate in Stage I does not affect the PR trend caused by the CaCO3 precipitate in Stage II. Moreover, the higher the proportion of CaCO3 precipitate participating in the repair in Stage I, the greater its impact on the PR trend in Stage II. From this perspective, the effect of the CaCO3 precipitate on fracture repair is more certain than that of the Fe(OH)3 precipitate.
By comparing the PR curves in the three added schemes, it can be seen that added Schemes 2 and 3 were prolonged mainly because the “flat permeability” trend at the end of Stage I and early Stage II lasted for a long time. This is similar to the situation in Scheme 3, indicating that the Fe(OH)3 precipitate adsorbed on the fracture surface in Stage I restricts the implantation and growth of CaCO3 crystals in Stage II. Comparing added Schemes 2 and 3, it can be further inferred that when the proportion of the Fe(OH)3 precipitate in Stage I increases, this restriction may be weakened, similar to the difference between Schemes 3 and 4. Therefore, the closer the proportion of Fe(OH)3 in the mixed precipitate is to zero or one, the better its repair effect on the fracture. The PR curve in added Scheme 1 transitions smoothly at the junction of the two stages. Therefore, it can be inferred that if the duration of Stage I in this scheme is prolonged, the time required to finally achieve fracture repair may be shorter. Accordingly, a mixed Fe(OH)3 and CaCO3 precipitate with a molar ratio of about 1:4 in the early stage and a single CaCO3 precipitate in the later stage should be able to repair fractures with relatively good PR efficiency. However, further study is required to determine a reasonable transition time for the two stages.

5. Conclusions

(1)
This study conducted repair and PR experiments using a single CaCO3/Fe(OH)3 precipitate or a mixed precipitate with different molar ratios of the two on the same fracture. The Fe(OH)3 colloid encapsulated CaCO3 crystals in a mixed precipitate, reducing the overall structural stability of the mixed precipitate and restricting repair and PR efficiency. The Fe(OH)3 precipitate had better PR efficiency in the initial stage of the experiment. Therefore, a new fracture repair experiment using a mixed precipitate and a single CaCO3 precipitate in two stages was conducted to obtain a reasonable scheme with excellent fracture repair efficiency.
(2)
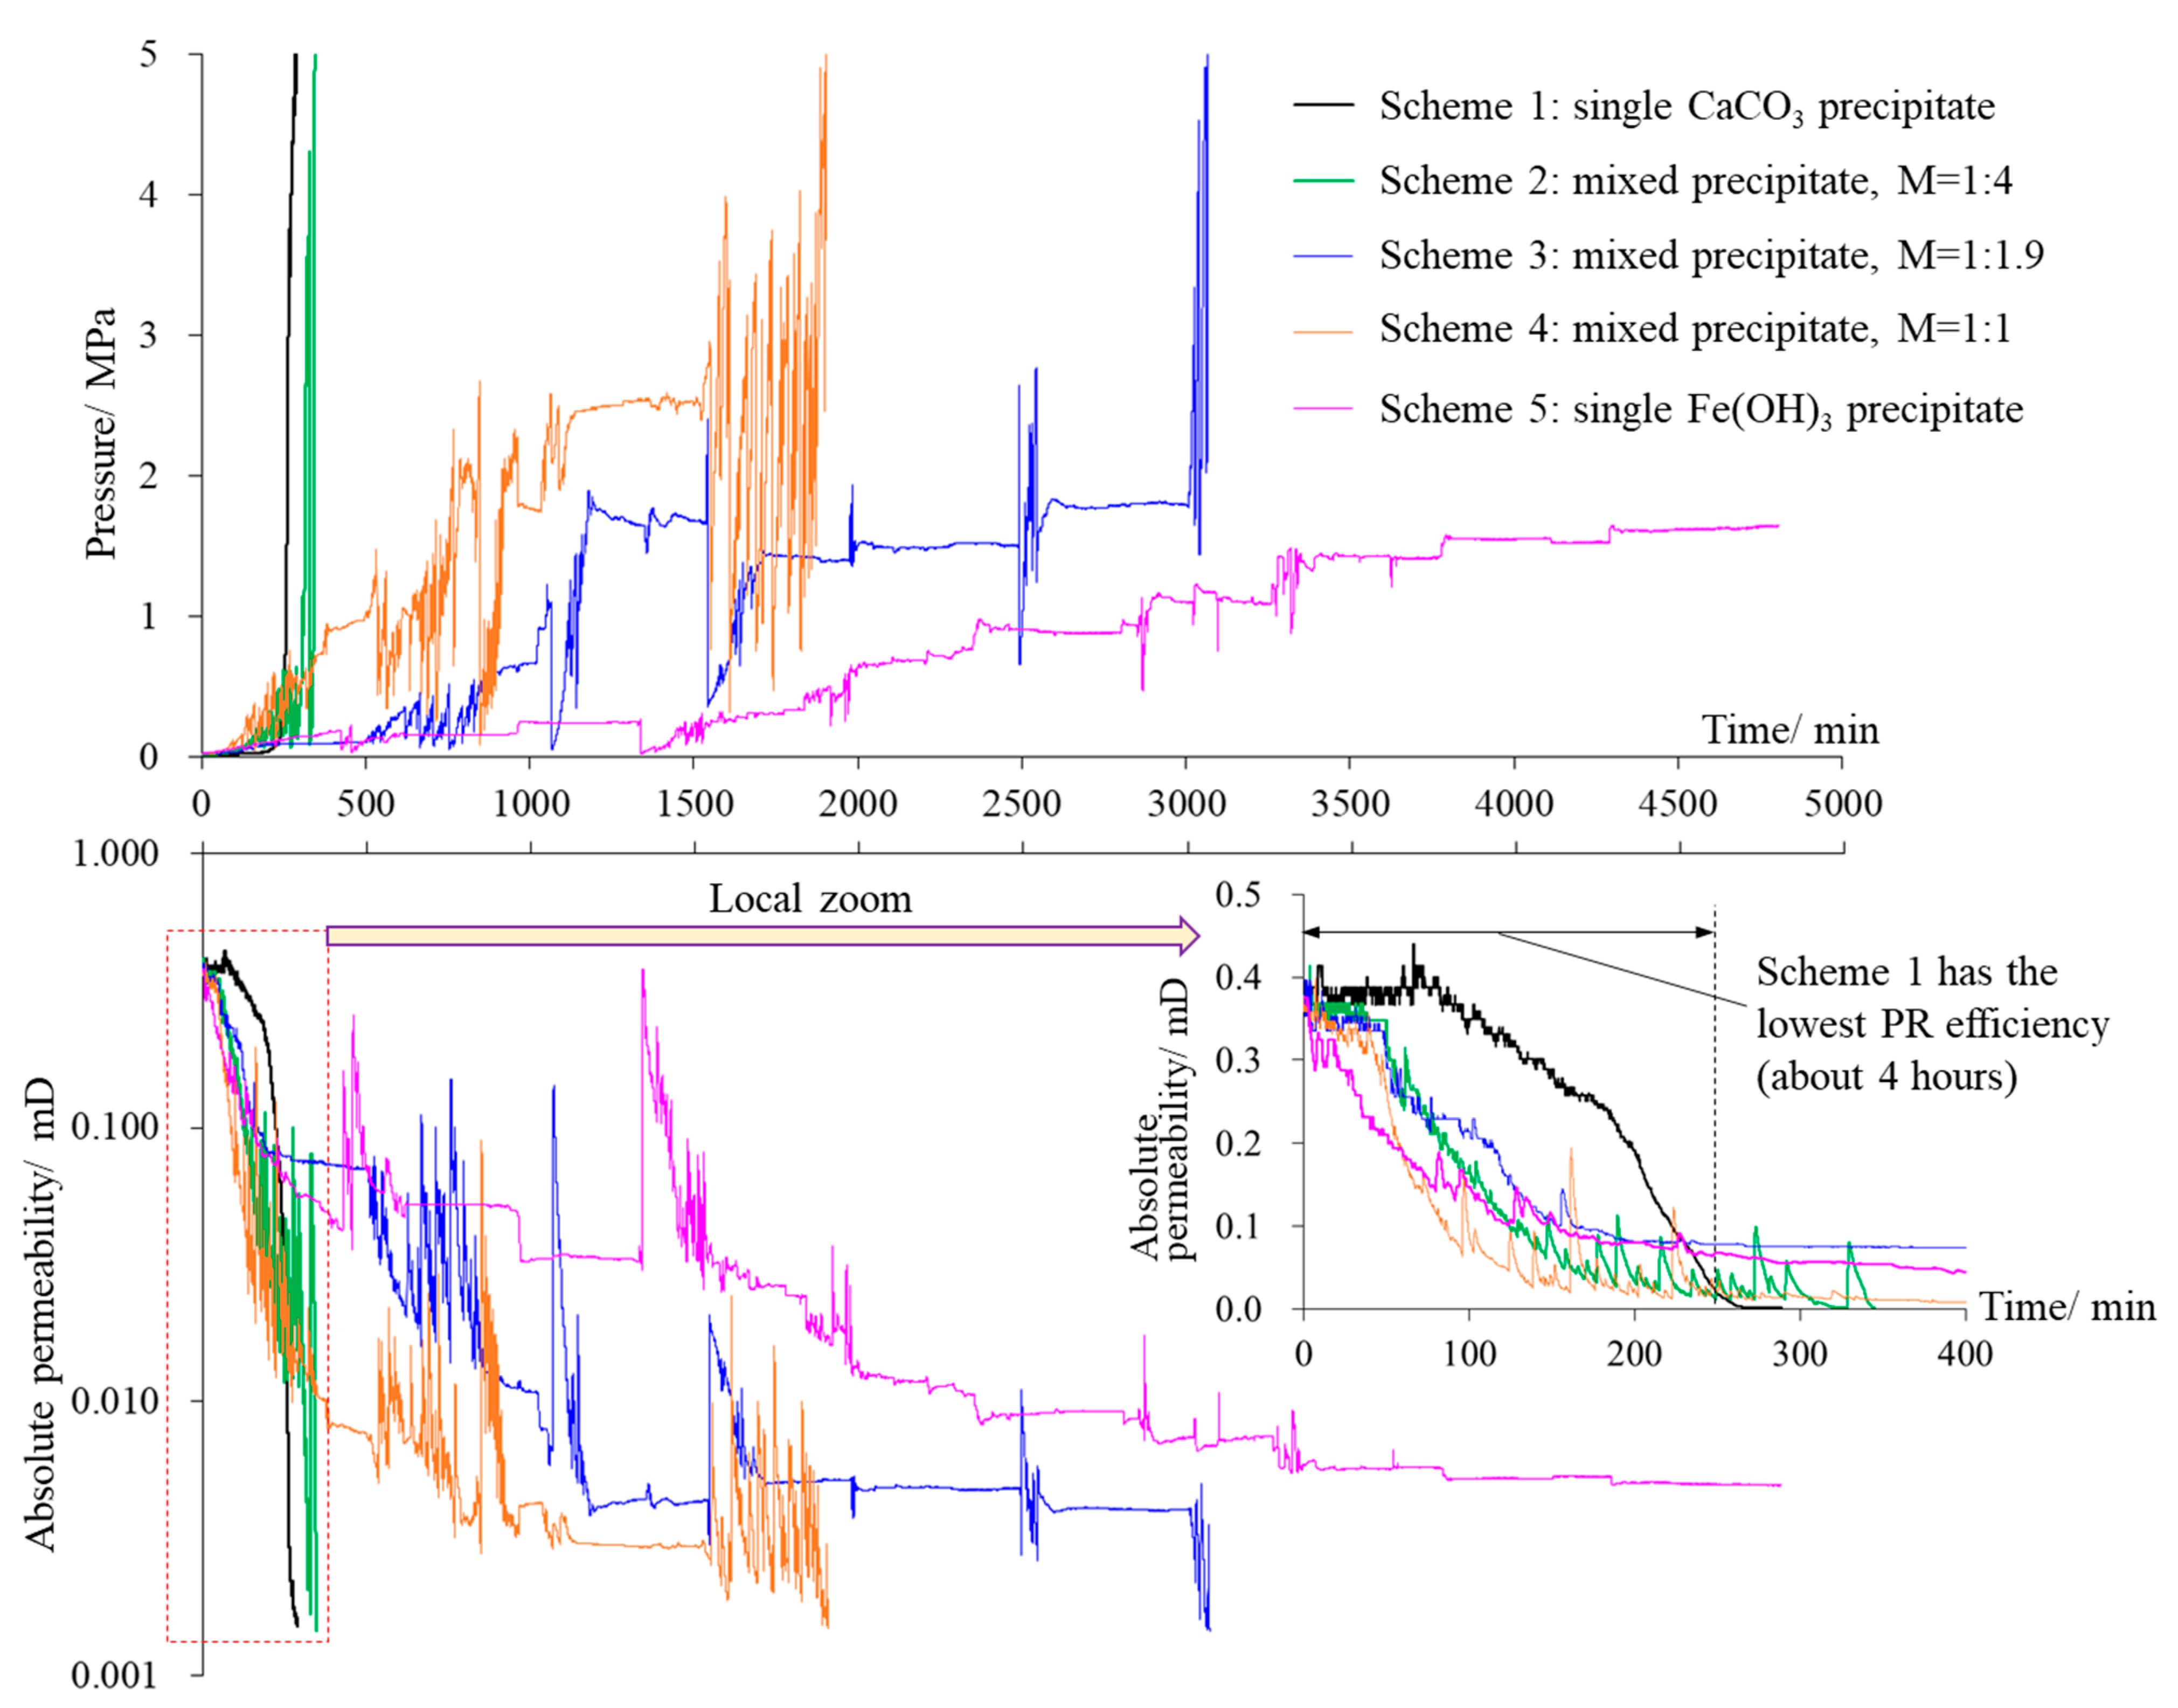
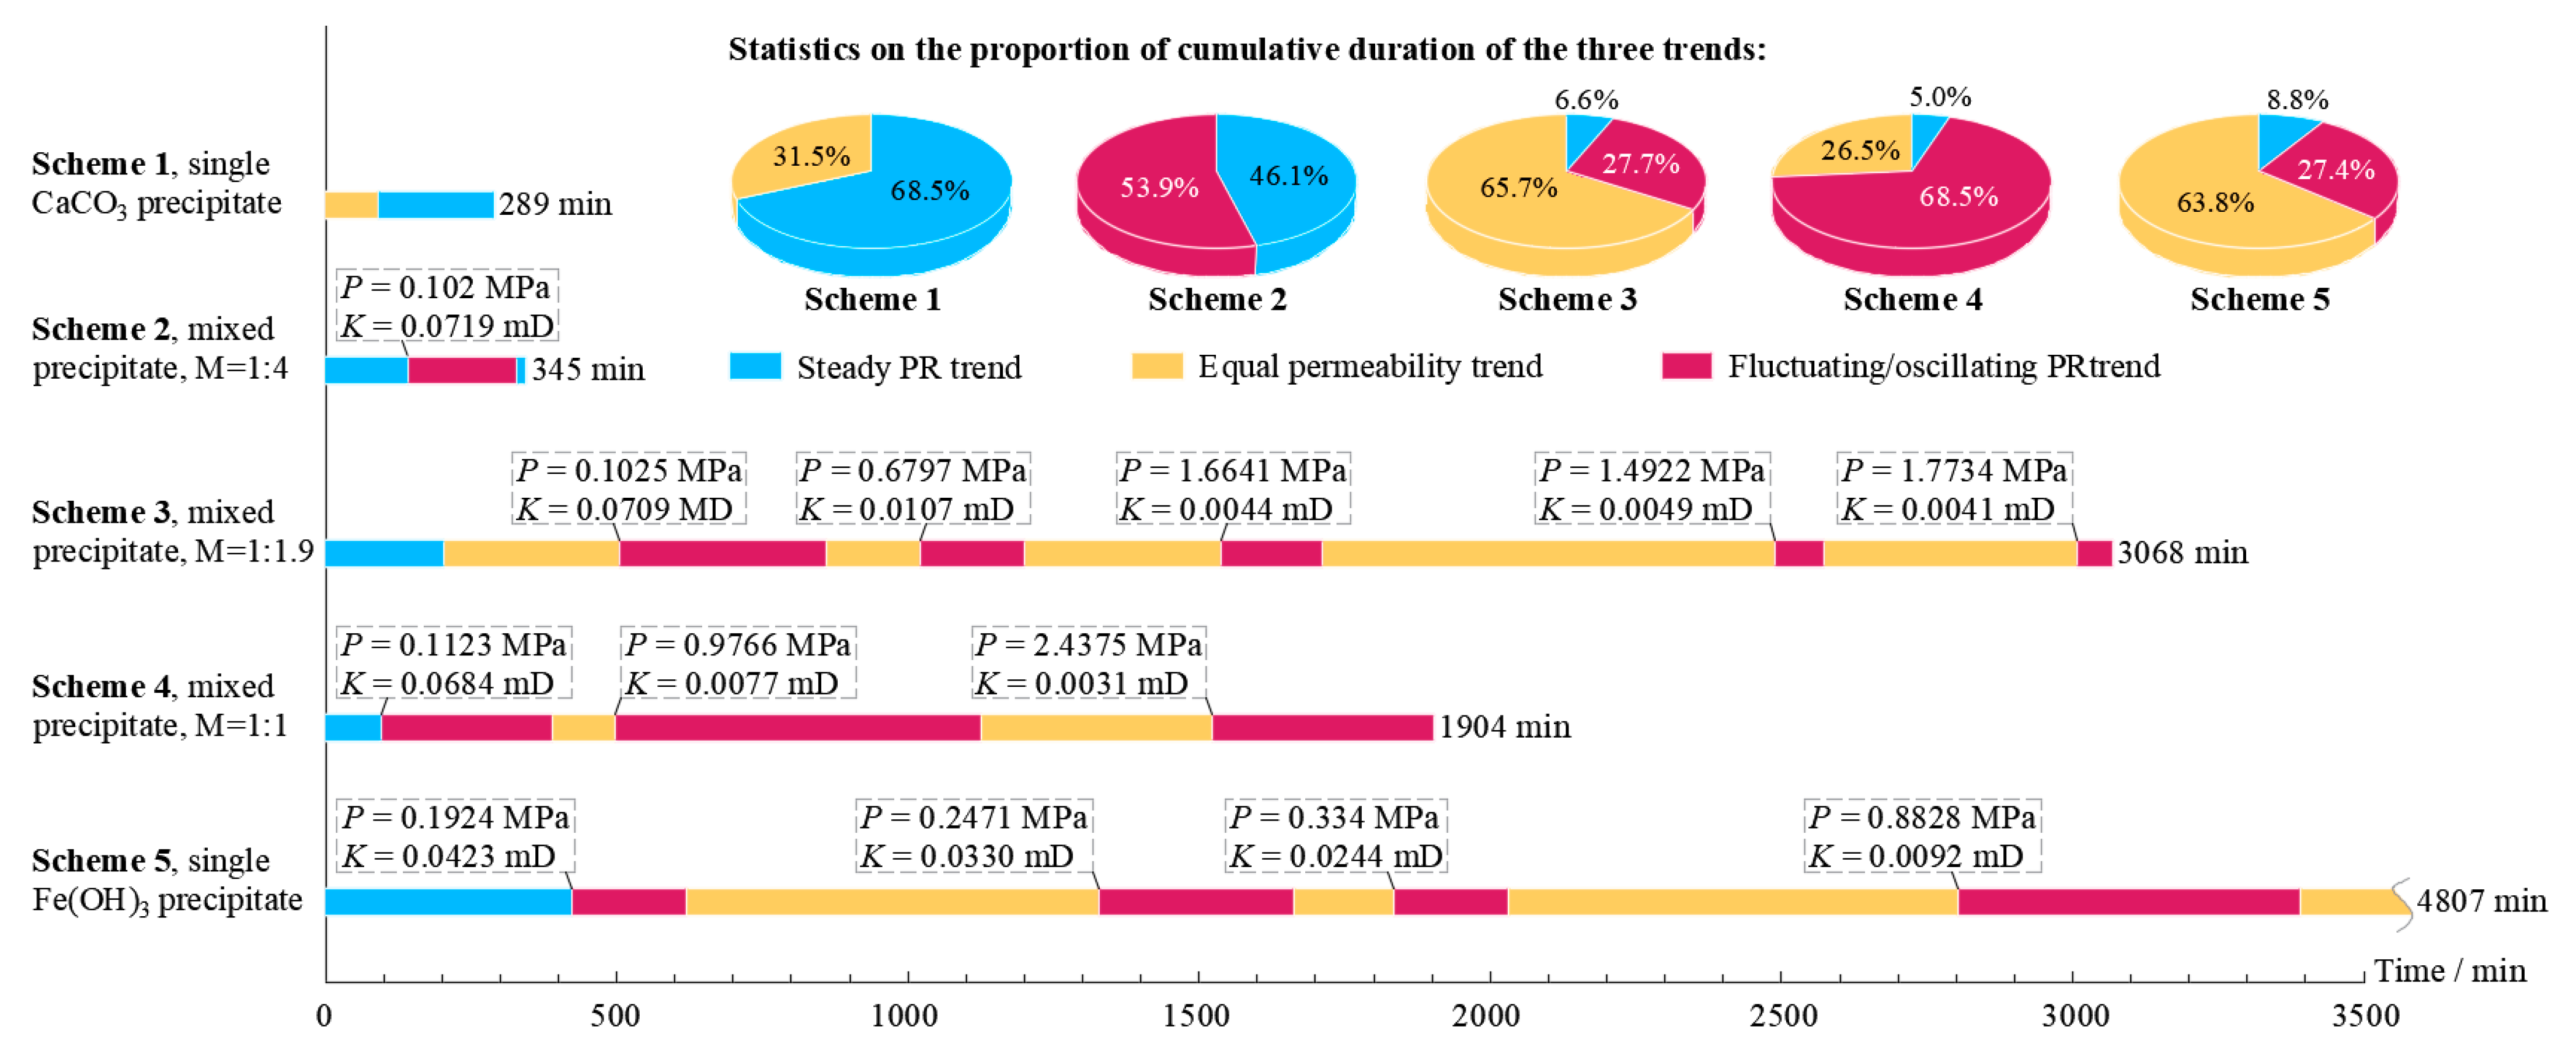
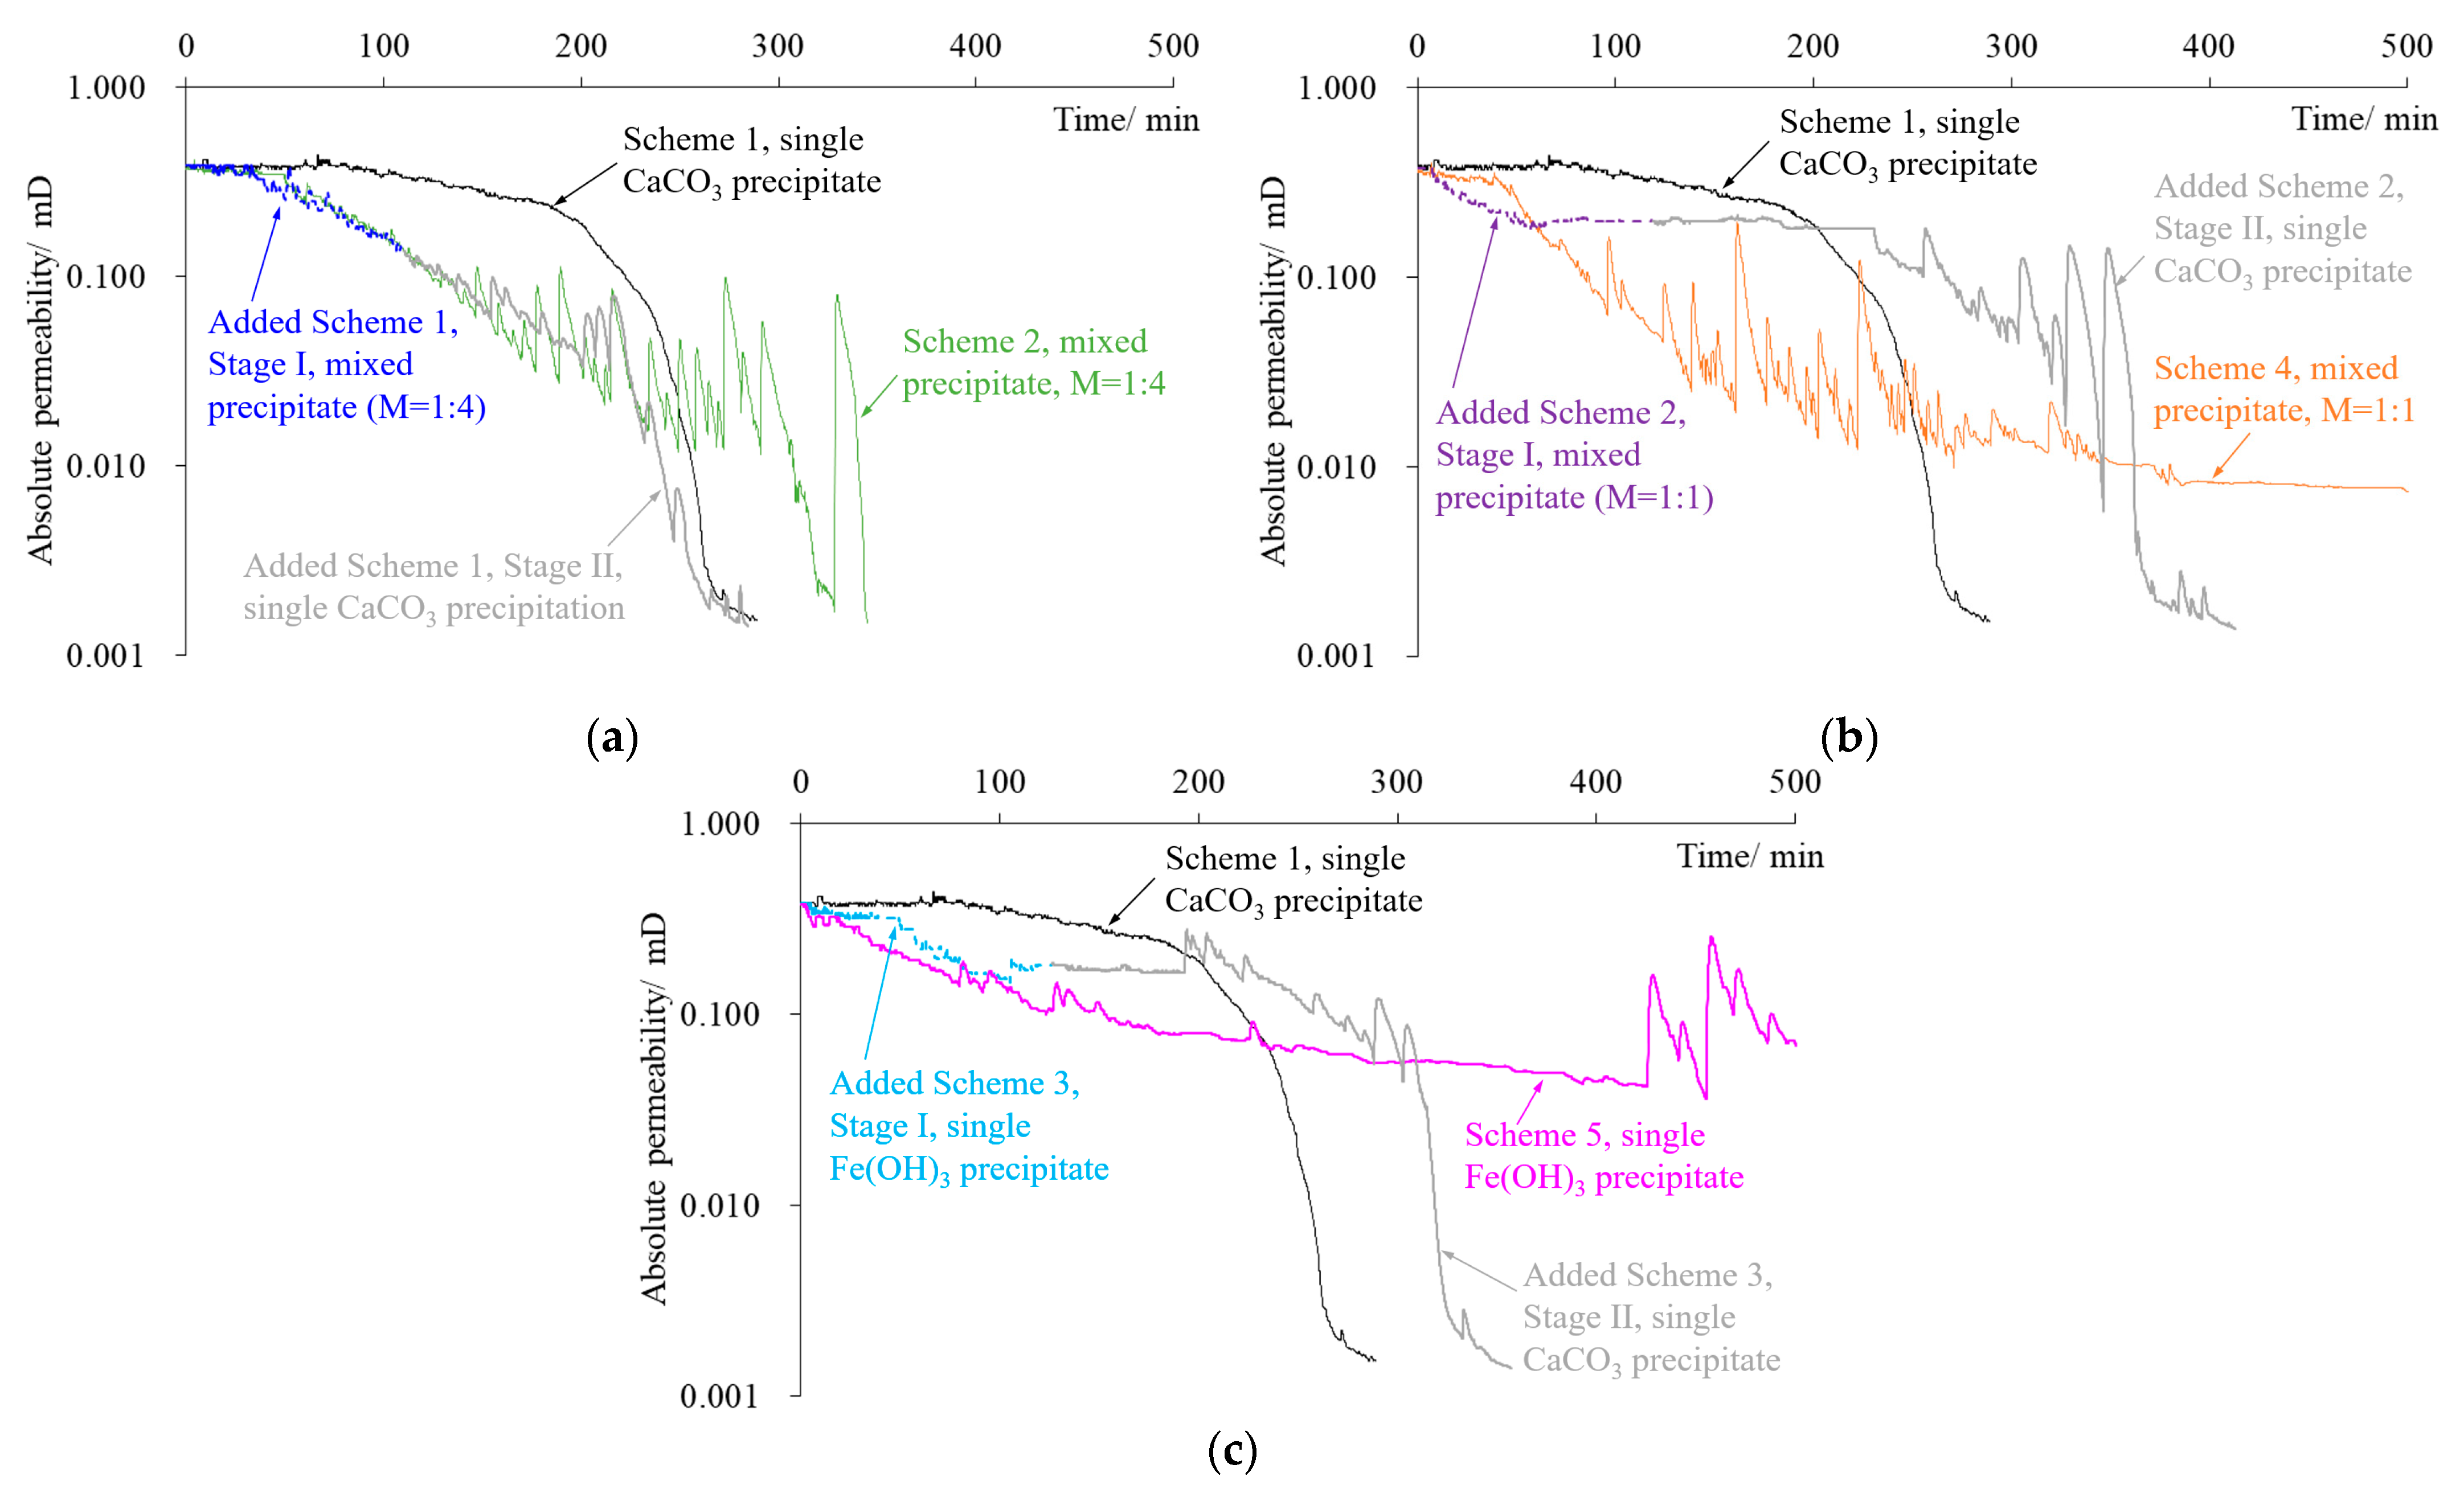
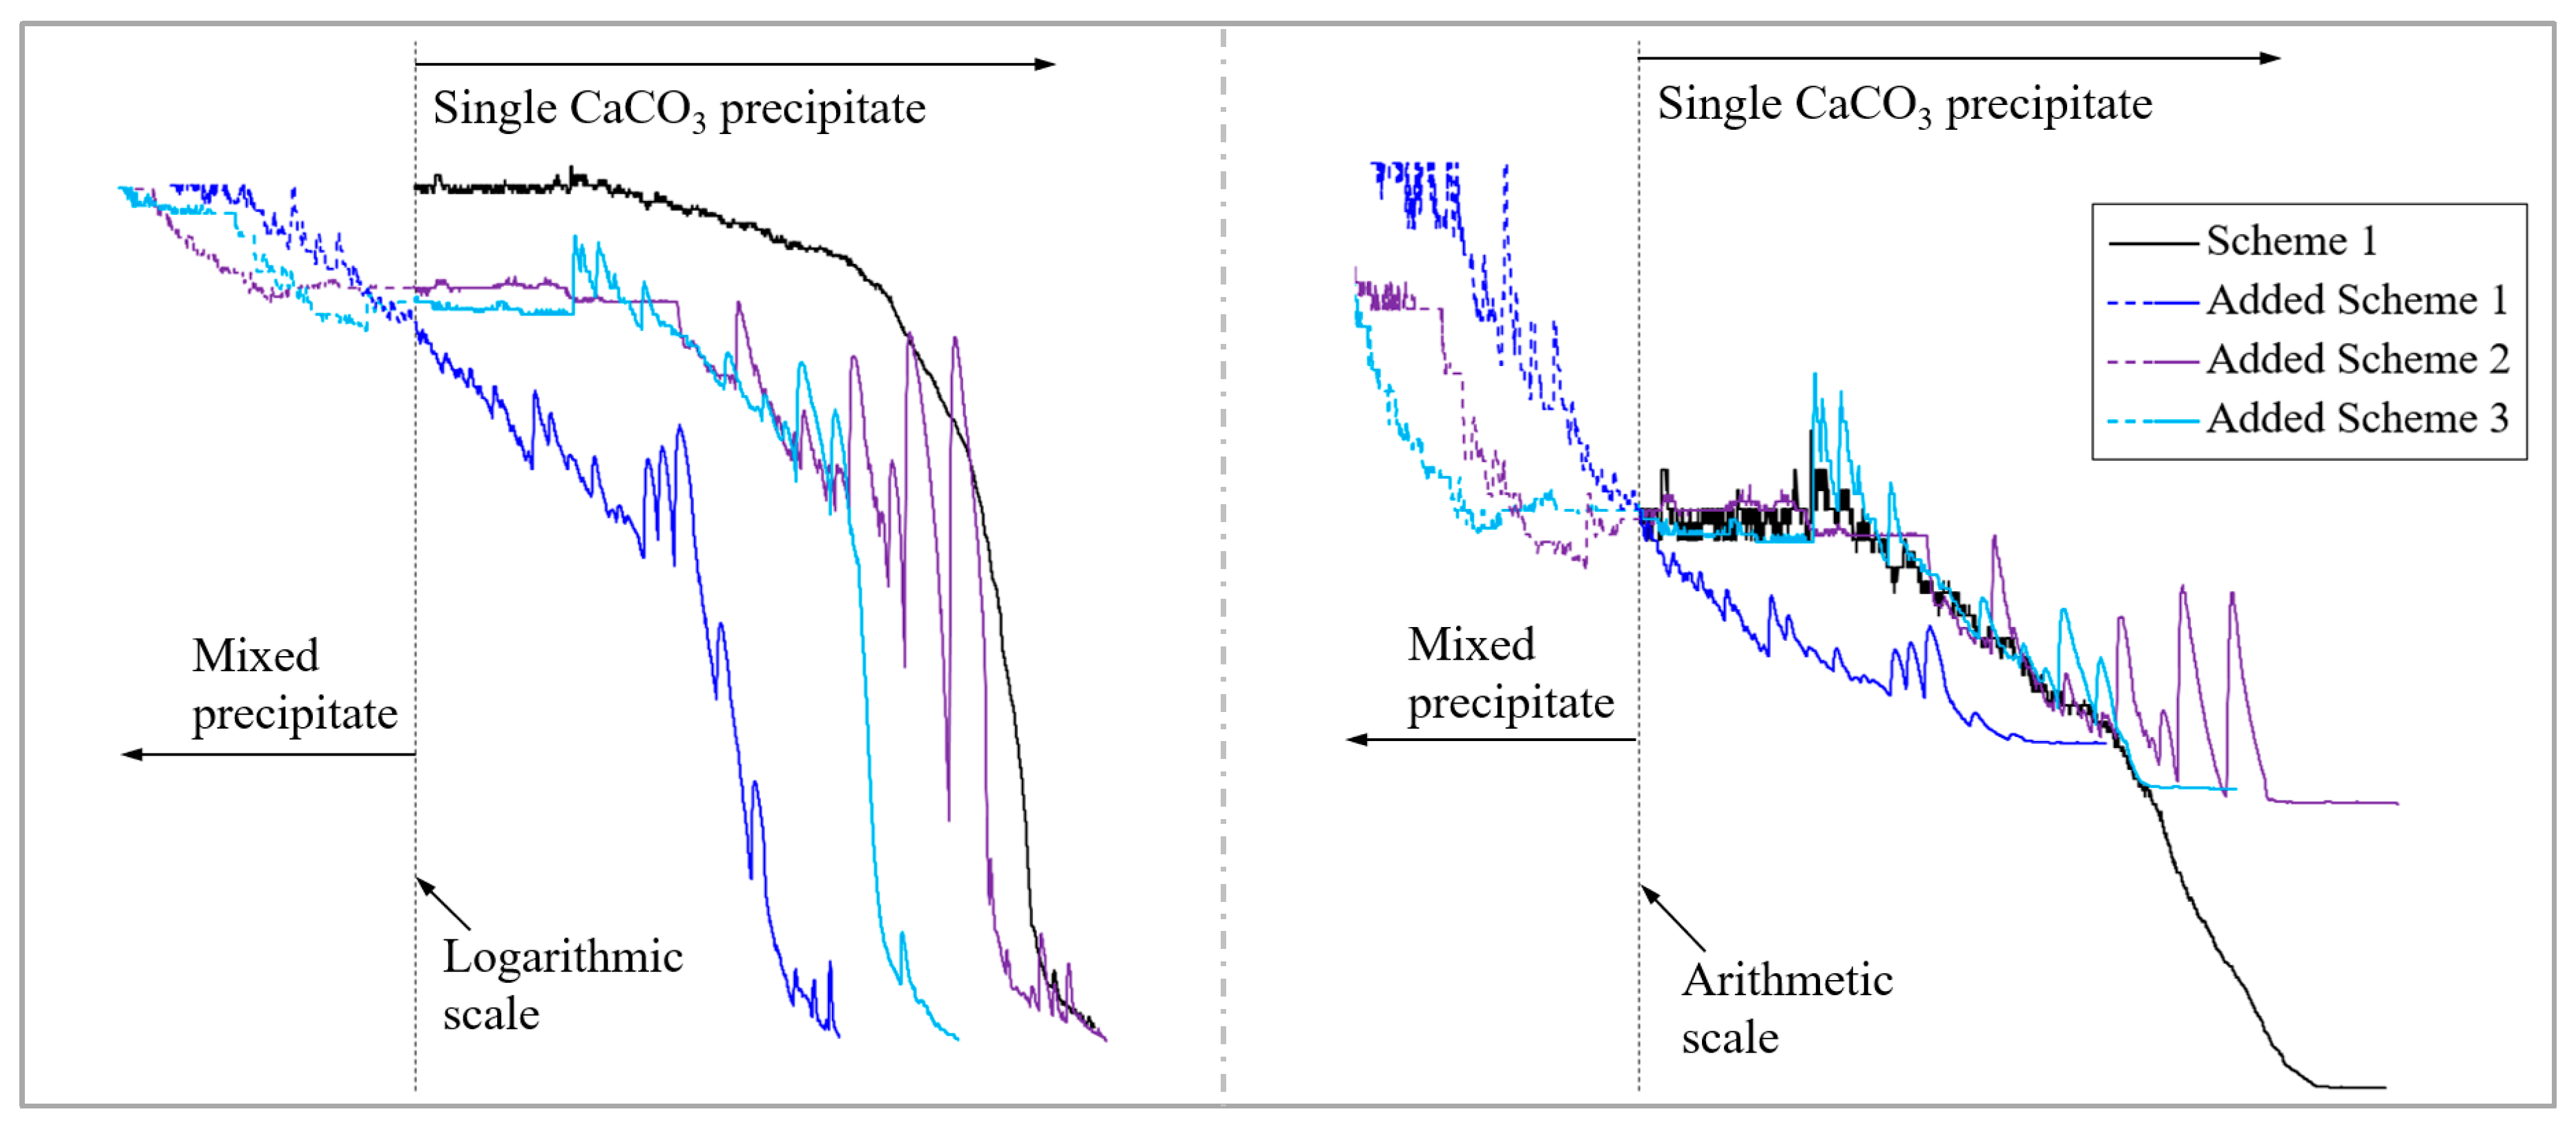
In the experiment, the fractured rock specimen’s PR curves showed different trend characteristics due to the difference in the adsorption and consolidation degree of the precipitates in the fractures. There were three main trends: a steady PR trend, a flat permeability trend, and a fluctuating/oscillating PR trend. The PR trend caused by the single CaCO3 precipitate was stable and fast, while those caused by the mixed precipitate and single Fe(OH)3 precipitate tended to frequently fluctuate/oscillate and persist for a long period. Instability in precipitate structures caused by hydraulic erosion is the main reason for this phenomenon. Under our experimental conditions, the strength of the mixed precipitate against hydraulic erosion was about 0.1 MPa, while that of the Fe(OH)3 precipitate was about 0.2 MPa.
(3)
Within the first 4 h of the initial stage, the repair efficiency of the single CaCO3 precipitate on fractures was always the lowest among the schemes. Further experiments showed that a mixed Fe(OH)3 and CaCO3 precipitate with a molar ratio of about 1:4 in the early stage (the duration should be more than 2 h) and a single CaCO3 precipitate in the later stage should be the relatively optimal scheme for WCF repair.
(4)
The PR law of chemical precipitates in repairing WCFs is a complex problem under the comprehensive influence of multiple factors. This study only examined a sandstone sample under specific fracture development conditions. For other lithological rock samples with different fracture development characteristics, these PR laws require further study. The time boundary setting for using different precipitates to repair fractures in stages will also be the focus of subsequent research.

Author Contributions

Conceptualization, J.J.; writing—original draft preparation, J.J.; writing—review and editing, C.W. and Y.F.; methodology, J.J. and Q.L.; validation, J.J. and Q.L.; formal analysis, J.J., Q.L. and C.W.; data curation, J.J., C.W. and Y.F.; project administration, J.J. All authors have read and agreed to the published version of the manuscript.

Funding

This research was funded by the National Natural Science Foundation of China (grant number: 42477497) and the National Key Research and Development Program of China (grant number: 2021YFC2902104).

Institutional Review Board Statement

Not applicable.

Informed Consent Statement

Not applicable.

Data Availability Statement

The original contributions presented in this study are included in the article. Further inquiries can be directed to the corresponding authors.

Acknowledgments

The authors acknowledge Mingzhong Wen for his help in sample testing.

Conflicts of Interest

The authors declare no conflicts of interest.

References

  1. Karan, S.K.; Samadder, S.R.; Singh, V. Groundwater vulnerability assessment in degraded coal mining areas using the AHP-Modified DRASTIC model. Land Degrad. Dev. 2018, 29, 2351–2365. [Google Scholar] [CrossRef]
  2. Arkoc, O.; Ucar, S.; Ozcan, C. Assessment of impact of coal mining on ground and surface waters in Tozakli coal field, Kirklareli, northeast of Thrace, Turkey. Environ. Earth Sci. 2016, 75, 514. [Google Scholar] [CrossRef]
  3. Zhang, J.C.; Shen, B.H. Coal mining under aquifers in China: A case study. Int. J. Rock Mech. Min. Sci. 2004, 41, 629–639. [Google Scholar] [CrossRef]
  4. Gao, X.C.; Liu, S.; Ma, T.F.; Zhao, C.; Zhang, X.C.; Xia, H.; Yin, J.H. A prediction method for height of water flowing fractured zone based on sparrow search Algorithm-Elman neural network in northwest mining area. Appl. Sci. 2023, 13, 1162. [Google Scholar] [CrossRef]
  5. Ju, J.F.; Li, Q.S.; Xu, J.L.; Cao, Z.G. Progress of ecological remediation technology of mining-damaged aquifer. Coal Sci. Technol. 2020, 48, 102–108. [Google Scholar]
  6. Han, G.S.; Dai, S.Z.; Zhang, J.Q.; Gao, Y.; Liu, Y.M. Study on the workability and early mechanical properties of carbon nanotube-coated fly ash modified cement-based grouting materials. Constr. Build. Mater. 2024, 439, 137327. [Google Scholar] [CrossRef]
  7. Feng, L.; Huang, F.; Wang, G.H.; Huang, T.; Qian, Z.Z. Experimental investigation on pneumatic pre-fracturing grouting in low-permeability soil. Tunn. Undergr. Space Technol. 2023, 131, 104798. [Google Scholar] [CrossRef]
  8. Lee, H.B.; Oh, T.M.; Park, E.S.; Lee, J.W.; Kim, H.M. Factors affecting waterproof efficiency of grouting in single rock fracture. Geomech. Eng. 2017, 12, 771–783. [Google Scholar] [CrossRef]
  9. El Tani, M. Grouting rock fractures with cement grout. Rock Mech. Rock Eng. 2012, 45, 547–561. [Google Scholar] [CrossRef]
  10. Salimian, M.H.; Baghbanan, A.; Hashemolhosseini, H.; Dehghanipoodeh, M.; Norouzi, S. Effect of grouting on shear behavior of rock joint. Int. J. Rock Mech. Min. Sci. 2017, 98, 159–166. [Google Scholar] [CrossRef]
  11. Liu, S.Q.; Fei, Y.; Xu, Y.C.; Huang, L.; Guo, W.Y. Full-floor grouting reinforcement for working faces with large mining heights and high water pressure: A case study in China. Mine Water Environ. 2020, 39, 268–279. [Google Scholar] [CrossRef]
  12. Duan, J.H.; Mu, W.Q.; Li, L.C.; Han, Y.C.; Zhang, Y.S.; Ren, B. Slurry flow mechanism with time-varying viscosity in regional long-hole grouting for floor reinforcement. Phys. Fluids 2024, 36, 083115. [Google Scholar] [CrossRef]
  13. Ju, J.F.; Xu, J.L.; Yang, J. Experimental study on the flow behavior of grout used in horizontal directional drilling borehole grouting to seal mining induced overburden fracture. Geofluids 2021, 2021, 8823902. [Google Scholar] [CrossRef]
  14. Faramarzi, L.; Rasti, A.; Abtahi, S.M. An experimental study of the effect of cement and chemical grouting on the improvement of the mechanical and hydraulic properties of alluvial formations. Constr. Build. Mater. 2016, 126, 32–43. [Google Scholar] [CrossRef]
  15. Wang, Y.K.; Han, M.S. Optimal design of slope reinforcement by a new developed polymer micro anti-slide pile in case of emergency and disaster relief. Nat. Hazards 2022, 112, 899–917. [Google Scholar] [CrossRef]
  16. Wang, P.C.; Li, S.C.; Li, J.L.; Zhou, H.Y.; Ma, P.F.; Tian, Y.; Yuan, C.; Feng, X.D. Seepage behavior and mechanical properties of two kinds of polyurethane/ water glass in combined grouting experiment. Tunn. Undergr. Space Technol. 2023, 136, 105092. [Google Scholar] [CrossRef]
  17. Cao, C.M.; Feng, Z.Q. Development and application of low viscosity urea-formaldehyde resin grouting material. J. China Coal Soc. 2009, 34, 482–486. [Google Scholar]
  18. Qian, C.X.; Wang, A.H.; Wang, X. Advances of soil improvement with bio-grouting. Rock Soil Mech. 2015, 36, 1537–1548. [Google Scholar]
  19. Ju, J.F.; Li, Q.S.; Xu, J.L.; Wang, X.Z.; Lou, J.F. Self-healing effect of water-conducting fractures due to water-rock interactions in undermined rock strata and its mechanisms. Bull. Eng. Geol. Environ. 2020, 79, 287–297. [Google Scholar] [CrossRef]
  20. Yin, S.H.; Shao, Y.J.; Wu, A.X.; Wang, S.Y.; Li, G.C. The effect of ferrous ions on hydraulic conductivity in fine tailings. Eng. Geol. 2019, 206, 105243. [Google Scholar] [CrossRef]
  21. van Beek, C.G.E.M. Well-screen and well-head clogging by hydrous ferric oxides. Hydrogeol. J. 2018, 26, 2919–2932. [Google Scholar] [CrossRef]
  22. Ju, J.F.; Li, Q.S.; Xu, J.L.; Li, J.J.; Cao, Z.G. Experimental study on water permeability decrease character due to restoration function of chemical precipitation on holes or fractures in mining failure rock mass. Coal Sci. Technol. 2020, 48, 89–96. [Google Scholar]
  23. Ju, J.F.; Li, Q.S.; Xu, J.L.; Li, J.J. Permeability reduction test of CaCO3/Fe(OH)3 repairing single fractured rock specimens. J. Min. Saf. Eng. 2024, 41, 151–159. [Google Scholar]
  24. Ju, J.F.; Li, Q.S.; Xu, J.L.; Cao, Z.G.; Tian, Y. Experimental investigations on the effect of CaCO3 precipitation on permeability reduction in single brown sandstone fracture. Rock Mech. Rock Eng. 2023, 56, 6647–6666. [Google Scholar] [CrossRef]
  25. Du, C.; Zuo, R.; Chen, M.H.; Wang, J.S.; Liu, X.; Liu, L.; Lin, Y.H. Influence of colloidal Fe(OH)3 on the adsorption characteristics of strontium in porous media from a candidate high-level radioactive waste geological disposal site. Environ. Pollut. 2020, 260, 113997. [Google Scholar] [CrossRef]
Figure 1. Single fractured rock specimen.
Applsci 14 10617 g001
Figure 2. Experimental device.
Applsci 14 10617 g002
Figure 3. Deposition morphology of chemical precipitation in fracture surfaces after different experimental schemes: (a) Scheme 1, single CaCO3 precipitate; (b) Scheme 2, mixed precipitate, M = 1:4; (c) Scheme 3, mixed precipitate, M = 1:1.9; (d) Scheme 4, mixed precipitate, M = 1:1; (e) Scheme 5, single Fe(OH)3 precipitate.
Applsci 14 10617 g003
Figure 4. Pressure lifting (PL)and permeability reduction (PR) curves of the 5 schemes. Note: Considering the large range of orders of magnitude in the absolute permeability data, the vertical coordinate of the PR curves in the figure is expressed on a logarithmic scale, and that of the local zoom is expressed on an arithmetic scale.
Applsci 14 10617 g004
Figure 5. Duration distribution of the three permeability change trends corresponding to each scheme.
Applsci 14 10617 g005
Figure 6. SEM test photos (magnified 2500 times) of mixed precipitate on the fracture surface corresponding to Schemes 2, 3, and 4: (a) Scheme 2, mixed precipitate, M = 1:4; (b) Scheme 3, mixed precipitate, M = 1:1.9; (c) Scheme 4, mixed precipitate, M = 1:1.
Applsci 14 10617 g006
Figure 7. Comparison of PR curves between the added schemes and their corresponding schemes: (a) comparison between added Scheme 1 and Schemes 1 and 2; (b) comparison between added Scheme 2 and Schemes 1 and 4; (c) comparison between added Scheme 3 and Schemes 1 and 5. Note: Similar to Figure 4, the vertical coordinates in the figures are all expressed on a logarithmic scale. To better compare the curves, not all of the longer-span curves in Schemes 4 and 5 are presented.
Applsci 14 10617 g007
Figure 8. Comparison of PR curves between Stage II of the added schemes and Scheme 1.
Applsci 14 10617 g008
Table 1. Preparation of aqueous solutions for different experimental schemes.
Water SolutionSimulated Groundwater
(Na2CO3 Solution)
Repair Reagent
Scheme 1Scheme 2Scheme 3Scheme 4Scheme 5
Single CaCl2
Solution
FeCl2 + CaCl2
Solution
FeCl2 + CaCl2
Solution
FeCl2 + CaCl2
Solution
Single FeCl2
Solution
Ion concentration
(mg/L)
CO32−Ca2+Fe2+Ca2+Fe2+Ca2+Fe2+Ca2+Fe2+
500333.393.4266.4163.5216.5233.3166.5466.6
Molar ratio of Fe to Ca M = 1:4M = 1:1.9M = 1:1
Disclaimer/Publisher’s Note: The statements, opinions and data contained in all publications are solely those of the individual author(s) and contributor(s) and not of MDPI and/or the editor(s). MDPI and/or the editor(s) disclaim responsibility for any injury to people or property resulting from any ideas, methods, instructions or products referred to in the content.

