Article

Multilevel Evaluation Model of Electric Power Steering System Based on Improved Combination Weighting and Cloud Theory

1
College of Mechanical and Electronic Engineering, Northwest A&F University, Xianyang 712100, China
2
School of Electronic Science and Engineering, Faculty of Electronic and Information Engineering, Xi’an Jiaotong University, Xi’an 710049, China
*
Author to whom correspondence should be addressed.
Appl. Sci. 2024, 14(3), 1043; https://doi.org/10.3390/app14031043
Submission received: 11 December 2023 / Revised: 18 January 2024 / Accepted: 21 January 2024 / Published: 25 January 2024

Abstract

:
In order to rapidly evaluate the working performance of an Electric Power Steering System (EPS) and clarify the key indicators that affect its working condition, targeted maintenance measures can be taken to improve the vehicle’s handling, stability, and safety. This paper took an EPS system as the research object and decomposed it into five working indicators: steering lightness, steering returnability, steering wheel mid-zone performance, steering wheel vibration, and power assist characteristics. On this basis, the subjective exponential extension Analytic Hierarchy Process (AHP) was combined with the objective improved entropy weight method, and then the combination weighting method of game theory was employed to ensure that the results were reliable. At the same time, a cloud model was introduced to understand the actual situation of each indicator by using cloud parameters and multi-level feedback results. According to the principle of maximum membership and the comprehensive evaluation method, the EPS performance evaluation result was obtained. The results showed that the comprehensive cloud parameter of EPS was U (74.31, 6.08, 0.50), which indicated that its working performance was in good condition, with some minor damage that did not affect its normal use; however, attention should be paid to the maintenance and repair of vulnerable components to ensure the handling, stability, and safety of the vehicle.

1. Introduction

The electric power steering system (EPS) is a new type of power steering device that uses an electric motor as a power source. It has been rapidly developed and is gradually replacing traditional hydraulic or electro-hydraulic power steering units. Currently, the working performance of EPS’s working performance is mostly evaluated and tested through experiments [1,2,3]. In these studies, if scholars want to analyze a certain characteristic of the EPS system, they need to finely model the parts, control multiple parameters via the orthogonal method, and carry out repeated simulation analyses to obtain the results; this requires the operator to have certain professional abilities and the computer to have certain simulation capacities and operating conditions. In addition, if they want to obtain the performance of the EPS through actual tests, they need to accurately calculate the vehicle design parameters, steering system design parameters, steering resistance parameters, deceleration ratio, motor selection, and other necessary parameters; this is also a complex, multi-step, and demanding process. Therefore, a combination of different mathematical methods can be utilized to rapidly evaluate the EPS, clarify the key performance indicators affecting its operation, and improve the maneuverability, stability, and safety of the vehicle through targeted maintenance measures.
Many scholars have realized that mathematical methods have excellent accuracy and can rapidly perform objective evaluation. Xi et al. first used the entropy weight method (EWM) in the analytic hierarchy process to optimize and determine the weights of each index and identified the main factors affecting municipal solid waste to be classified. Then, an artificial neural network method based on scanning optimization and machine learning was established to predict the missing indicators, which improved the prediction accuracy of the MSW sorting ability [4]. Spanidis et al. introduced a multi-criterion method. Firstly, the analytic hierarchy process (AHP) was used to determine the relative weights of risk factors, the abstract factors were quantified, and then the TOPSIS theory was used to rank different schemes based on the similarity preference of the ideal solution of low-risk methods; this was performed to evaluate the recovery scheme and select the optimal scheme of mining projects [5]. Shen et al. presented a cloud model-based approach to evaluating the risk status of excavation that involved three phases: multi-source information collection, the construction of the benchmark cloud model (BCM) and identified cloud model (ICM), and risk level determination. In this phase, two-stage weight determination was developed to aggregate the multi-source information [6].
Ruan et al. first calculated the weight of each evaluation parameter by using the CRITIC objective weight method and established a multidimensional normal cloud model to obtain the membership degree of water samples belonging to each water quality grade. Then, the MCM-LEM model was compared with the single-factor evaluation method, the Nemerow index method, and the fuzzy comprehensive evaluation method; the scientific and objective evaluation results for this model were then verified [7]. Liu and Wang first established the multi-dimensional evaluation index system and evaluation model. Then, by integrating the normalization process and the improved analytic hierarchy process (AHP), the forward cloud generator was used to obtain the freezing pipe fracture evaluation grade cloud and the comprehensive evaluation cloud; then, the level of risk with regard to freezing pipe fracture was obtained according to the maximum membership principle and the comprehensive evaluation method [8].
When determining the weight of the index, these evaluation methods are mostly based on a single subjective or objective means, which leads to the professional understanding of the scorer and the unexpected situation of the experiment having a greater level of interference in the quantization weight; it is also easy for bias to affect the final quantization result and the scorer to have an inaccurate grasp of the main and secondary factors, thus affecting the accuracy of the subsequent evaluation. Based on the above considerations, this paper simultaneously uses the subjective analytic hierarchy process (AHP) and objective entropy weight method to calculate the corresponding weights and then uses the game theory method to combine these two weights linearly to ensure the scientific and practical comprehensive weight of factors, minimize all kinds of sudden and subjective interference in the evaluation process, and improve the accuracy and reliability of the results obtained by the multi-level evaluation system. Therefore, to comprehensively consider multi-level factors and the ability of their functional systems to affect the performance of the EPS, it is necessary to integrate uncertainties such as the fuzziness and randomness among these factors, fully combine the subjective judgment of the supervisor with the objective assessment results, and clarify the methods employed to focus and improve the system’s maintenance.
This paper takes an EPS system as the research object and conducts a multi-level decomposition of five working indicators; these include steering lightness, steering correctness, steering wheel middle area performance, steering wheel vibration, and assist characteristics. On this basis, the exponential extension AHP method is combined with the improved entropy weight method to comprehensively assign weights to the subjective and objective results when assigning comprehensive indicators. The combination weighting method of game theory is used to ensure the reliability of the results. At the same time, a cloud model is introduced, so cloud parameters and multi-level feedback results are used to understand the actual situation of each indicator. The evaluation results regarding the working performance of the EPS system are obtained through a cloud map comparison, which could provide a reference method for evaluating the working performance of similar EPS systems in the same environment.

2. Establishment of EPS Performance Evaluation System

2.1. Establishment Principle of Evaluation System

When establishing an evaluation index system for an EPS based on its inherent characteristics and usage environment, the following principles should be adhered to:
(1)
Objectivity
The establishment of an evaluation system needs to ensure the scientific validity of the selected indicators, and the authenticity and rigor of the indicator acquisition process. It should scientifically and comprehensively reflect the various factors that influence the design and usage process of the EPS, while also avoiding the interference of unnecessary indicators. Ultimately, it should construct an orderly, efficient, and systematic hierarchical structure that strives for the objectivity of research results.
(2)
Complementarity
Evaluating the working characteristics and usage efficiency of an EPS can be gradually layered, from the general to the specific, by selecting the overall direction first and then gradually delving into the details, thus forming an organized and hierarchical structure. The levels should be divided based on the characteristics of the matter and their relationships, and each level should have specific factors, both interdependent and interrelated. At the same time, each level’s system should complement one another and cooperate to form a whole.
(3)
Completeness
When determining the various level factors in the EPS evaluation system, no factors that affect the performance of the EPS should be missed. At the same time, the division of the level factors should not be too fine, so as to prevent a situation in which there is a heavy workload and excessive and ineffective evaluation.
(4)
Stability
When the system is established, the number and structure of levels should be changed as little as possible. If adjustments or improvements to the level system are necessary, they should be carefully considered, evaluated, and adjusted; this is to prevent the instability caused by frequent changes from leading to biased or erroneous results.

2.2. Establishment of Multi-Level Evaluation Index System

The process of evaluating the working performance of an EPS is a complex and fuzzy process involving multi-factor coupling and multi-level response. The working characteristics of an EPS and its utilization efficiency are influenced by various factors from different aspects. Therefore, to clearly define the evaluation level of the working performance of an EPS, it is necessary to carefully divide the working performance and infer the performance level of the target layer EPS through the performance status of each influencing factor.
In conclusion, this paper refers to the performance requirements in the “Basic Requirements for Automotive Steering Systems” (GB 17675-2021) [9] and “Technical Conditions for the Safe Operation of Motor Vehicles” (GB 7258-2017) [10] standards, comprehensively considers various factors that affect the overall working characteristics and utilization efficiency of an EPS, selects various indicators to evaluate the EPS based on artificial testing, non-destructive testing, and other monitoring behaviors, and establishes a multi-level evaluation system for the EPS based on the principles described above, as shown in Figure 1.
In Figure 1, the comment layer, target layer, factor layer, and state layer together constitute the system used to evaluate the performance of the EPS. The comment layer (EXCELLENT V1, GOOD V2, FAIR V3, POOR V4) represents the quality of the EPS performance. Evaluating and classifying its working characteristics and utilization efficiency can provide a basis for the maintenance measures undertaken by technicians and clarify the maintenance priorities.
The target layer is the ultimate goal of the system, which is an EPS performance evaluation (U). The factor layer categorizes the performance states of the EPS during operation and includes five characteristics. Steering portability (A) refers to the ability to turn the steering wheel lightly. Steering returnability (B) refers to the ability of the vehicle to automatically return to the straight direction after turning. The steering wheel middle area performance (C) refers to the performance of the steering wheel in the middle position. Steering wheel vibration (D) indicates the presence of vibration or abnormal steering wheel movement. Assisting characteristics (E) refer to the support of auxiliary systems for steering, such as electric power steering systems.
The state layer further analyzes the factor layer. For example, the ease of steering may be influenced by certain factors that lead to changes; these include the steering wheel diameter (A1), the maximum steering force of the steering wheel (A2), the steering wheel maximum steering (A3), vehicle speed (A4), and the overall vehicle mass (A5). This establishes a multi-level evaluation system for EPS performance.

3. Combination Weighting Based on Improved AHP–Entropy Method

3.1. Exponential Extension AHP

The analytic hierarchy process (AHP) is a systematic, hierarchical method that combines qualitative and quantitative aspects to determine subjective weights. However, considering the subjectivity, complexity in the calculation, and difficulty of reflecting the ambiguity of experts’ thinking in the traditional AHP, scholars have proposed some methods to improve this process; these include a five-point scale, a nine-point scale, exponential scale, and interval scale [11].
The exponential scale method is developed based on the nine-point scale method, and it has good preservation properties. It can accurately and objectively reflect the original ordinal relationship of each comparison object and applies to ranking problems under a single criterion and multiple criteria, as specifically described in Table 1.
Based on the existing research, it is known that the index scale method in AHP can achieve a higher accuracy during the determination of weights, while the interval scale method can expand the scale value from point to space, thus quantifying the fuzziness of expert evaluation thinking. Therefore, this article comprehensively applies these two improvement methods to ensure the scientific and rational allocation of indicators. The specific steps are as follows [12,13]:
(1)
Construct the judgment matrix of the exponential interval type
The EPS evaluation system is divided by hierarchy, and many relevant experts are invited to score and judge the importance of indicators at the same level according to Table 1. Then, the relative scale between two factors in the nth layer is a i j , and a i j × a j i = 1. Finally, with reference to the expert opinions, the extension interval ( a i j − λ, a i j  + λ) formed by a certain coefficient of variation λ is added or subtracted, that is, the judgment matrix is A = (aij)m×n. The specific expression is as follows:
A = a 11 a 1 n a m 1 a m n m × n = a 11 , a 11 + a 1 n , a 1 n + a m 1 , a m 1 + a m n , a m n + m × n
aij = ( a i j , a i j + ) is the number of extensible intervals, which are expressed as the upper and lower ends of the column j element in the first row i of the judgment matrix. Therefore, judgment matrix A = <A, A+> of the nth layer, upper and lower endpoint matrix is expressed as A = [ a i j ] m×n and A+ = [ a i j + ] m×n.
(2)
Consistency check
According to A = [ a i j ] m×n and A+ = [ a i j + ] m×n, the values of k and m are solved by Equation (2).
k = j = 1 n 1 / i = 1 n a i j + m = j = 1 n 1 / i = 1 n a i j
If 0  k 1  m, the consistency of the extension judgment matrix meets the requirements. Otherwise, the judgment matrix needs to be corrected or experts need to be invited again until the requirements are met.
(3)
Calculate the weight vector
After determining the final judgment matrix A = <A, A+>, the normalized eigenvector z and z+ corresponding to the maximum eigenvector A and A+ with positive components can be calculated. The eigenvector of the extension judgment matrix can be solved using the root method. Thus, the weight vector is as follows:
W = W 1 , W 2 , , W x y T = k z , m z +
where Wxy is the extension interval weight vector of the y factor in the x layer to a factor in the upper layer.
(4)
Single-layer sorting computation of the hierarchical system
The ith factor in the sth layer has interval number W i x = < W i s , W i s + > . The jth factor in the xth layer has interval number W j x = < W j s , W j s + > , i, j = 1, 2, 3, … n, ij. Thus, the significance of these two intervals is calculated as follows:
p i s = V W i s W j s = 2 W i s + W j s W j s + W j s + W i s + W i s
p i s = ( p 1 s , p 2 s , , p n s s ) T can be obtained after normalization, which represents the weight vector of ns factors in the sth layer to the single layer of a factor in the previous layer.

3.2. Improved Entropy Weight Method

In 1948, C. E. Shannon introduced the concept of entropy in the second law of thermodynamics into the field of informatics, where entropy was used to measure the amount of information widely used in various fields. The calculation formula for information entropy H is as follows:
H = i = 1 N p x ln p x
where p(x) is the probability of the event x, and N is the total number of samples.
Information entropy usually indicates the degree of uncertainty in information. If the information entropy of a parameter is small, the degree of variation in the parameter value is large. This parameter may contain more information and can play a more important role in the data analysis. Therefore, in the comprehensive evaluation, the weights of different parameters can be quantified by calculating entropy. In the traditional information entropy weight method, the information entropy weight of the jth parameter w i 0 using parameter entropy can be calculated as follows [14]:
w j 0 = 1 H j j = 1 n 1 H j
where w1 represents the weight index; this is calculated using Equation (8).
w j 1 = 1 + H ¯ H j k = 1 , H k 1 n ( 1 + H ¯ H k )
where H ¯ represents the average entropy value for each attribute not equal to 1.

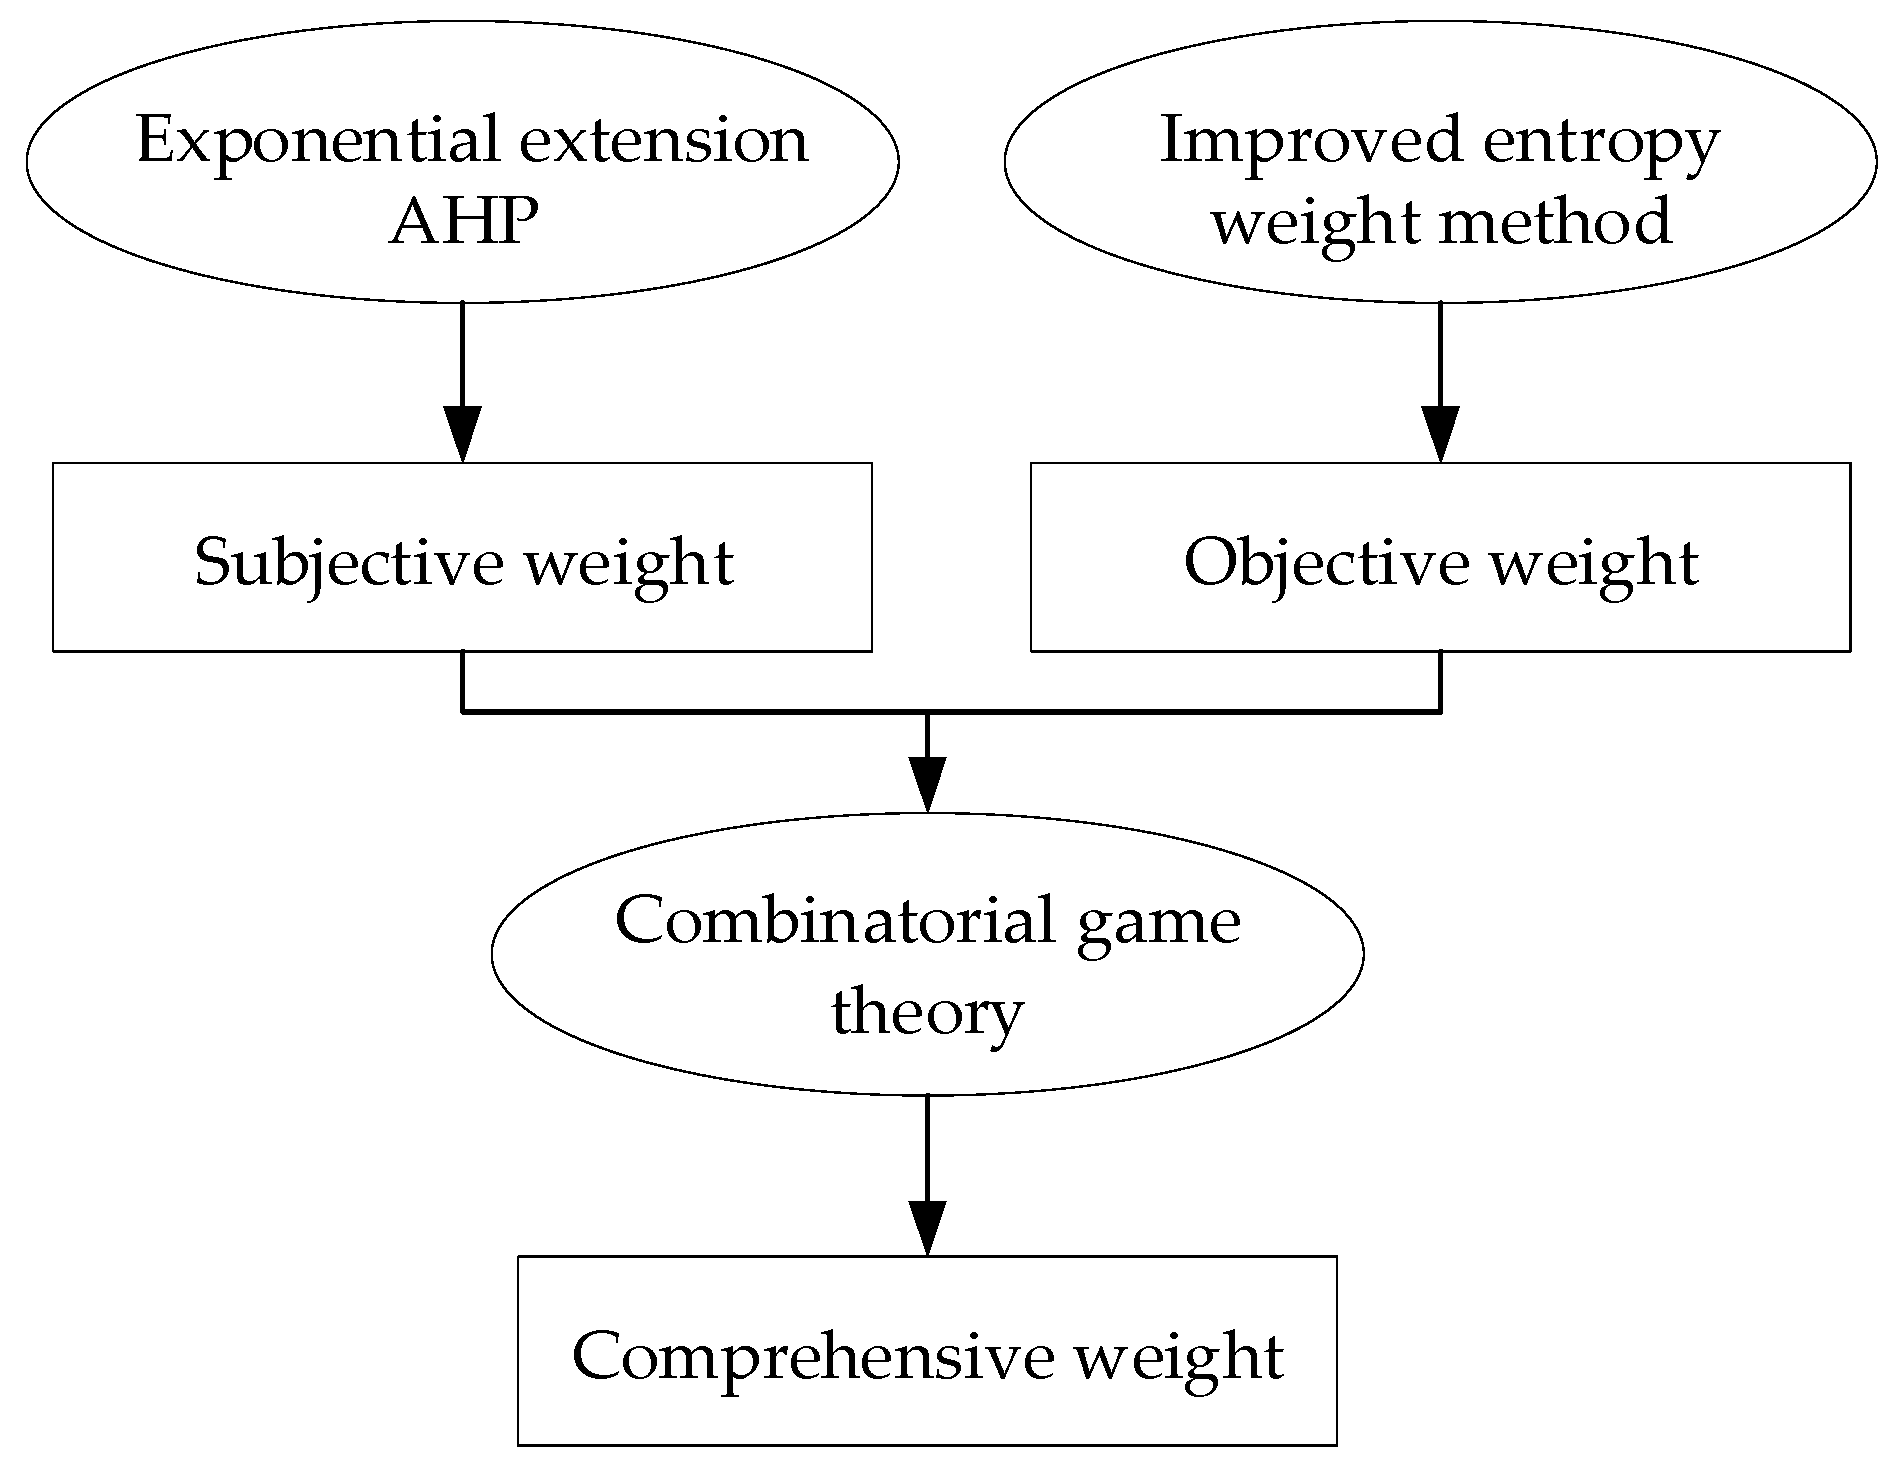
3.3. Combinatorial Game Theory

The basic aim of game theory is to find the best result that considers both subjective and objective weights by adjusting the conflicts between different weights, thus achieving Nash equilibrium. Therefore, the comprehensive weight calculation flowchart of each factor is shown in Figure 2. This method not only reduces the subjective arbitrariness but also keeps the result close to the fact; this makes the weight values of indicators more reasonable [15].
The steps undertaken in combinatorial game theory with weighted assignments are as follows [16]:
(1)
The weights obtained by the exponential extension AHP and the weights determined by the improved entropy weight method are taken as the basic weights for calculation; then, the weight set obtained using the kth method is Wk = {w1, w2, …, wn}(k = 1,2, …, n), where n is the number of evaluation indicators and L is the number of weight methods.
Assuming that α = {α1, α2} is a linear combination coefficient, then any linear combination of these vectors is as follows:
W = α 1 W 1 T + α 2 W 2 T
(2)
According to the Nash equilibrium theory in game theory, the two linear combination coefficients in Equation (8) are optimized to find the value that minimizes their shortcomings. In order to obtain the optimal value of weight W, the objective function can be determined as follows:
min k = 1 L α k W k T W k 2
(3)
According to the differential properties of the matrix, the optimal linear equations equivalent to Equation (9) can be obtained as follows:
W 1 W 1 T W 1 W 2 T W 2 W 1 T W 2 W 2 T α 1 α 2 = W 1 W 1 T W 2 W 2 T
(4)
The optimized combination coefficients α1 and α2 are calculated and normalized from Equation (11):
α 1 * = α 1 / ( α 1 + α 2 ) α 2 * = α 2 / ( α 1 + α 2 )
(5)
Finally, the comprehensive weight W based on the combination of game theory is determined as follows:
W = α 1 * W T + α 2 * W T

4. Multi-Level Evaluation Model Based on Cloud Theory

4.1. Basic Theory of Cloud Model

Cloud theory can effectively portray the randomness and uncertainty of various factors in the system, establish the interrelationship between qualitative concepts and quantitative values, and then reveal the intrinsic relationship between randomness and chaos in the system under study [17]. Therefore, this paper utilizes a cloud theory model to conduct a multi-level assessment of the EPS work performance.
Each cloud droplet is characterized by the unique expectation (Ex), entropy (En), and hyper-entropy (He) of a point, namely C(Ex, En, He). Among them, Ex represents the central location of the cloud droplet, which refers to the central value of the weight and the membership degree of each level factor in the evaluation system. En describes the fuzziness and randomness of cloud droplets, which refers to the fuzziness and dispersion of the cloud droplet distribution and reflects the uncertainty of the factor values of each layer in the system. He is the entropy of entropy and is used to describe the cohesiveness of the droplet; this refers to the uncertainty of entropy and reflects the deviation of the values of various hierarchical factors from the center value.
A cloud generator is utilized for the realization of a transformation between qualitative concepts and quantitative values. According to the direction of transformation, this is divided into a forward cloud generator and a reverse cloud generator [18]. The forward cloud generator transforms qualitative into quantitative, where cloud parameters (Ex, En, He) are used to generate cloud droplets (xi, yi). The reverse cloud generator performs the opposite process, transforming cloud droplets (xi, yi) into cloud parameters (Ex, En, He), as shown in Figure 3.

4.2. Cloud Theory Evaluation Model of EPS Performance

(1)
Constructing a comment set cloud model
A comment set cloud model is established to quantitatively transform and analyze the working state of the EPS, so a positive cloud generator is adopted. Firstly, by consulting expert opinions, the evaluation interval is divided and based on Equation (13), three characteristic numerical expectations, namely ExV, EnV, and HeV, of the EPS working performance comment set are determined [19].
E x i V = ( x i max + x i min ) 2 E n i V = x i max x i min 2 8 ln 2 H e V = k
where x i max and x i min represent the upper and lower boundary values of EPS performance in the comment set, respectively; the performance of the working state is commonly used to determine the classification. E x i V is the expectation of the comment set corresponding to the security level in the normal cloud model. E n i V is the entropy of the comment set corresponding to the security level in the normal cloud model. k is a constant that is often determined by an empirical value.
(2)
Build an indicator cloud model
Based on the scoring results provided by experts regarding the actual situation of the project, the influence weights of various factors in the multi-level system are obtained via the improved combinatorial weighting method of the AHP–entropy weight method. Then, the cloud parameters of each index are obtained by using the inverse cloud generator, and the specific calculation method is shown in Equation (14).
E x j = 1 n × i = 1 n x i j E n j = π 2 × 1 n × i = 1 n x i j E x j H e j = 1 n 1 × i = 1 n ( x i j x ¯ ) 2 E n j 2
(3)
Building comprehensive cloud parameters of the system
Based on the above-weighted processing index cloud parameters, the cloud parameters of the entire EPS working state are summarized [20], and the specific calculation method is shown in Equation (15).
E x = i = 1 n E x j W j E n = j = 1 n W j 2 i = 1 n W j 2 E n j H e j = i = 1 n W j 2 i = 1 n W j 2 H e j
(4)
Drawing and comparing cloud pictures.
According to the above formula, the membership cloud model U (ExV, EnV, HeV) representing the working state of the EPS is calculated and sorted out.
Then, using MATLAB R2023a software, a cloud map of the comment set and a cloud map of the evaluation of the EPS working state are drawn. Finally, the membership degree of the EPS working state is determined according to the maximum membership principle and comprehensive evaluation method.
Here, the selection of the maximum membership principle is mainly based on the meaning of cloud parameters (Ex, En, He). Once the cloud parameters of the working performance of the target factor EPS are determined, they can be determined according to the values and meanings of Ex, En, and He. That is, Ex represents the central location of the cloud droplet and the central value of the membership degree of the target factor. En represents the difference in expert scores. The smaller the difference, the more concentrated the score data, and the smaller the value of En. He is used to describe the condensation of cloud droplets, reflecting the deviation between the factor value and the central value.
Therefore, if most of the cloud droplets reflecting the working performance of the EPS are distributed in a certain interval, the working level of the EPS system can be directly determined. However, if the cloud droplets are at the boundary of the interval, it is necessary to use ultrasonic detection methods to further clarify the working state of the system and the corresponding maintenance means.

5. Case Analysis

The EPS is based on the traditional mechanical steering system; according to the torque signal on the steering wheel and the driving speed signal of the car, the electronic control device is used to make the motor generate auxiliary power with a corresponding magnitude and direction to assist the driver with steering [21]. Compared with the traditional hydraulic power steering system, the EPS has several advantages: it saves energy, aids in environmental protection, has convenient assembly, high efficiency, a good feeling on the road, and good reversion, and has excellent application and development prospects [22]. This paper takes the EPS system presented in reference [23] as the research object analyzes its performance, and determines its grade. A diagram of this EPS’s structure is shown in Figure 4.
An EPS in good working condition could easily provide different power-assisted motor effects at different speeds, thus ensuring that the car is flexible at low speeds and reliable at high speeds. However, the working state of an EPS is closely related to its own steering portability, steering rightness, steering wheel middle area performance, steering wheel vibration, power-assisted characteristics, and the subordinate factors of each performance, and many factors that influence and interfere with each other. Therefore, it is necessary to fully evaluate the working performance of the EPS, determine its shortcomings in time, and perform the corresponding maintenance measures to ensure that the EPS system is stable and in good condition.

5.1. EPS Performance Evaluation under Multi-Level System

5.1.1. Evaluation of Cloud Model of EPS Working State

This section refers to the testing methods used, and the performance requirements outlined in the standards comprehensively considers various factors that affect the overall working characteristics and efficiency of the EPS, and evaluates and scores the working status of the EPS. This is to guide the maintenance and repair of the EPS system. The parameters are shown in Table 2.
Then, Equation (14) is used to calculate the parameters of the cloud model corresponding to each level, and the specific results are shown in Table 2. Using the forward cloud generator, the evaluation layer of the EPS multi-level evaluation system is simulated using Matlab, as shown in Figure 5 (blue).

5.1.2. Combined Weight of Each Factor in EPS System

In order to consult the relevant structural design data and operation parameters, nine industry experts, designers, and maintenance personnel were hired. First, authoritative experts were invited to judge the importance of each indicator according to the index scaling criteria outlined in Table 1, and the subjective weight of each indicator was calculated according to Equations (1)–(4). Then, the experts scored the actual situation of each indicator of the project, and the objective weight was calculated according to Equations (7) and (8).
According to Equations (11) and (12), the linear combination coefficients α1 = 0.524 and α2 = 0.476 of the factor layers, as well as α1 = 0.308 and α2 = 0.692 of the state layer, are obtained. Then, the combination weight value of each index could be obtained, as shown in Table 3 and Table 4.
As can be seen from Table 3 and Table 4, steering portability (A) and steering returnability (B) have the most obvious influence on the working performance of the EPS, followed by the steering wheel middle area performance (C); in addition, the assisting characteristic (E) is smaller than that of the steering wheel vibration (D).
Steering portability (A) is a key index. On the one hand, good steering portability can make the vehicle easier to drive and provide a better handling performance, which is very important for daily driving and emergency handling. It can help drivers cope better with emergencies and improve the safety of driving. On the other hand, it can also reduce the driver’s driving fatigue and provide a more pleasant driving experience. At the same time, it can also improve the brand image of automobile manufacturers and increase the trust of consumers. In the subordinate hierarchy of A, vehicle speed (A4) has the greatest degree of influence, and the other four factors have the same degree of influence; as such, this parameter should be paid more attention to when evaluating the working performance of the EPS.
Steering returnability (B) refers to the ability of the vehicle to automatically return to the straight-line driving state after steering control, which is also important for the handling, stability, and safety of the vehicle. A good steering performance ensures that the driver can easily restore the vehicle to a straight line after steering, reducing the risk of driver fatigue and difficult handling. Usually, the steering alignment performance of vehicles can be improved by adjusting the settings of the suspension system, adjusting the parameters of the steering system, selecting the appropriate tire type and specifications, and equipping the system with an electronic auxiliary system. Moreover, the regular maintenance of the steering system and suspension system of vehicles is the key to maintaining the alignment performance. In the subordinate hierarchy of B, a slight rotation at high speeds (B3) and slow normal steering (B4) are more obvious, and these two performance indicators should therefore be paid more attention to.
Similarly, lateral acceleration (C1) is associated with the steering wheel middle area performance (C), the mechanical mechanism design (E2) is associated with the assisting characteristic (E), and the roughness of the road surface (D2) is associated with the steering wheel vibration (D); these are also important performance indicators that need more attention.

5.1.3. Cloud Parameters of Various Factors in EPS System

In the EPS system, the principle of a reverse cloud generator is used to obtain the cloud parameters. That is, the scores of nine experts regarding the actual work of an EPS are substituted into Equation (14), and the cloud parameters of each index in Figure 1 are obtained. The specific values are shown in Table 3 and Table 4.
As can be seen from Table 3 and Table 4, the Ex of the performance indicators at the factor level exceeds 70 points. According to the grading of the performance evaluation of the EPS system, we can determine that most indicators are in a good stage. However, the Ex of the steering wheel angle (C2) and torque fluctuation at low speeds (D3) is lower, which indicates that the good working condition of the EPS system cannot be satisfied; this affects the comfort and stability of the vehicle. On the whole, the Ex of the working indicators of the state layer is between 60 and 80, which indicates that the system is in good working condition.
In addition, the En of the working index of the EPS system’s factor layer is basically between 5 and 6, which shows that the scores of the nine experts are relatively concentrated and that the scoring results have good data adhesion. However, the En of performance C and D of the steering wheel is large, and the evaluation of appraisers is random and the score range is large. Therefore, it is necessary to conduct an experimental review of these two performances.

5.2. Comprehensive Evaluation

The weights and cloud parameters of each index in Table 3 are synthesized based on Equation (15). Finally, the comprehensive evaluation cloud model parameters of the EPS system performance are U (ExV, EnV, HeV) = U (74.31, 6.08, 0.96). According to the maximum membership principle and comprehensive evaluation method, the cloud parameters are compared with the comment sets (V1, V2, V3, V4) by using Matlab; the results are shown in Figure 5 (orange).
Figure 5 shows the comprehensive evaluation results regarding the performance of the EPS. The evaluation cloud drops (orange) representing the working performance of the EPS are relatively concentrated, En and He are reliable, and the comprehensive evaluation results are efficient. The distribution position of the orange cloud droplets is between the good and excellent comment set, and the overall situation is closer to good, which is consistent with the conclusion produced by the experts’ field investigation.
The result shows that there are some minor damages to the EPS system that do not affect normal use. However, some parts that are easily damaged should be paid special attention to; this is in order to prevent the defects of minor parts from interfering with the normal working state of the whole EPS system, which would affect the handling, stability, and safety of the vehicle, and strive to achieve the best driving effect with minimum loss.

5.3. Method Demonstration

In order to verify the accuracy of the evaluation method in this paper, a comparison is made with reference [24] at the end of the case analysis. Reference [24] uses the fuzzy evaluation method improved by cloud theory to comprehensively evaluate the target. The EPS comprehensive cloud parameter obtained in this paper is U (ExV, EnV, HeV) = U (74.31, 6.08, 0.96), which indicates that the EPS’s overall situation is closer to good; however, the calculation result in reference [24] is U (ExV, EnV, HeV) = U (61.44, 7.68, 1.98) and the results are shown in Figure 5 (green), which indicates that the EPS cannot reach the GOOD level and needs to be properly disassembled for maintenance.
By comparing the two results to the test results presented in reference [23], it is clear that the conclusion of this paper is more in line with reality, and EPS has a good working performance and the loss that occurs does not affect the subsequent driving experience. The calculation results of reference [24] are different from the actual situation, mainly because it only uses fuzzy evaluation to determine the weight of factors; this has a strong subjective influence and induces obvious and sudden state interference in some components, which easily causes certain deviations in the final comprehensive evaluation results.
In addition, among the EPS comprehensive cloud parameters finally obtained, the values of En and He in this paper are both smaller than those in reference [24]. This shows that this paper uses game theory to combine subjective weights and objective weights to obtain comprehensive weights. In the process of performing a multi-level comprehensive evaluation of the target, forward and reverse cloud processors based on cloud theory can be used to comprehensively consider the uncertainty and fuzziness in the random combination of various factors according to the actual situation, which further ensures the accuracy and reliability of the evaluation method presented in this paper.

6. Conclusions and Discussion

(1)
This paper combines an improved AHP method with an improved entropy weight method and uses game theory to ensure the reliability of the index weighting. On this basis, a cloud model is introduced, the actual situation of each index is reflected by the cloud parameters, and the evaluation results regarding the EPS performance are visually displayed by cloud images. The cloud model, which is based on the combination weighting method, not only gives full play to the advantages of the subjective and objective weighting method but can also directly reflect the evaluation grade of the EPS’s performance and the fuzziness of the results; this improves the scientific evaluation of the multi-level system.
(2)
Through the comprehensive evaluation of the EPS system, it is concluded that the parameters of the comprehensive cloud model of the EPS are U (74.31, 6.08, 0.96). The results of the cloud model show that the EPS is in good working condition and that the main parts are less defective. However, the maintenance and repair of the parts that are easily damaged should be paid special attention in order to ensure the handling, stability, and safety of the vehicle.
(3)
This paper combines the subjective and objective weights of multiple factors using combination weighting in game theory. When this method is applied in a multi-level EPS evaluation system, the scientific and practical capacity of quantitative weights can be guaranteed at the same time. However, when cloud theory is applied to evaluate a multi-level system, both the weighted cloud model and the subordinated cloud model in this paper are developed based on the normal cloud model, but the normal cloud model cannot cover all the characteristics of the system. In the subsequent evaluation, different cloud model types should be adopted to produce an overall evaluation of the working environment of the EPS. Thus, more accurate and reasonable results can be obtained.

Author Contributions

Conceptualization, Z.D. and A.D.; methodology, Z.D. and A.D.; software, Z.D.; validation, A.D., formal analysis, C.Y.; investigation, J.T.; resources, C.Y. and J.T.; data curation, Z.D. and Y.C.; writing—original draft preparation, Z.D. and A.D.; writing—review and editing, Z.D. and Y.C.; visualization, Z.D.; supervision, Y.C.; project administration, Y.C.; funding acquisition, Y.C. All authors have read and agreed to the published version of the manuscript.

Funding

This research was funded by the Key R&D projects in Shaanxi Province (2023-YBNY-241).

Institutional Review Board Statement

Not applicable.

Informed Consent Statement

Informed consent was obtained from all subjects involved in the study.

Data Availability Statement

The data presented in this study are available on request from the corresponding author. The data are not publicly available due to restrictions on privacy.

Conflicts of Interest

The authors declare no conflicts of interest.

References

  1. Júlio, R.C.; Cardoso, G.; Silva, V.B.; Oliveira, A.L.; Duarte Ricciotti, A.C.; Oliveira, P.T.C. Paraconsistent analysis network for uncertainties treatment in electric power system fault section estimation. Int. J. Electr. Power Energy Syst. 2022, 134, 107317. [Google Scholar]
  2. Zhang, H.; Lv, Y.; Guo, J. Stability modelling and control algorithm of electric vehicle power steering. Int. J. Heavy Veh. Syst. 2022, 29, 596–613. [Google Scholar] [CrossRef]
  3. Li, J. Matching design and performance analysis of automotive electric power steering system. J. Mech. Strength 2020, 42, 988–993. [Google Scholar]
  4. Xi, H.; Li, Z.; Han, J.; Shen, D.; Li, N.; Long, Y.; Chen, Z.; Xu, L.; Zhang, X.; Niu, D.; et al. Evaluating the capability of municipal solid waste separation in china based on AHP-EWM and BP neural network. Waste Manag. 2022, 139, 208–216. [Google Scholar] [CrossRef]
  5. Spanidis, P.M.; Roumpos, C.; Pavloudakis, F. A multi-criteria approach for the evaluation of low risk restoration projects in continuous surface lignite mines. Energies 2020, 13, 2179. [Google Scholar] [CrossRef]
  6. Shen, S.L.; Lin, S.S.; Zhou, A. A Cloud model-based approach for risk analysis of excavation system. Reliab. Eng. Syst. Saf. 2023, 231, 108984. [Google Scholar] [CrossRef]
  7. Ruan, D.; Bian, J.; Wang, Q.; Wu, J.; Yu, Y.; Gu, Z. Application of modified Cloud model-level eigenvalue method in water quality evaluation. J. Hydrol. 2021, 603, 126980. [Google Scholar] [CrossRef]
  8. Liu, F.; Wang, Y. A novel method of risk assessment based on improved AHP-Cloud model for freezing pipe fracture. J. Intell. Fuzzy Syst. 2021, 41, 1887–1900. [Google Scholar] [CrossRef]
  9. GB 17675-2021; Basic Requirements for Automotive Steering Systems. Standards Press of China: Beijing, China, 2021.
  10. GB 7258-2017; Technical Conditions for the Safe Operation of Motor Vehicles. Standards Press of China: Beijing, China, 2017.
  11. Afroz, S.; Singh, R.; Nain, M.S.; Mishra, J.R.; Kumar, P.; Khan, S.A.; Iquebal, M.A. Swot-analytic hierarchy process (AHP) of agriclinics and agribusiness center (ACABC) scheme. Indian J. Agric. Sci. 2021, 91, 900–904. [Google Scholar] [CrossRef]
  12. Baig, M.R.I.; Shahfahad; Ahmad, I.A.; Tayyab, M.; Asgher, M.S.; Rahman, A. Coastal vulnerability mapping by integrating geospatial techniques and analytical hierarchy process (AHP) along the Vishakhapatnam Coastal Tract, andhra pradesh, India. J. Indian Soc. Remote Sens. 2021, 49, 215–231. [Google Scholar] [CrossRef]
  13. Cioca, L.I.; Breaz, R.E.; Racz, S.G. Selecting the safest CNC machining workshop using AHP and TOPSIS approaches. Safety 2021, 7, 27. [Google Scholar] [CrossRef]
  14. Hu, C.; Ma, Y.; Chen, T. Application on online process learning evaluation based on optimal discrete hopfield neural network and entropy weight TOPSIS method. Complexity 2021, 2021, 2857244. [Google Scholar] [CrossRef]
  15. Mcglothlin, J.W.; Erol, A.; Brodie, E.D.; Moore, A.J.; Jeremy, V.C. A synthesis of game theory and quantitative genetic models of social evolution. J. Hered. 2022, 113, 109–119. [Google Scholar] [PubMed]
  16. Sahin, B.; Yazir, D.; Soylu, A.; Yip, T.L. Improved fuzzy AHP based game-theoretic model for shipyard selection. Ocean Eng. 2021, 233, 109060. [Google Scholar] [CrossRef]
  17. Chen, Y.; Xie, S.; Tian, Z. Risk assessment of buried gas pipelines based on improved cloud-variable weight theory. Reliab. Eng. Syst. Saf. 2022, 221, 108374. [Google Scholar] [CrossRef]
  18. Gong, X.; Yu, C.; Min, L. A cloud theory-based multi-objective portfolio selection model with variable risk appetite. Expert Syst. Appl. 2021, 176, 114911. [Google Scholar] [CrossRef]
  19. Wu, Z.; Cui, Y.; Guo, Y. A case study of flood risk evaluation based on emergy theory and cloud model in Anyang Region, China. Water 2021, 13, 420. [Google Scholar] [CrossRef]
  20. Zhao, W.; Xiao, C.; Chai, Y.; Feng, X.; Fang, Z. Application of a new improved weighting method, ESO method combined with fuzzy synthetic method, in water quality evaluation of Chagan Lake. Water 2021, 13, 1424. [Google Scholar] [CrossRef]
  21. Song, C.X.; Xiao, F.; Jin, L.Q.; Song, S.X.; Li, J.H.; Peng, S.L. Study of modeling and simulation on driving force power steering for electric vehicle with in-wheel-motor-drive. Appl. Mech. Mater. 2013, 397–400, 511–516. [Google Scholar] [CrossRef]
  22. Arifin, B.; Suprapto, B.Y.; Prasetyowati, S.A.D.; Nawawi, Z. Steering Control in Electric Power Steering Autonomous Vehicle Using Type-2 Fuzzy Logic Control and PI Control. World Electr. Veh. J. 2022, 13, 53. [Google Scholar] [CrossRef]
  23. Ding, F.; Chen, J.; Xu, M.; Hu, J.; Kang, J.; Li, J. Design of Power Assist Characteristic Curve of EPS System for Electric Vehicle in Special Venues. Comput. Digit. Eng. 2020, 50, 2594–2598+2610. [Google Scholar]
  24. Cheng, Y.; Wang, Z.; Xu, C.; Cheng, H.; Zhu, X. Safety grade evaluation of aqueduct structure based on fuzzy cloud theory analysis. Teh. Vjesn. Tech. Gaz. 2020, 27, 874–882. [Google Scholar]
Figure 1. A multi-level evaluation system for EPS performance.
Applsci 14 01043 g001
Figure 2. Comprehensive weight calculation flowchart.
Applsci 14 01043 g002
Figure 3. Cloud generator. (a) Forward cloud generator; (b) Reverse cloud generator.
Applsci 14 01043 g003
Figure 4. EPS structure diagram.
Applsci 14 01043 g004
Figure 5. Comprehensive evaluation results of EPS performance.
Applsci 14 01043 g005
Table 1. Description and selection of index scale.
The Importance of Pairwise ComparisonsValue
Si is more important than SjAbsolutelye 8/4
Stronglye 6/4
Obviouslye 4/4
Slightlye 2/4
The importance of the two judgments mentioned abovee 7/4, e 5/4, e 3/4, e 1/4
Si as more important as Sje 0/4
Table 2. EPS performance evaluation grade and cloud model parameter values.
Evaluation LevelEvaluation Conclusions and CountermeasuresCloud Model Parameters
Overall RatingsMeaningCountermeasuresExEnHe
EXCELLENT95 ≤ U < 100No damageDaily maintenance905.890.5
GOOD80 ≤ U < 95Minor damageMinor repair705.890.5
FAIR60 ≤ U < 80Moderate damageModerate repair505.890.5
POOR40 ≤ U < 60Serious damageOverhaul or reinforcement2011.770.5
Table 3. Performance evaluation parameters of state layer in the EPS multi-level system.
State Layer
Indicators
Subjective
Weight
Objective
Weight
Combination
Weight
Index Cloud
Parameters
A10.0850.1220.111(66.52, 7.52, 1.01)
A20.2260.1850.198(75.29, 4.89, 0.85)
A30.1860.2440.226(84.29, 6.85, 1.22)
A40.3150.3070.310(88.13, 3.99, 1.01)
A50.1880.1420.156(69.72, 6.26, 1.39)
B10.1450.0740.096(63.19, 4.20, 0.43)
B20.1660.2410.218(77.29, 5.23, 0.80)
B30.4120.3660.380(72.09, 8.36, 1.28)
B40.2770.3190.306(89.45, 4.57, 0.20)
C10.3880.7890.665(71.26, 8.93, 1.01)
C20.6120.2110.334(58.08, 5.57, 0.80)
D10.1210.0880.098(85.41, 6.24, 0.65)
D20.3520.4120.394(65.22, 7.53, 0.88)
D30.2010.1640.175(58.22, 4.03, 0.84)
D40.3260.3360.333(73.71, 7.67, 1.21)
E10.6140.3060.401(81.57, 6.24, 0.61)
E20.3860.6940.599(72.32, 7.12, 0.44)
Table 4. Performance evaluation parameters of factor layer in the EPS multi-level system.
Factor Layer
Indicators
Subjective WeightObjective WeightCombination WeightIndex Cloud
Parameters
A0.3250.4020.361(79.46, 5.25, 1.07)
B0.2430.1990.222(77.68, 6.52, 0.83)
C0.1910.1340.164(66.85, 8.27, 0.97)
D0.1220.1020.113(68.80, 7.19, 0.99)
E0.1190.1630.140(76.02, 6.85, 0.49)
Disclaimer/Publisher’s Note: The statements, opinions and data contained in all publications are solely those of the individual author(s) and contributor(s) and not of MDPI and/or the editor(s). MDPI and/or the editor(s) disclaim responsibility for any injury to people or property resulting from any ideas, methods, instructions or products referred to in the content.

