
Computational Fluid Dynamic Simulation of Fabric Cooling in a Stenter Machine


Abstract
:1. Introduction
2. Methodology
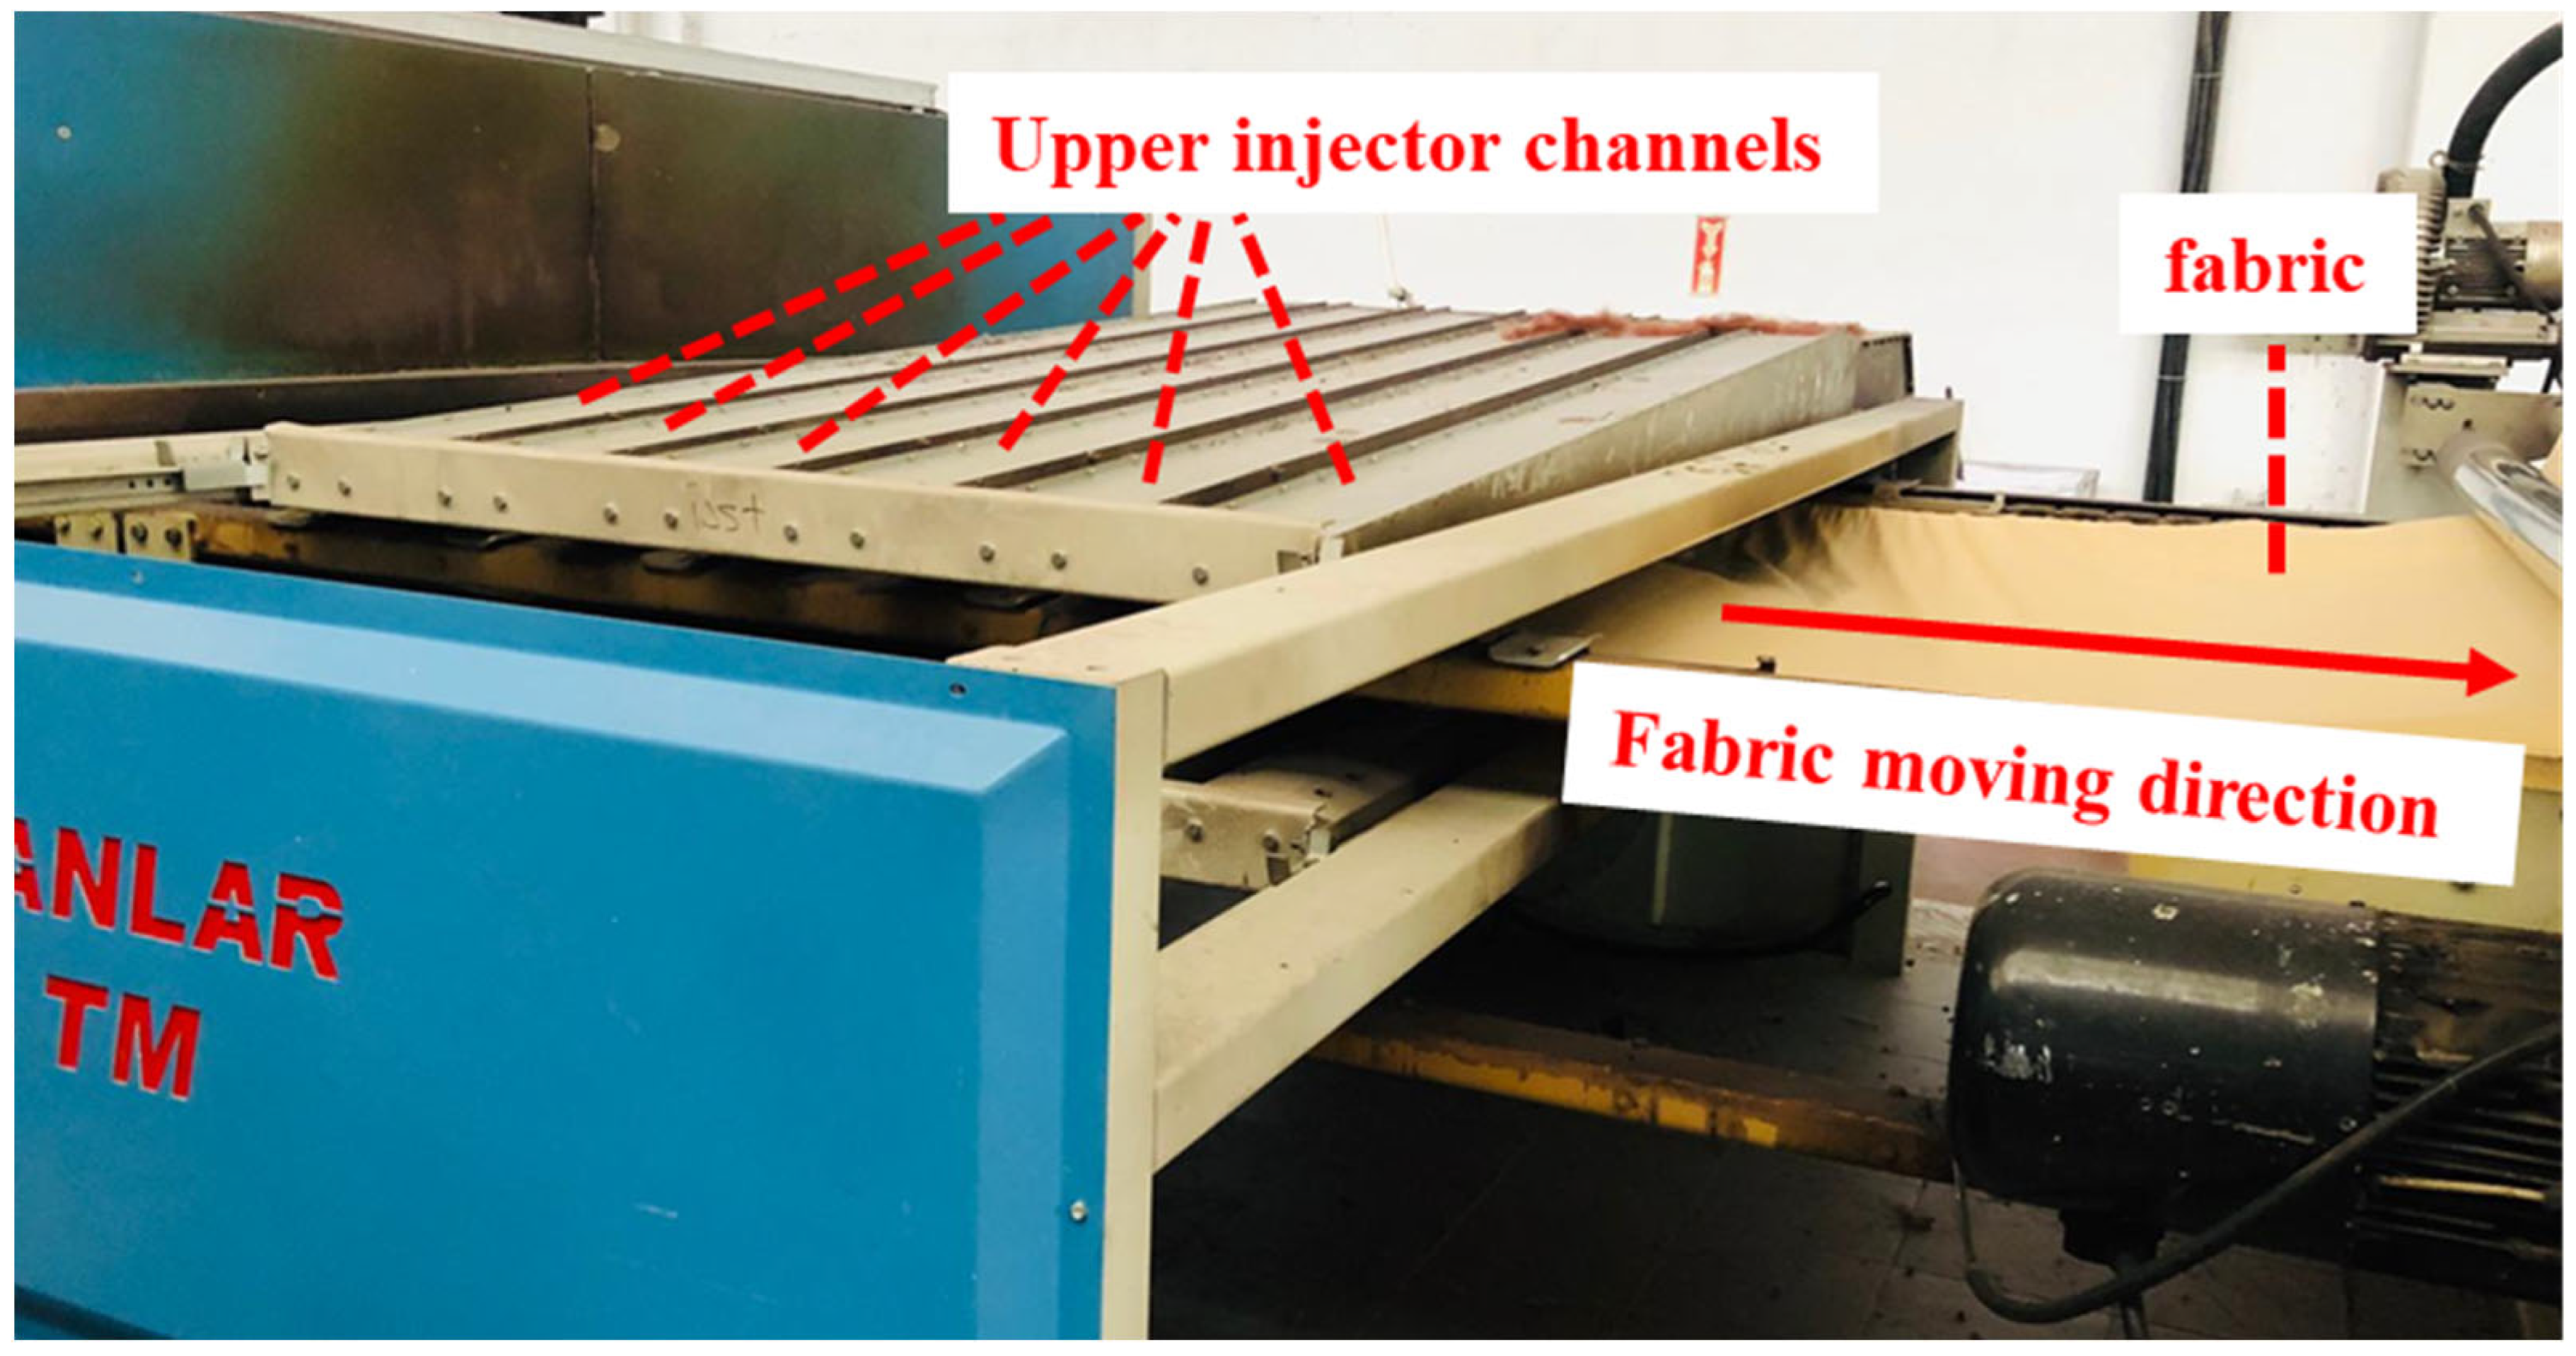
2.1. Geometry and Parameters
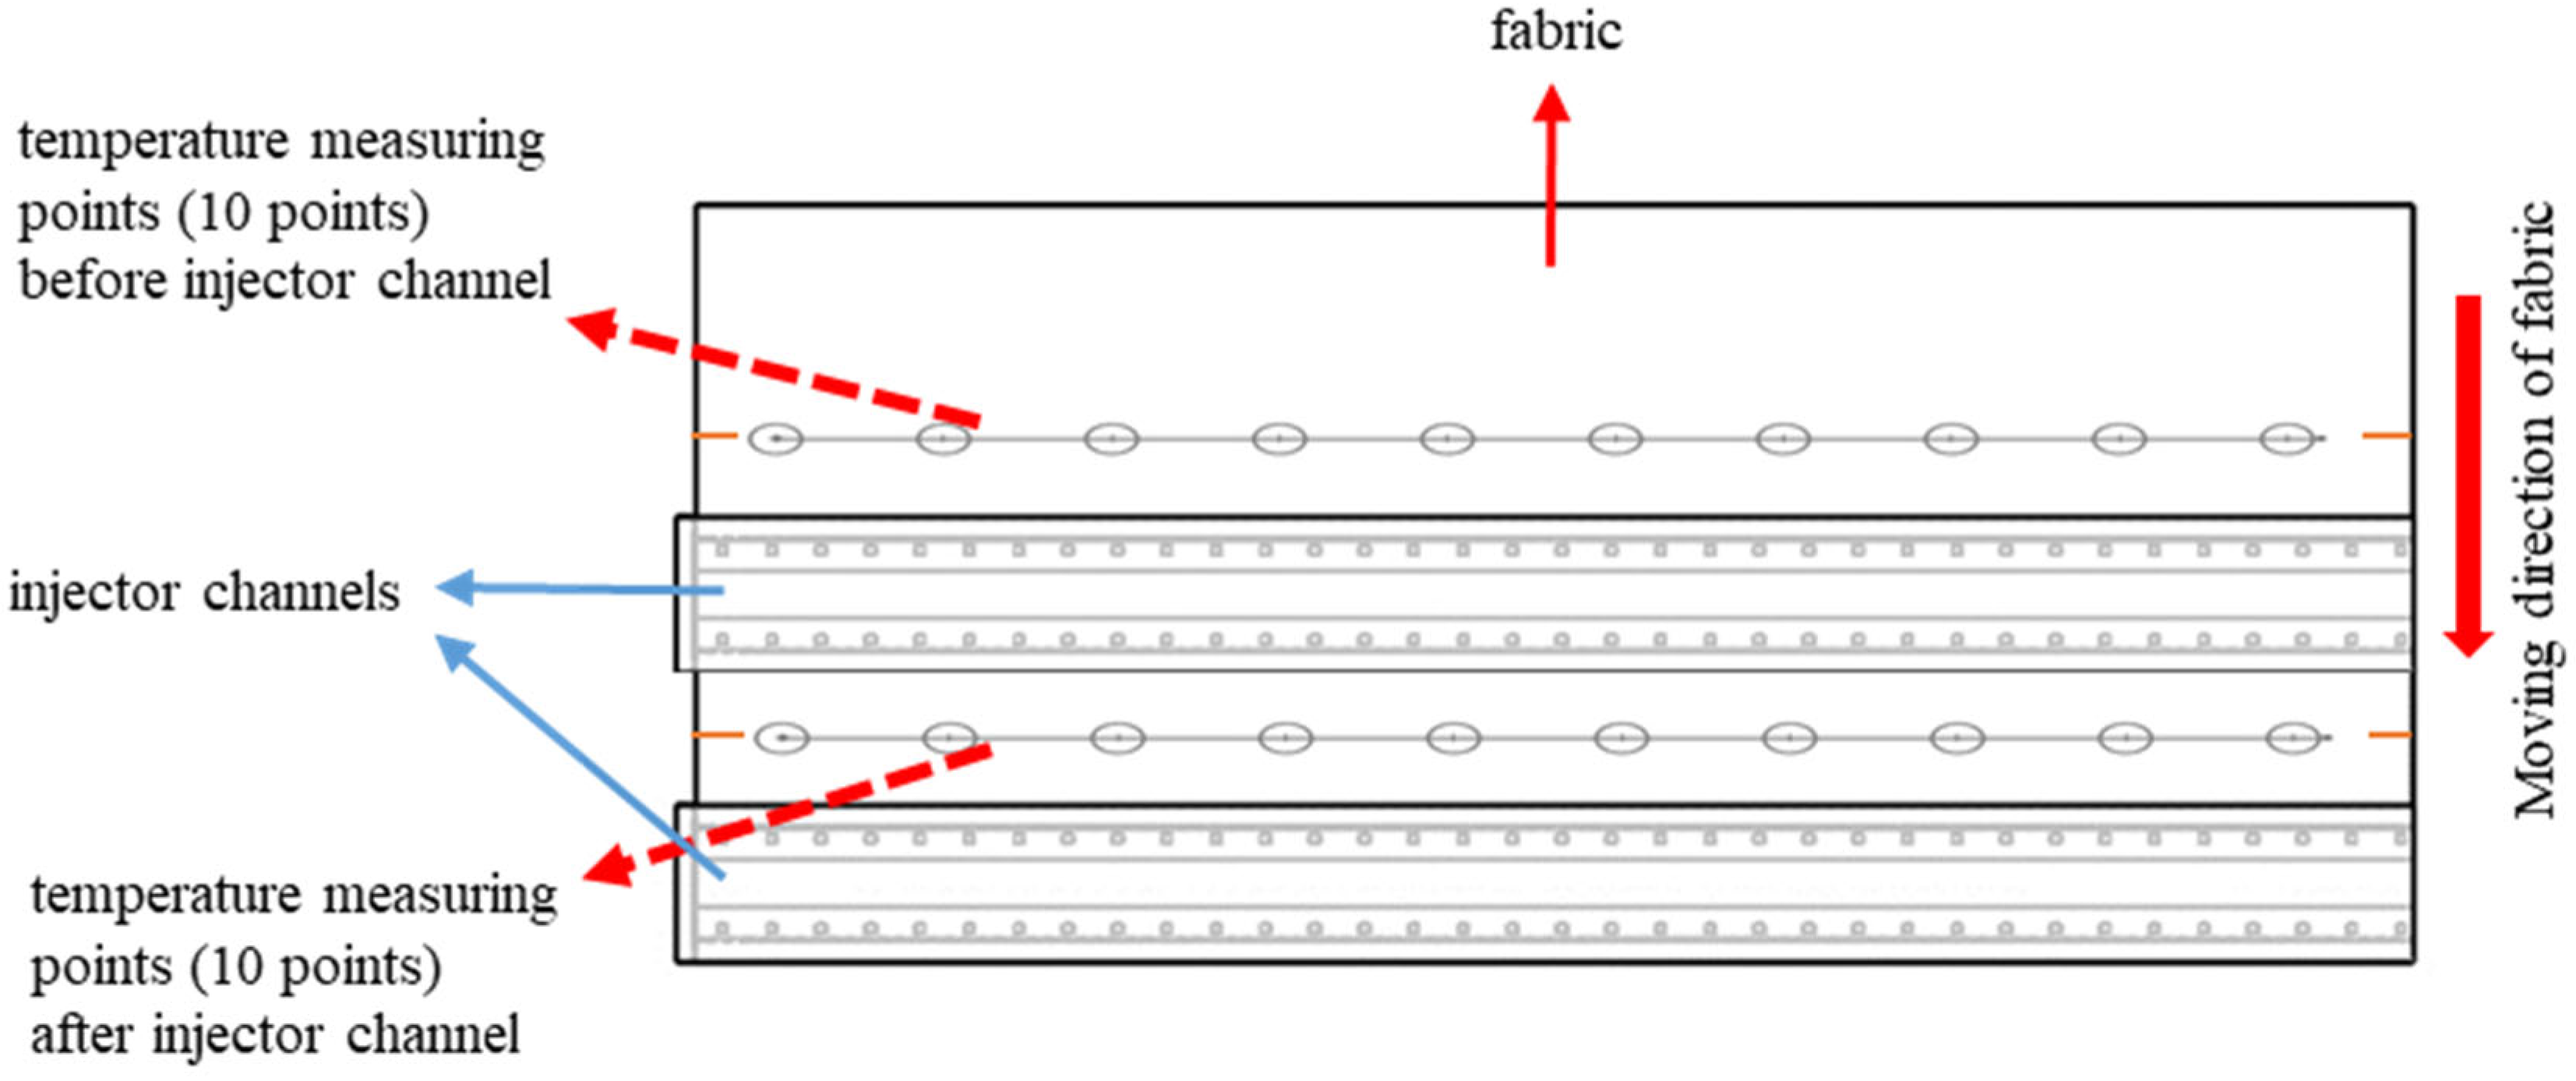
2.2. Experiments
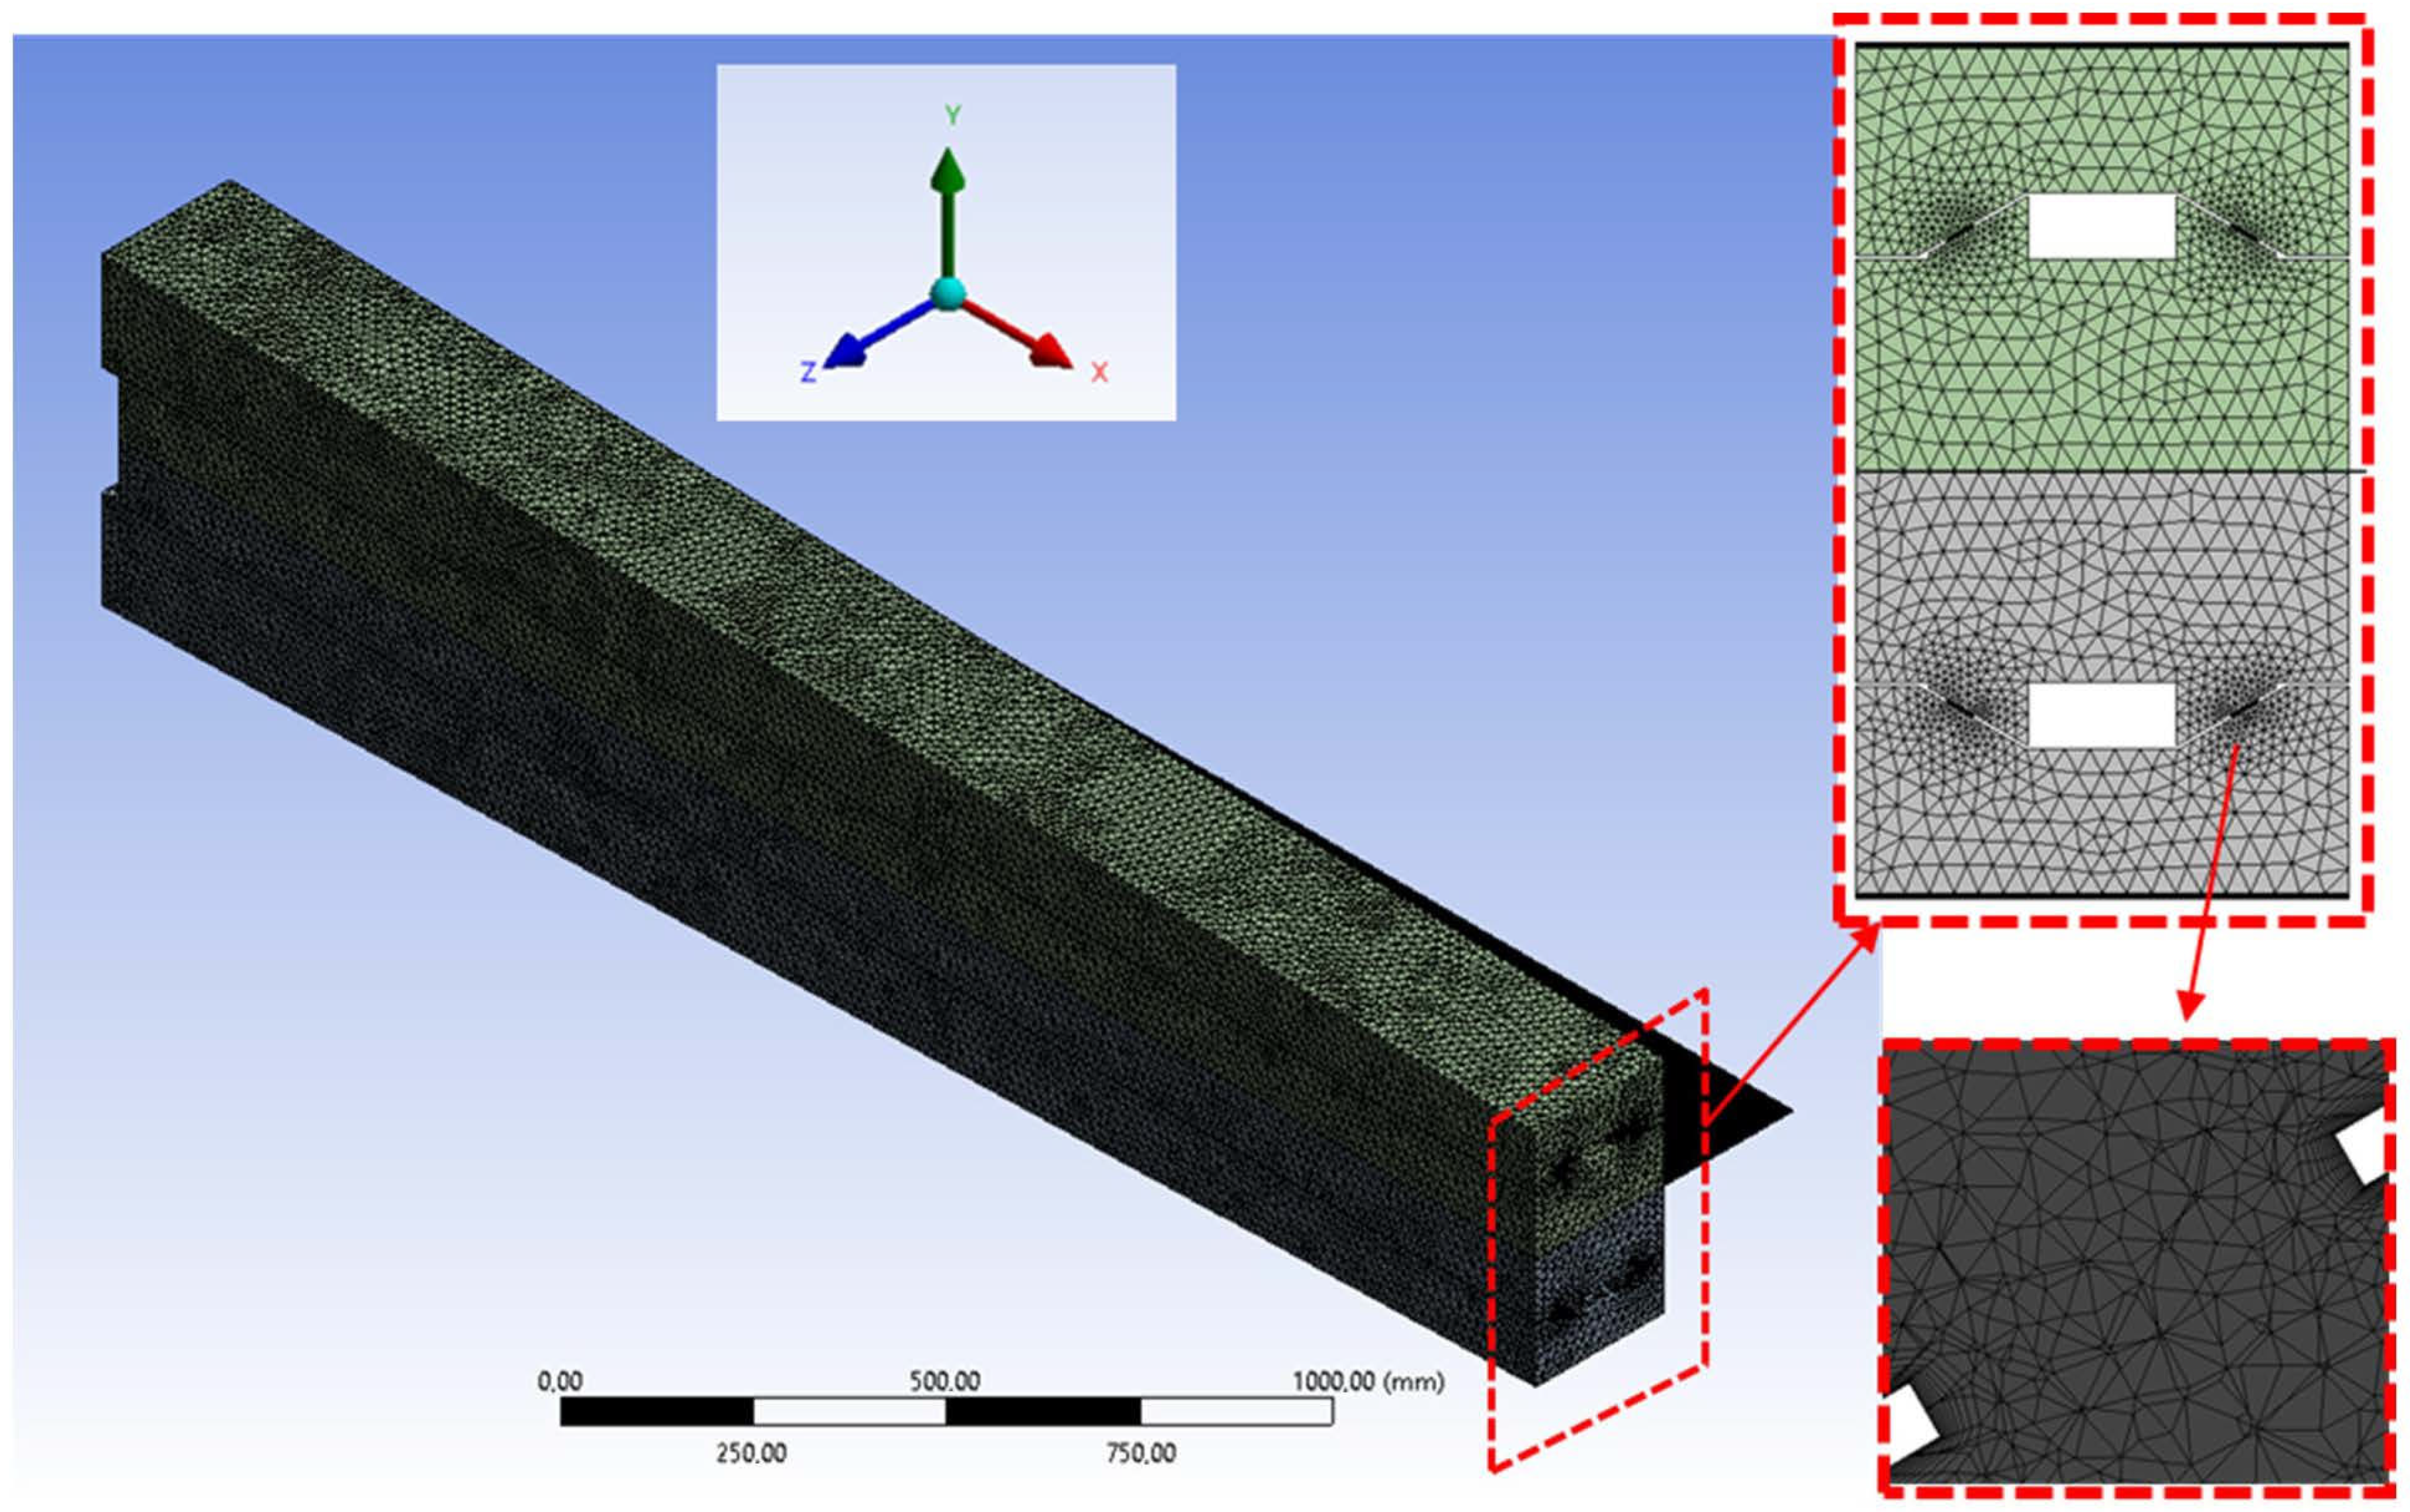
2.3. CFD Model
Mesh and Simulation Details
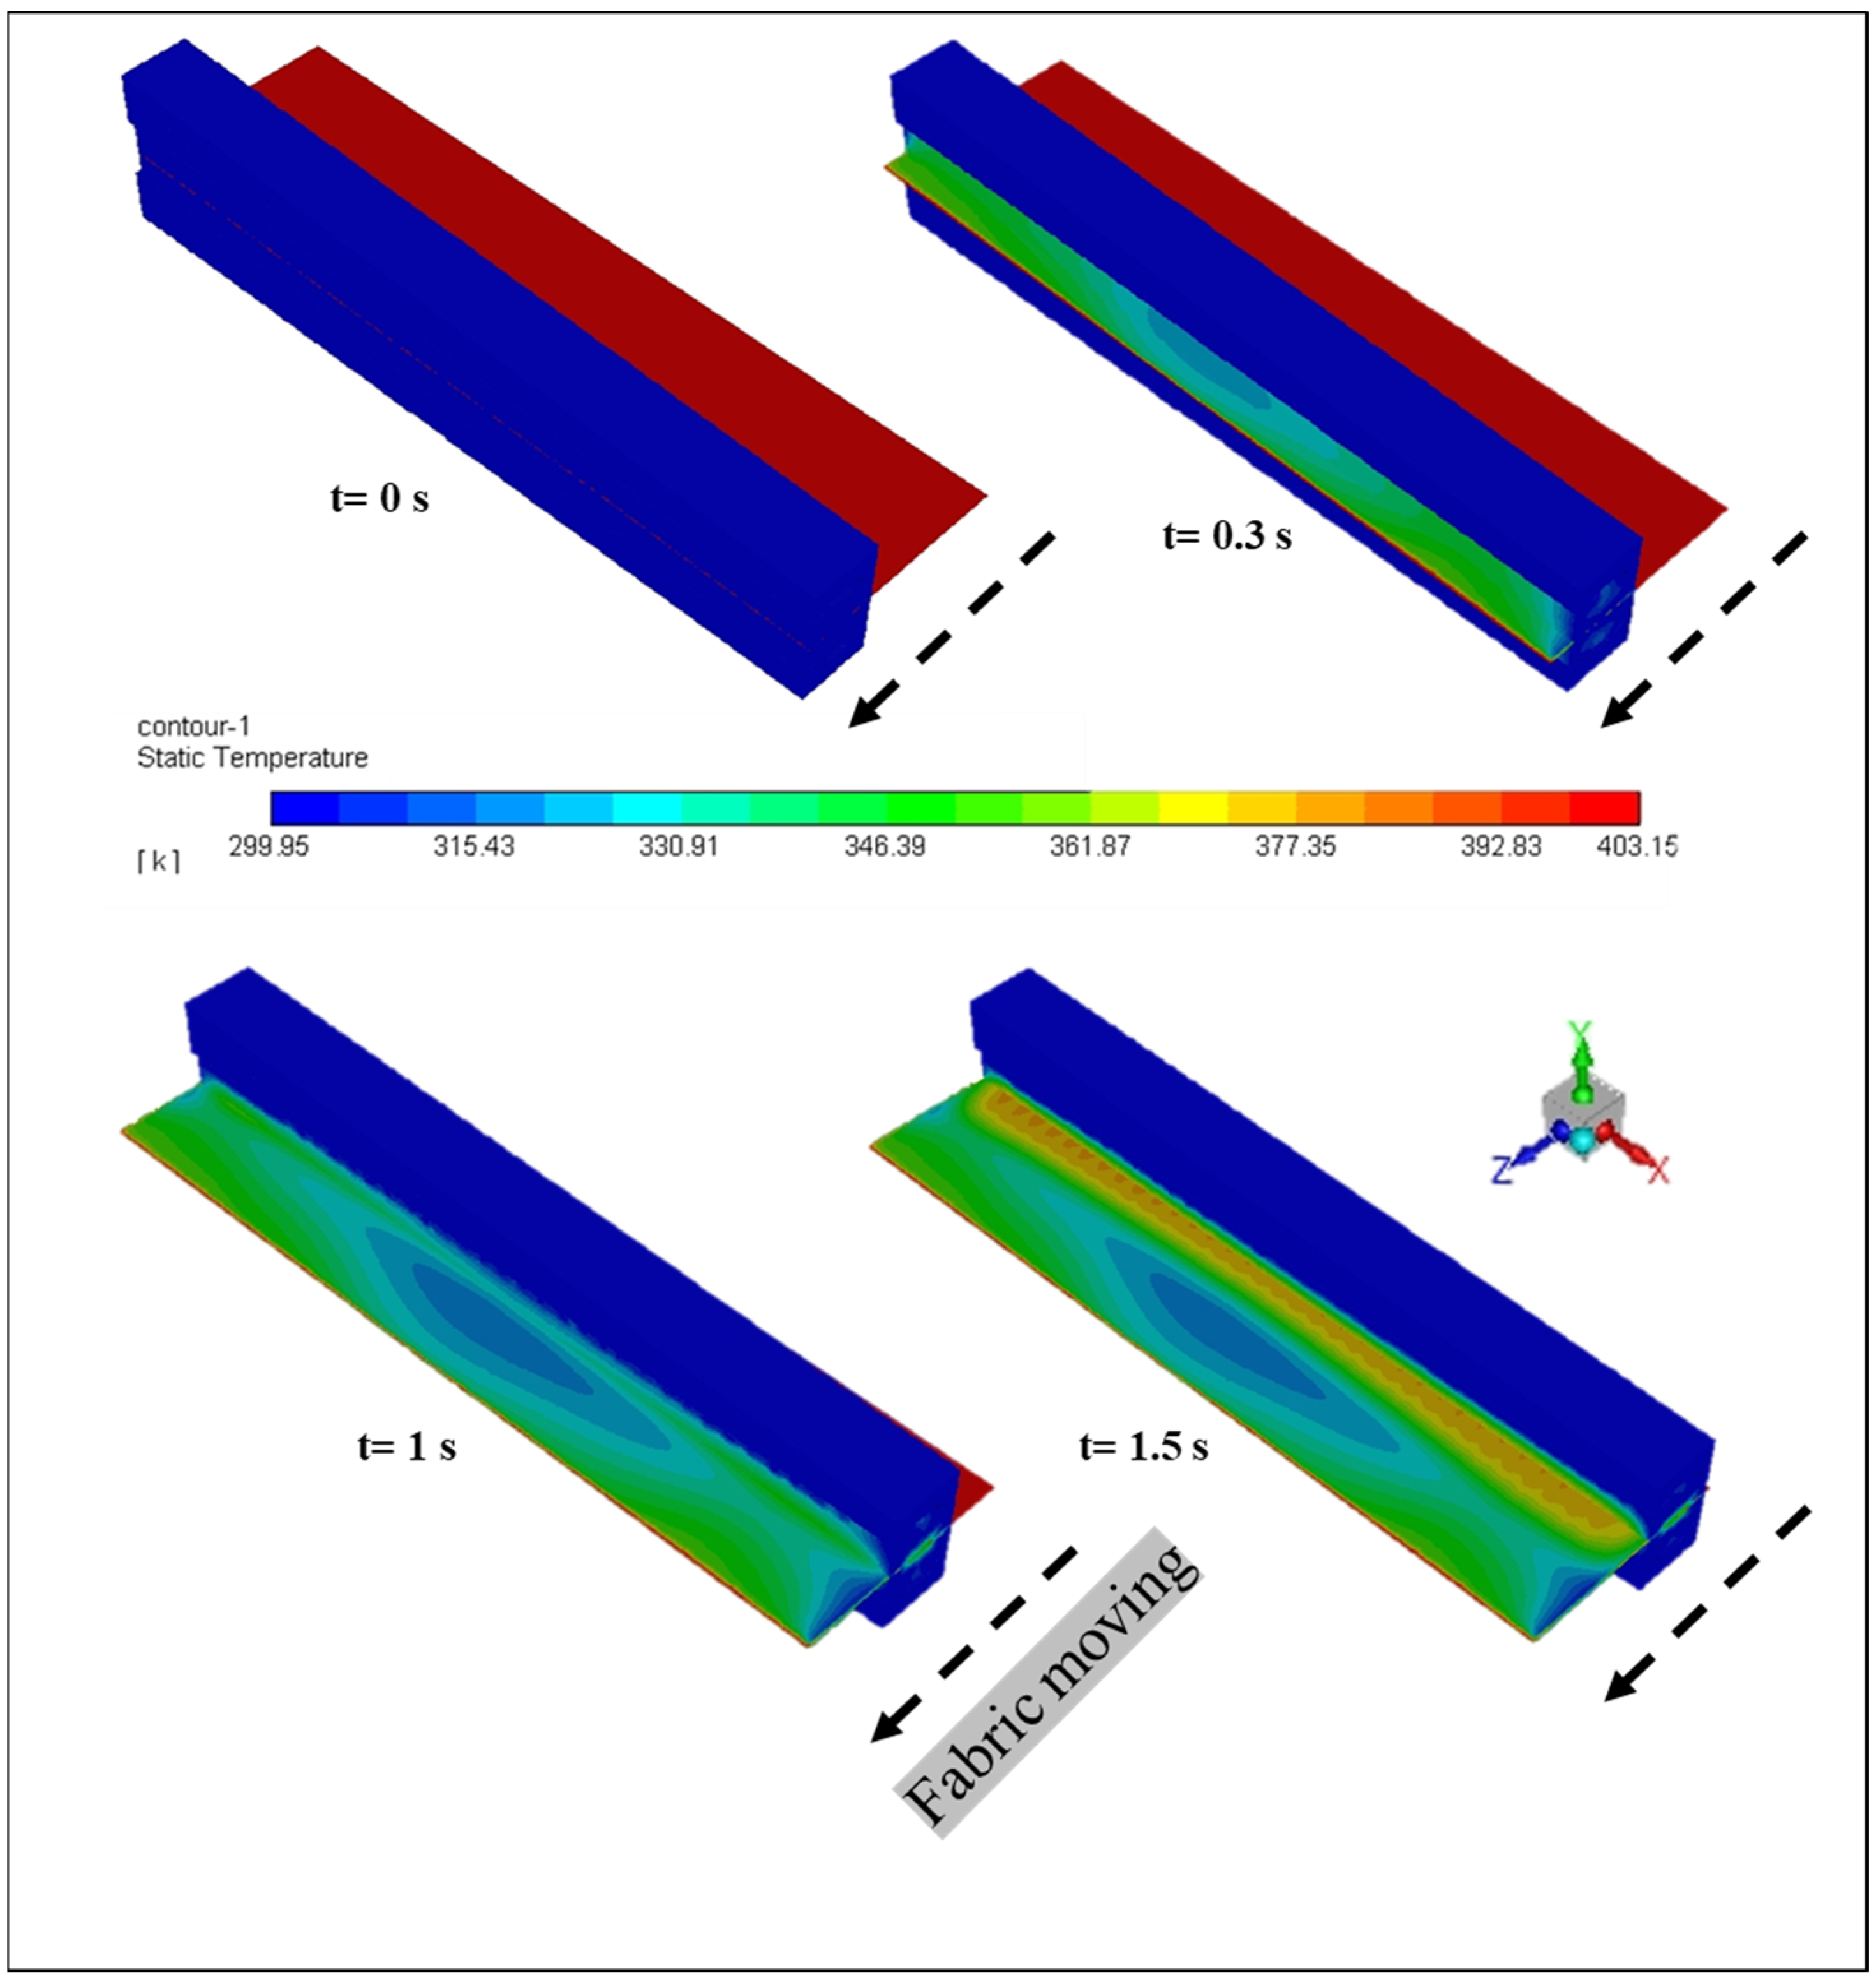
3. Results and Discussions
3.1. Validation Study
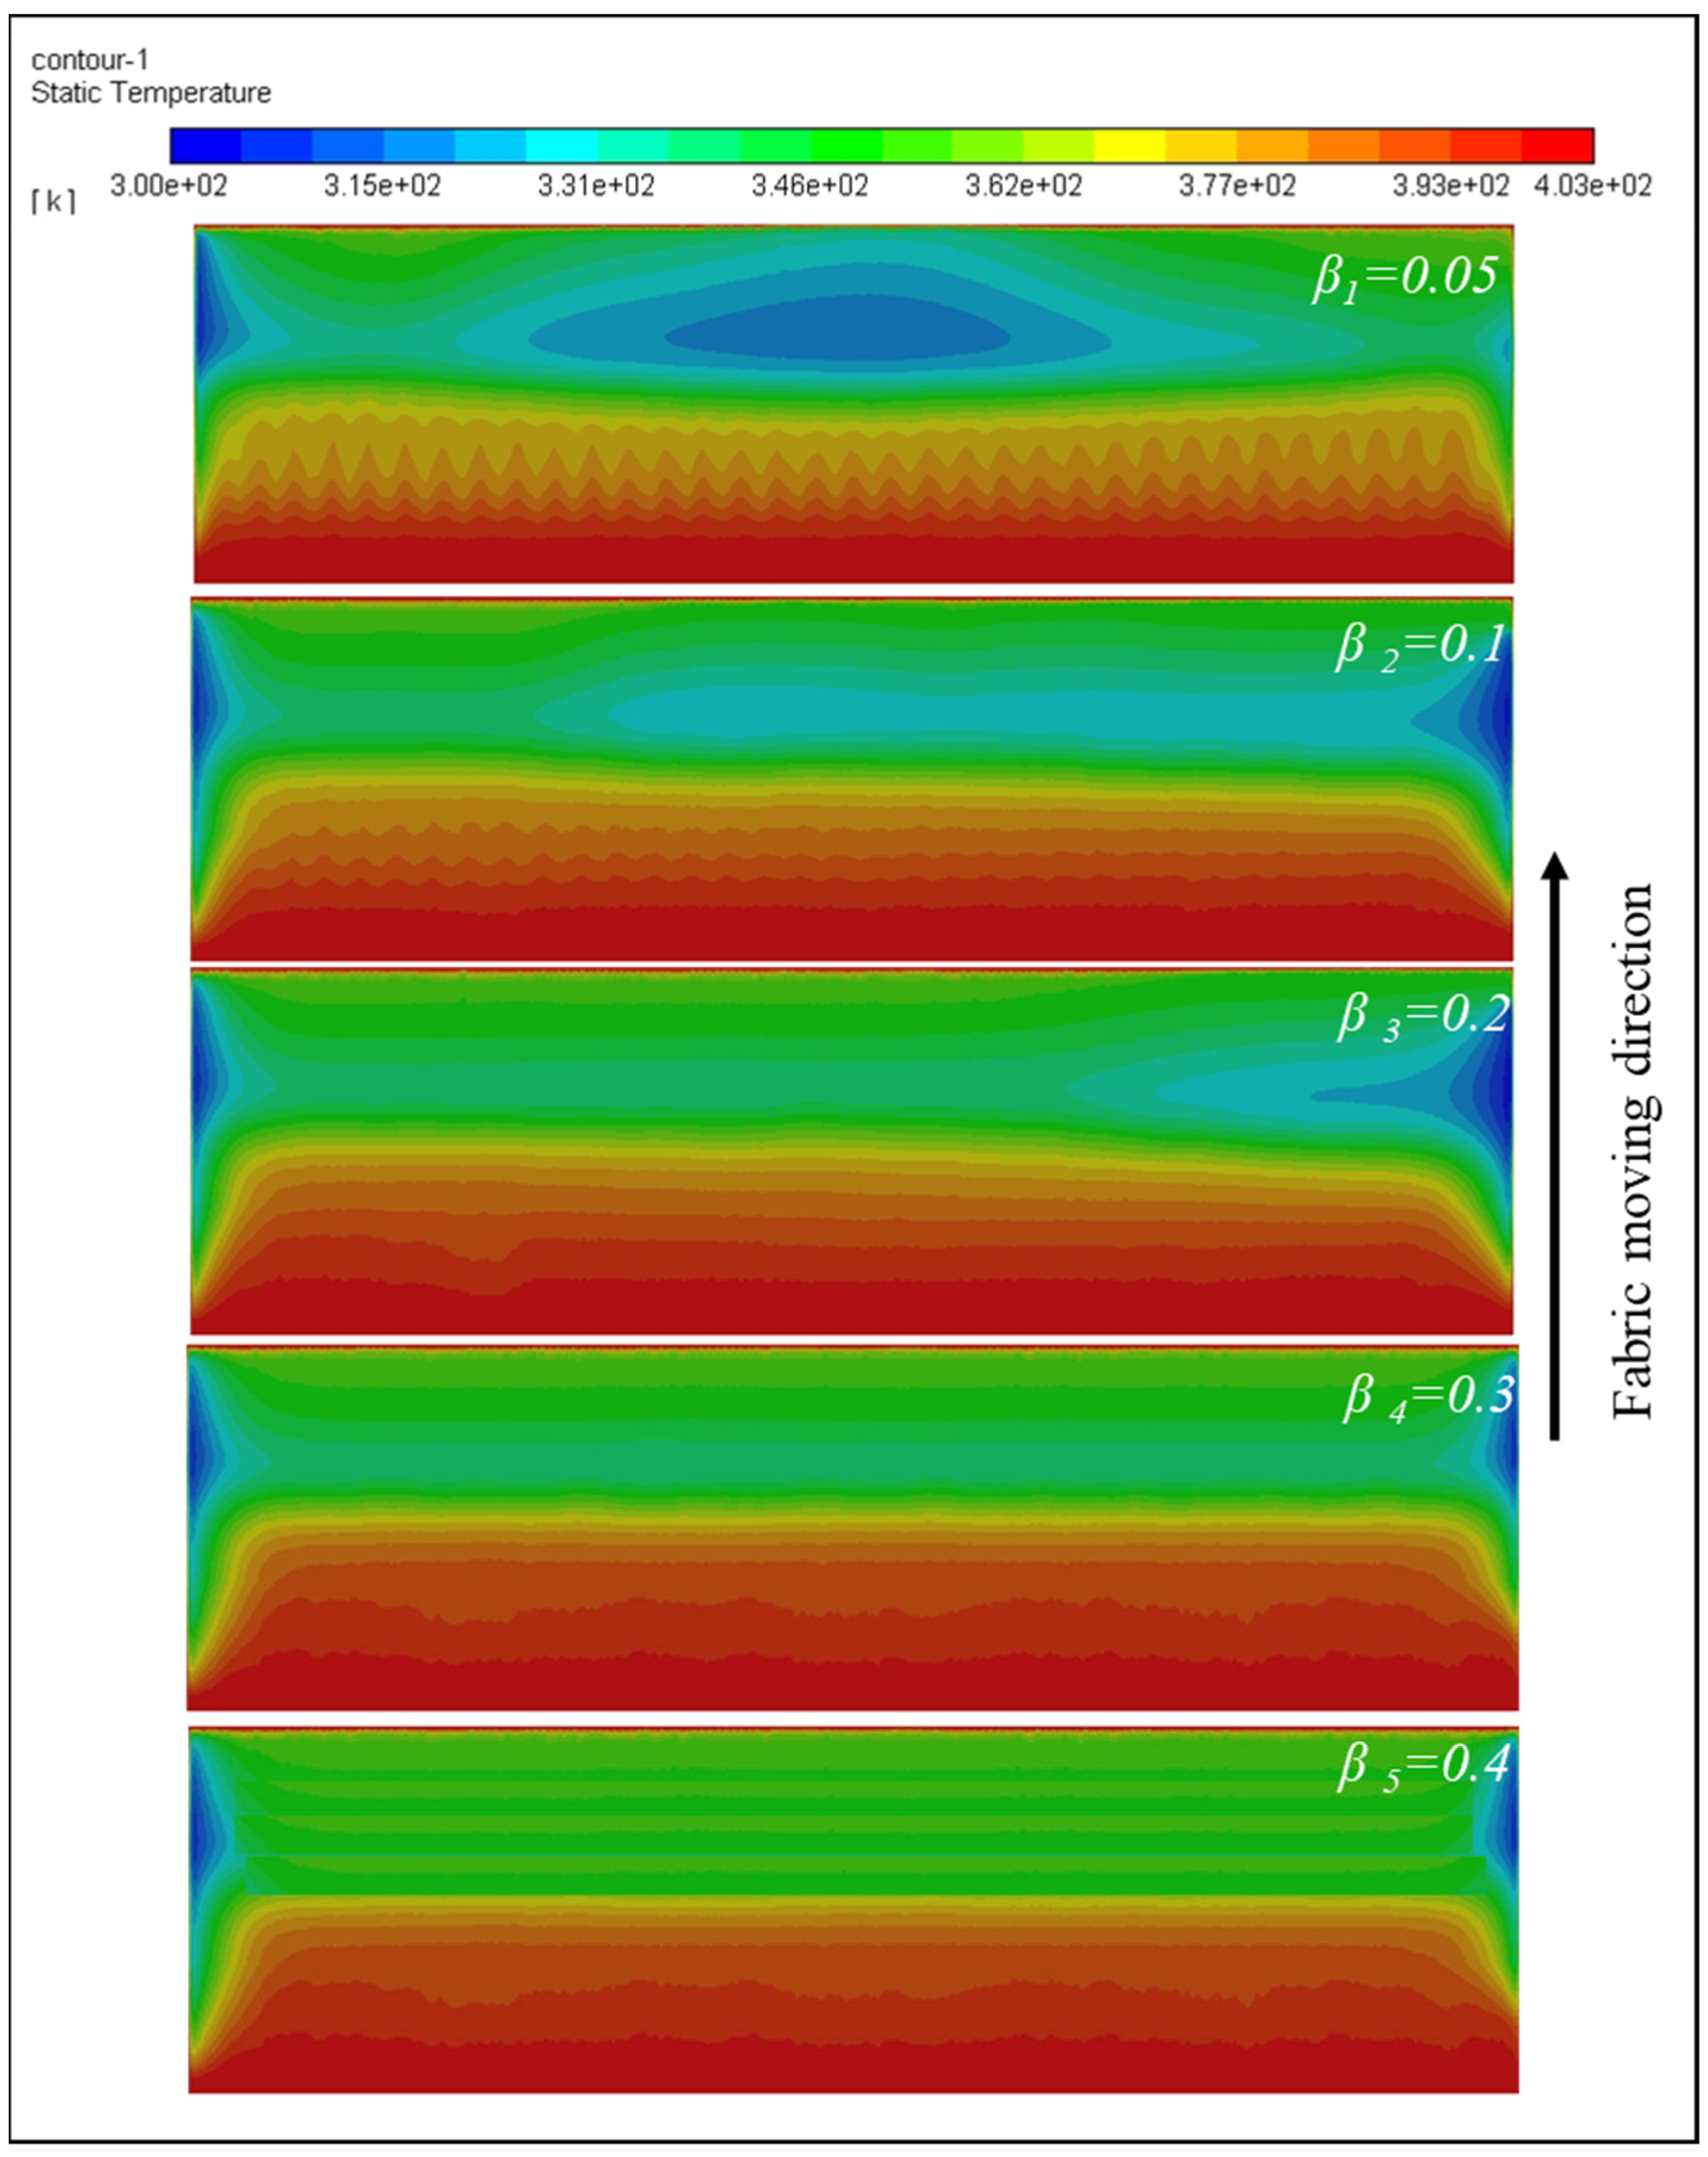
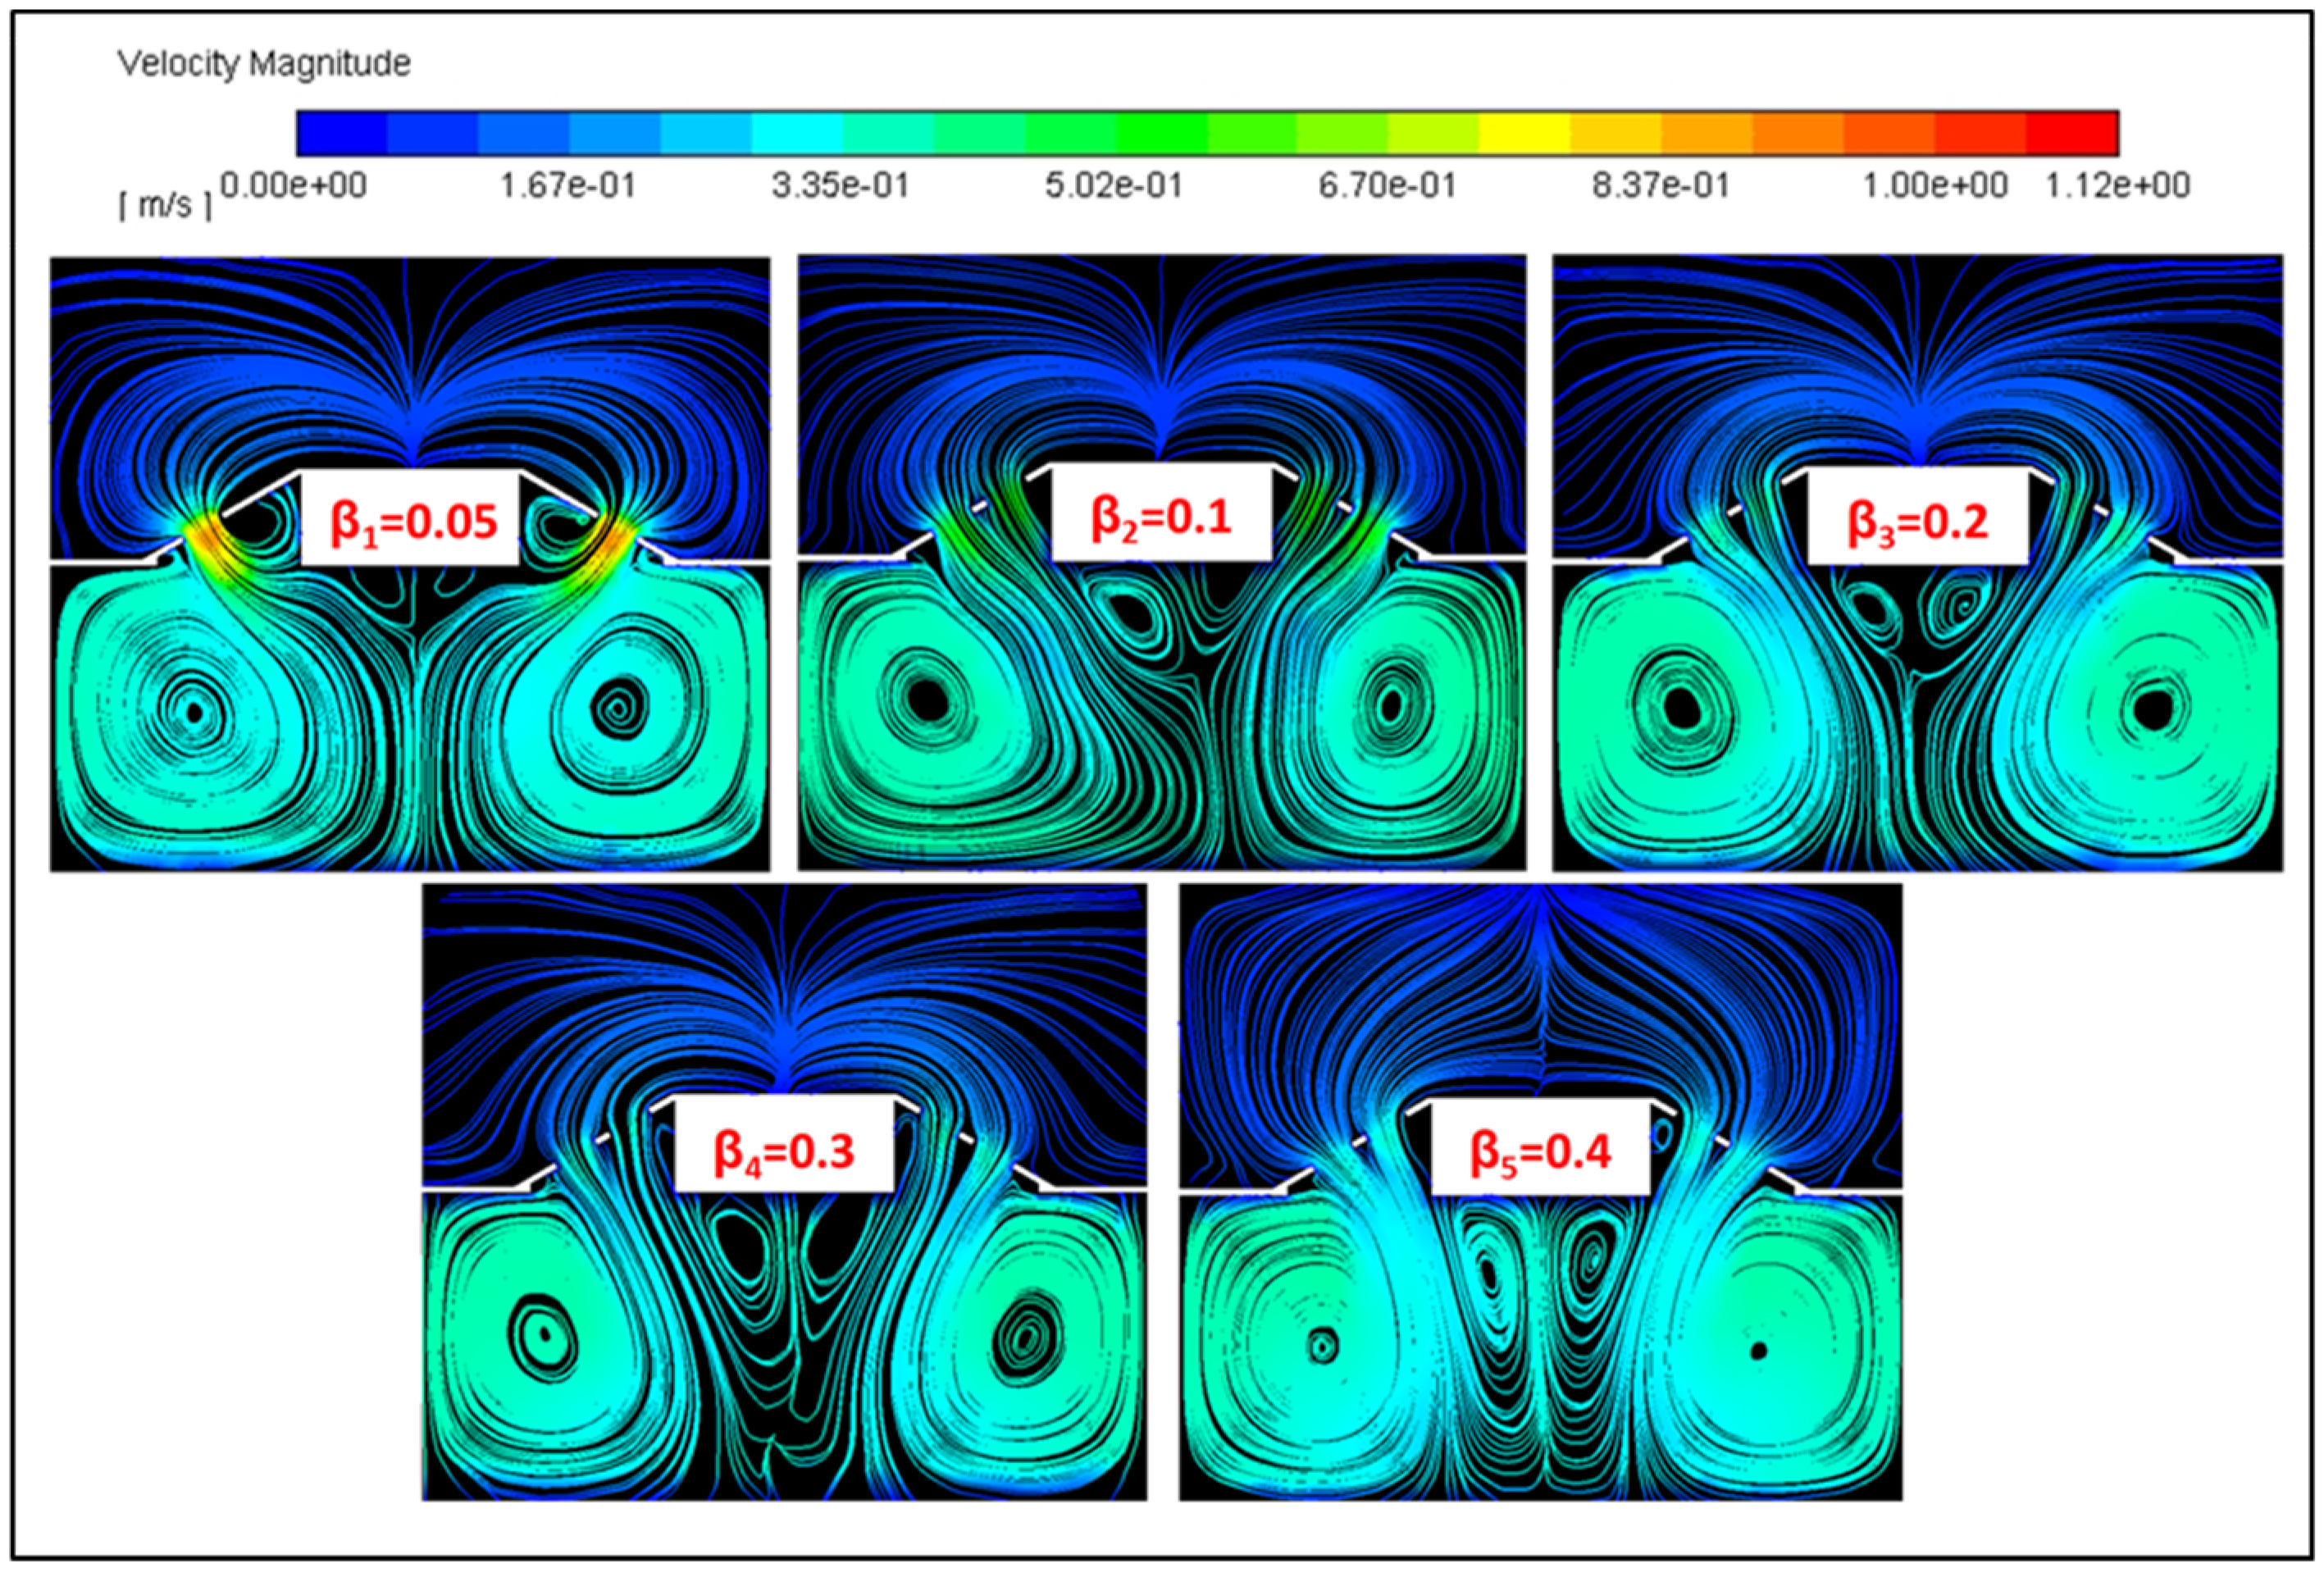
3.2. Porosity (β) Study
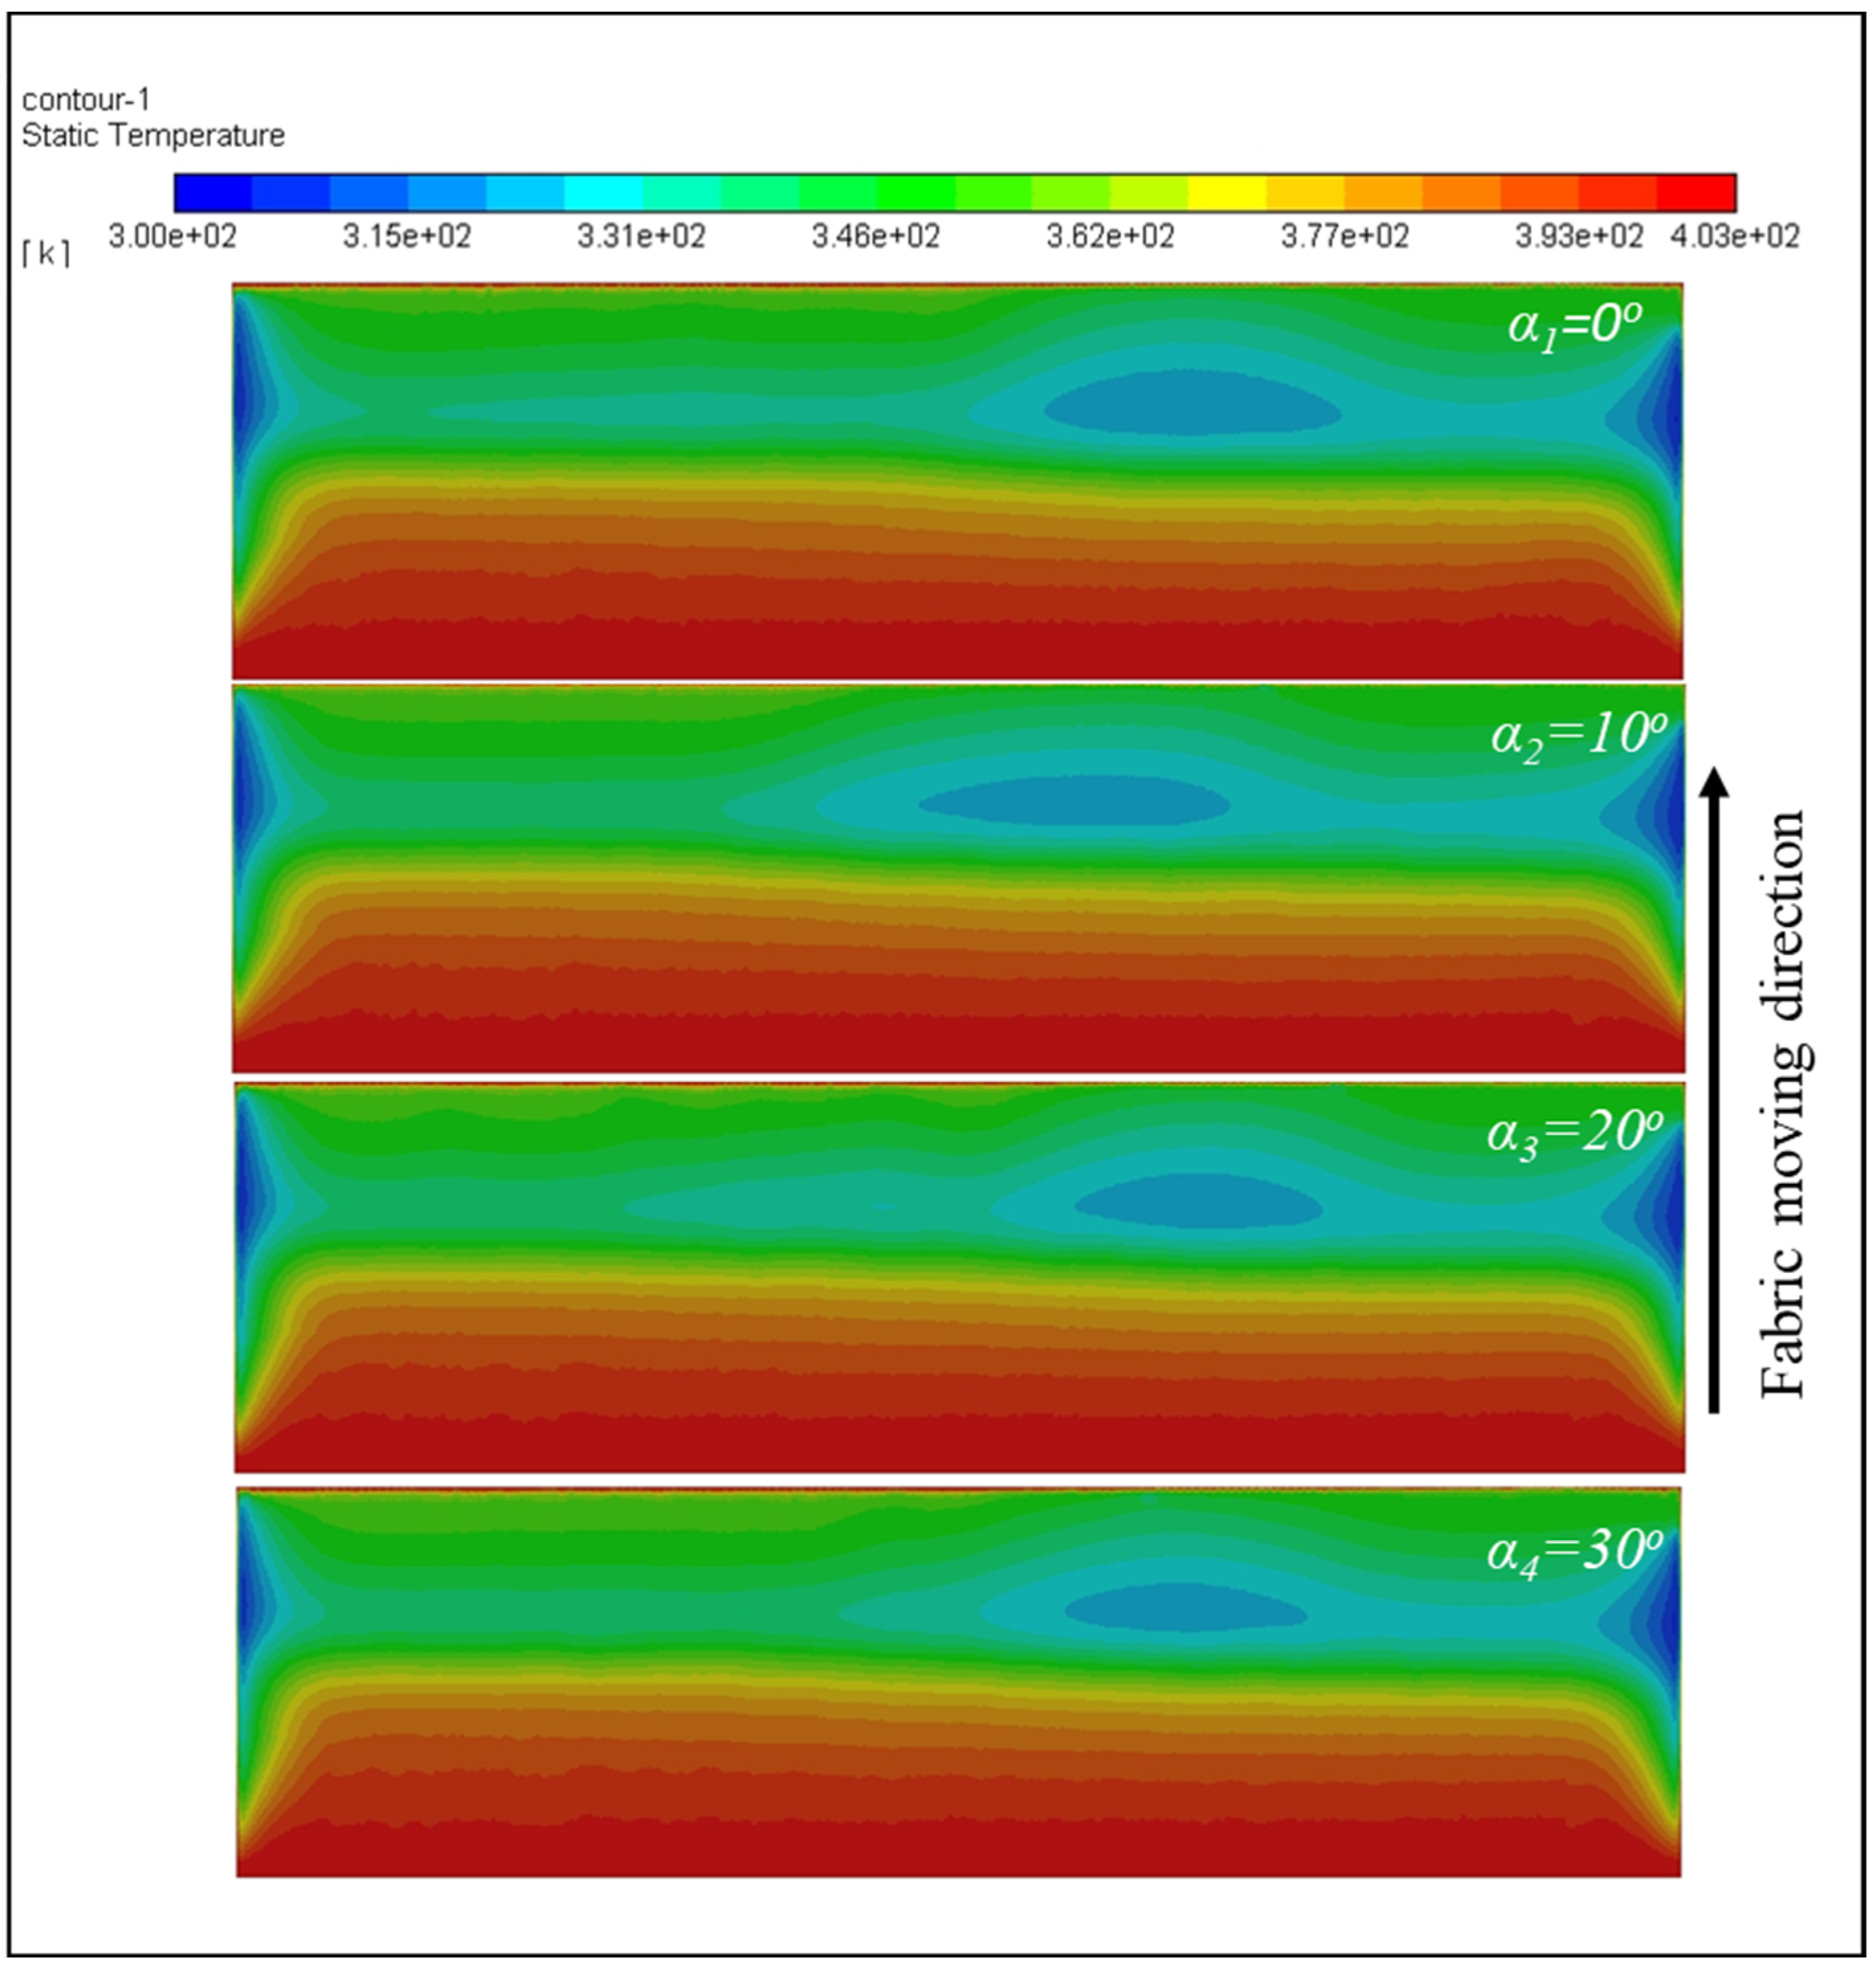
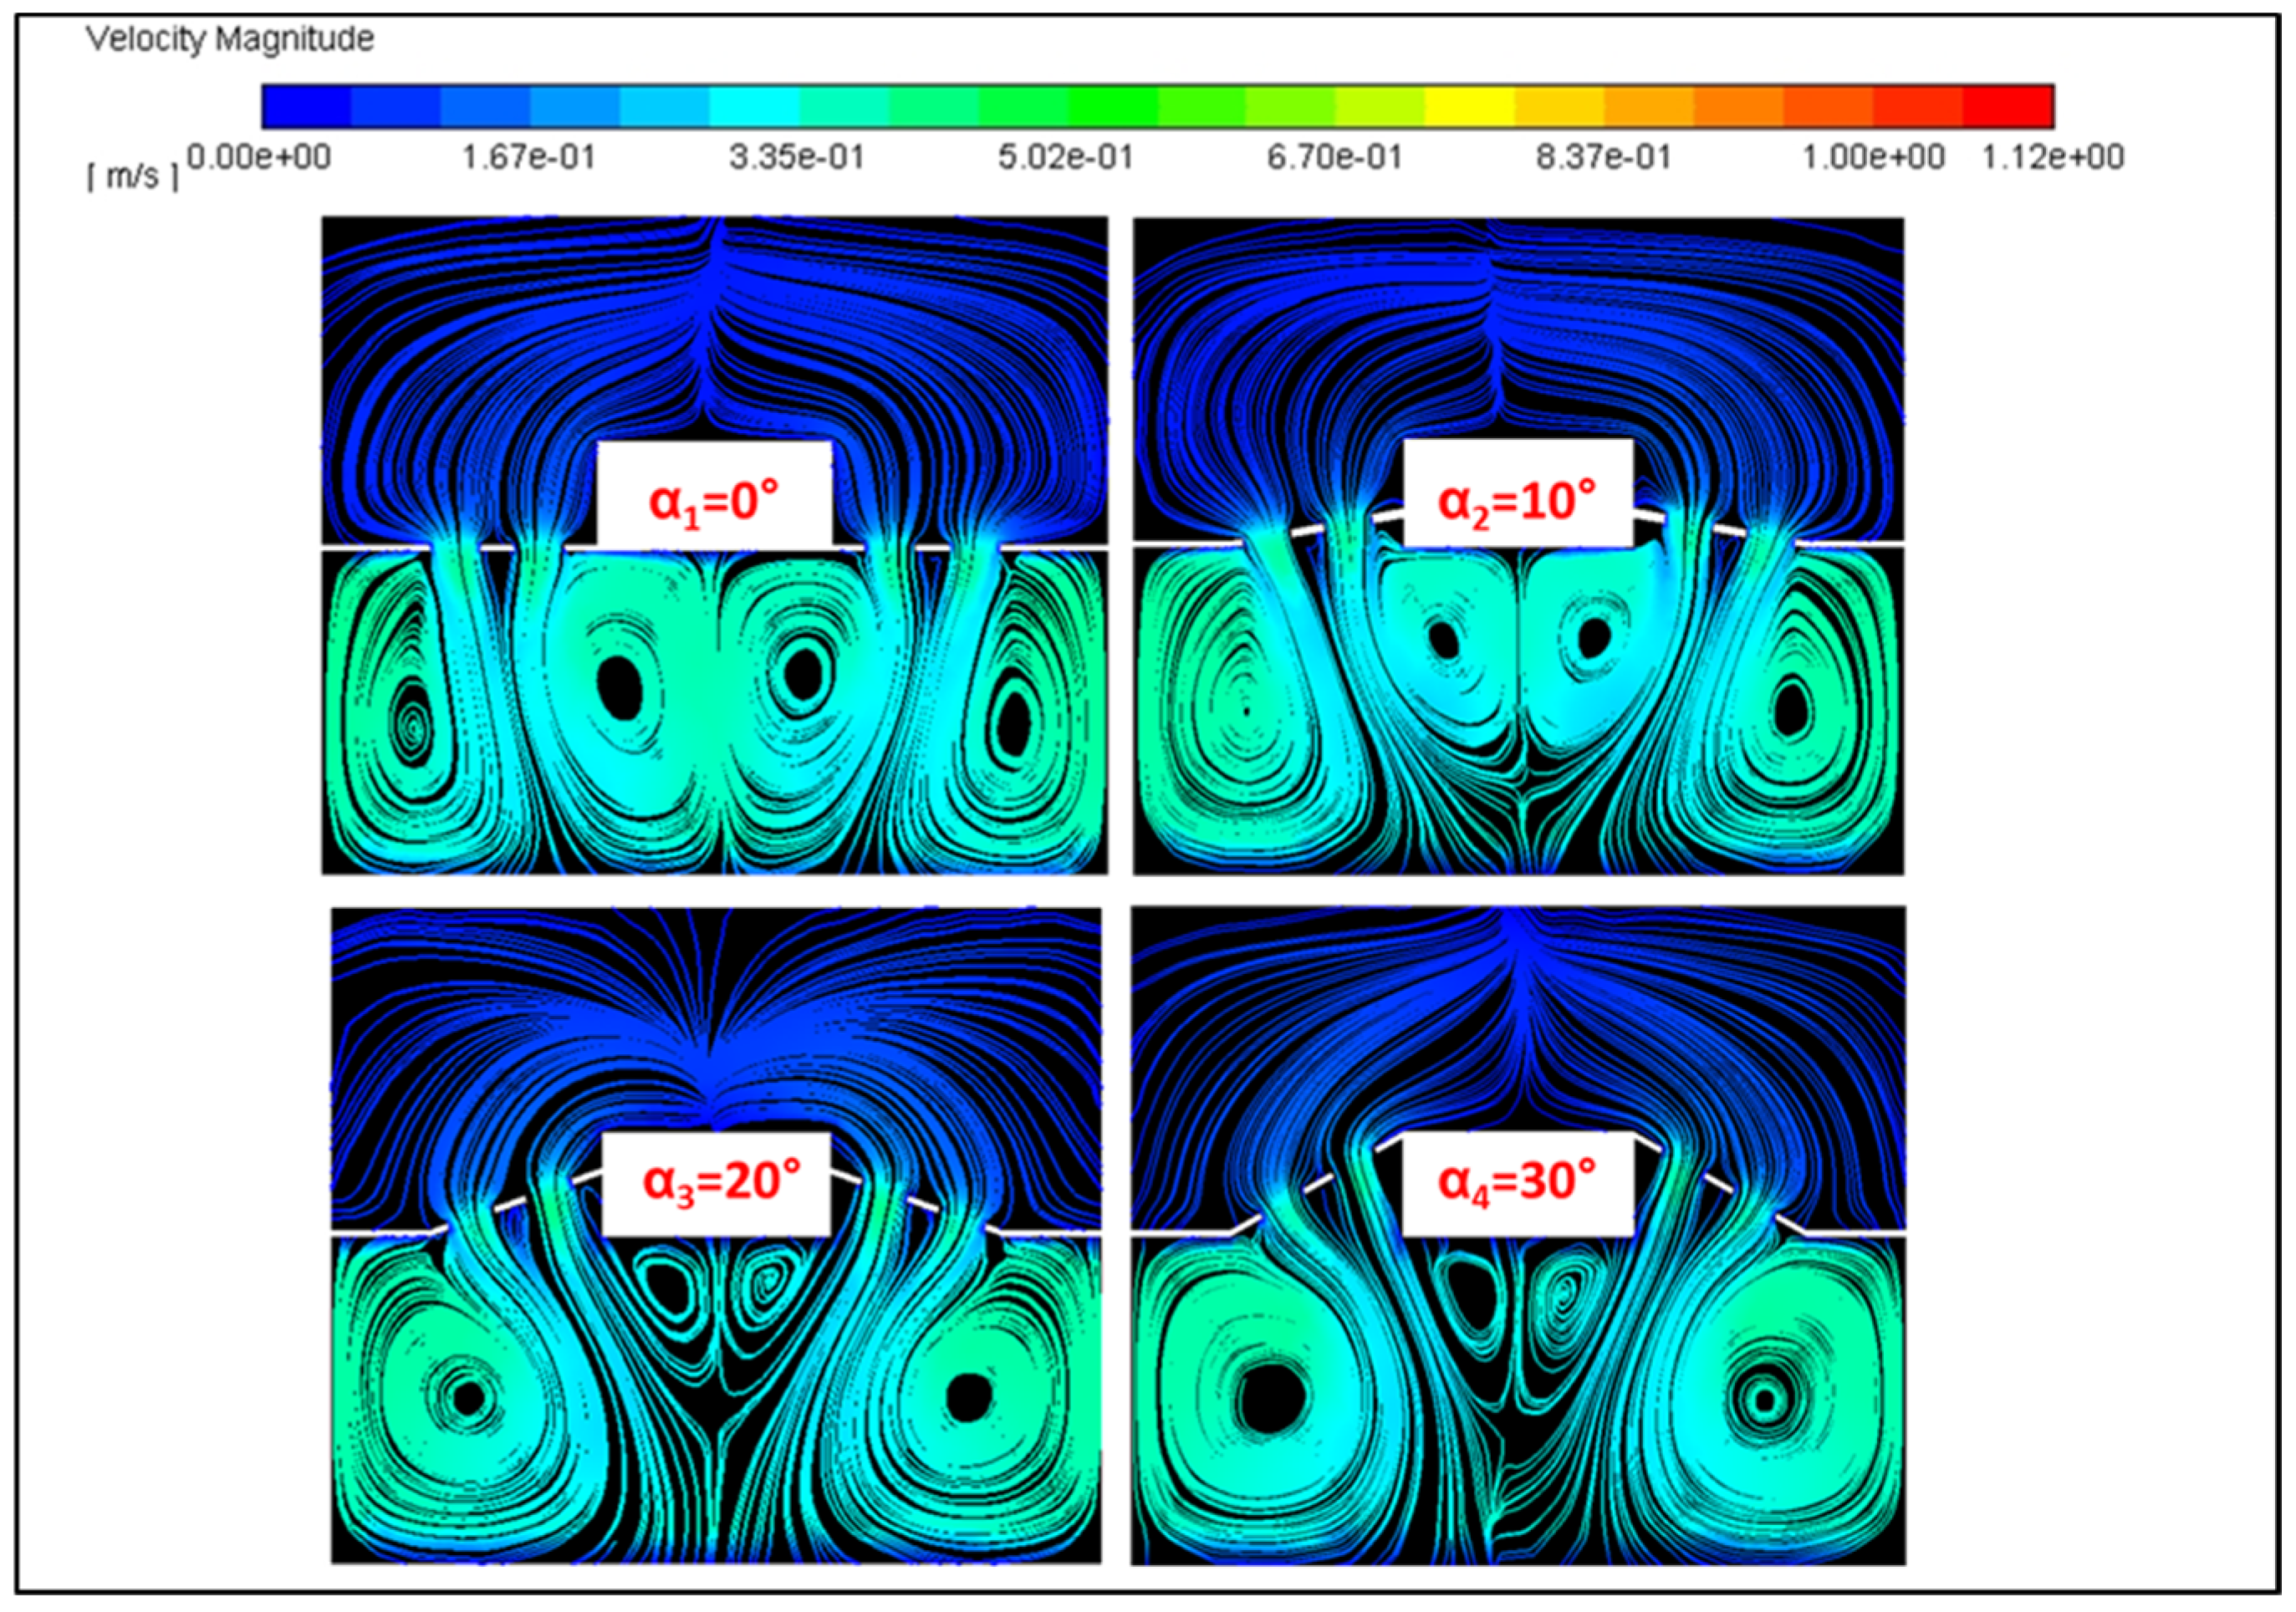
3.3. Injector Angle (α) Study
3.4. Airflow Velocity (Va) Study
3.5. Fabric Velocity (Vf) Study
4. Conclusions
- Industrial data obtained by experimental measurements validate the mesh quality, the fabric model supposed as a porous medium, fabric movement, heat and airflow mechanisms in the fabric cooling process in the stenter machine, and the turbulence model. In the prediction of industrial data by the CFD, the Realizable k-ε turbulence model provides good agreement.
- If the injector channel has a low porosity, it will perform better in a low-airflow supply, whereas if the injector channel has a high porosity, it will perform better in a high-airflow supply.
- In order to minimize vortices near corners and contact fabric and air directly, a horizontal position (α = 0°) will provide the best cooling performance.
- It is obviously seen that the current airflow velocity (Va = 0.5 m/s) is too low and should be increased.
- The best cooling process and fabric temperature distribution are achieved when the fabric velocity is 0.3 m/s under certain constant parameters.
Author Contributions
Funding
Institutional Review Board Statement
Informed Consent Statement
Data Availability Statement
Conflicts of Interest
References
- Farhana, K.; Kadirgama, K.; Mahamude, A.S.F.; Mica, M.T. Energy consumption, environmental impact, and implementation of renewable energy resources in global textile industries: An overview towards circularity and sustainability. Mater. Circ. Econ. 2022, 4, 15. [Google Scholar] [CrossRef]
- Kim, J.-O.; Traore, M.; Warfield, C. The textile and apparel industry in developing countries. Text. Prog. 2006, 38, 1–64. [Google Scholar] [CrossRef]
- Alberghini, M.; Hong, S.; Lozano, L.M.; Korolovych, V.; Huang, Y.; Signorato, F.; Zandavi, S.H.; Fucetola, C.; Uluturk, I.; Tolstorukov, M.Y.; et al. Sustainable polyethylene fabrics with engineered moisture transport for passive cooling. Nat. Sustain. 2021, 4, 715–724. [Google Scholar] [CrossRef]
- Hasanbeigi, A.; Price, L. A technical review of emerging technologies for energy and water efficiency and pollution reduction in the textile industry. J. Clean. Prod. 2015, 95, 30–44. [Google Scholar] [CrossRef]
- Alam, S.M.M.; Kibria, M.G. Sustainable Heat-setting Process in Stenter for Textile Industry. Mater. Today Proc. 2022, 59, 847–851. [Google Scholar] [CrossRef]
- Santos, R.M.; Llanos, J.W.P.; Quadri, M.B.; da Rocha, I.C.C. Study of drying and consumption of natural gas in a textile stenter of direct heating. Dry. Technol. 2015, 33, 37–54. [Google Scholar] [CrossRef]
- Wang, S.; Zhang, H.; Chen, H.; Zhong, Y.; Yue, X. A numerical model of the open-width coupling drying process for cotton fabrics based on the theory of heat and mass transfer in porous media. Text. Res. J. 2020, 90, 1639–1657. [Google Scholar] [CrossRef]
- Wang, S.; Zhang, H.; Chen, H.; Zhong, Y.; Yue, X. Process analysis and optimization of open-width fabric continuous drying based on numerical simulation. Text. Res. J. 2021, 91, 925–949. [Google Scholar] [CrossRef]
- Ramić, M.; Džaferović, E.; Kadrić, D.; Metović, S.; Hasečić, A. Temperature and density distribution in an industrial stenter frame based on three-dimensional numerical simulation. Text. Res. J. 2022, 92, 2317–2326. [Google Scholar] [CrossRef]
- Akan, A.E.; Ozkan, D.B. Experimental examination and theoretical modeling of drying behavior in the ram machine. Dry. Technol. 2020, 38, 1760–1775. [Google Scholar] [CrossRef]
- Akan, A.E.; Özkan, D.B. Determination of drying behaviour in industrial type convectional dryer and mathematical modelling. Therm. Sci. 2020, 24, 1935–1950. [Google Scholar] [CrossRef]
- Akan, A.E.; Ünal, F. Thin-Layer Drying Modeling in the Hot Oil-Heated Stenter. Int. J. Thermophys. 2020, 41, 114. [Google Scholar] [CrossRef]
- Baxi, H.; Patel, A.; Barve, J. (Eds.) Modelling and Simulation of Dryer System. In Proceedings of the 2015 International Conference on Industrial Instrumentation and Control (ICIC), Pune, India, 28–30 May 2015; IEEE: New York, NY, USA, 2015. [Google Scholar]
- Patel, N.G.; Shendage, D.J.; Parikh, M.G.; Basu, S.K.; Bade, M.H. Energy model-based benchmarking of the drying process in the stenter machine. Dry. Technol. 2021, 39, 1114–1133. [Google Scholar] [CrossRef]
- Juraeva, M.; Ryu, K.J.; Song, D.J. Optimum design of the injection duct system of a stenter machine. J. Mech. Sci. Technol. 2017, 31, 2279–2285. [Google Scholar] [CrossRef]
- Sığırcı, M.T.; Erdoğan, A. Ram makinelerindeki hava akışının Hesaplamalı Akışkanlar Dinamiği ile modellenmesi. Niğde Ömer Halisdemir Üniversitesi Mühendislik Bilim. Derg. 2022, 11, 207–216. [Google Scholar]
- Kamer, M.S.; Erdoğan AH ME, T.; Tacgun, E.; Sonmez, K.E.R.İ.M.; Kaya, A.; Aksoy, I.G.; Canbazoglu, S. A performance analysis on pressure loss and airflow diffusion in a chamber with perforated V-profile diffuser designed for air handling units (AHUs). J. Appl. Fluid Mech. 2018, 11, 1089–1100. [Google Scholar] [CrossRef]
- Standard A. Standard 111-1988; Practices for Measurement, Testing, Adjusting, and Balancing of Building Heating, Ventilation, Air-Conditioning, and Refrigeration Systems. American Society of Heating. Refrigeration, and Air-Conditioning Engineers, Inc.: Peachtree Corners, GA, USA, 1988.
- Guide, ANSYS FLUENT User. Release 14.0. ANSYS. Inc.: USA, 2011. Available online: https://www.afs.enea.it/project/neptunius/docs/fluent/html/th/main_pre.htm (accessed on 22 September 2023).
- Ertekin, G.; Oğlakçıoğlu, N.; Marmaralı, A. Physical, Dimensional and Visual Properties of Cotton/Spandex Plain Knit Fabrics. J. Text. Eng. 2018, 25, 146–153. [Google Scholar] [CrossRef]
- Wilmer Parra Llanos, J.; Mailde Santos, R.; Bastos Quadri, M.; Oliveira Martins, I. Phenomenological modeling and simulation of a textile stenter. Text. Res. J. 2020, 92, 2205–2222. [Google Scholar] [CrossRef]


| Porosity—β | Injector Angle—α | Airflow Velocity—Va | Fabric Velocity—Vf |
|---|---|---|---|
| (-) | (°) | (m/s) | (m/s) |
| 0.05 | 0 | 0.5 | 0.25 |
| 0.1 | 10 | 1 | 0.3 |
| 0.2 | 20 | 2 | 0.35 |
| 0.3 | 30 | - | - |
| 0.4 | - | - | - |
| Fabric | Thickness | Porosity | Density | Specific Heat Capacity | Coefficient of Heat Conduction |
|---|---|---|---|---|---|
| (mm) | (-) | (kg/m3) | (kJ/kg·K) | (W/m·K) | |
| Full Lycra | 1 | 0.5 | 266.39 | 1989.37 | 0.0555 |
| Analysis | Fabric Temperature (K) | Error (%) |
|---|---|---|
| Industrial | 122.82 | - |
| Standard k-ε | 111.99 | 8.82 |
| RNG k-ε | 107.56 | 12.42 |
| Realizable k-ε | 117.97 | 3.95 |
| Standard k-ω | 112.58 | 8.34 |
| SST k-ω | 112.81 | 8.15 |
Disclaimer/Publisher’s Note: The statements, opinions and data contained in all publications are solely those of the individual author(s) and contributor(s) and not of MDPI and/or the editor(s). MDPI and/or the editor(s) disclaim responsibility for any injury to people or property resulting from any ideas, methods, instructions or products referred to in the content. |
© 2024 by the authors. Licensee MDPI, Basel, Switzerland. This article is an open access article distributed under the terms and conditions of the Creative Commons Attribution (CC BY) license (https://creativecommons.org/licenses/by/4.0/).
Share and Cite
Erdoğan, A.; Sığırcı, M.T. Computational Fluid Dynamic Simulation of Fabric Cooling in a Stenter Machine. Appl. Sci. 2024, 14, 1103. https://doi.org/10.3390/app14031103
Erdoğan A, Sığırcı MT. Computational Fluid Dynamic Simulation of Fabric Cooling in a Stenter Machine. Applied Sciences. 2024; 14(3):1103. https://doi.org/10.3390/app14031103
Chicago/Turabian StyleErdoğan, Ahmet, and Muhammet Tibet Sığırcı. 2024. "Computational Fluid Dynamic Simulation of Fabric Cooling in a Stenter Machine" Applied Sciences 14, no. 3: 1103. https://doi.org/10.3390/app14031103