Article

Experimental Study of the Soil Water Dissipation Law of Vegetated Slopes under Natural Evaporation Conditions

1
Department of Civil Engineering, Architecture and Environment, Hubei University of Technology, Wuhan 430068, China
2
Innovation Demonstration Base of Ecological Environment Geotechnical and Ecological Restoration of Rivers and Lakes, Hubei University of Technology, Wuhan 430068, China
3
Key Laboratory of Intelligent Health Perception and Ecological Restoration of Rivers and Lakes, Ministry of Education, Hubei University of Technology, Wuhan 430068, China
*
Author to whom correspondence should be addressed.
Appl. Sci. 2024, 14(3), 1105; https://doi.org/10.3390/app14031105
Submission received: 12 January 2024 / Revised: 24 January 2024 / Accepted: 26 January 2024 / Published: 28 January 2024

Abstract

:
Under the combined action of soil evaporation and vegetation transpiration, the law of soil water dissipation at different depths of vegetated slopes is unknown and the related influencing factors are unclear. In this paper, six large-scale slope models were constructed for long-term dynamic monitoring of soil water. The effects of slope ratio and vegetation on the dynamic changes in soil water at different depths were analyzed. Pearson correlation analysis was used to analyze the relationship between slope conditions, meteorological factors, and soil water dissipation. The results show that under the condition of natural evaporation, slope ratio has little effect on the dynamic change in soil water in bare slopes. However, the greater the slope ratio of vegetated slopes, the faster the soil water decreases in the 40 cm depth range. Additionally, soil water dissipation follows a logarithmic functional relationship with evaporation time in both bare and vegetated slopes. The correlation between slope conditions and soil water dissipation is stronger than that of meteorological factors. The research results can provide some theoretical support for exploring the hydrological effects of vegetated slopes.

1. Introduction

In last few decades, China has embarked on an engineering boom in the transport, water, and mining sectors. However, this construction has had detrimental effects on soil structure and the ecological environment, resulting in numerous exposed slopes and an increased risk of geological disasters such as landslides and debris flows [1]. In order to restore damaged slope structures and the natural ecological environment, slope vegetation restoration technologies such as artificial grass planting and concrete vegetation slope protection are relatively mature [2,3,4]. The roots of the plants strengthen the slope in terms of structure and soil water reduction [5]. However, blindly applying vegetation restoration technology may worsen soil water depletion in certain areas, resulting in ecosystem degradation and more severe geological disasters [6]. Conducting a quantitative analysis of soil water dissipation from vegetated slopes is essential for optimizing slope ecological restoration measures and providing a scientific basis for slope ecological restoration. Therefore, studying the soil water dissipation of vegetated slopes holds great significance in the field of environmental geotechnics.
Water exchange between the atmosphere and the soil occurs continuously on vegetated slopes. The main form of soil water exchange is evapotranspiration [7]. Slope instability can occur due to changes in soil properties resulting from water exchange. Some scientists have conducted research to explore the relationship between plants and soil water dissipation. The study by Katul et al. [8] reveals that plant transpiration is the largest component of soil water dissipation. Scharwies and Dinneny [9] and Zhu et al. [10] have concluded that plant transpiration and root water uptake are influenced not only by climatic conditions such as light, temperature, and humidity, but also by the structure and depth of plant roots. Zhang et al. [11] found that various factors including vegetation cover, height, leaf area, shallow root distribution, and slope ratio significantly affect soil water. Research by Marín-Castro et al. [12] not only demonstrates that vegetation helps reduce soil water loss, but that the litter produced by vegetation also aids in conserving soil water. Van Loon et al. [13] discovered that water uptake and transpiration by plant roots not only provide energy for plant growth, but also promote the evaporation of slope water, altering soil suction and reducing soil bulk density. Hence, there exists a close relationship between soil water and vegetation.
Soil water dissipation is a topic that has been extensively explored by researchers in terms of its correlation with meteorological and environmental factors. Du et al. [14] discovered that soil water dissipation occurs as a result of interactions with plants, as well as environmental and meteorological factors. This process involves the self-regulation of soil water through potential energy and plant roots after infiltration. Alongside meteorological factors, Xu et al. [15] also examined the influence of different terrains and slope ratios on soil water dissipation in terraces. Liu et al. [16] carried out a study on plantations in the Yangtze River Delta region and observed that soil water loss was associated with atmospheric temperature, humidity, rainfall, barometric pressure, and wind speed. Moreover, the influence of meteorological factors on soil water exhibits variations across diverse regions. Although significant progress has been made in understanding the influence of soil water dissipation, current research primarily focuses on agricultural and forestry fields and forests. However, the impact of different terrain and vegetation conditions on soil water dissipation is not the same. Hence, it is imperative to investigate the soil water dissipation of slopes in the field of environmental geotechnical engineering.
This paper conducted a long-term dynamic monitoring test to study the natural evaporation of a large-scale slope model. The study analyzed the impact of identical rainfall conditions on the initial water conditions of different types of slopes. Additionally, it investigated the water dissipation pattern of soil layers at various depths of the slope under natural evaporation conditions. A logarithmic function model is established and fitted to represent soil water dissipation. The study also analyzed the influence and mechanism of vegetation, slope ratio, and meteorological factors on soil water dissipation in slopes. The objective of this research is to provide theoretical support for understanding the hydrological effects of vegetated slopes in the field of environmental geotechnics.

2. Materials and Methods

2.1. Model of the Slope

The slope model test was conducted at the Hubei University of Technology’s Innovation Demonstration Base of Ecological Environment Geotechnical and Ecological Restoration of Rivers and Lakes. The base is located in Wuhan City, Hubei Province, with a geographical location of E114°30′ and N30°.46′. Previous research has indicated that slope instability is primarily concentrated between 25° and 40° [17]. For the test slope model, three different slope ratios were used: 1:1.5 (33.69°), 1:1.75 (29.74°), and 1:2 (26.57°). A total of 6 slopes were constructed, with each slope ratio consisting of a bare slope and a vegetated slope planted with Bermuda grass. Each slope had a height of 2 m and a width of 1.5 m. The soil beneath slopes is common clay in Wuhan, so the monitored soil water infiltration and evaporation are not affected by it. This large-scale slope test model was designed to accurately represent real slope conditions while minimizing the impact of scale effects. An artificial rainfall system device and meteorological monitoring instruments were installed on the hardened site, and the slope model is depicted in Figure 1.

2.2. Test Soil Sample

The test soil sample used in this study was obtained from the shallow clay of a hillside in Wuhan. The physical property indexes of the soil sample are presented in Table 1, while the particle gradation curve can be seen in Figure 2. After collecting the soil sample, it was air-dried, crushed, and screened, with impurities then removed. The initial water content of the soil sample was approximately 20%. The slope filling process was performed in layers, with each layer consisting of a 20 cm thick soil sample. The maximum thickness of the soil layer reached 160 cm. The mass of soil required to reach the design line at natural density was calculated, and the compactor was used to compact the soil 3–5 times along the parallel direction of the slope. To ensure tight bonding between each layer, a scraping treatment was conducted between the middle layer and the layer above. This process effectively eliminated impurities and ensured the homogeneity of the model soil.

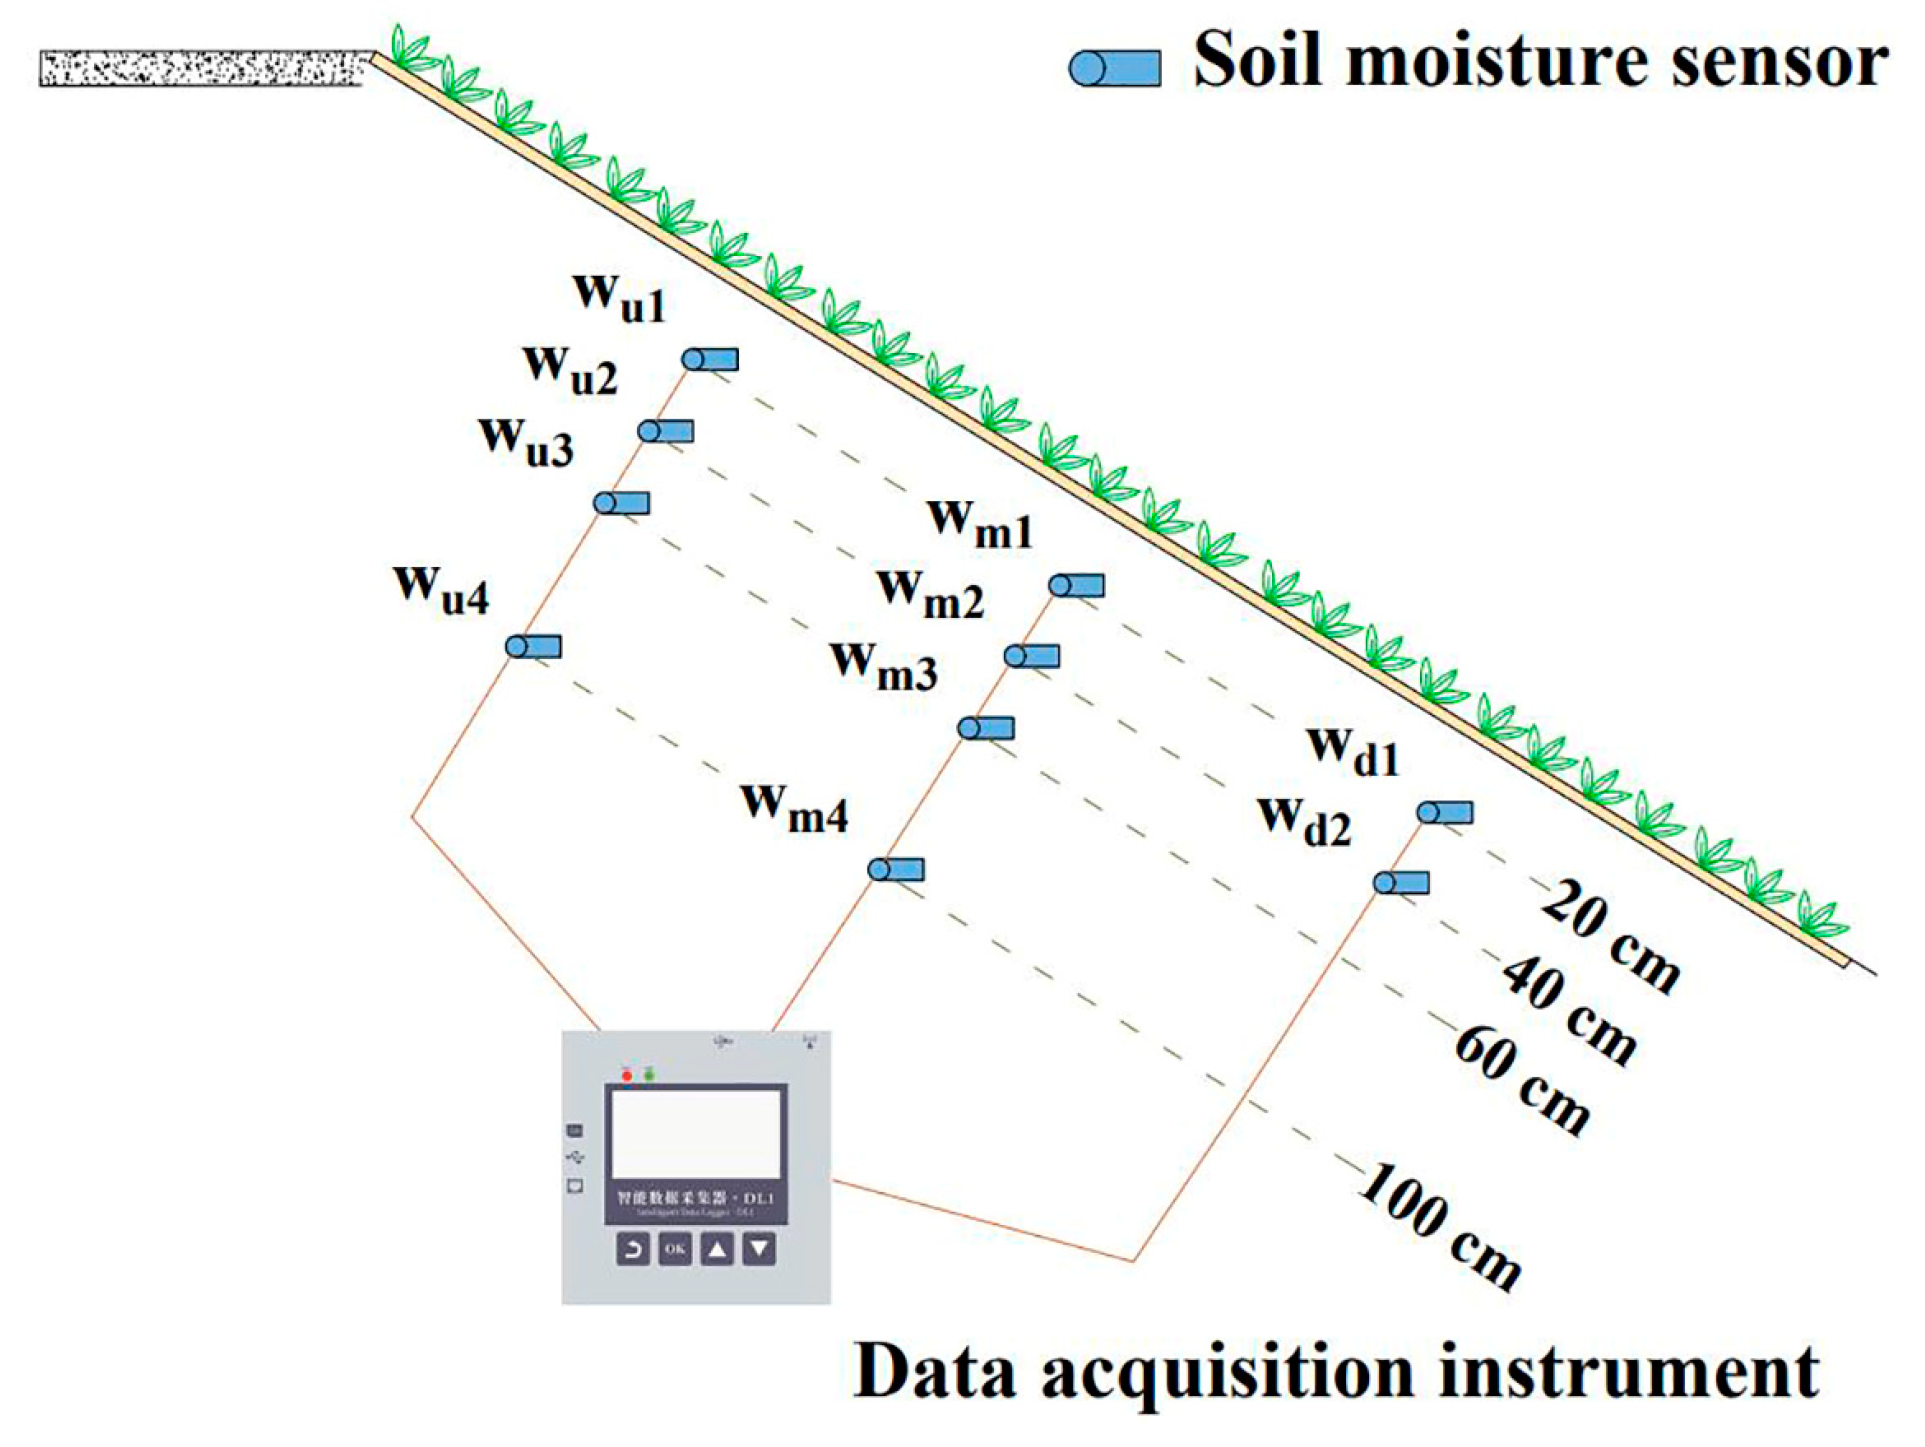
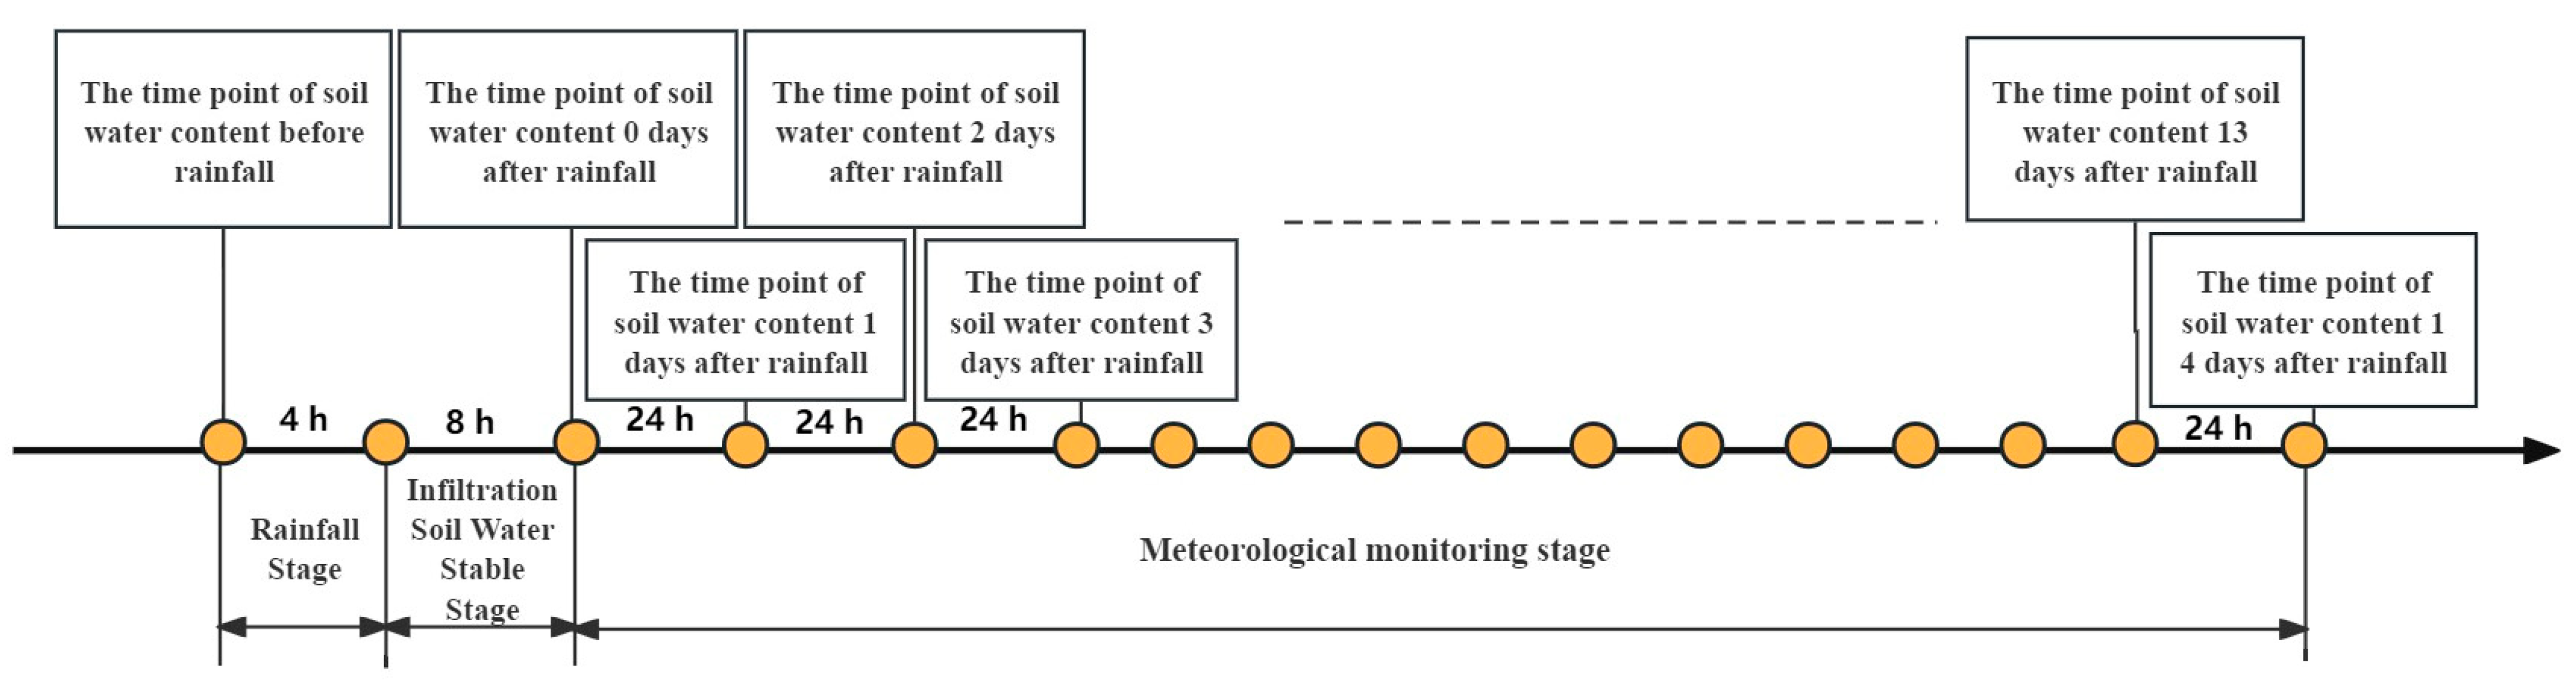
2.3. Experimental Equipment and Scheme

The main components of an artificial rainfall system include a control host, a pump, a bucket, a number of sprinklers, and a rain bracket, as shown in Figure 3. The system pressurizes water through the pump to form a spray that is ejected from the nozzle. After testing, the rainfall uniformity of the artificial rainfall system is more than 0.87 and the raindrop diameter is between 1.2 mm and 2.8 mm, which can simulate real rainfall. In Wuhan, rainfall is primarily concentrated in the summer and is characterized by short duration, high intensity, and abundant precipitation. For this experiment, a duration of 4 h and a constant rainfall intensity of 60 mm/h were selected as the input conditions for the simulated rainfall.
Each slope is equipped with 10 moisture monitoring instruments. These monitoring instruments are high-precision soil volumetric water content sensors (SWR-100) with a range of 0~100% and an accuracy of 0.1%. They are positioned along the central axis of the lateral slope at depths of 20 cm, 40 cm, 60 cm, and 100 cm below the slope surface. The monitoring instruments are divided into three sections: wu1 to wu4, wm1 to wm4, and wd1 to wd2. These sections are located at 1/4, 1/2, and 3/4 of the slope length perpendicular to the slope. The specific layout of the sensors can be seen in Figure 4. The soil water content at different depths of each slope was continuously monitored in real time. Under conditions of natural evaporation after the end of rainfall, the dynamic changes in soil water content in both the bare slope and the vegetated slope were compared and analyzed at different slope ratios.
The meteorological monitoring instrument was a PH automatic weather station located on the model slope within the experimental area, as shown in Figure 5. This station allows for real-time monitoring of rainfall, wind speed and direction, atmospheric temperature, and humidity within the test site.

3. Results and Discussion

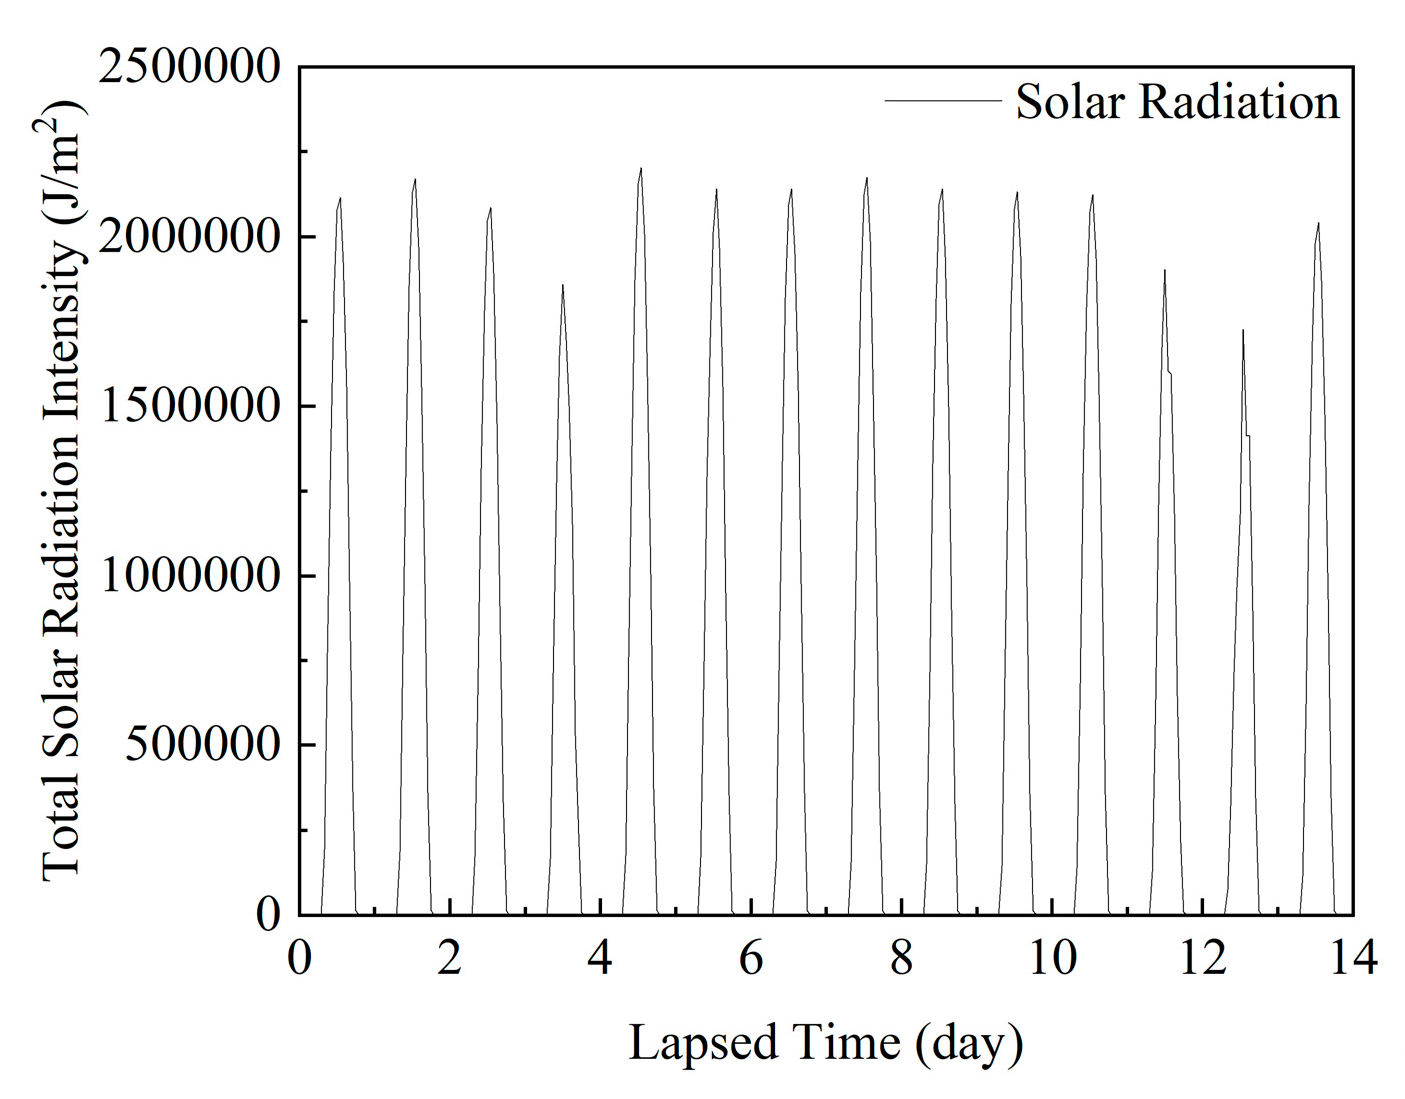
3.1. Meteorological Conditions during the Experimental Period

The test area experienced no rainfall during the natural evaporation period. Meteorological information monitoring began 8 h after the rainfall ended and continued for a duration of 14 days. The experiment can be separated into three stages: the rainfall stage, the soil water content stability stage, and the meteorological monitoring stage. The relationship between these stages is illustrated in Figure 6. Figure 7, Figure 8 and Figure 9 depict the variation curves of atmospheric temperature and humidity, wind speed, and total solar radiation intensity throughout the test period. The monitoring period revealed that the atmospheric temperature ranged from 4.2 °C to 19.4 °C, humidity ranged from 19.6% to 99.6%, the maximum wind speed recorded was 6.1 m/s, and the maximum total solar radiation intensity reached 2.204 × 10⁶ down·J/m2.

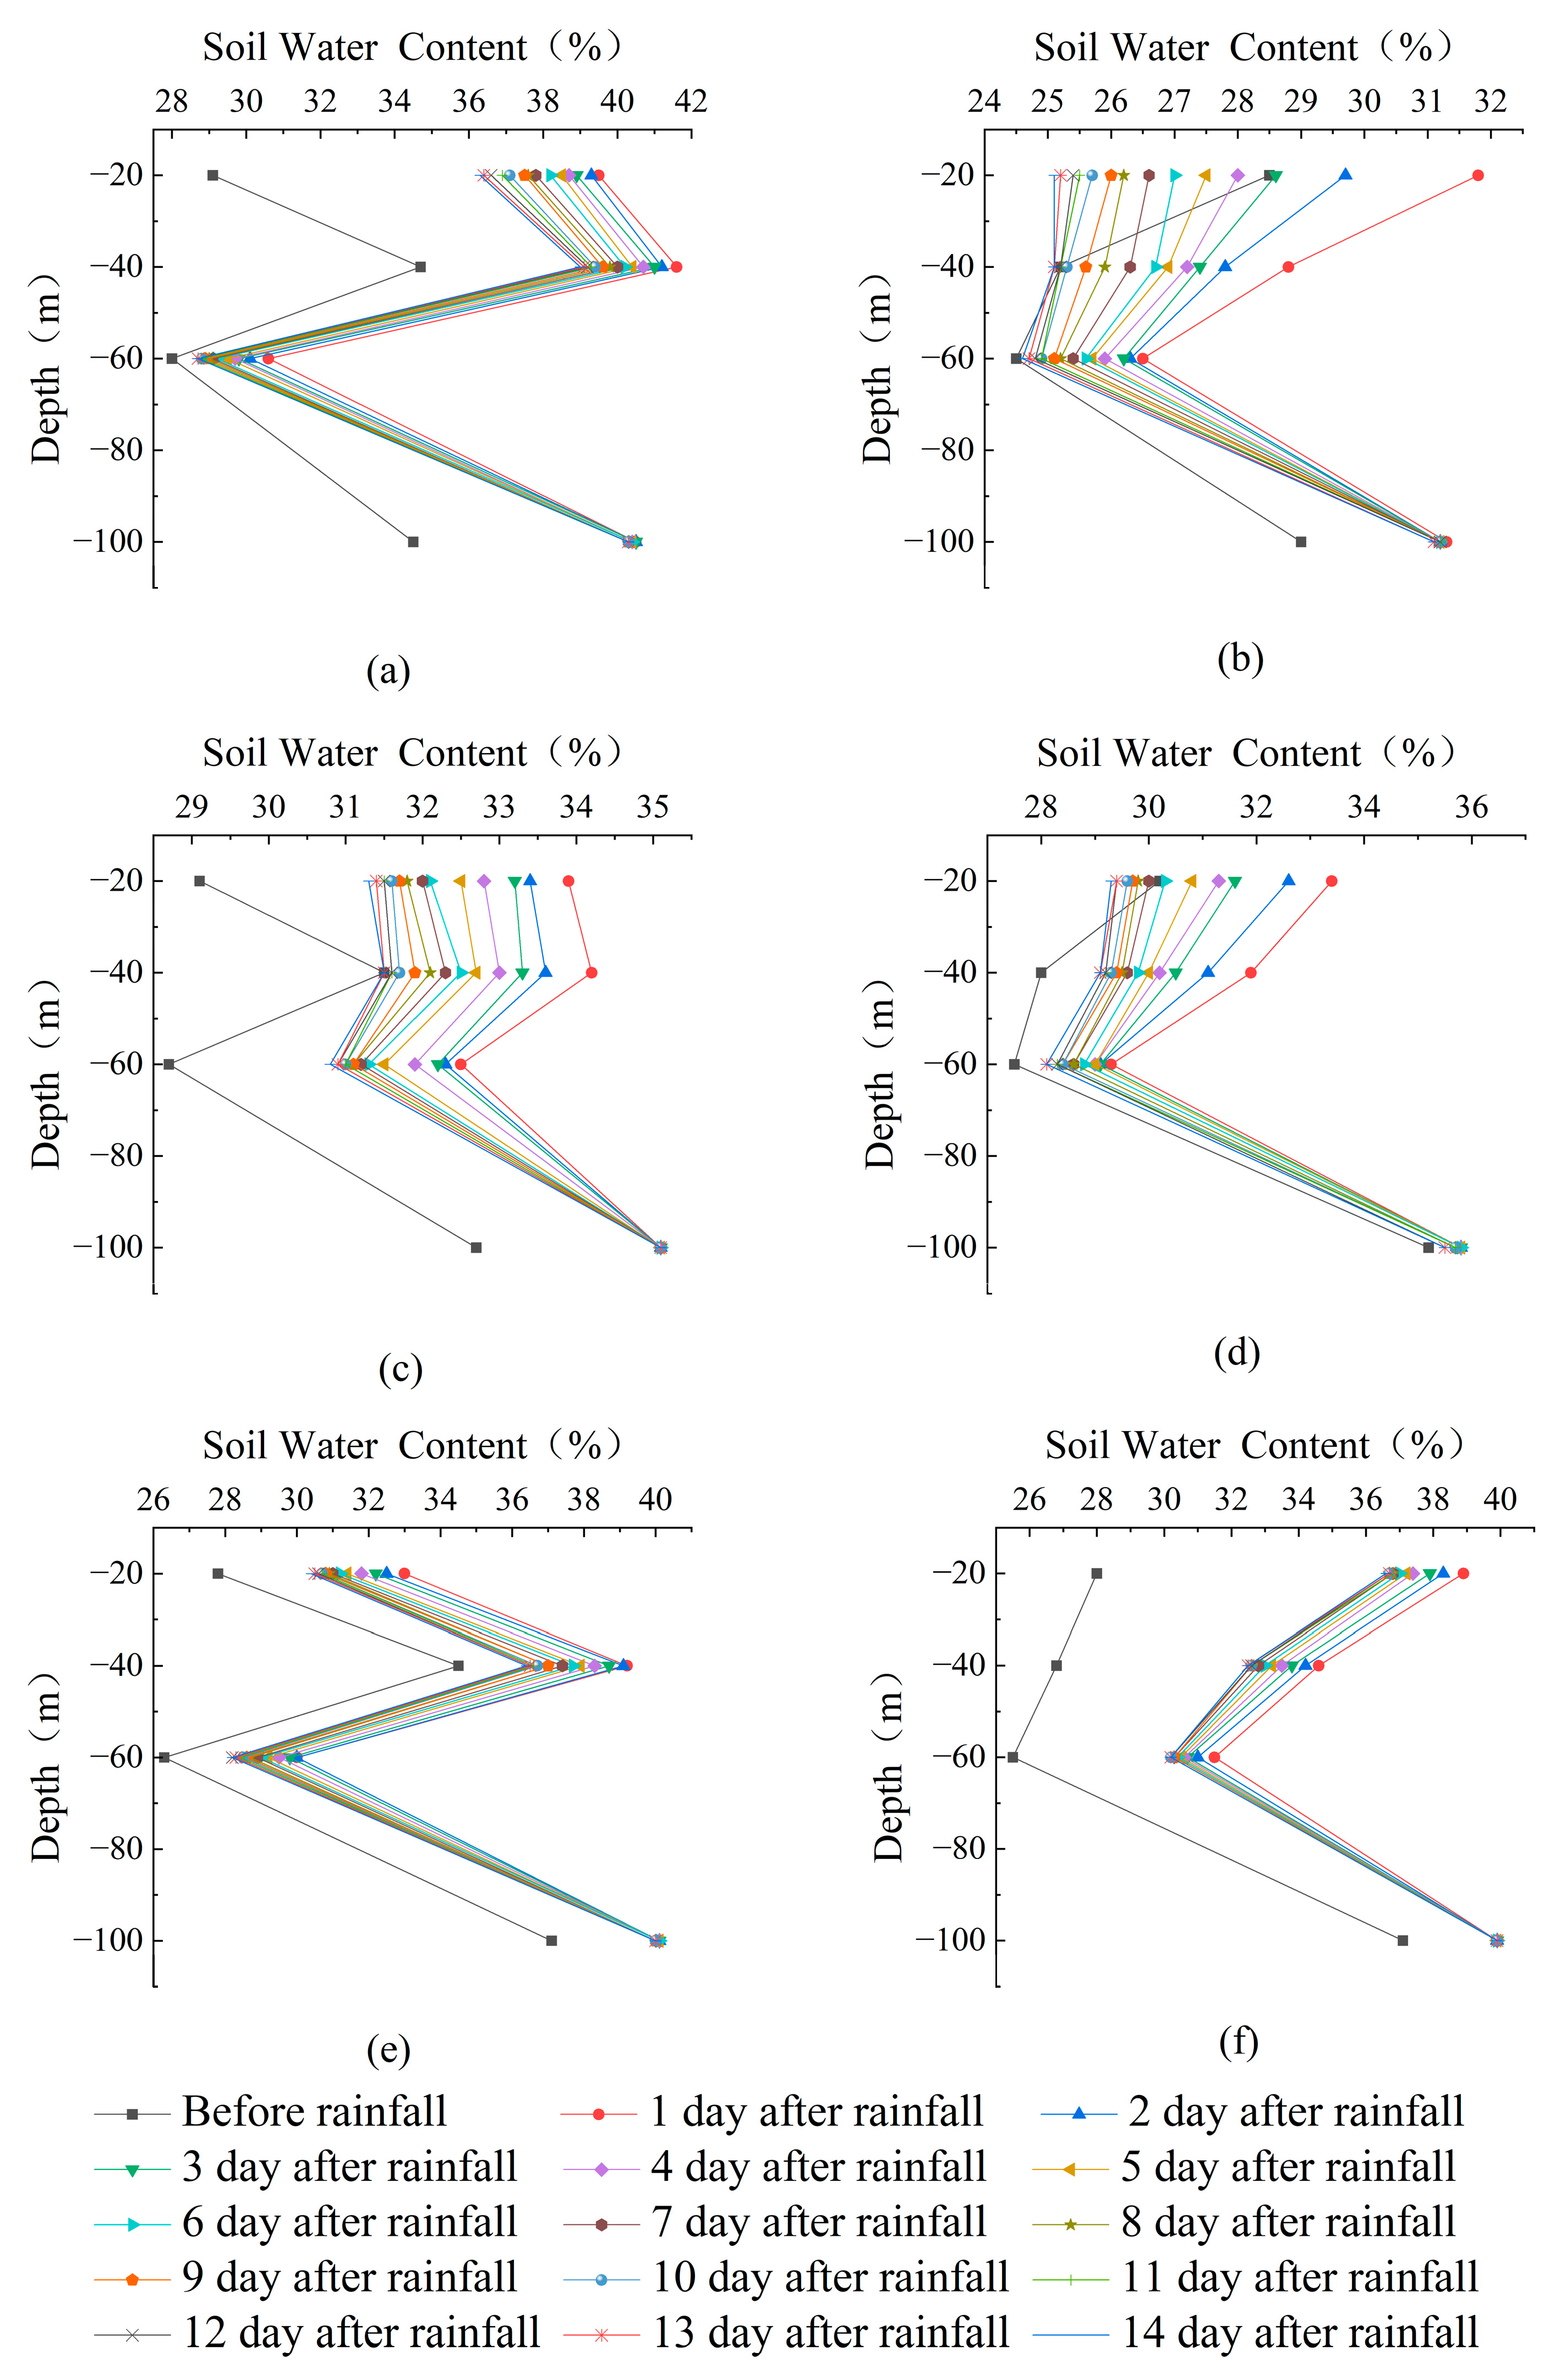
3.2. Initial Water Distribution of the Slope

By monitoring the change in soil water content, the study obtained data on the increase in soil water content in bare slopes and vegetated slopes with different slope ratios and depths. The results are presented in Figure 10 and Figure 11. The figures demonstrate that, as the soil depth increases, the growth rate and peak increment of soil water content decrease for each slope. The maximum increments in soil water content (arrival time) for bare slopes with slope ratios of 1:1.5, 1:1.75, and 1:2 were 13.0% (90 min), 12.0% (140 min), and 11.8% (160 min), respectively. For vegetated slopes with slope ratios of 1:1.5, 1:1.75, and 1:2, the maximum increase in soil water content (arrival time) was 12.8% (130 min), 16.1% (210 min), and 21.3% (240 min), respectively. The rate and peak value of increase in shallow soil water content decrease with a greater slope ratio for bare slopes, while the difference in deep layers is not significant. In contrast, the change in soil water content for vegetated slopes is opposite to that of bare slopes. The soil water content of vegetated slopes increases faster with a greater slope ratio, but the peak value of soil water content increment is smaller. Additionally, the peak value of soil water content increment for shallow soil in vegetated slopes is greater than that of bare slopes at each slope ratio.
After the rainfall ended, the soil water content decreased the most when the slope ratio of the bare and vegetated slopes was 1:1.75. In the bare slope with a slope ratio of 1:1.75, the maximum water content reduction was observed in the 20 cm, 40 cm, 60 cm, and 100 cm soil layers, with decreases of 5.4% (240 min), 4.5% (240 min), 1% (300 min), and 1.2% (300 min), respectively. Similarly, in the slope with vegetation and a slope ratio of 1:1.75, the maximum reduction in water content at soil depths of 20 cm, 40 cm, 60 cm, and 100 cm (the time at which soil water began to decrease) was 10.5% (220 min), 6.3% (240 min), 2.8% (260 min), and 0.9% (300 min). These results indicate a gradual decrease in soil water content at different depths after the rainfall, with a gradual slowing down of the decline rate over time. Moreover, the soil water content in the vegetated slope decreases more significantly compared to the bare slope with the same slope ratio. As the soil depth increases, the rate of decline in soil water content gradually reduces and the onset of decline is delayed. By the eighth hour after the rainfall ended, the water content in the soil layer at each depth of the slope had stabilized. This time is therefore used as the initial stage of water distribution on slopes under the condition of natural evaporation.

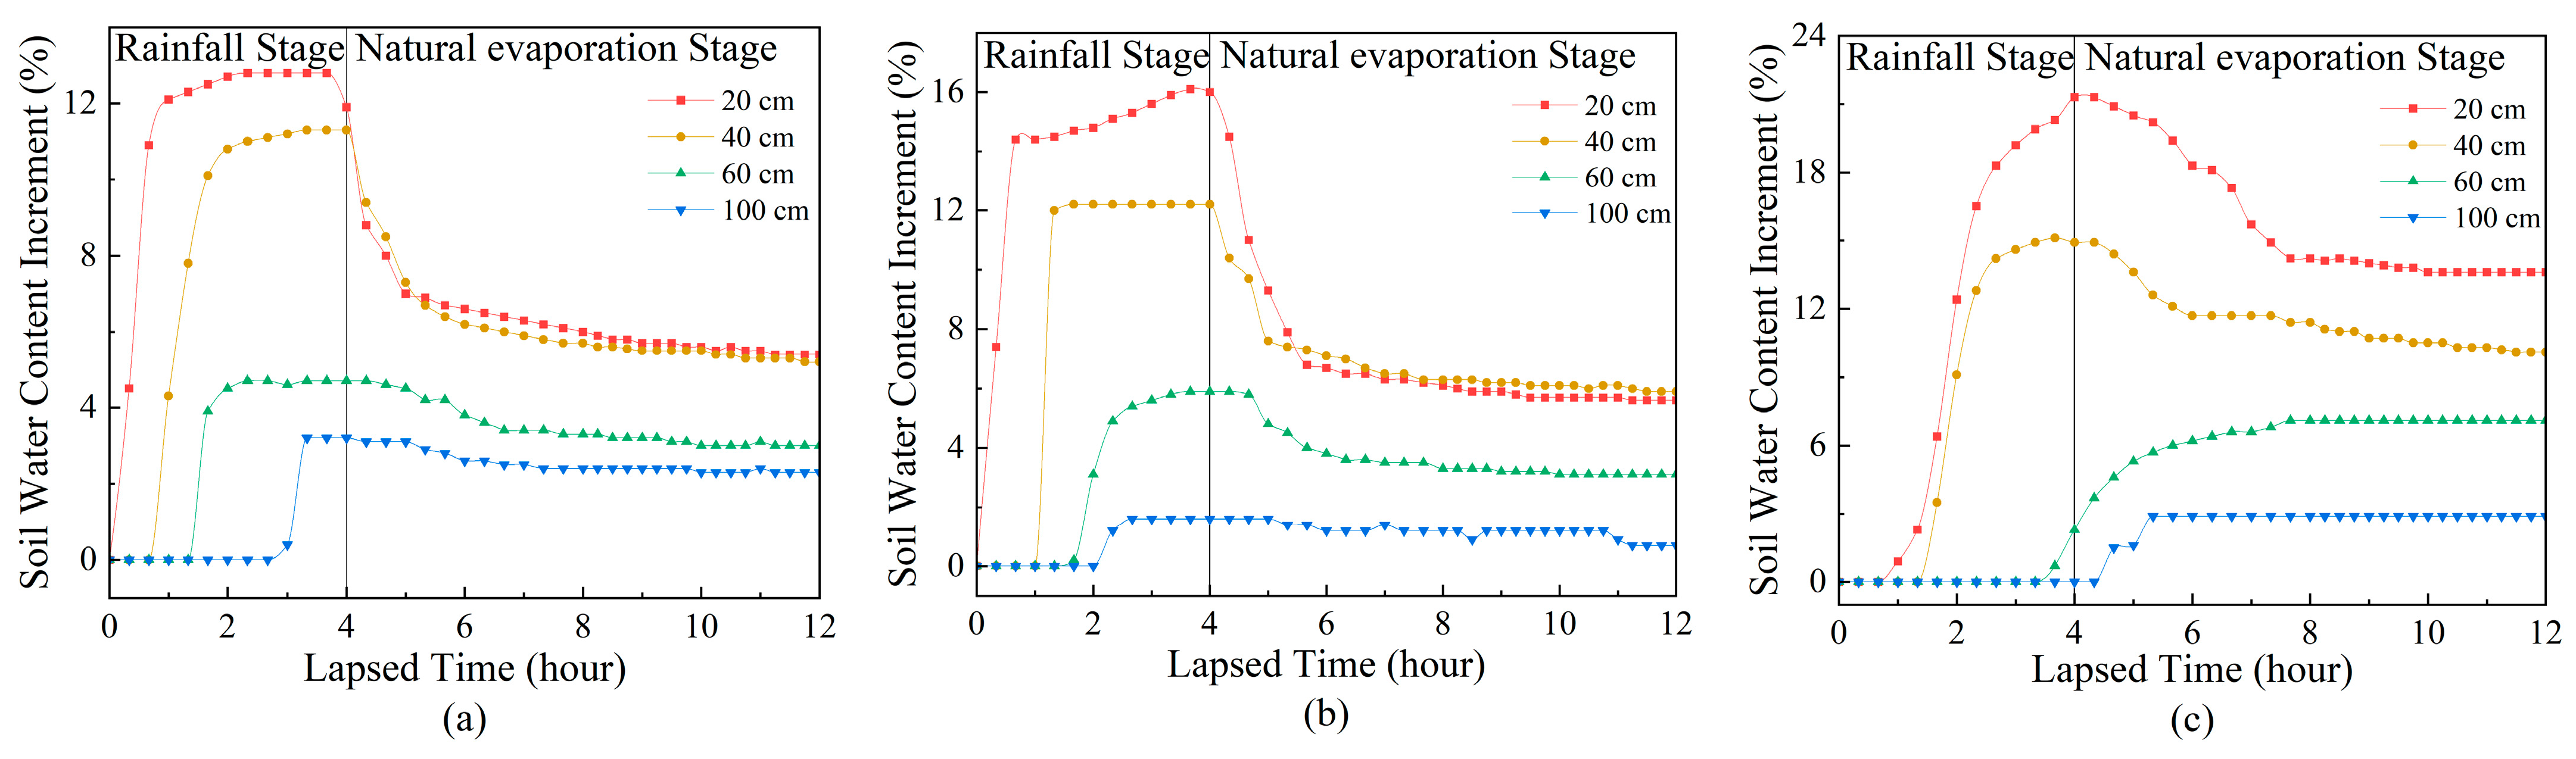
3.3. Soil Water Change in Slopes under Natural Evaporation Conditions

3.3.1. The Law of Total Variation in Slope Soil Water under Natural Evaporation Conditions

The diurnal variation in soil water content at different depths during the natural evaporation stage is depicted in Figure 12. For ease of illustration, the figure includes the soil water content before rainfall. It can be observed that the initial water content of slopes with the same slope protection mode is relatively similar at different slope ratios and depths before rainfall. When the initial water content is high, its impact on the soil water field distribution of the slope is somewhat limited [18]. Hence, the impact of the initial water content on the distribution of the soil water content in the profile can be disregarded.
The test results shown in Figure 12 indicate that the soil water content at each depth reaches its maximum within the first day after rainfall. With the exception of a few vegetated slopes, the soil water content 14 days after rainfall is higher than before the rainfall but gradually decreases to the level before the rainfall. As natural evaporation continues after the rainfall, the potential energy of soil water in the upper layer decreases. Consequently, soil water starts to move slowly upwards in the form of capillary water, primarily influenced by the soil matrix potential [19]. As time passes after rainfall, the rate of water migration in the soil gradually slows down and the soil water content tends to stabilize.
In the process of natural evaporation, Bermuda grass has a marked effect on soil water content, with its range of influence reaching over 100 cm. This influence is more pronounced within the top 40 cm of soil depth but becomes less significant at depths greater than 60 cm. When the distance from the slope surface is 100 cm, the influence of rainfall on soil water content is greater, while evaporation has a limited impact. The soil water content of the bare slope decreases in the following order from the slope surface: 100 cm, 40 cm, 20 cm, and 60 cm. Conversely, the soil water content of the vegetated slope decreases in the following order from the slope surface: 100 cm, 20 cm, 40 cm, and 60 cm. This difference is due to the presence of a thicker matrix epiphytic layer in the topsoil (10–30 cm) of herbaceous plants, which has a higher water-holding capacity [20]. Consequently, the soil water content at a depth of 20 cm is higher in the vegetated slope compared to a depth of 40 cm. This is in contrast to the soil water distribution in the bare slope. Bermuda grass on vegetated slopes has the ability to enhance slope water redistribution. It promotes water infiltration, leading to faster natural evaporation efficiency [21,22]. After rainfall, the vegetated slope with the smallest slope ratio experienced the greatest increase in soil water content at each depth. The soil water content at depths of 20 cm, 40 cm, 60 cm, and 100 cm increased from 28%, 26.8%, 25.5%, and 37.1% to 38.9%, 34.6%, 31.5%, and 39.9%, respectively. During the natural evaporation stage, the soil water content on the vegetated slope with the steepest incline decreased from 31.8%, 28.8%, 26.5%, and 31.3% to 25.1%, 25.1%, 24.6%, and 31.1% at depths of 20 cm, 40 cm, 60 cm, and 100 cm. This slope ratio experiences the largest reduction in soil water content among all slope ratios. The findings suggest that vegetated slopes have relatively low water retention capacity, which worsens with steeper slope ratios.

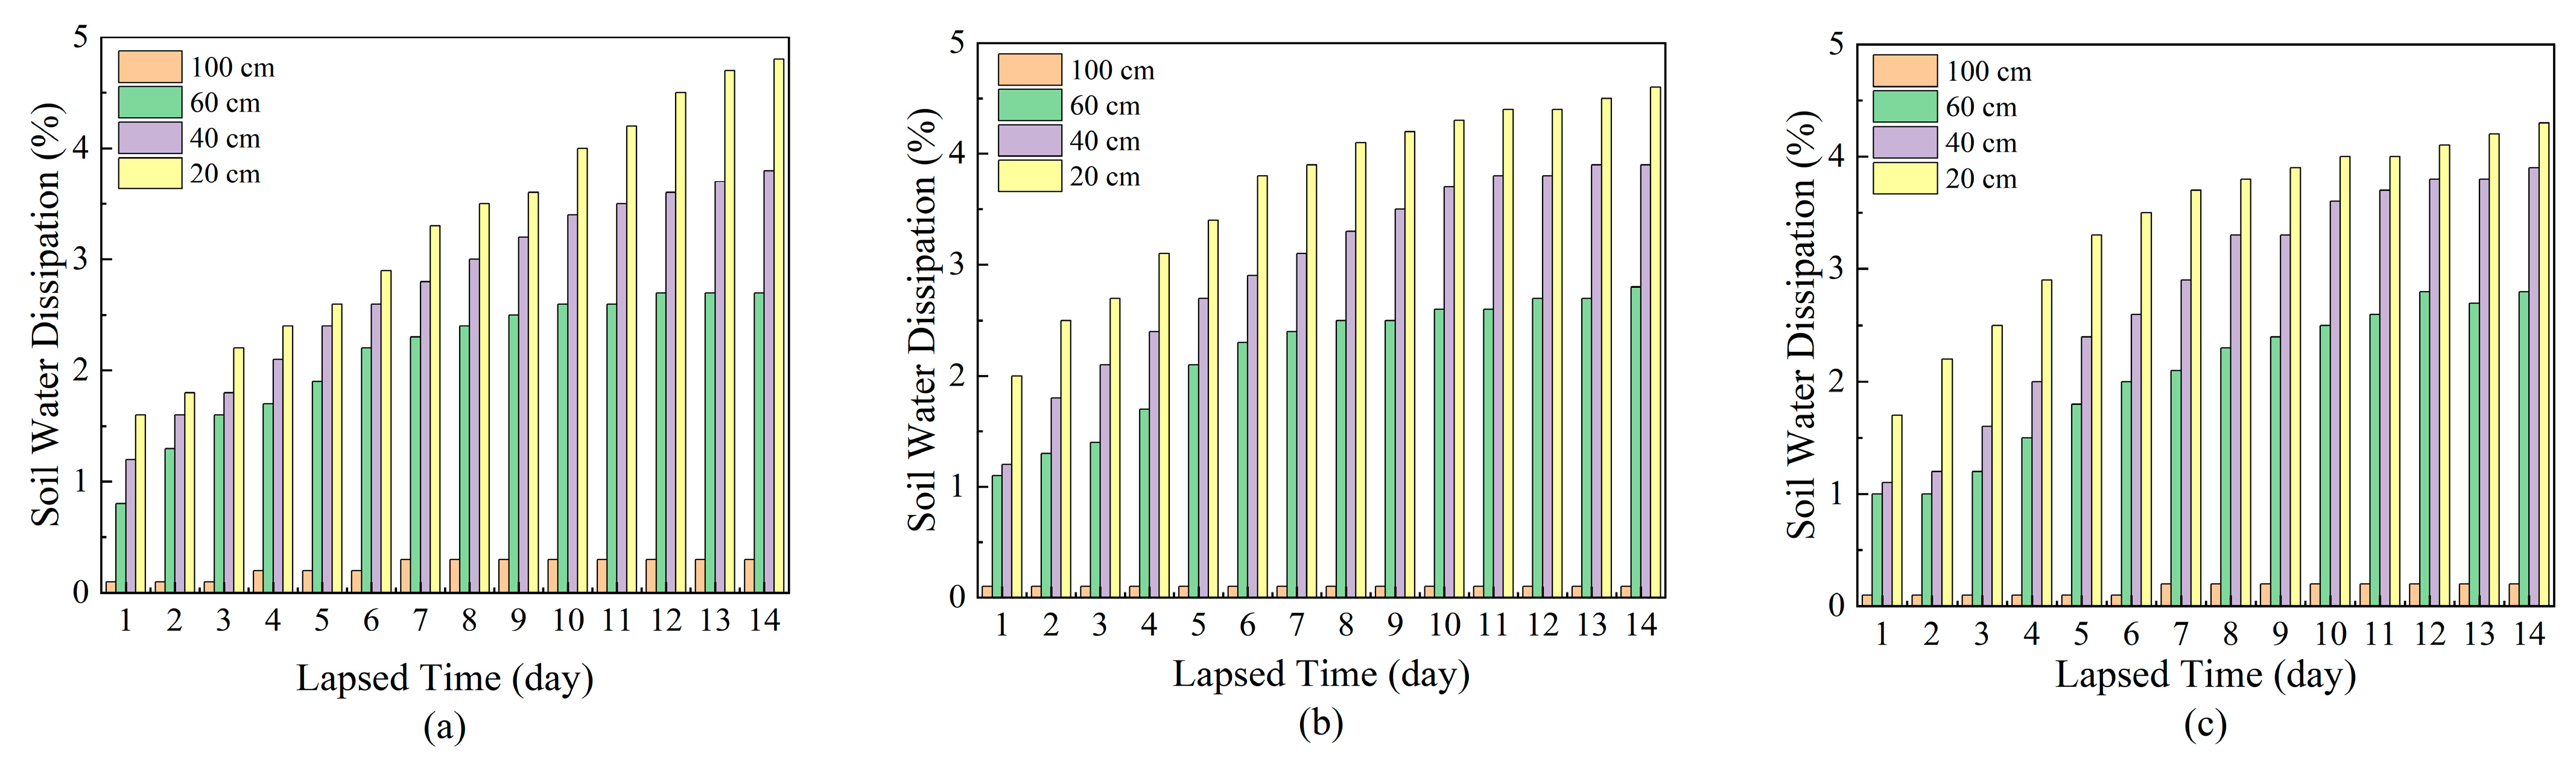
3.3.2. Soil Water Dissipation Law of Bare Slopes under Natural Evaporation Conditions

Under natural evaporation conditions, the dissipation of water content from bare slopes was observed at different depths over the course of 14 days, as depicted in Figure 13. It is evident that the soil water dissipation at a depth of 60 cm gradually increased after rainfall. However, the soil water dissipation at a depth of 100 cm remained almost unchanged for 14 days after the end of rainfall, with a maximum dissipation of only 0.2%. On the first day following the end of rainfall, the soil water dissipation of the slope with a slope ratio of 1:1.5 at depths of 20 cm, 40 cm, and 60 cm was 1.6%, 1.2%, and 0.8%, respectively. For the slope with a slope ratio of 1:1.75, the soil water dissipation at each depth was 2.0%, 1.2%, and 1.1%, respectively. Similarly, for the slope with a slope ratio of 1:2, the soil water dissipation at each depth was 1.7%, 1.1%, and 1.0%, respectively. After 14 days of natural evaporation, the soil water dissipation of the slope with a slope ratio of 1:1.5 at depths of 20 cm, 40 cm, and 60 cm was 4.7%, 3.8%, and 2.7%, respectively. For the slope with a slope ratio of 1:1.75, the soil water dissipation at each depth was 4.6%, 3.9%, and 2.8%, respectively. Similarly, for the slope with a slope ratio of 1:2, the soil water dissipation at each depth was 4.4%, 3.9%, and 2.8%, respectively. It is evident that the dissipation of soil water from the bare slope is most significant within the first day following the end of rainfall under natural evaporation conditions. However, over the next 14 days, the rate of soil water dissipation decreased. The overall trend of soil water dissipation within 14 days indicates a significant decrease in dissipation and dissipation rate with increasing soil depth. However, the slope ratio does not significantly affect the dissipation of soil water on bare slopes. After 14 days of natural evaporation, the trend of soil water dissipation with time is similar across different slope ratios. The maximum difference in soil water dissipation at depths of 20 cm, 40 cm, and 60 cm on bare slopes with varying slope ratios is 0.3%, 0.1%, and 0.1%, respectively. This indicates that the impact of slope ratio on the dynamic change in water content in bare slopes under natural evaporation is not significant. Instead, the depth of the slope soil and the duration of natural evaporation are the main factors influencing water dissipation in bare slopes.

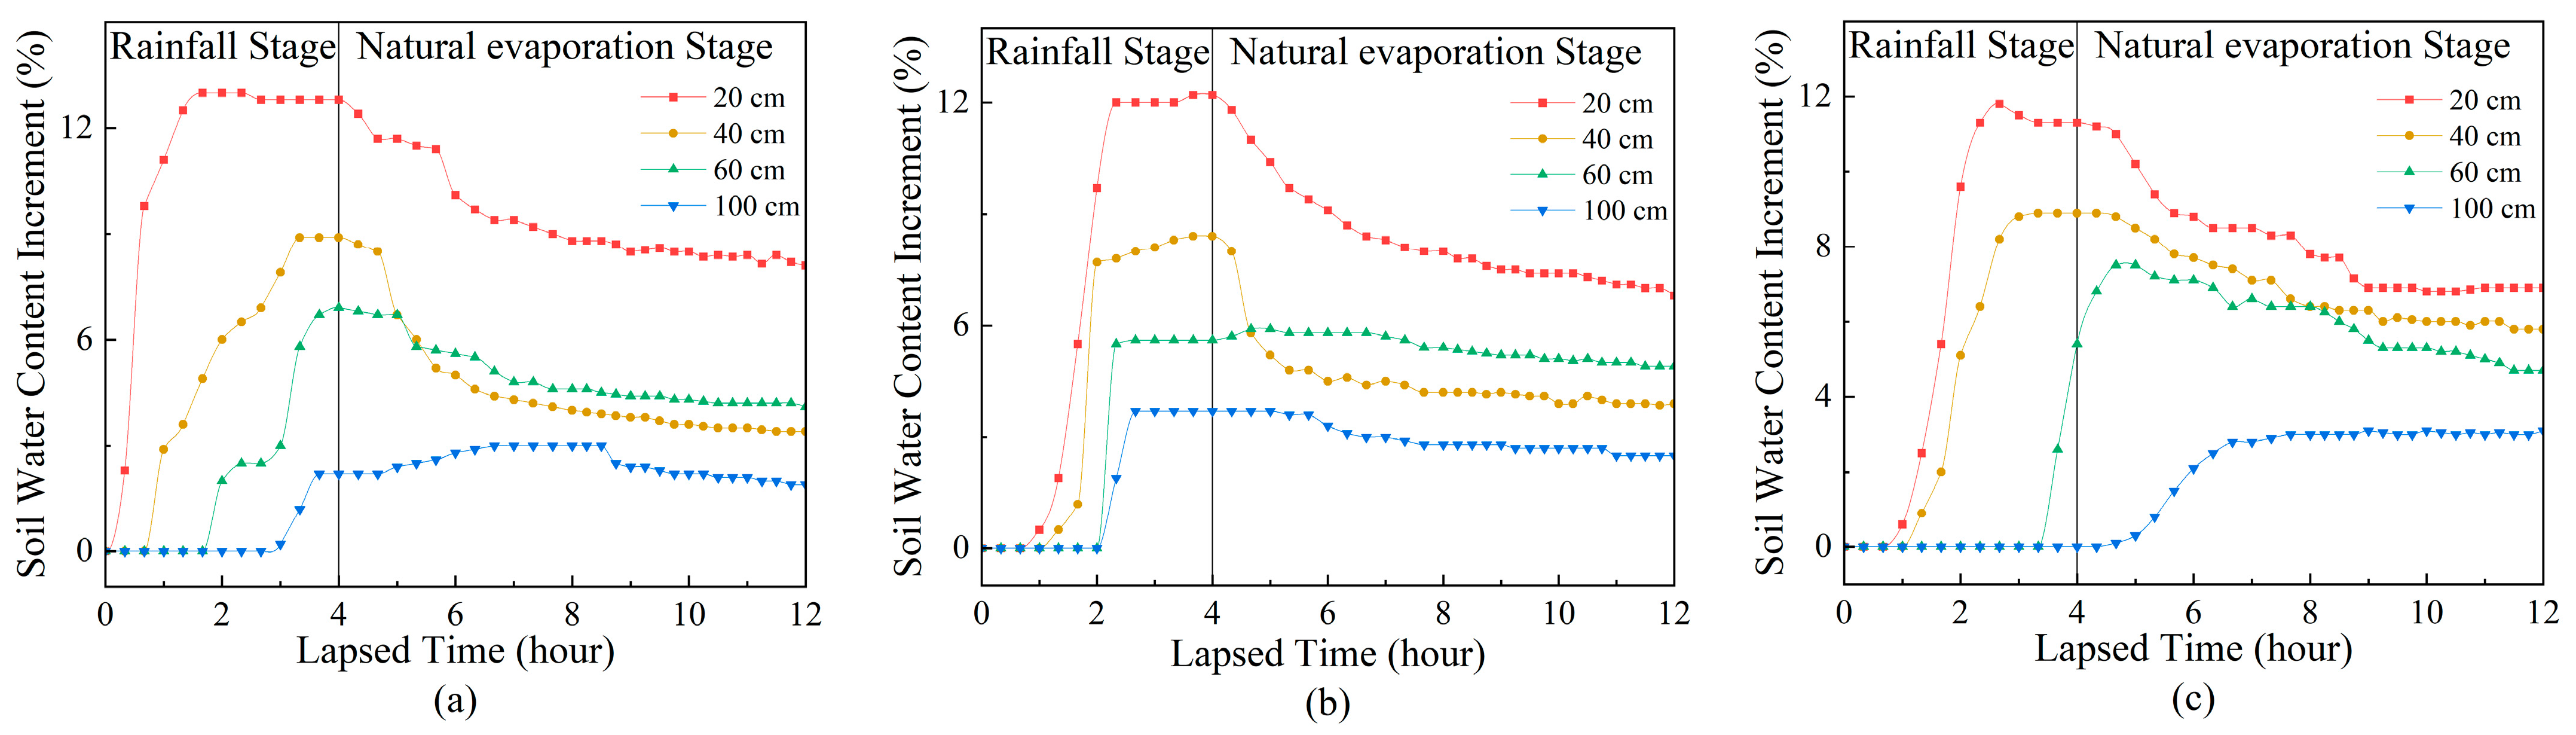
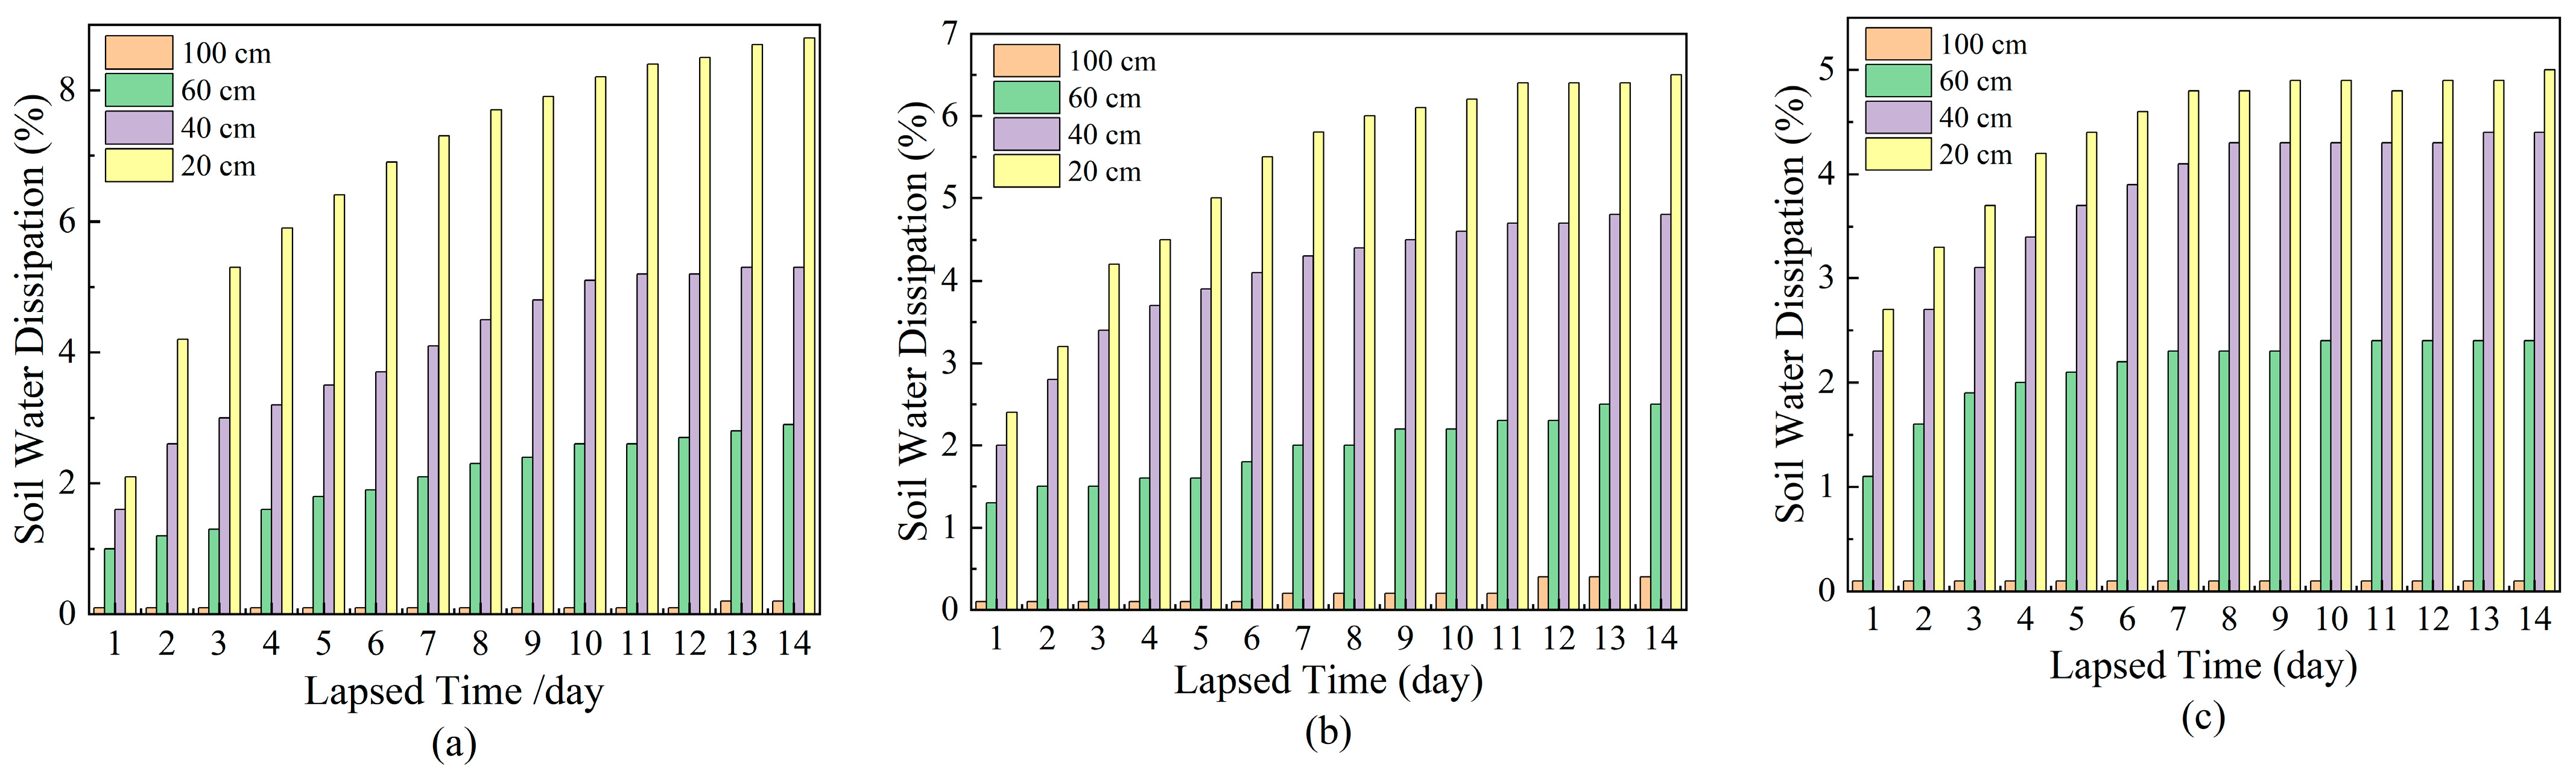
3.3.3. Soil Water Dissipation Law of Vegetated Slopes under Natural Evaporation Conditions

The dissipation of soil water at varying depths of vegetated slopes with several slope ratios over the course of 14 days is presented in Figure 14. From the figure, it is evident that on the first day after the rainfall ceased, the soil water dissipation at depths of 20 cm, 40 cm, and 60 cm in slopes with a slope ratio of 1:1.5 was 2.1%, 1.6%, and 1.1%, respectively. For slopes with a slope ratio of 1:1.75, the soil water dissipation at each depth was 2.4%, 2.0%, and 1.3%, respectively. Similarly, for slopes with a slope ratio of 1:2, the soil water dissipation at each depth was 2.7%, 2.3%, and 1.2%, respectively. These results indicate that higher slope ratios in vegetated slopes lead to lower soil water dissipation within the first day after the end of the rainfall. After 14 days of natural evaporation following rainfall, the soil water dissipation at depths of 20 cm, 40 cm, and 60 cm in slopes with a slope ratio of 1:1.5 was 8.9%, 6.0%, and 2.4%, respectively. For slopes with a slope ratio of 1:1.75, the soil water dissipation at each depth was 6.3%, 4.7%, and 2.2%, respectively. Similarly, for slopes with a slope ratio of 1:2, the soil water dissipation at each depth was 5.0%, 4.0%, and 2.2%, respectively. At a depth of 100 cm in the vegetated slope, the soil water content remained relatively stable over 14 days, with only minimal water dissipation of 0.1%. These findings highlight that soil water dissipation at depths of 20 cm and 40 cm in the vegetated slope is significantly influenced by the slope ratio. A higher slope ratio corresponds to greater soil water dissipation within the 40 cm range. However, there were no notable differences in soil water dissipation between the depths of 60 cm and 100 cm in vegetated slopes with varying slopes.
The trend of soil water dissipation in vegetated slopes over time shows that the rate of soil water dissipation gradually decreases at each depth after rainfall. It is observed that the soil water dissipation rate is faster in shallower depths compared to deeper depths. At a depth of 20 cm, soil water dissipation is similar to that at a depth of 40 cm but significantly different from that at a depth of 60 cm. This law can be attributed to water absorption by plant roots. In order to support its growth and development, vegetation reduces the soil water content of the slope through root absorption and transpiration within its root zone. Consequently, there is a significant decrease in soil water content at depths of 20 cm and 40 cm. As the soil water content decreases in the shallow soil, water from the 60 cm soil layer slowly migrates towards the slope surface to replenish the water content in the shallow soil. As a result, the rate of soil water dissipation at a depth of 60 cm is slower and the amount of dissipation is also lower. When the depth of vegetated slopes is less than 40 cm, water dissipation is significantly higher compared to bare slopes. However, when the depth is greater than 60 cm, it is less than that of the bare slope.

3.3.4. Soil Water Dissipation Model of a Slope under Natural Evaporation Conditions

This study quantitatively analyzed the soil water dissipation of bare slopes and vegetated slopes with varying slope ratios over 14 days after rainfall. The results of the comparative analysis revealed that the soil water dissipation of vegetated slopes was significantly higher than that of bare slopes at the same slope ratio. This difference can be attributed to the water absorption capacity of plant roots. Vegetation can reduce the soil water content of slopes through transpiration, which leads to a decrease in soil bulk density and an increase in slope stability. Furthermore, the impact of vegetation on slope water content becomes more pronounced as the slope ratio decreases.
To investigate the quantitative impact of vegetation on dynamic soil water changes, this study conducted a fitting analysis of soil water dissipation on both bare slopes and vegetated slopes over 14 days. The dissipation model shown in Table 2 was subsequently developed. The R2 values of the logarithmic function Δw = a × ln(Δt) + b ranged from 0.914 to 0.996. This formula can effectively fit the change in soil water dissipation over time, characterizing the pattern of faster to slower soil water dissipation rates under natural evaporation. The parameter ‘a’ indicates the rate of change in soil water dissipation, with higher values suggesting faster rates. Similarly, the parameter ‘b’ represents the overall magnitude of soil water dissipation, with larger values indicating greater dissipation. The highest values of parameters ‘a’ and ‘b’ were observed in the vegetated slope with a slope ratio of 1:1.5 at a depth of 20 cm (2.162, 3.065). This indicates that the soil water dissipation rate is significantly lower in bare slopes compared to vegetated slopes. Additionally, the soil water dissipation rate decreases with increasing soil depth.

3.4. Slope Soil Water Dissipation-Related Factors Analysis

In the vertical direction within the slope, changes in soil water are primarily influenced by soil properties, vegetation growth, and climatic factors [23,24]. Soil water is particularly sensitive to climatic factors within the top 100 cm of the soil surface [25]. After the end of rainfall, the redistribution of soil water is mainly influenced by the combined effects of gravitational potential and matrix potential [26]. Soil water migrates from soil layers with high potential energy to those with low potential energy. Additionally, meteorological conditions such as temperature, humidity, wind speed, and solar radiation impact the rate at which water dissipates in the soil [27,28]. Consequently, soil water content varies over time due to the interaction of multiple meteorological factors and slope conditions. To assess the relationship between meteorological factors (such as temperature, humidity, wind speed, solar radiation) and slope conditions (such as vegetation and slope ratio) with soil water, Table 3 was constructed using Pearson correlation analysis.
Table 3 demonstrates an extremely significant correlation between soil water at each depth and the ratio of slope and vegetation (p < 0.01). The presence of vegetation has a significant impact on soil water dissipation, particularly in deeper soil layers. The dissipation coefficients of vegetation on soil water at depths of 0–20 cm, 20–40 cm, 40–60 cm, 60–100 cm, and 0–100 cm are −0.155, −0.431, −0.419, −0.481, and −0.800, respectively. The effect of slope ratio on the natural evaporation of soil layers at different depths varies. The dissipation coefficients of slope ratio on the water content of soil layers with depths of 0–20 cm, 20–40 cm, 40–60 cm, 60–100 cm, and 0–100 cm are 0.672, 0.551, −0.236, 0.817, and 0.0688, respectively.
Humidity and temperature have a negative correlation with soil water content, while wind speed has a positive correlation. However, solar radiation has little effect on soil water content (p > 0.05). The rise in temperature accelerates water movement in the soil, leading to an increase in soil water dissipation capacity. Previous studies have shown that higher humidity makes it more difficult for soil water to evaporate into the atmosphere, as the water vapor content of the atmosphere is closer to saturation [29]. Additionally, higher wind speeds blow away air with higher soil water content from the soil surface, increasing soil water evaporation and dissipation rates [30,31]. The different results in this paper may be attributed to the combined effects of various meteorological factors, as well as differences in observation time and scale. Temperature has a more direct influence; hence, it has a stronger correlation. Solar radiation can heat the surface soil and influence soil water content through heat conduction. However, the correlation between solar radiation and soil water dissipation is lower due to delayed heat conduction in air and soil, as well as obstruction by vegetation [32]. Temperature shows a significant effect on water dissipation in the 0–40 cm soil layer (p < 0.05), while humidity significantly affects the 0–20 cm soil layer (p < 0.05) and wind speed has an extremely significant effect on the 20–40 cm soil layer (p < 0.01). This is mainly because the transmission energy of meteorological factors decreases as soil depth increases, resulting in a reduced correlation between meteorological factors and soil water dissipation. In addition to meteorological factors and slope conditions, the dissipation of soil water is also significantly influenced by the water content of adjacent soil layers. The greater the difference in water content between soil layers, the more pronounced the effect on water dissipation [33]. While the slope conditions have a strong influence on water dissipation in the soil, meteorological factors have a relatively lesser impact.

4. Conclusions

This paper analyzes changes in the soil water content of slopes after the end of rainfall under the condition of natural evaporation. Changes in soil water content over time at different depths in both bare and vegetated slopes were analyzed. The effects of vegetation, slope ratio, and meteorological factors on the dynamic changes in slope water under natural evaporation conditions were revealed. The main conclusions of this study can be summarized as follows:
(1)
Soil water dissipation from the bare slope was more significant on the first day after the rainfall ended but became milder in the following 14 days. The slope ratio has little impact on the dynamic change in water content in bare slopes under natural evaporation conditions. The main influencing factors are soil depth and evaporation time. A greater soil depth leads to a lower rate of soil water dissipation.
(2)
The greater the slope ratio of vegetated slopes, the greater the amount of soil water dissipation within a 40 cm range. However, there is no significant difference in soil water dissipation at depths of 60 cm and 100 cm for different slope ratios of vegetated slopes. Since the soil water dissipation rate decreases with time, the change in soil water dissipation over time can be modeled by the logarithmic function Δw = a × ln(Δt) + b.
(3)
Pearson correlation analysis revealed that slope conditions, such as slope ratio and vegetation, are the primary factors influencing soil water dissipation under natural evaporation conditions after rainfall. Meteorological factors have less influence on soil water dissipation, although wind speed, humidity, and temperature have a significant impact on soil water dissipation in the 20–40 cm, 0–40 cm, and 0–20 cm soil layers, respectively. Solar radiation, on the other hand, has little effect on soil water dissipation in each soil layer.

Author Contributions

Conceptualization, H.X. and J.W.; methodology, H.X. and J.W.; formal analysis, Z.L. and J.C.; data curation, J.C. and Y.S.; writing—review and editing, Z.L., J.W. and J.C.; funding acquisition, H.X. and J.W. All authors have read and agreed to the published version of the manuscript.

Funding

This research was substantially funded by the Joint Funds of the National Natural Science Foundation of China (No. U22A20232) project supported by the National Natural Science Foundation of China (No. 52078195) and the Innovation Demonstration Base of Ecological Environment Geotechnical and Ecological Restoration of Rivers and Lakes (2020EJB004).

Institutional Review Board Statement

Not applicable.

Informed Consent Statement

Not applicable.

Data Availability Statement

All data during the study were obtained through experiments in the paper.

Conflicts of Interest

The authors declare that they have no known competing financial interests or personal relationships that could have appeared to influence the work reported in this paper.

References

  1. Shi, G.; Yang, X.; Chen, W.; Chen, H.; Zhang, J.; Tao, Z. Characteristics of failure area and failure mechanism of a landslide in Yingjiang County, Yunnan, China. Recent Landslides 2020, 18, 721–735. [Google Scholar] [CrossRef]
  2. Wang, M.; Liu, Q.; Luo, R. Evaluating ecological effects of roadside slope restoration techniques: A global meta-analysis. J. Environ. Manag. 2021, 281, 111867. [Google Scholar] [CrossRef]
  3. Fu, H.; Zha, H.; Zeng, L.; Chen, C.; Jia, C.; Bian, H. Research progress on ecological protection technology of highway slope: Status and challenges. Transp. Saf. Environ. 2020, 2, 3–17. [Google Scholar] [CrossRef]
  4. Zhou, X.; Fu, D.; Wan, J.; Xiao, H.; He, X.; Li, Z.; Deng, Q. The Shear Strength of Root–Soil Composites in Different Growth Periods and Their Effects on Slope Stability. Appl. Sci. 2023, 13, 11116. [Google Scholar] [CrossRef]
  5. Wang, X.; Wang, Y.; Ma, C.; Wang, Y.; Li, T.; Dai, Z.; Wang, L.; Qi, Z.; Hu, Y. The Hydrological and Mechanical Effects of Forests on Hillslope Soil Moisture Changes and Stability Dynamics. Forests 2023, 14, 507. [Google Scholar] [CrossRef]
  6. Feng, X.; Fu, B.; Piao, S.; Wang, S.; Ciais, P.; Zeng, Z.; Lü, Y.; Zeng, Y.; Li, Y.; Jiang, X.; et al. Revegetation in China’s Loess Plateau is approaching sustainable water resource limits. Nat. Clim. Chang. 2016, 6, 1019–1022. [Google Scholar] [CrossRef]
  7. Lal, P.; Shekhar, A.; Gharun, M.; Das, N.N. Spatiotemporal evolution of global long-term patterns of soil moisture. Sci. Total Environ. 2023, 867, 161470. [Google Scholar] [CrossRef]
  8. Katul, G.G.; Oren, R.; Manzoni, S.; Higgins, C.; Parlange, M.B. Evapotranspiration: A process driving mass transport and energy exchange in the soil-plant-atmosphere-climate system. Rev. Geophys. 2012, 50. [Google Scholar] [CrossRef]
  9. Scharwies, J.D.; Dinneny, J.R. Water transport, perception, and response in plants. J. Plant Res. 2019, 132, 311–324. [Google Scholar] [CrossRef]
  10. Zhu, H.; Zhang, L.M.; Garg, A. Investigating plant transpiration-induced soil suction affected by root morphology and root depth. Comput. Geotech. 2018, 103, 26–31. [Google Scholar] [CrossRef]
  11. Zhang, Q.; Wei, W.; Chen, L.; Yang, L.; Luo, Y.; Cai, A. Plant traits in influencing soil moisture in semiarid grasslands of the Loess Plateau, China. Sci. Total Environ. 2020, 718, 137355. [Google Scholar] [CrossRef]
  12. Marín-Castro, B.E.; Negrete-Yankelevich, S.; Geissert, D. Litter thickness, but not root biomass, explains the average and spatial structure of soil hydraulic conductivity in secondary forests and coffee agroecosystems in Veracruz, Mexico. Sci. Total Environ. 2017, 607–608, 1357–1366. [Google Scholar] [CrossRef]
  13. van Loon, M.P.; Schieving, F.; Rietkerk, M.; Dekker, S.; Sterck, F.; Anten, N.N.P.R. How Light Competition between Plants Affects their Response to Climate Change. Procedia Environ. Sci. 2015, 29, 66. [Google Scholar] [CrossRef]
  14. Du, M.; Zhang, J.; Wu, Y.; Liu, H.; Wang, Z.; Liu, C.; Yang, Q.; Hu, Y.; Bao, Z.; Liu, Y.; et al. Evaluating the contribution of different environmental drivers to changes in evapotranspiration and soil moisture, a case study of the Wudaogou Experimental Station. J. Contam. Hydrol. 2021, 243, 103912. [Google Scholar] [CrossRef]
  15. Xu, Y.; Zhu, G.; Wan, Q.; Yong, L.; Ma, H.; Sun, Z.; Zhang, Z.; Qiu, D. Effect of terrace construction on soil moisture in rain-fed farming area of Loess Plateau. J. Hydrol. Reg. Stud. 2021, 37, 100889. [Google Scholar] [CrossRef]
  16. Liu, X.; Tang, Y.; Cheng, X.; Jia, Z.; Li, C.; Ma, S.; Zhai, L.; Zhang, B.; Zhang, J. Comparison of Changes in Soil Moisture Content Following Rainfall in Different Subtropical Plantations of the Yangtze River Delta Region. Water 2021, 13, 914. [Google Scholar] [CrossRef]
  17. Liang, Z.; Liu, H.; Zhao, Y.; Wang, Q.; Wu, Z.; Deng, L.; Gao, H. Effects of rainfall intensity, slope angle, and vegetation coverage on the erosion characteristics of Pisha sandstone slopes under simulated rainfall conditions. Environ. Sci. Pollut. Res. 2019, 27, 17458–17467. [Google Scholar] [CrossRef]
  18. Zhang, J.; Duan, L.; Liu, T.; Chen, Z.; Wang, Y.; Li, M.; Zhou, Y. Experimental analysis of soil moisture response to rainfall in a typical grassland hillslope under different vegetation treatments. Environ. Res. 2022, 213, 113608. [Google Scholar] [CrossRef] [PubMed]
  19. Ju, X.; Gao, L.; She, D.; Jia, Y.; Pang, Z.; Wang, Y. Impacts of the soil pore structure on infiltration characteristics at the profile scale in the red soil region. Soil Tillage Res. 2024, 236, 105922. [Google Scholar] [CrossRef]
  20. Dai, L.; Guo, X.; Zhang, F.; Du, Y.; Ke, X.; Li, Y.; Cao, G.; Li, Q.; Lin, L.; Shu, K.; et al. Seasonal dynamics and controls of deep soil water infiltration in the seasonally-frozen region of the Qinghai-Tibet plateau. J. Hydrol. 2019, 571, 740–748. [Google Scholar] [CrossRef]
  21. Wei, W.; Feng, X.; Yang, L.; Chen, L.; Feng, T.; Chen, D. The effects of terracing and vegetation on soil moisture retention in a dry hilly catchment in China. Sci. Total Environ. 2019, 647, 1323–1332. [Google Scholar] [CrossRef] [PubMed]
  22. Gardner, W.R. Mathematics of isothermal water conduction in unsaturated soils. Highw. Res. Board Spec. Rep. 1958, 40, 78–87. [Google Scholar]
  23. Bordoni, M.; Vivaldi, V.; Alessia Giarola Valentino, R.; Bittelli, M.; Meisina, C. Comparison between mechanical and hydrological reinforcement effects of cultivated plants on shallow slope stability. Sci. Total Environ. 2024, 912, 168999. [Google Scholar] [CrossRef] [PubMed]
  24. McColl, K.A.; Alemohammad, S.H.; Akbar, R.; Konings, A.G.; Yueh, S.; Entekhabi, D. The global distribution and dynamics of surface soil moisture. Nat. Geosci. 2017, 10, 100–104. [Google Scholar] [CrossRef]
  25. Vereecken, H.; Huisman, J.A.; Pachepsky, Y.; Montzka, C.; van der Kruk, J.; Bogena, H.; Weihermüller, L.; Herbst, M.; Martinez, G.; Vanderborght, J. On the spatio-temporal dynamics of soil moisture at the field scale. J. Hydrol. 2014, 516, 76–96. [Google Scholar] [CrossRef]
  26. Hou, X.; Li, T.; Vanapalli, S.K.; Xi, Y. Water percolation in a thick unsaturated loess layer considering the ground-atmosphere interaction. Hydrol. Process. 2018, 33, 794–802. [Google Scholar] [CrossRef]
  27. Warren, J.M.; Renée Brooks, J.; Dragila, M.I.; Meinzer, F.C. In situ separation of root hydraulic redistribution of soil water from liquid and vapor transport. Oecologia 2011, 166, 899–911. [Google Scholar] [CrossRef] [PubMed]
  28. Li, C.-Q.; Wu, P.; Li, X.; Zhou, T.; Sun, S.S.; Wang, Y.; Luan, X.B.; Yu, X. Spatial and temporal evolution of climatic factors and its impacts on potential evapotranspiration in Loess Plateau of Northern Shaanxi, China. Sci. Total Environ. 2017, 589, 165–172. [Google Scholar] [CrossRef]
  29. Fu, J.; Gong, Y.; Zheng, W.; Zou, J.; Zhang, M.; Zhang, Z.; Qin, J.; Liu, J.; Quan, B. Spatial-temporal variations of terrestrial evapotranspiration across China from 2000 to 2019. Sci. Total Environ. 2022, 825, 153951. [Google Scholar] [CrossRef]
  30. Czarnecka, M.; Nidzgorska-Lencewicz, J. The effect of the main meteorological elements on the 24 hour variability of moisture of soil under rye and potato. Pol. J. Nat. Sci. 2006, 21, 475–486. [Google Scholar]
  31. Tang, M.; Li, W.; Gao, X.; Wu, P.; Li, H.; Ling, Q.; Zhang, C. Land use affects the response of soil moisture and soil temperature to environmental factors in the loess hilly region of China. PeerJ 2022, 10, e13736. [Google Scholar] [CrossRef] [PubMed]
  32. MacDonald, M.K.; Pomeroy, J.W.; Essery, R.L.H. Water and energy fluxes over northern prairies as affected by chinook winds and winter precipitation. Agric. For. Meteorol. 2018, 248, 372–385. [Google Scholar] [CrossRef]
  33. Xiao, B.; Bowker, M.A. Moss-biocrusts strongly decrease soil surface albedo, altering land-surface energy balance in a dryland ecosystem. Sci. Total Environ. 2020, 741, 140425. [Google Scholar] [CrossRef] [PubMed]
Figure 1. Slope model diagram.
Applsci 14 01105 g001
Figure 2. Grading curve.
Applsci 14 01105 g002
Figure 3. Sprayer and water pipe.
Applsci 14 01105 g003
Figure 4. Layout section of soil moisture sensor.
Applsci 14 01105 g004
Figure 5. Meteorological information monitoring system.
Applsci 14 01105 g005
Figure 6. Monitoring time diagram of the rainfall stage and natural evaporation stage.
Applsci 14 01105 g006
Figure 7. Changes in atmospheric temperature and humidity during the meteorological monitoring stage: (a) atmospheric temperature; (b) atmospheric humidity.
Applsci 14 01105 g007
Figure 8. Change in wind speed during the meteorological monitoring stage.
Applsci 14 01105 g008
Figure 9. Variation in total solar radiation intensity during the meteorological monitoring stage.
Applsci 14 01105 g009
Figure 10. The average increase in soil water content at different depths of the bare slope and how it varies with time: (a) slope ratio of 1:1.5, (b) slope ratio of 1:1.75, (c) slope ratio of 1:2.
Applsci 14 01105 g010
Figure 11. The average increase in soil water content at different depths of the vegetated slope and how it varies with time: (a) slope ratio of 1:1.5, (b) slope ratio of 1:1.75, (c) slope ratio of 1:2.
Applsci 14 01105 g011
Figure 12. The soil water content of bare and vegetated slopes with different slope ratios in the natural evaporation stage and how it varies with depth within 14 days: (a) bare slope, 1:1.5; (b) vegetated slope, 1:1.5; (c) bare slope, 1:1.75; (d) vegetated slope, 1:1.75; (e) bare slope, 1:2; (f) vegetated slope, 1:2.
Applsci 14 01105 g012
Figure 13. Soil water dissipation from bare slopes with different slope ratios and how it changes with time: (a) slope ratio of 1:1.5, (b) slope ratio of 1:1.75, (c) slope ratio of 1:2.
Applsci 14 01105 g013
Figure 14. Soil water dissipation from vegetated slopes with different slope ratios and how it changes with time: (a) slope ratio of 1:1.5, (b) slope ratio of 1:1.75, (c) slope ratio of 1:2.
Applsci 14 01105 g014
Table 1. Physical property indexes of the test soil.
Plastic Limit (%)Liquid Limit (%)Natural Density (g/cm3)Maximum Dry Density (g/cm3)Optimum Water Content (%)
23.041.01.501.75020.0
Table 2. Model of soil water dissipation with time on different slopes.
Types of SlopeRatio of SlopeSoil Depth/cmΔw = a × ln(Δt) + b
abR2
Bare Slope1:1.5201.0731.4010.914
400.8861.1980.953
600.6640.9640.979
1:1.75201.0461.8280.991
400.9441.3340.973
600.6571.0220.969
1:2200.9911.6620.992
400.9661.1070.913
600.6670.8740.929
Vegetated Slope1:1.5202.1623.0650.980
401.2791.8130.965
600.6630.9130.944
1:1.75201.5582.5440.989
401.1062.0560.996
600.5211.0090.953
1:2201.0992.4140.965
400.9922.0210.982
600.5481.1320.974
Table 3. Pearson correlation coefficient of meteorological and environmental factors with the soil water content of different soil layers.
Soil DepthMeteorological FactorsSlope Conditions
Wind SpeedTemperatureHumiditySolar RadiationVegetationRatio of Slope
0–20 cm0.0329−0.0507 *−0.05003 *−0.01484−0.155 **−0.672 **
20–40 cm0.0882 **−0.0516 *−0.0368−0.01995−0.431 **0.551 **
40–60 cm−0.00554−0.0306−0.02720.00244−0.419 **−0.236 **
60–100 cm0.043−0.0321−0.0255−0.01236−0.481 **0.817 **
0–100 cm0.0202−0.0468 *−0.0445 *−0.00629−0.800 **0.0688 **
p > 0.05 indicates no significant correlation; 0.01 < p < 0.05 indicates a significant correlation, marked with *; p < 0.01 indicates an extremely significant correlation, marked with **.
Disclaimer/Publisher’s Note: The statements, opinions and data contained in all publications are solely those of the individual author(s) and contributor(s) and not of MDPI and/or the editor(s). MDPI and/or the editor(s) disclaim responsibility for any injury to people or property resulting from any ideas, methods, instructions or products referred to in the content.

