Article

Investigating the Reliability of Nonlinear Static Procedures for the Seismic Assessment of Existing Masonry Buildings

Department of Civil, Chemical and Environmental Engineering (DICCA), University of Genoa, Via Montallegro 1, 16145 Genoa, Italy
*
Author to whom correspondence should be addressed.
Appl. Sci. 2024, 14(3), 1130; https://doi.org/10.3390/app14031130
Submission received: 1 November 2023 / Revised: 11 January 2024 / Accepted: 15 January 2024 / Published: 29 January 2024
(This article belongs to the Special Issue Structural Design and Analysis for Constructions and Buildings)

Abstract

:
This paper presents, firstly, an overview of the nonlinear static procedures (NSPs) given in different codes and research studies available in the literature, followed by the results achieved by the authors to evaluate the reliability of the safety level that they guarantee. The latter is estimated by adopting the fragility curve concept. In particular, 125 models of a masonry building case study are generated through a Monte Carlo process to obtain numerical fragility curves by applying various NSPs. More specifically, among the NSPs, the N2 method (based on the use of inelastic response spectra) with different alternatives and the capacity spectrum method (CSM)—based on the use of overdamped response spectra—are investigated. As a reference solution to estimate the reliability of the nonlinear static approach, nonlinear dynamic analyses (NLDAs) are carried out using the cloud method and a set of 125 accelerograms; the results are post-processed to derive fragility curves under the assumption of a lognormal distribution. The focus of this investigation is to quantify the influence that the NSP method’s choices imply, such as the criteria adopted to calculate the displacement demand of a structure or those for the bilinearization of the pushover curve. The results show that the N2 methods are all non-conservative. The only method that provides a good approximation of the capacity of the analyzed URM structures as derived from NLDAs is the CSM. In particular, bilinearization is proven to have a relevant impact on the results when using the N2 method to calculate displacement capacities, whereas the CSM method is not affected at all by such an assumption. The results obtained may have a significant impact on engineering practice and in outlining future directions regarding the methods to be recommended in codes.

1. Introduction

The ductility and dissipation features of new and existing buildings constitute key factors in performance-based seismic engineering in terms of assuring the desired safety levels and economic feasibility. Moreover, as testified by the evidence of many real seismic events, unreinforced masonry (URM) structures are characterized by strong nonlinear behavior that may even be activated by seismic inputs of low–medium intensity [1,2,3]. Due to this, the ability to appropriately account for nonlinearity and estimate the seismic demand becomes crucial. Different analysis methods (i.e., linear and nonlinear, static and dynamic) are proposed in the literature [4,5,6] and recommended in certain standards [7,8,9,10,11].
In the case of linear approaches, the use of q-factors is one way to account for the intrinsic ability of a structure to resist energy dissipation [12,13]. For the seismic design of new URM buildings, q-factor reference values, able to implicitly account for plastic behavior up to the near-collapse (NC) limit state, are available [14]. Their use, combined with that of capacity design structural details, aims to ensure the required seismic performance. Despite this, the application of linear approaches in the case of designing URM structures is quite problematic, particularly in areas with moderate-to-high seismic activity, as proven in some studies [15,16]. The use of linear methods in the case of existing URM buildings is even more challenging [17], beginning with the difficulty in defining robust q-factor reference values, considering that, often, such structures are designed according to an empirical approach rather than an engineered one, thus leading to a large variety of possible structural solutions that may affect their seismic responses [18]. These factors mean that, in the case of URM buildings, nonlinear methods (and especially static ones, which this paper focuses on) constitute the standard methods applied not only at the research level but also in engineering practice [19].
While nonlinear dynamic analyses (NLDAs) are considered highly accurate and are useful in explicitly capturing the full dynamic responses of structures, nonlinear static procedures (NSPs) based on the execution of nonlinear static analyses (NLSAs) are often more widely used for various practical reasons. In fact, NLDAs involve the use of ground motion time-history records that need to be appropriately selected [6,20,21,22], as well as defining appropriate nonlinear hysteretic models. Although, nowadays, very effective tools are available to address the selection of seismic inputs [23,24,25,26,27]—and the availability of nonlinear constitutive laws has increased, proving their effectiveness in simulating the actual responses of complex buildings [28,29,30]—currently, NLDAs are mostly adopted at the research level.
Nonlinear static analysis (NLSA), also known as pushover analysis, simulates the actual inertial forces activated within dynamic responses by statically applying horizontal conventional load patterns to a 3D model of a structure. NLSA is a very effective tool in evaluating structural seismic responses and estimating progressing nonlinear states. Meanwhile, NSPs address the use of the so-obtained pushover curve (i.e., the overall base shear versus the top displacement) to compute the expected displacement seismic demand, given a certain seismic input, expressed in terms of response spectra. To this aim, NSPs require the following additional steps [31]: (i) the definition in the pushover curve of given performance levels; (ii) the conversion of the original multi-degree-of-freedom structure’s capacity, represented by the pushover curve, into an equivalent single-degree-of-freedom (SDOF) system; and (iii) the adoption of an appropriate procedure to compare such an SDOF capacity curve with the response spectrum (i.e., the method of calculating the maximum displacement demand under a seismic input of a given intensity).
Regarding the first issue, different criteria are proposed in the literature, as well as certain codes, as discussed in detail in [32]. They are based on conventional criteria that refer to given percentages of the overall base shear attained or that also account for the damage incurred by single elements or a set of walls. Regarding the second issue, usually, the criteria originally proposed in [33] are adopted; this step eventually also requires the conversion of the original curve into an equivalent bilinear curve.
Regarding issue (iii), the literature proposes two alternative methods: (i) the N2 method [33] and (ii) the capacity spectrum method (CSM, as introduced for the first time in [34]). They have both been widely used in the last 20 years as they have been introduced into certain standards, together with some coefficients/controls to limit their scope of application. Starting from the original proposals of these approaches, various developments have since been described in the literature.
This paper focuses in particular on issues (ii) and (iii), with the aim of comparing the different alternatives proposed in the literature and certain standards (including some proposals that are currently under review for the update of Eurocode 8) and outlining the most reliable ones. An overview of the NSPs outlined in different codes and research studies is given in Section 2. Of course, other issues are still open in the literature, such as the application of NSPs when applied to irregular buildings characterized by flexible or stiff floors [35,36,37,38,39,40], but these aspects are beyond the scope of this paper.
As described in Section 3, the concept of the fragility curve [41,42,43,44,45] is adopted to assess the reliability of the alternative NSPs considered. In fact, despite the broad use of NSPs in engineering practice for existing URM buildings, the validation of the available approaches is still limited in the literature. There are different methods used to develop fragility curves [41,46,47], i.e., empirical; analytical, based on simplified approaches; or numerical, based on more accurate models. In this paper, the numerical one is selected. More specifically, both NLDA and NLSA are executed on a 3D model set according to the equivalent frame modeling approach and a representative of an existing URM building, which is described in Section 4. The fragility curve obtained by NLDA is adopted as a reference solution to estimate the reliability of the various NSPs adopted. Finally, the main outcomes achieved are illustrated in Section 5, which also outlines the possible advantages and disadvantages of alternative NPSs. As summarized in the Conclusions (Section 6), the repercussions of the achieved outcomes may be significant also in guiding possible recommendations to be included in the future generations of the European Standards, as the topic is quite relevant and the extensive revision of such documents is ongoing.

2. Basics of Nonlinear Static Procedures Adopted in Standards

The performance-based evaluation of buildings’ seismic performance relies on comparing the seismic forces acting on the structure and its ability to withstand these forces in terms of displacement. This approach involves making specific assumptions to minimize the computational and analytical efforts. When conducting a seismic performance-based assessment, it is crucial to establish the expected structural response at various damage levels under specific seismic hazard conditions. The structural response can be quantified using displacement levels associated with the attainment of corresponding limit states (LSs) or performance levels (PLs) (for example, fully operational, operational, life safety, and near collapse). These limit states—even if they are strictly correlated to the structural damage—encompass non-structural aspects such as reusability, immediate occupancy, operational functionality, and also economic considerations. However, different performance levels may also differ in terms of probability. Accordingly, the obtained results could be checked and evaluated for different performance states (for example, the life safety limit state) [48]. In this paper, attention is focused on the near collapse (NC) limit state.
As briefly recalled in the Introduction, NSPs presuppose the following:
  • The execution of an NLSA to obtain the pushover curve (representative of the original multi-degree-of-freedom—MDOF—system) aimed at describing the evolution of the structural response in a nonlinear range;
  • The adoption of criteria to define the attainment of given limit states on the pushover curve;
  • The conversion of the MDOF into an equivalent single-degree-of-freedom (SDOF) representation of the system;
  • The adoption of a procedure to assess the displacement demand expected given a seismic input, which is expressed in NSPs in terms of response spectra.
In the following, for the specific alternatives proposed in the Standards to address these issues, reference is mainly made to the European Code [49] and the Italian Structural Code [8].
The execution of the NLSA in turn implies various choices, such as that of the control node, of which the displacement is incrementally increased, and that of the load pattern (LP), adopted as an approximate representation of the inertial forces that the building may experience during an actual earthquake. The control node is typically defined as a roof level’s point; in this paper, the control node is assumed in proximity to the center of mass of the top floor. This choice is reasonable considering that the selected case study is characterized by rigid diaphragms.
Regarding the choice of the LP, the European Code [49] prescribes the application of a minimum of two distinct LPs, which are kept invariant during the pushover analysis: (a) a “uniform” pattern, in which the lateral forces vary in direct proportion to the masses involved (associated with a uniform deformed displacement profile); (b) a “modal” pattern, where the lateral forces are in line with a deformed shape assumed to be equal to the one consistent with the first mode (producing an inverse triangular displacement profile). The Structural Italian Code [8] defines two groups of LPs: the first one contains the LP (b) and other possible alternatives that conceptually recall the dynamic behavior of the structure in the pseudo-elastic phase; the second one contains the LP (a) together with other possibilities, such as the adaptive LP (see [50,51]). In the first group, it is also possible to approximate the first mode shape with an LP proportional to the one adopted in the case of the linear analysis, i.e., based on the assumption of a linear mode shape (producing an inverse triangular profile). For the purpose of the safety assessment, the worst result (i.e., the one associated with the higher displacement demand) between two LPs is assumed as a reference.
As aforementioned, appropriate criteria must be introduced to define the attainment of PLs on the pushover curve. Current approaches adopted in the Standards are based on (a) global criteria (or by assessing the strength degradation of the pushover curve) [49]; (b) local criteria associated with the attainment of a given damage level in single elements or groups of them (e.g., a wall composed of a set of structural elements, usually defined as a macroelement). In some cases [8], a combination of such criteria (c) is adopted. Such an approach is adopted also in other Codes, such as the Turkish Building Earthquake Code (TBEC), which uses both member-based strain definitions and building performance definitions separately [48].
In this research, approach (c) is adopted as a reference for the assessment of the NC LS by adopting the criteria proposed in [32], which are conceptually consistent with the Italian Structural Code [8]. Thus, a combination of two criteria is used: a criterion at the macroelement scale (i.e., the wall scale), to monitor the progression of damage in structural components (specifically, piers and spandrels in URM buildings), and a global criterion based on checking on the pushover curve when the decay rate of the maximum base shear ( V m a x ) of the pushover curve is reached.
Concerning the macroelement criterion, the goal is to monitor the possible concentration of damage in specific portions of the URM building that could be incompatible with the safety requirements (e.g., to identify the activation of a soft story mechanism in local portions); this is particularly relevant in the case of structures with irregular configurations or in the presence of flexible diaphragms. The first proposal to detect such conditions was introduced in [31], using the inter-story drift ( θ w , l ) within a particular story or level (l) of a wall (w) as an engineer demand parameter to be checked against the exceedance of the predetermined threshold. In [31], the computation of the inter-story drift is performed according to Equation (1):
θ w , l = D w , l D w , l 1 h i ± φ w , l φ w , l 1 2
where h i represents the height of a story at level l, while D w , l and φ w , l denote the average horizontal displacement and the nodes’ rotation, situated at either level l or level l-1 within wall w. The use of ± depends on the direction of rotation, with the positive sign indicating clockwise rotation [32]. The contribution of rotations becomes relevant, in particular, in the absence of an RC ring beam or in the case of flexible diaphragms, i.e., when the shear-type idealization is far from satisfied. The adoption of the inter-story drift as a proxy for the attainment of damage conditions was also extensively used in the RINTC project [52,53], which was aimed at the evaluation of the risk level implicit in Italian code-conforming buildings, and it is common also in the case of reinforced concrete (RC) buildings [54].
Despite the effectiveness of the inter-story drift, in the case of URM buildings, the definition of robust thresholds may be quite conventional since the drift limits adopted to check the damage level in piers vary with the prevailing damage mode (whether flexural or shear-dominant), and the activation of the latter depends on several factors (e.g., the slenderness of the panel and the acting axial load, in addition to material strength parameters). To overcome such a limitation, in this research, the criterion proposed in [32] is used, namely, the variable “DLmin”. According to this approach, the achievement of a damage level (DL) (then associated with a corresponding PL) occurs when all the piers on a wall’s story reach or exceed the monitored DL (see Figure 1).
Instead, for the global check, the pushover analysis point at which the building’s base shear ( V b ) experiences a 20% reduction is assumed, as also proposed in [8,49]. Table 1 summarizes the thresholds adopted for the monitoring of the NC PL in this research.
Finally, the NC PL is reached in correspondence to the minimum displacement capacity of the structure, d u , N C , between the two associated with the satisfaction of the two checks in Table 1.
d u , N C = m i n d u , 1 ; d u , 2
Such an approach may be consistently applied in the case of both NLSA and NLDA.
Proceeding to the step that involves the transformation of the MDOF pushover curve into the equivalent SDOF system, the criteria proposed in [55] are assumed, as they are unanimously supported in the literature. Such conversion is performed by dividing the pushover components by the participation factor Γ through the following expressions:
V b = V b Γ ; d = d Γ
with “∗” to indicate that the quantity pertains to an equivalent SDOF system and Γ denoting the participation factor obtained with respect to the provided deformed shape [32].
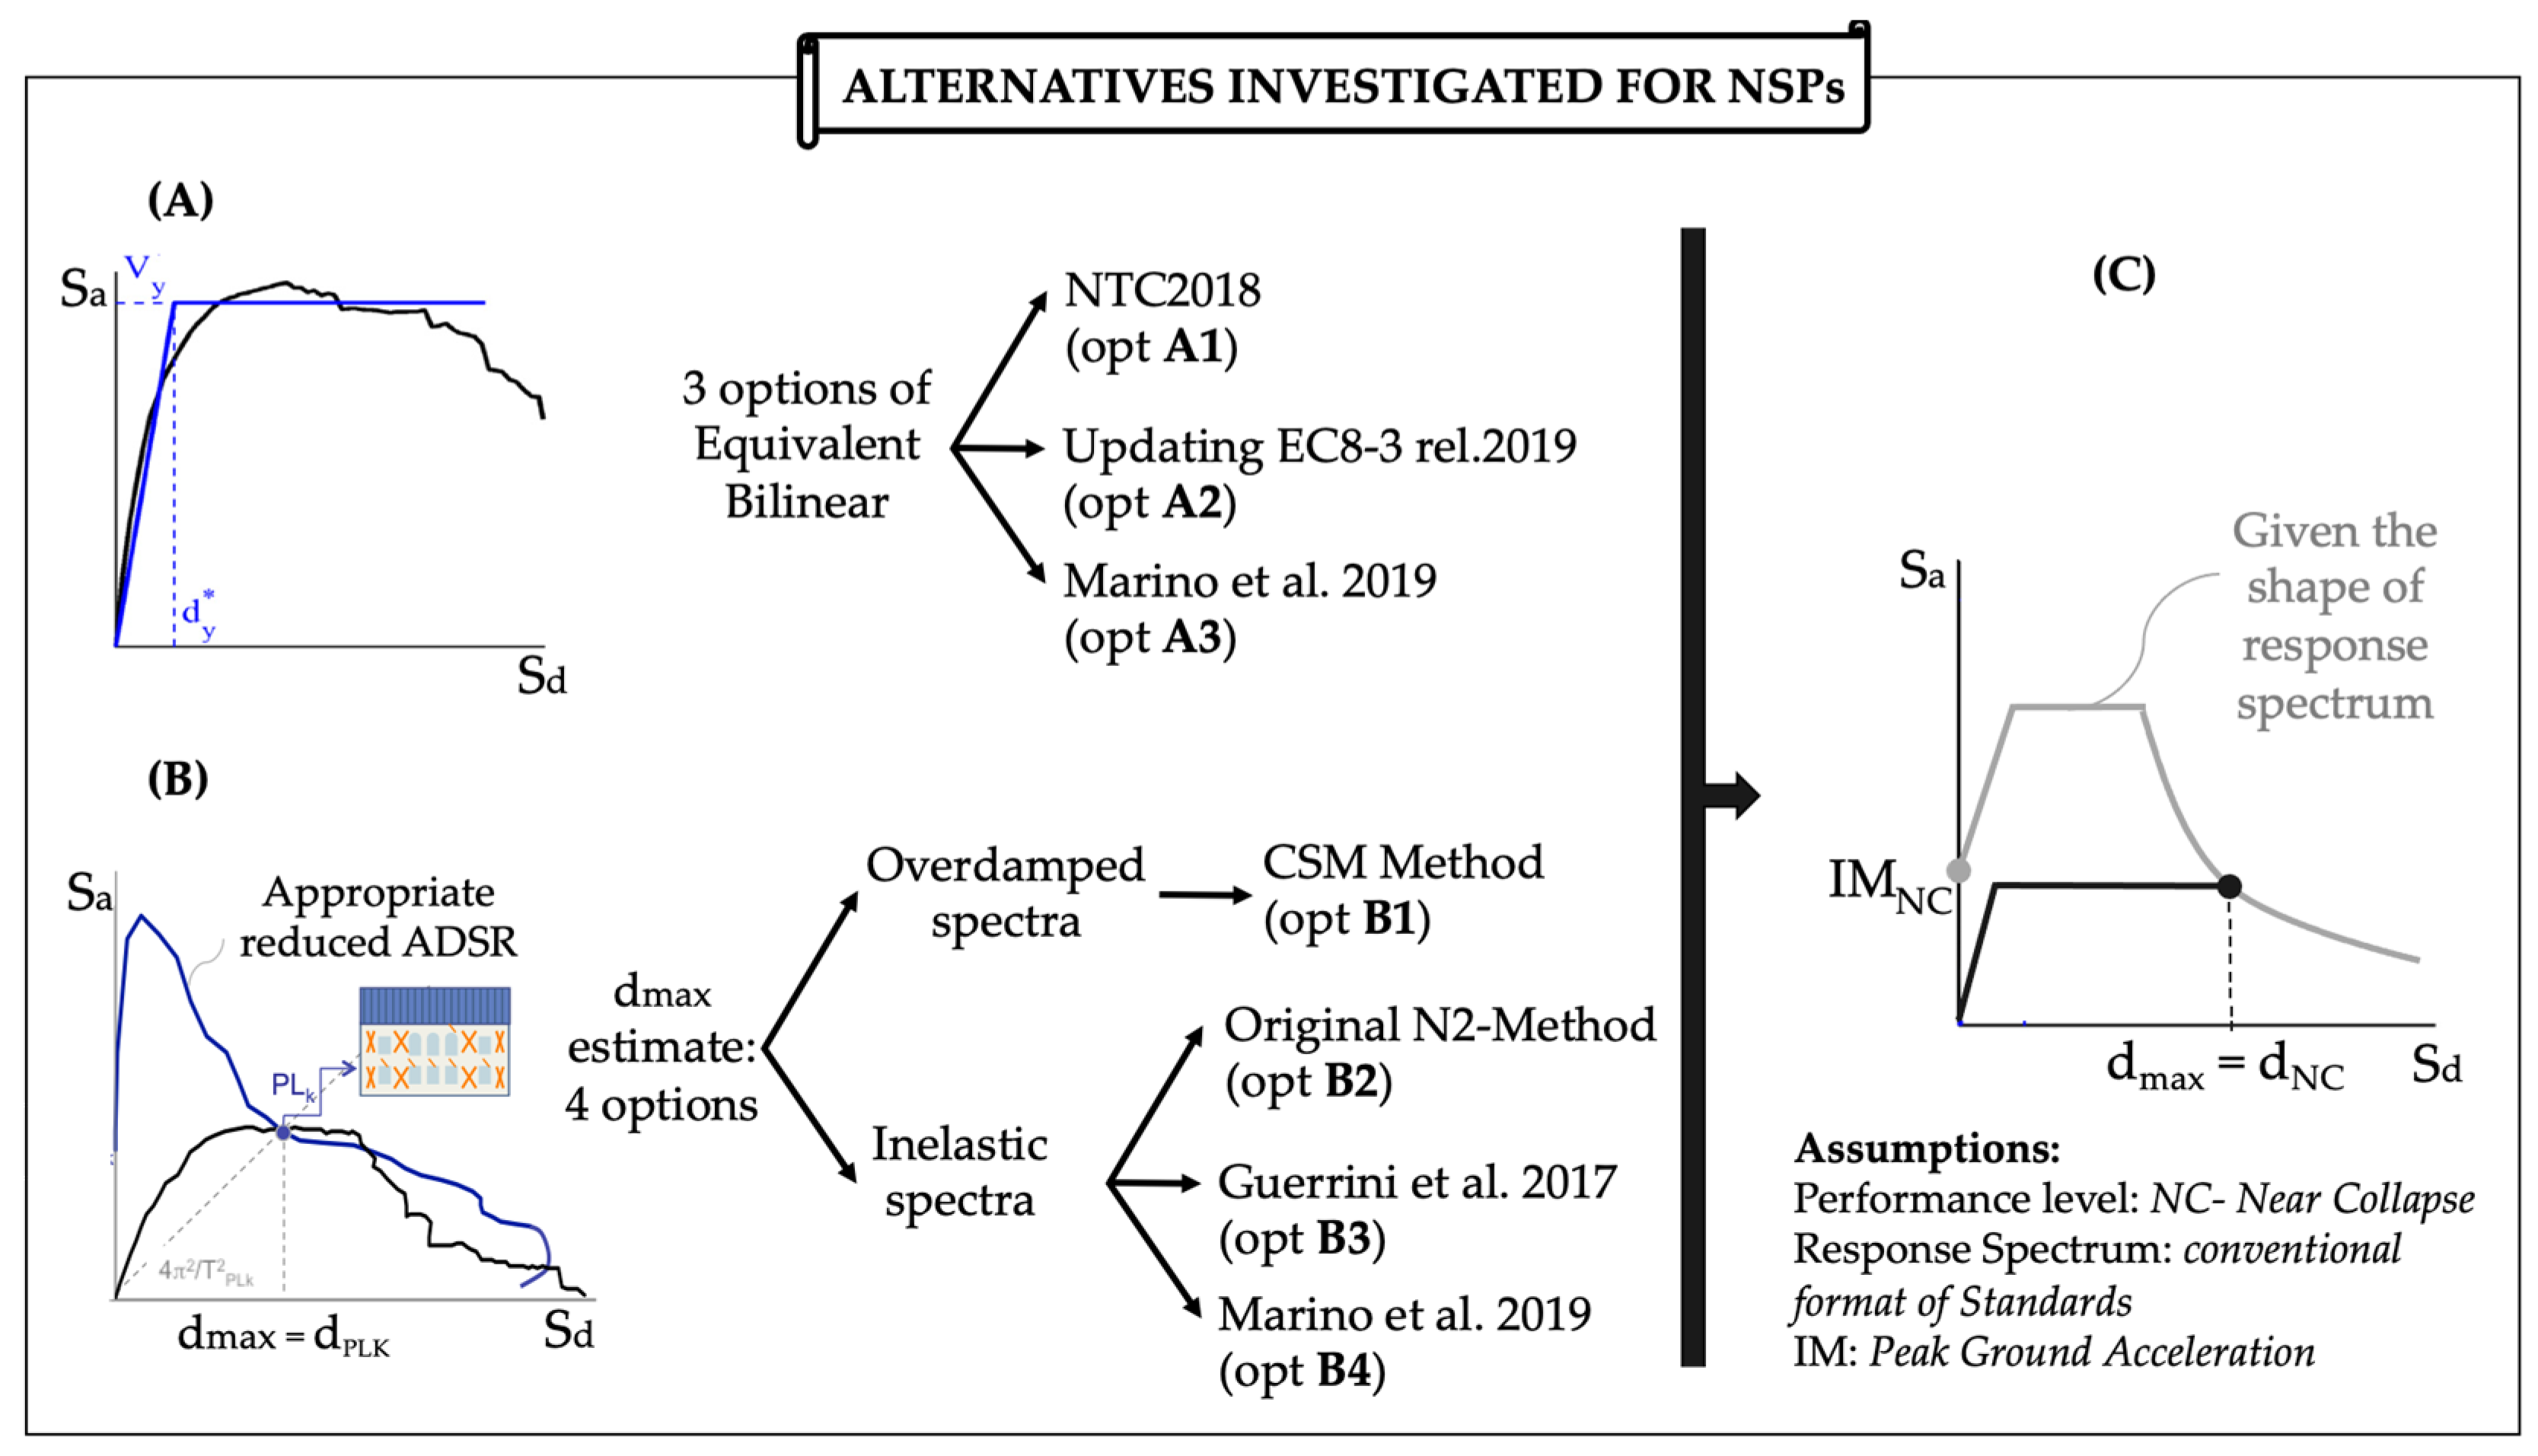
Once the pushover is converted, it is possible to proceed to the comparison with the seismic demand to compute the maximum displacement demand (denoted as d*max). For this issue, different possible alternatives are investigated, as depicted in Figure 2.
The best-known procedures, also investigated in this paper, are (1) the N2 method [55] and (2) the capacity spectrum method (CSM) [34]. Both approaches require the introduction of a reduction criterion to account for the effect of the response’s nonlinearity in the response spectra evaluation. While the N2 method refers to the concept of inelastic spectra associated with ductility, the CSM method refers to the use of overdamped spectra. The N2 method is the one traditionally adopted in European countries, while the CSM is favored in the USA [9,10] and New Zealand [11] (even if it has been recently recommended in [8] as “Method b”).
A review of the use of these two methods when applied to URM structures has already been presented in [32]. The N2 method strictly requires the pushover curve’s transformation into an equivalent bilinear representation. Various criteria have been suggested for this purpose, as outlined in Table 2, which aims to summarize the three criteria investigated in this paper. According to the Italian Structural Code [8], an elastoplastic relationship is usually employed for URM structures. In this approach, the initial branch of the bilinear curve starts from the origin and extends through the pushover curve point corresponding to 70% of the maximum base shear ( V m a x ), while the yield base shear V y is defined by imposing the equivalence of the areas under the bilinear and the original pushover curve up to the ultimate displacement capacity ( d u , N C ), set in correspondence to the base shear decay equal to 20%. According to NTC2018, the bilinear curve is invariant with the examined LS. Instead, the other two criteria in Table 2 lead to an adaptive approach, i.e., one that varies according to the position of the SL on the curve (i.e., before or after the peak base shear V m a x ). More specifically, in the proposal introduced in the version of Eurocode 8-3 [56] published on September 2019 (in the following, it is briefly recalled as “Updating EC8-3 rel.2019” and is currently under review also with additional modifications), an elastoplastic relationship is adopted but with the following differences from NTC2018: the initial stiffness is determined by equating the areas beneath the curve up to the peak of the pushover curve ( V m a x ); the strength V y is assumed equal to V m a x until the peak, while, after, it is computed by imposing the equivalence of the areas up to the d u , N C displacement. Finally, according to Marino’s proposal, introduced in [32], the following adaptive criteria are adopted: until the shear peak, the stiffness is computed by imposing the area’s equivalence up to the displacement associated with the LS under examination, which also establishes the corresponding value of the yield base shear V y to be assumed; after the shear peak, V y is kept constant and equal to V m a x and the stiffness is computed according to the equivalence area’s rule. The initial stiffness of such an equivalent bilinear then addresses the building’s equivalent period T , which plays a pivotal role in determining d m a x through the N2 method (as described in references [8,49] and evident from Table 3).
The N2 method, initially introduced by Fajfar and Fischinger in their work [33], is explicitly recommended in the Italian Structural Code (as Method A [8]) and Eurocode 8-1 [49], besides the Updating EC8-3 rel.2019 document. Equation (4), presented in Table 3, recalls how the assessment of the inelastic displacement demand is computed according to this approach. In Table 3, d e , m a x is equal to the elastic displacement spectral value S d , e ( T ) at period T (which is d e , m a x = S d , e ( T ) ); R = m · S a , e ( T ) V y is the reduction factor; S a , e ( T ) is the elastic acceleration spectral value at period T ; m is the mass of the equivalent SDOF; and T u is the secant period at the ultimate displacement capacity of the pushover curve.
Indeed, the original proposal of [33] has been demonstrated to not always be suitable for stiff structures such as URM buildings [32,57]. Thus, alternative proposals have been developed for these structures in the literature. The alternative N2 method of Guerrini et al. [57] introduces a novel equation to calculate d m a x (refer to Equation (5) in Table 3) that aims to include the influence of the hysteretic dissipation when estimating the earthquake-induced nonlinear displacement demand. Various hysteretic responses are assumed for SDOF oscillators, as investigated in depth by executing NLDA; in particular, three distinct behavior types are classified based on the prevailing failure modes activated in piers, i.e., those primarily influenced by flexural behavior; those predominantly affected by shear behavior; and a group exhibiting a hybrid mode [57]. The parameters a h y s t , b , c , and T h y s t in Table 3 are calibrated by these authors on the basis of the dynamic response of this first set of SDOFs. This calibration involves conducting an orthogonal regression analysis between the results of the μ R R T relationship and those obtained from NLTHA [57]. Specifically, the exponents b and c are fine-tuned using data from the entire set of oscillators, while parameters a h y s t and T h y s t are subjected to separate calibration processes for the three previously reported ranges of hysteretic dissipation. In Section 4.2 of this paper, the choice among the latter is carried out on the basis of the examination of the damage simulated at the NC limit state by nonlinear analyses performed on the examined case study.
Another alternative was proposed by Marino et al. [32], which maintains a format similar to the equation adopted in [8,49] (see Equation (6) in Table 3); in this expression, the coefficient a defines the ductility and the demand computed using the traditional N2 method is underestimated, while b accounts for the dissipative capacity of the system.
To achieve equivalence in the inelastic displacement demand, the proposal of Marino and the N2 method are calibrated to match the ductility demand of 3 (or, equivalently, by setting a = 3 ) [32]. With regard to the b coefficient, in this paper, it is assumed equal to 1.2 (or correspondingly setting b = 1.2 ), in order to maintain the relationship with the reduction factor equal to 3 (i.e., a = 3 = R ). It is worth noting that the coefficient b has the potential to set the limit from which the equal displacement rule starts to be valid. It is worth observing that expressions (4) and (5), presented in Table 3, reveal the strong influence of the initial period of the SDOF (T*) and its relationship with TC (i.e., the corner period of the response spectrum). In fact, the equal displacement rule is applied for T* > TC, while, for T* < TC, the equivalence between the elastic and nonlinear SDOF is imposed by an appropriate reduction rule.
Table 3. N2 methods for calculation of the displacement demand d*max and related references.
ReferenceN2 Methods and CSM for d*max CalculationEquation
N2, Fajfar
et al. (2000)
[33]
  d m a x = d e , m a x                                                                                                                                                                 R < 1   a n d   T T c d e , m a x R · 1 + R 1 · T T c d e , m a x                                               R 1   a n d   T < T c (4)
N2, Guerrini
et al. (2017)
[57]
d m a x = d e , m a x                                                                                                                                                                 R < 1   a n d   T T c d e , m a x R · R 1 c T T h y s t + a h y s t · T T c b + R                                             R 1   a n d   T < T c
For Configuration C: a h y s t = 0.2 ;   b = 2.3 ; c = 2.1 ;   T h y s t = 0.03
For Configurations A and B: a h y s t = 0.7 ;   b = 2.3 ; c = 2.1 ;   T h y s t = 0.055
(5)
N2, Marino
et al. (2019)
[32]
d m a x = d e , m a x                                                                                                                                                                 R < 1   a n d   T T c d e , m a x R · R c = d e , m a x · R c 1                                                                                                                       R 1   a n d   T < T c  
c = 1 ln a ln 1 + a 1 · b · T c T 1
(6)
CSM
[34]
                d m a x = S d ( T u ) (7)
The CSM, initially formulated and pioneered by Freeman [34] and integrated into Standards such as [10], is employed in the analysis of the case study, using the methodology illustrated in [31]. The CSM obviates the strict requirement of converting the capacity curve into an equivalent bilinear, and it makes use of reduced spectra (see Equations (10) and (11)) based on the concept of equivalent damping ξ (Equation (8)). The following expressions clarify these issues and the specific criteria adopted in this paper to compute these entities:
ξ = k · 63.7 · V y · d m a x V m a x · d y V m a x · d m a x + 5
η = 10 5 + ξ 0.55
S a ( T ) = η · S a , e ( T )
S d ( T ) = T 2 π 2 · S a ( T )
where ξ is the damping coefficient, η is the factor that alters the elastic spectrum for conventional viscous damping coefficients ξ different from 5%, and S a ( T ) and S d ( T ) are the acceleration spectral value and displacement spectral value at period T . The coefficient k considers the dissipative capacity of the structure and, in particular, the characteristics of the hysteresis cycle. As recommended in the NTC18 [8] and consistently with [9,10], the following values can be assumed, depending on the structural typology:
  • Structures with high dissipative capacity: k = 1;
  • Structures with moderate dissipative capacity: k = 0.66;
  • Structures with low dissipative capacity: k = 0.33.
In this paper, these values of k are tested while varying the configurations analyzed for the examined case study, in order to assess the sensitivity of the achievable results.
The expressions summarized in Table 3 refer to the computation of the maximum displacement demand d*max expected under a given earthquake. However, these expressions may be effectively inverted in order to assess the maximum intensity measure (IM) of the earthquake that produces the attainment of a displacement demand associated with a given LS. In this paper, these expressions are used in such a way by imposing, for example, that d*max is equal to the ultimate displacement associated with the NC LS attainment (i.e., d m a x = d u , N C ) to estimate the maximum value of the PGA compatible with NL (PGANC).

3. Criteria Adopted to Assess the Reliability of the Examined Approaches

As already mentioned in the Section 1, the fragility curve concept is adopted to compare the reliability of different alternative solutions implemented in NSPs. As is known, the fragility curve expresses the probability of attaining a certain damage level or limit state given a certain intensity of the seismic input. To this aim, the fragility curves obtained by executing NLSA and NLDA are compared by adopting the latter as a reference target. The following sections clarify the assumptions adopted to derive them, as briefly illustrated in Figure 3 for the URM case study discussed in Section 4.

3.1. Assessment of the Reference/Target Fragility Curve by Nonlinear Dynamic Analyses

Different approaches are available in the literature to derive fragility curves from NLDAs, including Incremental Dynamic Analysis (IDA, [58,59]), Multiple-Stripe Analysis (MSA, [60]), and the Cloud Method ([61,62]). In this paper, the NLDAs are executed according to Cloud Analysis [62], which offers the advantage of a high level of computational efficiency. The first relevant issue when deriving fragility curves from NLDAs consists in the appropriate selection of recordings [6,20,21,22] and the choice of optimal intensity measures for probabilistic seismic demand analyses [63,64,65,66,67].
Usually, accelerograms are selected from databases of ground motion recordings during past earthquakes by ensuring compatibility with the seismic hazard of the target site [6,20,21,22,68]. The sensitivity of the structural responses to the input motions makes the careful choice and scaling of actual ground motions a critical aspect in earthquake engineering [20,22]; this is because increasing scale factors during the scaling process may result in the overestimation of the deformation demands [21]. In this paper, the accelerograms selected for the aims of the MARS (Seismic Risk Maps) project [69] are used [26]. This project was funded by the Italian Civil Protection Department (DPC) and then jointly developed with researchers from the University Laboratories Network for Earthquake Engineering (ReLUIS), with the aim of developing fragility curves through different approaches (including that based on NLDAs) to be used to address seismic risk analyses at a national scale. To this aim, within the MARS project, a set of 125 accelerograms is firstly selected using the Select&Match software package (release March 2022)) [26,27]. More specifically, a set of 85 recorded (unscaled) and a set of 40 spectrally matched accelerograms compatible with the target spectrum of L’Aquila are extracted, for a total of 125 accelerograms. The target spectrum is specified as the uniform hazard spectrum at L’Aquila for return periods of 50, 100, 200, 475, 975, 2475, 5000, and 10,000 years, considering soil category A [26,70,71,72]. The purpose of this choice is not to make a specific reference to the L’Aquila site but to scan the intensity levels of ground motion gradually increasing from very low to very high, in order to select a large set of input motions with intensity levels encompassing a sufficiently wide range, in order to be used in NLDAs to construct site-independent fragility curves, constrained both at very low and very high levels of seismic hazard. The 125 records are associated in pairs with the models generated for the examined case study, once applying the EW component to the X direction and the NS to the Y direction and once by reversing them, for a total of 250 NLDAs. Each pair is randomly associated with one of the 125 models generated by Monte Carlo sampling, as illustrated in Section 3.2 and Section 4, to account for the uncertainty in the materials’ properties.
Performing a cloud analysis with unscaled natural accelerograms preserves all seismic event information, including “record-to-record variability”. It has been proven that, when using unscaled accelerograms in conjunction with NLDAs, there exists a correlation between the chosen engineering demand parameter (EDP) and the intensity measure (IM) values of the applied seismic signals. The maximum displacement demand is chosen as the reference EDP representative of the structural response of the building, with the peak ground acceleration (PGA) being selected as the IM parameter. The choice of the PGA among other possible alternatives [52,73] is justified by the fact that the examined case study is quite rigid [74].
To establish whether the EDP value leads to the attainment of the NC LS, consistent criteria and thresholds with the NLSAs are used, i.e., those already introduced in Table 1. Moreover, to avoid including, in the statistical processing, results associated with a damage level even higher than the near collapse, a condition representative of the collapse is also introduced (namely V b V m a x = 0.5 for the check at a global scale and D L m i n     D L 5 for the check at a macroelement scale).
Finally, the results obtained by the Cloud Analysis are post-processed by assuming a lognormal distribution (as is typical in risk analyses [42]) in order to define the median value of IM associated with the attainment of NC and its dispersion. The latter includes the record-to-record variability (intrinsically described by the record selection) and that associated with the structural variability (as described by the Monte Carlo sampling).
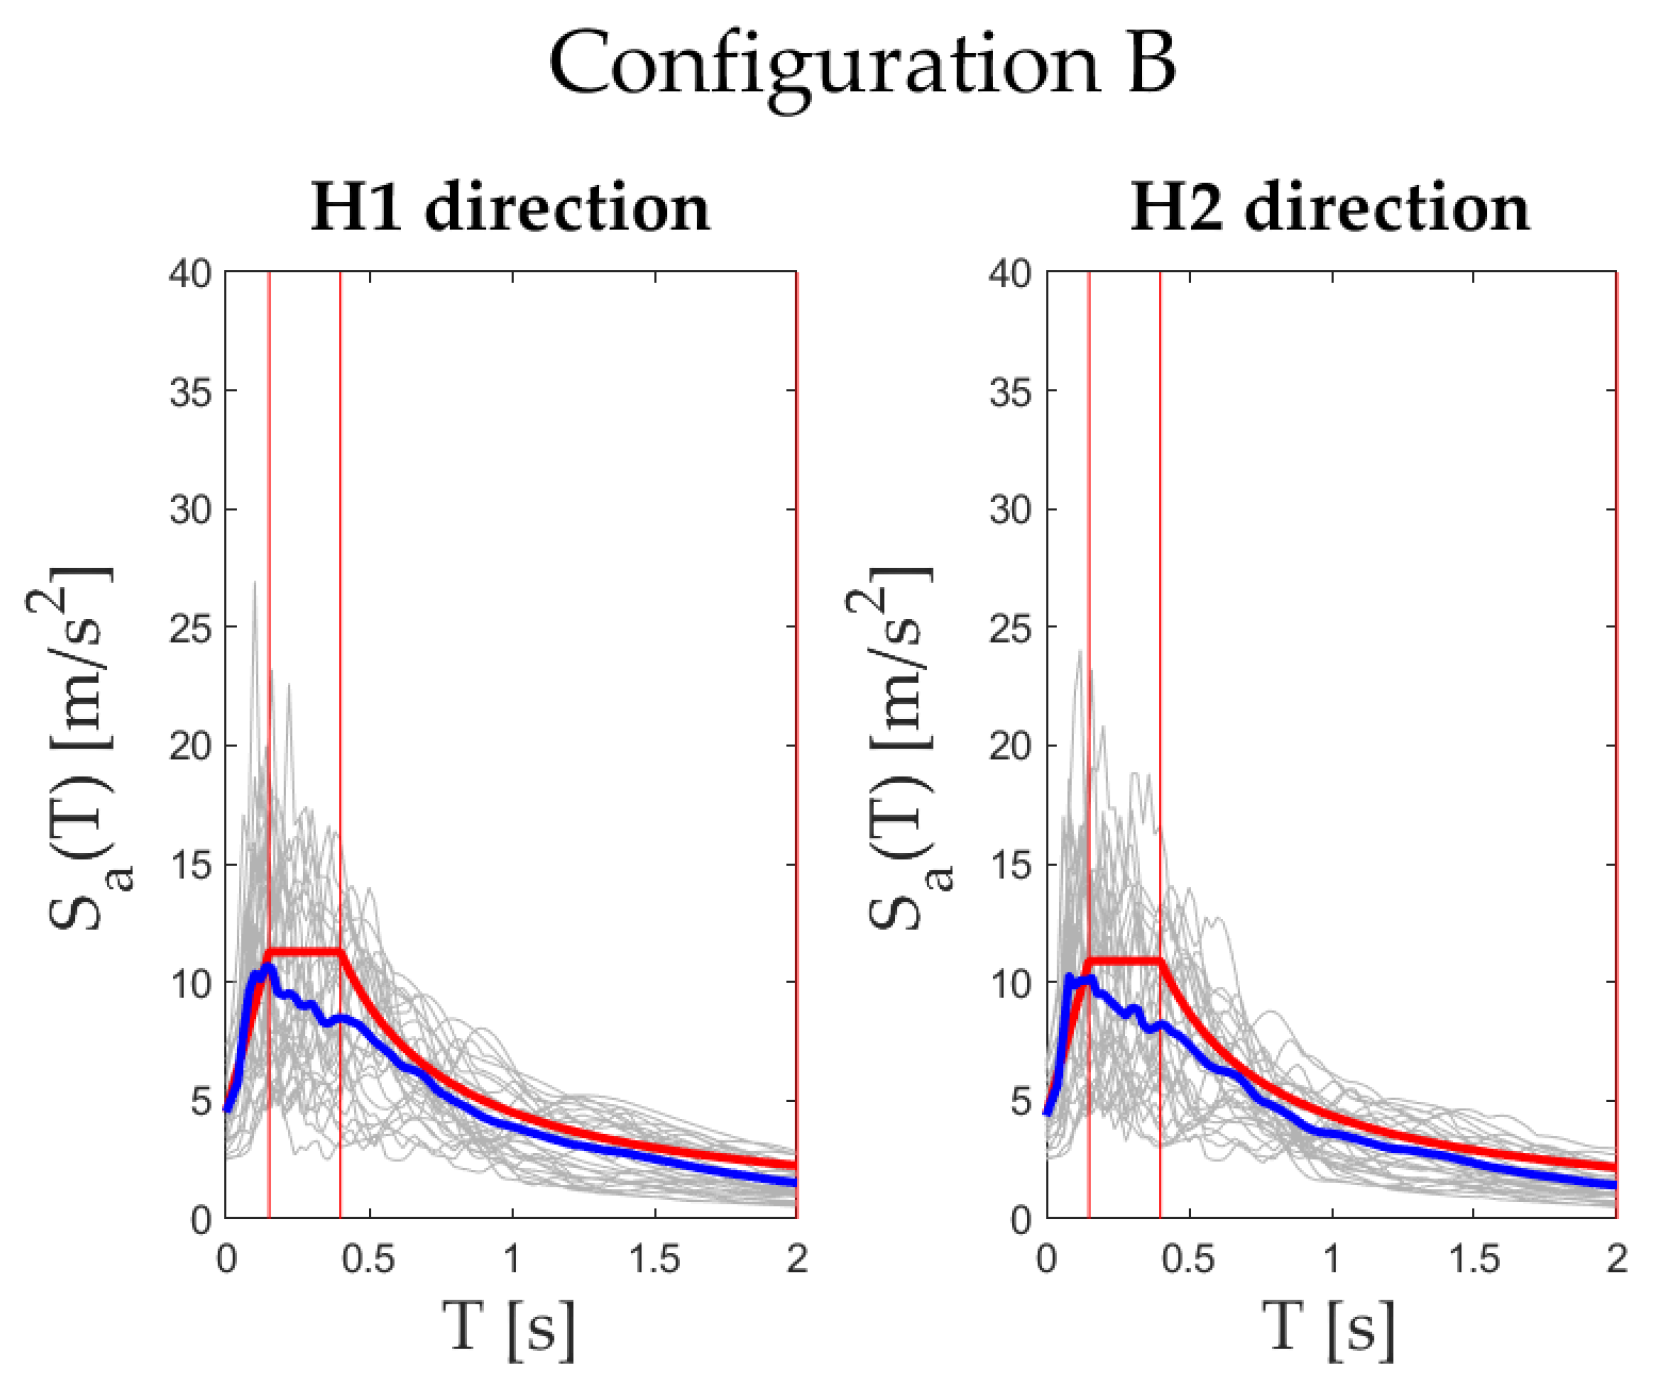
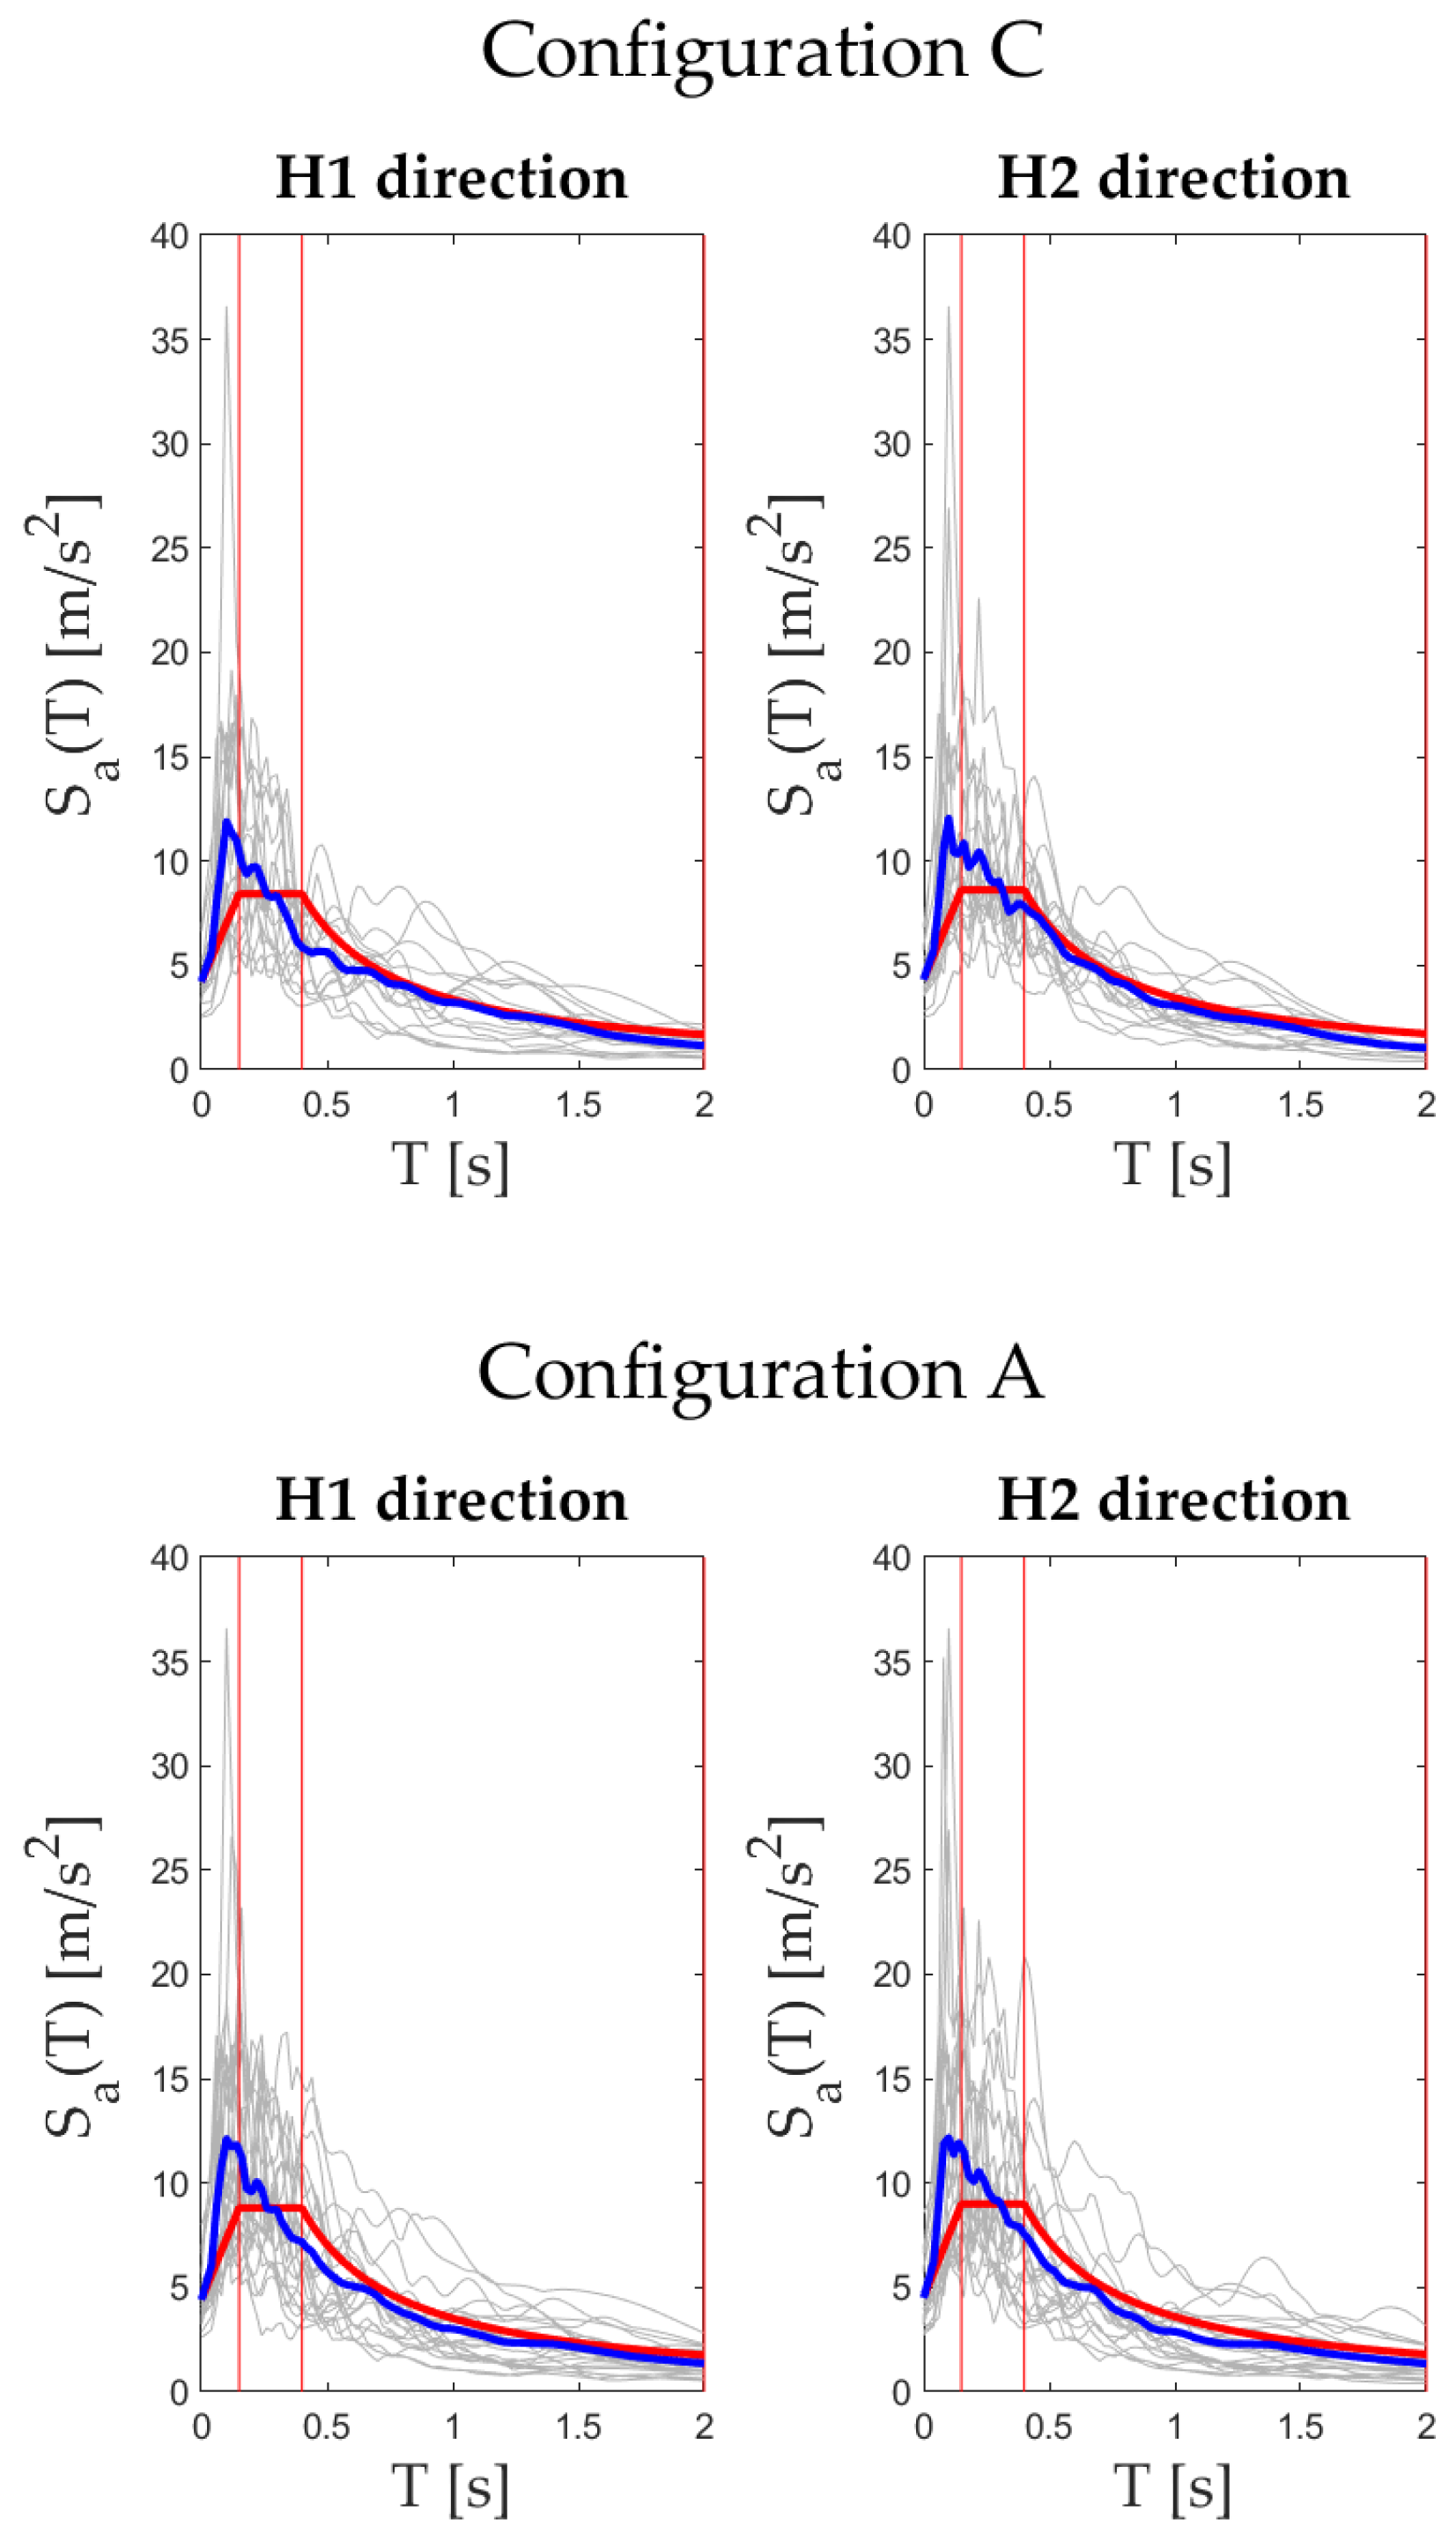
Directly comparing the response from a single record with the NSP-derived solution would not be meaningful. The procedures of calculating the displacement demand are based on regularly smoothed response spectra. The shape of the response spectrum adopted is checked against the median spectrum derived from the recordings adopted in the NLDAs. Figure 4 and Figure 5 compare the acceleration response spectra associated with the actual records used in executing the NLDAs (in grey) and the conventional ones according to the Standards format (in red), i.e., the one used in the case of NSPs. H1 refers to the signals applied in the X-EW direction, while H2 refers to those in the Y-NS direction. It is worth specifying that only the records that lead the NLDAs to satisfy the achievement of the NC limit state are examined; the acceleration response spectra marked in blue in Figure 4 and Figure 5 refer to the average of such a subset of recordings. Data are reported for the three configurations examined of the investigated case study. The spectra according to the Standards format are defined according to the common format, in which the region at constant acceleration is estimated as S · F 0 · P G A · η , where S is the maximum response spectral acceleration (5% damping) corresponding to the constant acceleration range of the horizontal elastic response spectrum; F 0 is the short period site amplification factor; and η is the damping correction factor for the elastic response spectrum. In particular, S and η are assumed to be equal to 1, while F 0 is alternatively equal to 2.5 (Figure 4) and 2 (Figure 5). The decision to consider both these options is made to investigate the sensitivity of the results of fragility curves derived from NSPs to this factor and, in particular, to obtain a shape as close as possible to the seismic input adopted in NLDAs (i.e., with a shape able to reproduce, on average, that of the set of accelerograms leading to the attainment of the NC).

3.2. Assessment of Fragility Curves by Nonlinear Static Analyses

To derive the fragility curves from the NSPs, the criteria introduced in Section 3 are applied to each of the pushover curves obtained by the execution of the NLSAs on a set of 125 models generated for each of the three configurations examined for the URM case study illustrated in Section 4.
The 125 models are generated by Monte Carlo sampling [75,76] with the aim of estimating the influence of the uncertainty associated with the material’s mechanical parameters.
As introduced in Section 2, the expressions summarized in Table 3 are inverted by imposing that d*max is equal to the ultimate displacement associated with the attainment of NC LS (i.e., d m a x = d u , N C ), in order to estimate the maximum value of the PGA compatible with NL (PGANC).
These PGA values are then sorted in ascending order and a probability value is associated with each of them. In this way, the fragility curve from NSP is defined.
To avoid comparing a fragility curve (from NLDA) with a single deterministic estimate of the seismic capacity (from NLSA), 125 models are created through a Monte Carlo process [75,76]. This aims to derive a fragility curve for NLSA, accounting for dispersion related solely to uncertainties in masonry mechanical properties.
Smaller dispersion is expected for the fragility curves from NLSAs than NLDAs since, in an NLSA, there is no record-to-record variability, and the same spectrum is used on all 250 static analyses (where, instead, the models are different with regard to the mechanical parameters of the panels).

4. Masonry Building Prototype: Modeling and Preliminary Nonlinear Analyses

4.1. Description and Modeling
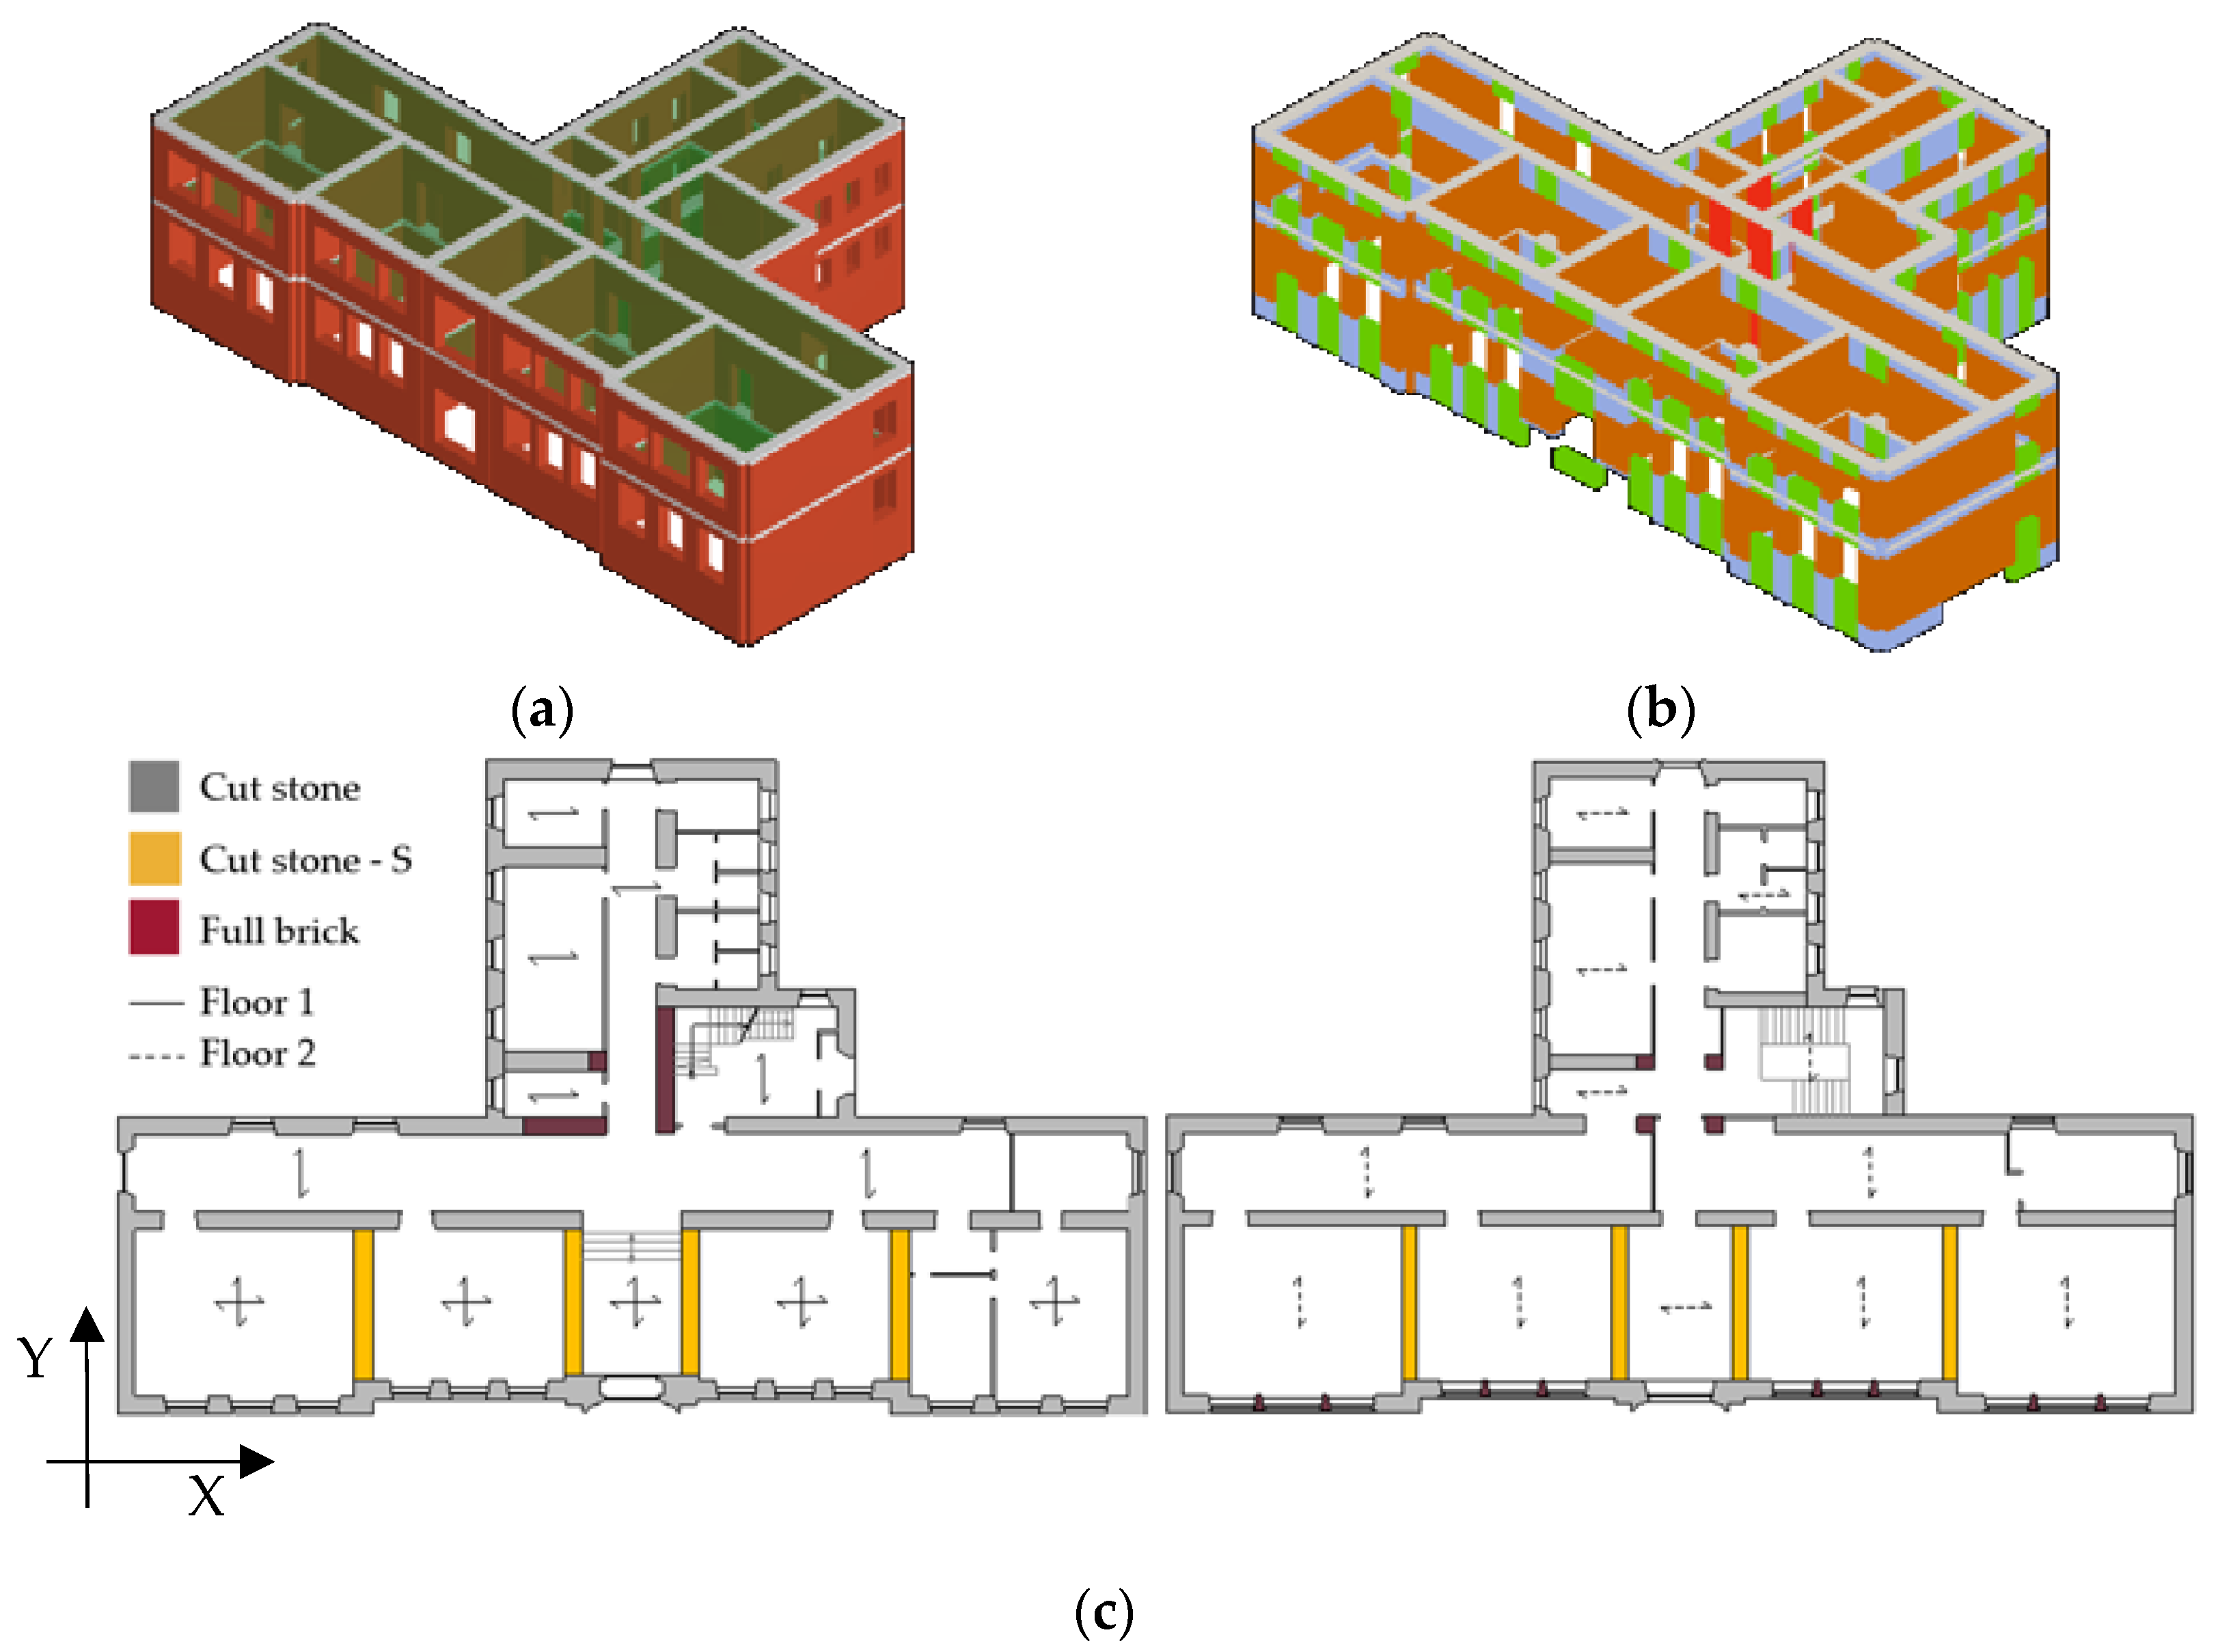
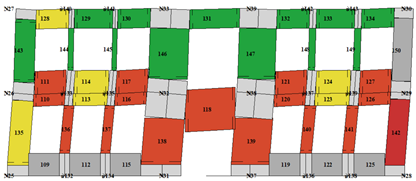
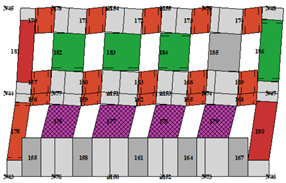
The case study is inspired by the Visso School [28,77,78], a URM building permanently monitored by the Seismic Observatory of Structures of the Department of Civil Protection (DPC) and now demolished (due to severe damage that occurred after the 2016/2017 Central Italy earthquake). The seismic response of this structure was investigated in detail in the previous research of some of the authors, and the numerical model used here was extensively validated in [28] by executing NLDAs designed to simulate the actual response of the school building hit by the Central Italy seismic sequence. The building is characterized by two stories, irregular in plan and regular in elevation, with a prevailing masonry typology composed of cut stone, with the localized presence of pillars constructed from full brick units with lime mortar. It presents diaphragms that are stiff in their planes. The in-plane configuration is depicted in Figure 6c.
TreMuri software rel.2022 [79] is used to implement the model and perform the numerical nonlinear analyses. This software works according to equivalent frame (EF) modeling. Thus, walls are discretized into a set of masonry panels, i.e., piers and spandrels, where the nonlinear response is concentrated. These panels are connected by rigid nodes. Notably, this modeling strategy focuses on the in-plane (IP) response of URM walls, assuming that out-of-plane mechanisms are prevented. The research herein discussed in fact focuses only on the global IP response, which the NSPs illustrated in Section 2 refer to.
The nonlinear response of the piers is simulated by adopting the multilinear constitutive laws developed by [80], suitable also for describing the most recent Standard proposals and depicted in Figure 7. In this figure, two types of Code-based nonlinear constituents are illustrated: one consistent with the current Italian Structural Code [8], which is elasto-plastic for piers and considers a residual strength capacity for a spandrel after an initial strength decay, and one consistent with “Updating EC8-3 rel.2019” [56], which is multilinear for both piers and spandrels. In the case of spandrels, the residual strength capacity is due to the contribution associated with the architrave or another tension-resistant element that is coupled (e.g., an RC beam).
Figure 6. A 3D view of the geometric model (a), equivalent frame model adopted (b), and 2D in-plane configuration with the identification of the present masonry typologies (full brick; cut stone—unconsolidated; cut stone—S-consolidated) (c). The arrows indicate the main orientation of diaphragms.
Applsci 14 01130 g006
Figure 7. Constitutive laws assumed according to NTC2018 [8] and Updating EC8-3 rel.2019 [56] for (a) pier and (b) spandrel elements.
Applsci 14 01130 g007
Starting from the actual geometrical architecture of the Visso School and maintaining the masonry types and diaphragm types that characterize it, three different structural configurations are considered (types A, B, and C), aiming to investigate the sensitivity of the nonlinear response to various structural details (i.e., the presence or not of RC ring beams) as well as the wall-to-wall connection’s efficiency. More specifically,
  • Case A assumes the absence of reinforced concrete beams coupled to the spandrels and good interlocking between the external and internal walls;
  • Case B assumes the absence of reinforced concrete beams coupled to the spandrels and poor interlocking between the external and internal walls;
  • Case C assumes that RC ring beams are coupled to the spandrels and there is good interlocking between the external and internal walls.
The structural configurations A and C are conceived to verify the sensitivity of the results when varying different global mechanisms activated in the structure (whether the prevailing shear failure mode in piers—expected to occur in case C—or the flexural failure mode in piers and spandrels—expected to occur in case A). Configuration B is instead conceived as a typical example of the epistemic uncertainty that analysts might encounter when investigating real URM buildings and associated with the quality of the interlocking between vertical walls (as further discussed in [81]).
As already introduced in Section 3, 125 models are generated through a Monte Carlo process, so as to obtain a fragility curve that only includes the dispersion related to the uncertainties in the mechanical properties of the masonry.
More specifically, uncertain parameters of the following wall typologies present in the structure (Figure 6c clarifies where the three masonry typologies are located) are considered:
  • Unconsolidated cut stone masonry, which characterizes the majority of the wall panels;
  • Consolidated (through injections) cut stone masonry, which involves some internal side panels oriented perpendicularly to the main façade;
  • Full brick masonry with lime mortar, which some internal pillars and an internal wall are composed of.
The mechanical parameter values of these masonry types are generated stochastically, having assumed a range of variation consistent with the reference values proposed in Table C8.5.I of the Circular of NTC 2028 [82], and summarized in Table 4.
For the purposes of Monte Carlo sampling for the generation of the mechanical parameters, it is decided to adopt criteria similar to those already established within the RINTC 2018 project [83], the use of which has been consolidated in other applications [52].
Indeed, the actual sampling interval adopted for Monte Carlo sampling (Table 5) is obtained by taking as a reference interval the one in Table 4 [82], further amplified by accounting for possible masonry characteristics (e.g., good mortar quality or good interlocking between transversal walls) compatible with the examined masonry types.
The stochastic parameters for the wall panels in the models are determined using the median value and the dispersion within each parameter interval, as illustrated in Table 6.
In particular, the following parameters are considered to be uncertain: the elastic Young’s modulus E; the elastic shear modulus G; the compressive masonry strength f m ; the masonry shear strength τ 0 ; the specific weight ρ ; the drift thresholds associated with a relevant strength decay in the constitutive law assumed for piers (namely, the shear drift θ T and the flexural drift θ P F ). As commonly recommended in the Standards in the absence of more detailed information [49], the masonry’s cracked stiffness is considered to be half of its elastic stiffness.
Thus, every generated model is analyzed, carrying out NLSA in the X and Y directions, positive and negative verses, with “uniform” and “modal” load patterns considered, for a total of 1000 NLSAs performed. However, because the Standards require one to consider only the worst verification outcomes among those obtained from the above cases (positive or negative verse, uniform or modal LP), the uniform one, being the most punitive distribution, is considered for the discussion of the results presented in the subsequent sections. Figure 8 reports the results of NSPs in terms of fragility curves, where it is possible to notice how that derived from the uniform load pattern is always the one associated with the lowest value of the median IM.
Table 5. Sampling interval adopted for Monte Carlo sampling.
MortarCross
Connection
Injections
Cut stone increase1.31.31.5
Full brick increase1.471.3-
f m [ N / m m 2 ] τ 0 [ N / m m 2 ] E [ N / m m 2 ]
minmedianmax
incremented
minmedianmax
incremented
minmedianmax
incremented
Cut stone
unconsolidated
2.64.096.420.0560.0840.125150019652574
Cut stone
consolidated
3.97.5114.450.0840.1540.281225036105792
Full brick2.64.628.210.0500.1110.248120017812644
Table 6. Values adopted for the Monte Carlo sampling generation.
ParameterMedian Valueβ
Cut stone
unconsolidated
E 19650.27
f m 4.090.45
τ 0 0.0840.40
θ S h e a r 0.0050.57
θ P F 0.0100.51
Cut stone
consolidated
E 36100.47
f m 7.510.65
τ 0 0.1540.60
θ S h e a r 0.0070.57
θ P F 0.0120.51
Full brick E 17810.40
f m 4.620.58
τ 0 0.1110.80
θ S h e a r 0.0050.40
θ P F 0.0100.40
Figure 8. Fragility curve: in the first column is the X-analysis, in the second column is the Y-analysis; the three rows represent, in order, the three configurations, Visso C, Visso A, Visso B, with their two typologies of LP.
Applsci 14 01130 g008

4.2. Seismic Response of Set Configurations Simulated by Nonlinear Static Analyses

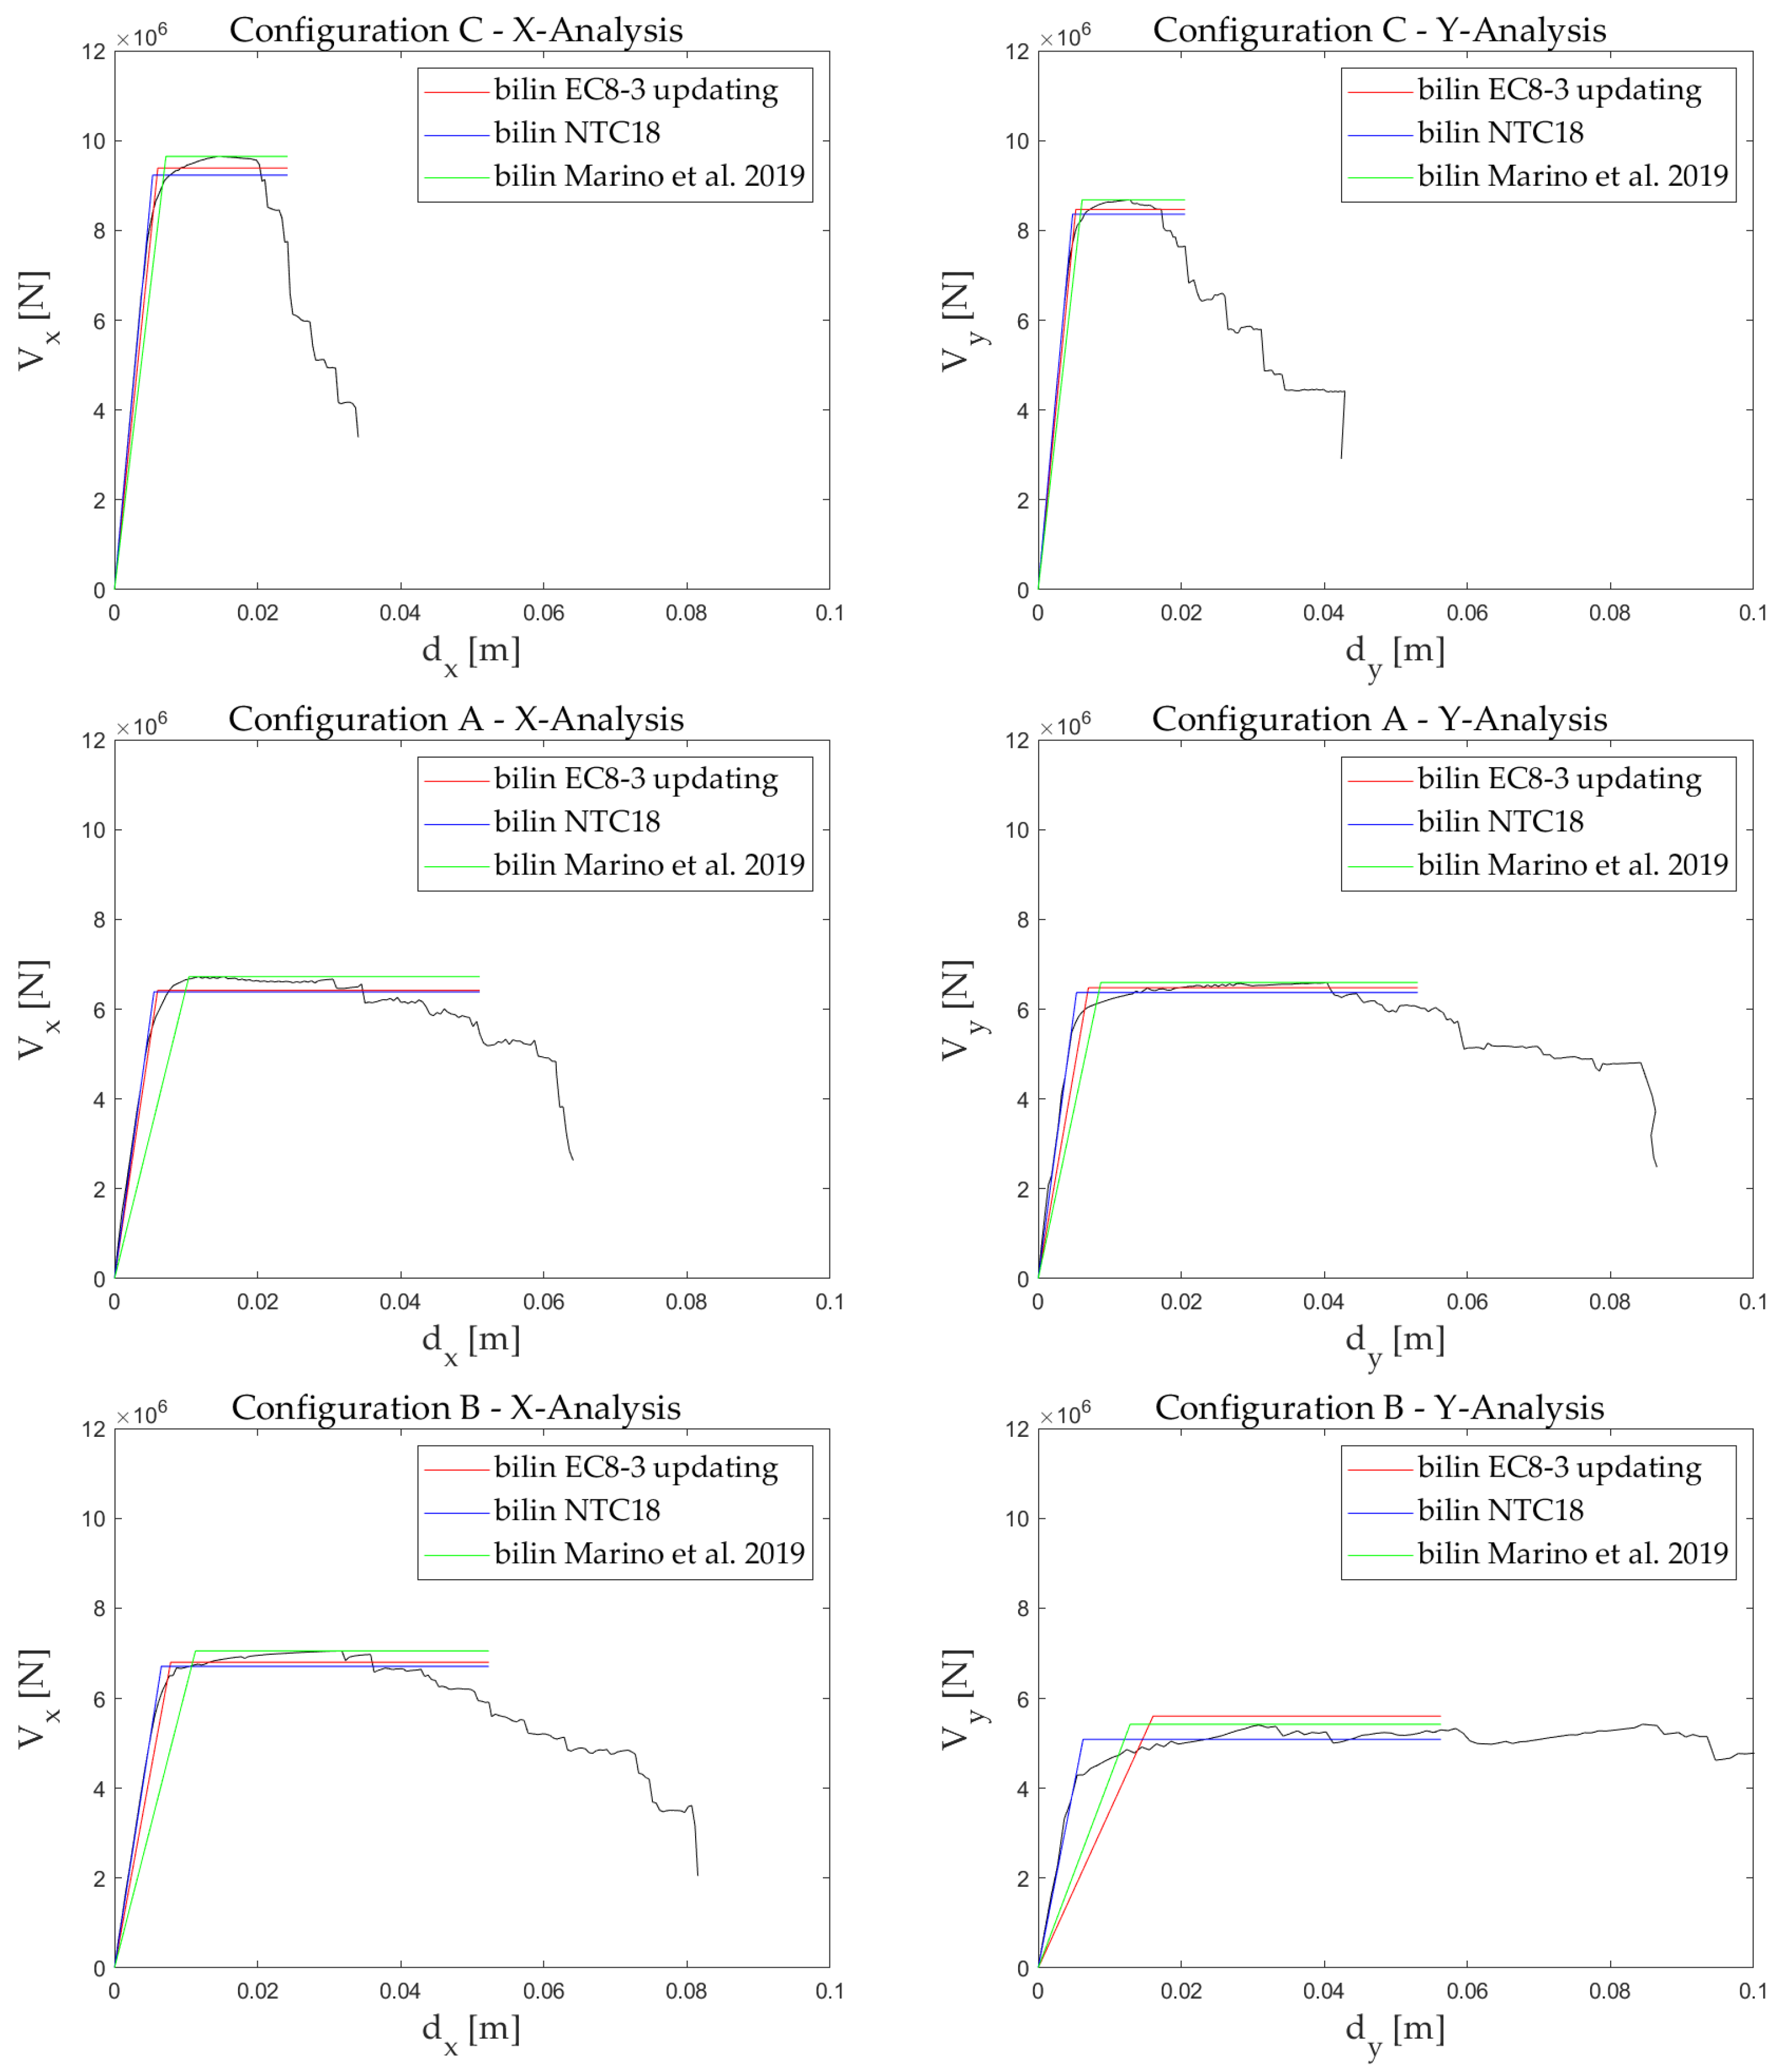
Figure 9 depicts the pushover curves obtained for the three examined configurations by referring to the uniform load pattern. It clearly emerges that the pushover curves exhibit not only a different maximum base shear but also significantly different ductility.
Focusing on the Visso A building, which has no reinforced concrete beams, the pushover curve in the Y-direction is almost a bilinear itself (the horizontal section of the pushover is horizontal), while, in the X-direction, there is the progressive degradation of the pushover.
The same applies to the Visso B case, with the only difference compared to case A being that, having reduced the interlocking in the Y-direction walls, the pushover curve in the Y-direction of case B is weaker than in the Y-direction of case A.
In the X-direction, the building features a facade with spandrels, leading to the more gradual degradation of the pushover curve (see Figure 9), while, in the Y-direction (with more blind piers), the pushover curve shows less progressive degradation. In Visso B, the Y-direction is consistently more brittle due to the weak interlocking between the walls.
Moreover, in the X-direction, there is greater ductility available.
The difference in ductility in the positive and negative directions is linked to the change in the response of the structure in terms of damage.
For example, examining the damage reported in Table 7, Visso C has mixed behavior in the X- and Y-directions (mainly the shear mechanism but also the flexural one is present in some panels), and this is also observable from the pushover curves of this model.
Instead, Visso A has flexural behavior in the X- and Y-directions, and this is also observable from the pushover curves of this model, which are more flattened than in case C, with reinforced concrete beams and with greater ductility. Visso B has the same damage as Visso A, with only less strength in the Y-direction.
All these differences in the seismic response have, firstly, an impact on the bilinear idealization, varying the different criteria adopted, and then on the final outcome consisting of the seismic verification. All these issues are investigated in detail in Section 5.
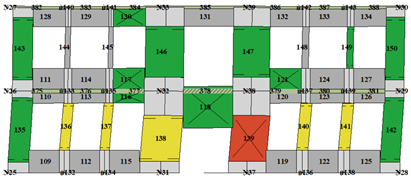
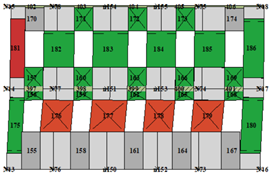
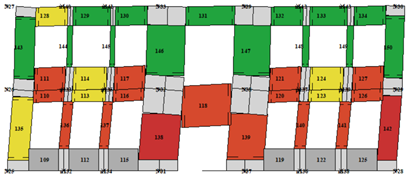
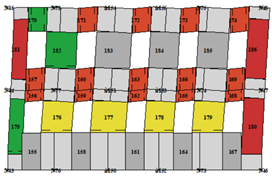
Table 7. Damage: (a) represents the structural damage in a wall in the X-direction; (b) represents the structural damage in a wall in the Y-direction. See (c) for the color and failure mechanism legend.
Wall no.9 (X Dir.)Wall no.12 (Y Dir.)
Configuration CApplsci 14 01130 i001Applsci 14 01130 i002
Configuration AApplsci 14 01130 i003Applsci 14 01130 i004
Configuration BApplsci 14 01130 i005Applsci 14 01130 i006
(a)(b)
Applsci 14 01130 i007(c)
Figure 9. Pushover curves: in the first column is the positive X-analysis, and in the second column is the positive Y-analysis, both considering a uniform load pattern (i.e., the most punitive, as previously checked); the figures represent a comparison among the three configurations.
Applsci 14 01130 g009

5. Results

The outcomes obtained by applying nonlinear static and dynamic analyses are compared in this section in terms of the fragility curves, focusing on the impact of various options for the application of the NSPs (see Section 2), namely related to the choice of the method used to calculate the displacement demand (i.e., whether based on the use of inelastic or overdamped spectra) (Section 5.1) and the approach adopted for the bilinearization of the pushover curve (Section 5.2). As already mentioned, the fragility curve from the NLDA is assumed as a reference to check the reliability of the different alternatives explored for NPSs and determine the most effective one, as illustrated in Figure 10 and extensively discussed in the following sections.

5.1. Influence of the Approach Adopted to Compute the Displacement Demand in N2-Based and CSM-Based Methods
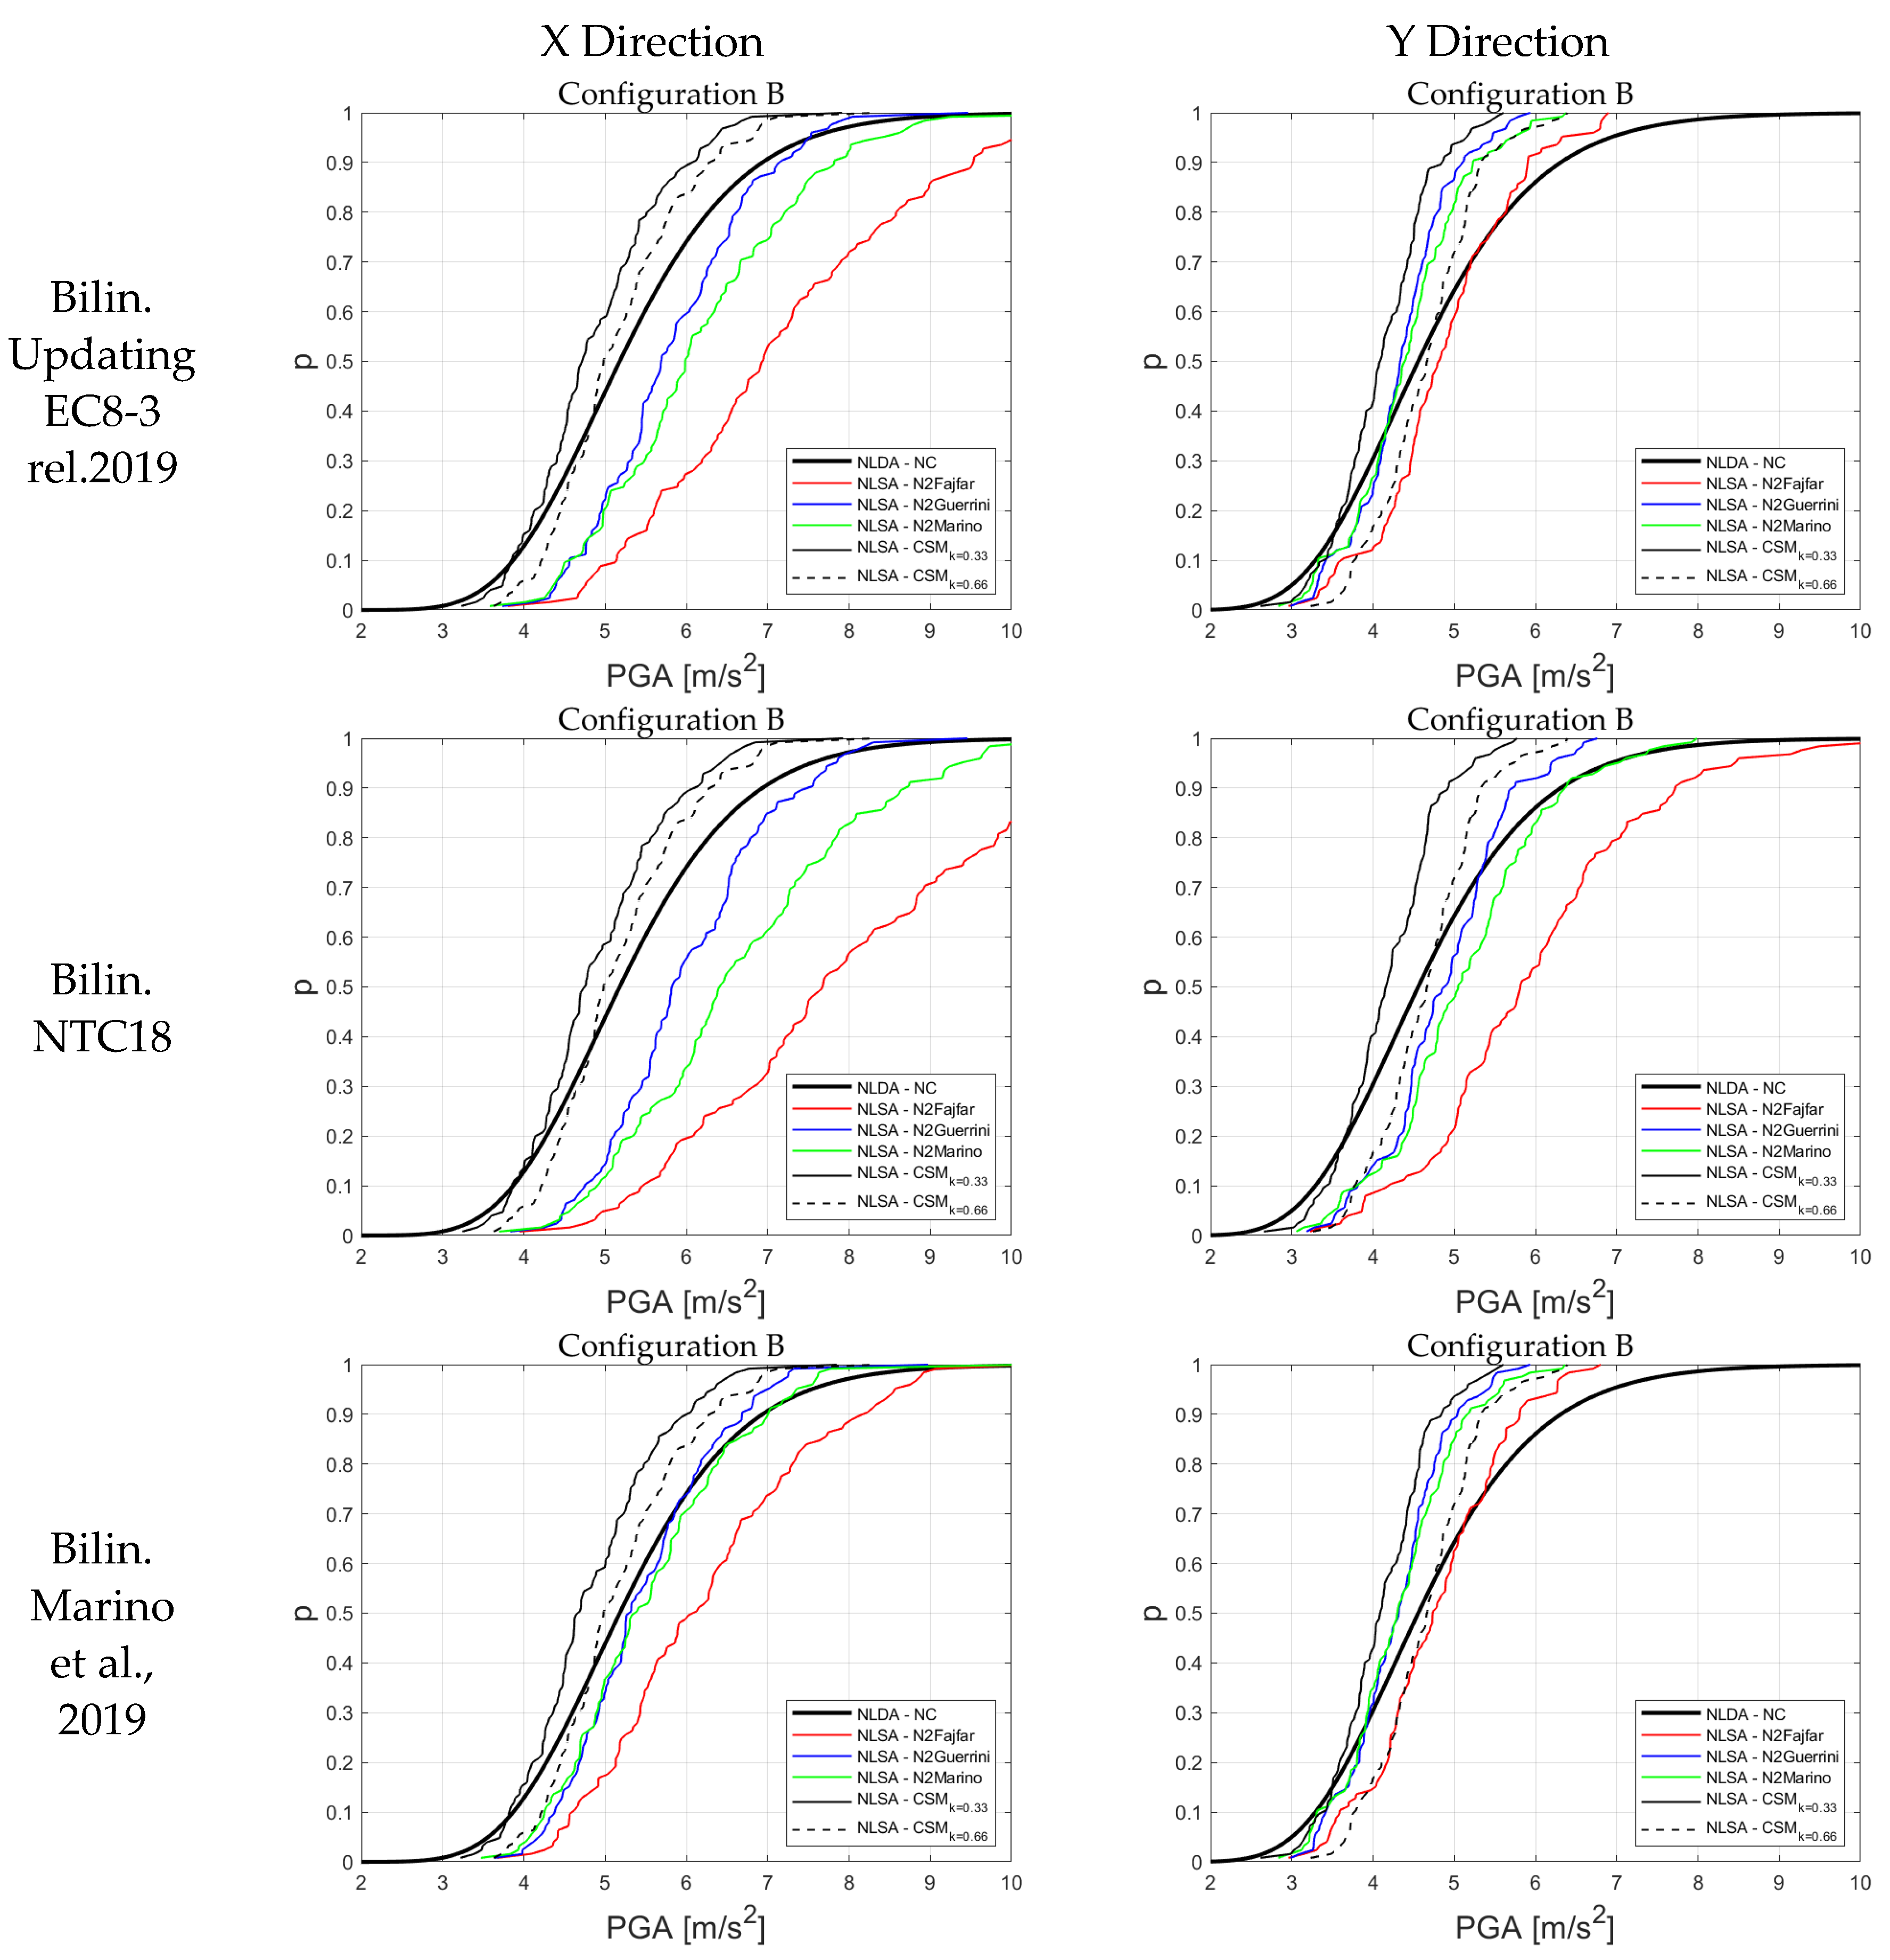
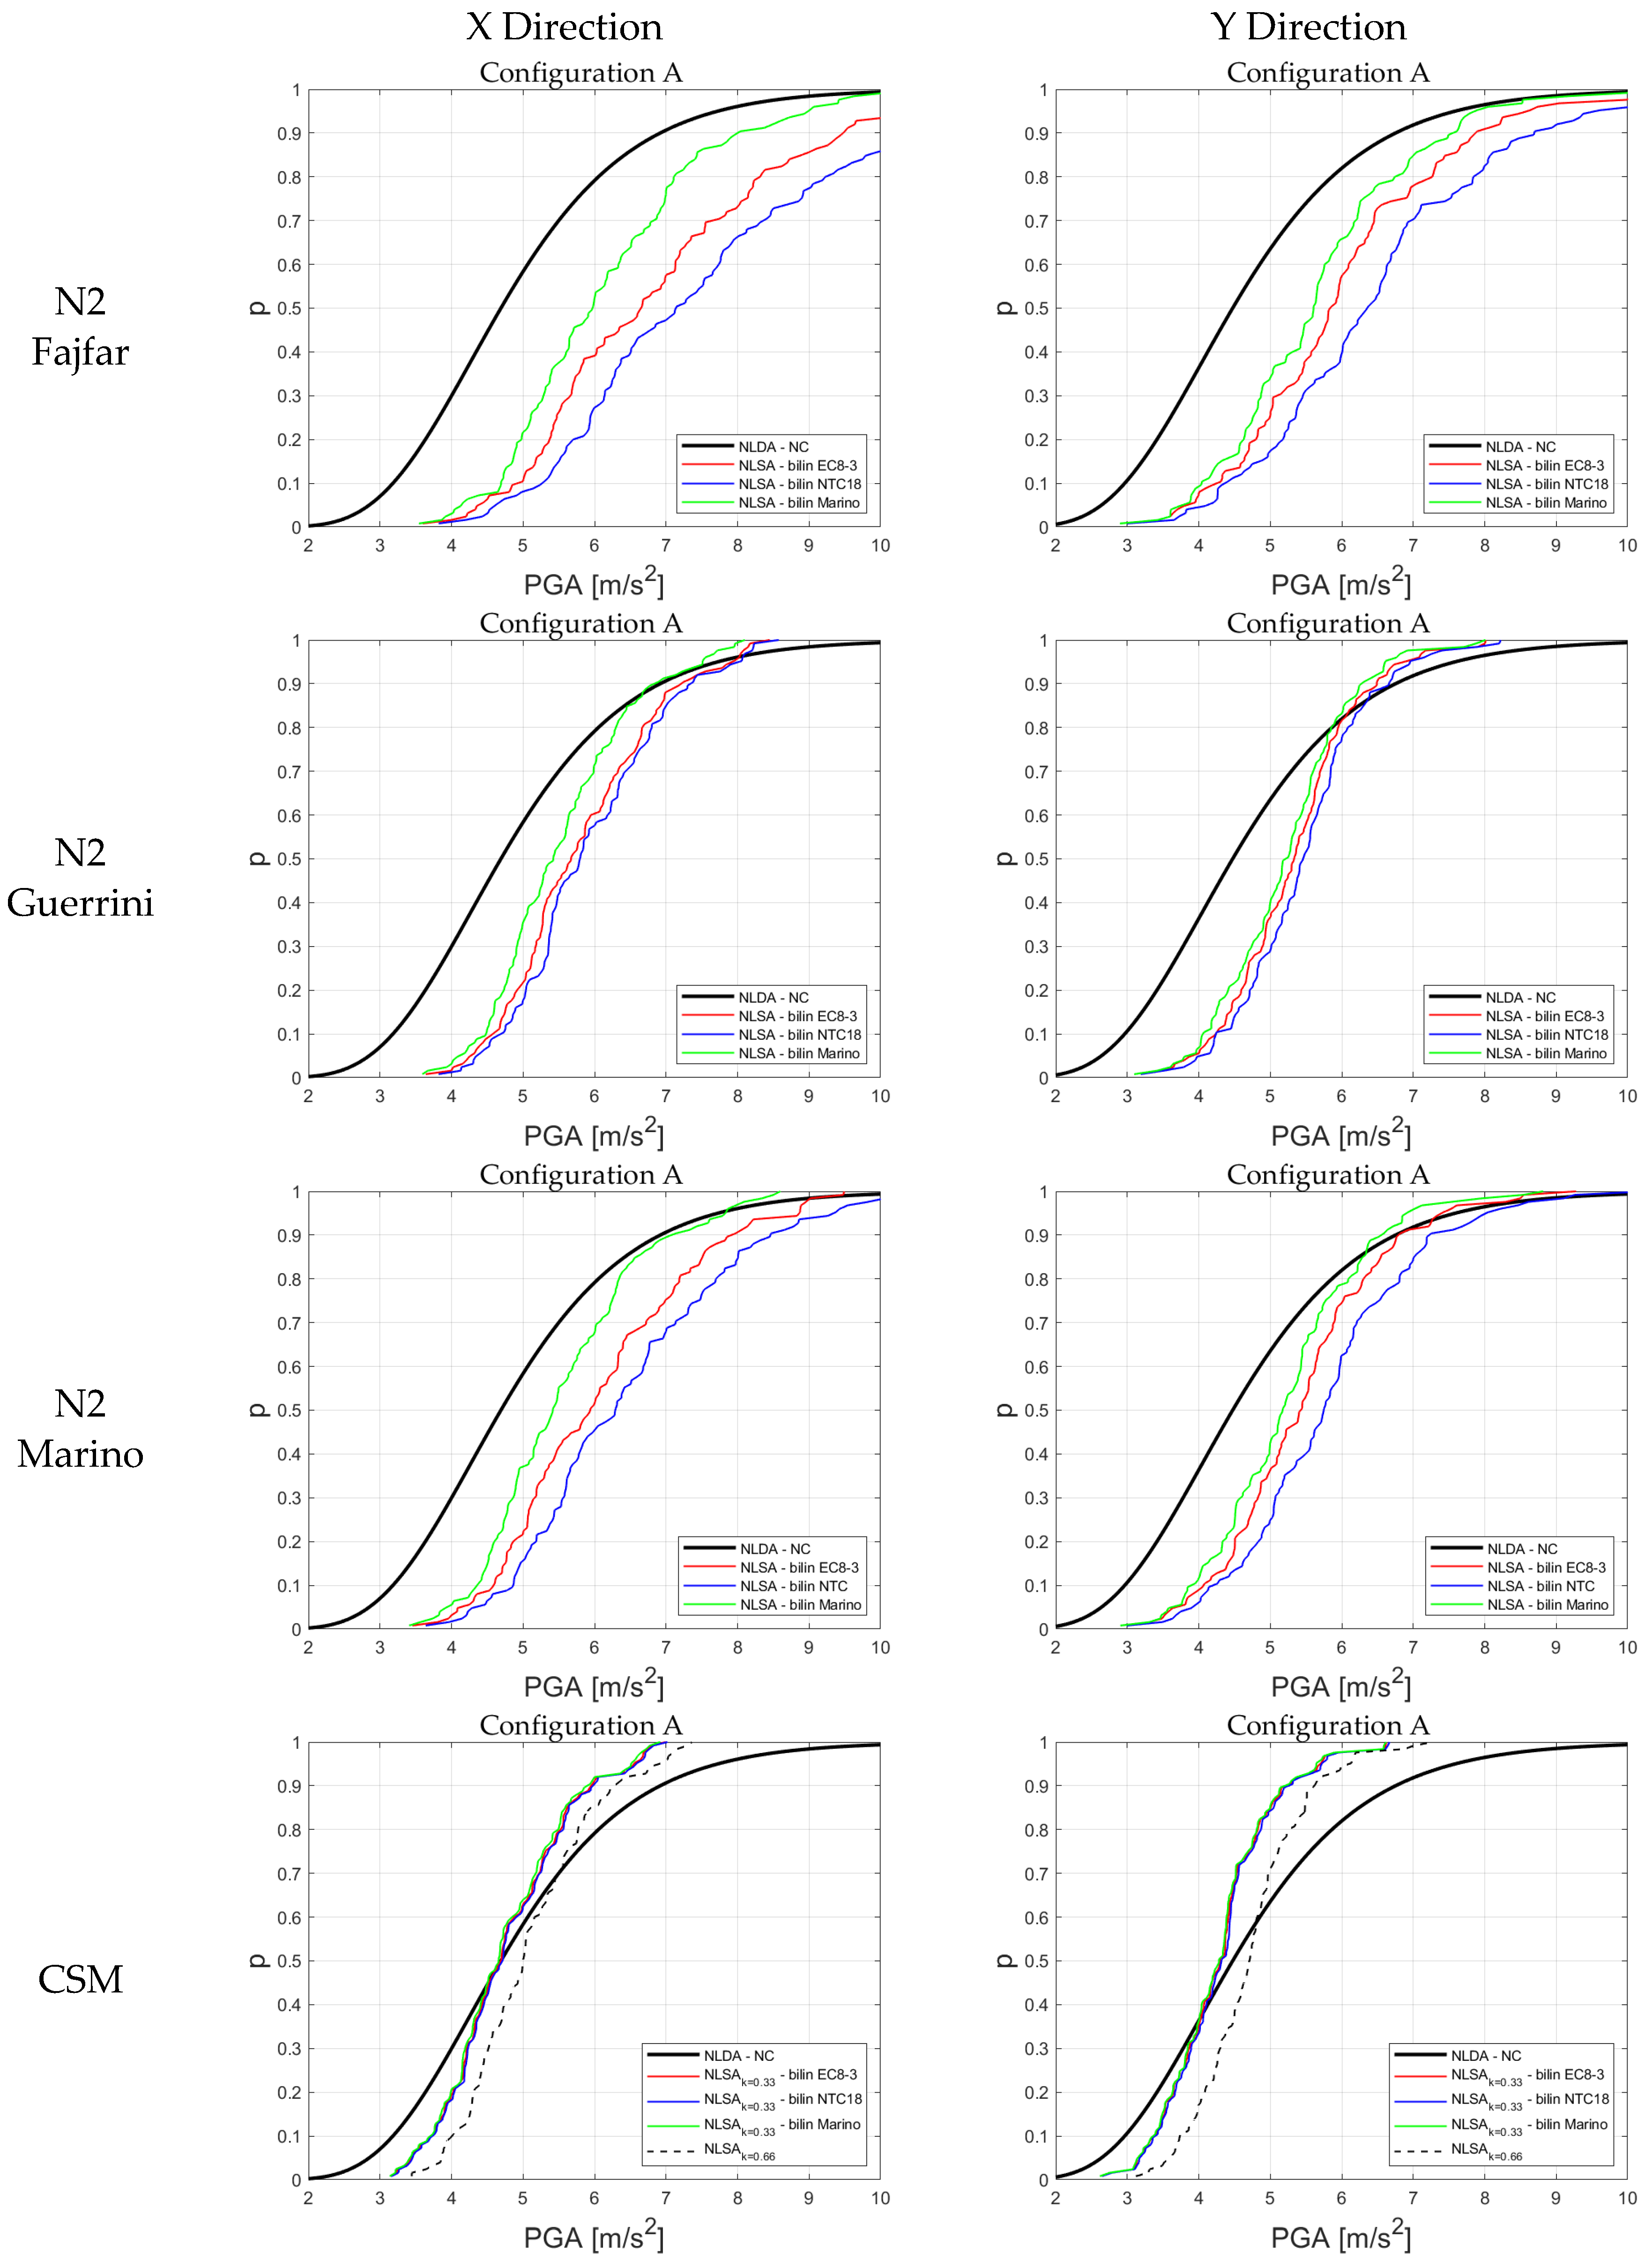
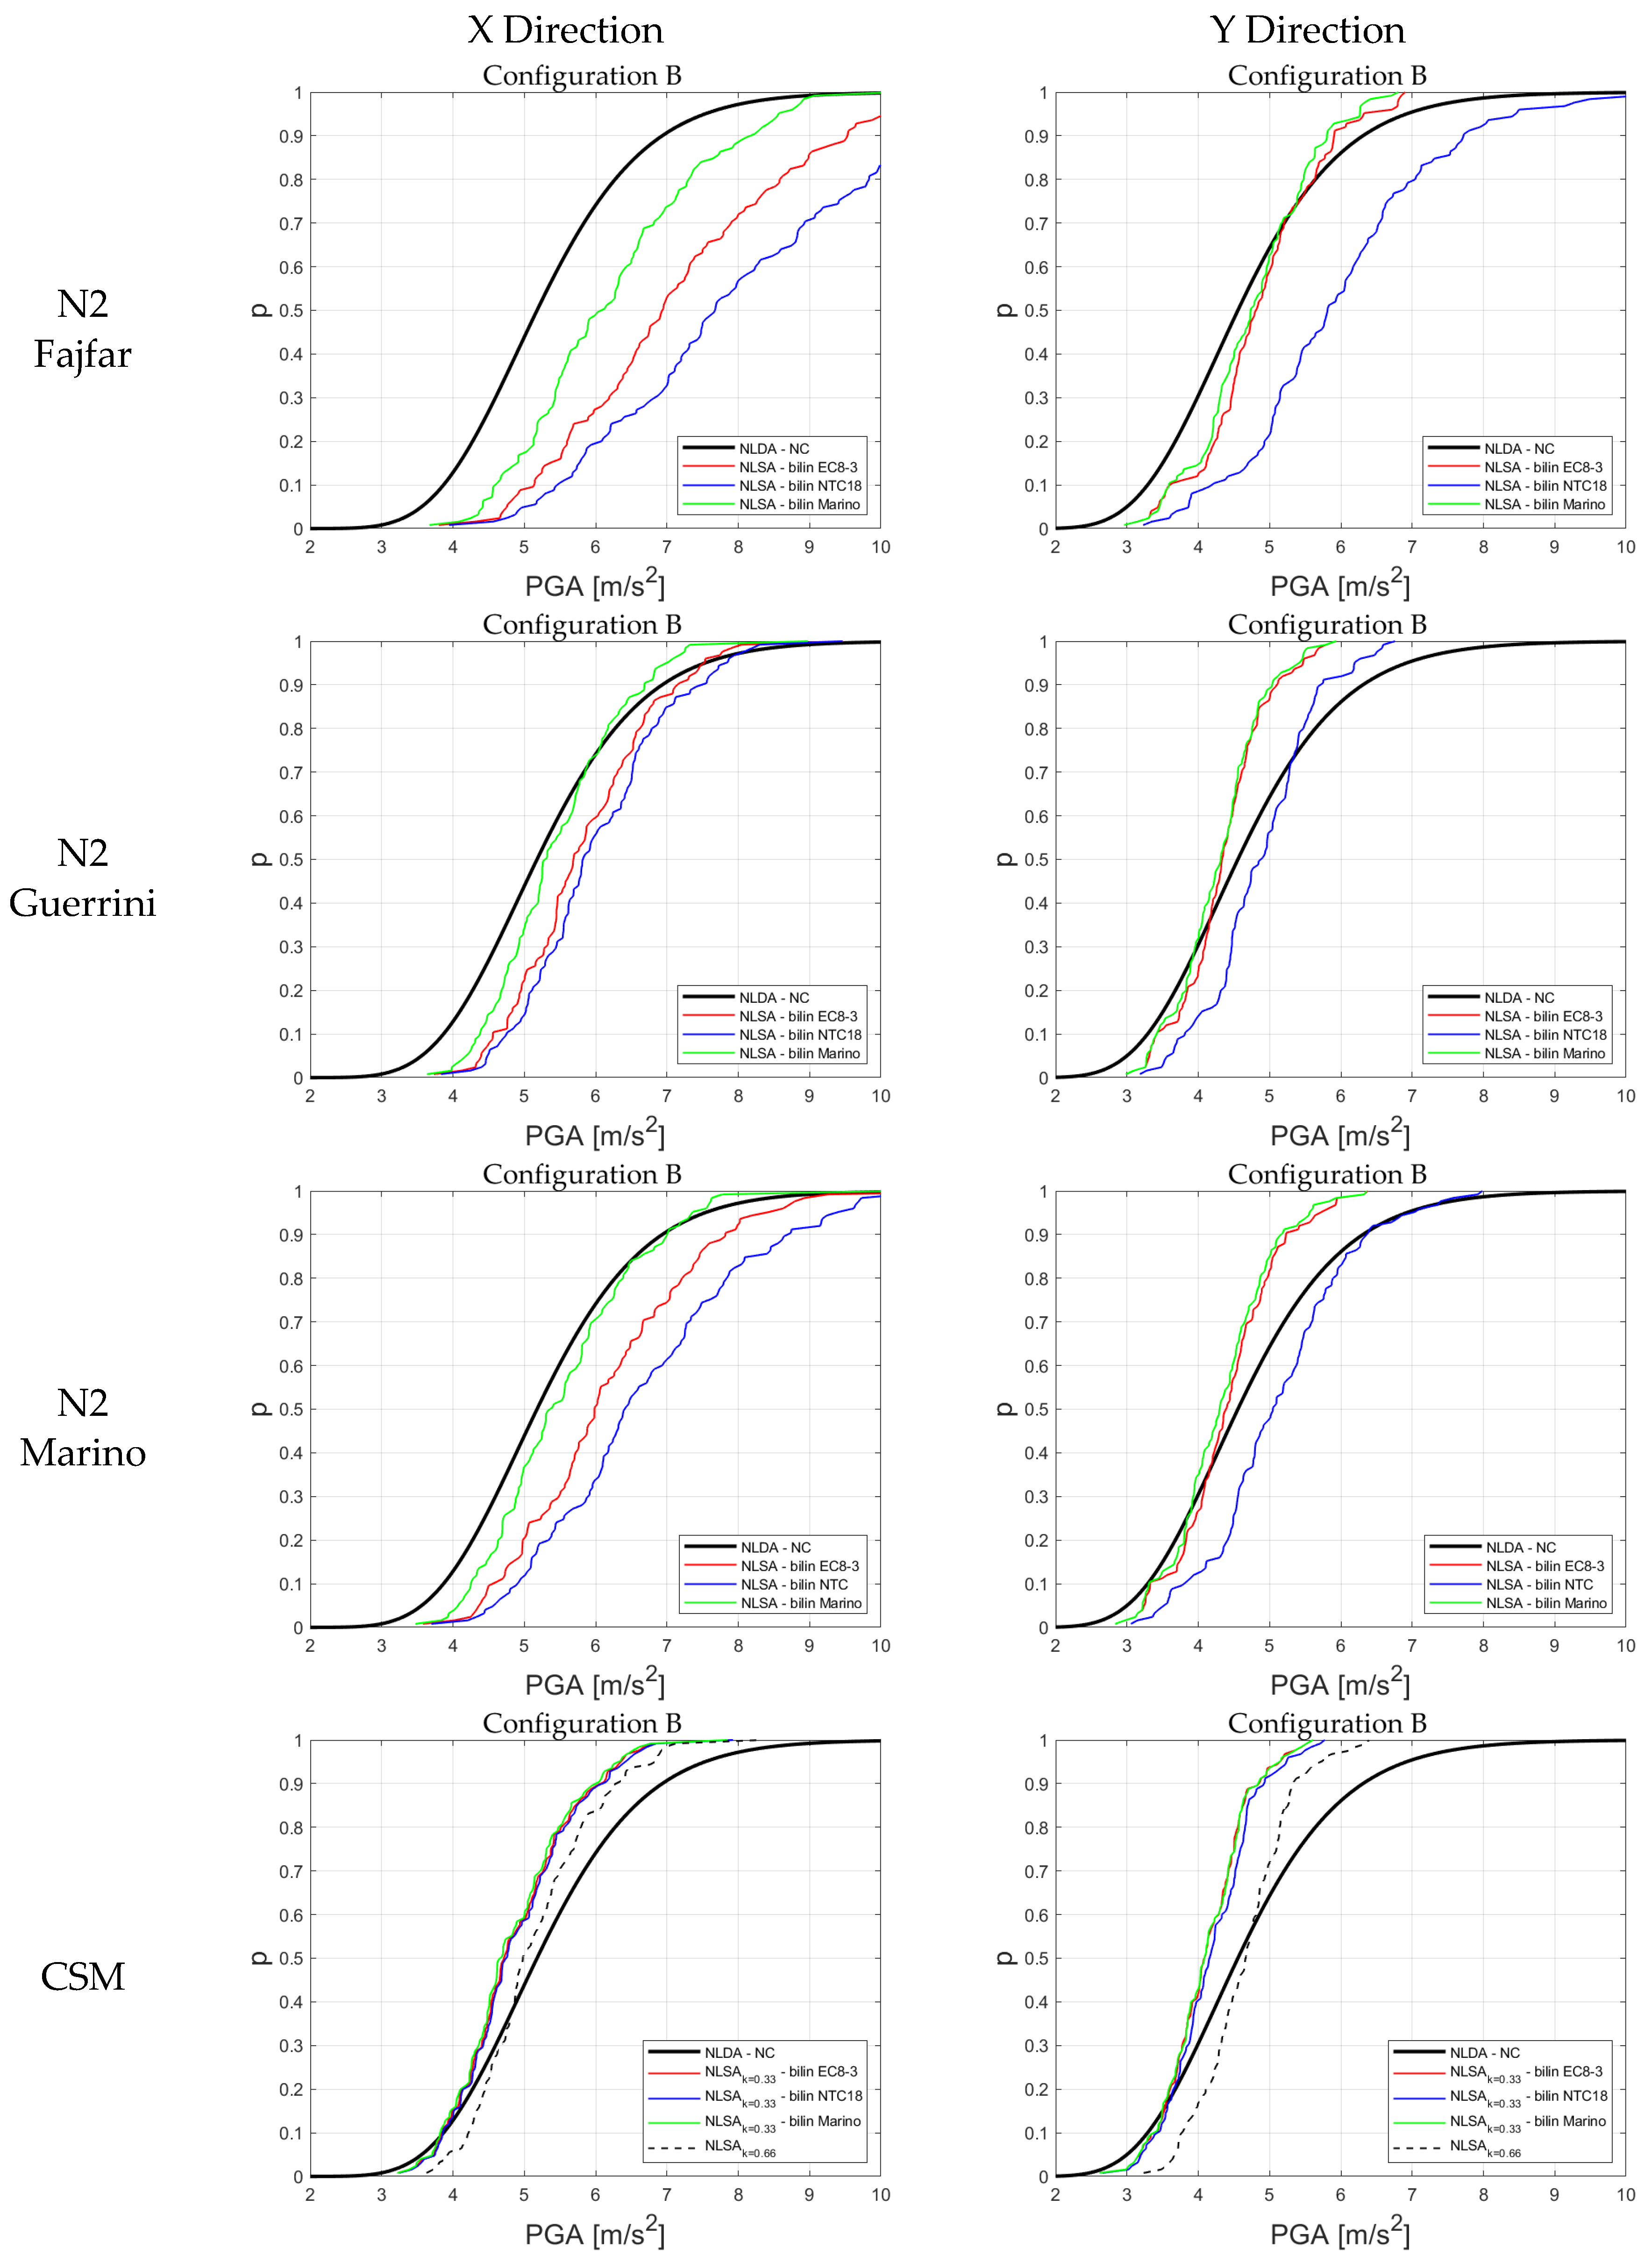
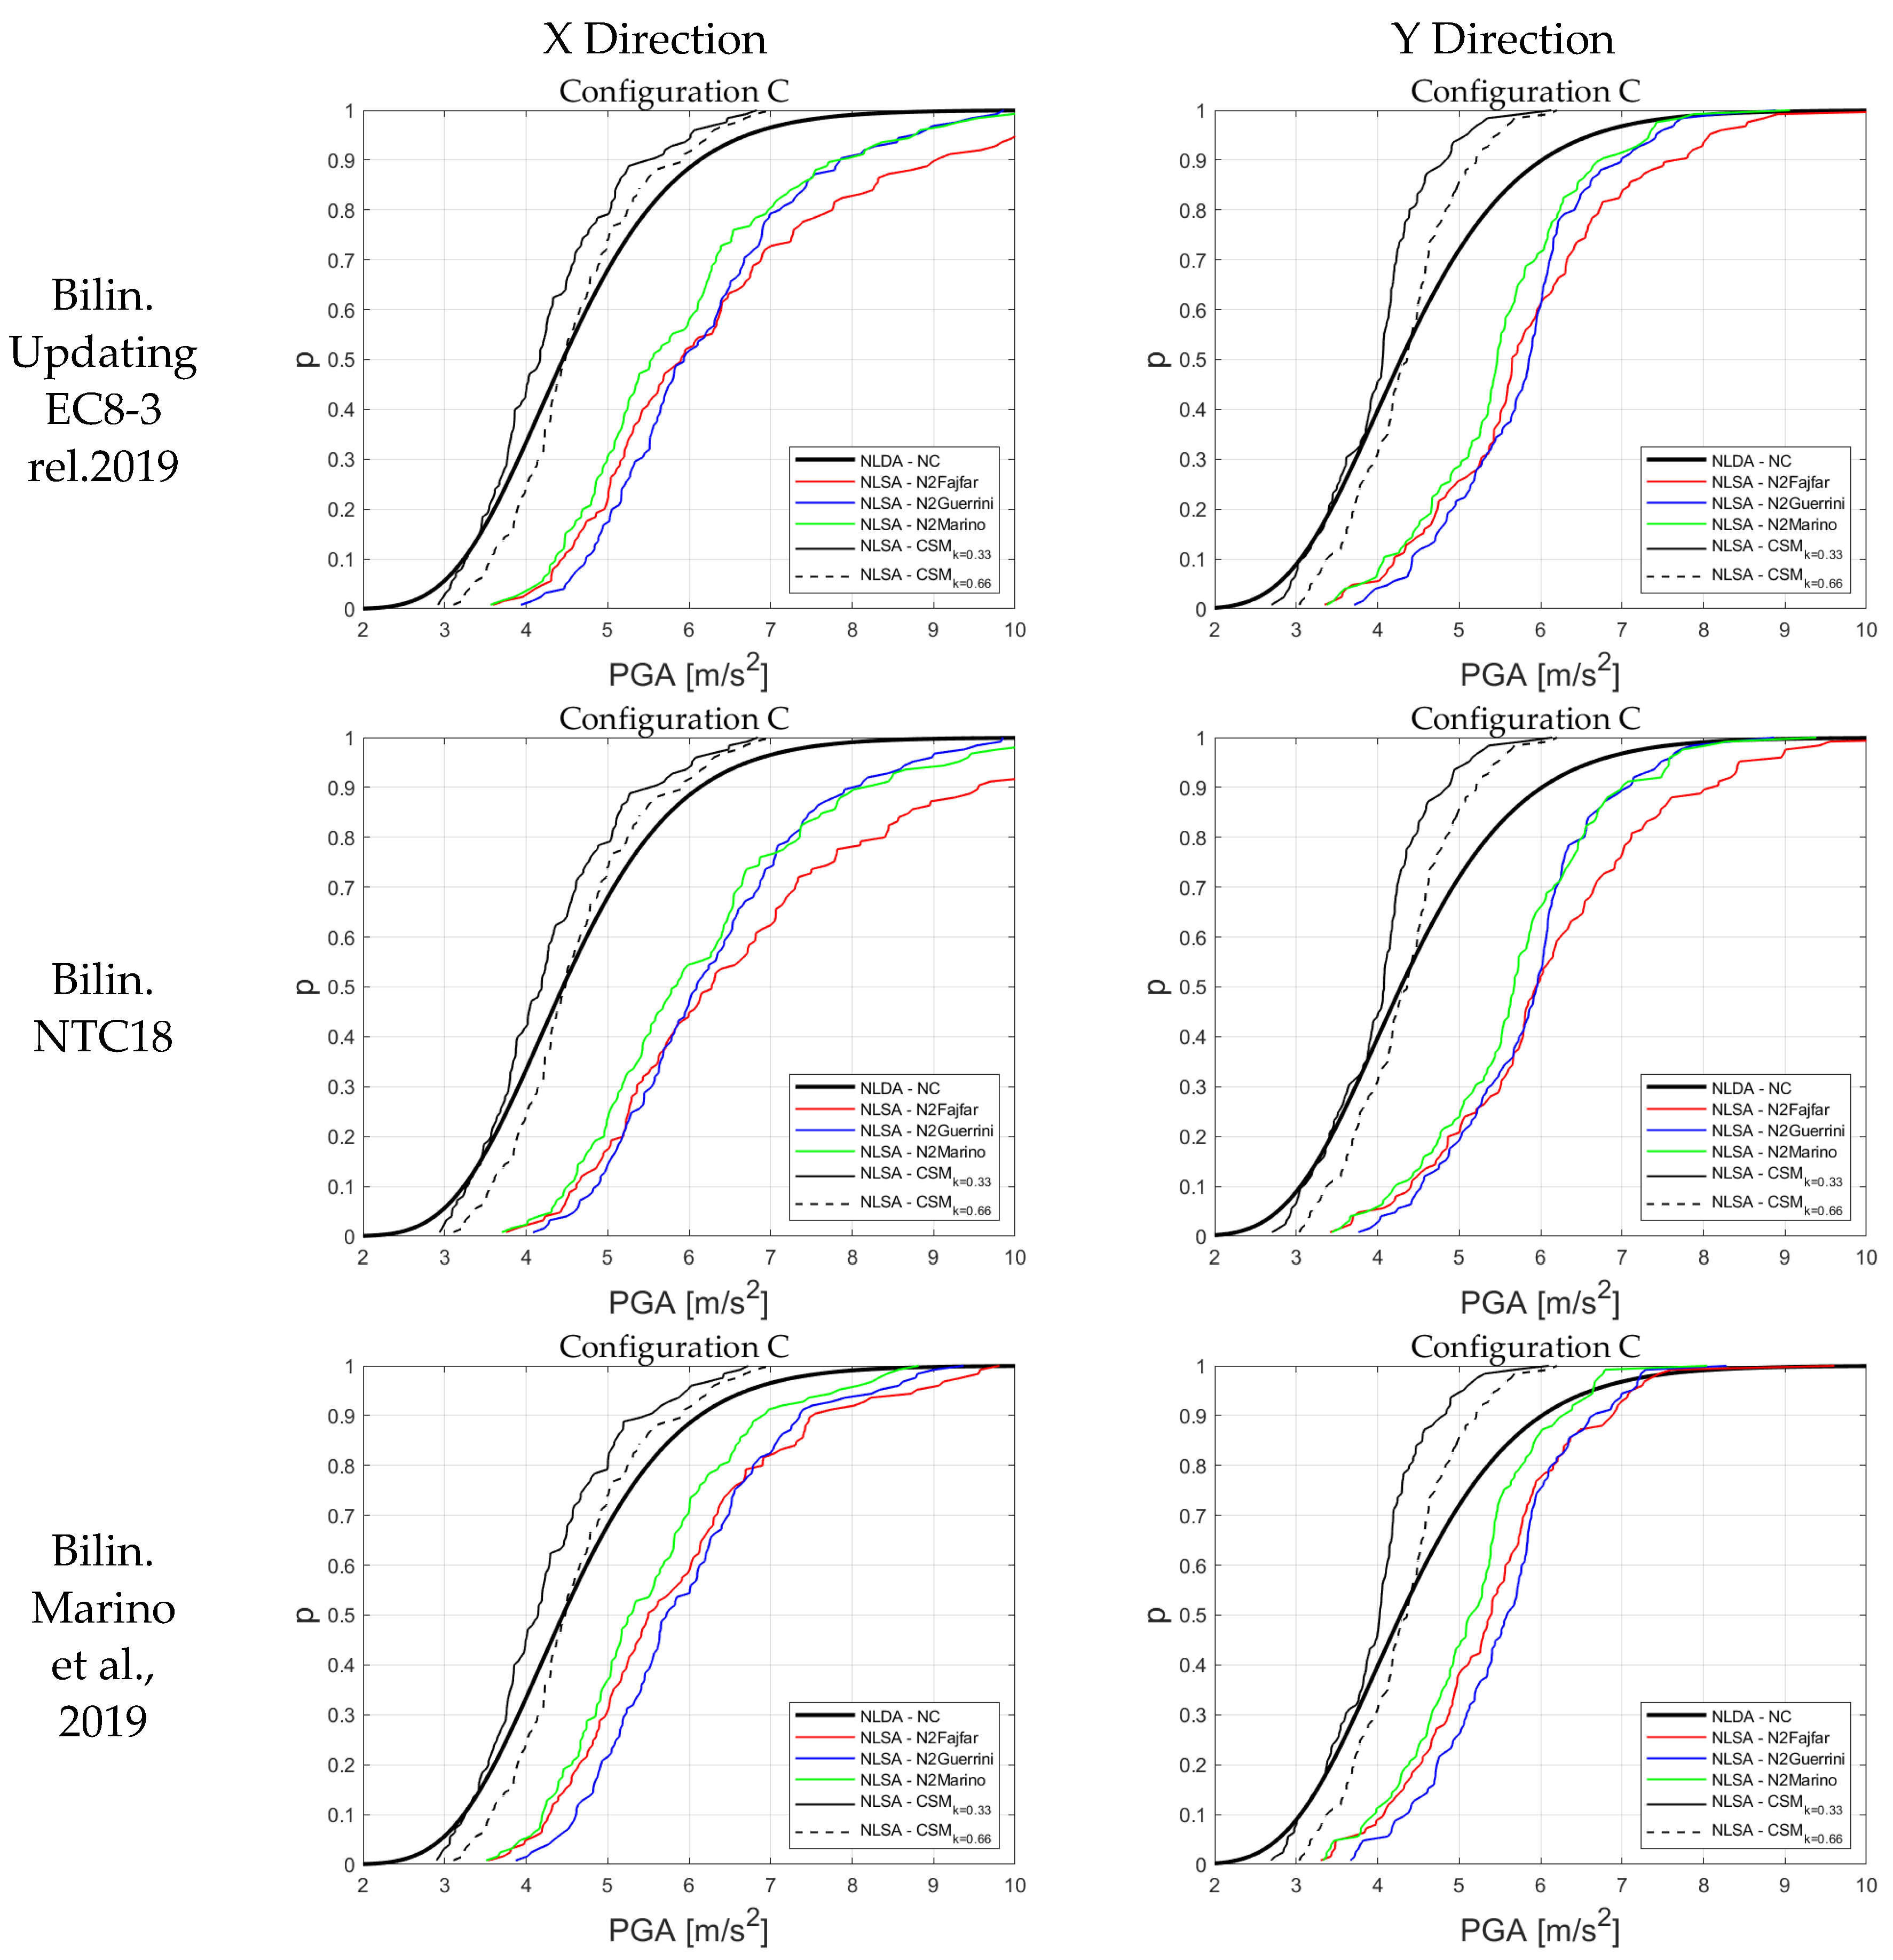
Figure 11, Figure 12 and Figure 13 illustrate, for the C, A, and B cases, respectively, the comparison of the fragility curves obtained from the ADNL (thick solid black line) and different NSPs (colored lines and dashed/thin black lines).
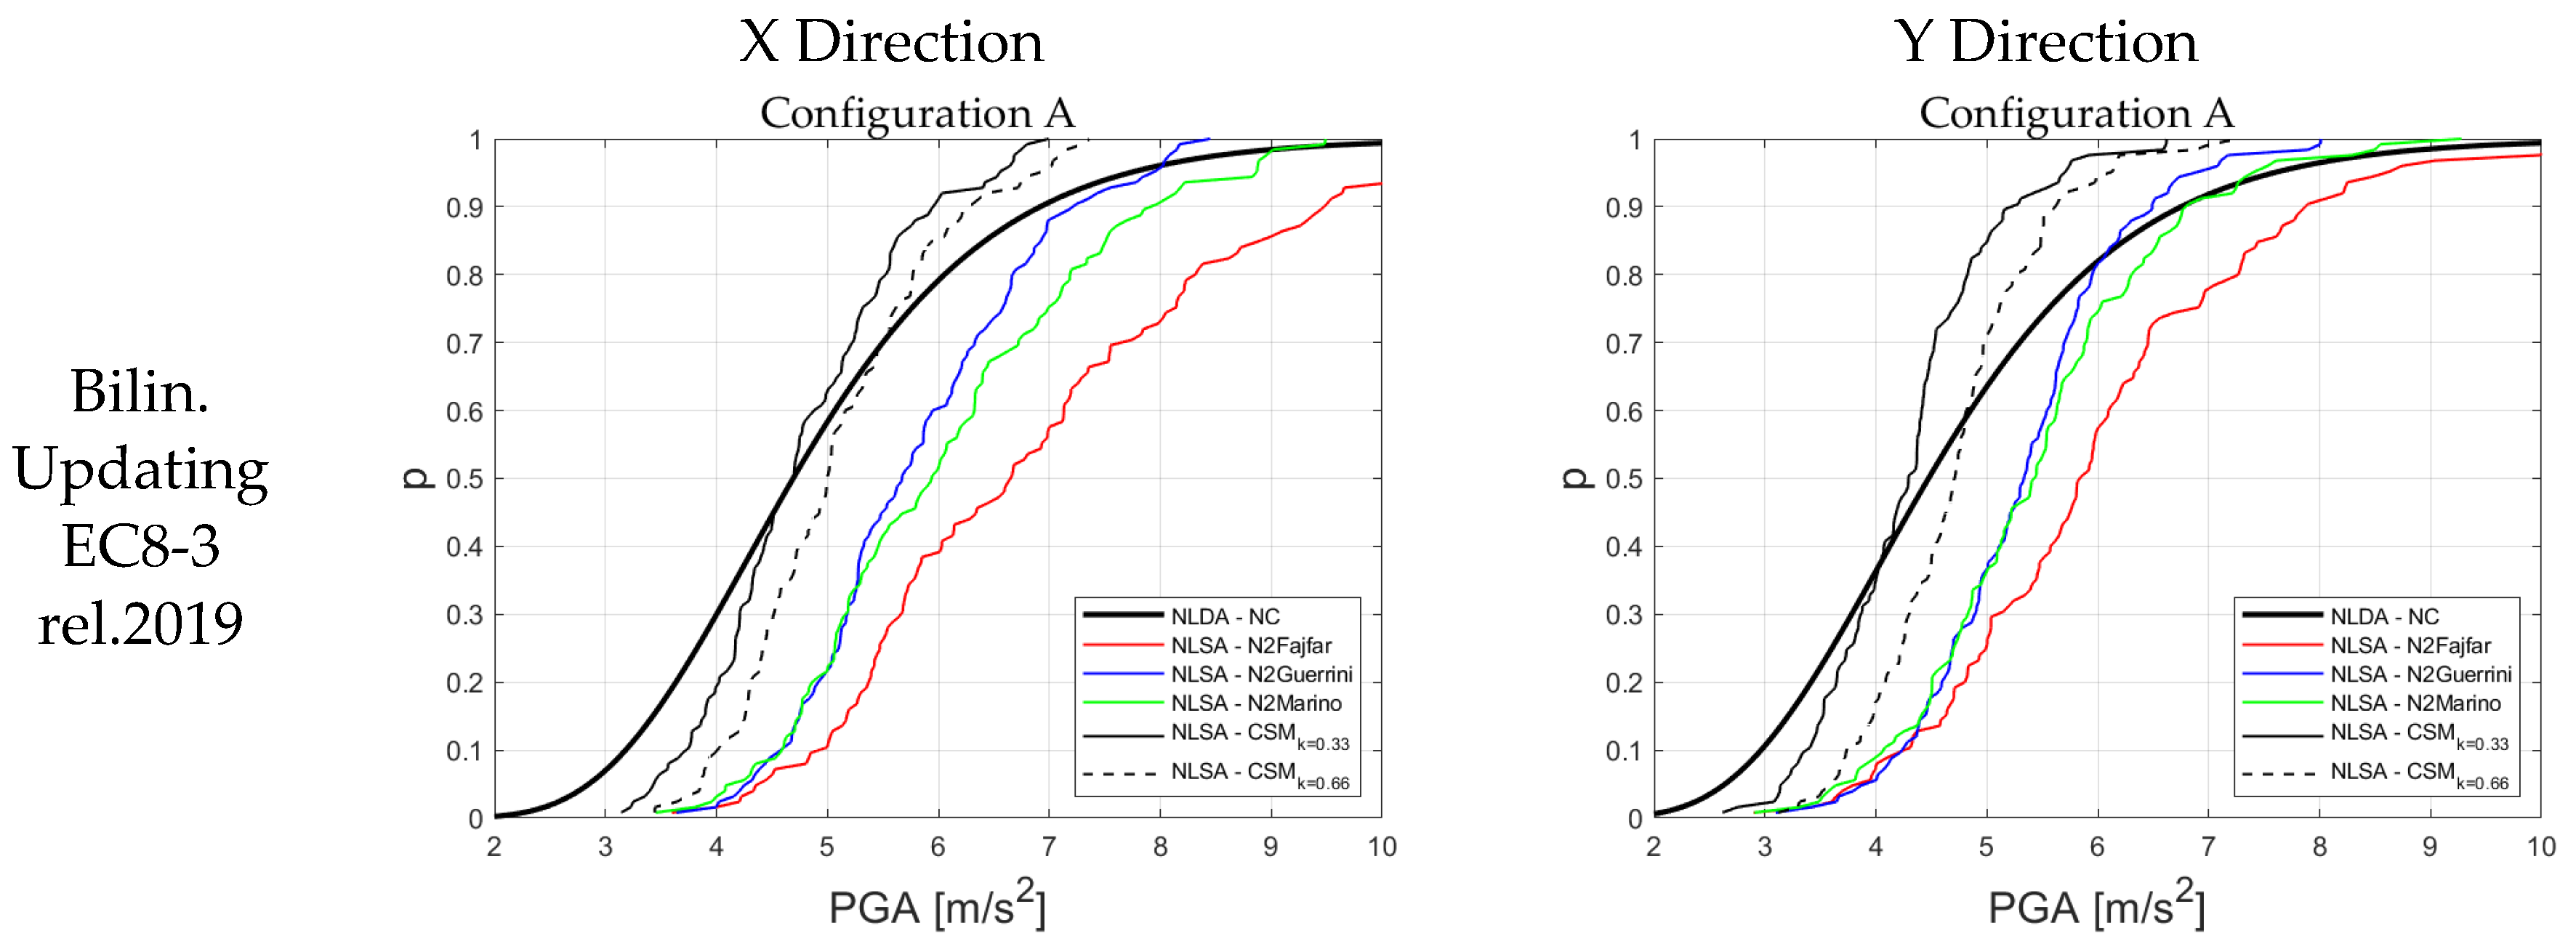
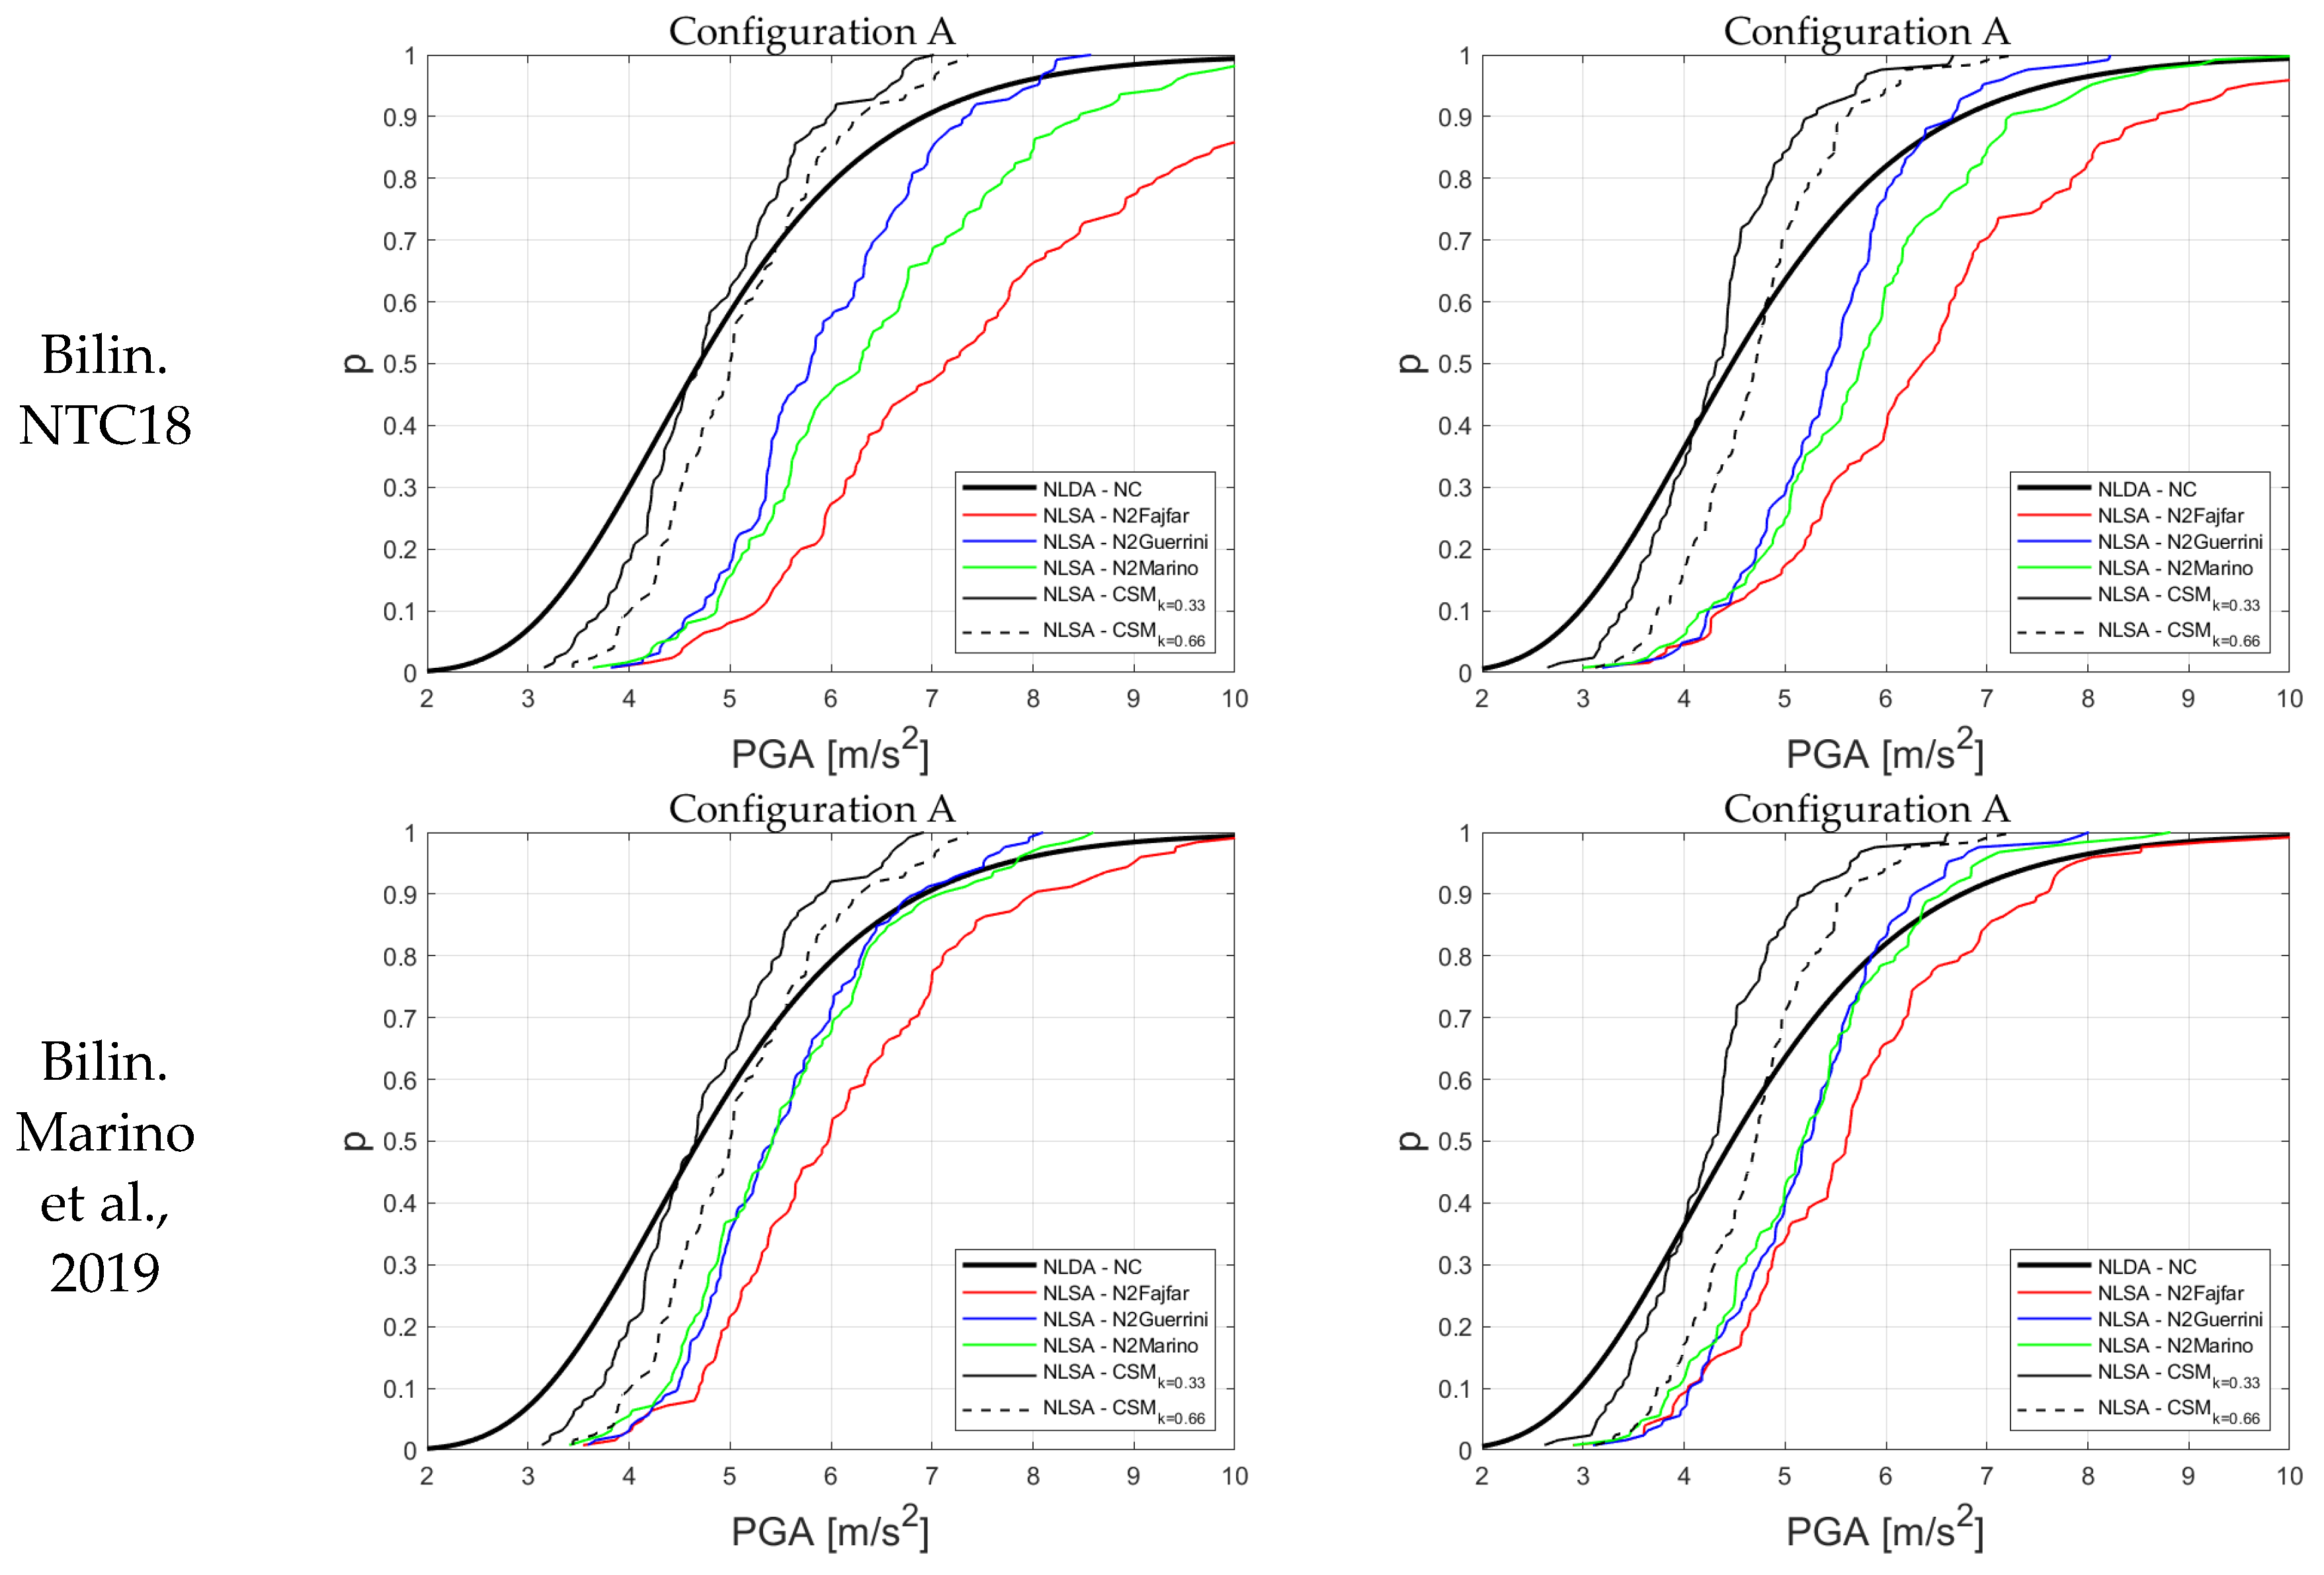
More specifically, the red line refers to the original N2 method; the blue line to Guerrini’s proposal; the green line to Marino’s proposal; and the dashed and thin black lines to the CSM approach, with two different values adopted for the dissipation properties (i.e., k = 0.33 thin solid line and k = 0.66 dashed line). Each figure is arranged in such a way as to present, in the left column, results from the X-direction and, in the right column, results from the Y-direction; in each line, the results are associated with the NSP applied according to the specific choice of the criterion for the equivalent bilinearization of the pushover curve (i.e., the first line according to Updating EC8-3 rel.2019, the second line to NTC2018, and the third line to Marino’s proposal).
For all the cases, and especially for the C, A, and B-X directions, it is evident that, regardless of the method used to address the conversion in the equivalent bilinear of the pushover curve, the NSPs based on the use of inelastic spectra (i.e., according to the N2 or similar methods) show non-conservative behavior (i.e., with fragility curves shifted to the right for the one derived from NLDAs). Moreover, among the three methods based on inelastic spectra, it is possible to observe that the least conservative one is the original N2 method, while Guerrini and Marino’s proposals produce some improvements (especially in the A and B cases), although, in most cases, they are not sufficient to obtain a fragility curve close to that from the NLDAs. In fact, it can be noted that Guerrini’s N2 method, i.e., the blue line, is usually to the left of Fajfar’s N2 method, i.e., the red line.
Figure 13. Configuration of Visso B’s fragility curves: in the first row is the X-analysis, and in the second row is the Y-analysis; the method of bilinearization of the capacity curve is fixed (in order of row according to Updating EC8-3 rel.2019 [56], NTC18 [8], Marino et al., 2019 [32]) and we include all the possible methods to calculate the displacement capacity (N2Fajfar [33], N2Guerrini [57], N2Marino [32], CSM [34]).
Applsci 14 01130 g013
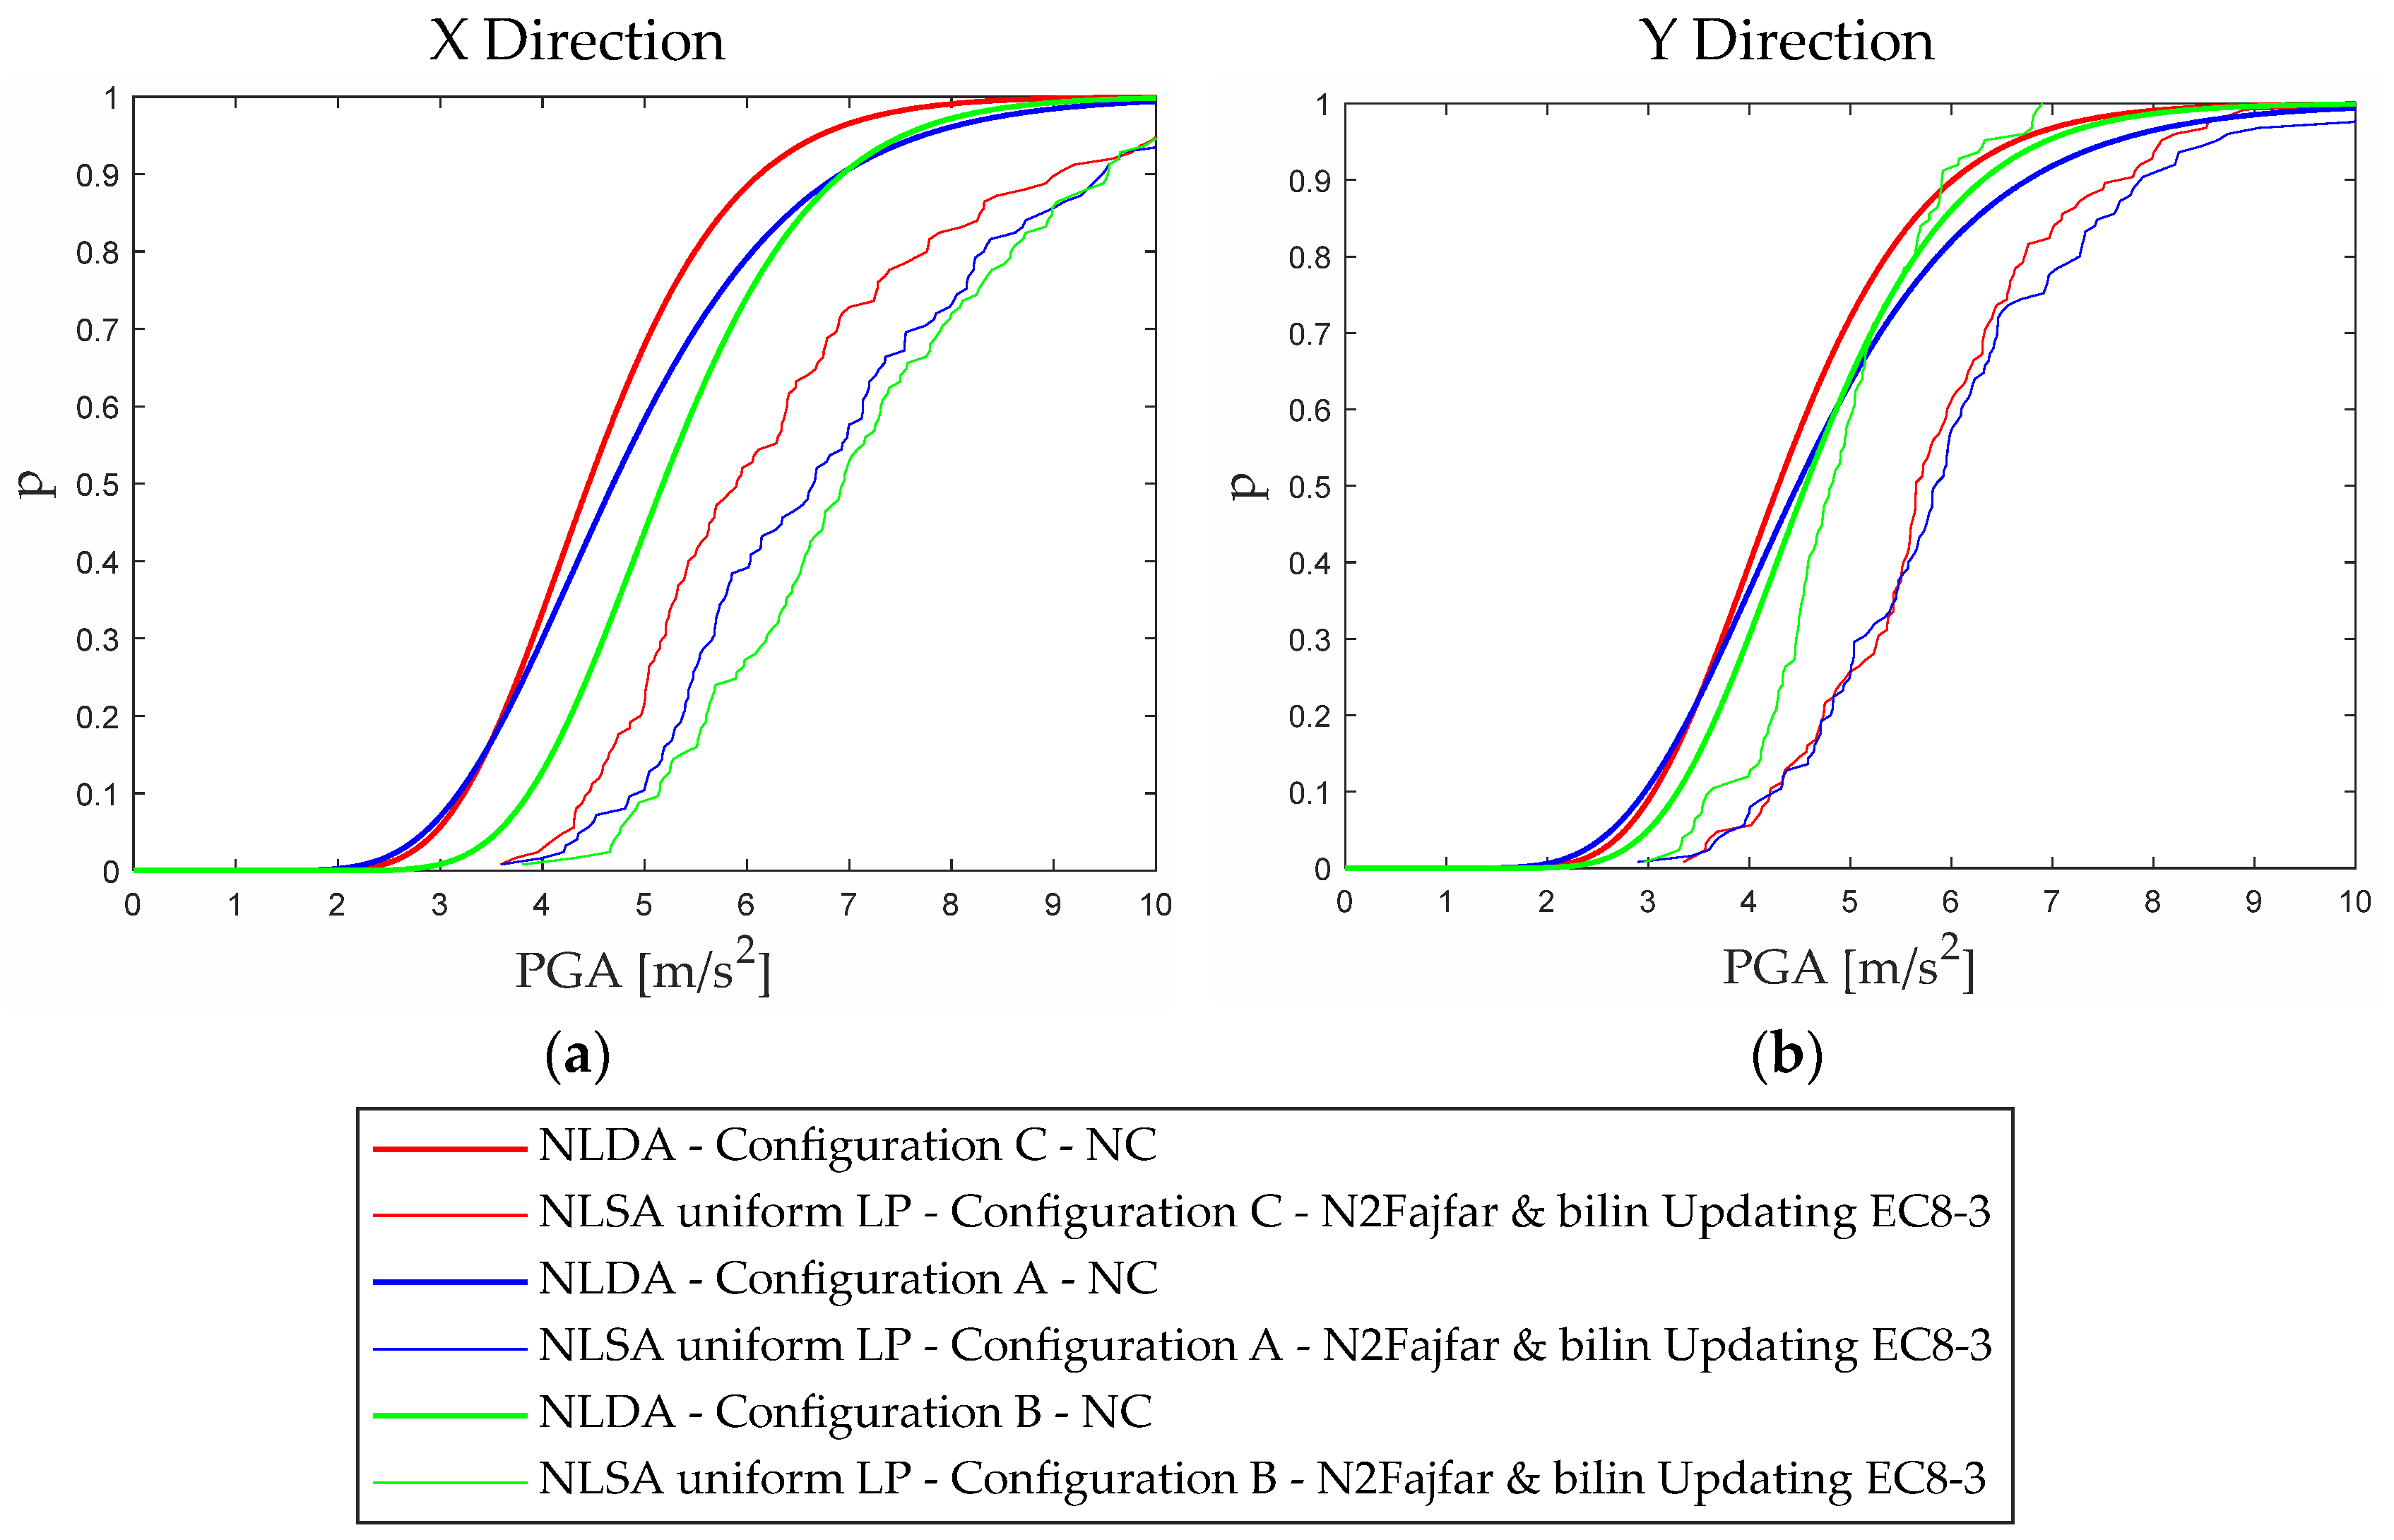
Figure 14 provides a more comprehensive overview of the results achieved using the N2 method according to the application criteria recommended in the Updating EC8-3 rel.2019 document, with the three examined case studies. Again, it is evident that, in all cases, the results are not conservative.
The only method that successfully approximates the real capacity of the analyzed structures is the CSM approach based on the use of overdamped spectra. In fact, the fragility curves obtained with the CSM are always slightly to the right of the curves obtained from the NLDAs; this is a desirable outcome, since nonlinear static analyses are expected to be less accurate than dynamic ones, so obtaining more conservative static fragility curves is reasonable and in line with the use of a more simplified approach. In the case of the CSM method, no differences are obtained using k = 0.66 or k = 1; this is because, in these cases, the η coefficient in Equation (8) is saturated and set equal to the lower limit (η = 0.55).
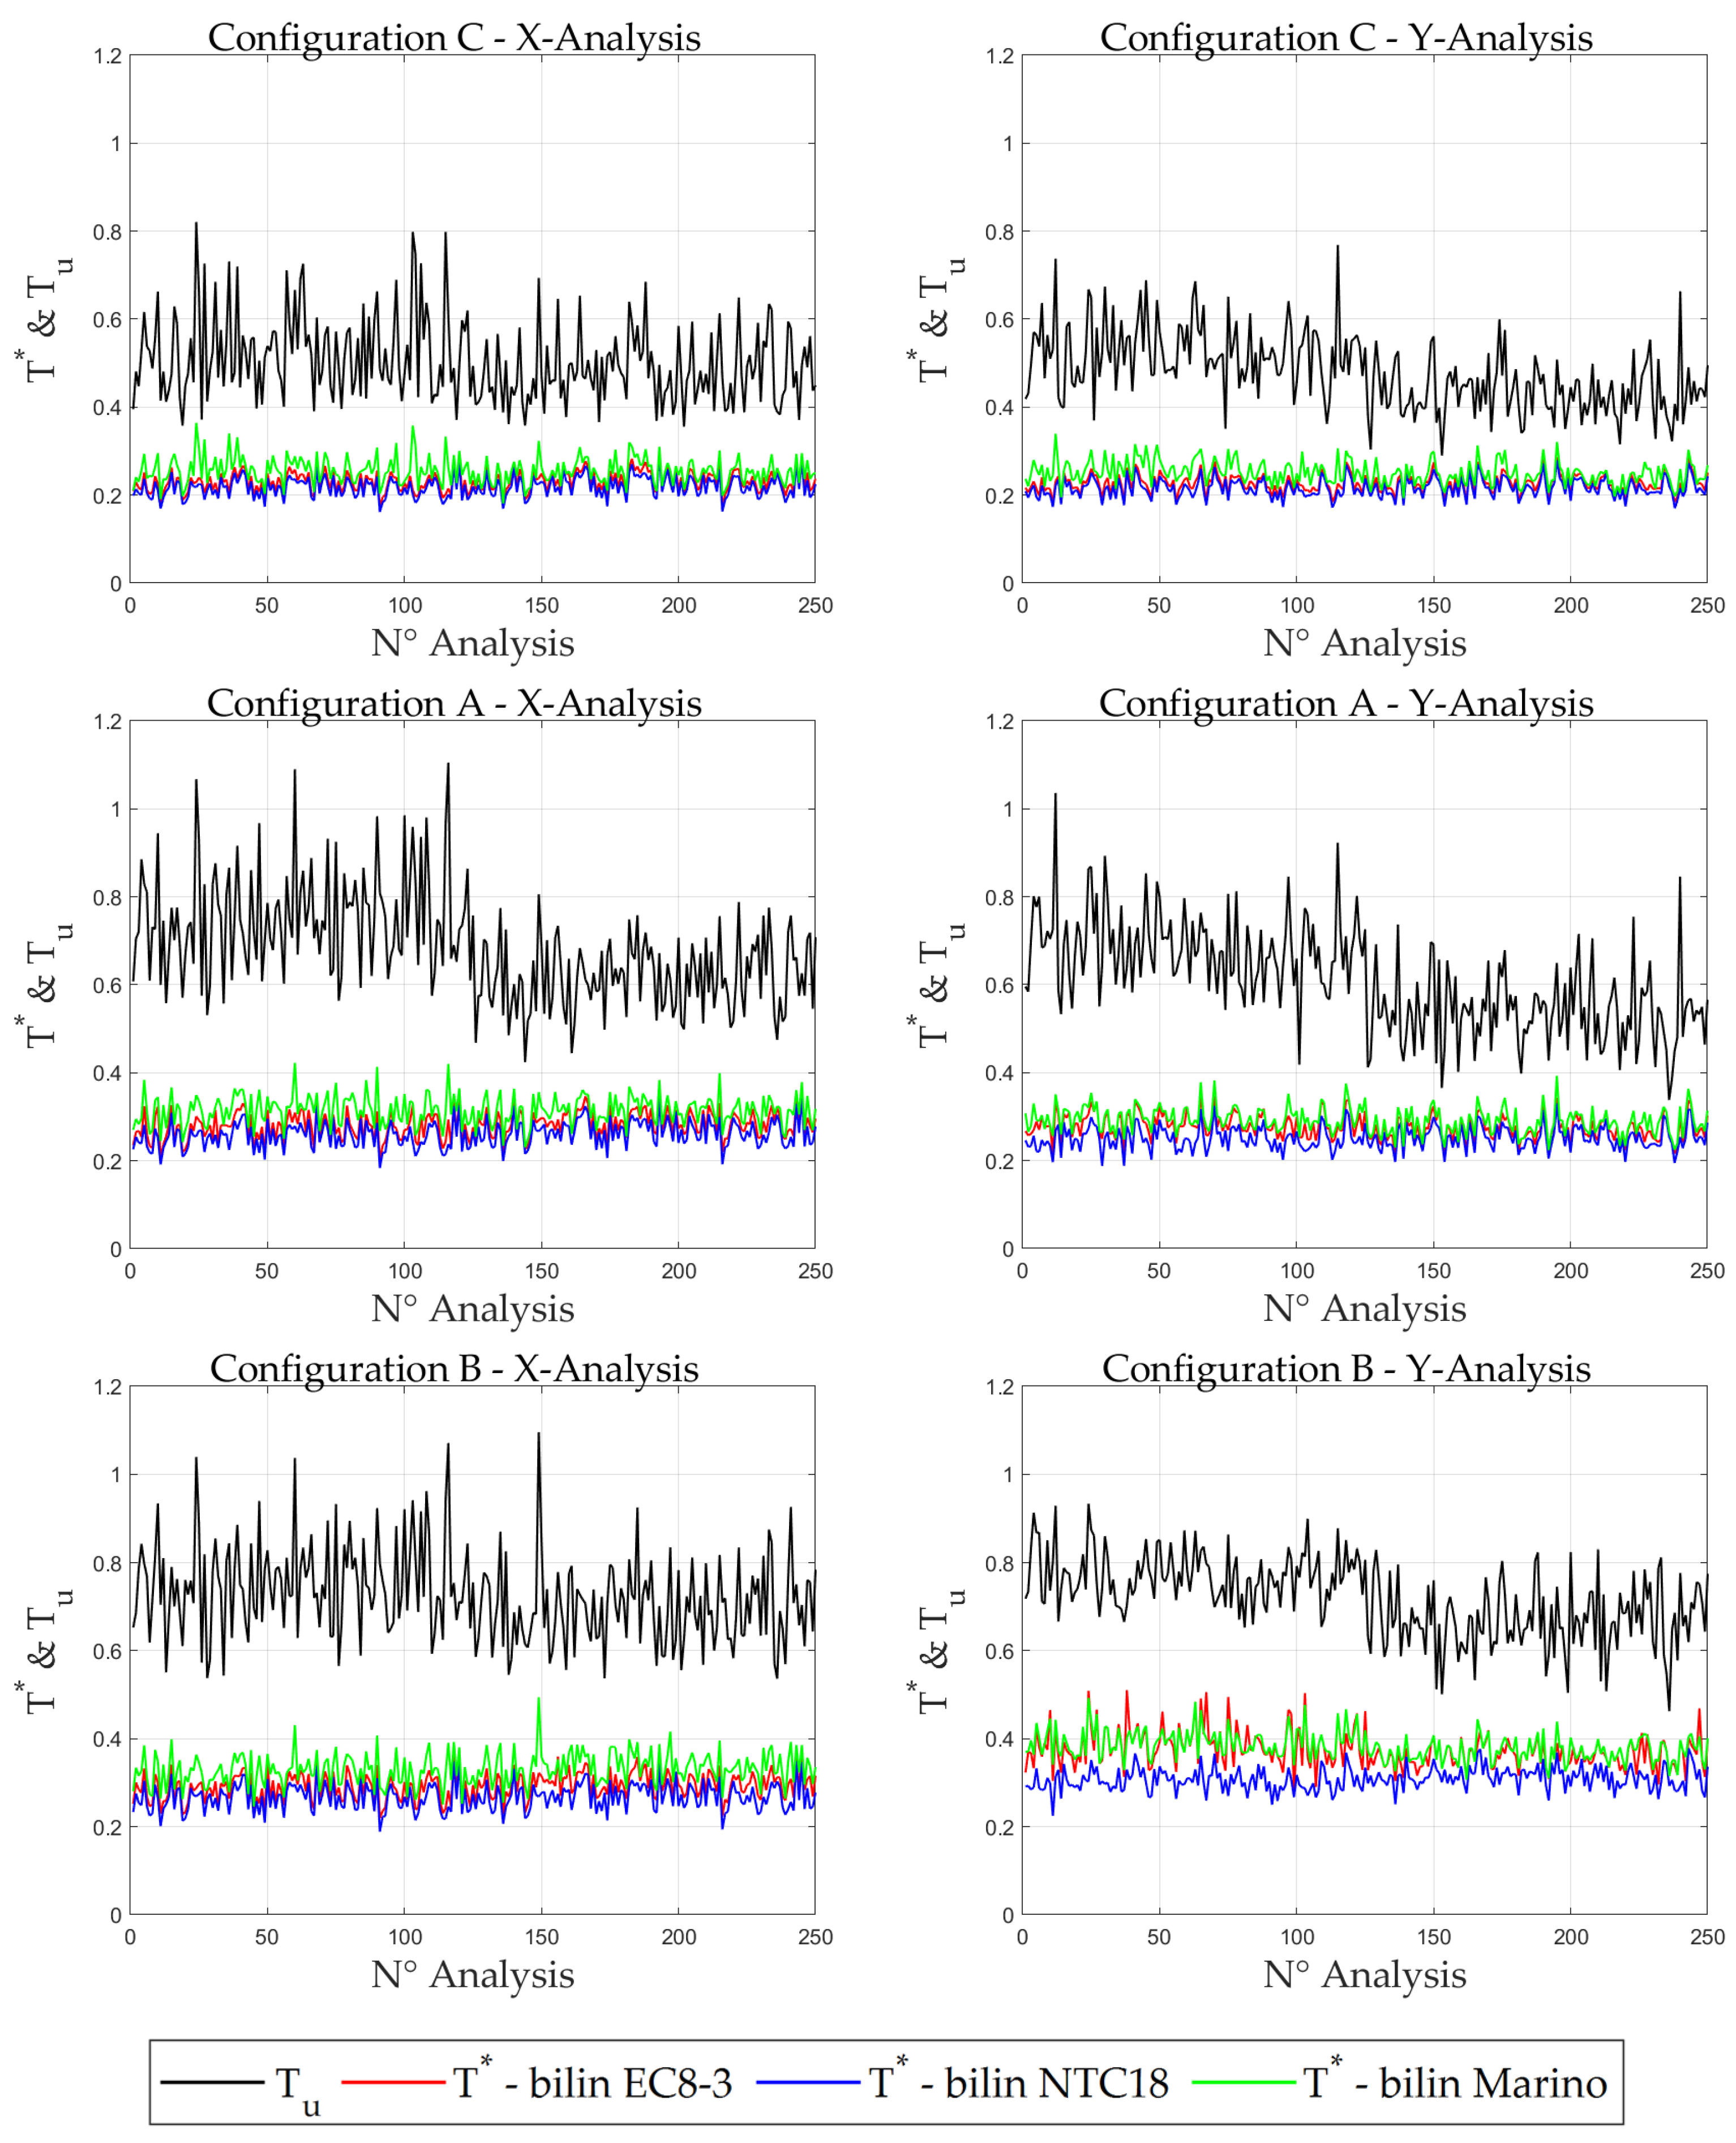
Moreover, by comparing the results reported in the three lines of Figure 11, Figure 12 and Figure 13 (i.e., varying the approach adopted for the equivalent bilinearization), it is possible to observe that the CSM method is almost insensitive to the chosen criterion, while the other NSPs exhibit some variations. The reason is that the N2-based methods use the T value to enter into the spectrum, while the CSM uses the secant period at NC T u , which is closer to the physics of the phenomenon (with T being more representative of the pseudo-elastic response) and affects only the evaluation of the equivalent damping associated with the ultimate displacement capacity.
Figure 15 compares the T u and T* values for all the examined cases. It is worth noting that, in all cases, T u is significantly higher than T* and also greater than T c .
Finally, Figure 16 illustrates the ductility associated with the ultimate displacement capacity at NC. The difference in the ductility in the positive and negative directions is due to the change in the structural response in terms of damage, as already discussed in Section 4. The results reported in Figure 16 are also useful to understand when the limitations recommended by the Standard to q* in the N2-based approaches become relevant.

5.2. Influence of the Criteria Adopted for the Bilinear Idealization of the Pushover Curve
This paragraph investigates how the method used to bilinearize the pushover curve affects the calculation of the structure’s displacement capacity. Firstly, Figure 17 compares the resulting bilinear curves when varying the three alternatives summarized in Table 2.
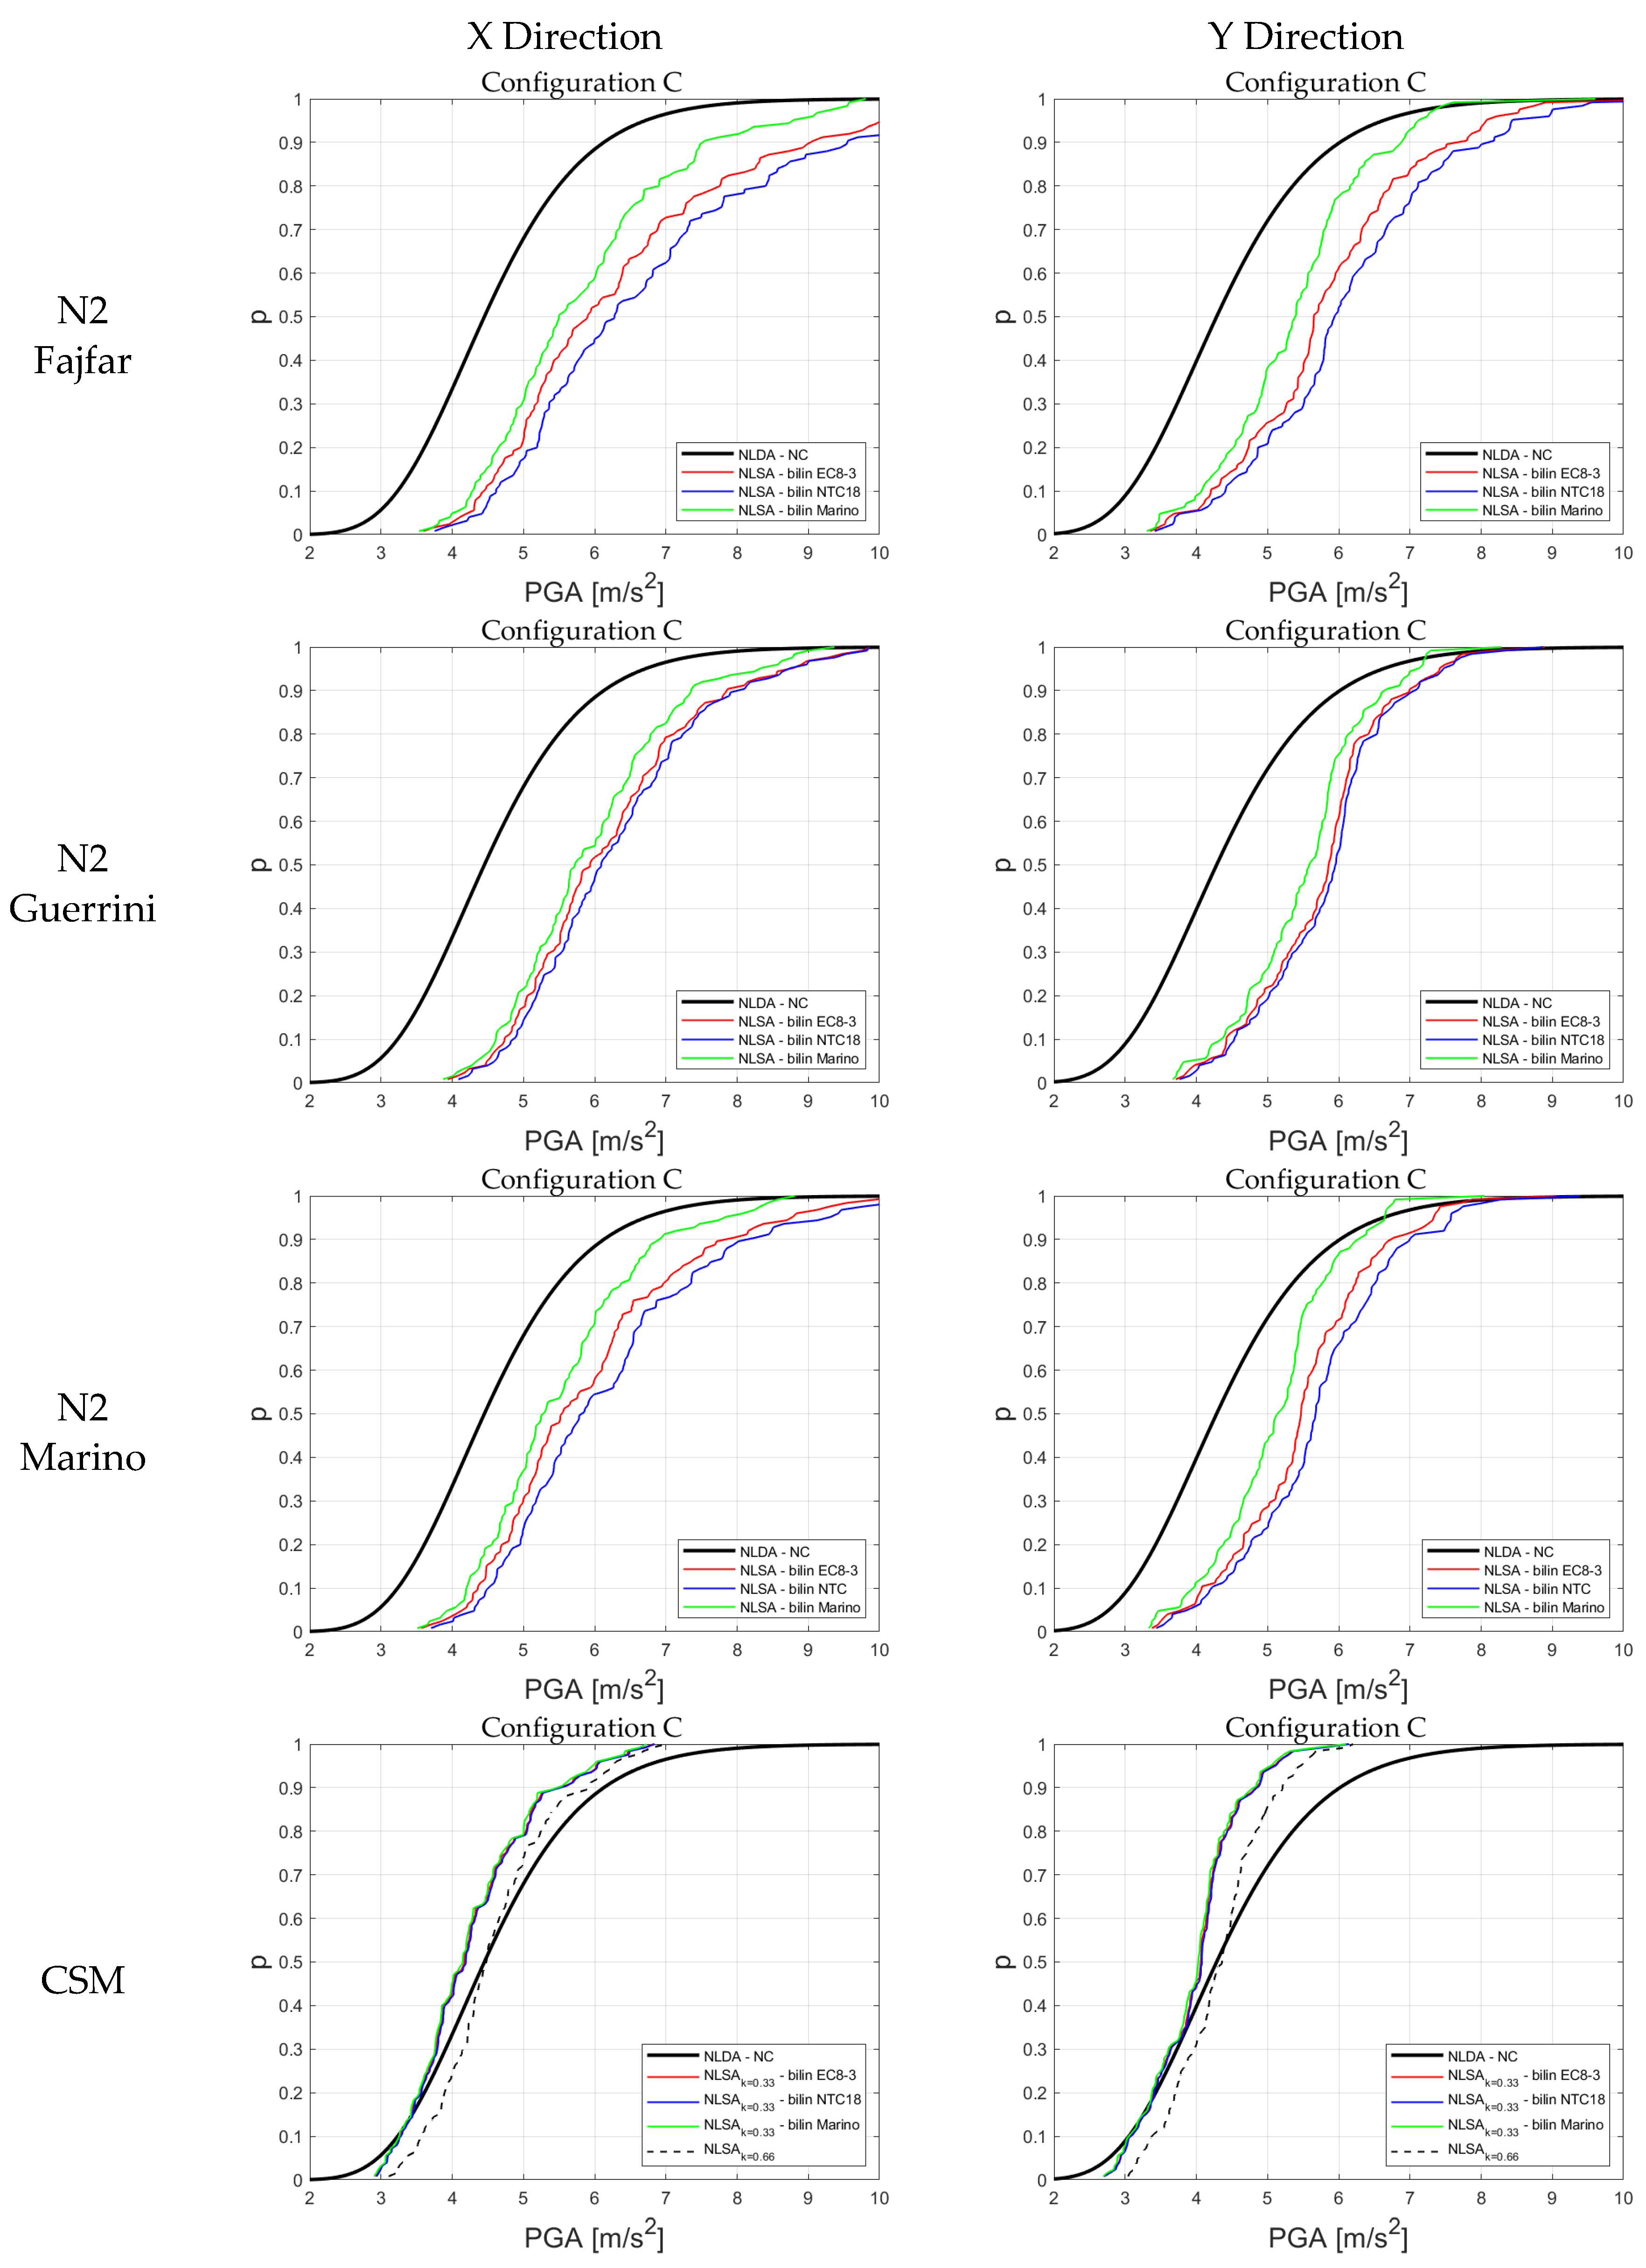
Figure 18, Figure 19 and Figure 20 illustrate, through the solid black line, the fragility curves obtained from the NLDAs and, through the colored lines, the ones derived from the application of a given NSP while varying the method of bilinearizing the pushover curve (in red, according to the Updating EC8-3 rel.2019 document; in blue, according to NTC2018; and in green, according to Marino’s proposal).
It can be seen that the choice of bilinear has a non-negligible impact on the results when using the methods based on the use of inelastic spectra to calculate the displacement capacity, whereas the CSM method is not affected at all. Thus, it would be sufficient to vary the bilinearization approach to obtain very different results with the same N2-based NSP.
The bilinear curves obtained with Marino’s criterion allow us to obtain more conservative fragility curves than others. As shown in the following figures, the fragility curve obtained with NTC’s bilinear is the most optimistic, while the one obtained with EC8’s bilinear is slightly less optimistic.
Figure 18. Configuration of Visso C’s fragility curves: in the first column is the X-analysis, and in the second column is the Y-analysis; the method to calculate the displacement capacity is fixed (in order of rows, N2Fajfar [33], N2Guerrini [57], N2Marino [32], CSM [34]). In each figure, the solid black line corresponds to the results from NLDAs, while the colored lines to the NSPs with the three different alternatives for the bilinearization of the pushover curve.
Applsci 14 01130 g018
Moreover, the trend is the same in the X- and Y-directions, but it is more pronounced in the X- than in the Y-direction. It depends on the behavior of the building, i.e., whether the pushover curve shows the more progressive degradation of the stiffness in the initial phase (as in the case of Visso A and B) or behaves more linearly and then reaches the maximum resistance (as in the case of Visso C).
Figure 19. Visso A’s fragility curves: in the first column is the X-analysis, and in the second column is the Y-analysis; the method to calculate the displacement capacity is fixed (in order of rows, N2Fajfar [33], N2Guerrini [57], N2Marino [32], CSM [34]). In each figure, the solid black line corresponds to the results from NLDAs, while the colored lines to the NSPs with the three different alternatives for the bilinearization of the pushover curve.
Applsci 14 01130 g019
Figure 20. Visso B’s fragility curves: in the first column is the X-analysis, and in the second column is the Y-analysis; the method to calculate the displacement capacity is fixed (in order of rows, N2Fajfar [33], N2Guerrini [57], N2Marino [32], CSM [34]). In each figure, the solid black line corresponds to the results from NLDAs, while the colored lines to the NSPs with the three different alternatives for the bilinearization of the pushover curve.
Applsci 14 01130 g020
Focusing on the Visso A building, which has no reinforced concrete beams, it is evident that, in the X-direction, there is a much greater influence on the bilinear chosen, while, in the Y-direction, the bilinear curves are much more similar; this is reasonable because, examining the pushover curves, the Y-direction is almost a bilinear itself (the horizontal section of the pushover is horizontal), while, in the X-direction, there is the progressive degradation of the pushover. For this reason, the application of a criterion that changes the resistance (such as the NTC18 and EC8’s bilinear), or another one that keeps the resistance equal to the maximum (as with Marino’s bilinear), has a significant impact. The same applies to the Visso B case, with the only difference compared to case A being that, having reduced the interlocking in the Y-direction walls, the pushover curve in the Y-direction of case B is weaker than in the Y-direction of case A.
Thus, in the X-direction, there is a much greater influence related to the choice of bilinear, while, in the Y-direction, the fragility curves are very similar, regardless of the bilinearization.
To conclude, it is important to note that in the Y-direction of the Visso B model, the fragility curves obtained with the EC8 and Marino’s bilinear methods are very different from those obtained with the NTC18’s bilinear method (see Figure 20); this choice of bilinear subsequently also affects the calculation of the T value of the structure, since the EC8 and Marino’s bilinear method lead to T values associated with spectrum’s branch at a constant velocity (i.e., between T C and T D ) (see Figure 15), while the NTC18’s bilinear method leads to T values associated with the spectrum’s branch at constant acceleration (i.e., in the plateau, between T B and T C ). As a consequence, it can be seen from Figure 20. that the fragility curves in the Y-direction, obtained with the Updating EC8-3 rel. 2019 method and Marino’s bilinearization method, are more similar regardless of the N2 method used to calculate the displacement capacity.

6. Conclusions

This paper investigated the effectiveness of nonlinear static procedures in evaluating the seismic performance of URM buildings through a comprehensive comparison with the outcomes derived from nonlinear dynamic analyses. The latter are assumed as the reference solution and as the target for the validation of the reliability of the static approach. This paper contributes to enriching the work already conducted in the literature validating the use of assessment methods based on nonlinear static analyses for URM buildings, which, despite their widespread use in engineering practice and at the research level, is still limited. Various structural configurations of a URM building inspired by a real structure were analyzed to this aim. This paper primarily focused on the so-called global response of URM buildings, specifically examining the in-plane response of URM walls.
Various nonlinear static procedures were examined in this paper, which included both proposals from the literature and recommendations already included in current or updated versions of the European Standards. The sensitivity of the safety outcomes to various alternative options in quantifying the displacement demand (i.e., methods alternatively based on the use of inelastic or overdamped spectra) as well as for the conversion of the original pushover curve into an equivalent bilinear—when requested by the method, as in the N2-oriented ones—was examined. The reliability of the NSPs against the reference solution provided by NLDAs was checked by incorporating the fragility curve concept. The results achieved are very useful in identifying the advantages and disadvantages of the present and next generation of Standards and possibly outlining future developments.
Firstly, the results confirm what has already been proven by other literature works [1,32], i.e., that NSPs based on the use of inelastic spectra, which are the current procedures adopted in the Italian and European codes and of more common use in engineering practice, produce results that are often not conservative in the case of stiff URM structures.
Alternative proposals of the N2 method specifically developed in the literature for URM structures led to appreciable improvements, but they are not always sufficient to produce safe outcomes, and, in addition, they require the appropriate calibration of some coefficients (such as Guerrini’s method, which implies the choice of factors that regulate the dissipation properties of the system).
Moreover, approaches based on the use of inelastic spectra strictly require the conversion of the pushover curve into an equivalent bilinear and are strongly sensitive to the consequent definition of the equivalent period of SDOF (T*). Among the three criteria investigated in this paper to address such conversion, the more promising one is the one that assimilates the strength degradation through a reduction in the equivalent stiffness, keeping the maximum base shear strength constant (i.e., Marino’s proposal in [32]). However, relying only on the bilinear conversion rule is not sufficient to establish robust consistency between static and dynamic approaches, as aforementioned. Furthermore, if T exceeds T C   (i.e., the corner period of the response spectrum), the demand for inelastic displacement is equivalent to that for elastic displacement; while there is no doubt regarding the validity of the equal displacement rule, a limitation of these methods is the strong influence on the definition of T C and its relationship with T*.
The only method that results in estimates close to the ones of NLDA is the capacity spectrum method. Even if, in some cases, the results provided by the CSM are too conservative, another strong advantage of such a method is that it is insensitive to the bilinear conversion rule.
The CSM method is already explicitly recommended in the Italian Structural Code (NTC2018) as Method b, but it is still very rarely used by engineers in real applications.
To conclude, for the future updating of the European Standards, it could be very important to add the CSM, at least as an alternative, since, at present, only the N2 method is foreseen; for NTC2018, instead, where the CSM method is already mentioned, it would be beneficial to promote it as the main method for URM structures and eventually use the N2 method only as a second option.

Author Contributions

Visualization, data curation and figure editing: S.G.; Interpretation of results: all authors; Supervision, Methodology, and Software: S.C. and S.L.; Resources/Funding: S.C. and S.L.; Writing—original draft preparation: S.G.; Writing—review and editing: S.C. and S.L. All authors have read and agreed to the published version of the manuscript.

Funding

This research received no external funding.

Institutional Review Board Statement

Not applicable.

Informed Consent Statement

Not applicable.

Data Availability Statement

The raw data supporting the conclusions of this article will be made available by the authors on request.

Acknowledgments

This paper was developed with financial support from the Italian Department of Civil Protection (DPC), within the ReLUIS-DPC 2019-21 and 2022–2024 Research Projects (WP10), which are gratefully acknowledged.

Conflicts of Interest

The authors declare no conflicts of interest.

References

  1. D’Ayala, D.F.; Paganoni, S. Assessment and analysis of damage in L’Aquila historic city centre after 6th April 2009. Bull. Earthq. Eng. 2011, 9, 81–104. [Google Scholar] [CrossRef]
  2. Sorrentino, L.; Cattari, S.; da Porto, F.; Magenes, G.; Penna, A. Seismic behaviour of ordinary masonry buildings during the 2016 central Italy earthquakes. Bull. Earthq. Eng. 2019, 17, 5583–5607. [Google Scholar] [CrossRef]
  3. Penna, A.; Morandi, P.; Rota, M.; Manzini, C.F.; da Porto, F.; Magenes, G. Performance of masonry buildings during the Emilia 2012 earthquake. Bull. Earthq. Eng. 2013, 12, 2255–2273. [Google Scholar] [CrossRef]
  4. Albanesi, T.; Nuti, C.; Vanzi, I. State of the art of non linear static methods. In Proceedings of the 12th European Conference on Earthquake Engineering, London, UK, 9–13 September 2002; Available online: https://api.semanticscholar.org/CorpusID:117719266 (accessed on 24 September 2015).
  5. Aşıkoğlu, A.; Vasconcelos, G.; Lourenço, P.B. Overview on the Nonlinear Static Procedures and Performance-Based Approach on Modern Unreinforced Masonry Buildings with Structural Irregularity. Buildings 2021, 11, 147. [Google Scholar] [CrossRef]
  6. Fajfar, P. Analysis in seismic provisions for buildings: Past, present and future. Bull. Earthq. Eng. 2018, 16, 2567–2608. [Google Scholar] [CrossRef]
  7. EN 1998-3:2005; Eurocode 8: Design of Structures for Earthquake Resistance—Part 3: Assessment and Retrofitting of Buildings and Bridges. European Committee for Standardization: Brussels, Belgium, 2005.
  8. NTC. Decreto Ministeriale 17/1/2018. Norme Tecniche per le Costruzioni; Ministry of Infrastructures and Transportations: Rome, Italy, 2018.
  9. FEMA 440. Improvement of Nonlinear Static Seismic Analysis Procedures; Federal Emergency Management Agency: Washington, DC, USA, 2005.
  10. ASCE/SEI 41-13; Seismic Evaluation and Retrofit of Existing Buildings. American Society of Civil Engineers: Reston, VA, USA, 2014.
  11. NZSEE. The Seismic Assessment of Existing Buildings (the Guidelines). 2017. Available online: http://www.eq-assess.org.nz (accessed on 26 January 2024).
  12. Tomazevic, M.; Bosiljkov, V.; Weiss, P. Structural behavior factor for masonry structures. In Proceedings of the 13th World Conference on Earthquake Engineering, Vancouver, BC, Canada, 1–6 August 2004; Available online: https://www.iitk.ac.in/nicee/wcee/article/13_2642.pdf (accessed on 1 January 2021).
  13. Chourasia, A.; Singhal, S.; Bhargava, P. Damage limitation and structural behaviour factor for masonry structures. Aust. J. Struct. Eng. 2021, 22, 19–28. [Google Scholar] [CrossRef]
  14. Morandi, P.; Butenweg, C.; Breis, K.; Beyer, K.; Magenes, G. Latest findings on the behaviour factor q for the seismic design of URM buildings. Bull. Earthq. Eng. 2022, 20, 5797–5848. [Google Scholar] [CrossRef]
  15. Morandi, P.; Manzini, C.F.; Magenes, G. Application of seismic design procedures on three modern URM buildings struck by the 2012 Emilia earthquakes: Inconsistencies and improvement proposals in the European codes. Bull. Earthq. Eng. 2020, 18, 547–580. [Google Scholar] [CrossRef]
  16. Manzini, C.F.; Magenes, G.; Penna, A.; da Porto, F.; Camilletti, D.; Cattari, S.; Lagomarsino, S. Masonry Italian Code-Conforming Buildings. Part 1: Case Studies and Design Methods. J. Earthq. Eng. 2018, 22, 54–73. [Google Scholar] [CrossRef]
  17. Lagomarsino, S.; Marino, S.; Cattari, S. Linear static procedures for the seismic assessment of masonry buildings: Open issues in the new generation of European codes. Structures 2020, 26, 427–440. [Google Scholar] [CrossRef]
  18. Cattari, S.; Calderoni, B.; Caliò, I.; Camata, G.; de Miranda, S.; Magenes, G.; Milani, G.; Saetta, A. Nonlinear modeling of the seismic response of masonry structures: Critical review and open issues towards engineering practice. Bull. Earthq. Eng. 2022, 20, 1939–1997. [Google Scholar] [CrossRef]
  19. Lagomarsino, S.; Cattari, S. Seismic Performance of Historical Masonry Structures Through Pushover and Nonlinear Dynamic Analyses. Geotech. Geol. Earthq. Eng. 2015, 39, 265–292. [Google Scholar] [CrossRef]
  20. Palanci, M.; Demir, A.; Kayhan, A.H. Quantifying the effect of amplitude scaling of real ground motions based on structural responses of vertically irregular and regular RC frames. Structures 2023, 51, 105–123. [Google Scholar] [CrossRef]
  21. Dávalos, H.; Miranda, E. Evaluation of bias on the probability of collapse from amplitude scaling using spectral-shape-matched records. Earthq. Eng. Struct. Dyn. 2019, 48, 970–986. [Google Scholar] [CrossRef]
  22. Demir, A.; Kayhan, A.H.; Palanci, M. Response- and probability-based evaluation of spectrally matched ground motion selection strategies for bi-directional dynamic analysis of low- to mid-rise RC buildings. Structures 2023, 58, 105533. [Google Scholar] [CrossRef]
  23. Iervolino, I.; Galasso, C.; Cosenza, E. REXEL: Computer aided record selection for code-based seismic structural analysis. Bull. Earthq. Eng. 2009, 8, 339–362. [Google Scholar] [CrossRef]
  24. Iervolino, I.; Galasso, C.; Paolucci, R.; Pacor, F. Engineering ground motion record selection in the ITalian ACcelerometric Archive. Bull. Earthq. Eng. 2011, 9, 1761–1778. [Google Scholar] [CrossRef]
  25. Sgobba, S.; Puglia, R.; Pacor, F.; Luzi, L.; Russo, E.; Felicetta, C.; Lanzano, G.; D’Amico, M.; Baraschino, R.; Baltzopoulos, G.; et al. REXELweb: A Tool for Selection of Ground-Motion Records from the Engineering Strong Motion Database (ESM). In Proceedings of the 7th International Conference on Earthquake Geotechnical Engineering, Rome, Italy, 17–20 June 2019; Available online: https://www.researchgate.net/publication/333895014_REXELweb_A_tool_for_selection_of_ground-motion_records_from_the_Engineering_Strong_Motion_database_ESM (accessed on 26 January 2024).
  26. Manfredi, V.; Masi, A.; Özcebe, A.G.; Paolucci, R.; Smerzini, C. Selection and spectral matching of recorded ground motions for seismic fragility analyses. Bull. Earthq. Eng. 2022, 20, 4961–4987. [Google Scholar] [CrossRef]
  27. Smerzini, C.; Amendola, C.; Paolucci, R.; Bazrafshan, A. Engineering validation of BB-SPEEDset, a data set of near-source physics-based simulated accelerograms. Earthq Spectra. 2023. [Google Scholar] [CrossRef]
  28. Brunelli, A.; de Silva, F.; Piro, A.; Parisi, F.; Sica, S.; Silvestri, F.; Cattari, S. Numerical simulation of the seismic response and soil–structure interaction for a monitored masonry school building damaged by the 2016 Central Italy earthquake. Bull. Earthq. Eng. 2021, 19, 1181–1211. [Google Scholar] [CrossRef]
  29. Parisse, F.; Marques, R.; Cattari, S.; Lourenco, P. Implications of Modelling Assumptions on the Seismic Assessment of URM Structures through FE and SE-Based Approaches. In Proceedings of the 3rd European Conference on Earthquake Engineering and Seismology, Bucharest, Romania, 4–9 September 2022; Available online: https://www.researchgate.net/publication/363738779_Implications_of_modelling_assumptions_on_the_seismic_assessment_of_URM_structures_through_FE_and_SE-based_approaches (accessed on 26 January 2024).
  30. Astroza, R.; Alessandri, A. Effects of model uncertainty in nonlinear structural finite element model updating by numerical simulation of building structures. Struct. Control Health Monit. 2019, 26, e2297. [Google Scholar] [CrossRef]
  31. Lagomarsino, S.; Cattari, S. PERPETUATE guidelines for seismic performance-based assessment of cultural heritage masonry structures. Bull. Earthq. Eng. 2015, 13, 13–47. [Google Scholar] [CrossRef]
  32. Marino, S.; Cattari, S.; Lagomarsino, S. Are the nonlinear static procedures feasible for the seismic assessment of irregular existing masonry buildings? Eng. Struct. 2019, 200, 109700. [Google Scholar] [CrossRef]
  33. Fajfar, P.; Fischinger, M. N2-A Method for Nonlinear Seismic Analysis of Regular Buildings. In Proceedings of the 9th World Conference on Earthquake Engineering, Tokyo, Japan, 2–6 August 1988; Volume 5, pp. 111–116. [Google Scholar]
  34. Freeman, S. Review of the development of the capacity spectrum method. ISET J. Earthq. Technol. 2004, 41, 1–13. [Google Scholar]
  35. Fajfar, P.; Marusic, D.; Perus, I. Torsional effects in the pushover-based seismic analysis of buildings. J. Earthq. Eng. 2005, 9, 831–854. [Google Scholar] [CrossRef]
  36. Bento, R.; Bhatt, C.; Pinho, R. Using nonlinear static procedures for seismic assessment of the 3D irregular SPEAR building. Earthq. Struct. 2010, 1, 177–195. [Google Scholar] [CrossRef]
  37. Stefano, M.; Mariani, V. Pushover Analysis for Plan Irregular Building Structures. In Geotechnical, Geological and Earthquake Engineering; Springer: Cham, Switzerland, 2014; Volume 34, pp. 429–448. [Google Scholar] [CrossRef]
  38. Adhikari, R.; D’Ayala, D. Applied Element Modelling and Pushover Analysis of Unreinforced Masonry Buildings with Flexible Roof Diaphragm; European Community on Computational Methods in Applied Sciences: Barcelona, Spain, 2019. [Google Scholar] [CrossRef]
  39. Nakamura, Y.; Derakhshan, H.; Griffith, M.; Magenes, G.; Sheikh, A. Applicability of nonlinear static procedures for low-rise unreinforced masonry buildings with flexible diaphragms. Eng. Struct. 2017, 137, 1–18. [Google Scholar] [CrossRef]
  40. Lagomarsino, S.; Camilletti, D.; Cattari, S.; Marino, S. Seismic Assessment of Existing Irregular Masonry Buildings by Nonlinear Static and Dynamic Analyses. In Geotechnical, Geological and Earthquake Engineering; Springer: Cham, Switzerland, 2018; pp. 123–151. [Google Scholar] [CrossRef]
  41. Rossetto, T.; D’Ayala, D.; Ioannou, I.; Meslem, A. Evaluation of Existing Fragility Curves. In SYNER-G: Typology Definition and Fragility Functions for Physical Elements at Seismic Risk; Springer: Dordrecht, The Netherlands, 2014; pp. 47–93. [Google Scholar] [CrossRef]
  42. Baraschino, R.; Baltzopoulos, G.; Iervolino, I. R2R-EU: Software for fragility fitting and evaluation of estimation uncertainty in seismic risk analysis. Soil Dyn. Earthq. Eng. 2020, 132, 106093. [Google Scholar] [CrossRef]
  43. Lagomarsino, S.; Cattari, S. Fragility Functions of Masonry Buildings; Springer: Dordrecht, The Netherlands, 2014; Volume 27, pp. 111–156. [Google Scholar] [CrossRef]
  44. Urlainis, A.; Shohet, I.M. Seismic Risk Mitigation and Management for Critical Infrastructures Using an RMIR Indicator. Buildings 2022, 12, 1748. [Google Scholar] [CrossRef]
  45. Follador, V.; Carpanese, P.; Donà, M.; Alfano, S.; Cattari, S.; Lagomarsino, S.; da Porto, F. Comparison of Fragility Sets to Assess the Effectiveness of Retrofit Interventions on Masonry Buildings in Italy. Buildings 2023, 13, 2937. [Google Scholar] [CrossRef]
  46. Rosti, A.; Rota, M.; Penna, A. Empirical fragility curves for Italian URM buildings. Bull. Earthq. Eng. 2021, 19, 3057–3076. [Google Scholar] [CrossRef]
  47. Donà, M.; Carpanese, P.; Follador, V.; Sbrogiò, L.; da Porto, F. Mechanics-based fragility curves for Italian residential URM buildings. Bull. Earthq. Eng. 2021, 19, 3099–3127. [Google Scholar] [CrossRef]
  48. Cirak Karakas, C.; Palanci, M.; Senel, S.M. Fragility based evaluation of different code based assessment approaches for the performance estimation of existing buildings. Bull. Earthq. Eng. 2022, 20, 1685–1716. [Google Scholar] [CrossRef]
  49. EN 1998-1:2004; Eurocode 8: Design of Structures for Earthquake Resistance—Part 1: General Rules, Seismic Actions and Rules for Buildings. European Committee for Standardization: Brussels, Belgium, 2004.
  50. Antoniou, S.; Pinho, R. Advantage and limitations of adaptive and non-adaptive force-based pushover procedures. J. Earthq. Eng. 2004, 8, 497–522. [Google Scholar] [CrossRef]
  51. Antoniou, S.; Pinho, R. Development and verification of a displacement-based adaptive pushover procedure. J. Earthq. Eng. 2004, 8, 643–661. [Google Scholar] [CrossRef]
  52. Cattari, S.; Camilletti, D.; Lagomarsino, S.; Bracchi, S.; Rota, M.; Penna, A. Masonry Italian Code-Conforming Buildings. Part 2: Nonlinear Modelling and Time-History Analysis. J. Earthq. Eng. 2018, 22 (Suppl. S2), 2010–2040. [Google Scholar] [CrossRef]
  53. Iervolino, I.; Spillatura, A.; Bazzurro, P. Seismic Reliability of Code-Conforming Italian Buildings. J. Earthq. Eng. 2018, 22, 5–27. [Google Scholar] [CrossRef]
  54. De Risi, M.T.; Di Domenico, M.; Manfredi, V.; Terrenzi, M.; Camata, G.; Mollaioli, F.; Noto, F.; Ricci, P.; Franchin, P.; Masi, A.; et al. Modelling and Seismic Response Analysis of Italian Pre-Code and Low-Code Reinforced Concrete Buildings. Part I: Bare Frames. J. Earthq. Eng. 2022, 27, 1482–1513. [Google Scholar] [CrossRef]
  55. Fajfar, P. A Nonlinear Analysis Method for Performance-Based Seismic Design. Earthq. Spectra 2000, 16, 573–592. [Google Scholar] [CrossRef]
  56. prEN 1998-3:2019; Eurocode 8: Design of Structures for Earthquake Resistance—Part 3: Assessment and Retrofitting of Buildings and Bridges. The European Union: Brussels, Belgium; Luxembourg, 2019; updating September 2019.
  57. Guerrini, G.; Graziotti, F.; Penna, A.; Magenes, G. Improved evaluation of inelastic displacement demands for short-period masonry structures. Earthq. Eng. Struct. Dyn. 2017, 46, 1411–1430. [Google Scholar] [CrossRef]
  58. Vamvatsikos, D.; Cornell, C. Incremental Dynamic Analysis. Earthq. Eng. Struct. Dyn. 2002, 31, 491–514. [Google Scholar] [CrossRef]
  59. Phadnis, P.; Desai, R.; Tande, S.; Dhumal, P. Fragility analysis of masonry infill R.C. frame using incremental dynamic approach. Asian J. Civ. Eng. 2023, 24, 3375–3386. [Google Scholar] [CrossRef]
  60. Jalayer, F.; Cornell, C. Alternative non-linear demand estimation methods for probability-based seismic assessments. Earthq. Eng. Struct. Dyn. 2009, 38, 951–972. [Google Scholar] [CrossRef]
  61. Bazzurro, P.; Cornell, C.; Shome, N.; Carballo, J. Three Proposals for Characterizing MDOF Nonlinear Seismic Response. J. Struct. Eng-Asce 1998, 124, 1281–1289. [Google Scholar] [CrossRef]
  62. Jalayer, F.; Risi, R.; Manfredi, G. Bayesian Cloud Analysis: Efficient structural fragility assessment using linear regression. Bull. Earthq. Eng. 2014, 13, 1183–1203. [Google Scholar] [CrossRef]
  63. Shome, N. Probabilistic Seismic Demand Analysis of Nonlinear Structures. Ph.D. Thesis, Stanford University, Stanford, CA, USA, 1999. [Google Scholar]
  64. Elenas, A.; Meskouris, K. Correlation study between seismic acceleration parameters and damage indices of structures. Eng. Struct. 2001, 23, 698–704. [Google Scholar] [CrossRef]
  65. Luco, N.; Cornell, C.A. Structure-Specific Scalar Intensity Measures for Near-Source and Ordinary Earthquake Ground Motions. Earthq. Spectra 2007, 23, 357–392. [Google Scholar] [CrossRef]
  66. Mollaioli, F.; Lucchini, A.; Cheng, Y.; Monti, G. Intensity measures for the seismic response prediction of base-isolated buildings. Bull. Earthq. Eng. 2013, 11, 1841–1866. [Google Scholar] [CrossRef]
  67. Minas, S.; Galasso, C. Accounting for spectral shape in simplified fragility analysis of case-study reinforced concrete frames. Soil Dyn. Earthq. Eng. 2019, 119, 91–103. [Google Scholar] [CrossRef]
  68. Iervolino, I.; Maddaloni, G.; Cosenza, E. Eurocode 8 Compliant Real Record Sets for Seismic Analysis of Structures. J. Earthq. Eng. 2008, 12, 54–90. [Google Scholar] [CrossRef]
  69. Masi, A.; Lagomarsino, S.; Dolce, M.; Manfredi, V.; Ottonelli, D. Towards the updated Italian seismic risk assessment: Exposure and vulnerability modelling. Bull. Earthq. Eng. 2021, 19, 3253–3286. [Google Scholar] [CrossRef]
  70. Iervolino, I.; Chioccarelli, E.; Convertito, V. Engineering design earthquakes from multimodal hazard disaggregation. Soil Dyn. Earthq. Eng. 2011, 31, 1212–1231. [Google Scholar] [CrossRef]
  71. Cipriano, A. Impact of Italian Ground Motion Models in Seismic Hazard Assessment: Case Studies in Near-Source Region and Volcanic Context. ING I—Scuola di Ingegneria Civile, Ambientale e Territoriale. Politecnico di Milano. 2022. Available online: https://hdl.handle.net/10589/197115 (accessed on 1 December 2022).
  72. Rebez, A.; Peruzza, L.; Slejko, D. Probabilistic spectral seismic hazard assessment for Italy. Boll. Geofis. Teor. Appl. 1999, 40, 31–51. [Google Scholar]
  73. Kita, A.; Cavalagli, N.; Masciotta, M.; Lourenco, P.; Ubertini, F. Rapid post-earthquake damage localization and quantification in masonry structures through multidimensional non-linear seismic IDA. Eng. Struct. 2020, 219, 110841. [Google Scholar] [CrossRef]
  74. Ghosh, A.K.; Kushwaha, H.S. Sensitivity of Seismic Hazard to Various Parameters and Correlations for Peak Ground Acceleration. 1998; pp. 1–25. Available online: http://inis.iaea.org/search/search.aspx?orig_q=RN:30017533 (accessed on 1 January 2022).
  75. Whitlock, P.A.; Kalos, M. Monte Carlo Methods; Wiley: Hoboken, NJ, USA, 1986. [Google Scholar]
  76. Vargas, Y.F.; Pujades, L.G.; Barbat, A.H.; Hurtado, J.E. Capacity, fragility and damage in reinforced concrete buildings: A probabilistic approach. Bull. Earthq. Eng. 2013, 11, 2007–2032. [Google Scholar] [CrossRef]
  77. Cattari, S.; Degli Abbati, S.; Ottonelli, D.; Marano, C.; Camata, G.; Spacone, E.; Da Porto, F.; Modena, C.; Lorenzoni, F.; Magenes, G.; et al. Discussion on data recorded by the Italian structural seismic monitoring network on three masonry structures hit by the 2016–2017 Central Italy earthquake. In Proceedings of the 7th International Conference on Computational Methods in Structural Dynamics and Earthquake Engineering Methods in Structural Dynamics and Earthquake Engineering, Crete, Greece, 24–26 June 2019; pp. 1889–1906. [Google Scholar] [CrossRef]
  78. Ferrero, C.; Lourenco, P.; Calderini, C. Nonlinear modeling of unreinforced masonry structures under seismic actions: Validation using a building hit by the 2016 Central Italy earthquake. Frat. Integrità Strutt. 2020, XIV, 92–114. [Google Scholar] [CrossRef]
  79. Lagomarsino, S.; Penna, A.; Galasco, A.; Cattari, S. TREMURI program: An equivalent frame model for the nonlinear seismic analysis of masonry buildings. Eng. Struct. 2013, 56, 1787–1799. [Google Scholar] [CrossRef]
  80. Cattari, S.; Lagomarsino, S. Masonry Structures. In Developments in the Field of Displacement Based Seismic Assessment; IUSS Press and EU CENTRE: Pavia, Italy, 2013; p. 524. ISBN 978-88-6198-090-7. [Google Scholar]
  81. Cattari, S.; Alfano, S.; Lagomarsino, S. A Practice-Oriented Proposal to Consider the Flange Effect in Equivalent Frame Modeling of Masonry Buildings. Buildings 2023, 13, 462. [Google Scholar] [CrossRef]
  82. Circolare. Istruzioni per L’applicazione dell’«Aggiornamento delle “Norme Tecniche per le Costruzioni”» di cui al Decreto Ministeriale 17 Gennaio 2018. G.U.S.O. n. 29 of 27/7/2018, No. 42, 21 gennaio 2019. Available online: https://www.lavoripubblici.it/normativa/20190121/Circolare-Ministero-delle-infrastrutture-e-dei-trasporti-21-gennaio-2019-n-7-18430.html (accessed on 26 January 2024).
  83. Franchin, P.; Ragni, L.; Rota, M.; Zona, A. Modelling Uncertainties of Italian Code-Conforming Structures for the Purpose of Seismic Response Analysis. J. Earthq. Eng. 2018, 22 (Suppl. S2), 1964–1989. [Google Scholar] [CrossRef]
Figure 1. Illustration of the DLmin criterion used to assess damage levels at macroelement level: (a) multilinear constitutive law adopted for URM elements and identification of DL at element scale; (b) the top level overall reached DL2, since all piers reached at least DL2 (four piers indeed reached DL3, but there was still a pier in DL2); (c) the top level overall reached DL3 since all piers reached at least DL3 (only one pier reached DL4, while all the others were in DL3). See (a) for the color legend.
Applsci 14 01130 g001
Figure 2. NSP research investigation framework: (A) equivalent bilinear according to [8] (A1), [56] (A2) and [32] (A3); (B) procedure for the dmax estimate according to [34] (B1), [33] (B2), [57] (B3) and [32] (B4); (C) computation of the maximum intensity measure compatible with the fulfillment of NC (IMMC).
Applsci 14 01130 g002
Figure 3. Adopted framework for the derivation of fragility curves from NLSA and NLDA.
Applsci 14 01130 g003
Figure 4. Comparison of the acceleration response spectra derived from actual signals (grey, in blue their average) and the conventional format of Standards (red, with S = 1 , η = 1 , F 0 = 2.5 ).
Applsci 14 01130 g004aApplsci 14 01130 g004b
Figure 5. Comparison of the acceleration response spectra derived from actual signals (grey, in blue their average) and the conventional format of Standards (red, with S = 1 , η = 1 , F 0 = 2 ).
Applsci 14 01130 g005aApplsci 14 01130 g005b
Figure 10. Procedure adopted to assess the reliability for various NSPs.
Applsci 14 01130 g010
Figure 11. Configuration of Visso C’s fragility curves: in the first column is the X-analysis, and in the second column is the Y-analysis; the method of bilinearization of the capacity curve is fixed (in order of row according to Updating EC8-3 rel.2019 [56], NTC18 [8], Marino et al., 2019 [32]) and we include all the possible methods to calculate the displacement capacity (N2Fajfar [33], N2Guerrini [57], N2Marino [32], CSM [34]).
Applsci 14 01130 g011
Figure 12. Configuration of Visso A’s fragility curves: in the first row is the X-analysis, and in the second row is the Y-analysis; the method of bilinearization of the capacity curve is fixed (in order of row according to Updating EC8-3 rel.2019 [56], NTC18 [8], Marino et al., 2019 [32]) and we include all the possible methods to calculate the displacement capacity (N2Fajfar [33], N2Guerrini [57], N2Marino [32], CSM [34]).
Applsci 14 01130 g012aApplsci 14 01130 g012b
Figure 14. Fragility curves: (a) represents the X-analysis, (b) represents the Y-analysis; the figures represent the three examined case studies, i.e., C, A, and B structural configurations of the Visso School building, with the continuous lines derived from NDP and the indented lines derived from NSP.
Applsci 14 01130 g014
Figure 15. T and T u values: in the first column is the X-analysis and in the second column is the Y-analysis; the figures represent, in the order of the rows, the three examined case studies, i.e., C, A, and B structural configurations of the Visso School building, with the first 125 values of T corresponding to the positive direction and the last 125 values corresponding to the negative direction.
Applsci 14 01130 g015
Figure 16. Ductility: in the first column is the X-analysis, and in the second column is the Y-analysis; the figures represent, in order, the three examined case studies, i.e., C, A, and B structural configurations of the Visso School building, with the first 125 values of ductility corresponding to the positive direction and the last 125 values corresponding to the negative direction.
Applsci 14 01130 g016
Figure 17. Resulting bilinear curves when varying the three alternatives summarized in Table 2 as a function of the examined case studies, i.e., A, B, and C structural configurations of the Visso School building [8,32,56].
Applsci 14 01130 g017
Table 1. Thresholds adopted for achievement of the NC limit state (with, at the macroelement scale, a check regarding the inter-story drift).
ControlNC Limit State
Global d u , 1 = d V b V m a x = 0.8
Macroelement d u , 2 = d D L m i n   D L 4
Table 2. Methods to bilinearize the capacity curve and associated references.
ReferenceMethods to Bilinearize the Capacity Curve for the NC Limit State
NTC2018
[8]
The stiffness k is calculated in correspondence to the 70% V m a x ; then, the stiffness k is kept constant, and the yield strength V y is calculated by the equivalence of the areas up to the displacement of collapse d u , N C .
Updating EC8-3 rel.2019
[56]
Up to the base shear peak, the yield strength V y is kept constant, equal to the peak V m a x , and the stiffness k is calculated by imposing the equivalence of the areas up to V m a x ; after the base shear peak, the stiffness k is kept constant and equal to the value computed until the peak, while the yield strength V y is calculated by the equivalence of the areas up to the displacement of collapse d u , N C .
Marino
et al. (2019)
[32]
For LSs associated with displacements up to the base shear peak, the stiffness k is calculated by the equivalence of the areas up to the displacement associated with the SL by assuming V y equal to the current value of the base shear at this point; for SLs associated with displacements after the base shear peak, the yield strength V y is kept equal to V m a x while the stiffness is computed by imposing the equivalence of the areas up the displacement of collapse d u , N C .
Table 4. Building’s masonry typologies and related values of mechanical parameters [49].
Masonry typology f m
[ N / m m 2 ]
τ 0  
[ N / m m 2 ]
E 
[ N / m m 2 ]
G 
[ N / m m 2 ]
ρ  
[ k N / m 3 ]
minminminmin
medmedmedmed
maxmaxmaxmax
Cut stone masonry2.60.0056150050021
3.20.03981740580
3.80.07401980660
Full brick masonry with lime mortar 2.60.05120040018
3.450.091500500
4.30.131800600
Disclaimer/Publisher’s Note: The statements, opinions and data contained in all publications are solely those of the individual author(s) and contributor(s) and not of MDPI and/or the editor(s). MDPI and/or the editor(s) disclaim responsibility for any injury to people or property resulting from any ideas, methods, instructions or products referred to in the content.