Abstract
Data classification storage has emerged as an effective strategy, harnessing the diverse performance attributes of storage devices to orchestrate a harmonious equilibrium between energy consumption, cost considerations, and user accessibility. The traditional strategy of solely relying on access frequency for data classification is no longer suitable for today’s complex storage environment. Diverging from conventional methods, we explore from the perspective of text semantics to address this issue and propose an effective data classification storage method using text semantic similarity to extract seasonal features. First, we adopt a dual-layer strategy based on semantic similarity to extract seasonal features. Second, we put forward a cost-effective data classification storage framework based on text seasonal features. We compare our work with the data classification approach AS-H, which runs at full high performance. In addition, we also compare it with K-ear, which adopts K-means as the classification algorithm. The experimental results show that compared with AS-H and K-ear, our method reduces energy consumption by 9.51–13.35% and operating costs by 13.20–22.17%.
1. Introduction
The exponential growth of data in recent times has given rise to a significant conundrum concerning the balance between storage performance and costs. In addressing this challenge, hybrid storage solutions have emerged as a promising compromise for consumers, adept at striking a delicate equilibrium among factors such as energy efficiency, cost-effectiveness, and performance optimization [1,2,3,4,5]. Recent statistical data underscore the urgency of this matter, revealing that 1.5% of world energy consumption is contributed by data centers, with storage systems accounting for a substantial 40% of this total [6]. The imperative to curtail energy consumption and operating costs has become a paramount concern for storage systems.
Data classification storage is proven to save storage energy consumption and costs. The existing literature features extensive research on the identification of hot data [7,8,9,10] and the optimization of data placement strategies [11,12]. Hot data identification involves intricate analyses of factors like access frequency, recency, and other relevant features. Data placement strategies [13,14,15,16] involve both horizontal placement, addressing the distribution of data within a storage layer, and vertical placement, managing the distribution of data across various storage layers. These strategies aim to enhance the efficient organization of data. It is worth noting that most current classification methods primarily rely on access frequency for data. However, as the scale of the data increases, the cost associated with collecting frequency information over time becomes non-negligible. Moreover, in the context of the massive data era characterized by continuous data growth, diverse data types, and intricate user access patterns, classification methods that solely hinge on access frequency gradually lose their efficacy. In response to these challenges, this paper advocates for a more holistic approach to data classification storage.
Unlike traditional data classification storage methods, which rely solely on access frequency, we propose an effective data classification storage method using text semantic similarity to extract seasonal features. First, we adopt an approach based on text semantic similarity to extract data textual seasonal features for classification. More specifically, we realize data classification from coarse to fine by setting two text semantic similarity thresholds in a dual-layer strategy. In the first layer, by setting a low threshold, we ensure that the filtered data are all without seasonal features. In the second layer, by setting a high threshold, the data without seasonal features are further screened and the category of seasonal feature data is determined. Second, we propose a framework for data classification storage based on text seasonal features. We classify the data into “hot data” (i.e., data with current seasonal characteristics) and cold data (i.e., data with other seasonal characteristics) based on its seasonal characteristics. We achieve classified storage of the data by placing the data on different performance disks. This storage framework uses text semantic similarity as the basis for data classification, filling the gap of relying solely on access frequency to partition data. At the same time, this method achieves regular adjustment of the storage system with seasonal changes by mining the seasonal feature attributes contained in the semantics of data texts. The experimental validation of our method demonstrates its superiority in achieving not only reduced energy consumption but also cost-effectiveness in comparison to conventional methods, thus offering a forward-looking solution for the evolving demands of data storage systems. In brief, this paper makes the following contributions:
- We explore a dual-layer strategy for mining seasonal features of data texts to classify them based on text semantic similarity.
- We propose a cost-effective data classification storage framework based on text seasonal features.
- The experimental results demonstrate that the energy consumption and operating cost can be saved by more than 9.51–13.35% and 13.20–22.17%, respectively.
The rest of paper is organized as follows: the related work and motivation are depicted in Section 2. Section 3 presents the data classification storage framework based on season. In Section 4, we elaborate on the energy and cost models. Section 5 outlines the evaluation experiments along with pertinent discussions. Finally, we conclude the paper in Section 6.
2. Related Work and Motivation
Related Work
We provide a concise overview of noteworthy studies in this field through data classification to achieve cost-effective storage [17,18] in this section.
SEA [11] is designed to enhance energy efficiency within RAID-structured storage systems. SEA employs popularity weights for data classification, storing them separately on different disks. However, it relies on simple statistics for popularity, potentially overlooking nuanced patterns in data access. Furthermore, the definition of popularity is essential, which may lead to suboptimal results in dynamic environments with changing data access patterns.
GreenHDFS [19] achieves energy-proportional behavior in data centers. According to the energy consumption and performance, storage areas are categorized into two areas (hot and cold). Although GreenHDFS achieves 26% energy savings of a Hadoop cluster in the experiment, the reliance on statistical metrics for data classification may limit its adaptability to diverse workloads.
Lightning’s [20] approach of configuring servers into two zones is efficient for energy conservation. However, putting servers in the cold zone to sleep raises concerns about responsiveness and latency. The trade-off between energy savings and potential delays in activating servers needs careful consideration, especially in environments with unpredictable access patterns.
Liao et al. [21] built a cost-effective model for distributed storage systems in which racks are classified into active and sleep zones. While the approach effectively reduces energy consumption, relying on statistical metrics for access regularity may oversimplify the dynamics of real-world data access patterns. Additionally, the real performance of sleeping servers in the sleep zone may vary based on workload characteristics.
Zhang et al. [22] partitioned data into three classes according to the file characteristics. The rigid division of storage areas into reduplication, hot, and cold zones may adapt well to evolving data access patterns. While the approach shows energy savings under specific conditions, its effectiveness may diminish in dynamic environments.
K-ear [23] categorizes data into multiple groups by extracting seasonal period characteristics using the K-means clustering algorithm. These categories are then stored in various regions within a cloud storage system. While considering seasonal features is a step forward, the K-means algorithm may limit the model’s ability to capture complex relationships in the data. The shallow features extracted may not provide a comprehensive understanding of the data dynamics, particularly in scenarios with intricate access patterns.
CSEA [4] also adopts access frequency as the basis for data classification. Unlike K-ear, it considers the climatic season characteristics of data access and applies a fine-grained data layout strategy from the perspective of climate and seasonal characteristics, reducing the storage system’s expenses.
We compare the related studies in Table 1, most of which only depend on access frequency. Our solution analyzes data from the perspective of text semantics and implements classification, providing a new idea for data classification storage.

Table 1.
The comparison of related studies.
Motivation
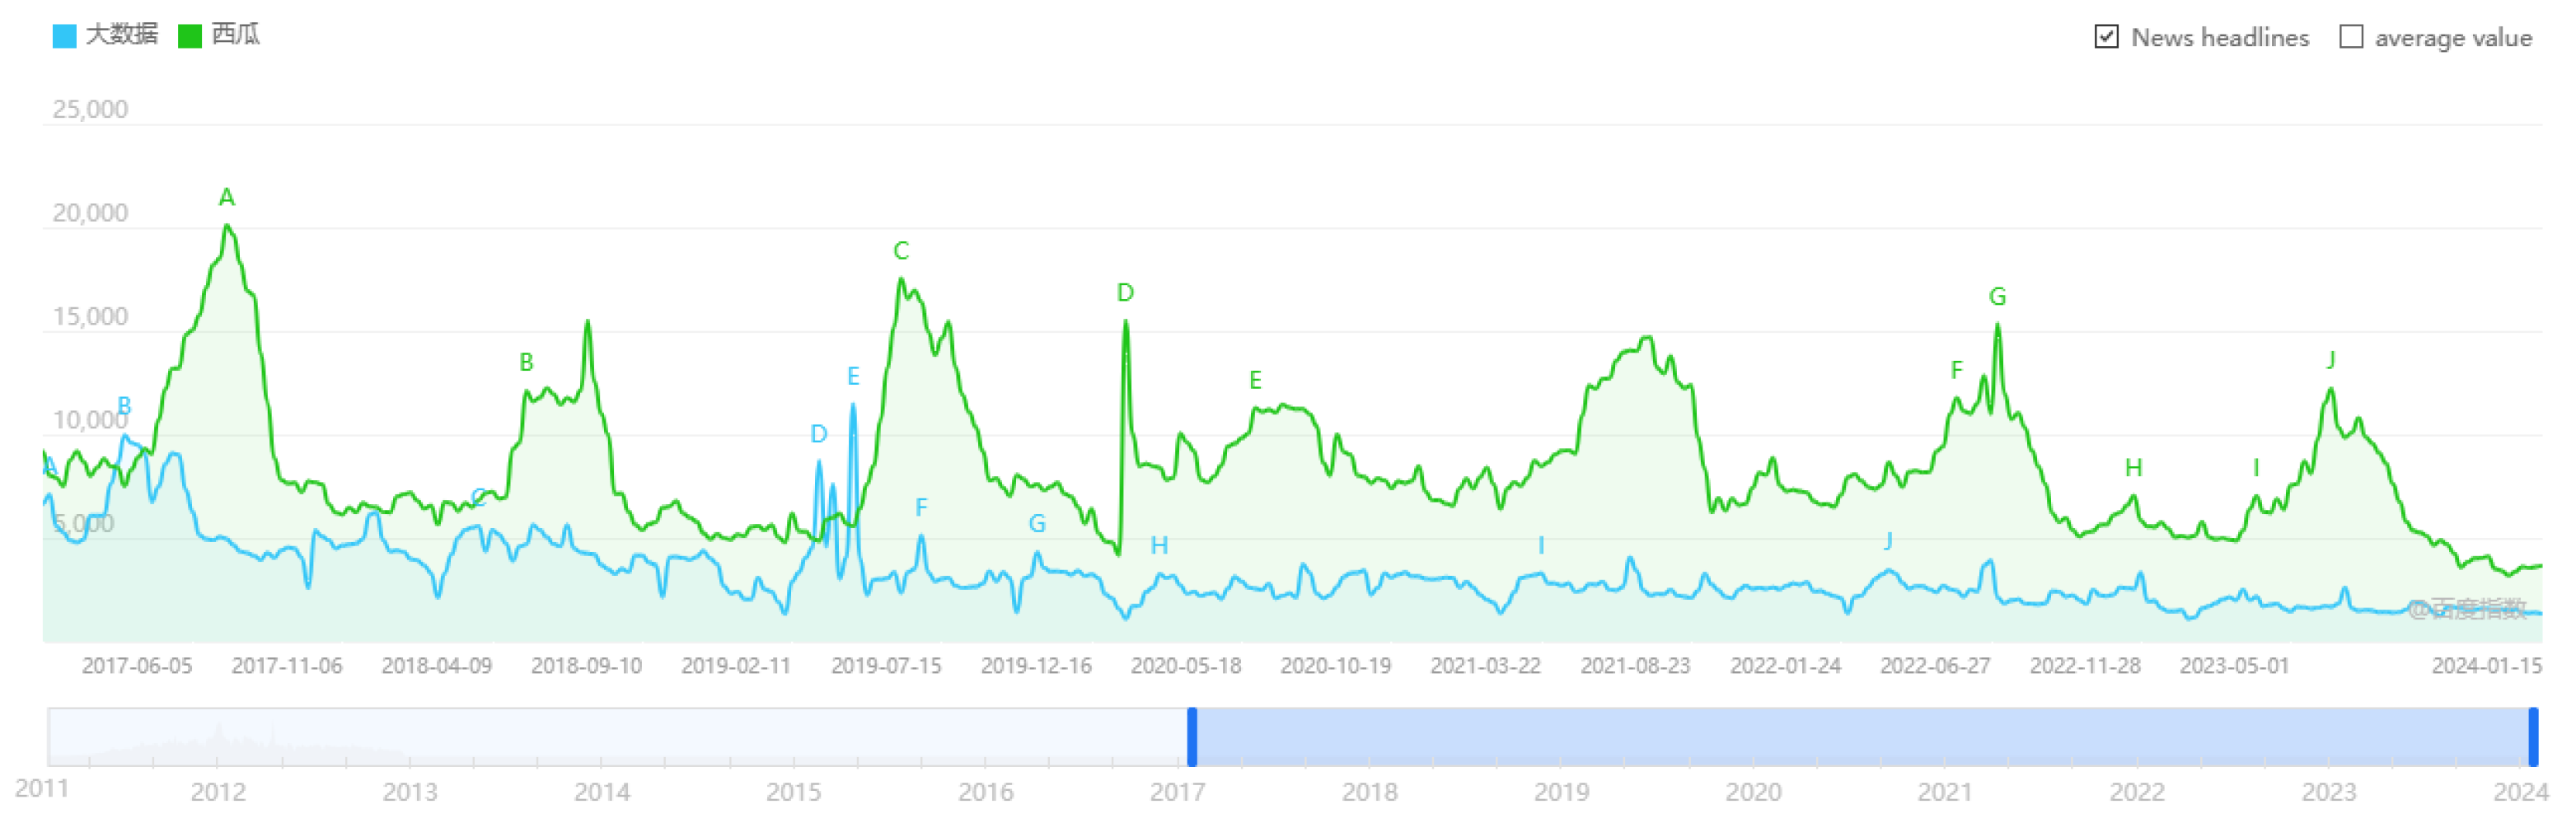
Indeed, much of the existing research in the realm of classification storage is rooted in the analysis of access frequency. Notably, within sectors such as banking and e-commerce, researchers have discovered periodic regularities in data access frequency, uncovering periodic hot-spot data by scrutinizing applications on enterprise-level storage servers. In our study, we investigate the inner link between data access frequency and seasonal cycle laws. We obtain the access frequency by searching for keywords on the Baidu Index website. The statistical period for the access frequency provided by the website is from 2011 to 2024. We intercept the data from 2017 to 2024 to display the seasonal characteristics corresponding to the access frequency. Figure 1 exhibits the access frequency of keywords (e.g., “Watermelon = 西瓜” and “Big data = 大数据”) [24]. We observe that the peak characteristic of “Watermelon" access frequency is consistent with the corresponding seasonal laws. Conversely, the access frequency pattern of “Big data" manifests characteristics that depart from seasonal rules. Thus, we contemplate that it is viable to implement classification storage by mining seasonal features of data access frequency.
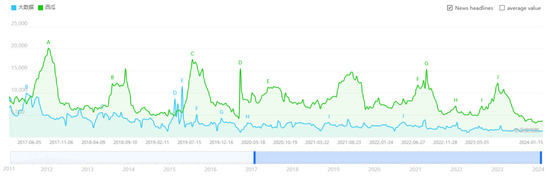
Figure 1.
The access frequency of keywords.
3. The Data Classification Storage Framework Based on Season
3.1. Architecture Overview
As illustrated in Figure 2, our proposed method concludes three key components: season division, seasonal feature extraction based on semantic similarity, and data classification storage. Each of these components plays a crucial role in establishing an effective and nuanced approach to managing data for seasonal attributes. For the season division, we adopt the conventional astronomical seasons approach. This approach provides a standardized and widely accepted framework for delineating the boundaries of each season, ensuring consistency and alignment with established meteorological conventions. Concerning seasonal feature extraction, we employ a dual-layer strategy. In the initial phase, coarse-grained data classification is applied to filter out text data without seasonal features. Subsequently, in the fine-grained refinement stage, we delve deeper into the data to further categorize it based on more intricate seasonal attributes. This dual-layer strategy ensures a comprehensive and nuanced understanding of the seasonal characteristics inherent in the dataset. For data classification storage, after extracting and categorizing the data based on their seasonal features, we organize and store the information according to these identified characteristics. This facilitates energy conservation and cost-effectiveness, aligning with the overarching goals of our methodology. By combining these three components, our method presents a holistic and efficient solution to the challenges of data classification storage in the context of seasonal dynamics.
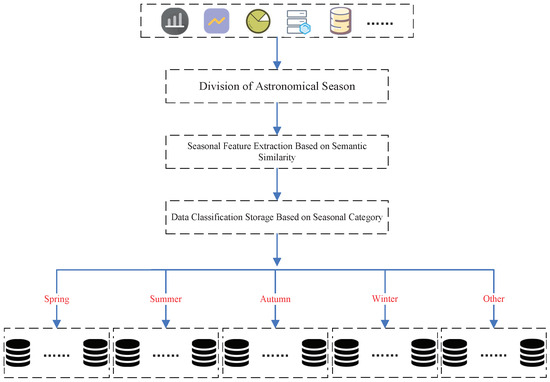
Figure 2.
The data classification storage framework based on season.
3.2. Division of Seasons
Indeed, our current method for defining the four seasons predominantly relies on astronomical seasons, representing the prevailing standard for season division. The four seasons adhere to a regular yearly cycle, with each month and region exhibiting distinctive attributes. This unified and structured seasonal division method provides a coherent and widely applicable basis for discussions and analyses related to seasons.
3.3. Text Classification Based on Semantic Similarity
Our work is inspired by Luo et al. [25] to use a double-layer Bloom filter for identifying hot data. It exploits the characteristic of the Bloom filter with zero false negatives to pre-classify the data in advance, leaving behind 100% cold data and rough hot data. Then, it performs post-identification to divide the data into hot data (with false positives) and cold data. After experimental verification, the double-layer hot data recognition framework effectively improves the hot data recognition accuracy. Therefore, we propose a dual-layer strategy based on semantic similarity to extract seasonal features for classification.
For semantic similarity calculation, cosine similarity [26] is the most common method. It represents each word in the text as a vector that can describe the content of the text. Then, employing the cosine formula, it computes the cosine value for the angle between these two vectors, assessing the semantic similarity of texts in the process.
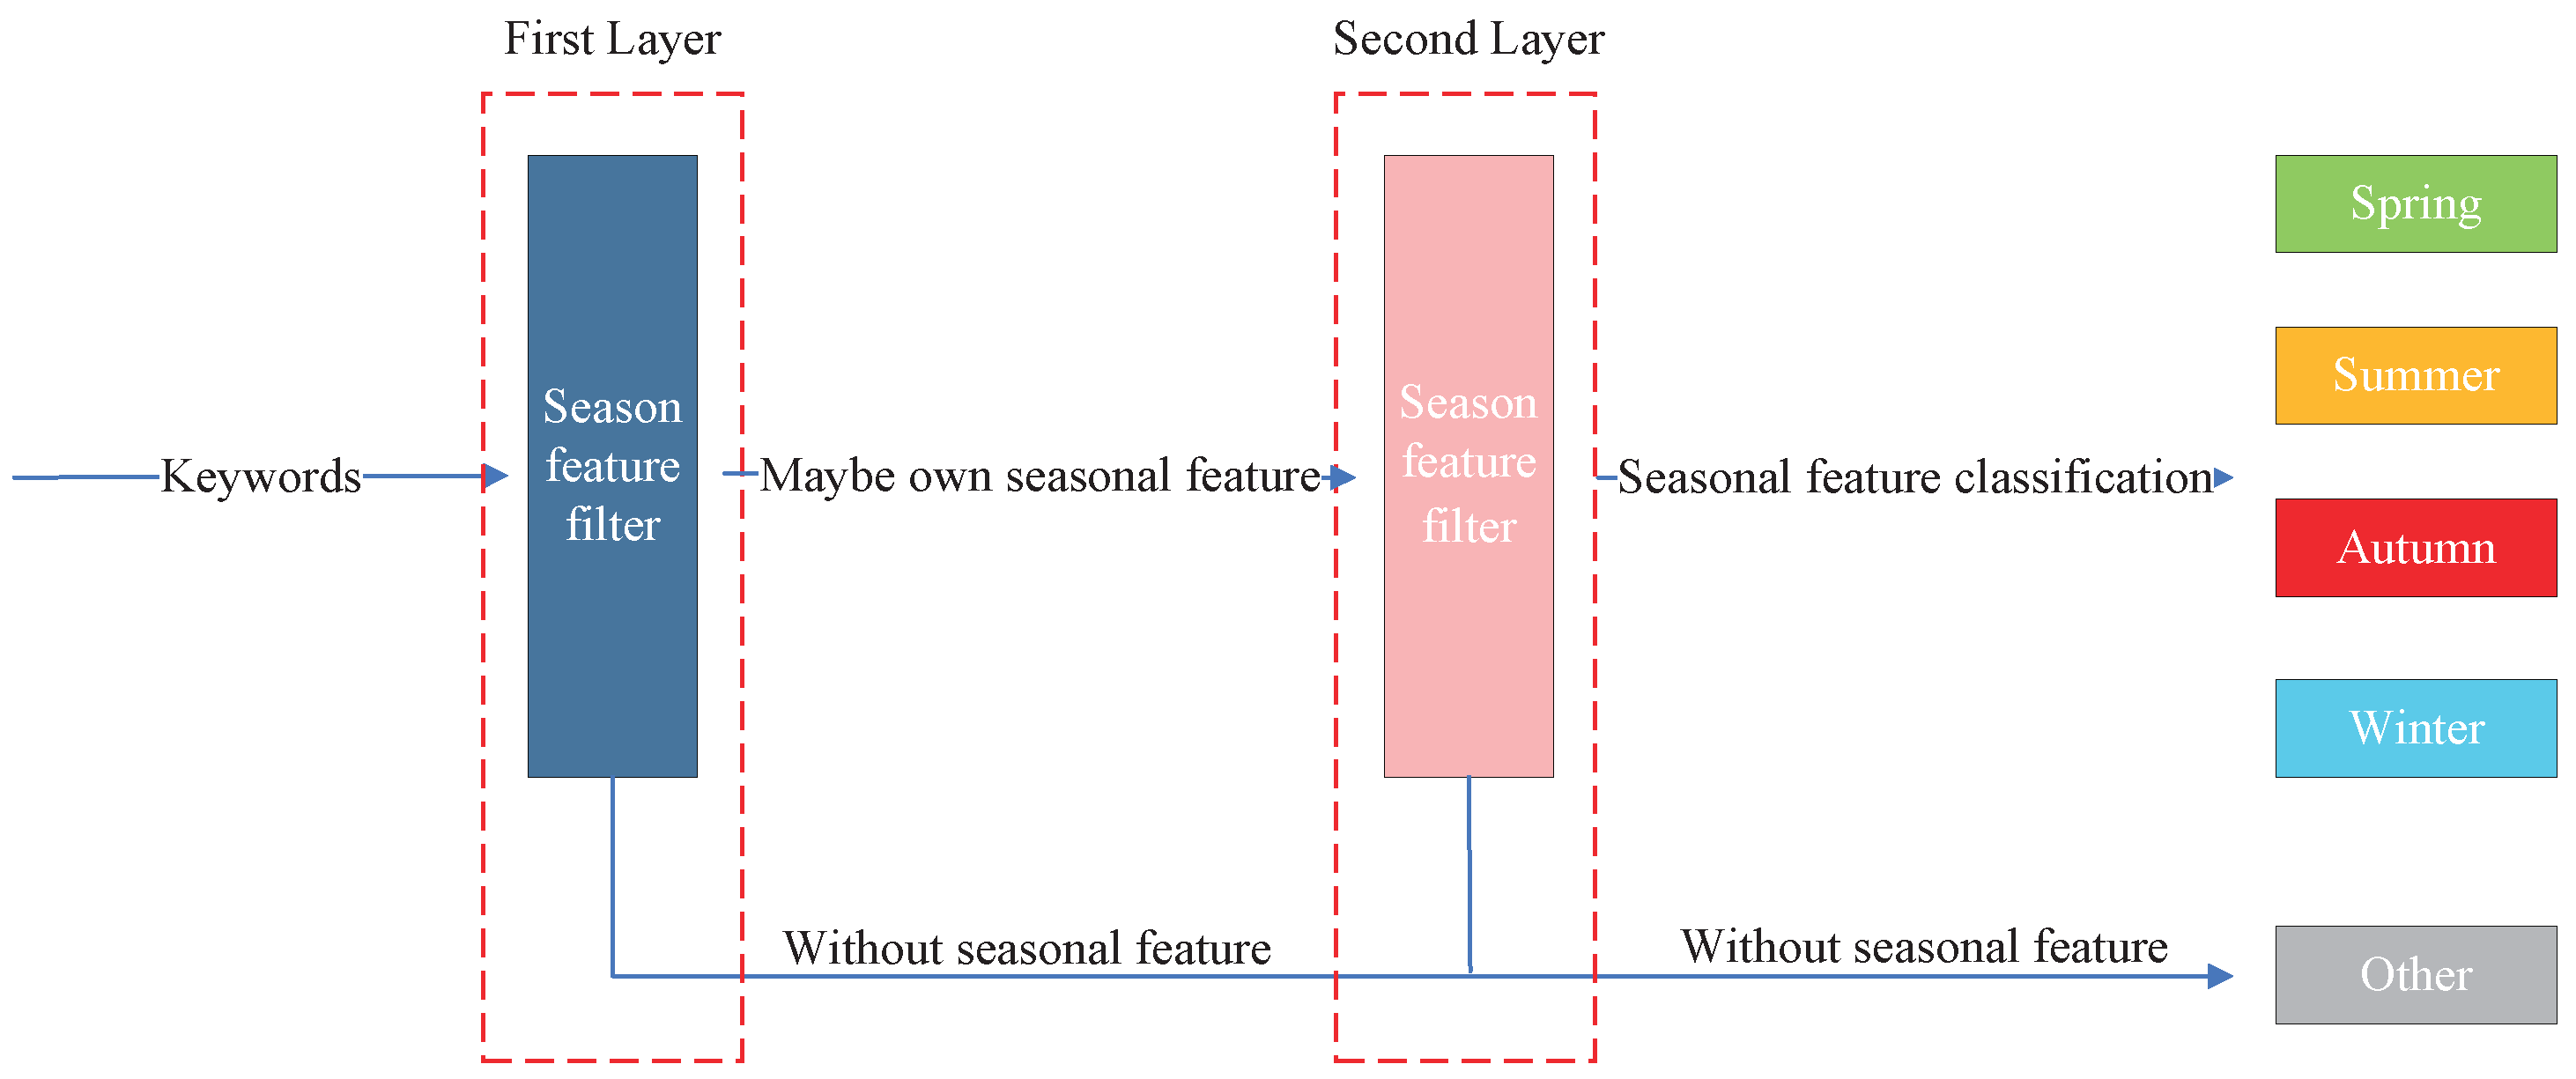
Figure 3 shows the process of extracting seasonal features and classifying them using a dual-layer strategy. Our core idea revolves around the extraction of data text features from coarse- to fine-grained. We achieve this by conducting numerous semantic similarity analyses [27] using sources such as Baidu Encyclopedia, Wikipedia, Financial News, Zhihu QA, and the Weibo corpus. These are publicly available and representative of Chinese text corpora in the academic community. Due to differences in corpus size, attributes, domains, etc., the semantic similarity obtained may be different in various corpora. Therefore, we normalize the similarity obtained by comparing the data text with the feature text of each season. Meanwhile, we need to comprehensively compare the similarity values of the same text on different corpora and obtain a comprehensive similarity value by taking the average value. We can obtain a composite value for each data text with these analysis results. When semantic similarities are not found in the corpus, we assume that the data text has no seasonal features. For text semantic similarity, a higher value indicates a higher probability of having seasonal features, while a lower value indicates a lower probability of having seasonal features. But there are also cases of recognition errors or false recognition. Therefore, we adopt a dual-layer strategy to address this issue.
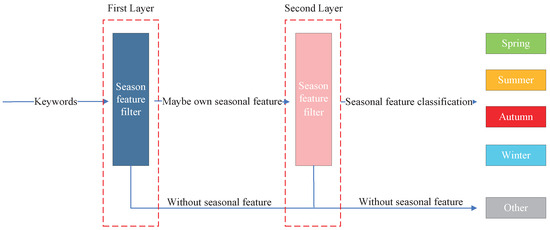
Figure 3.
Dual-layer strategy to extract seasonal features based on text semantic similarity.
In the first layer, we employ a low threshold. Below this similarity threshold is considered indicative of the absence of seasonal features. This initial filtering step effectively screens out data texts that lack discernible seasonal characteristics. After using a low threshold, the data are divided into 100% data without seasonal features and rough data with seasonal features.
In the second layer, we introduce a high threshold. Beyond this threshold, the presence of seasonal features is definite, while values below it suggest the absence of such features. After adopting a high threshold, we once again divide the rough seasonal feature data into data with seasonal features and without seasonal features. Among them, based on the semantic similarity comparison between each data text and seasonal feature text, the data with seasonal features select the highest value as the seasonal attribute of the data text. For example, if the similarity between the data text and seasonal feature words is spring: 0.5, summer: 0.2, autumn: 0.1, winter: 0.2, then we consider the data text to have the spring feature.
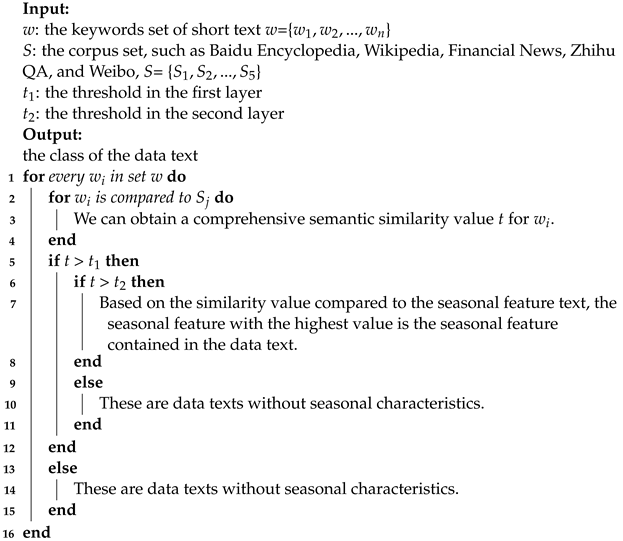
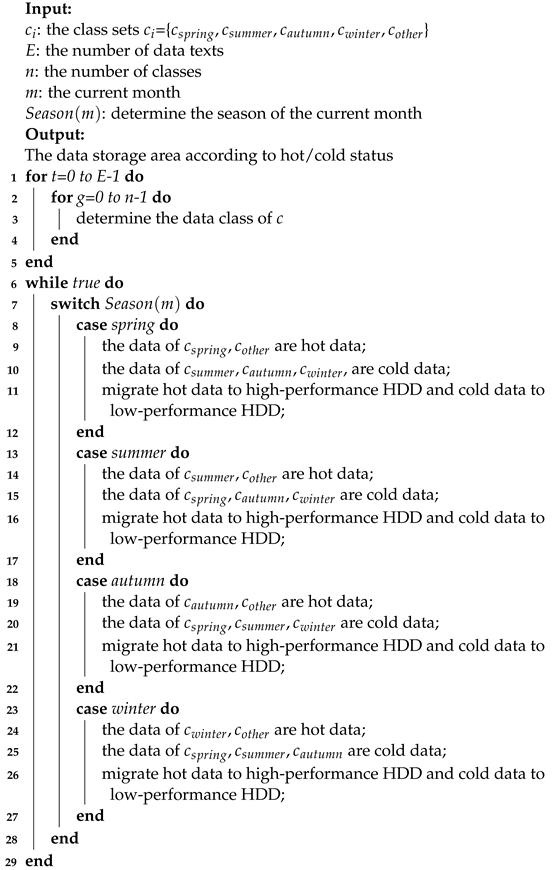
Algorithm 1 provides a detailed description of the process of implementing a dual-layer strategy. Through this dual-layer strategy, our approach ensures a robust and comprehensive understanding of seasonal characteristics within the dataset. By combining both coarse- and fine-grained analyses, we aim to enhance the precision and adaptability of our data classification system, providing a sophisticated solution for capturing the intricate nuances of seasonal patterns in different data texts.
| Algorithm 1: Dual-layer strategy |
 |
3.4. Data Storage
Analyzing historical data, we have identified potential seasonal patterns in data access. These patterns are inherently tied to time, wherein the data exhibit recurring patterns or fluctuations during specific seasonal intervals. These observed seasonal data access laws provide the basis for categorizing the data into “hot” and “cold” data, based on their seasonal features. In this context, data with the current seasonal feature are considered “hot” data, while data with other seasonal features are classified as “cold” data. We implement data classification and storage by allocating high-performance disks for hot data and utilizing low-performing disks for cold data. As the seasons change, the disk state can be transformed and the data can also be migrated. Algorithm 2 describes the whole process of data classification storage and migration. The primary objective of the algorithm is to assign the data to disks based on their performance, segregating the data into disks corresponding to different temperature levels. We do not care about the data migration overhead. This is because seasonal changes are a necessary condition for triggering data migration, and there are only three seasonal changes in an entire year. That is to say, data migration only occurs three times in one year. Therefore, the overhead resulting from data migration during their lifespan after data placement can be disregarded when compared to the data storage overheads post-data placement. Reducing the overall energy consumption and cost of the storage system is facilitated with this method, all the while ensuring that the quality of user access remains intact.
| Algorithm 2: Data Classification Storage and Migration |
 |
4. The Related Energy and Cost Model
4.1. Model Parameters
We evaluate the effectiveness of various classification methods by designing models. Table 2 details all parameters utilized in the models. We denote the dataset by . The data are divided into five categories according to the experimental requirements. The storage system’s operating time is denoted by T. Since the disks have two performance modes and each mode has active and idle statuses, we set these parameters separately. In the high-performance mode, we set the transfer rate to (Mbit/s), with corresponding energy consumption rates of (J/s) in the active status and (J/s) in the idle status. In the low-performance mode, we define the transfer rate as (Mbit/s), with corresponding energy consumption rates of (J/s) in the active status and (J/s) in the idle status. For simplicity, we suppose that the disks share equal capacity, in which the data are stored in blocks with a size of B.
Table 2.
Parameters and explanations needed to design the model.
There are two key points to emphasize in the model: (1) Disks in the current seasonal storage area operate in the high-performance mode, while those in other seasonal storage areas run in the low-performance mode. (2) Storage areas’ disks without seasonal features consistently run in the high-performance mode, regardless of the season.
4.2. Energy Consumption Model
As the storage system adjusts the performance modes of disks based on seasonal variations, the total energy consumed within one year is the total energy consumption over the four seasons.
Given space limitations, we employ the spring as an illustrative example. Throughout a specific spring month, disks in both the spring and without seasonal feature storage areas run in high-performance mode, with the remaining disks assigned to low-performance mode. The energy consumption is evaluated as follows: First, the count of disks in active status within the spring storage area is . The overall transfer speed is . Then, the data volume of spring active status is . Next, we derive the time spent in transmitting these data as . Finally, during active status, the spring energy consumption in high-performance mode is represented as . The variable T represents the operational time of a storage system over one year. During the spring season, the cumulative operational time is . The expression for the ratio of the total idle time in spring to the total operational time during spring is given by . We calculate the spring energy consumption during idle status as . By analogy, we can obtain the other seasons’ energy consumption.
4.3. Operating Cost Model
Using the established energy consumption model, we quantify the overall operational cost of a storage system throughout one year. Again, we take the spring operating cost as an example. The cost associated with processing data per megabyte in both high- and low-performance modes is denoted as and , respectively. Additionally, the expense of data storage per megabyte per day is represented as . Now, we quantify the operating cost in the following steps. First, the volume of data to be processed during the active status in spring is . Subsequently, we determine the cost in the high-performance mode during the active status as . Following that, the data volume during the idle status is . T denotes the total running time for a year. Then, the spring running time is . The operational time during the idle status is represented as . Ultimately, we calculate the overall storage cost during the idle status as . The operating cost of the other seasons can be derived in the same fashion.
5. Experiments and Evaluation
We begin by outlining the experimental environment and pertinent settings of the CloudSimDisk simulator. Subsequently, we delve into performance analyses focusing on storage energy consumption and operational costs. For performance comparison, we employ the AS-H and K-ear methods as baselines.
AS-H: This method adopts the access frequency of data text as the classification basis. By analyzing the access peak, it selects the highest peak as the seasonal feature contained in the text. It considers data with current seasonal characteristics as hot data and data with other seasonal characteristics as cold data. All disks storing data operate in high-performance mode.
K-ear: This approach utilizes K-means as the text classification method and implements classification storage based on seasonal features. It considers data containing current seasonal characteristics as hot data and data containing other seasonal characteristics as cold data. The high-performance disks store hot data. The low-performance disks store cold data.
5.1. Experimental Setup
Table 3 provides a comprehensive list of experimental parameters, encompassing both hardware and software configurations.
Table 3.
The configuration of both hardware and software.
5.1.1. CloudSimDisk
CloudSim [28] stands out as a robust and versatile discrete-event simulator specifically designed for evaluating cloud computing infrastructures and services. Despite its prowess, a notable gap in its functionality is the absence of capabilities for simulating energy consumption in cloud storage systems. In response to this limitation, researchers and developers have endeavored to enhance CloudSim’s capabilities by integrating energy awareness into cloud storage simulations, resulting in the development of CloudSimDisk [29].
CloudSimDisk incorporates an innovative and scalable module dedicated to simulating energy-aware cloud storage systems. Building upon this foundation, we have further extended its functionality by developing a specialized cost module. This module is designed to evaluate operational costs, encompassing factors such as data processing and storage costs. By doing so, it empowers users to strike a balance between performance and cost, ensuring the provision of high-quality cloud storage services with optimized operational cost-effectiveness.
5.1.2. Storage Device Models
CloudSimDisk offers the modeling of storage device components: it generates a package comprising classes that model components of storage devices. Table 4 lists the storage device characteristics implemented in CloudSimDisk, where the parameter key retrieves the value of a specific characteristic associated with this device.
Table 4.
Storage device characteristics implemented in CloudSimDisk.
To demonstrate the approach’s effectiveness, we conduct the experiments in CloudSim-Disk to model three disks. The disk parameters crucial for our simulation are sourced from the official website [30] and are detailed in Table 5.
Table 5.
The parameters of different disk models.
5.1.3. Workload Characteristics
To evaluate the performance of various solutions, we adopt a replay real-access record method. K-ear selects a set of 70 keywords, mainly including entertainment, season, work, and other aspects. Simultaneously, it crawls their access records from the Baidu index website for 2018 and generates experimental workloads based on this. However, this method has certain limitations, including a relatively small number of selected keywords and a short time span. We have borrowed from this method, refining and improving it. Specifically, we have augmented the keyword set to encompass 200 keywords (such as short skirt, tree planting, Spring Festival, skiing, Christmas, etc.), offering a more comprehensive and diverse representation. After classification using the semantic similarity algorithm, the classification results for the 200 keywords are: Spring: 27, Summer: 25, Autumn: 5, Winter: 29, Other: 113. Furthermore, we have extended the time span for our data collection, covering the period from January 2018 to December 2020. This extended time span allows for a deeper exploration of periodic patterns and trends in the data, providing a more solid foundation.
There are seven key points to consider regarding the characteristics of the workload.
- (1)
- Workload format. The workloads include vital data from access records, such as text, request size, storage location, and timestamp.
- (2)
- Workload generation. We organize the keyword access records monthly and calculate the ratio to the year’s access records. This approach guarantees that the workload characteristics remain unaffected by the workload size.
- (3)
- Number of I/O records. The number of records affects the disk array’s load. Generally speaking, the search volume for each feature keyword is huge. Therefore, we choose to optimize the experiment by limiting the total I/O records monthly.
- (4)
- Access frequency. Generally, each access is considered an I/O record
- (5)
- Data size distribution. Prior studies [31,32] observed that the data size shows a robust correlation with the access frequency, often conforming to a Zipf-like distribution. Hence, we guarantee the law for data size and access frequency in reverse order.
- (6)
- Request size. We set equal access sizes for the same keyword, which can be obtained from the data size and frequency.
- (7)
- Request timestamp. Since the total number of I/Os is kept at a fixed value, the timestamps need to be scaled down by the same multiplier.
5.2. Results and Discussions
The overhead of a disk is mainly related to the transaction time of files. The calculation of transaction time is shown in Formula (2).
E is the entire storage system’s energy consumption, as in Formula (3).
The disk’s total energy consumption contains the active status and idle status , as in Formula (4).
The energy consumed by the two states equals the multiplication of the time spent in their respective statuses and the power of the corresponding mode P, as in Formulas (5) and (6).
The operating cost encompasses both the data processing and data storage cost. Data processing costs encapsulate the expenditures related to processing data across a range of storage devices. Data storage costs account for the varying expenses incurred by different devices due to acquisition costs. The operating cost is expressed by C, which is the total operating cost of all disks, as in Formula (7).
The cost of each device is equal to the cost sum of processing and storing data , as in Formula (8).
The operating cost of processing data and storing data are equal to the product of the file size f and the corresponding cost s, as in Formulas (9) and (10).
5.2.1. Comparison across Multiple Years
Energy Consumption. In this comprehensive analysis, we delve into the nuanced landscape of energy consumption across various data classification strategies. The experimental workloads are meticulously configured for the years 2018, 2019, and 2020, providing a robust foundation for evaluating the strategies’ performance over time. Figure 4 elucidates the dynamic trends in energy consumption associated with different data classification methods.
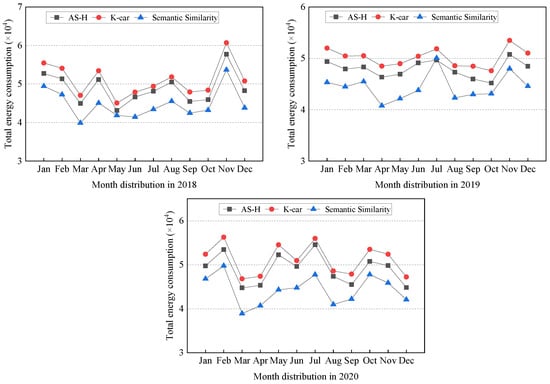
Figure 4.
Annual total energy consumption of different methods (2018–2020). We use the energy consumption module in CloudSimDisk to compare the energy consumption of all approaches by replaying the workloads. Compared to AH-S and K-ear, the semantic similarity method reduces energy consumption by up to 9.51–13.35%.
Figure 4 unveils that the semantic similarity method outperforms other classification strategies regarding energy consumption. Across the time quantum from January 2018 to December 2020, compared with AS-H and K-ear, the semantic similarity method decreases energy consumption by 8.33–12.24%, 7.35–11.42%, and 9.51–13.35%, respectively. Furthermore, we can observe that the semantic similarity method not only outperforms its counterparts but also showcases a resilient and enduring advantage over three consecutive years. This sustained superiority highlights the robustness and stability of the semantic similarity approach in minimizing energy consumption in data classification tasks. Compared with the method that relies solely on access frequency for classification, this is mainly attributed to the advantages of the text semantic method in extracting semantics, because there is a large amount of semantic data text with seasonal features and access frequency without seasonal feature. Text semantics have greater dimensional information in reflecting seasonal characteristics than access frequency.
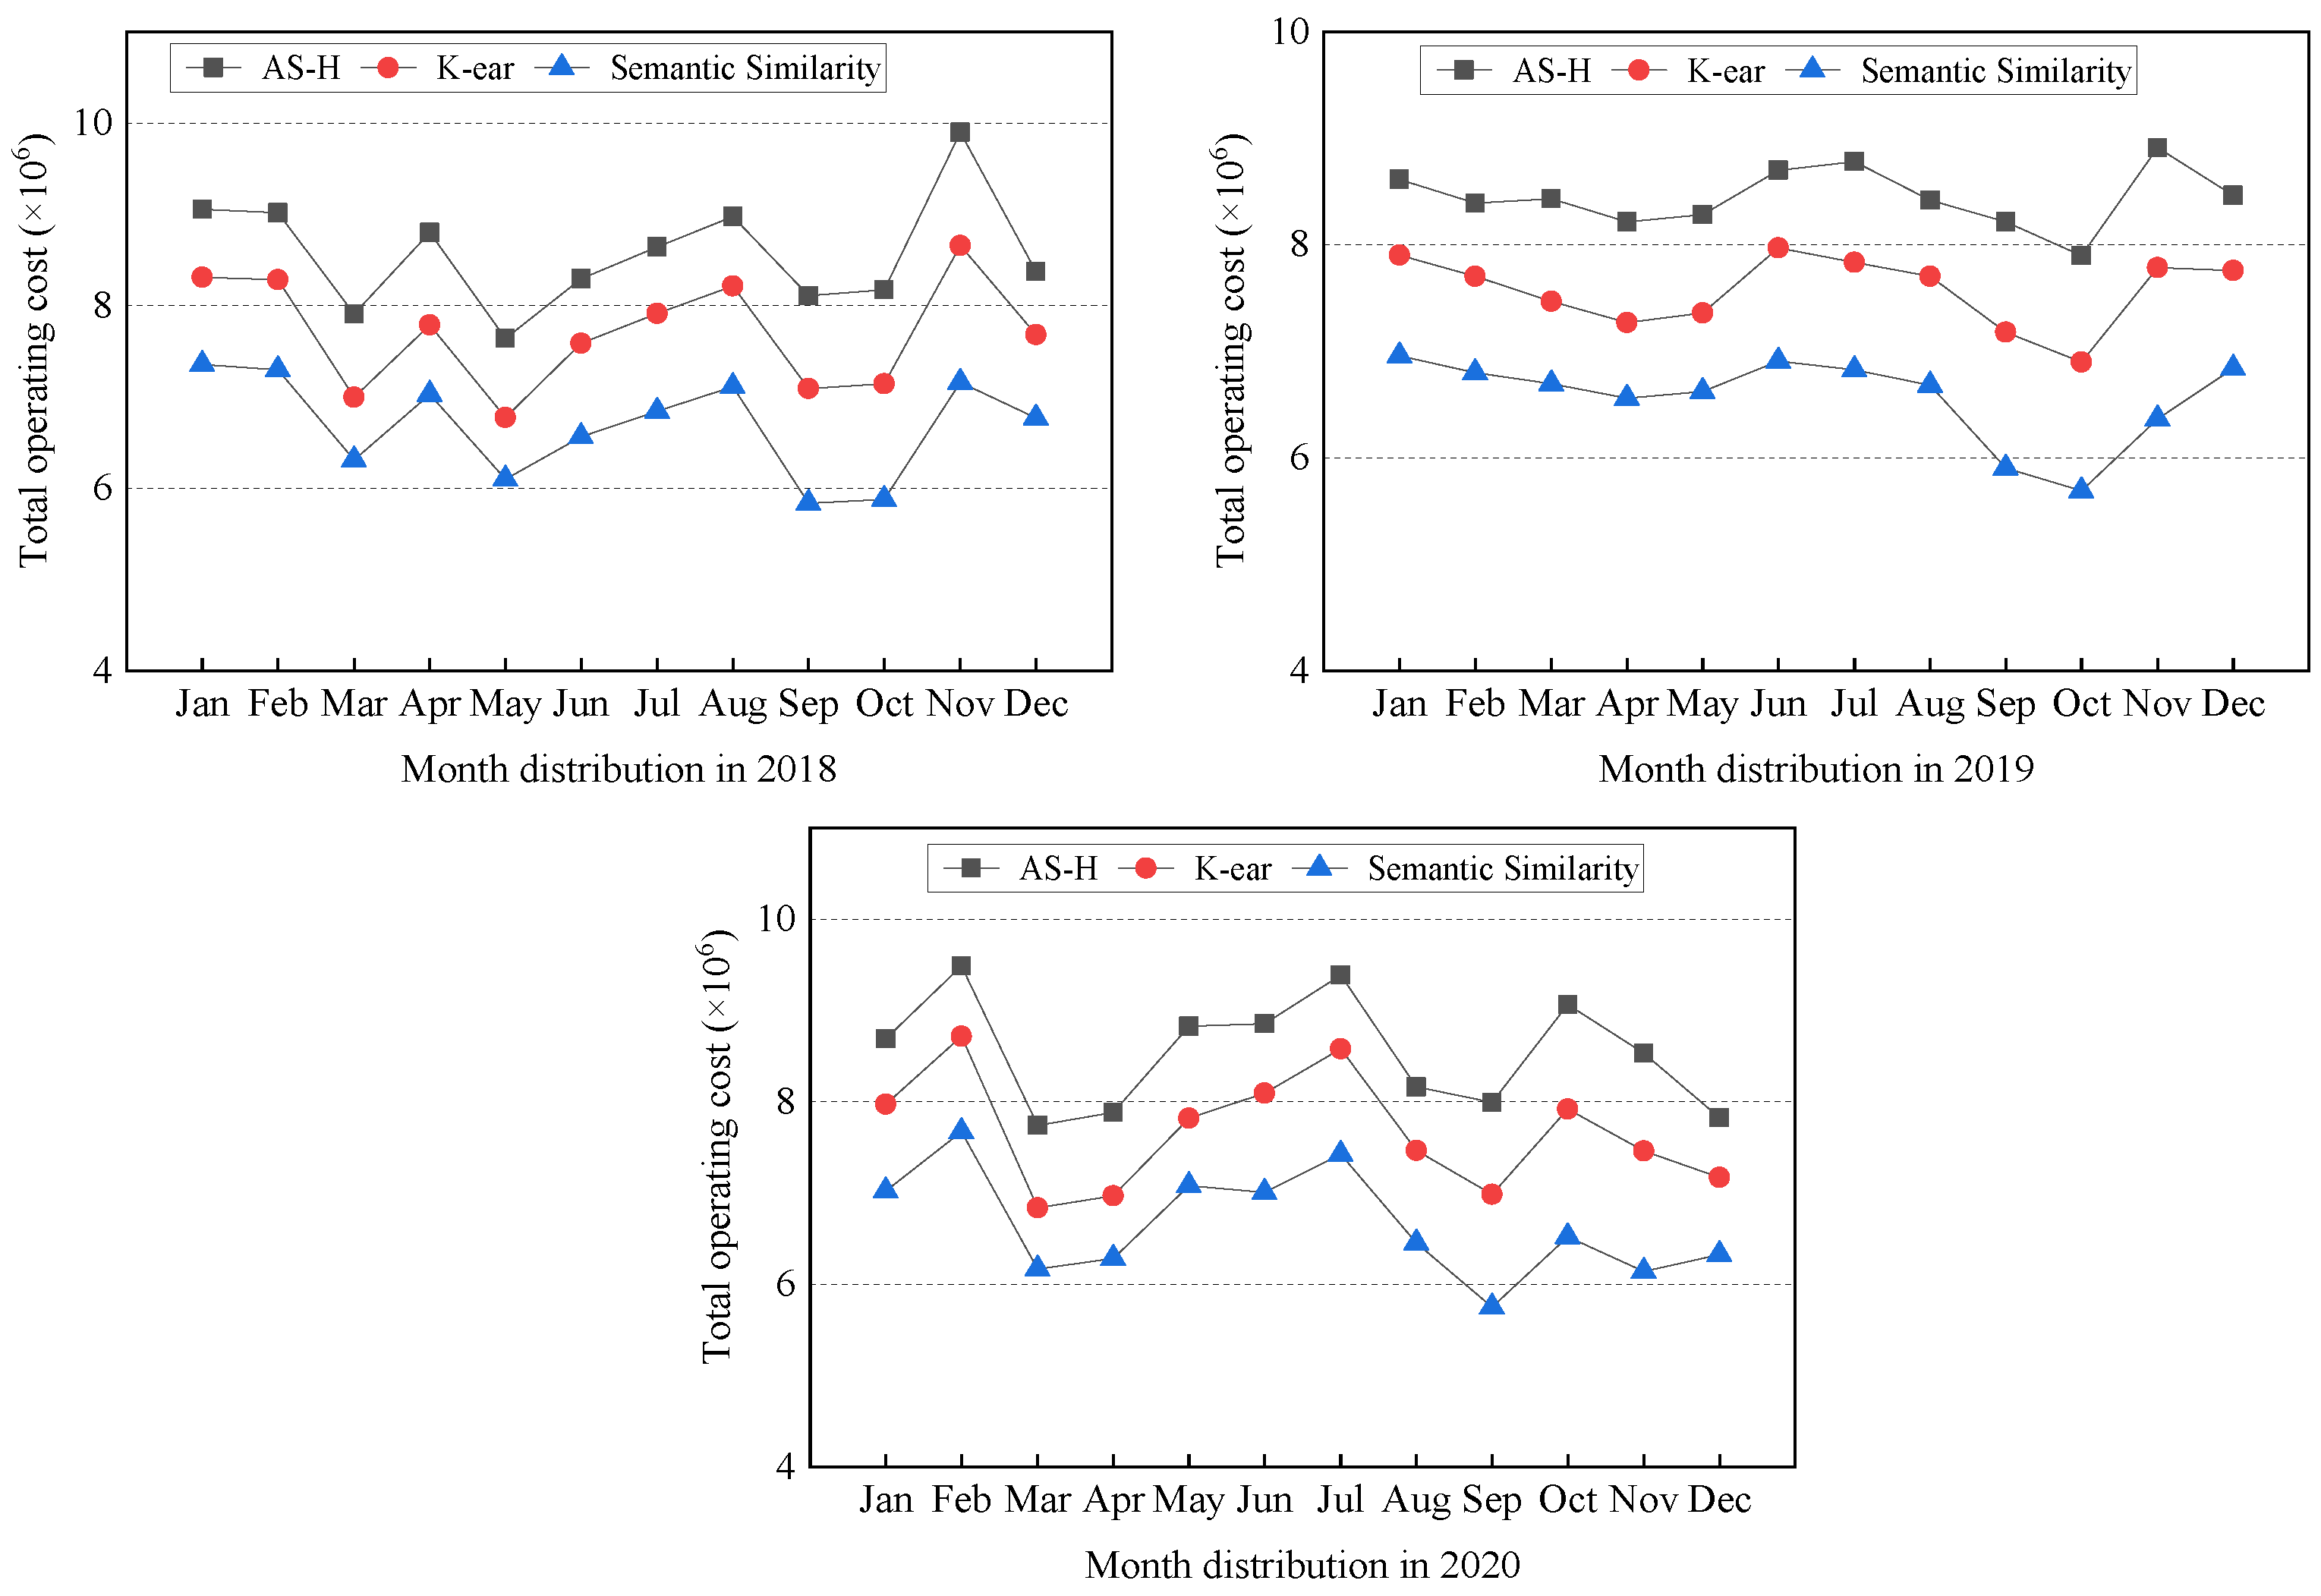
Operating Cost. In our comprehensive analysis, we delve into the operating costs associated with diverse data classification approaches from 2018 to 2020. The operating costs for each classification strategy are visually presented in Figure 5.
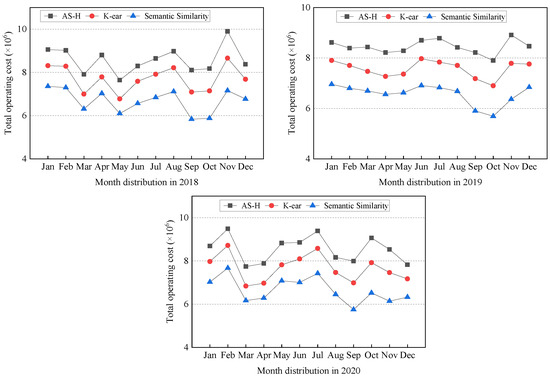
Figure 5.
Annual total operating cost of different methods (2018–2020). We compare the operating costs of all approaches through the cost module designed by us in CloudSimDisk. Compared to AH-S and K-ear, the semantic similarity method economizes operating cost by up to 13.20–22.17%.
Figure 5 illuminates the operating cost of the semantic similarity method, which consistently exhibits a lower operating cost compared to alternative strategies. Specifically, when juxtaposed with the AS-H and K-ear classification strategies, the semantic similarity method showcases substantial operating cost savings, ranging from 13.19% to 22.00% in 2018, 13.20% to 22.17% in 2019, and 13.20% to 22.05% in 2020. This notable cost advantage underscores the economic viability and efficiency of the semantic similarity method, positioning it as a choice for seeking to optimize the operational cost of data processing and storage. The sustained and substantial cost savings over the three years further accentuate the method’s reliability and cost-effectiveness in real-world applications. This is mainly attributed to the improvement in the accuracy of seasonal feature recognition using text-semantic methods. The improvement in accuracy allows limited data to be placed on high-performance disks. This also means that more data are placed on low-cost disks, reducing the entire storage system’s cost.
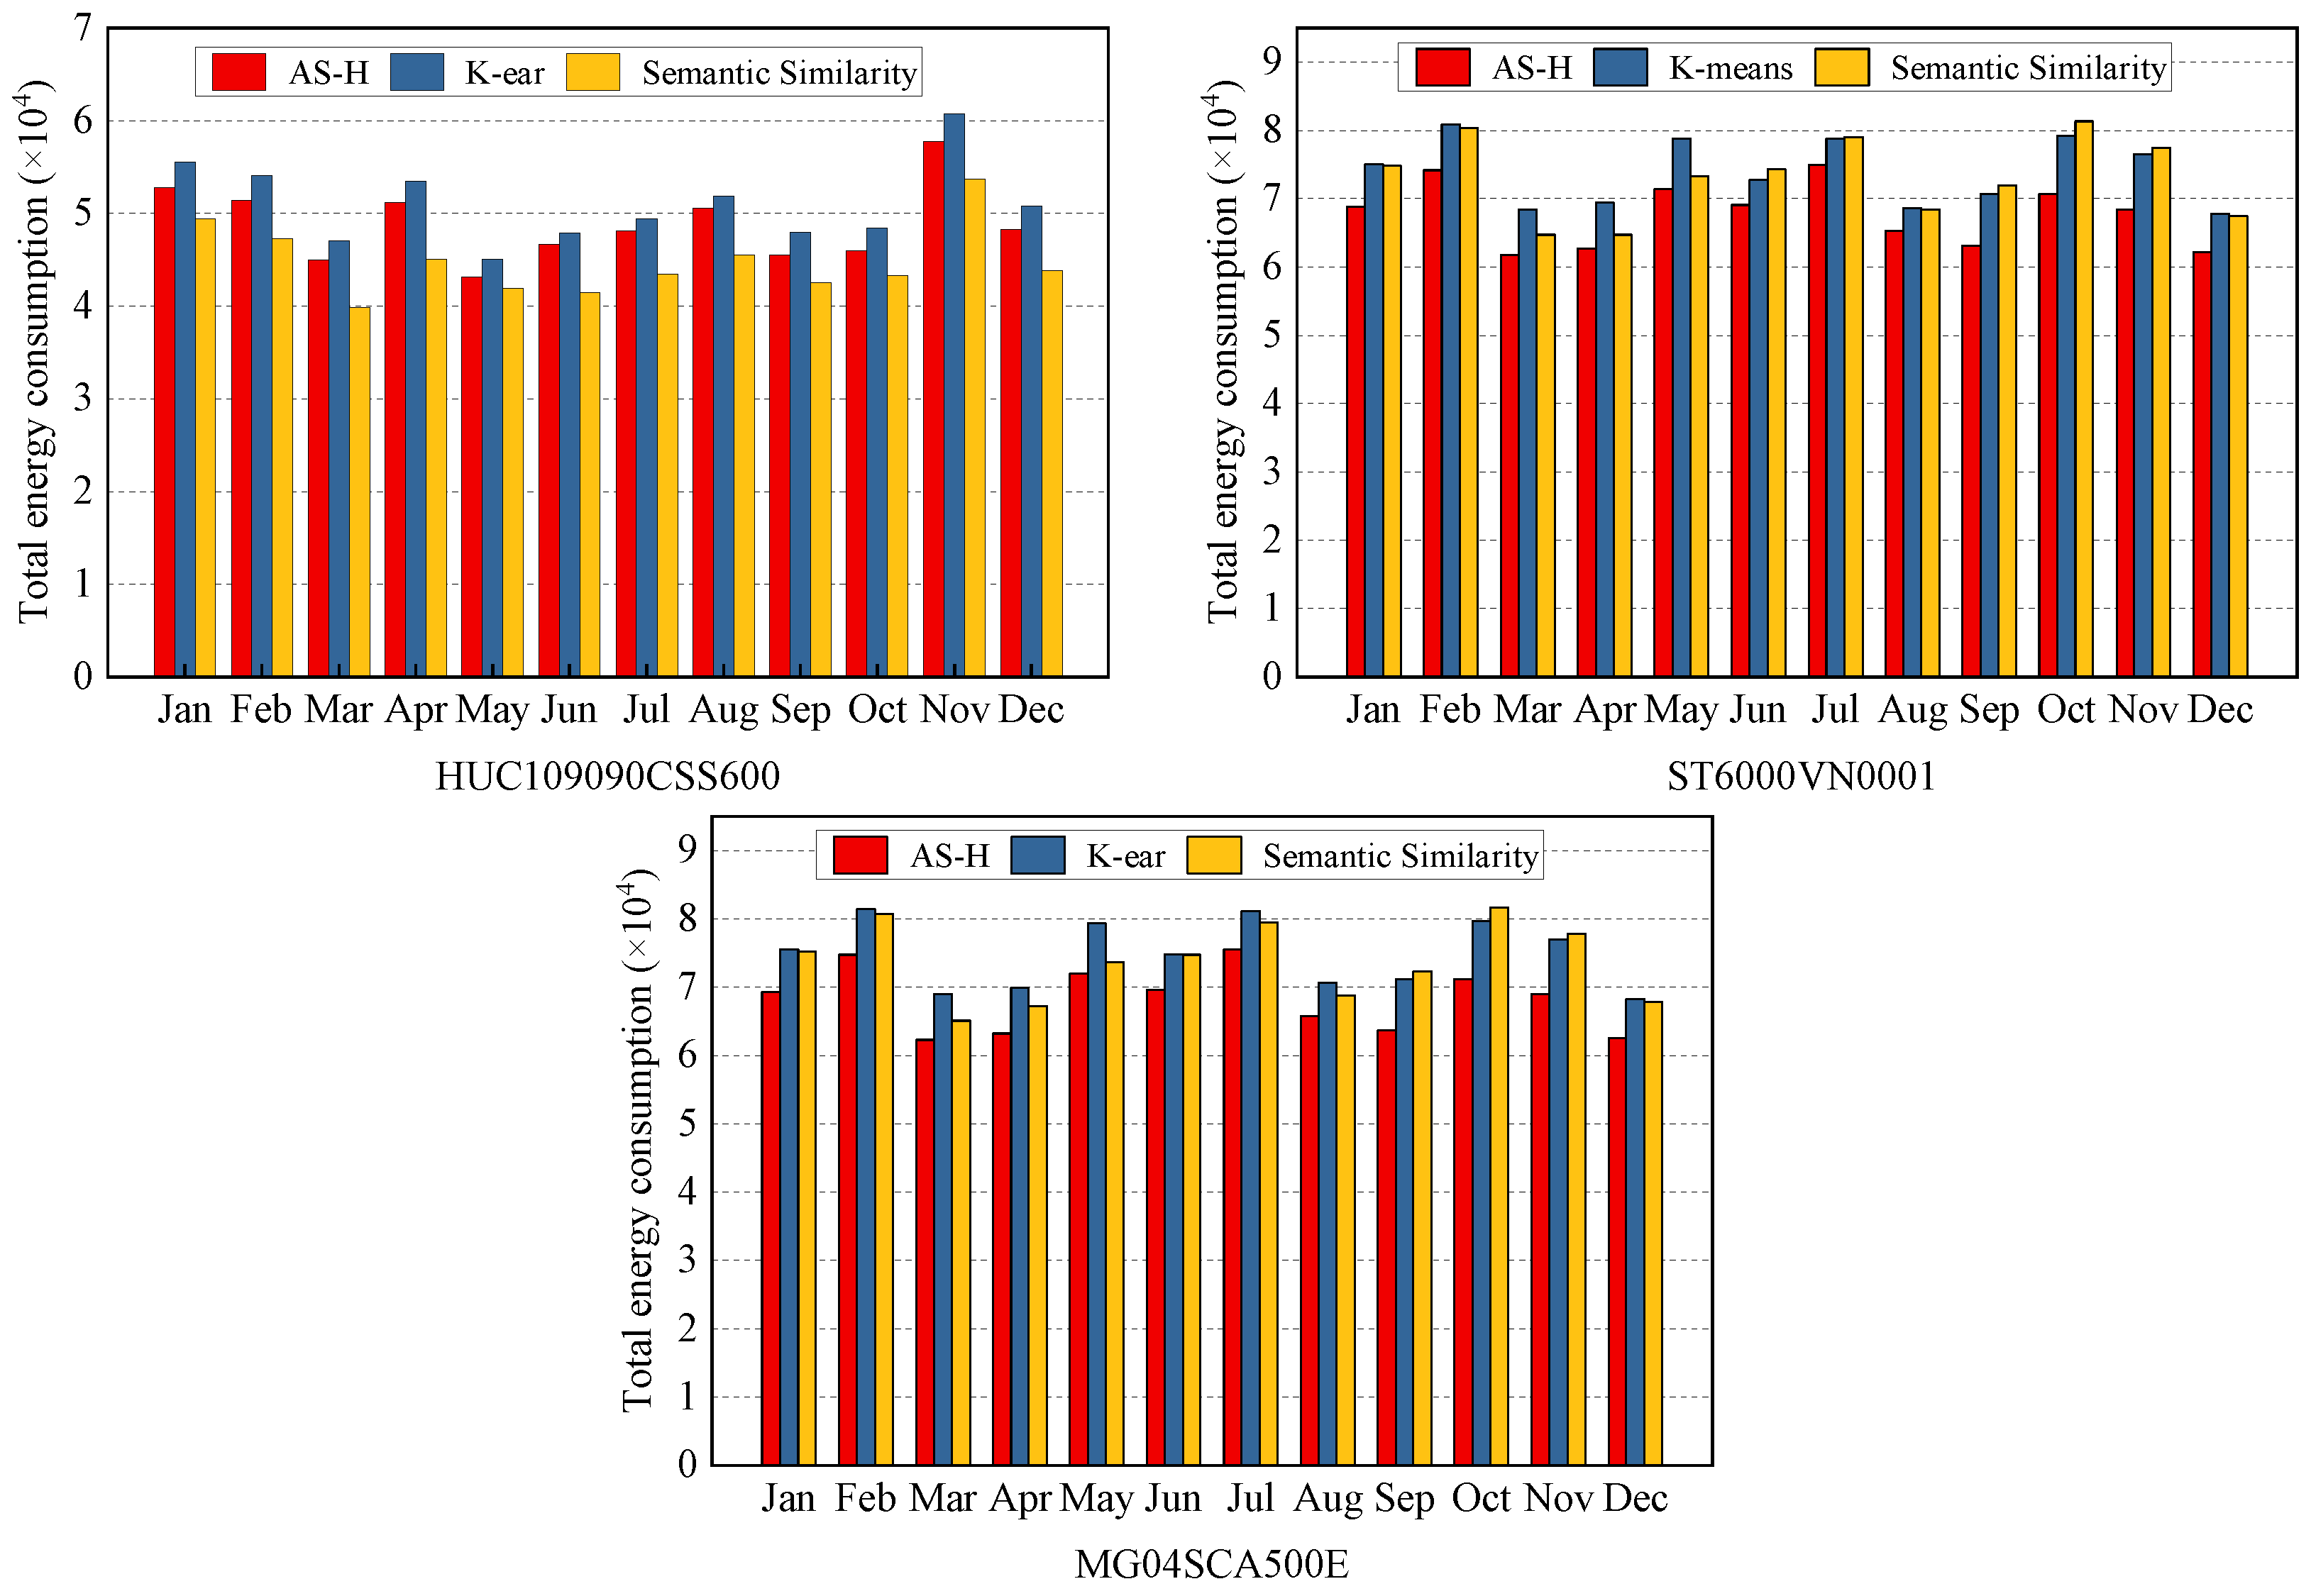
5.2.2. Comparison across Multiple Disk Models
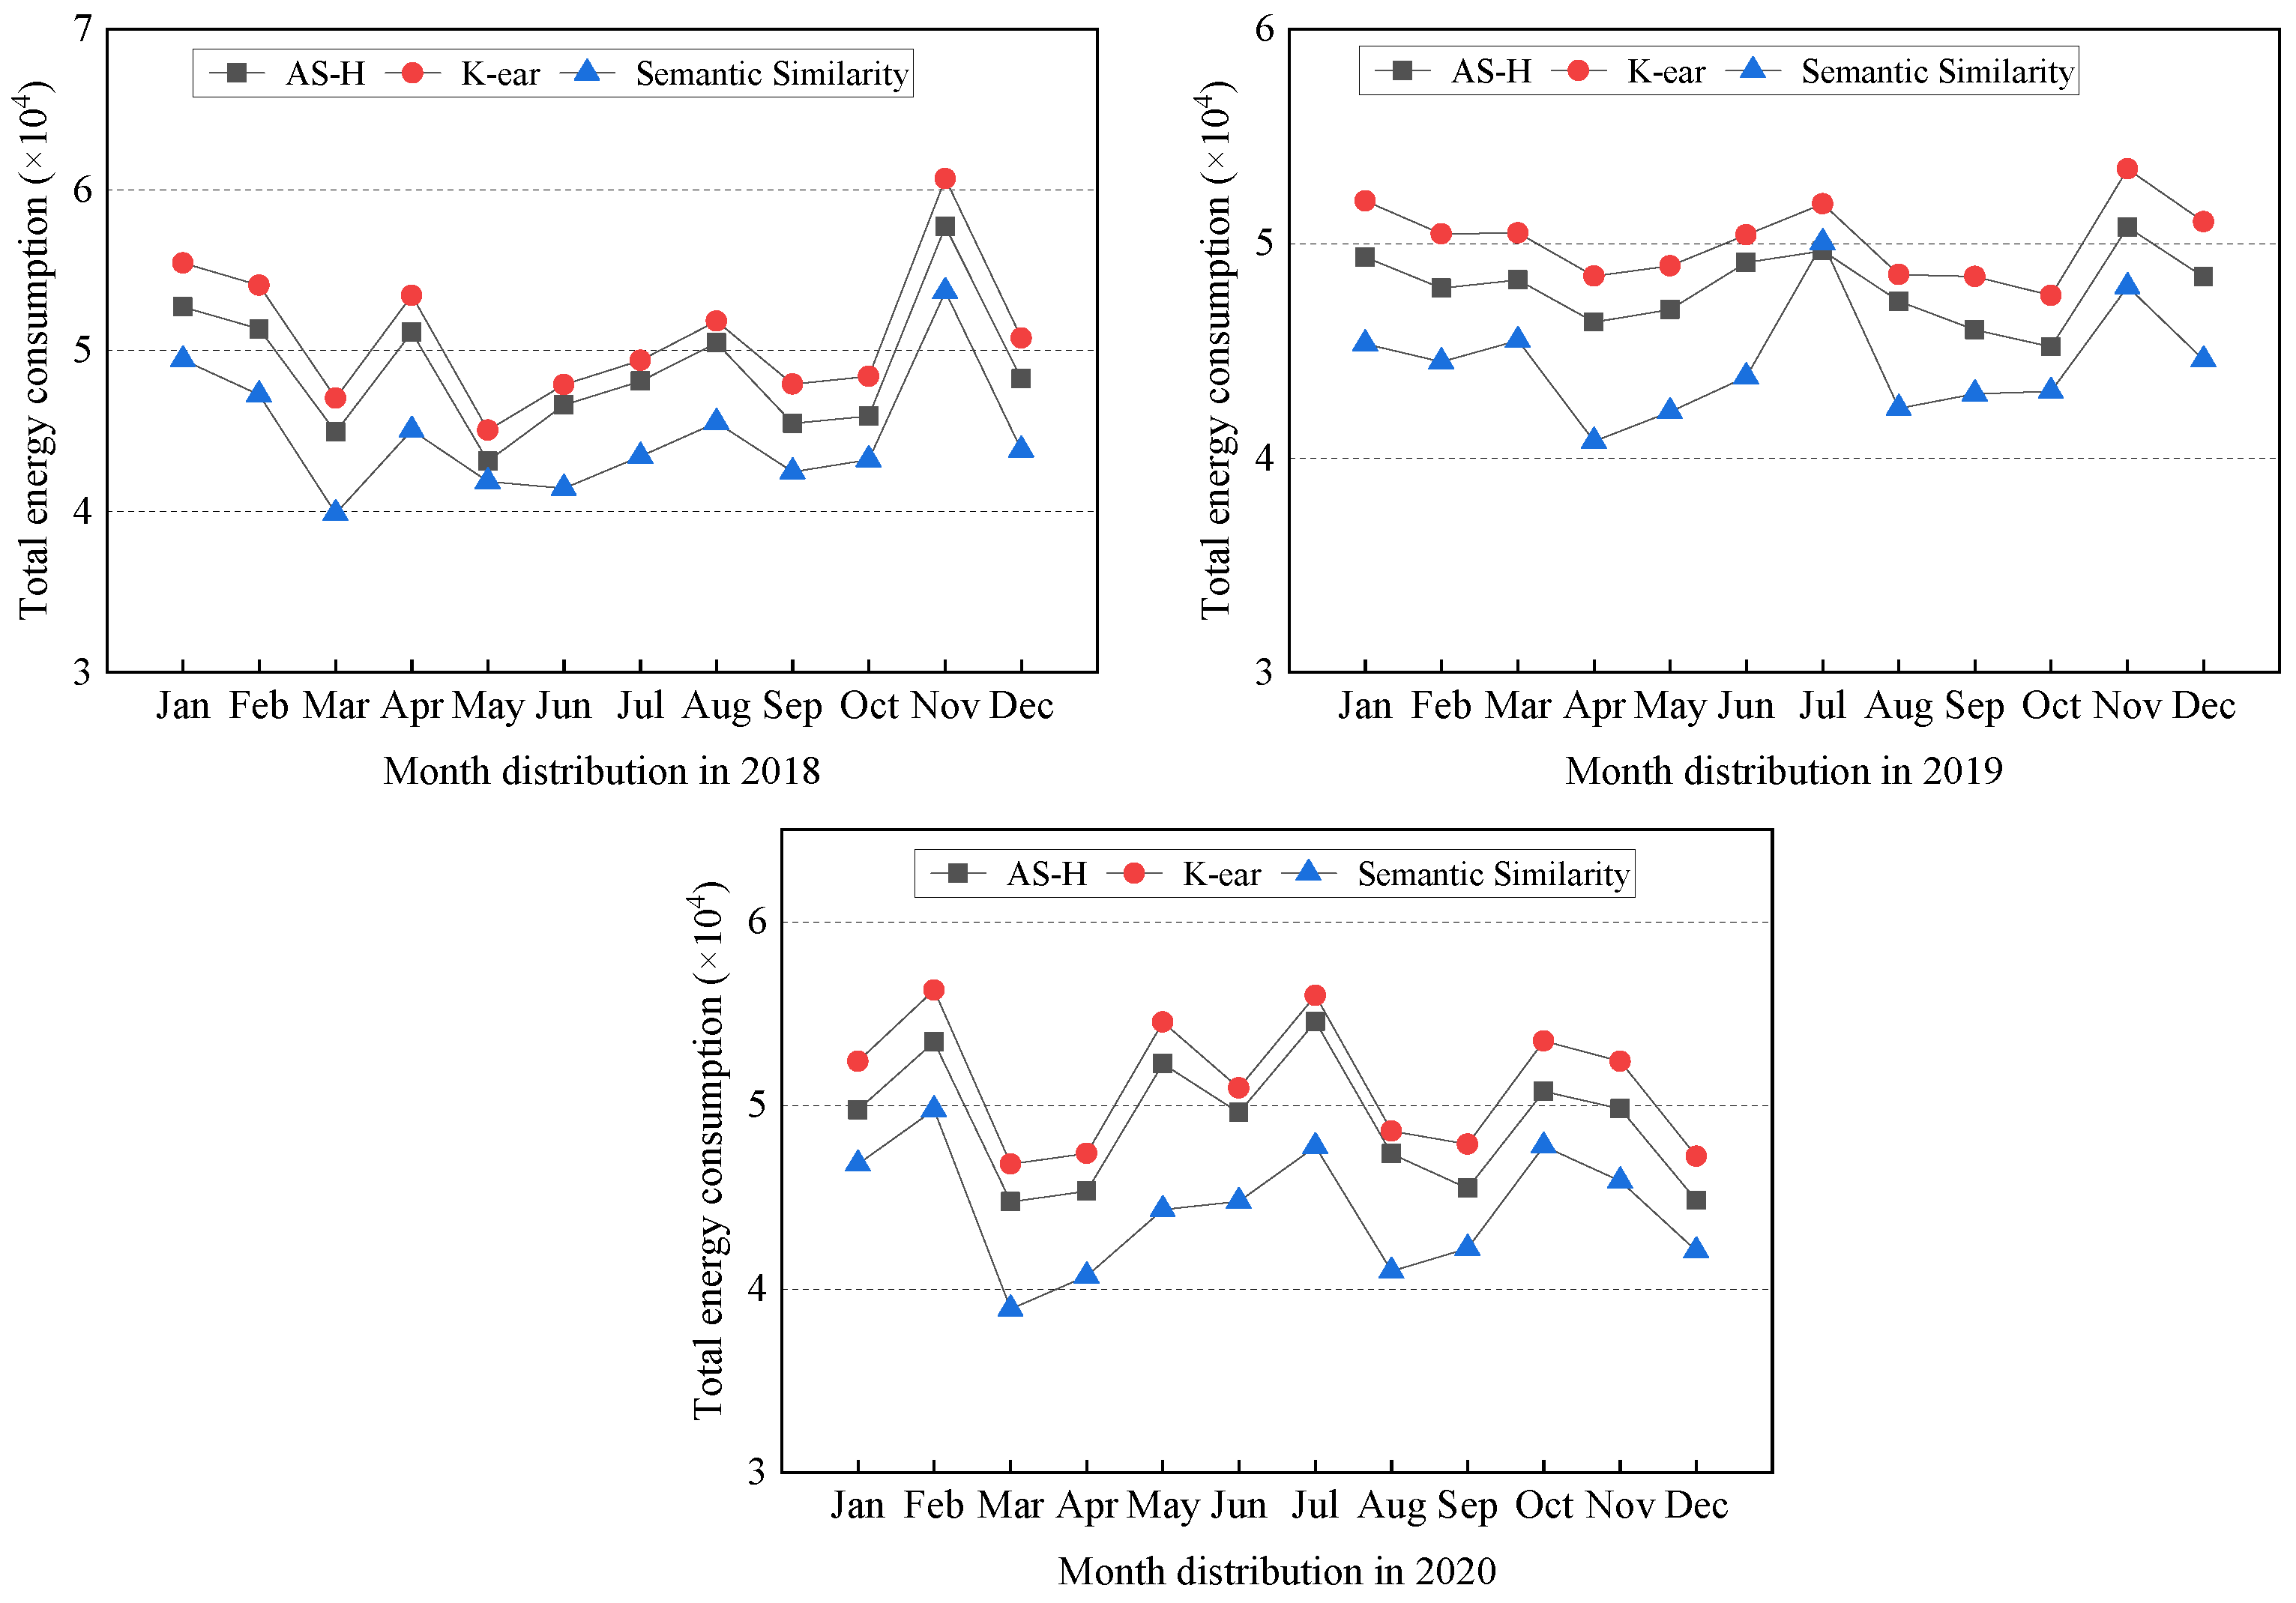
To emphasize the benefits of the semantic similarity method, we expand our analysis to different disk models. The energy consumption of these strategies on three different disk models in the year 2020 is shown in Figure 6. Notably, the semantic similarity approach maintains its advantageous position under the HUC109090CSS600 disk model, while presenting an unstable trend under the other two disk models. It can be seen that the selection of disk models has a certain impact on the energy consumption reduction effect of data classification storage schemes. Through analysis, we find that the average rotation latency is a crucial parameter affecting energy consumption simulation. Compared with HUC109090CSS600, the other two models have a significant gap in average rotation delay parameters, even up to twice. This plays a crucial role in the increase in energy consumption. In other words, the negative impact of the average rotation latency offsets the positive benefits brought by the classification storage scheme.
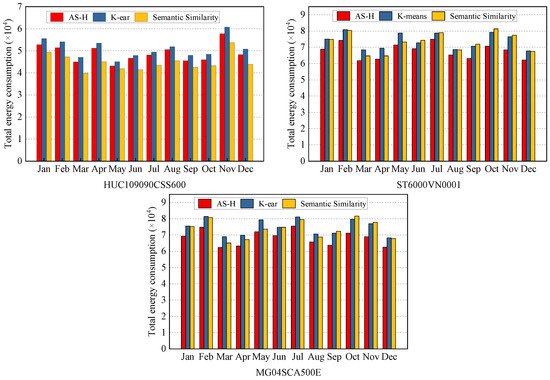
Figure 6.
Total energy consumption of different disk models. The energy consumption of the semantic similarity method is always lower than that of K-ear. AS-H is greatly affected by disk performance.
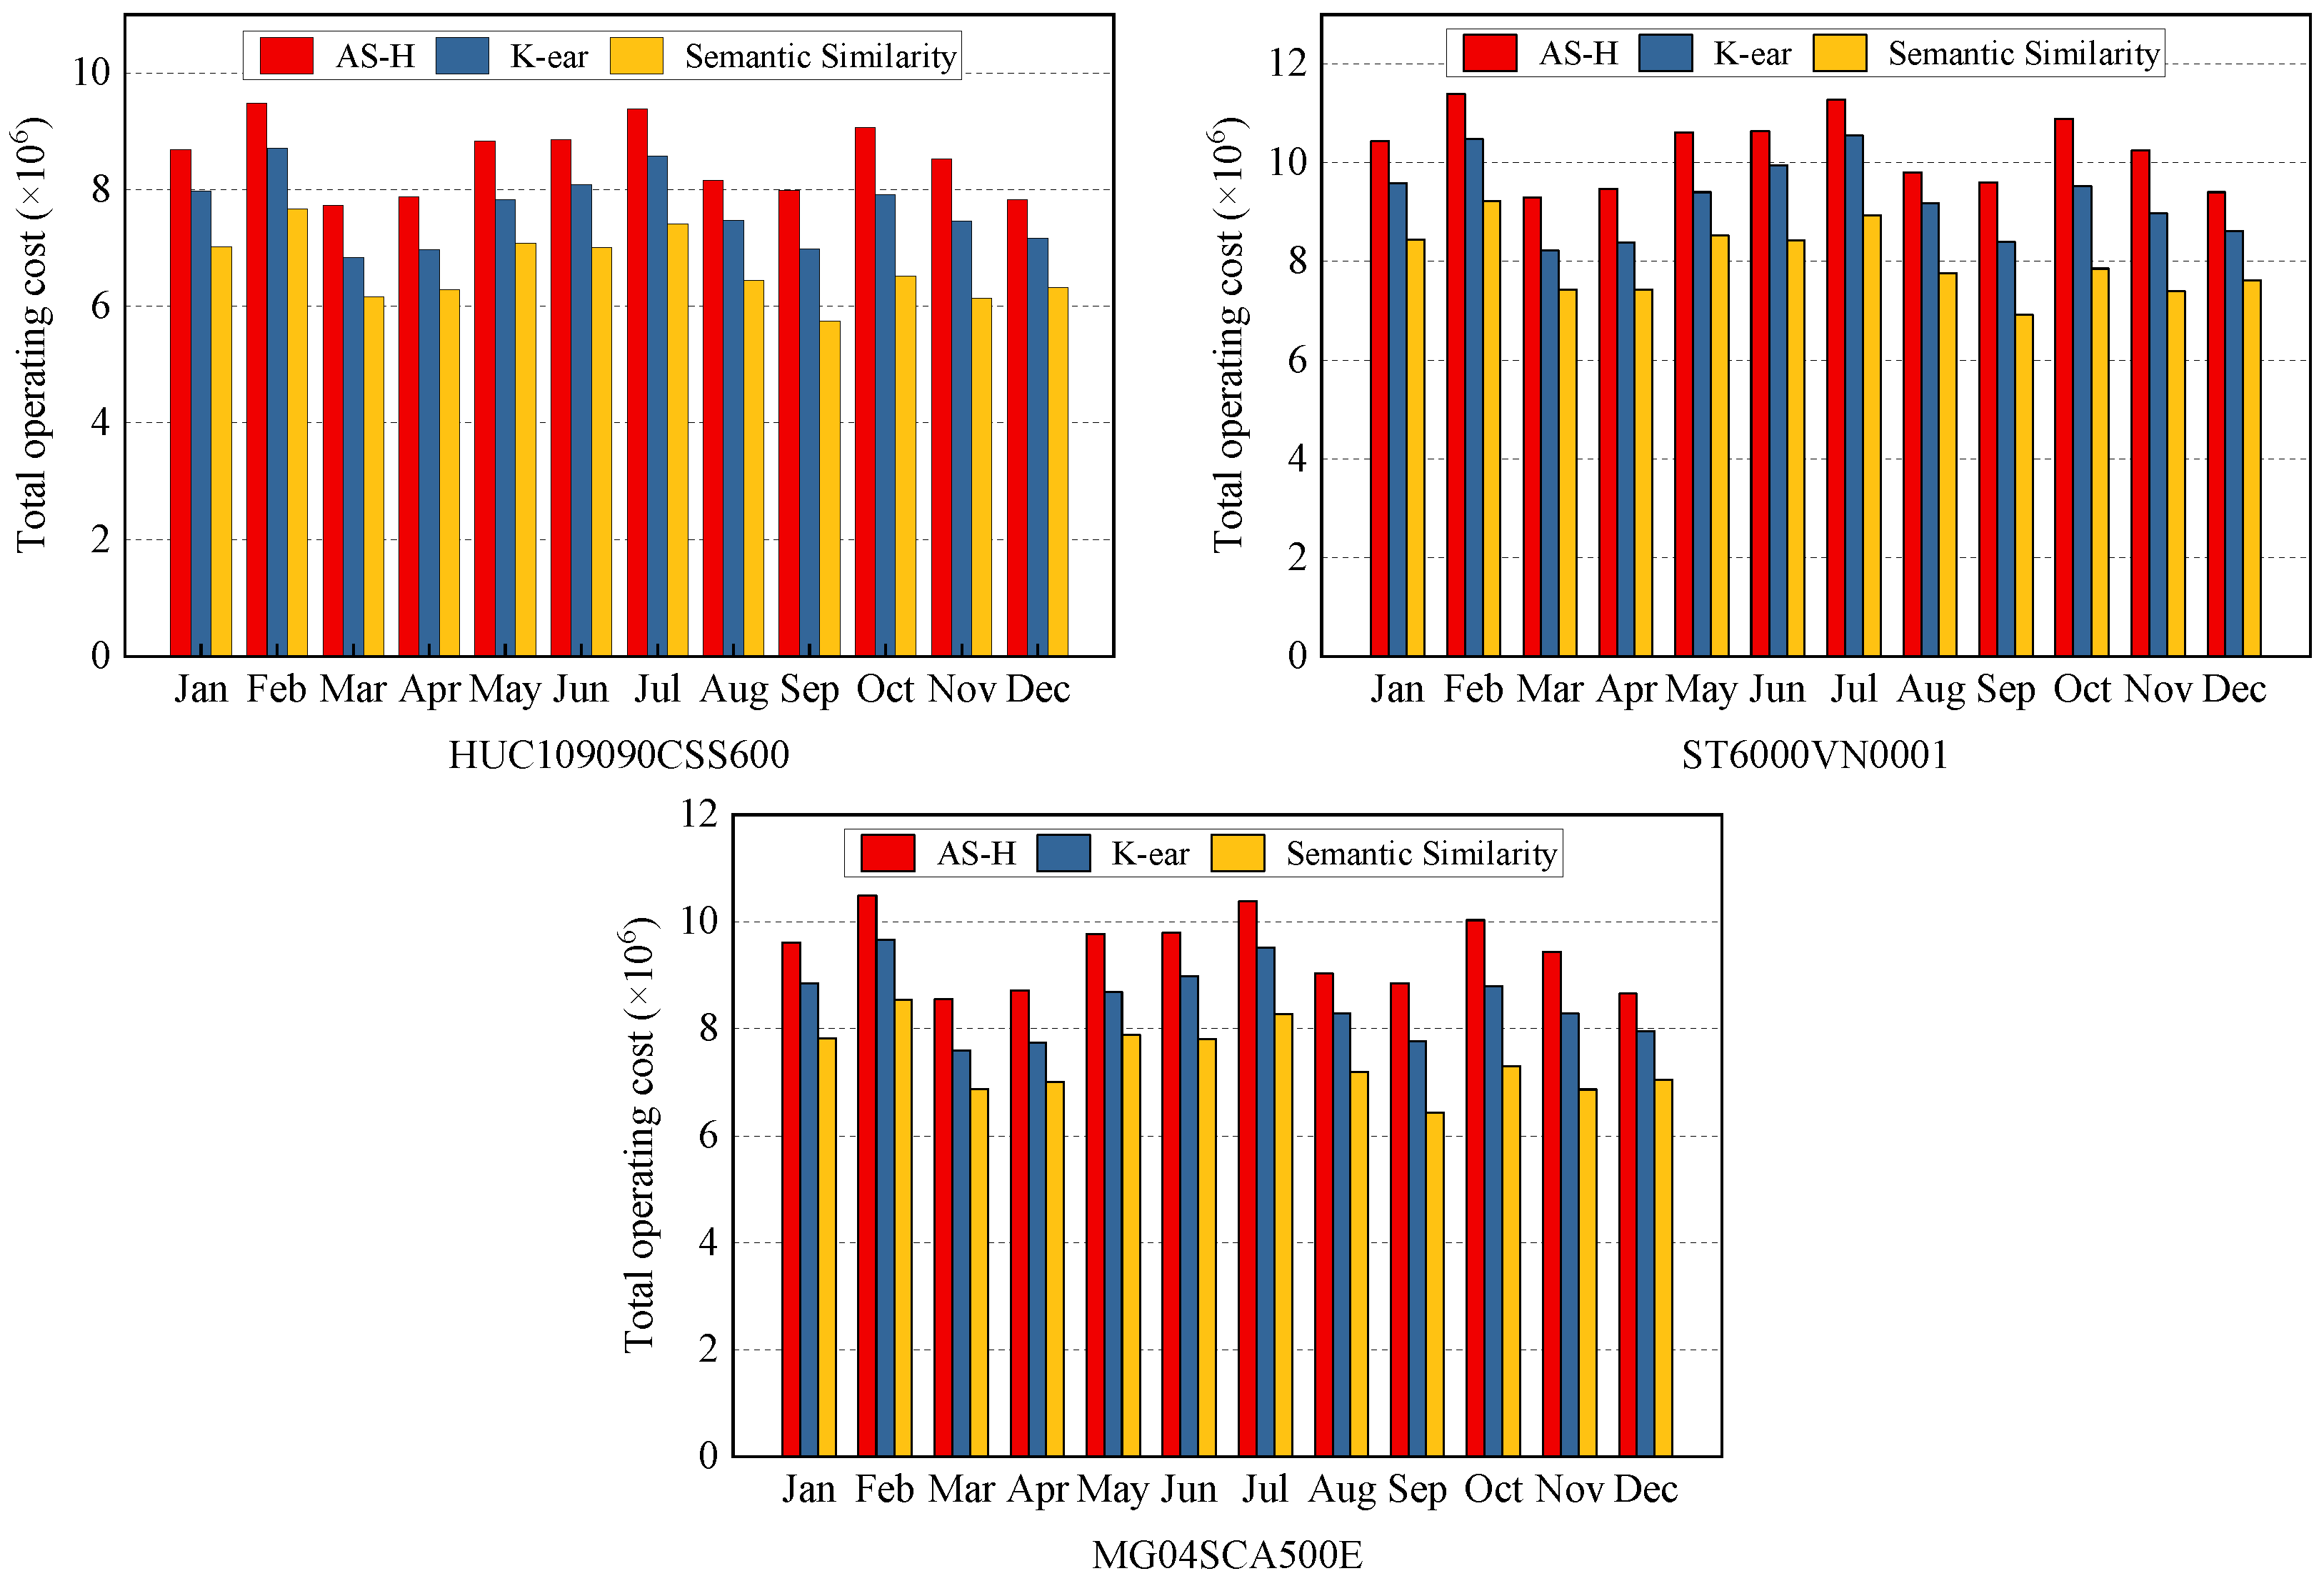
The comparison of total operating costs of different disk models is presented in Figure 7. Remarkably, regardless of the specific disk model, the total operating cost of AS-H is always the highest, while the semantic similarity method consistently registers the lowest. A detailed comparison reveals that, in comparison to AS-H and K-ear, the semantic similarity method achieves substantial operating cost savings in different disk models, ranging from 11.77% to 19.15%, 13.75% to 22.03%, and 12.78% to 21.42%, respectively. By analyzing the parameters of the three disk models, it can be found that compared to HUC109090CSS600, the other two models did not have a significant gap in data processing costs. This means that the negative impact of the increased costs is smaller than the positive benefits of data classification storage approaches.
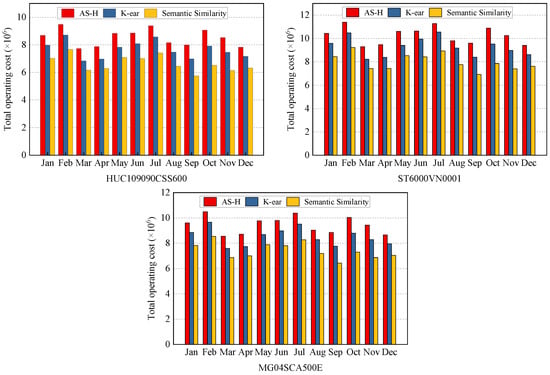
Figure 7.
Total operating cost of different disk models. For all disk models, the energy consumption of the semantic similarity method is always lower than those of AS-H and K-ear. AS-H has the highest operating cost.
In the thorough analysis of overall energy consumption and total operating expenses, we can obtain two key conclusions. Firstly, the semantic similarity method consistently outperforms the other two strategies across different periods, highlighting its edge in overall power consumption and operating cost. Secondly, while the superior performance in energy consumption may exhibit some variability under different disk models, the semantic similarity method consistently maintains stability in terms of operating cost. In implementing the semantic similarity approach, it is necessary to pair it with high-performance disks to fully leverage its advantages. Otherwise, the benefits brought by data classification approaches may be masked by the negative impact of the disk.
6. Conclusions
In this paper, we introduce an innovative approach to data classification storage by leveraging text semantic similarity to extract seasonal features effectively. By incorporating text semantic similarity, our proposed method aims to enhance the precision and relevance of seasonal feature extraction in the context of data classification. Our method employs a two-layer strategy to fully exploit the seasonal characteristics embedded in textual data. Furthermore, we introduce a data classification storage framework that is specifically designed around these seasonal features. The introduced data classification storage framework, tailored to leverage seasonal features, reflects our commitment to optimizing storage solutions for diverse datasets. Our experimental results affirm the cost-effectiveness of our approach, demonstrating its potential to efficiently store and categorize data while minimizing operational expenses. In conclusion, our proposed method not only advances the field of data classification storage but also provides a practical and effective solution for handling seasonal features in textual data. The demonstrated cost-effectiveness positions our approach as a promising avenue for organizations seeking efficient and economically viable solutions for data management and storage.
As a future research direction, we will continuously investigate mining data features from multiple perspectives to optimize data classification storage.
Author Contributions
Conceptualization, Z.Y. and X.Y.; methodology, Z.Y., Y.G., B.L. and H.Y.; validation, B.L., H.Y. and X.Y.; formal analysis, X.L.; writing—original draft preparation, Z.Y.; writing—review and editing, Y.G., X.L. and X.Y.; supervision, X.L. and X.Y.; project administration, X.L. and X.Y.; funding acquisition, X.L. and X.Y. All authors have read and agreed to the published version of the manuscript.
Funding
This work is supported by the National Natural Science Foundation of China under Grants No. 62171043 and 62362057, the Natural Science Foundation of Beijing under Grant No. 4212020, the Application Platform of Graph Neural Network and Data Mining under Grants No. 2022-ZJ-T02, and the Beijing Advanced Innovation Center for Future Blockchain and Privacy Computing. Xindong You is the corresponding author of this paper.
Institutional Review Board Statement
Not applicable.
Informed Consent Statement
Not applicable.
Data Availability Statement
Data sharing not applicable due to confidentiality restrictions.
Conflicts of Interest
The authors have no competing interests to declare that are relevant to the content of this article.
References
- Dobre, D.; Viotti, P.; Vukolić, M. Hybris: Robust hybrid cloud storage. In Proceedings of the ACM Symposium on Cloud Computing, Seattle, WA, USA, 3–5 November 2014; pp. 1–14. [Google Scholar]
- Niu, J.; Xu, J.; Xie, L. Hybrid storage systems: A survey of architectures and algorithms. IEEE Access 2018, 6, 13385–13406. [Google Scholar] [CrossRef]
- Wang, S.; Lu, Z.; Cao, Q.; Jiang, H.; Yao, J.; Dong, Y.; Yang, P.; Xie, C. Exploration and Exploitation for Buffer-Controlled HDD-Writes for SSD-HDD Hybrid Storage Server. ACM Trans. Storage (TOS) 2022, 18, 1–29. [Google Scholar] [CrossRef]
- Yuan, Z.; Lv, X.; Xie, P.; Ge, H.; You, X. CSEA: A Fine-Grained Framework of Climate-Season-Based Energy-Aware in Cloud Storage Systems. Comput. J. 2022. [Google Scholar] [CrossRef]
- Singh, G.; Nadig, R.; Park, J.; Bera, R.; Hajinazar, N.; Novo, D.; Gómez-Luna, J.; Stuijk, S.; Corporaal, H.; Mutlu, O. Sibyl: Adaptive and extensible data placement in hybrid storage systems using online reinforcement learning. In Proceedings of the 49th Annual International Symposium on Computer Architecture, New York, NY, USA, 18–22 June 2022; pp. 320–336. [Google Scholar]
- Arora, S.; Bala, A. An intelligent energy efficient storage system for cloud based big data applications. Simul. Model. Pract. Theory 2021, 108, 102260. [Google Scholar] [CrossRef]
- Hsieh, J.W.; Kuo, T.W.; Chang, L.P. Efficient identification of hot data for flash memory storage systems. ACM Trans. Storage (TOS) 2006, 2, 22–40. [Google Scholar] [CrossRef]
- Park, D.; Du, D.H.C. Hot data identification for flash-based storage systems using multiple bloom filters. In Proceedings of the 2011 IEEE 27th Symposium on Mass Storage Systems and Technologies (MSST), Denver, CO, USA, 23–27 May 2011; pp. 1–11. [Google Scholar]
- Lee, Y.; Kim, Y.; Yeom, H.Y. Lightweight memory tracing for hot data identification. Clust. Comput. 2020, 23, 2273–2285. [Google Scholar] [CrossRef]
- Yao, Y.; Bao, J.; Kong, X.; Gu, N.; Xu, X. B2L: A hot data identification algorithm by fusing bloom filter and temporal locality for NAND flash based solid-state drives. Microprocess. Microsyst. 2021, 84, 104266. [Google Scholar] [CrossRef]
- Xie, T. Sea: A striping-based energy-aware strategy for data placement in raid-structured storage systems. IEEE Trans. Comput. 2008, 57, 748–761. [Google Scholar]
- Boissier, M.; Schlosser, R.; Uflacker, M. Hybrid data layouts for tiered HTAP databases with pareto-optimal data placements. In Proceedings of the 2018 IEEE 34th International Conference on Data Engineering (ICDE), Paris, France, 16–19 April 2018; pp. 209–220. [Google Scholar]
- Hoseinzadeh, M. A survey on tiering and caching in high-performance storage systems. arXiv 2019, arXiv:1904.11560. [Google Scholar]
- Liu, Y.; Wang, H.; Zhou, K.; Li, C.; Wu, R. A survey on AI for storage. CCF Trans. High Perform. Comput. 2022, 4, 233–264. [Google Scholar] [CrossRef]
- Xie, X.; Xiao, L.; Du, D.H.C. Zonetier: A zone-based storage tiering and caching co-design to integrate ssds with smr drives. ACM Trans. Storage (TOS) 2019, 15, 1–25. [Google Scholar] [CrossRef]
- Chiu, K.H.T.; Wang, J.M.; Abdelmoniem, A.M.; Bensaou, B. A two-tiered caching scheme for information-centric networks. In Proceedings of the 2021 IEEE 22nd International Conference on High Performance Switching and Routing (HPSR), Paris, France, 7–10 June 2021; pp. 1–6. [Google Scholar]
- You, X.; Lv, X.; Zhao, Z.; Han, J.; Ren, X. A survey and taxonomy on energy-aware data management strategies in cloud environment. IEEE Access 2020, 8, 94279–94293. [Google Scholar] [CrossRef]
- Geetha, B.T.; Kumar, P.S.; Bama, B.S.; Neelakandan, S.; Dutta, C.; Babu, D.V. Green energy aware and cluster based communication for future load prediction in IoT. Sustain. Energy Technol. Assess. 2022, 52, 102244. [Google Scholar] [CrossRef]
- DelValle, R.; Kaushik, P.; Jain, A.; Hartog, J.; Govindaraju, M. Exploiting Efficiency Opportunities Based on Workloads with Electron on Heterogeneous Clusters. In Proceedings of the 10th International Conference on Utility and Cloud Computing, Austin, TX, USA, 5–8 December 2017; pp. 67–77. [Google Scholar]
- Kaushik, R.T.; Cherkasova, L.; Campbell, R.; Nahrstedt, K. Lightning: Self-adaptive, energy-conserving, multi-zoned, commodity green cloud storage system. In Proceedings of the 19th ACM International Symposium on High Performance Distributed Computing, Chicago, IL, USA, 21–25 June 2010; pp. 332–335. [Google Scholar]
- Liao, B.; Yu, J.; Zhang, T.; Binglei, G.; Hua, S.; Ying, C. Energy-efficient algorithms for distributed storage system based on block storage structure reconfiguration. J. Netw. Comput. Appl. 2015, 48, 71–86. [Google Scholar] [CrossRef]
- Zhang, T.; Li, F. Energy-efficient algorithm based on data classification for cloud storage system. J. Comput. Appl. 2014, 34, 2267. [Google Scholar]
- You, X.; Sun, T.; Sun, D.; Liu, X.; Lv, X.; Buyya, R. K-ear: Extracting data access periodic characteristics for energy-aware data clustering and storing in cloud storage systems. Concurr. Comput. Pract. Exp. 2021, 33, e6096. [Google Scholar] [CrossRef]
- Baidu Index. Available online: https://index.baidu.com// (accessed on 29 January 2024).
- Luo, Q.; Cheung, R.C.C.; Sun, Y. Dynamic virtual page-based flash translation layer with novel hot data identification and adaptive parallelism management. IEEE Access 2018, 6, 56200–56213. [Google Scholar] [CrossRef]
- Rahutomo, F.; Kitasuka, T.; Aritsugi, M. Semantic cosine similarity. In Proceedings of the 7th International Student Conference on Advanced Science and Technology ICAST, Bahir Dar, Ethiopia, 2–4 October 2012; Voume 4, p. 1. [Google Scholar]
- Chandrasekaran, D.; Mago, V. Evolution of semantic similarity—A survey. ACM Comput. Surv. (CSUR) 2021, 54, 1–37. [Google Scholar] [CrossRef]
- Calheiros, R.N.; Ranjan, R.; Beloglazov, A.; De Rose, C.A.; Buyya, R. CloudSim: A toolkit for modeling and simulation of cloud computing environments and evaluation of resource provisioning algorithms. Softw. Pract. Exp. 2011, 41, 23–50. [Google Scholar] [CrossRef]
- Louis, B.; Mitra, K.; Saguna, S.; Åhlund, C. Cloudsimdisk: Energy-aware storage simulation in cloudsim. In Proceedings of the 2015 IEEE/ACM 8th International Conference on Utility and Cloud Computing (UCC), Limassol, Cyprus, 7–10 December 2015; pp. 11–15. [Google Scholar]
- Storage Review Enterprise Lab—Enterprise Reviews. Available online: https://www.storagereview.com/enterprise (accessed on 29 January 2024).
- Yang, Y.; Zhu, J. Write skew and zipf distribution: Evidence and implications. ACM Trans. Storage (TOS) 2016, 12, 1–19. [Google Scholar] [CrossRef]
- Ma, J. Overview and Empirical Research on File Correlation in Cloud Storage. Procedia Comput. Sci. 2021, 188, 33–39. [Google Scholar] [CrossRef]

Disclaimer/Publisher’s Note: The statements, opinions and data contained in all publications are solely those of the individual author(s) and contributor(s) and not of MDPI and/or the editor(s). MDPI and/or the editor(s) disclaim responsibility for any injury to people or property resulting from any ideas, methods, instructions or products referred to in the content. |
© 2024 by the authors. Licensee MDPI, Basel, Switzerland. This article is an open access article distributed under the terms and conditions of the Creative Commons Attribution (CC BY) license (https://creativecommons.org/licenses/by/4.0/).