Article

Fatigue Damage Evaluation of Aviation Aluminum Alloy Based on Strain Monitoring

1
Key Laboratory of Non-Destructive Testing Ministry of Education, Nanchang Hangkong University, Nanchang 330063, China
2
Institute of Acoustics, Chinese Academy of Sciences, Beijing 100190, China
*
Author to whom correspondence should be addressed.
Appl. Sci. 2024, 14(3), 1184; https://doi.org/10.3390/app14031184
Submission received: 19 December 2023 / Revised: 25 January 2024 / Accepted: 28 January 2024 / Published: 31 January 2024

Abstract

:
A metal fatigue damage model is established in this study by employing real-time strain monitoring to evaluate the damage state of metal materials. The fatigue life simulation, based on crystal plasticity finite element analysis, establishes the constitutive relationship between strain and damage before microcrack initiation in the low-cycle fatigue state of aerospace aluminum alloy. Subsequently, a comprehensive analysis of the strain–damage relationship is conducted under various stress conditions. Electron backscattering diffraction analysis (EBSD) is used to examine the fatigue damage state of the grooved specimen before initiating fatigue cracks at various stages. This analysis validates the metal fatigue damage model proposed in this paper and is based on strain monitoring, contributing to the enhanced confirmation of the model’s accuracy.

1. Introduction

Extensive research has been conducted on fatigue in the past century, driven by its significant threat in terms of structural damage. Statistical evidence suggests that fatigue damage is responsible for at least half of all mechanical failures [1,2]. Aluminum alloy, known for its strength, high specific stiffness, and ease of formability, is extensively used in critical structures of aviation and aerospace products. Aluminum alloys used in the aerospace industry are primarily classified into two categories: 2XXX and 7XXX. The 7XXX aluminum alloys are particularly important in engineering and are applied in fighter aircraft, launch vehicles, long-range missiles, and defense industry operations that involve demanding, complex, and severe working conditions [3]. These alloys are chosen for their high strength, toughness, good stress corrosion resistance, hot forming properties, and welding capabilities. They are extensively utilized in various aerospace components, including the upper wing, engine, tailplane front and rear beams, web, rib webs, and other parts [4,5]. Consequently, investigating fatigue damage in aluminum alloy holds paramount significance.
Early studies of fatigue failure focused on developing laboratory testing techniques and quantifying the number of failures under different fatigue loading conditions to understand fatigue life. However, these studies paid little attention to the microscopic origins of fatigue failure. In 1903, James Alfred Ewing and Humfrey [6] conducted a comprehensive investigation into fatigue mechanisms in metals, revealing that fatigue damage occurs due to the accumulation of minuscule irreversible plastic cyclic microstrains on metal surfaces. Building upon this, Coffin and Manson [7,8] proposed that the fatigue life is determined by the plastic strain amplitude. Currently, cyclic microplasticity mechanisms, based on dislocation slip, are considered the primary cause of fatigue failure. Another dislocation mechanism involving extrusion and intrusion was suggested by C. Laird [9]. HAEL Mughrabi [10] suggests that fatigue damage usually arises from the irreversibility of cyclic slip on surfaces, leading to the formation of microcracks at localized stress concentrations, which can then propagate into the bulk.
Throughout the fatigue phase, the majority of the overall fatigue life is comprised of early fatigue damage. This includes initial cyclic deformation and damage, as well as crack nucleation and microcrack propagation, which involves the growth and interconnection of microcracks. As a result, research primarily focuses on early fatigue. Currently, the investigation of early fatigue damage is categorized into models based on image-only theory, models based on crystal plasticity theory, and models based on molecular dynamics theory [11,12,13,14,15]. However, macroscopic image-only ontological models, which assume continuity and homogeneity, typically overlook the impact of microstructural factors when studying the mechanical behavior of materials. These models have certain limitations when it comes to mechanical issues related to the fine structure of materials, such as damage evolution, crack nucleation, and small crack extension. In contrast to intrinsic models at macroscopic and fine scales, microscale-based modeling involves molecular dynamics and discrete dislocation dynamics exhibits features at both temporal and spatial scales that cannot be compared to conventional experiments [14,15,16].
Realizing the correlation between fine-scale deformation mechanisms and macroscopic mechanical behavior is crucial in the field of crystal plasticity mechanics, particularly in the study of fatigue in polycrystalline alloys [17,18,19,20,21,22,23,24,25,26]. For instance, Takayuki Shiraiwa [17] incorporated computed local plastic strain into the quasi-measurement of crack initiation to predict the fatigue life of 7075 aluminum alloy. Sun [21] investigated the influence of grain orientation and hardened particles on the fatigue performance of friction stir welded (FSW) joints in aluminum alloys. In these studies [18,19,20,23,24,25], the prediction of metal fatigue life primarily involved exploring new fatigue indicating factors (FIPS). FIPS is a fatigue life prediction method based on crystal plasticity finite elements, which attributes the plastic deformation of crystalline materials to the slip of dislocations on the slip surface. Unlike macroscopic finite element analysis, the FIP analysis method closely reflects the actual situation and can reveal the fatigue failure mechanism from a microscopic perspective.
However, there is limited research on the online monitoring of fatigue damage, with most studies being theoretical. In the field of acoustic NDT, Saju T. Abraham [27] monitored fatigue crack extension by diffraction of elastic waves at the crack tip and compared it with the conventional DC potential drop method. T. Vie [28] analyzed the acoustic emission signals during tension and fatigue of 7075-T6 aluminum alloy with various coating combinations to assess the damage and its mechanisms during fatigue testing. Mohammad I [29] introduced a novel patch antenna sensor that monitors crack extension and opening by observing the resonant frequency shift of the antenna, enhancing the sensitivity of crack growth monitoring with sub-millimeter resolution. Vivek Kumar [30] developed a model for damage detection, localization, and quantification based on a sensing chip. Strain data from the peaks in the slope are used for crack identification, and localization algorithms are developed based on different orders of magnitude of strain. X Kong [31] introduced a large-area strain sensing technique using a soft elastomer capacitor (SEC) to monitor plastic deformation and large crack openings in low circumferential fatigue cracks. Jarkko Tikka [32] utilized strain gauges to create an automated Structural Health Monitoring System (SHMS) for monitoring specific segments of a contemporary military aircraft’s structure. In a study evaluating fatigue damage in relation to strain, S. Vebkatachalam et al. [33] characterized the fatigue damage evolution of CFPR using DIC and infrared thermography, among other methods. The experimental results indicated that fatigue damage parameters characterized by local transverse strains could predict changes in fatigue life for unnotched samples, with more accurate predictions for tensile and compressive fatigue. In a study conducted by Qianni Fu [34], the crack extension process of aluminum alloy materials was investigated. The study established a relationship between local strain and crack length, and characterized fatigue crack extension based on local strain. Additionally, an inverse data algorithm was used for pattern recognition of crack length, and the particle filtering algorithm was employed for fatigue life prediction. The crack-monitoring algorithm proposed in this study is capable of detecting crack extensions at the millimeter level and exhibits a robust crack extension index. Previous research on fatigue damage has primarily focused on macroscopic cracks, with fewer studies on online monitoring of early fatigue damage. Therefore, this paper aims to investigate the relationship between fatigue damage and strain in the early stage of metal.
This study utilizes crystal plastic finite element (CPFEM) to simulate the low-cycle fatigue behavior of 7075-T6 aluminum alloy. The predicted fatigue life is analyzed using two different fatigue indicator factors (FIP), and the surface strain changes of the specimen are compared with the results from monitored fatigue experiments. Furthermore, fatigue surface damage is analyzed using EBSD. The objective of this study is to establish a strain-based model for early monitoring of metal fatigue damage, in order to provide early warning. The accuracy of the model is experimentally verified.

2. Crystal Plasticity Modeling and Numerical Implementation

2.1. Theory of Crystal Plasticity

The kinematic theory of the classical crystal plasticity model follows the pioneering work of Taylor, whose exact mathematical theoretical model was successively developed by Hill and Rice (1972) [35], Asaro and Rice (1977) [36], Peirce and Asaro (1983) [37], Needleman and Asaro (1985) [38], and others. The total deformation gradient tensor of a crystal, F , can be decomposed into two parts, the elastic deformation gradient, F * , and the plastic deformation gradient, F p , viz:
F = F * F p
We define the plastic part L p of the velocity tensor deformation tensor as follows:
L p = F p ( F p ) 1 = α = 1 n γ ˙ α s α m α
where s α and m α refer to the direction of shear slip and normal to the slip plane in the reference configuration, respectively. n is the number of slip systems of the corresponding grain. γ ˙ α denotes the slip shear rate on the αth slip system and is summed over all activated slip systems.
The elastic strain is defined as the Green–Lagrange strain tensor E e :
E e = 1 2 [ F * T F * I ]
where I is a second-order constant tensor. The second type of Piola–Kirchhoff stress S is related to E e by the following:
S = C e E e
where C e is the fourth-order elastic constant tensor. The decomposed shear stress on the slip surface α is then derived from the following:
τ α = S : ( s α m α )
Cauchy stress is derived as follows:
σ = det ( F * ) 1 F * S F * T
The plastic shear rate of each slip regime obeys a power-law function of the resolved shear stress τ α [39]:
γ ˙ α = γ ˙ 0 s i g n ( τ α χ α ) ( τ α χ α g α ) n
where γ ˙ ( α ) is the reference shear strain rate, n is the rate sensitivity index related to the material properties, g α is the critical shear stress in the αth slip regime for isotropic hardening, and χ α is the back stress for kinematic hardening. When the material parameter n tends to , it is rate-independent [40].
The initial value of g α is denoted as the initial slip resistance g 0 , assuming uniformity across all slip systems. It is defined as follows:
g ˙ ( α ) = β h α β γ ˙ ( β )
where h α β is the sliding hardening modulus due to self-hardening and potential hardening, which is defined as follows:
h α β = q α β h ( γ )
where q α β is the self- and latent hardening ratio coefficient. When α β , h α β represents the latent hardening constant, and when α = β , h α α represents the self-hardening constant. Here, h ( γ ) is defined as follows:
h ( γ ) = h 0   sech 2 | h 0 γ τ s τ 0 |
where h 0 represents the initial hardening modulus, τ 0 represents the yield stress which equals the initial critical resolved shear stress, τ s represents the stress at the limit of g α , and γ represents the cumulative shear strain on all slip systems, which is calculated as follows:
γ = α 0 t | γ ˙ α | d t
To describe the ratcheting behavior of single crystals, a hardening criterion is introduced on each slip system. This criterion incorporates a nonlinear dynamic recovery term, building upon the classical Armstrong–Frederick [41] hardening with a modification of the dynamic recovery term. The modified hardening evolution law is as follows [42]:
χ ˙ α = c γ ˙ α b χ α | γ ˙ α |
b = b 0 + ( b s a t b 0 ) [ 1 e ( γ γ 0 ) ]
where c , b s a t , b 0 , and γ 0 are the material parameters. The introduction of the dynamic recovery term b χ α γ ˙ α allows the model to simulate the ratchet behavior of the material at the single crystal level.

2.2. Definition of FIPs

To investigate the impact of microstructure on fatigue crack formation, this study introduces a computable fatigue indicator factor (FIP) as a measure of the cyclic driving force for fatigue crack initiation and early crack extension within the grain [43,44,45,46]. In this paper, two FIPs are utilized as quasi-measures of fatigue crack initiation. The cumulative plastic slip ( P ) [47] criterion suggests that plastic slip in the microstructure can accumulate, and crack initiation occurs when a critical slip is reached. P is defined as a function of the plastic velocity gradient L p :
P = 0 t P ˙ d t
P ˙ = ( 2 3 L p : L p ) 1 / 2
where L p is the plastic deformation gradient tensor mentioned in Equation (2), P ˙ is effective plastic slip rate, and double dot product notation “:” stands for the reduction and merging operation of the L p tensor.
The definition of the cumulative plastic slip critical value is primarily based on experimental data. It involves establishing a baseline strain amplitude and determining the critical value of cumulative plastic slip for the material by multiplying the fatigue crack initiation life obtained from fatigue experiments at this strain amplitude by the cumulative plasticity value of a single week. The stress–strain behavior stabilizes quickly under the appropriate load, allowing for the determination of cumulative slip for each cycle and prediction of the critical slip value. This critical value is then used to predict the fatigue crack initiation life at other strain amplitudes. Mathematically, the critical value is the product of the number of cycles of crack initiation, n, and the plastic slip, p c y c , per cycle, as shown below:
p c p s t = N i × p c y c
The critical value of accumulated plastic slip, p c p s t , is a material characteristic that represents the cumulative plasticity associated with the initiation of small fatigue cracks. It is an essential parameter that remains unaffected by loading conditions at a specific temperature for a given material [47]. Skelton, R [48], along with other researchers, used the strain energy dissipated by the crystal during each fatigue loading cycle to estimate the fatigue crack nucleation life. The formula for calculating strain energy dissipation is as follows:
W = α 0 t τ α γ ˙ α d t
where τ α is the shear stress in the α slip regime and γ ˙ α is the shear strain rate in the α slip regime. Analogous to the critical value for cumulative plastic slip, the critical value for strain energy dissipation can be defined as follows:
W c p s t = N i × W c y c

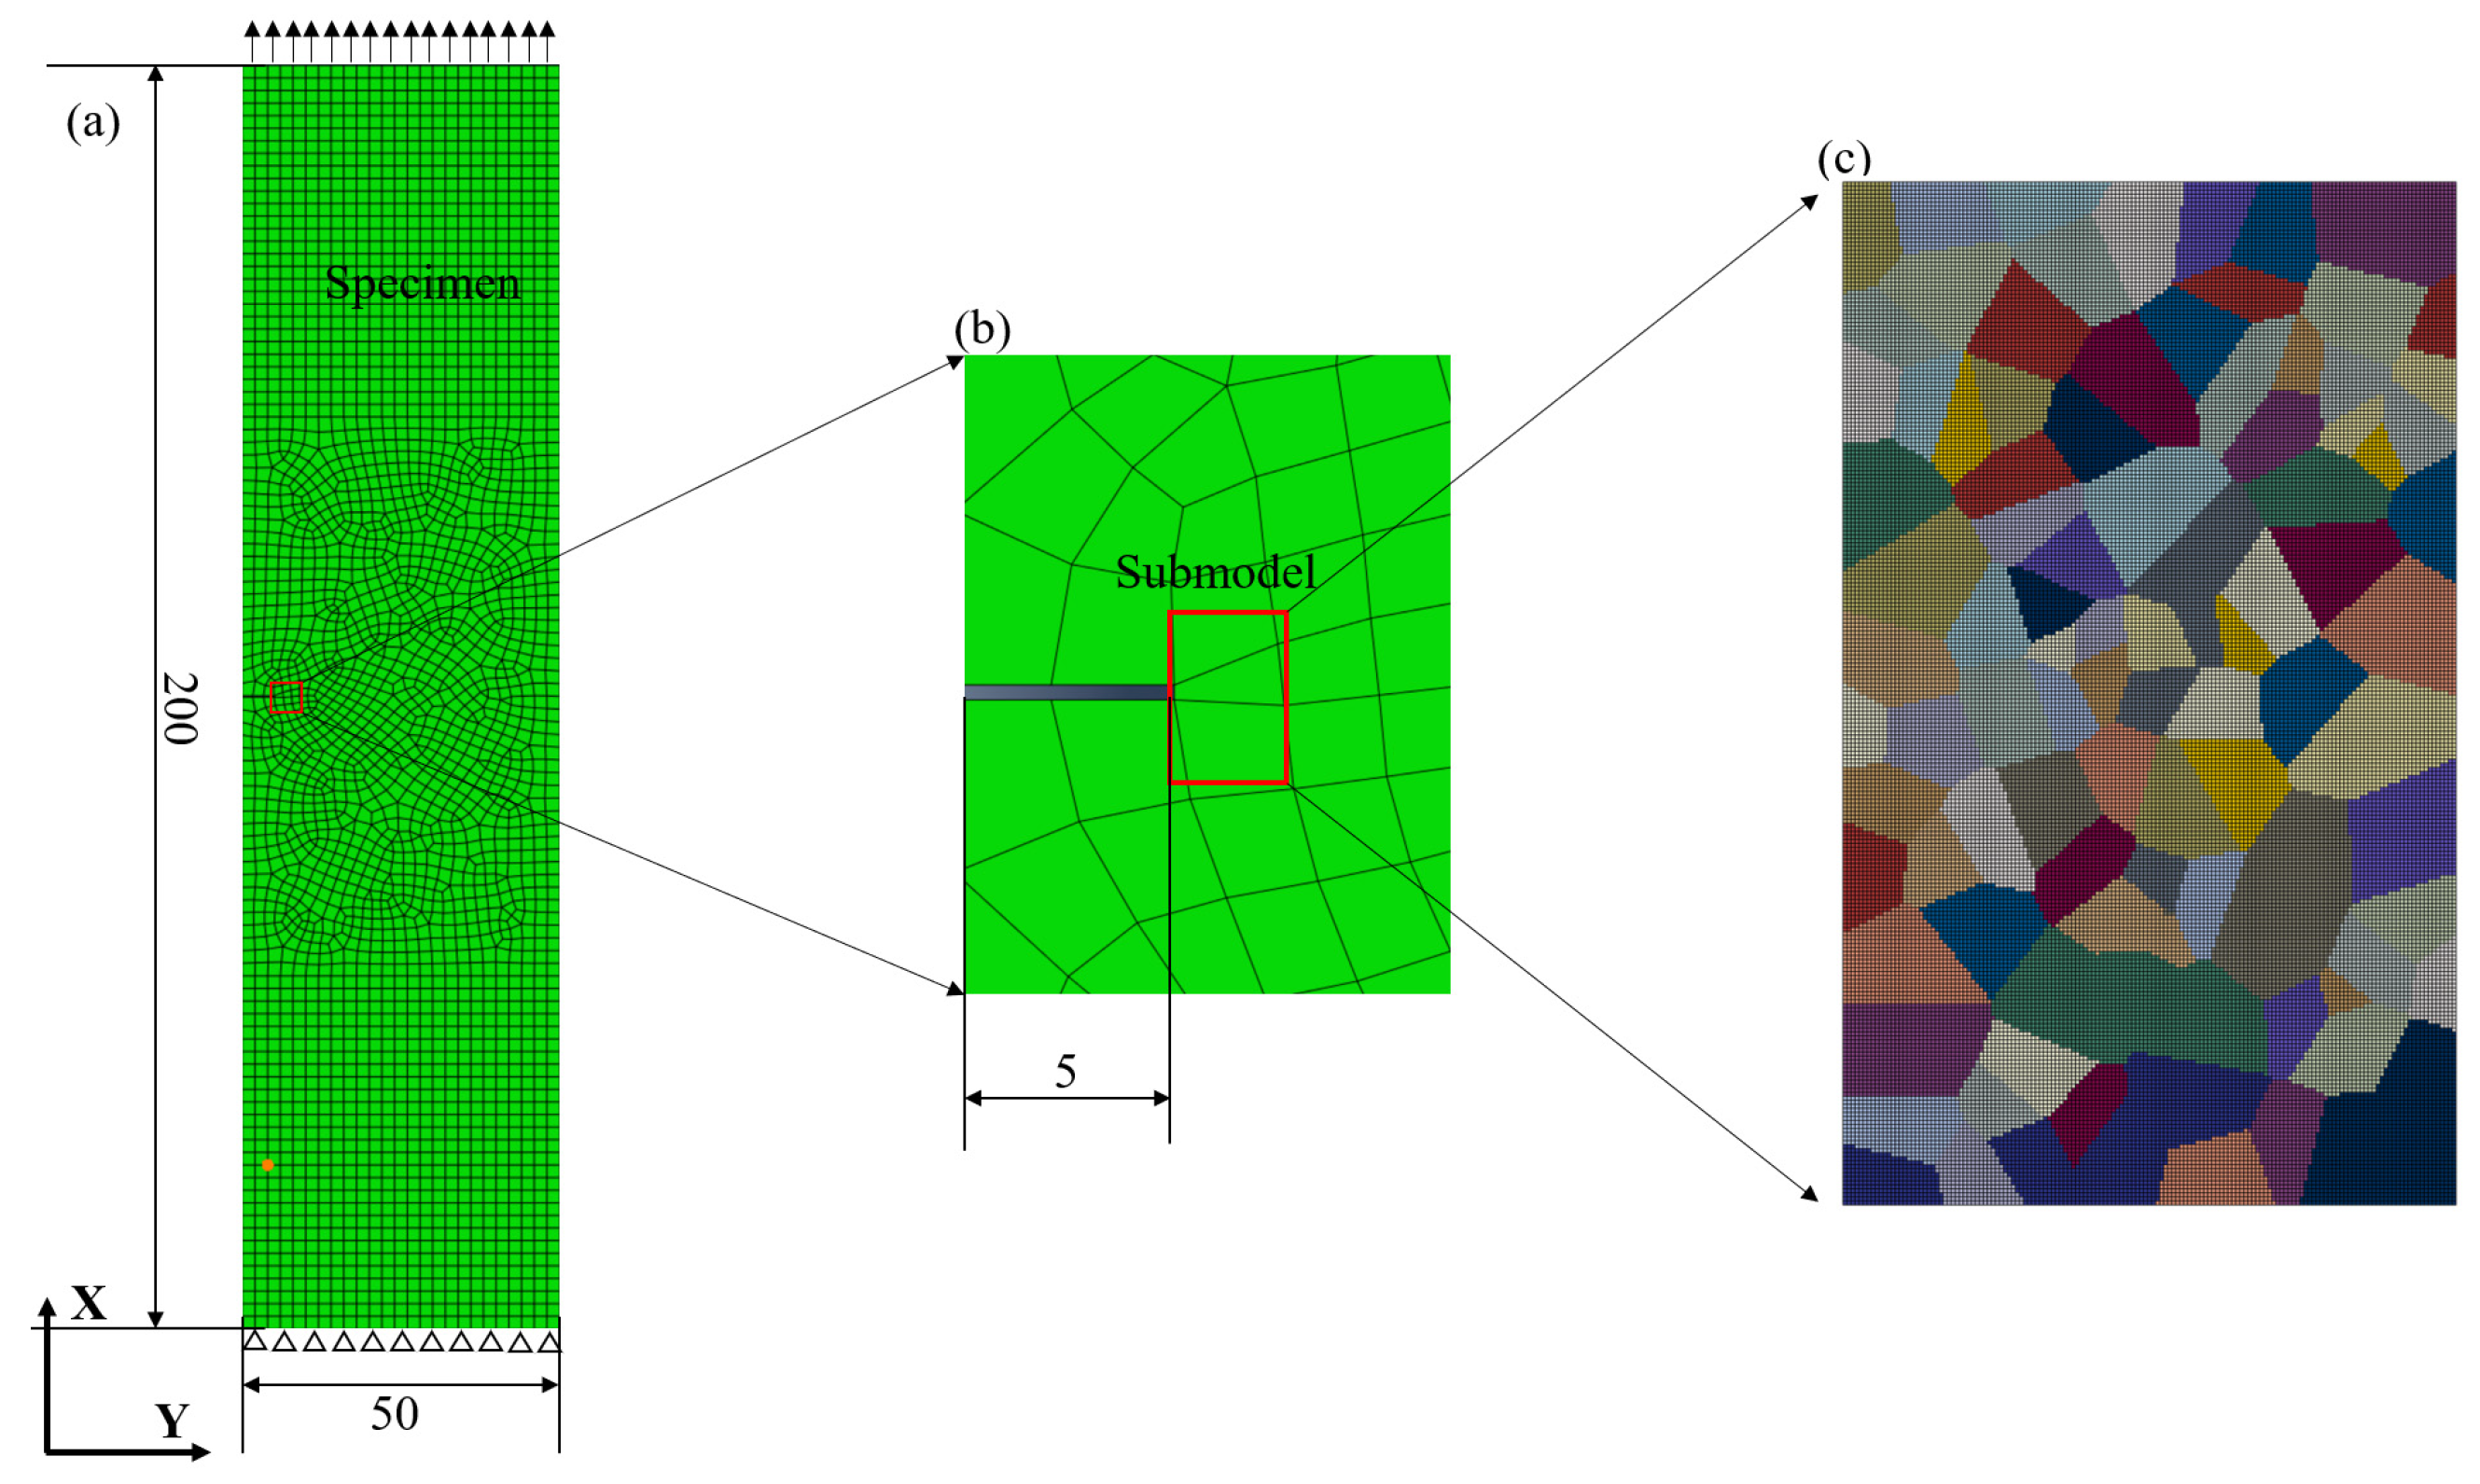
2.3. Crystal Plasticity Finite Element Model of 7075-T6 Aluminum Alloy

This paper presents a polycrystalline model using Voronoi tessellation [49]. The study utilizes the finite element sub-model technique to investigate the impact of microstructure near the crack tip on crack tip deformation. The sub-model, located in the vicinity of the crack tip, consists of approximately 100 grains with random orientations, as shown in Figure 1. The loading method is determined based on the local displacements obtained from the analytical results of the global model. The validity of this sub-model analysis method has been confirmed in previous literature [50]. Displacements are used as boundary conditions in this paper to ensure a balance of strain energy between the global model and sub-model boundary conditions.
The sub-model in this study follows the crystal plasticity principle mentioned earlier. On the other hand, the global model is an elastoplastic model that takes into account isotropic and kinematic hardening variables throughout the transient and saturation phases of the cyclic response [51]. To implement both the sub-model and the global model, the researchers used the ABAQUS v2021 finite element software.
To ensure reasonable macroscopic mechanical properties of the simplified model and moderate computational cost, this paper selects 125 grains(generated using Neper 4.5.4-1) to determine material parameters, as shown in Figure 2a. Experimental studies have demonstrated that there is almost no difference in the stress–strain curves for different Euler angle parameters, as depicted in Figure 2d for uniaxial tensile results with various grain orientations. Some studies have indicated that both experiments and simulations show the evident influence of grain size [52]. Therefore, this paper determines the average grain size of the material using EBSD and provides the grain size for finite element simulations based on EBSD experiments. Moreover, when the number of grains exceeds 100, its impact on the macroscopic response becomes very weak [53]. To align with the actual complex machining process, this paper randomly sets the grain orientation, resulting in overall isotropy. The simplification of the model significantly reduces the computational cost, enabling the adoption of the trial-and-error method in this paper to determine material parameters more quickly and meet the requirements.
The boundary conditions, as shown in Figure 2a, include constraining the displacement in the Z-axis direction of the XBY plane, constraining the displacement in the X-axis direction of the XAB plane, and applying a specified displacement in the ZAC plane (Zeiss SIGMA 500, Jena, Germany). The selected cell type is C3D8R-Enhanced, which is used to simulate static and cyclic tension, following the approach described in paper [53]. Table 1 presents the material parameters of the intrinsic model for 7075-T6 aluminum alloy, which were determined through the trial-and-error method. The theoretical calculations, as depicted in Figure 2b, show a remarkable agreement between the model simulations and the experimental data. The material parameters used in this study demonstrate their capability to accurately predict the mechanical properties of 7075-T6 aluminum (Murphy and Nolan Inc., Syracuse, NY, USA) alloy.

3. Experimental Results and Analysis

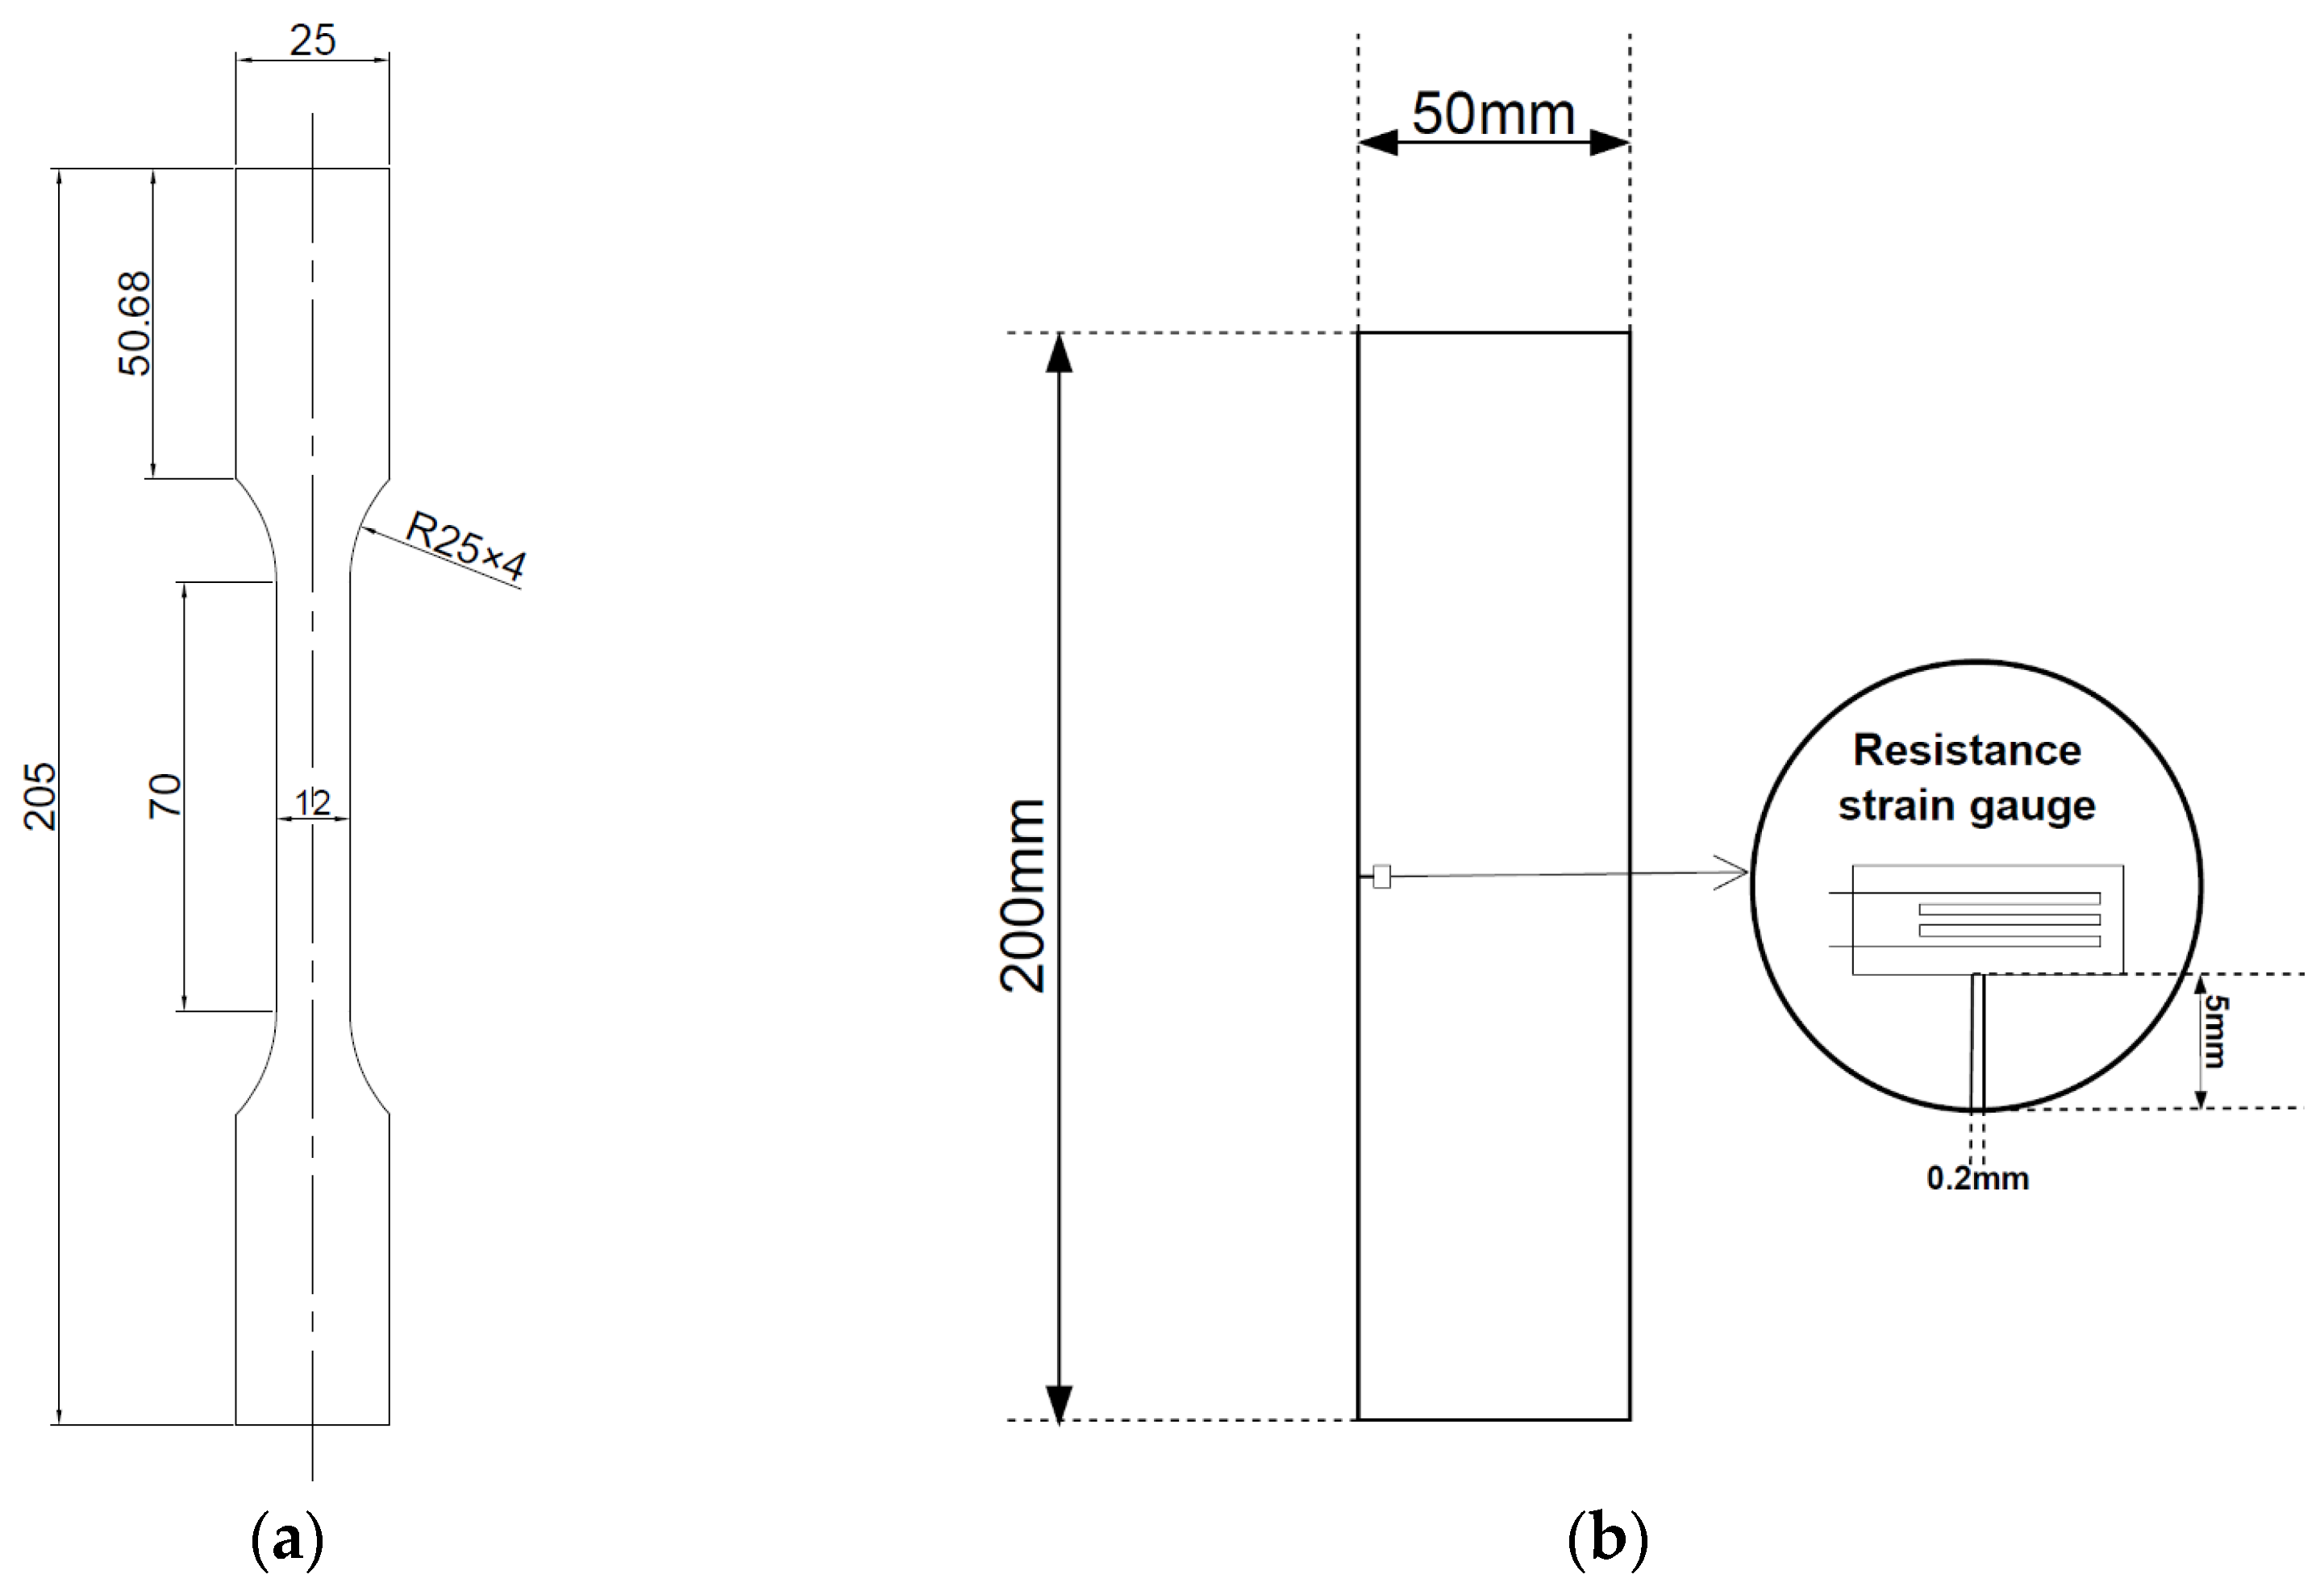
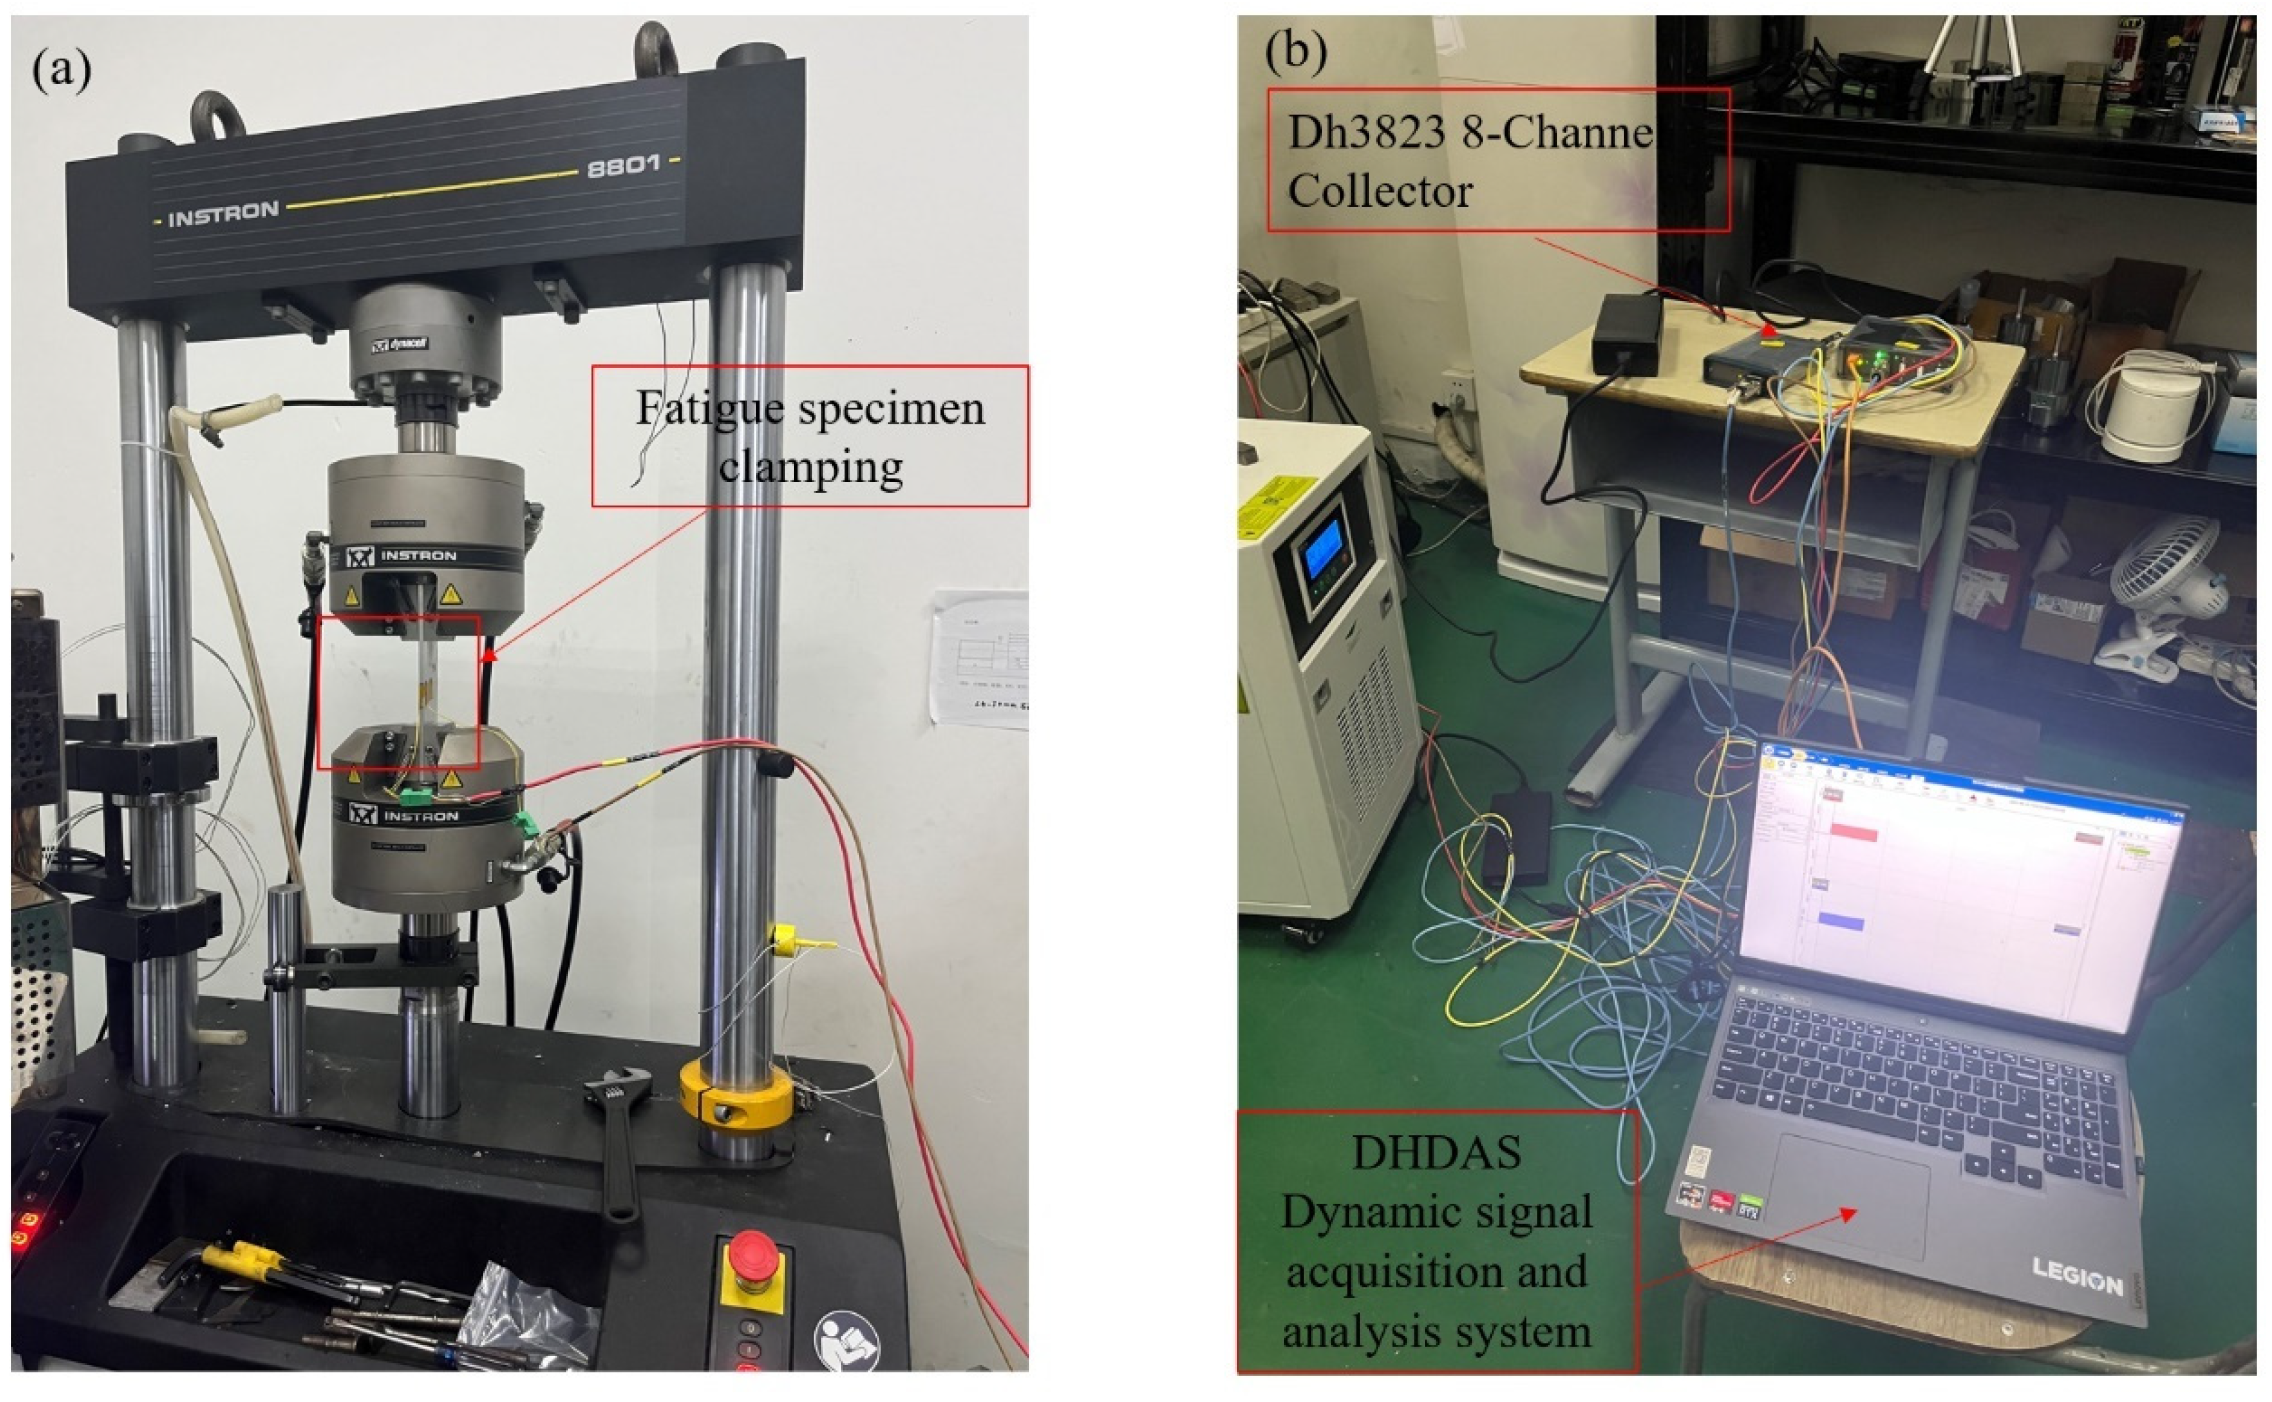
3.1. Experiment Program

The aerospace aluminum alloy 7075 was used as the test material in this study. It underwent a solution treatment and artificial aging (T6) heat treatment process. The heat treatment process began with subjecting the alloy to a solid solution treatment at a temperature range of 465–477 °C for a duration of 1–2 h. Afterward, the alloy was cooled and subjected to an artificial aging treatment at a temperature range of 120–180 °C for a duration of 6–24 h. The fabrication process involved hot rough-rolled quenched plates, and the detailed chemical composition can be found in Table 2. The average grain size of the material was measured to be approximately 88 μm using SEM electron microscopy (Thermo Fisher Scientific Inc., Waltham, MA, USA), following the standard metallographic procedure [54]. Subsequently, EBSD experiments were conducted to investigate the crystal orientation of the material. A step size of 4 μm was used in these experiments. Based on the research by Gao and Kubin et al. [55], the geometrically necessary dislocation density (GND) of each pixel point during the EBSD scanning process can be calculated using the strain gradient theory:
ρ G N D = 2 θ i u b
where θ i denotes the orientation difference, b denotes the Burger vector, and u is the unit length of the pixel point.
To determine the precise mechanical properties of the material, a tensile test was performed on a standard specimen measuring 205 mm in length and 25 mm in width, as shown in Figure 3a. The resulting tensile stress–strain curves were subsequently compared with the simulation results presented in Figure 2b. The strong correlation between the experimental and simulated tensile curves validates the accuracy of the material parameter.
In comparison to the tensile test, the fatigue test involves a grooved specimen. The parameters of the specimen are shown in Figure 3b, where the thickness of the test block is 5 mm. The fatigue test is conducted using an Instron 8801 fatigue tester and the control mode is strain control. The specific fatigue parameters can be found in Table 3. In order to observe changes in surface organization during fatigue, the specimen’s surface is sanded and polished using sandpaper with different mesh sizes (800, 1000, 1200, 1500, 2000, 2500, and 3000). Strain gauges are attached to the notch to monitor strain changes before the initiation of fatigue microcracks. The overall test program is illustrated in Figure 4. For dynamic strain gauge measurements, this paper utilizes the DH3823 8-channel strain collector with a collection frequency of 1 kHz. The experimental setup is shown in Figure 4b.

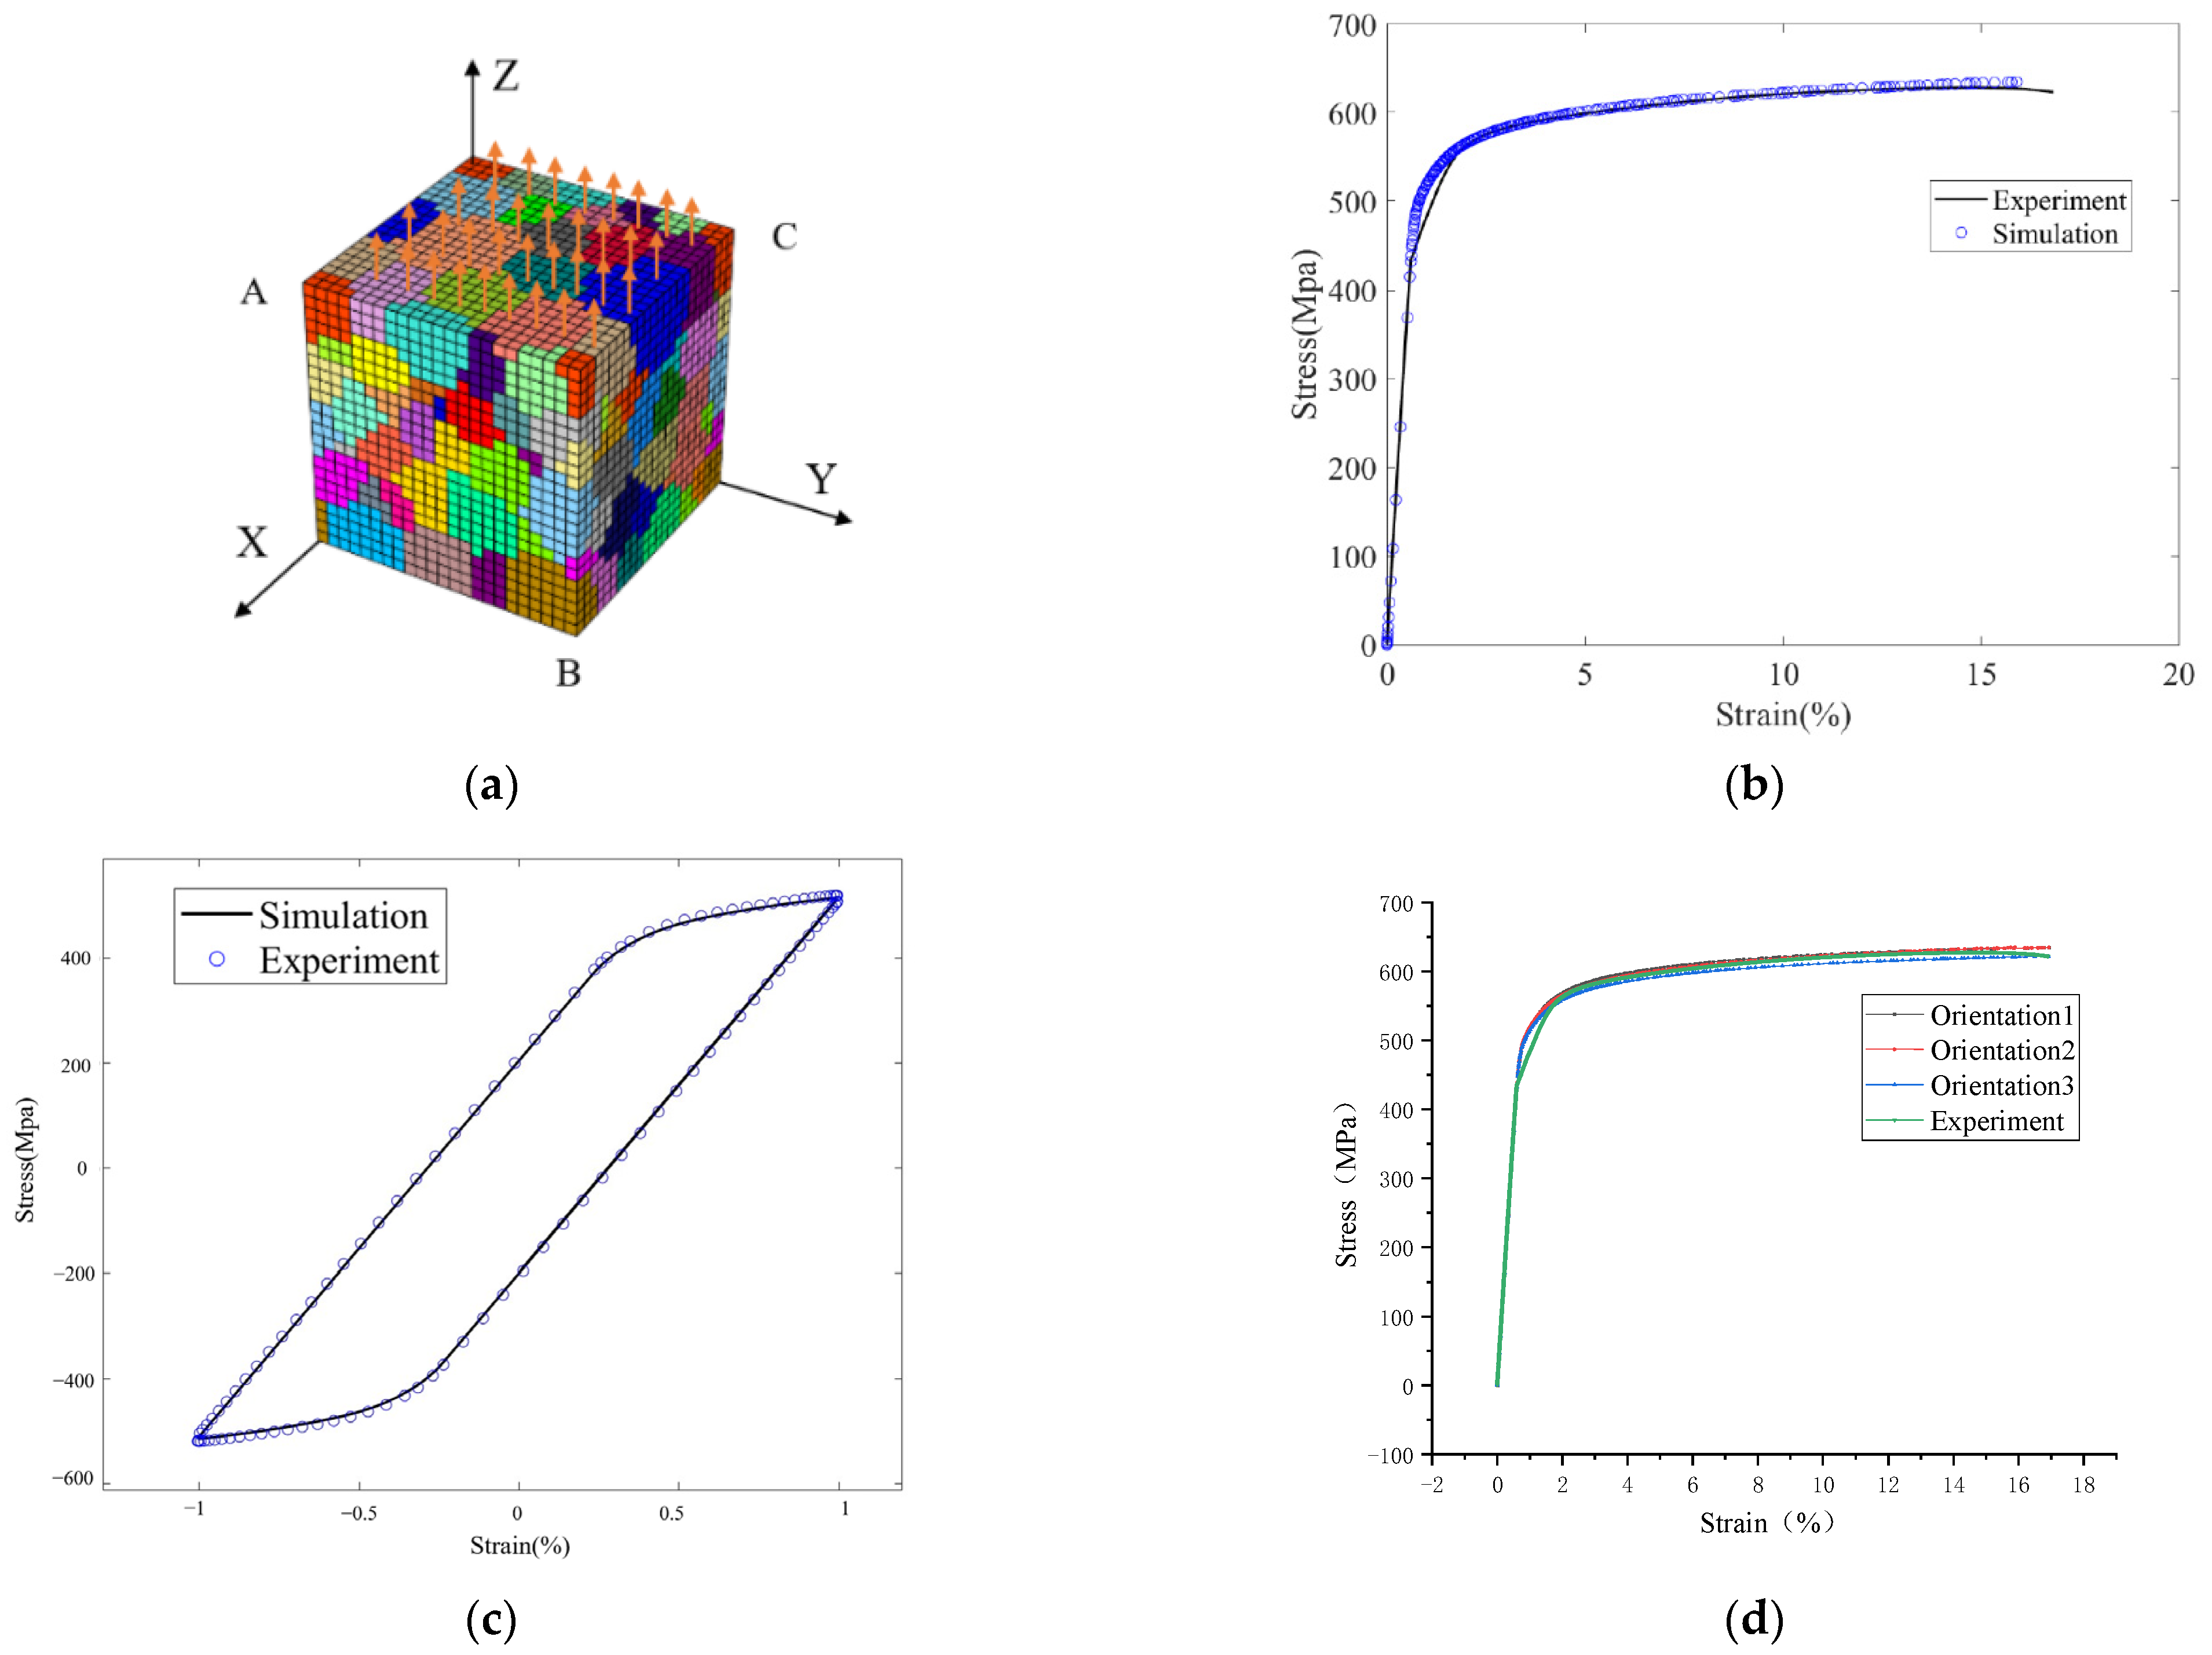
3.2. Analysis of Simulation and Test Results

This paper aims to investigate the correlation between fatigue damage and microstrain by varying the fatigue times to achieve different fatigue damage states. To characterize the surface fatigue damage state, the electron backscattering (EBSD) technique [56] is employed. EBSD tests are primarily conducted above the notch, which represents the stress concentration point. EBSD maps corresponding to different fatigue durations are generated, and the geometrical mean dislocation densities are calculated using the formula in Equation (19). Figure 5 displays the GND maps of specimens that did not undergo fatigue failure.
Figure 6 presents the recorded strain changes from resistance strain gauges during fatigue testing of the specimen. The strain data is shown with an envelope above and below it, and the initial value is zeroed as shown in Figure 6b. The results display the strain changes on two surfaces of the specimen, namely surface A and B. At this stage, the cracks have extended to approximately 925 μm. Due to the presence of coarse grains, the main mechanism of crack extension is perforation fracture. Figure 7a illustrates the metallographic image of crack expansion at the notch on the B-side, which corresponds to a strain growth of 100 με. As the cycles progress to around 25,000 cycles, the crack length continues to increase. In order to establish a clearer relationship between fatigue damage and strain, a new batch of test materials was produced to obtain varying fatigue cycles and different strain changes in the fatigue damage test materials. EBSD tests were conducted on the surface to analyze the micro-mechanism of fatigue damage.
Following the fatigue test program outlined in Section 3.1, this paper fabricated aluminum alloy specimens and subjected them to different numbers of fatigue cycles: 3000, 5000, 7000, 10,000, and 11,500. The fatigue parameters used in the experiments are provided in Table 3. The strain changes on the A and B surfaces were monitored under various fatigue conditions, as shown in Figure 8.
Observing Figure 8e, it is evident that the strain growth is 26 με when the fatigue duration reaches approximately 11,500 cycles. Metallographic observation on the B side of the notch at this point reveals a crack length of 46μm, as shown in Figure 7b. Meanwhile, metallographic experiments were conducted on the A side, where no cracks were produced, and the strain growth was only 17 με. Figure 8d also shows that the strain change rule is not consistent on both sides. However, in Figure 6b and Figure 8a–c, the strain monitoring data on both sides are essentially similar. This discrepancy can be attributed to variations in the surface treatment of specimen A and B sides, the processing of the notch, and the different states of the notches on the two surfaces. These factors introduce variations and offset issues in the strain data. Nevertheless, this disparity also highlights the feasibility of monitoring the fatigue state through strain.
To investigate additional surface damage–strain relationships, an EBSD test was conducted above the notch of the specimen prior to crack initiation. Masoud Moshtaghi et al. [57,58] analyzed the dislocation characteristics and deformation-induced martensitic transformation of 304 and 316 stainless steels under asymmetric cyclic loading. The study revealed that work hardening plays a crucial role in influencing the fatigue behavior of stable austenitic stainless steel under such loading conditions. Moreover, using X-ray diffraction, they quantitatively assessed the dislocation densities in austenitic and ferritic stainless steels during cyclic loading and found a linear variation with low circumferential fatigue life. In ferrite, helical dislocations decreased with decreasing life, while in austenite, they remained relatively unchanged. In summary, the arrangement of dislocations during cyclic loading is dependent on the applied load, and dislocations in both materials generally exhibit an increasing and then stabilizing relationship with fatigue cycles. Subsequently, an analysis of the distribution of geometrically necessary dislocation density was performed. Following cyclic loading, the specimen showed an overall trend of dislocation density initially increasing and then decreasing, as shown in Figure 9. A significant concentration of geometrically necessary dislocations was observed at grain boundaries. Figure 9b displays the GND map of the fatigue specimen above the notch at 3000 cycles. EBSD analysis of the fatigue specimen reveals that the early stage of fatigue in hard aluminum alloy corresponds to the hardening stage. At this point, the specimen exhibits a work-hardening condition. However, the strain monitoring remains nearly constant. This can be attributed to the current measurement method not having reached a higher level of accuracy. Additionally, the strain is less pronounced during the work-hardening stage, as shown in Figure 8a,b. During this phase, the number of slipped grains increases, leading to an increase in dislocation density. As a result, the fatigue process enters the softening stage, characterized by a decrease in dislocation density and the formation of a strong slip band. Liu et al. [59] also observed that the work-hardening and work-softening states change at different fatigue cycles, affecting the plastic deformability. Within this robust slip band, microcracks start to emerge, indicating the beginning of the cyclic saturation state. At this point, the monitored strain gradually begins to increase. In low circumferential fatigue, the strain gradually increases due to cyclic loading controlled by machining softening during strain loading, while machining hardening hinders plastic deformation. The appearance of cracks intensifies the change in strain, making it more pronounced.
Utilizing fatigue test data, this study predicts the fatigue crack emergence life under various fatigue loading conditions through the crystal plasticity model. The crystal plasticity model, detailed in Section 2.1, is employed to calculate and analyze the plastic deformation of the polycrystalline model. Both macroscopic and fine scales of strains are meticulously examined, and the resulting strain variations in the simulation results are analyzed. Cyclic loading of the crystal plasticity model proposed above is conducted, and Figure 2c illustrates the cyclic stress–strain curves of the 10th cycle at a strain amplitude of 0.15%, compared with the experimental results. It is evident that the model parameters obtained in Table 1 align with the experimental results.
Figure 10 presents a comparison of the clouds of the two FIPs discussed in Section 2.2. These FIP clouds represent specimens after 40 fatigue cycles at a 0.3% strain amplitude and 0.1 stress ratio. It is evident that there is a significant accumulation of cumulative plastic slip and strain energy dissipation closer to the notch. This accumulation indicates a high likelihood of crack generation due to stress concentration in this region. The FIP critical value near the grain boundary is the primary criterion for assessing fatigue crack initiation life. This critical value is characterized by a substantial accumulation of plastic slip and strain energy dissipation, as shown at point A in Figure 10. The critical values for cumulative plastic strain and strain energy dissipation are obtained from the fatigue test. The polycrystalline plasticity model predicts the fatigue crack initiation life, which is then compared with the test results, as illustrated in Figure 11.
As shown in Figure 11, the low-cycle fatigue test of aluminum alloy provides valuable information through both fatigue indicators and the predicted fatigue crack initiation life. It is worth noting that strain energy dissipation offers more accurate predictions in this experimental process compared to cumulative plastic slip. However, the predicted life for cumulative plastic slip exceeds the actual experimental results.
To investigate the relationship between strain and fatigue damage, both experimental and simulated fatigue were analyzed. In Figure 11b, the average strain is plotted against the number of fatigue cycles for the model simulated with the fitted parameters at a strain amplitude of 0.15%. The figure shows that the strain at the notch initially decreases and then increases before reaching 3300 cycles of fatigue. After that point, it exhibits a consistent increasing trend. However, it remains relatively stable around 200 με throughout the fatigue cycles. On the other hand, the cumulative plastic strain fatigue indicator factor demonstrates an increasing trend after 3900 cycles, but remains relatively stable during the pre-fatigue period. This suggests that the emergence of fatigue damage is closely related to the change in microstrain. As shown in Figure 11b, the change in strain is approximately 2300 με, whereas the results from the test presented in Figure 7b indicate only 26 με. This discrepancy is attributed to the contact issue between the surface of the fatigue specimen and the strain gauges, which reduces the sensitivity of strain monitoring. This can be observed in Figure 8a–c, where the strain essentially remains unchanged during the first 5000 cycles of fatigue, aligning with the simulation.

4. Conclusions

This paper investigates the relationship between strain and fatigue damage in aerospace aluminum alloy 7075-T6. The study analyzes the microscopic damage mechanism of low-cycle fatigue using crystal plasticity and fatigue tests. The correlation between strain and fatigue damage prior to the onset of fatigue crack life is explored through multiple sets of unilateral grooved specimens. Fatigue crack initiation life is predicted using two fatigue indicator factors (FIPs) in crystal plasticity simulations, and the accuracy of these FIPs is assessed. The main conclusions of this study are as follows: (1) The fatigue indication of strain energy dissipation in low-cycle fatigue testing of aluminum alloys is more accurate in predicting fatigue crack initiation life, as determined by analyzing the accuracy of the two FIPs. (2) Strain changes were found to be insignificant for monitoring the early stages of work-hardening in fatigue, as evidenced by the comparison of experimental and simulated cycle counts with fatigue damage. Experimentally monitored strains remained essentially constant. (3) After the fatigue cycle enters cyclic saturation, the microstrain at the notch gradually begins to rise, indicating the onset of microcracks. (4) When the strain exceeds 26 με, microcracks start to appear, and the strain tends to increase as the microcracks expand. Crystal plasticity simulations show a similar pattern in the cumulative plastic slip fatigue indicator factor.

Author Contributions

Writing—original draft, Software, Formal analysis and Methodology, J.W.; Conceptualization and Writing—review and editing, W.W.; Writing—review and editing, M.L.; Investigation, Y.H. and J.W. All authors have read and agreed to the published version of the manuscript.

Funding

This work was financially supported by the National Natural Science Foundation of China (No. 12204510) and National Key Research and Development Program (2022YFB3206802).

Institutional Review Board Statement

Not applicable.

Informed Consent Statement

Not applicable.

Data Availability Statement

The raw data supporting the conclusions of this article will be made available by the authors on request.

Conflicts of Interest

The authors declare no conflicts of interest.

References

  1. Stephens, R.I.; Fatemi, A.; Stephens, R.R.; Fuchs, H.O. Metal Fatigue in Engineering; John Wiley & Sons: New York, UK, 2001; pp. 3–7. [Google Scholar]
  2. Forrest, P.G. Fatigue of Metals; Pergamon Press: Oxford, UK, 1970; pp. 1–6. [Google Scholar]
  3. Dursun, T.; Soutis, C. Recent developments in advanced aircraft aluminium alloys. Mater. Des. 2014, 56, 862–871. [Google Scholar] [CrossRef]
  4. Li, S.S.; Yue, X.; Li, Q.Y.; Peng, H.L.; Dong, B.X.; Liu, T.S.; Yang, H.Y.; Fan, J.; Shu, S.L.; Qiu, F. Development and applications of aluminum alloys for aerospace industry. J. Mater. Res. Technol. 2023, 27, 944–983. [Google Scholar] [CrossRef]
  5. Mouritz, A.P. Aluminium alloys for aircraft structures. Introd. Aerosp. Mater. 2012, 1, 173–201. [Google Scholar]
  6. Ewing, J.A.; Humfrey, J., VI. The fracture of metals under repeated alternations of stress. Philos. Trans. R. Soc. London Ser. A Contain. Pap. Math. Phys. Character 1903, 200, 241–250. [Google Scholar]
  7. Coffin, L.F., Jr. A study of the effects of cyclic thermal stresses on a ductile metal. Trans. Am. Soc. Mech. Eng. 1954, 76, 931–949. [Google Scholar] [CrossRef]
  8. Manson, S. National Advisory Committee on Aerospace Technical Note 2933; National Advisory Committee: Cleveland, OH, USA, 1954.
  9. Laird, D.C.; Duquette, J. Corrosion Fatigue: Chemistry, Mechanics and Microstructure; National Association of Corrosion Engineers: Houston, TX, USA, 1972; pp. 88–117. [Google Scholar]
  10. Mughrabi, H. Cyclic slip irreversibilities and the evolution of fatigue damage. Metall. Mater. Trans. B 2009, 40, 431–453. [Google Scholar] [CrossRef]
  11. Yasbolaghi, R.; Khoei, A. Micro-structural aspects of fatigue crack propagation in atomistic-scale via the molecular dynamics analysis. Eng. Fract. Mech. 2020, 226, 106848. [Google Scholar] [CrossRef]
  12. Zhang, P.; Zhang, L.; Zhu, Q.; Chen, G.; Wang, C.; Fan, G.; Qin, H.; Tian, Q.; Gan, B. Evolution of fatigue mechanical properties and micro defects in nickel-based single crystal superalloys: A molecular dynamics research. Mater. Today Commun. 2023, 34, 105044. [Google Scholar] [CrossRef]
  13. Wu, W.; Chen, B.; Shen, H.; Ding, Z. Molecular dynamics simulation of rhenium effects on creep behavior of Ni-based single crystal superalloys. Prog. Nat. Sci. Mater. Int. 2022, 32, 259–266. [Google Scholar] [CrossRef]
  14. Sainath, G.; Rohith, P.; Choudhary, B. Fatigue deformation of polycrystalline Cu using molecular dynamics simulations. Trans. Indian Inst. Met. 2016, 69, 489–493. [Google Scholar] [CrossRef]
  15. Yang, Y.; Li, H.; Yang, Z.; Liu, J.; Kateye, E.K.; Zhao, J. Notch fatigue of Cu50Zr50 metallic glasses under cyclic loading: Molecular dynamics simulations. Commun. Theor. Phys. 2021, 73, 065501. [Google Scholar] [CrossRef]
  16. Zhang, J. Severe Plastic Deformation of Metal and Mesoscopic Constitutive Model Including Size Effect. Ph.D. Thesis, Guangxi University, Nanning, China, 2011. [Google Scholar]
  17. Shiraiwa, T.; Briffod, F.; Enoki, M. Prediction of Fatigue Crack Initiation of 7075 Aluminum Alloy by Crystal Plasticity Simulation. Materials 2023, 16, 1595. [Google Scholar] [CrossRef]
  18. Sun, T.; Qin, L.; Xie, Y.; Zheng, Z.; Xie, C.; Huang, Z. An Approach for Predicting the Low-Cycle-Fatigue Crack Initiation Life of Ultrafine-Grained Aluminum Alloy Considering Inhomogeneous Deformation and Microscale Multiaxial Strain. Materials 2022, 15, 3403. [Google Scholar] [CrossRef]
  19. Cen, C.-X.; Lu, D.-M.; Qin, D.-W.; Zhang, K.-S. Torsional Fatigue Life Prediction of 30CrMnSiNi2A Based on Meso-Inhomogeneous Deformation. Materials 2021, 14, 1846. [Google Scholar] [CrossRef] [PubMed]
  20. Jin, L.; Zeng, B.; Lu, D.; Gao, Y.; Zhang, K. Prediction of strain fatigue life of HRB400 steel based on meso-deformation inhomogeneity. Materials 2020, 13, 1464. [Google Scholar] [CrossRef]
  21. Sun, G.; Guo, Y.; Han, X.; Shang, D.; Chen, S. Fatigue modeling containing hardening particles and grain orientation for aluminum alloy FSW joints. Materials 2019, 12, 2024. [Google Scholar] [CrossRef] [PubMed]
  22. Jiang, J.; Dunne, F.P.; Britton, T.B. Toward predictive understanding of fatigue crack nucleation in Ni-based superalloys. Jom 2017, 69, 863–871. [Google Scholar] [CrossRef] [PubMed]
  23. Yuan, G.-J.; Zhang, X.-C.; Chen, B.; Tu, S.-T.; Zhang, C.-C. Low-cycle fatigue life prediction of a polycrystalline nickel-base superalloy using crystal plasticity modelling approach. J. Mater. Sci. Technol. 2020, 38, 28–38. [Google Scholar] [CrossRef]
  24. Pineau, A.; McDowell, D.L.; Busso, E.P.; Antolovich, S.D. Failure of metals II: Fatigue. Acta Mater. 2016, 107, 484–507. [Google Scholar] [CrossRef]
  25. Castelluccio, G.M.; McDowell, D.L. A mesoscale approach for growth of 3D microstructurally small fatigue cracks in polycrystals. Int. J. Damage Mech. 2014, 23, 791–818. [Google Scholar] [CrossRef]
  26. Dabiri, M.; Lindroos, M.; Andersson, T.; Afkhami, S.; Laukkanen, A.; Björk, T. Utilizing the theory of critical distances in conjunction with crystal plasticity for low-cycle notch fatigue analysis of S960 MC high-strength steel. Int. J. Fatigue 2018, 117, 257–273. [Google Scholar] [CrossRef]
  27. Abraham, S.T.; Babu, M.N.; Venkatraman, B. A novel ultrasonic non-destructive testing methodology to monitor fatigue crack growth in compact tension specimens. Rev. Sci. Instrum. 2023, 94, 035108. [Google Scholar] [CrossRef]
  28. Vié, T.; Deschanel, S.; Godin, N.; Normand, B. On the effect of coatings on the tensile and fatigue properties of 7075-T6 aluminum alloy monitored with acoustic Emission (AE): Towards lifetime estimation. Int. J. Fatigue 2023, 171, 107578. [Google Scholar] [CrossRef]
  29. Mohammad, I.; Huang, H. Monitoring fatigue crack growth and opening using antenna sensors. Smart Mater. Struct. 2010, 19, 055023. [Google Scholar] [CrossRef]
  30. Kumar, V.; Acot, B.; Aygun, L.E.; Wagner, S.; Verma, N.; Sturm, J.; Glisic, B. Detecting, localizing, and quantifying damage using two-dimensional sensing sheet: Lab test and field application. J. Civ. Struct. Health Monit. 2021, 11, 1055–1075. [Google Scholar] [CrossRef]
  31. Kong, X.; Li, J.; Collins, W.; Bennett, C.; Laflamme, S.; Jo, H. A large-area strain sensing technology for monitoring fatigue cracks in steel bridges. Smart Mater. Struct. 2017, 26, 085024. [Google Scholar] [CrossRef]
  32. Tikka, J.; Hedman, R.; Silijander, A. Strain gauge capabilities in crack detection. In Proceedings of the 4th International Workshop on Structural Health Monitoring, Stanford, CA, USA, 15–17 September 2003; pp. 15–17. [Google Scholar]
  33. Venkatachalam, S.; Murthy, H. Damage characterization and fatigue modeling of CFRP subjected to cyclic loading. Compos. Struct. 2018, 202, 1069–1077. [Google Scholar] [CrossRef]
  34. Fu, Q. Research on Online Fatigue Crack Monitoring and Life Prediction Based on Strain Analysis. Master’s Thesis, Xi’an University of Technology, Xi’an, China, 2018. [Google Scholar]
  35. Hill, R.; Rice, J. Constitutive analysis of elastic-plastic crystals at arbitrary strain. J. Mech. Phys. Solids 1972, 20, 401–413. [Google Scholar] [CrossRef]
  36. Asaro, R.J.; Rice, J. Strain localization in ductile single crystals. J. Mech. Phys. Solids 1977, 25, 309–338. [Google Scholar] [CrossRef]
  37. Peirce, D.; Asaro, R.J.; Needleman, A. Material rate dependence and localized deformation in crystalline solids. Acta Metall. 1983, 31, 1951–1976. [Google Scholar] [CrossRef]
  38. Needleman, A.; Asaro, R.; Lemonds, J.; Peirce, D. Finite element analysis of crystalline solids. Comput. Methods Appl. Mech. Eng. 1985, 52, 689–708. [Google Scholar] [CrossRef]
  39. Hutchinson, J.W. Bounds and self-consistent estimates for creep of polycrystalline materials. Proc. R. Soc. Lond. A Math. Phys. Sci. 1976, 348, 101–127. [Google Scholar]
  40. Huang, Y. A User-Material Subroutine Incroporating Single Crystal Plasticity in the ABAQUS Finite Element Program; Harvard University: Cambridge, UK, 1991. [Google Scholar]
  41. Frederick, C.O.; Armstrong, P. A mathematical representation of the multiaxial Bauschinger effect. Mater. High Temp. 2007, 24, 1–26. [Google Scholar] [CrossRef]
  42. Luo, J. Crystal Plasticity Based Polycrystalline Cyclic Constitutive Model and Its Finite Element Implementation. Master’s Thesis, Southwest Jiaotong University, Chengdu, China, 2014. [Google Scholar]
  43. Gu, T.; Stopka, K.S.; Xu, C.; McDowell, D.L. Prediction of maximum fatigue indicator parameters for duplex Ti–6Al–4V using extreme value theory. Acta Mater. 2020, 188, 504–516. [Google Scholar] [CrossRef]
  44. McDowell, D.; Dunne, F. Microstructure-sensitive computational modeling of fatigue crack formation. Int. J. Fatigue 2010, 32, 1521–1542. [Google Scholar] [CrossRef]
  45. Przybyla, C.P.; Musinski, W.D.; Castelluccio, G.M.; McDowell, D.L. Microstructure-sensitive HCF and VHCF simulations. Int. J. Fatigue 2013, 57, 9–27. [Google Scholar] [CrossRef]
  46. McDowell, D.L. Simulation-based strategies for microstructure-sensitive fatigue modeling. Mater. Sci. Eng. A 2007, 468, 4–14. [Google Scholar] [CrossRef]
  47. Manonukul, A.; Dunne, F. High–and low–cycle fatigue crack initiation using polycrystal plasticity. Proc. R. Soc. Lond. Ser. A Math. Phys. Eng. Sci. 2004, 460, 1881–1903. [Google Scholar] [CrossRef]
  48. Skelton, R. Cyclic hardening, softening, and crack growth during high temperature fatigue. Mater. Sci. Technol. 1993, 9, 1001–1008. [Google Scholar] [CrossRef]
  49. Barbe, F.; Decker, L.; Jeulin, D.; Cailletaud, G. Intergranular and intragranular behavior of polycrystalline aggregates. Part 1: FE model. Int. J. Plast. 2001, 17, 513–536. [Google Scholar] [CrossRef]
  50. Shankar, S.; Nithyaprakash, R.; Santhosh, B.; Uddin, M.; Pramanik, A. Finite element submodeling technique to analyze the contact pressure and wear of hard bearing couples in hip prosthesis. Comput. Methods Biomech. Biomed. Eng. 2020, 23, 422–431. [Google Scholar] [CrossRef]
  51. Lin, B.; Zhao, L.; Tong, J. A crystal plasticity study of cyclic constitutive behaviour, crack-tip deformation and crack-growth path for a polycrystalline nickel-based superalloy. Eng. Fract. Mech. 2011, 78, 2174–2192. [Google Scholar] [CrossRef]
  52. Sweeney, C.; O’Brien, B.; Dunne, F.; McHugh, P.; Leen, S. Strain-gradient modelling of grain size effects on fatigue of CoCr alloy. Acta Mater. 2014, 78, 341–353. [Google Scholar] [CrossRef]
  53. Sui, T.; Shi, D.; Yang, Q.; Fu, Q.; Gong, C.; Dong, C.; Yang, X. Material Parameter Identification Method of Crystal Plastic Constitutive Models. Propuls. Technol. 2023, 44, 210593. [Google Scholar]
  54. ASTM E1558-09; Standard Guide for Electrolytic Polishing of Metallographic Specimens. ASTM International: West Conshohocken, PA, USA, 2014.
  55. Nix, W.D.; Gao, H. Indentation size effects in crystalline materials: A law for strain gradient plasticity. J. Mech. Phys. Solids 1998, 46, 411–425. [Google Scholar] [CrossRef]
  56. Wang, Z.; Wu, S.; Kang, G.; Li, H.; Wu, Z.; Fu, Y.; Withers, P.J. In-situ synchrotron X-ray tomography investigation of damage mechanism of an extruded magnesium alloy in uniaxial low-cycle fatigue with ratchetting. Acta Mater. 2021, 211, 116881. [Google Scholar] [CrossRef]
  57. Moshtaghi, M.; Sato, S. Characterization of dislocation evolution in cyclically loaded austenitic and ferritic stainless steels via XRD line-profile analysis. ISIJ Int. 2019, 59, 1591–1598. [Google Scholar] [CrossRef]
  58. Moshtaghi, M.; Safyari, M. Effect of Work-Hardening Mechanisms in Asymmetrically Cyclic-Loaded Austenitic Stainless Steels on Low-Cycle and High-Cycle Fatigue Behavior. Steel Res. Int. 2021, 92, 2000242. [Google Scholar] [CrossRef]
  59. Liu, F.; Yan, Z.; He, X.; Wang, F.; Wang, Z.; Li, C.; Li, Y. Work-Harding/Softening Behavior and Temperature Evolution of AZ31B Magnesium Alloy During High Cycle Fatigue Process. Mech. Eng. Mater. 2018, 42, 27–30. [Google Scholar]
Figure 1. Establishment of polycrystalline model: (a) main model and its loading method, (b) location of sub-model, (c) crystal plasticity model.
Applsci 14 01184 g001
Figure 2. Uniaxial stretching polycrystal model: (a) setting of boundary conditions; (b) comparison between uniaxial tensile test and simulation; (c) comparison of fatigue cyclic loading experiment and simulation; (d) the effect of different grain orientations on the model.
Applsci 14 01184 g002
Figure 3. Experimental specimen design: (a) tensile specimen design scheme; (b) strain fatigue test design scheme.
Applsci 14 01184 g003
Figure 4. Schematic diagram of the strain monitoring fatigue system: (a) fatigue testing machine; (b) strain acquisition system.
Applsci 14 01184 g004
Figure 5. EBSD above the specimen notch when not fatigued: (a) GND; (b) histogram of GND.
Applsci 14 01184 g005
Figure 6. Map of real-time strain monitoring data: (a) plot of strain real-time acquisition data; (b) plot of data after taking envelope homogenization.
Applsci 14 01184 g006
Figure 7. Crack extension metallograph at the notch: (a) 25000 cycles; (b) 11500 cycles.
Applsci 14 01184 g007
Figure 8. Fatigue cycles versus strain change: (a) 3000 cycles; (b) 5000 cycles; (c) 7000 cycles; (d) 10,000 cycles; (e) 11,500 cycles.
Applsci 14 01184 g008
Figure 9. Geometric must dislocation density variation: (a) geometric mean must dislocation density variation; (b) GND at 3000 cycles.
Applsci 14 01184 g009
Figure 10. Equivalent plastic strain and strain energy dissipation at the fortieth cycle for a strain amplitude of 0.3%: (a) equivalent plastic strain; (b) strain energy dissipation.
Applsci 14 01184 g010
Figure 11. Simulation results analysis: (a) comparison of two FIP predictions and experimental results; (b) variation of strain and FIP with fatigue cycles for crystal plasticity model at 0.15% strain amplitude.
Applsci 14 01184 g011
Table 1. Simulation parameters of 7075-T6 aerospace aluminum alloy.
E (GPa) ν h c (MPa) b 0 b s a t γ 0 g 0 (MPa) n
71.50.3340203160.00.0220320
Table 2. 7075-T6 aircraft aluminum alloy main composition.
ElementSiFeCuMnMgCrZnTiAl
Atomic Content (%)0.160.371.70.192.80.225.90.03Bal.
Table 3. Fatigue test parameters.
Fatigue Parameters
Loading Frequency/Hz5
Strain Amplitude0.15%
Strain Ratio0.1
Load WaveformSimple Harmonic Vibration
Disclaimer/Publisher’s Note: The statements, opinions and data contained in all publications are solely those of the individual author(s) and contributor(s) and not of MDPI and/or the editor(s). MDPI and/or the editor(s) disclaim responsibility for any injury to people or property resulting from any ideas, methods, instructions or products referred to in the content.

