Article

Dynamic Energy Management Strategy of a Solar-and-Energy Storage-Integrated Smart Charging Station

1
Department of Electrical Engineering, National Taiwan University of Science and Technology, Taipei 10607, Taiwan
2
Graduate Institute of Energy and Sustainability Technology, National Taiwan University of Science and Technology, Taipei 10607, Taiwan
*
Author to whom correspondence should be addressed.
Appl. Sci. 2024, 14(3), 1188; https://doi.org/10.3390/app14031188
Submission received: 14 December 2023 / Revised: 19 January 2024 / Accepted: 28 January 2024 / Published: 31 January 2024

Abstract

:
Under net-zero objectives, the development of electric vehicle (EV) charging infrastructure on a densely populated island can be achieved by repurposing existing facilities, such as rooftops of wholesale stores and parking areas, into charging stations to accelerate transport electrification. For facility owners, this transformation could enable the showcasing of carbon reduction efforts through the self-use of renewable energy while simultaneously gaining charging revenue. In this paper, we propose a dynamic energy management system (EMS) for a solar-and-energy storage-integrated charging station, taking into consideration EV charging demand, solar power generation, status of energy storage system (ESS), contract capacity, and the electricity price of EV charging in real-time to optimize economic efficiency, based on a real-world situation in Taiwan. This study confirms the benefits of ESS in contracted capacity management, peak shaving, valley filling, and price arbitrage. The result shows that the incorporation of dynamic EMS with solar-and-energy storage-integrated charging stations effectively reduces electricity costs and the required electricity contract capacity. Moreover, it leads to an augmentation in the overall operational profitability of the charging station. This increase contains not only the revenue generated from electricity sales at the charging station but also the additional income from surplus solar energy sales. From a comprehensive cost–benefit perspective, introducing this solar-and-energy storage-integrated EMS can increase facility owners’ net income by 1.25 times compared to merely installing charging infrastructure.

1. Introduction

In recent years, carbon emissions resulting from the combustion of fossil fuels have posed a global environmental challenge. The transportation sector is a significant contributor, accounting for approximately 25% of global carbon dioxide emissions [1]. Therefore, promoting the electrification of vehicles is seen as a critical decarbonization strategy. Replacing traditional gasoline-powered cars with electric vehicles (EVs) as a means of transportation is currently the most effective alternative, aiming to achieve carbon neutrality and enhance energy efficiency. This shift has become a central focus in the national plans of various governments [2].
With the widespread adoption of EVs, the demand for charging infrastructure has also increased. However, the integration of a large number of EV charging stations into the power grid may lead to grid instability and even short-term power shortages [3,4,5]. This not only affects the reliability of the power grid but can also result in increased electricity costs and necessitate upgrades or expansions of the grid infrastructure [6].
In the pursuit of higher reliability and the reduction of feeder burden and losses, there is increased attention on the application of energy management systems (EMS) and microgrids [7]. For example, [8] provides a comprehensive explanation of AC and DC microgrid systems, particularly focusing on the introduction of distributed generation architecture utilizing renewable energy, energy storage systems, and loads. It compares the feasibility, control, and energy management strategies of the two microgrid systems. [9] presents a DC microgrid architecture incorporating various generation sources and charging stations, accompanied by a real-time power management strategy that considers uncertainties such as the arrival time of EVs and their initial charging status. [10] proposes a community-based EV charging station energy management strategy that dynamically coordinates solar energy, the grid, and energy storage systems to meet EV demands. It dynamically allocates charging levels based on the state and departure time of each vehicle. [11] introduces a real-time charging management strategy based on a DC microgrid, utilizing Mixed Integer Linear Programming (MILP) for optimization scheduling.
In Taiwan, a densely populated island with limited land resources, utilizing existing facilities such as rooftops of wholesale stores and parking lots to establish solar and charging infrastructure holds significant practicality and value. This approach not only accelerates the electrification of vehicles but also brings about economic benefits and contributes to carbon reduction.
This paper proposes a dynamic EMS based on the actual situation in Taiwan, designed specifically for charging stations integrating solar energy and ESSs. The system takes into account EV charging demand, solar power generation, the state of the ESS, contracted capacity, and the dedicated electricity price for EVs to optimize economic benefits. The main contributions of this paper are as follows:
  • Introducing a novel dynamic EMS for charging stations integrating solar energy and ESSs, with simulation and analysis based on the actual situation in Taiwan.
  • Confirming the multiple benefits of ESSs in contracted capacity management, peak shaving, and energy arbitrage.
  • Demonstrating that implementing the energy management strategy proposed in this paper can increase the overall net income, achieving 1.25 times the income compared to merely setting up a charging station.

2. Description

This research is situated in the context of EV charging infrastructure deployment in a densely populated island nation. Due to limited land availability, EVs often depend on centralized DC fast charging stations for their charging needs. Within densely inhabited urban regions, existing facilities like rooftops of wholesale stores and their parking areas emerge as promising sites for the development of solar-and-energy storage-integrated charging stations.

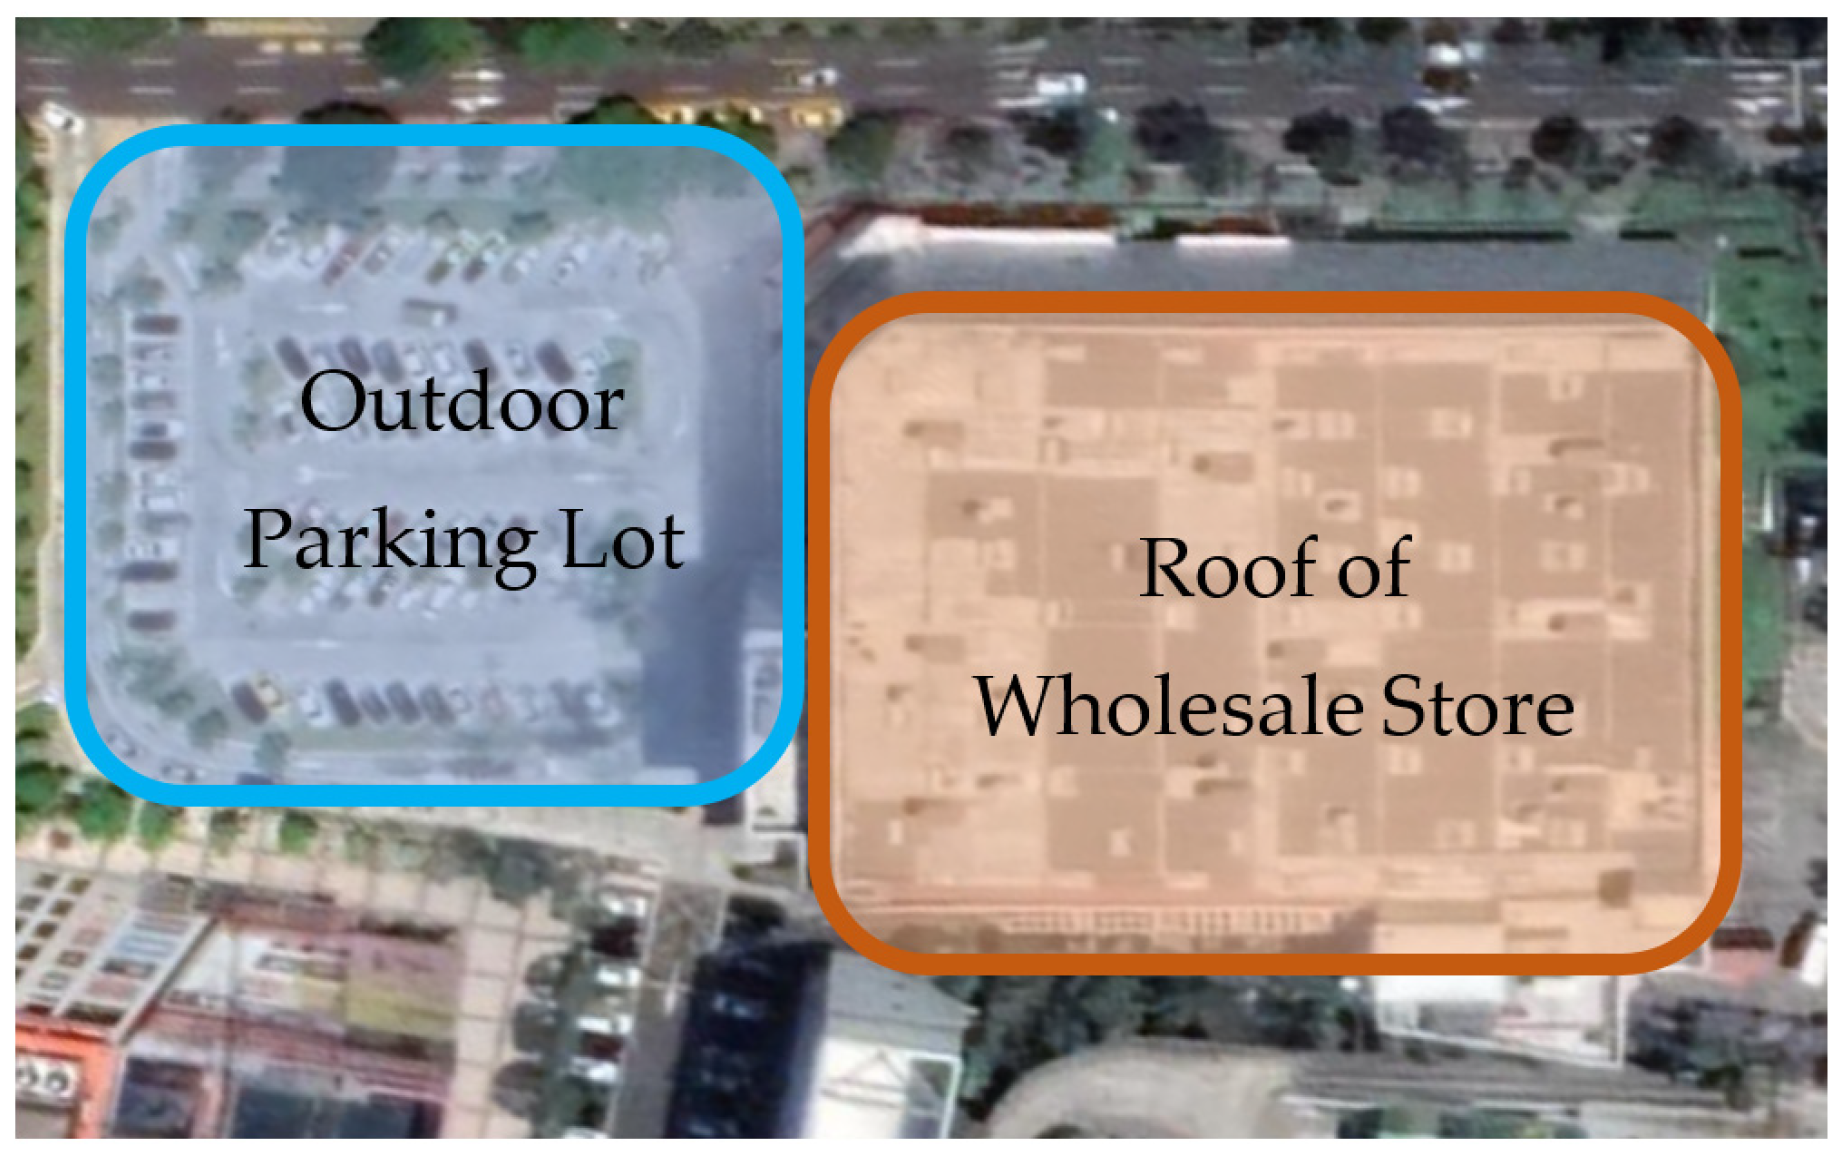
2.1. A Real-Wolrd Scenario

Illustrated by the case of a major wholesale store and its parking facility in a northern region of Taiwan, shown in Figure 1, this scenario exemplifies an abundance of unused rooftop spaces within the wholesale store premises. The outdoor parking lot presents the opportunity to install rain-shielding structures adorned with solar panels. Upon proportional assessment, both locations reveal the availability of at least 1000 square meters of space, sufficient to install approximately 450 kW of solar capacity.

2.2. Taipower Electricity Tariff of EV Charging and Swapping Facility

The Taipower Electricity Tariff for the EV Charging and Swapping Facility is shown in Table 1. It applies to high electricity demand users of charging and swapping facilities with contracted capacities. It contains three main features: a minimal basic fee, substantial peak-off peak price differential (exceeding TWD 6 per kilowatt-hour, three times the regular electricity tariff), and extended off-peak periods.

3. The Integrated System of Photovoltaic Energy Storage and Fast Charging Station

3.1. System Structure and System Size

Solar-and-energy storage-integrated charging stations typically encompass several essential components: solar panels, energy storage systems, inverters, and electric vehicle supply equipment (EVSE). Moreover, the energy management system (EMS) is integrated within the converters, serving to regulate the power output. This regulation enables control over the battery charging/discharging process in conjunction with the power generation from solar energy [12,13]. The system adopts a DC coupling architecture [10]. The DC bus voltage is set at 1500 V and eventually linked to the power grid via a power conversion system (PCS).
The solar installation, designed for a 1000 square meter rooftop area at the wholesale store, has an optimal capacity of 450 kW. This capacity is tailored to maximize solar energy capture within the limited space. In conjunction with this, the energy storage system (ESS) is configured based on Taiwan’s Ministry of Economic Affairs guidelines [14]. These guidelines not only provide a blueprint for integrating ESS with photovoltaic systems but also emphasize the importance of balancing energy generation and storage. This balance is evident in the system’s ‘Proportion of Configuration’, where the ESS power and capacity are set at ratios of 1.0 kW and 2.61 kWh, respectively, relative to the solar installation capacity of 1.5 kW. In practical terms, this translates to an ESS with an installation capacity of 300 kW and 800 kWh. These proportions ensure that the ESS capacity aligns with the energy demand and grid interaction requirements and maximizes overall system efficiency and sustainability. The detailed configuration of this integrated solar-and-energy storage smart charging station, adhering to the guideline proportions, is further illustrated in Table 2.
The EV charging station in this study is meticulously designed to feature eight 60 kW DC fast charging piles, a configuration that aligns with the current dominant trend in Taiwan’s EV charging infrastructure. This specific choice of 60 kW charging piles is informed by their prevalence and effectiveness in meeting the current demands of electric vehicles in the region. Moreover, the overall contracted capacity of the station is capped at 499 kW [15], in strict compliance with Taipower’s regulations for low-voltage supply contracts. This limit is a standard practice in Taiwan, reflecting a balance between the operational capacity of charging stations and the constraints imposed by local grid infrastructure. By adhering to this standard, the station ensures optimal compatibility with the existing electrical systems and regulatory frameworks while also catering to the practical needs of EV users. The architectural layout and the integration of the solar-and-energy storage system with the EV charging infrastructure are illustrated in Figure 2.
The charging station operates under the control of a Smart EMS. Upon an EV’s arrival at the station, the vehicle owner is prompted to set the departure time and target state of charge (SOC). The EMS is capable of autonomously adjusting charging strategies based on factors such as electricity tariffs, solar energy generation levels, energy storage system status, and vehicle charging demands. These energy management strategies aim to achieve optimal economic benefits.

3.2. Energy Storage System

The ESS utilizes lithium-ion battery cells, selected for their high energy density and efficient energy conversion. The estimated lifespan of these cells is around 10–15 years, a figure that is based on manufacturer specifications and empirical data gathered under typical operational conditions. This lifespan projection incorporates various factors, including the number of charge–discharge cycles, depth of discharge, operational temperature, and the effectiveness of battery management practices. These batteries are notable for their high round-trip efficiency and rapid responsiveness, making them particularly suitable for critical functions such as smoothing out solar energy fluctuations, aligning with time-based electricity pricing to reduce peak demand, participating in electricity price arbitrage, avoiding penalties associated with operating charging stations beyond their contracted capacities, and ensuring a steady power supply to these stations.
The equivalent model of lithium-ion battery employed in this study is based on the battery model proposed by Tremblay [16]. The output voltage, discharge voltage, and charge voltage are, respectively, derived from Equations (1)–(3).
V B A T = E B A T R i n t i
E b a t d i s = E 0 K Q Q i t i t + i * + A e B   i t
E b a t c h = E 0 K Q i t 0.1 Q i * K Q Q i t i t A e B   i t
where V b a t is the output voltage of the battery, E b a t d i s is the discharge voltage of the battery, E b a t c h is the charge voltage of the battery, E B A T is the no-load voltage of the battery, R i n t is the internal resistance of the battery, i is the battery current, E 0 is the battery constant voltage, K is the polarization constant, Q is the battery capacity, i t is the actual battery charge, i * is the filtered current, A is the exponential zone amplitude, and B is the exponential zone time constant inverse.
Regarding the treatment of losses and round-trip efficiency in the battery system, the current model does not explicitly quantify these aspects. This approach stems from the inherent complexities involved in accurately calculating both round-trip efficiency and system losses, which can vary significantly based on specific usage patterns, environmental conditions, and battery aging. Round-trip efficiency, in particular, is a crucial parameter that can impact overall system performance; however, its precise value is challenging to determine due to fluctuations in operational conditions and the efficiency of energy conversion processes. Similarly, the losses in the battery system, which may include factors such as thermal losses, energy conversion inefficiencies, and degradation over time, are also not directly accounted for in the model. These exclusions are a reflection of the difficulties in providing a one-size-fits-all quantification for these parameters, given their dependency on a wide range of variables.
According to the system design, the energy storage device has a capacity of 300 kW/800 kWh. Taking into account the depth of discharge (DoD) of the lithium-ion battery, the SOC is set to be between 20% and 90%. The SOC calculation method is shown in Equation (4), and this capacity ensures the system can sustain the provision of charging services for a certain duration.
S O C % = S O C 0 ( % ) i d t Q × 100 %
where S O C and S O C 0 are the remaining quantity of electricity available in the ESS at the current and previous moments, excluding additional losses and the rate of battery degradation.

3.3. Supervisory Platform of EMS

The EMS of the charging station is equipped with a Supervisory Control and Data Acquisition (SCADA) system to achieve the following functions:
(1)
Control and Supervision: This part is primarily responsible for the design of optimization and control strategies. It discerns varying operational messages from EVs based on time and allocates the power plans formulated for each time point to the battery, EVs, and grid interface.
(2)
Data Collection: Through an industrial computer, the charging station periodically retrieves system data, including power, voltage, phase angle, and charging and discharging times. Simultaneously, the computer also accesses information from the environmental service database, such as sunlight, ambient temperature, humidity, and wind speed. These data points are consolidated, stored, and transmitted to a cloud server for subsequent data processing.
(3)
Monitoring and Visualization: Through Human–Machine Interface (HMI) software, interaction and information exchange are facilitated between the system and users. This empowers users to monitor real-time information such as grid-supplied power, environmental conditions, power generated by photovoltaics (PV), profits, and costs via an intelligent panel. The control end collaborates in generating cumulative charts or tables at various time intervals (daily, weekly, monthly, and overall). Additionally, personalized settings are adjustable, encompassing language translation and the customization of EV charging preferences (e.g., fast charging or other special requirements).
(4)
Communication and Connectivity: The converter, EV supply equipment (EVSE), industrial computer, and intelligent panel are all linked to the backend server through Internet Protocol (IP) configuration. Communication is established via HTTP with any network client, enabling remote web services. Moreover, on-site sensors and other RS485 communication devices can potentially acquire data through wireless means.

4. Smart EMS Control

The charging station operates under the control of a Smart EMS. Upon an EV’s arrival at the station, the EV owner is prompted to set the departure time and target state of charge (SOC). The dynamic energy management strategies will prioritize the energy storage system for electric vehicle charging during high-priced peak hours (refer to Table 1). During low-priced off-peak hours, if it is daytime, solar energy will be directly utilized for EV charging; if it is nighttime, grid electricity will be employed for either the ESS or EV charging.

4.1. Dynamic Energy Management System Strategy

The EMS employed in this solar-and-energy storage-integrated charging station is designed to optimize the usage of solar energy, particularly for EV charging. This prioritization aligns with the overarching goal of maximizing renewable energy utilization, reducing dependence on grid-supplied electricity, and minimizing the carbon footprint of the charging process. The EMS dynamically manages the power flow, giving precedence to EV charging during periods of high solar energy availability. This strategy not only leverages the environmental benefits of solar power but also aims to lower operational costs by using self-generated energy, which is generally more cost-effective compared to grid electricity, especially when considering the long-term investment in solar infrastructure.
The EMS systematically addresses the charging needs of electric vehicles based on several parameters, including the current SOC of the EV, desired SOC, battery capacity, current time, and planned departure time. The system incorporates a 5 min buffer period to approximate actual EV charging behavior, enhancing the accuracy of its demand forecasts. This information, along with the ESS’s SOC and the current TOU electricity tariff, is integrated into Equation (5). In considering the losses of the ESS, as mentioned in the previous battery content, given the difficulty in accounting for and accurately calculating numerous physical parameters, these are initially omitted to facilitate the feasibility of model computation and construction. When the cumulative charging demand surpasses the station’s contracted capacity, the EMS proportionally allocates power among the EVSEs based on individual EV requirements Equation (6), facilitating the computation of each vehicle’s charging power Equation (7). The total power demand of the station is then determined by summing the individual charging powers Equation (8).
P E V i = ( S O C E V i d S O C E V i ( t ) ) C E V i t d i t t  
p i = ( S O C E V i d S O C E V i ( t ) ) C E V i t d i t t × 1 P d e m  
P E V i l i m i t = p i × P m a x      
P d e m = i = 1 N E V P E V i
where P E V i is the charging power under typical circumstances, S O C E V i d is the desired state of charge, S O C E V i is the current SOC of the EV at the charging station, C E V i is the battery capacity, t is the current time, t d i is the departure time, t is the buffer period before the charging ends, p i is the ratio of charging power, P d e m is the total station power demand, P E V i l i m i t is the individual electric vehicle charging power, P m a x is the maximum power that can be provided to the charging station by the system, and N E V is the total number of electric vehicles.
The overarching control strategy of the EMS gives priority to EV charging, aiming to maximize the use of solar energy. Following this, it addresses the charging of the energy storage system. Any excess electricity is then flexibly allocated to other loads within the system or fed back into the grid. In instances where the energy in the ESS is depleted (SOC lower than 20%), the EMS will source power from the grid to maintain continuous operation.
Furthermore, the EMS also executes real-time adjustment strategies based on the conditions of solar energy, ESS, and the grid. This encompasses utilizing the ESS to smooth out solar energy fluctuations, achieved through a Moving Average method (MA) where the average of the preceding n instantaneous solar power values is calculated, as depicted in Equation (9).
P M A t = P P V t 1 + P P V t 2 + + P P V t n n
where P M A t is the PV output power achieved through a Moving Average method at time t, P P V t is the PV output power at time t, and n is the division number of time.
Even in cases where grid electricity may be more cost-effective, the prioritization of solar energy is crucial to prevent the waste of this valuable resource. Once the solar infrastructure is established, the energy it generates becomes an integral asset. Therefore, optimizing the use of solar power is essential, regardless of the fluctuating costs of grid electricity.
This dynamic energy management strategy primarily distinguishes three time periods within a day, based on the Taipower Electricity Price of EV Charging and Swapping Facility shown in Table 1:

4.1.1. Off-Peak Daytime Hours (Summer 6:00–16:00/Non-Summer 6:00–15:00)

The primary source of power for the charging station is PV energy. When the PV generation exceeds the power demand of the station, the excess energy is supplied to the station’s needs, and the surplus is exported to the grid. However, if the exported power to the grid exceeds the contractual capacity, priority is given to charging the ESS. Once the ESS reaches its maximum capacity, any additional solar power generation is curtailed to prevent wastage, a process known as ‘curtailment for protection.’ Conversely, during periods when PV generation falls short of the station’s power needs, the station first draws additional power from the grid, staying within the contracted capacity limits. Only if this grid-supplied power proves insufficient will the station then draw from the ESS. For a detailed illustration of this energy management process, please refer to Figure 3.

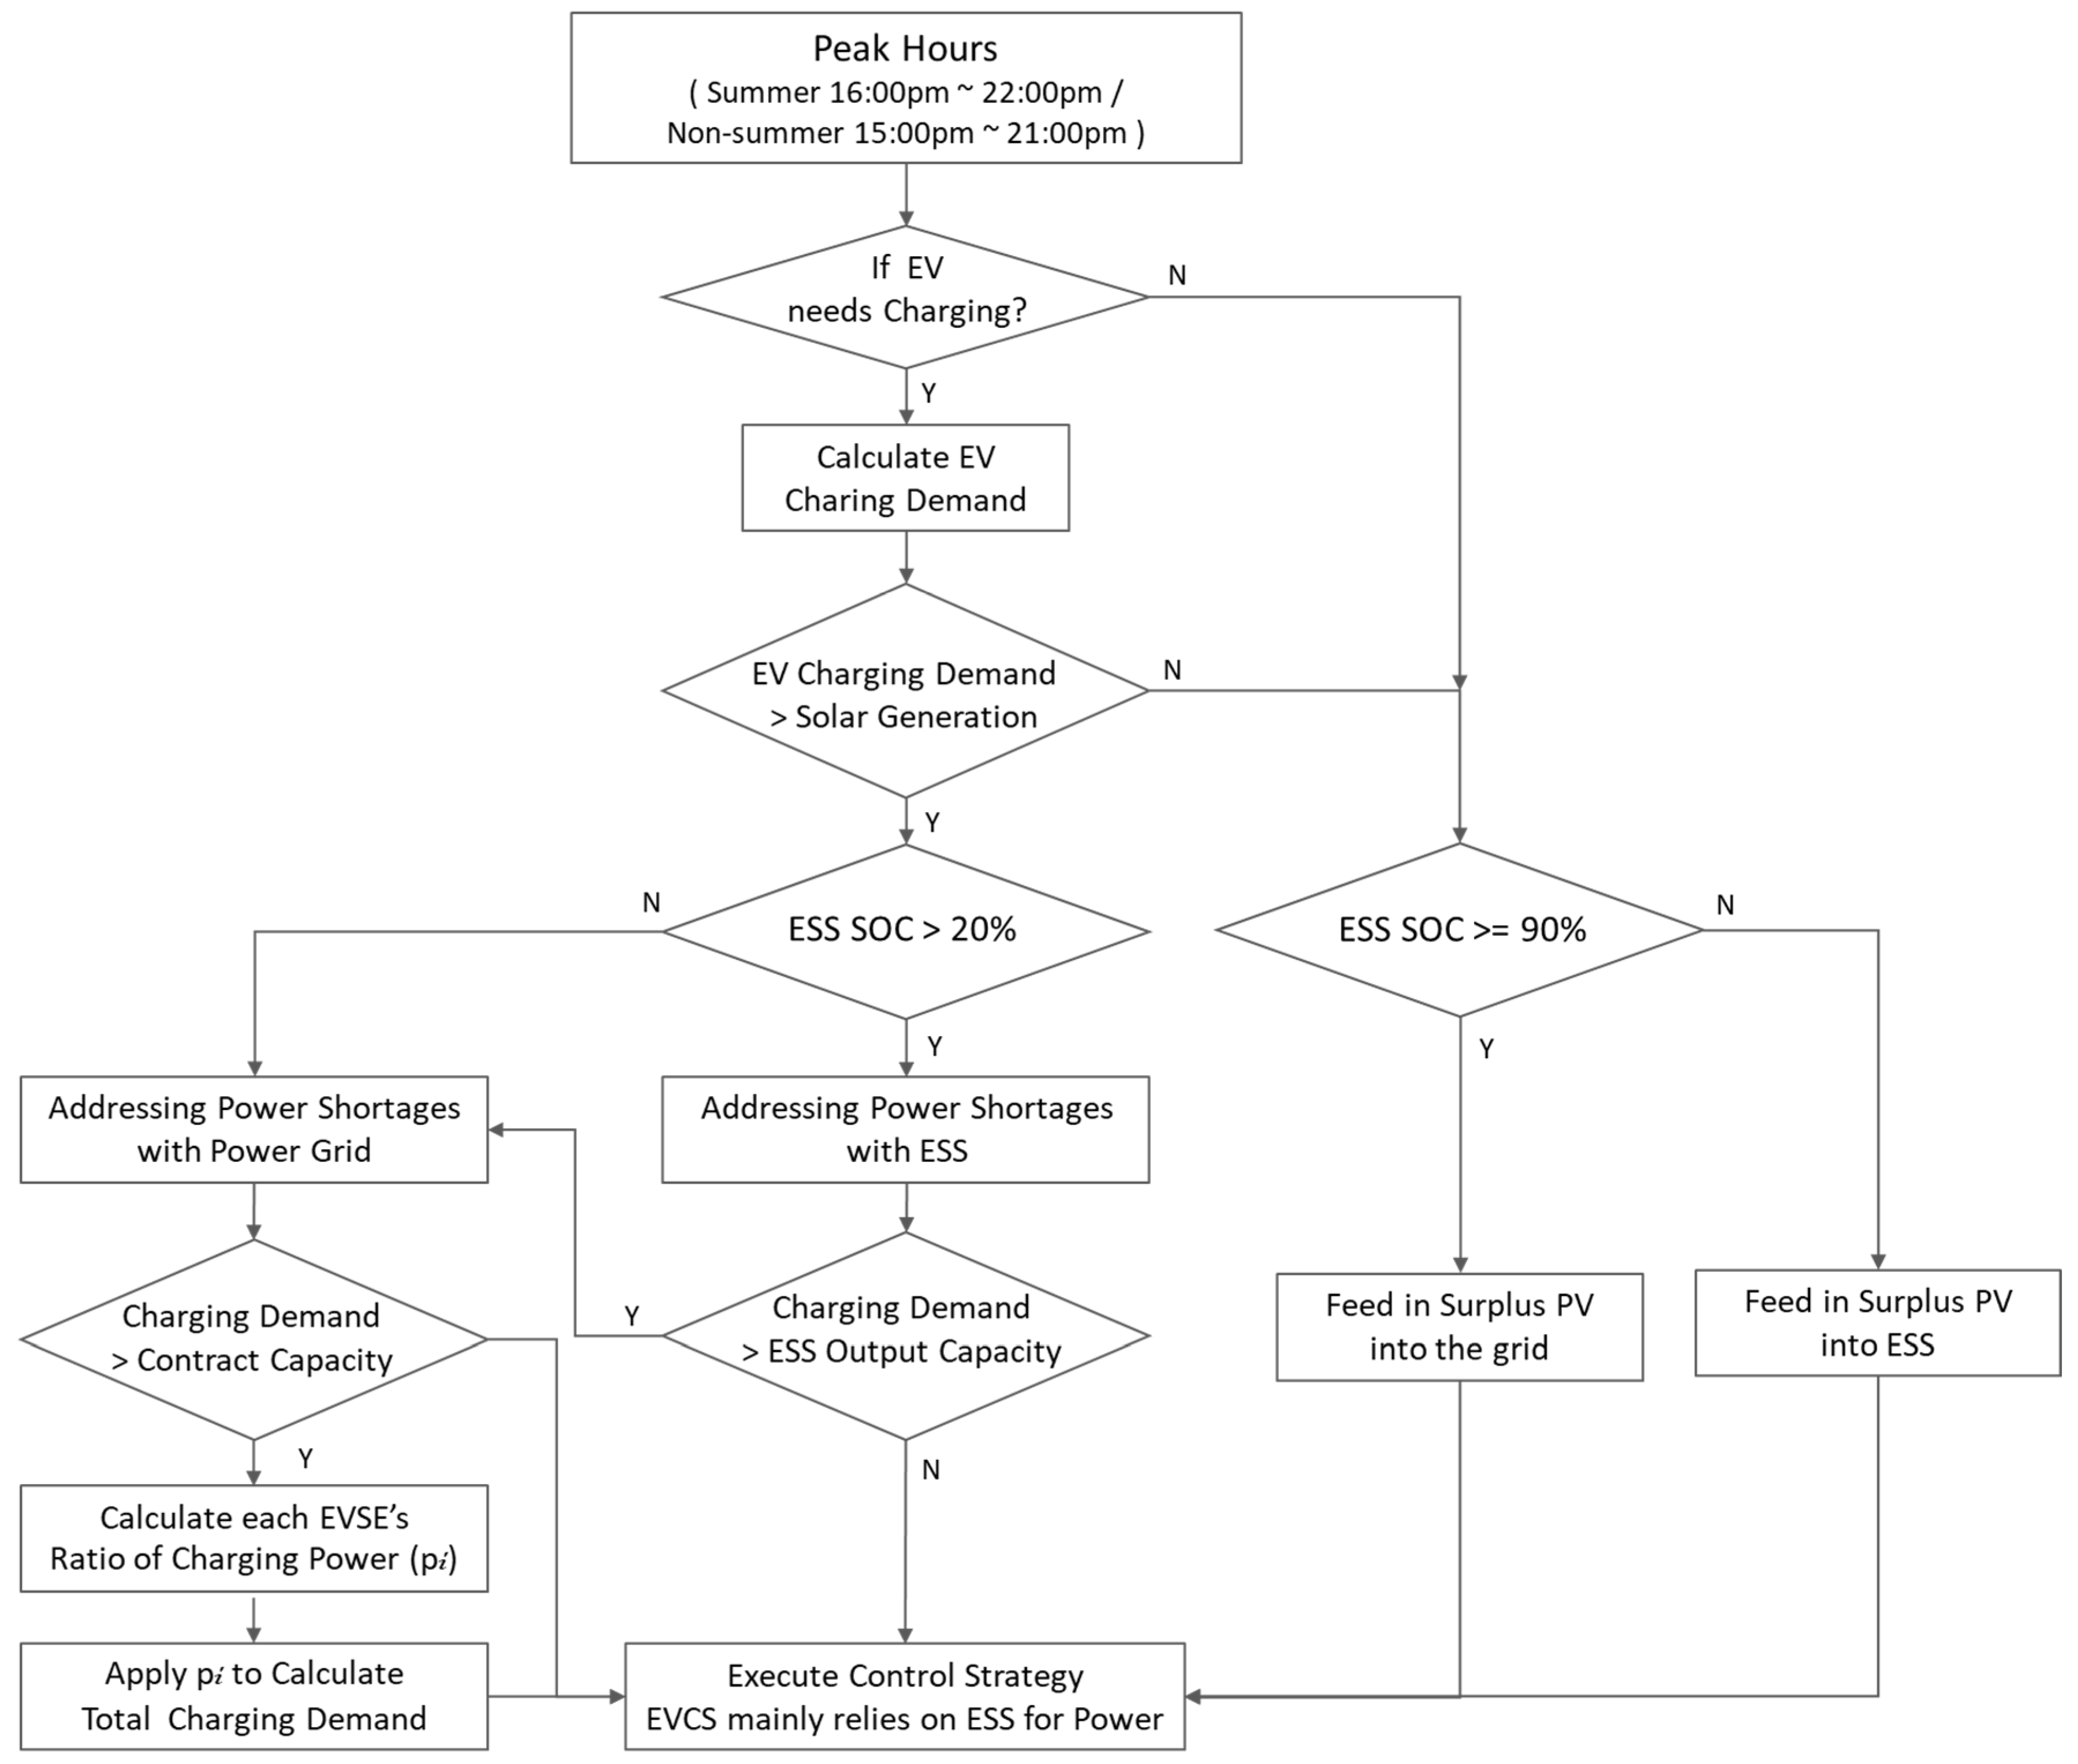
4.1.2. Peak Hours (Summer 16:00–22:00/Non-Summer 15:00–21:00)

The primary objective of the control strategy is to maximize the use of the ESS and minimize reliance on grid electricity. When solar energy generation exceeds the station’s power needs, it first meets these needs, with any excess energy directed to charge the ESS. Once the ESS reaches its full capacity, surplus solar power is then exported to the grid. Conversely, when solar output is insufficient to meet the station’s power requirements, the deficit is primarily covered by the ESS. If the ESS cannot fully compensate for the shortfall, additional power is sourced from the grid. However, if the additional power required from the grid exceeds the contracted capacity, the system will distribute the available power according to predefined priorities, ensuring that the station operates within its contractual limits. For a detailed illustration of this energy management process, please refer to Figure 4.

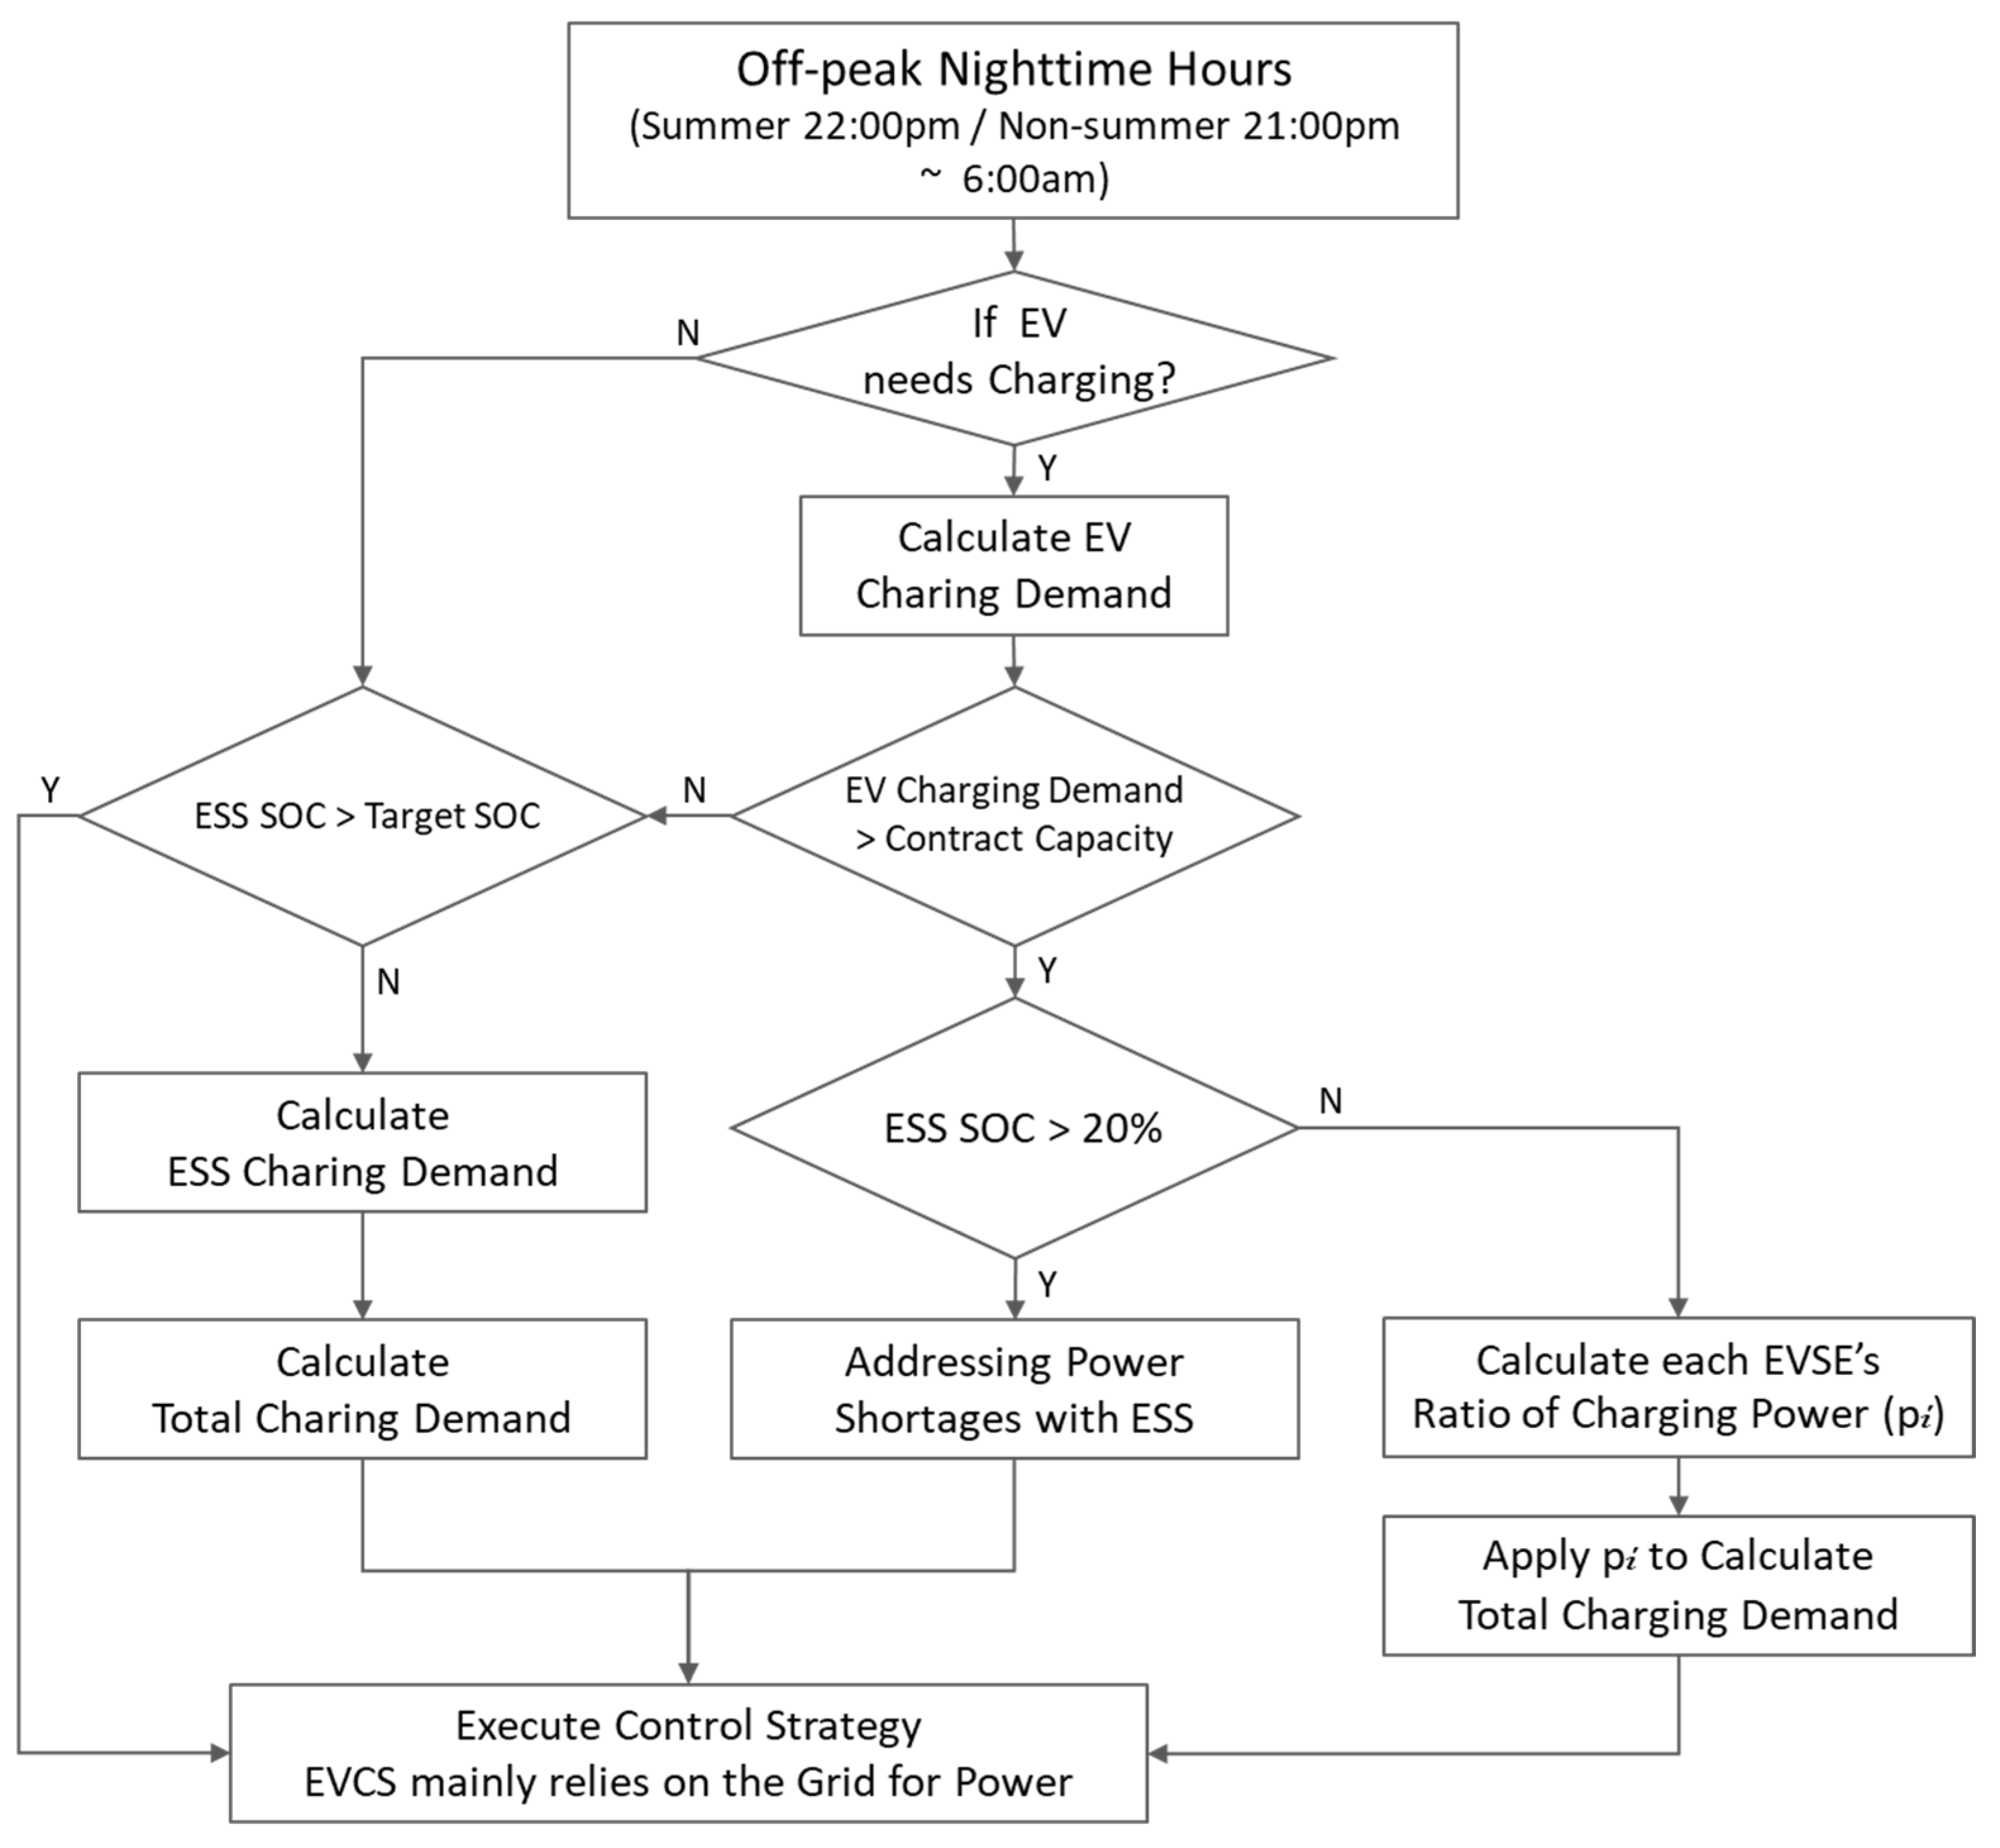
4.1.3. Off-Peak Nighttime Hours (Summer 22:00–6:00/Non-Summer 21:00–6:00)

The primary objective of the control strategy is to manage the power requirements of the charging station, ensuring optimal use of grid electricity while adhering to contracted capacity limits. In this phase, if the charging station requires power, the demand is initially met by the grid. However, if the required grid power exceeds the station’s contracted capacity, the system adjusts the power available from the ESS to keep the total power usage within contractual limits. In cases where the ESS cannot provide sufficient power to meet the demand, the system proportionally allocates power based on the p i , ensuring the station operates within its contracted capacity. Additionally, when the ESS has not reached its targeted state of charge and there is surplus capacity within the grid contract, the grid will charge the ESS. For a detailed illustration of this energy management process, please refer to Figure 5.

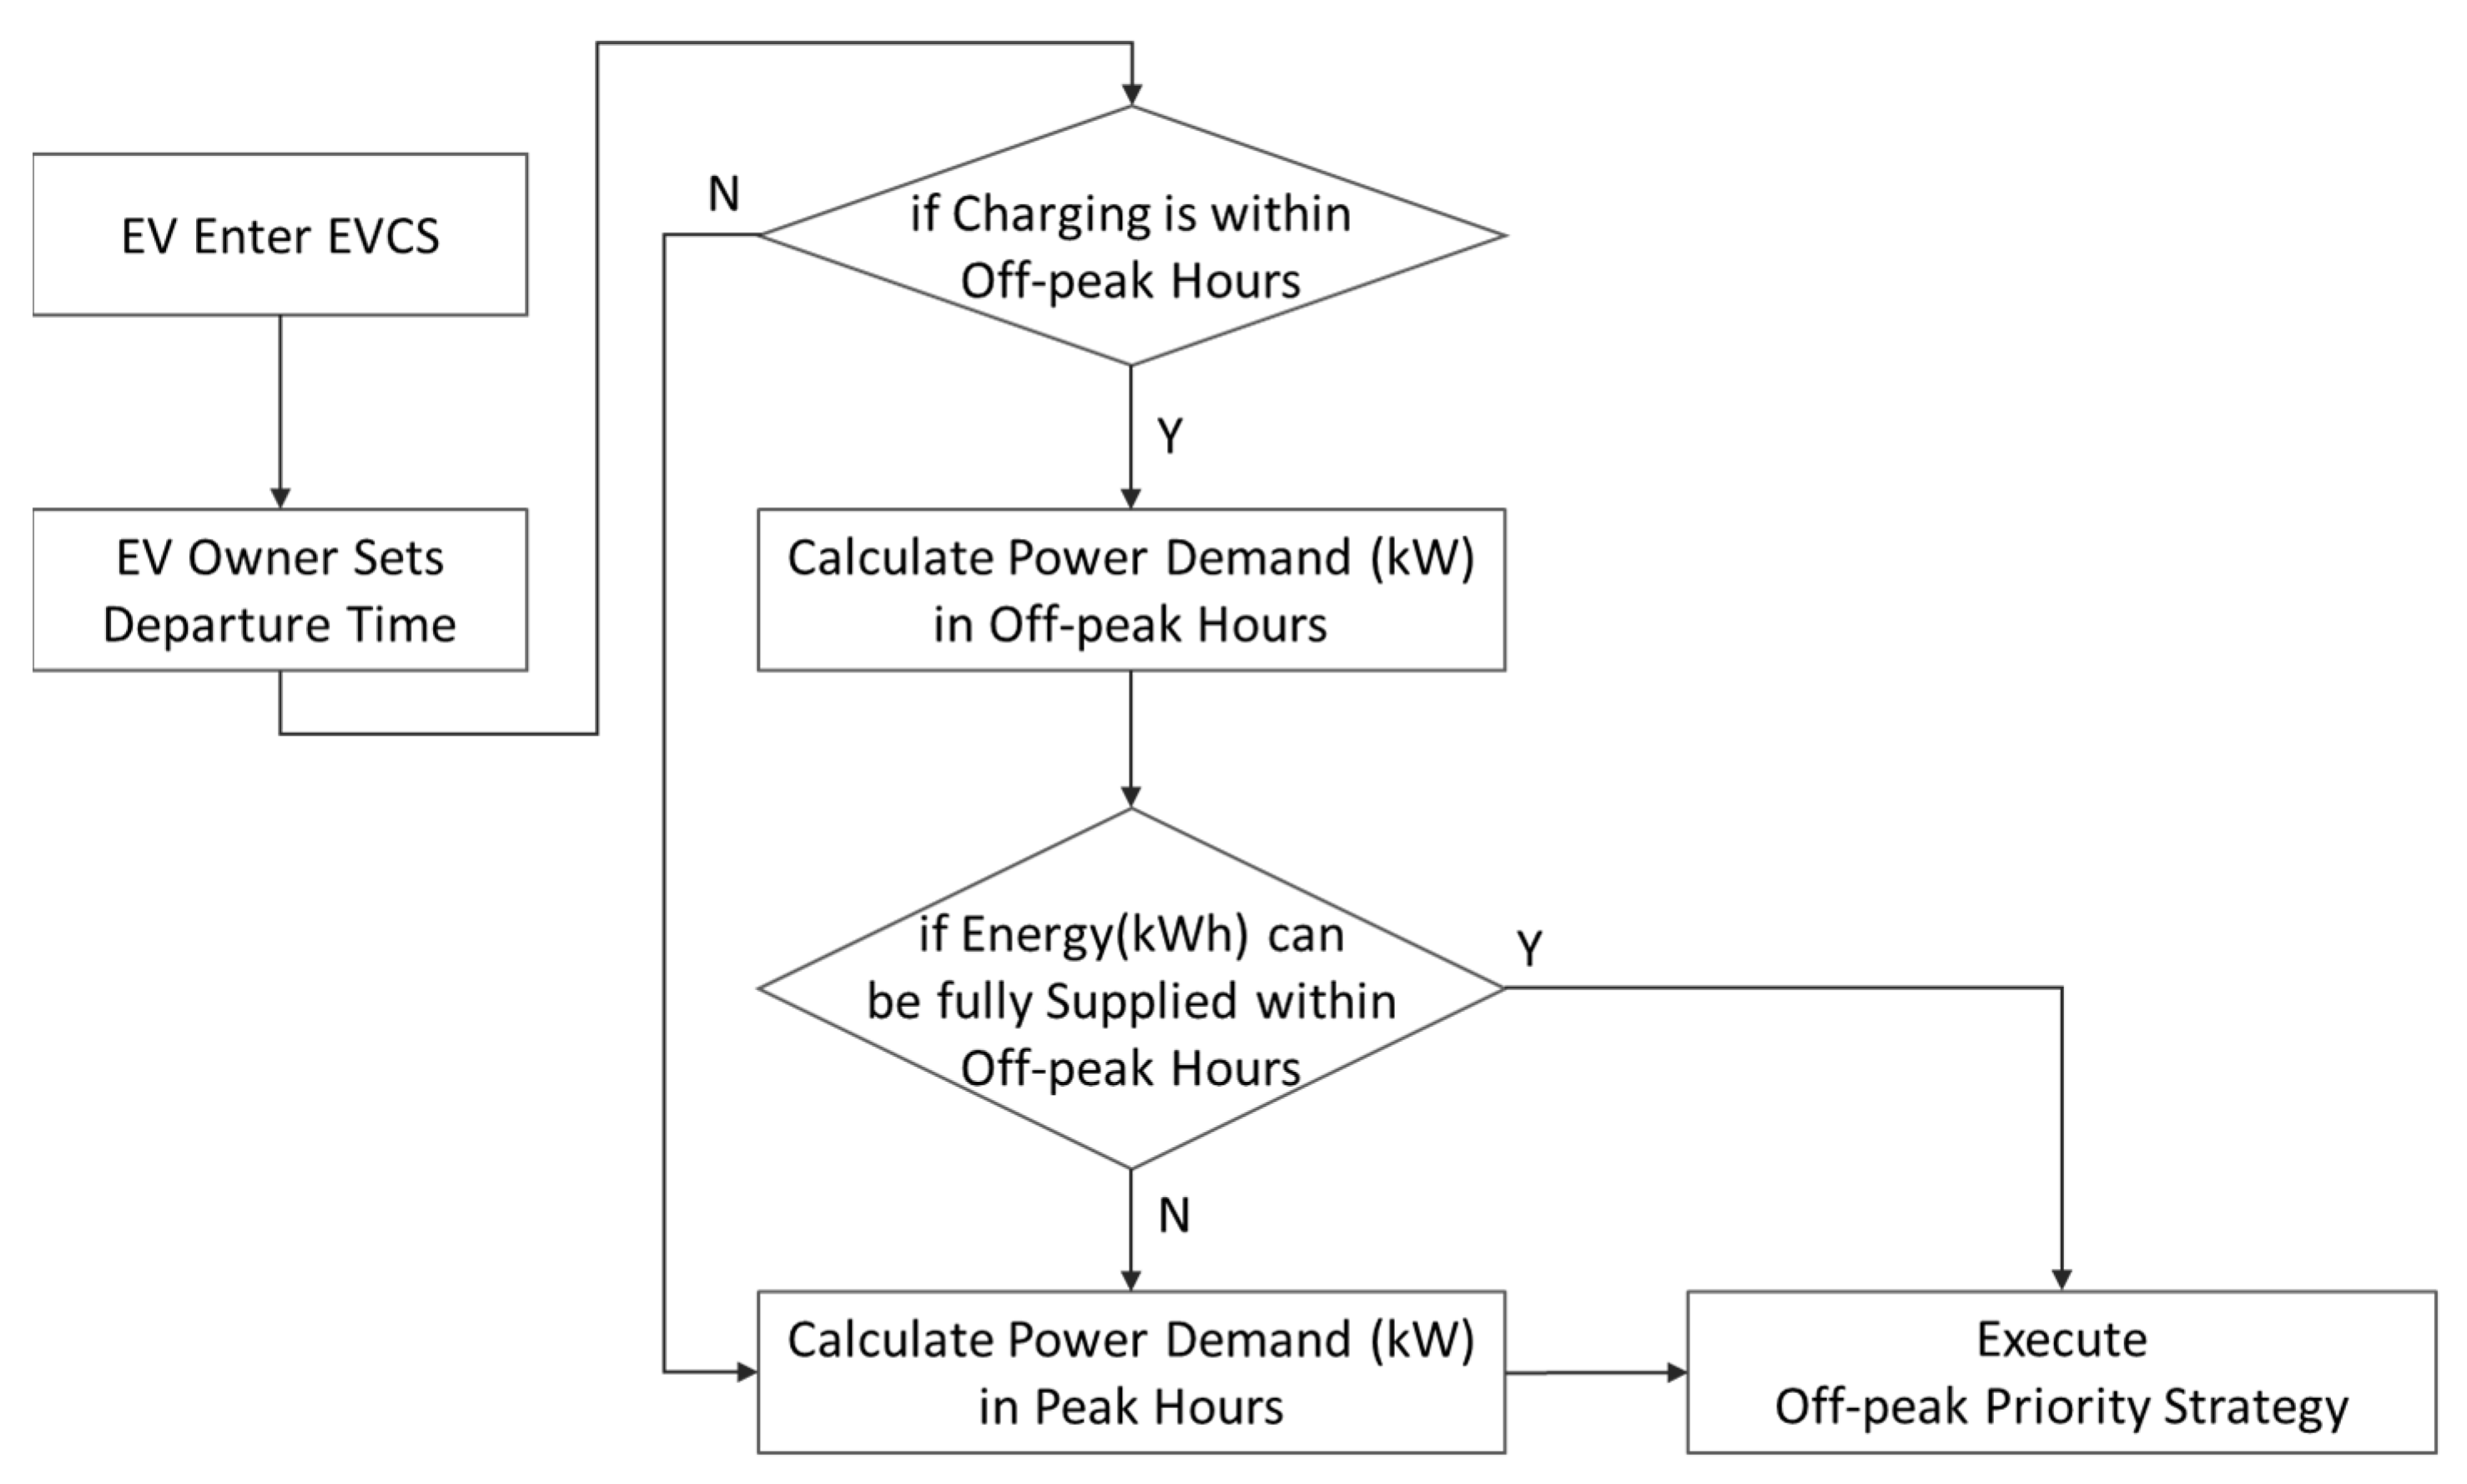
4.2. Off-Peak Priority Strategy

The departure time of an EV is set upon its entry to the station. This control strategy also optimizes the charging time slots for EVs, aiming to conduct charging primarily during off-peak hours. The flowchart for the off-peak priority charging strategy is presented below. For a detailed illustration of this energy management process, please refer to Figure 6.

5. Simulation Inputs and Results

5.1. Simulation Inputs

5.1.1. PV Power Generation

Utilizing Python, a model for the electric vehicle charging station (EVCS) was constructed to validate simulation results under PV generation conditions for 30 days each in summer and winter. The simulation was conducted using historical data from a Taiwan central region solar farm for the periods of 1 July 2022 to 30 July 2022 and 1 January 2023 to 30 January 2023. The total electricity generation for July amounted to 60,792.89 kWh, approximately 1.5 times the electricity generation of 40,756.35 kWh observed in January.

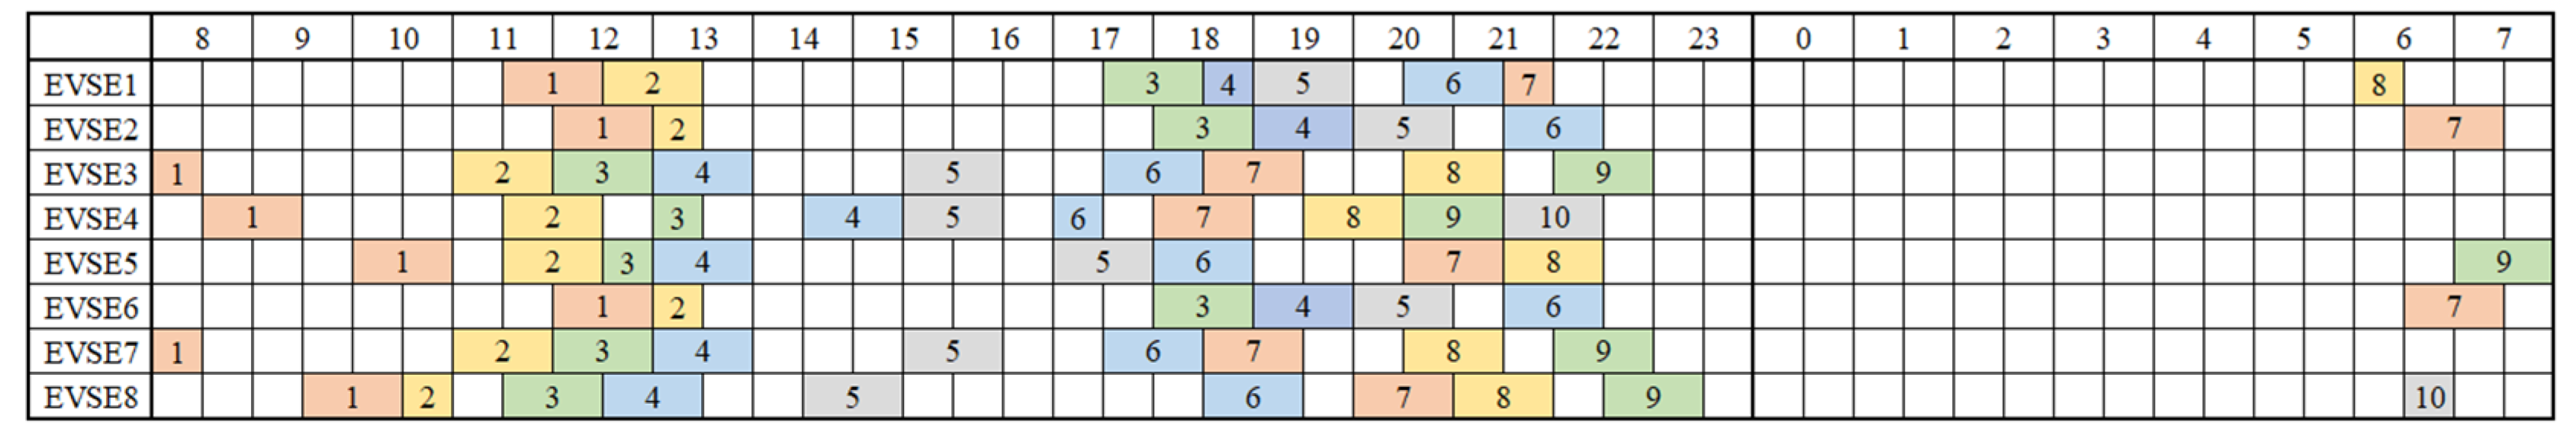
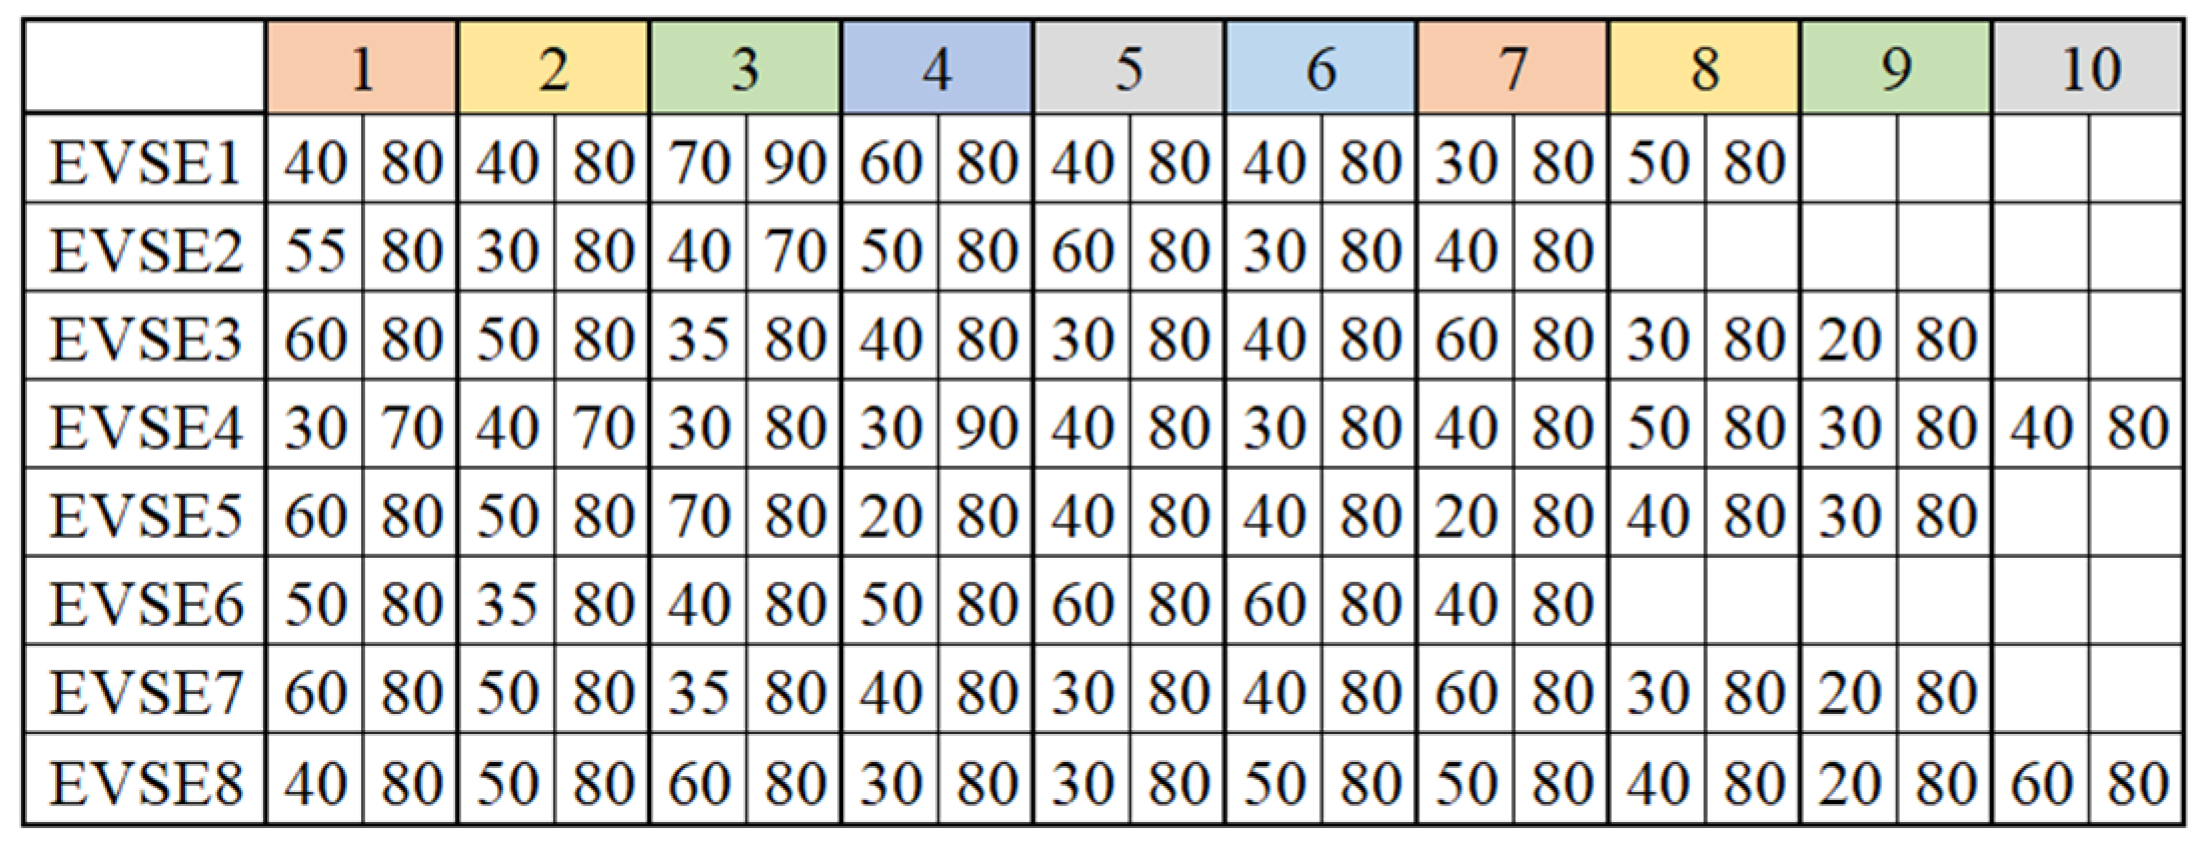
5.1.2. Charging Demand

In this study, the operational scheduling for each EVSE is meticulously outlined in Figure 7. This table provides a detailed timetable of utilization for each charging pile, 1 to 10 represent the variable number and variable duration of charging operations for each EVSE, indicating the specific hours during which they are engaged in charging activities. Figure 8 provides information about the electric vehicles using each EVSE. It specifically lists the entry and departure SOC for the EVs that utilize each charging pile. The relationship between Figure 7 and Figure 8 is pivotal for understanding the charging behaviors and requirements at each EVSE.

5.1.3. Others

Regarding the input tariff for the analysis of EVCS operational benefits, the existing costs and pricing structures in Taiwan are referenced. A cost of 3.1 TWD per kWh is considered for solar energy, while a feed-in tariff of 3.9 TWD per kWh is utilized. The ESS incurs a fixed and operational cost of 55,000 TWD per month. The EVCS generates revenue of 9 TWD per kWh of electricity sold. Construction costs are temporarily excluded from consideration. The grid tariff (electricity cost of the EVCS) is in line with the rates outlined in Table 1, “Taipower Electricity Tariff of EV Charging and Swapping Facility”.
In order to verify the effectiveness of implementing EMS in reducing the contracted capacity of the EVCS, this study examines and analyzes the operational scenarios for four different contracted capacities: 499 kW, 400 kW, 300 kW, and 250 kW. A comparative analysis is conducted. The scenario without EMS, PV, and ESS is also simulated and compared simultaneously.

5.2. Simulation Results

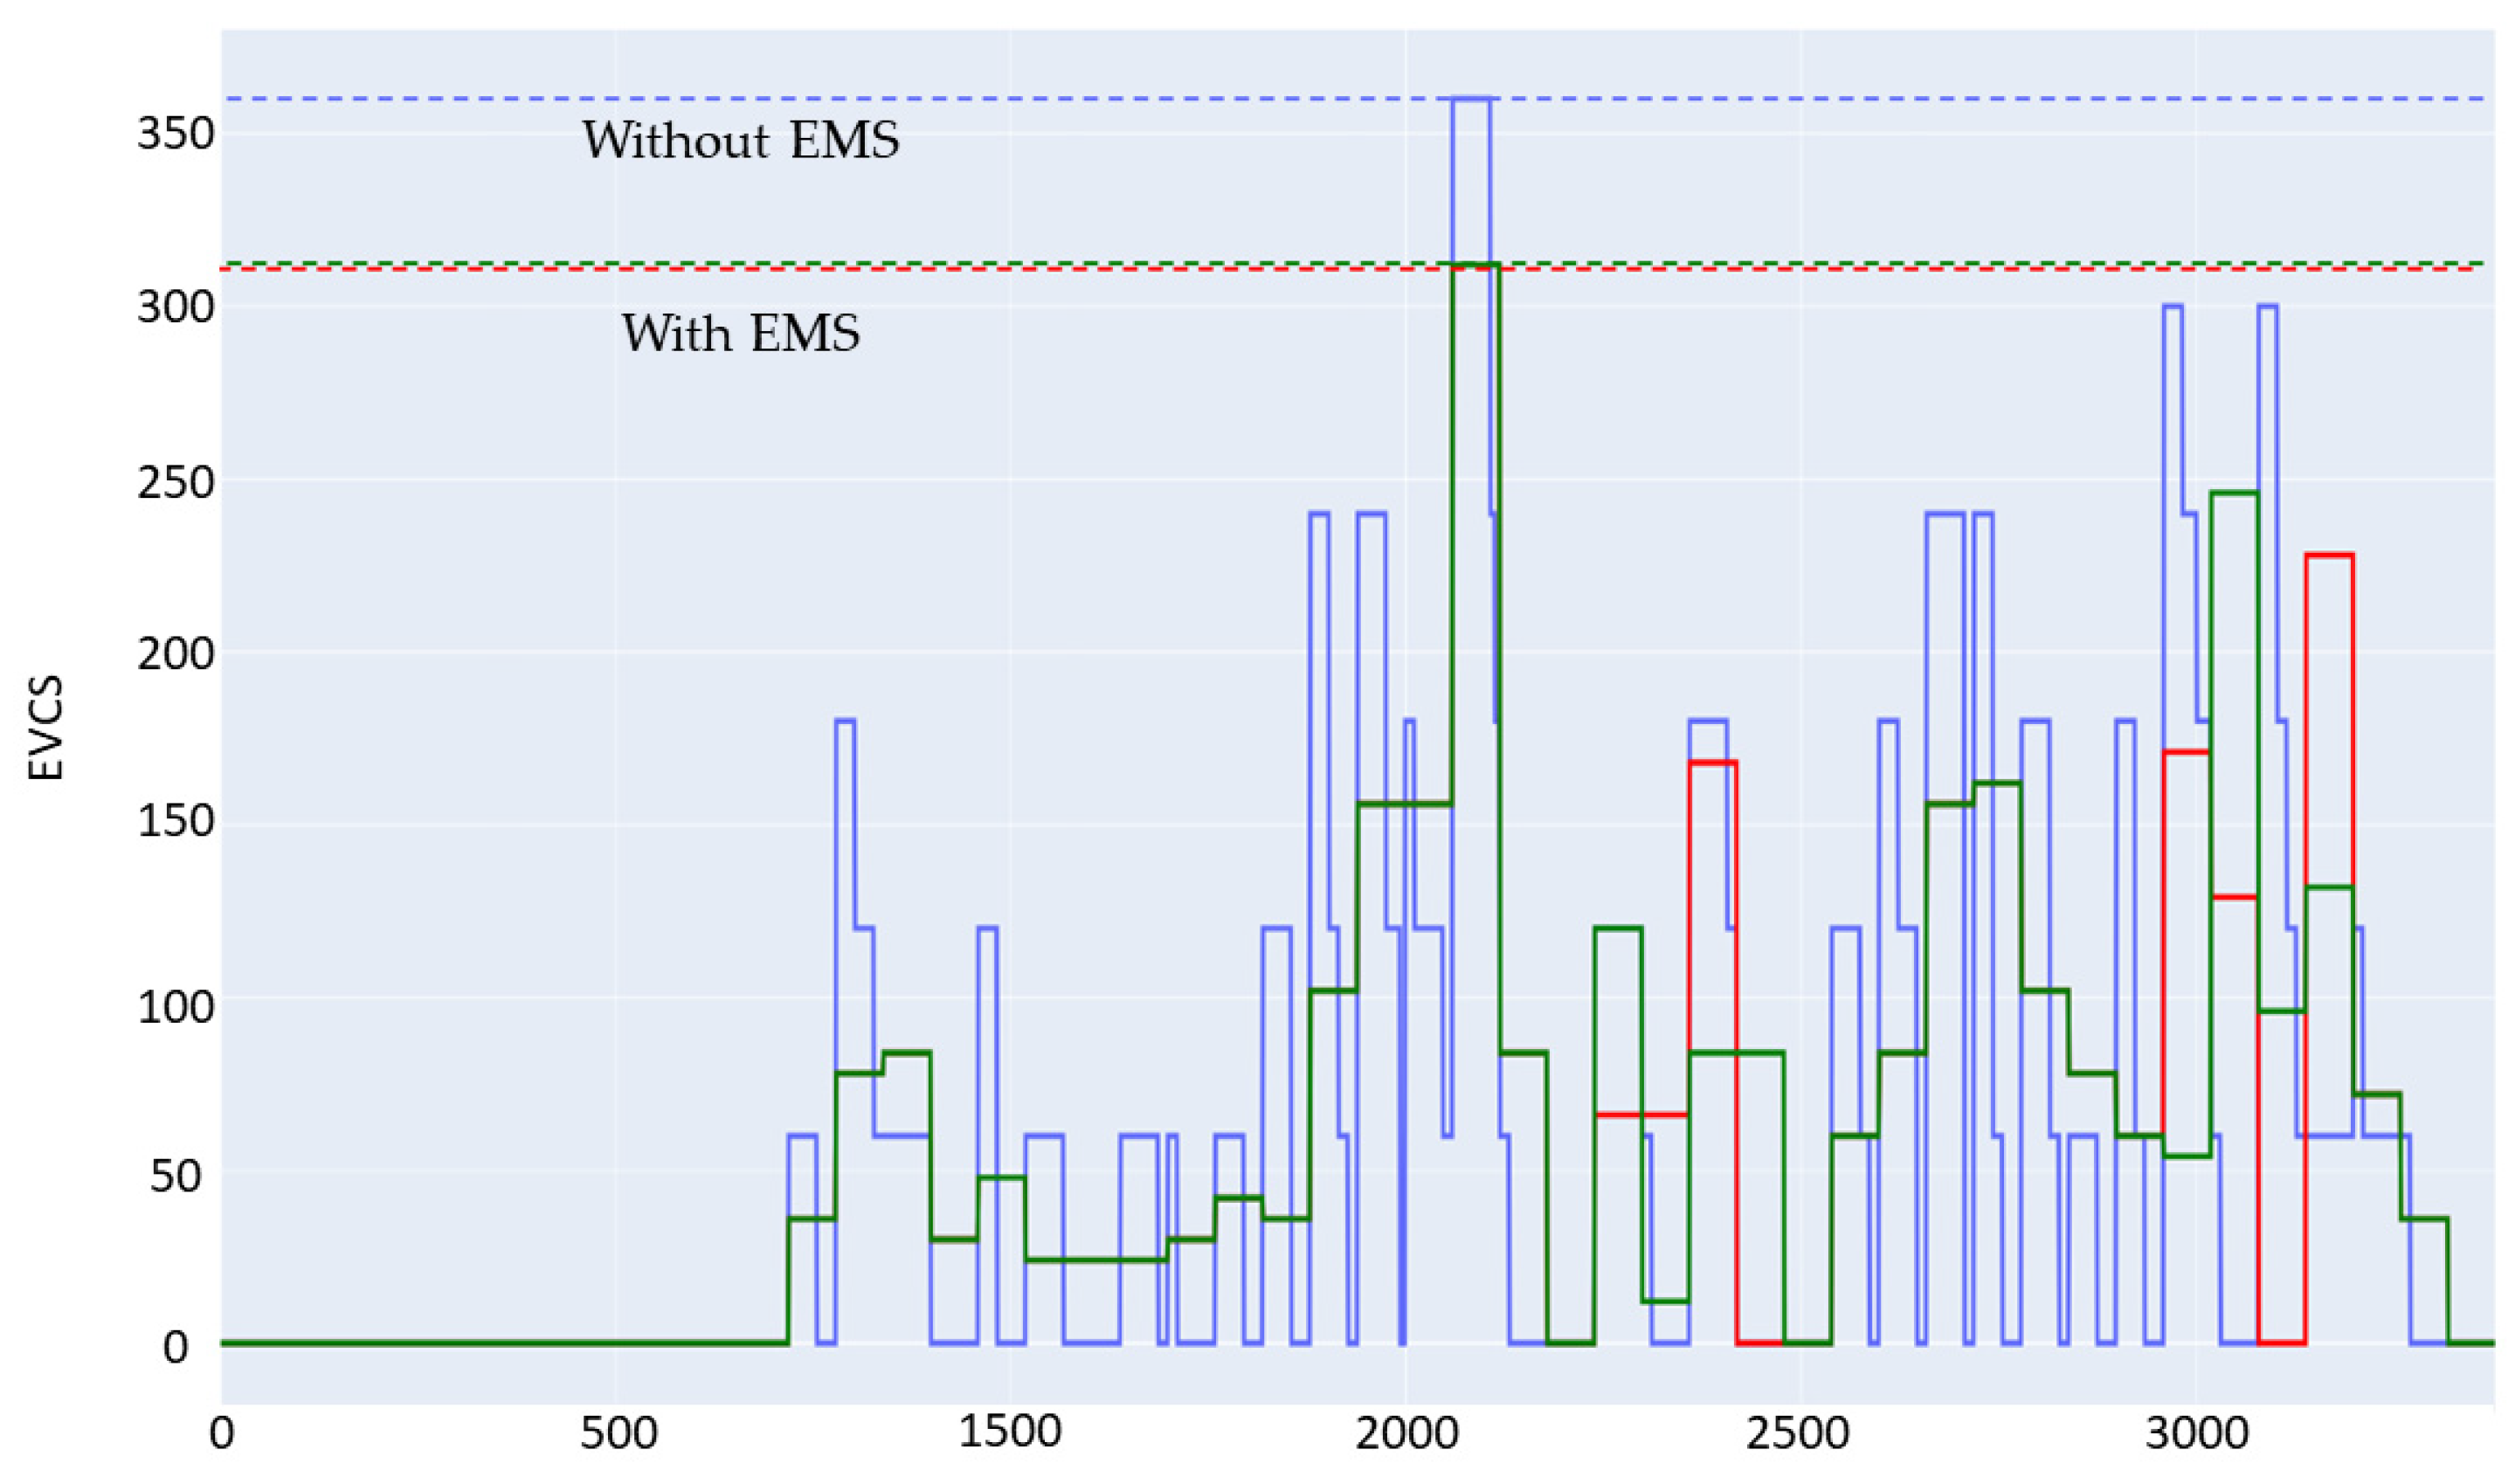
5.2.1. Charging Power Comparison—With and without Smart EMS

The results of simulated power demand for the EVCS are presented in Figure 9. The blue line represents the temporal profile of total charging power without implementing EMS, PV, and ESS. The red line illustrates the power profile during the summer months when the proposed EMS is applied. The green line depicts the power profile during non-summer months with the implementation of the EMS. (The overlapping portions of the red and green lines are displayed in green). The results demonstrate that upon implementing the control strategies proposed in this study, uniform current control can be achieved during EV charging, leading to a smoother power demand profile for the charging station. This not only contributes to the preservation of EV battery life but also facilitates a reduction in the required contracted capacity of the EVCS.

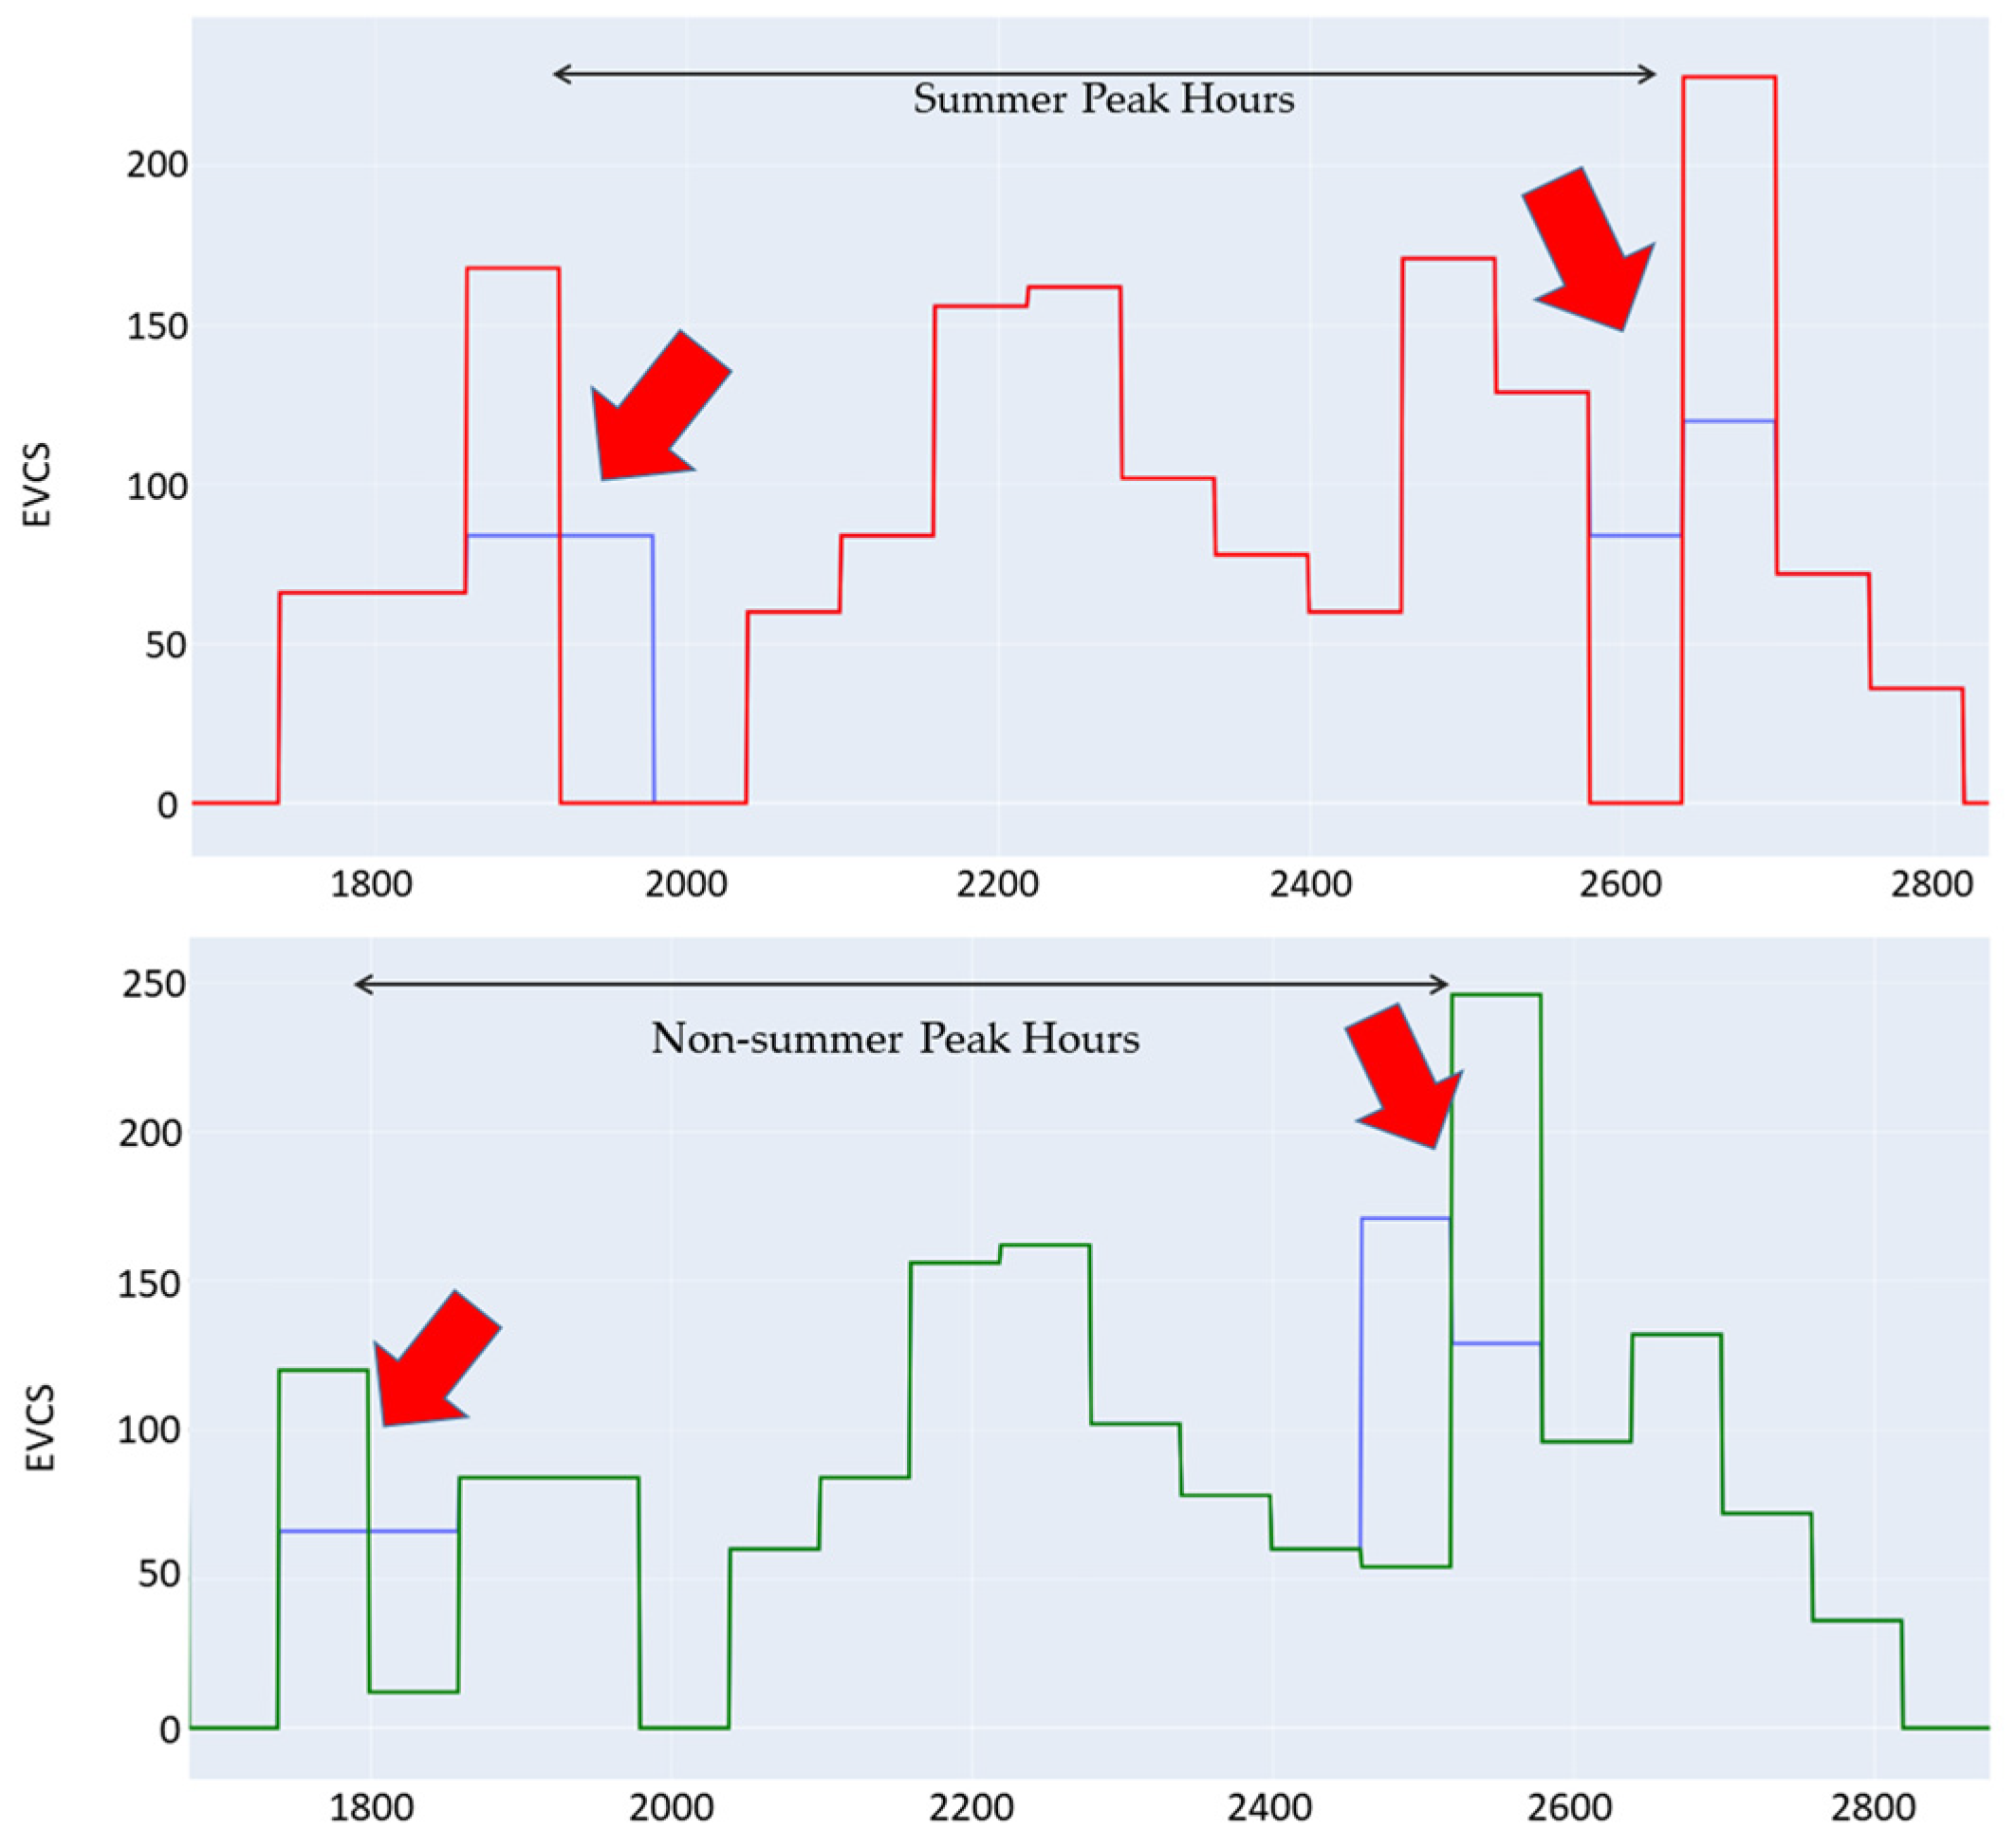
5.2.2. Charging Power Comparison—Off-Peak Priority Strategy

From Figure 10, it can be observed that the off-peak priority charging strategy exhibits control responses during both summer and non-summer months. The blue line represents the conventional uniform current control, while the red and green lines correspond to the charging power temporal profiles of the EVCS with the off-peak priority charging strategy implemented during peak and off-peak hours in summer and non-summer months, respectively. It is evident that this strategy effectively shifts the charging load to off-peak periods.

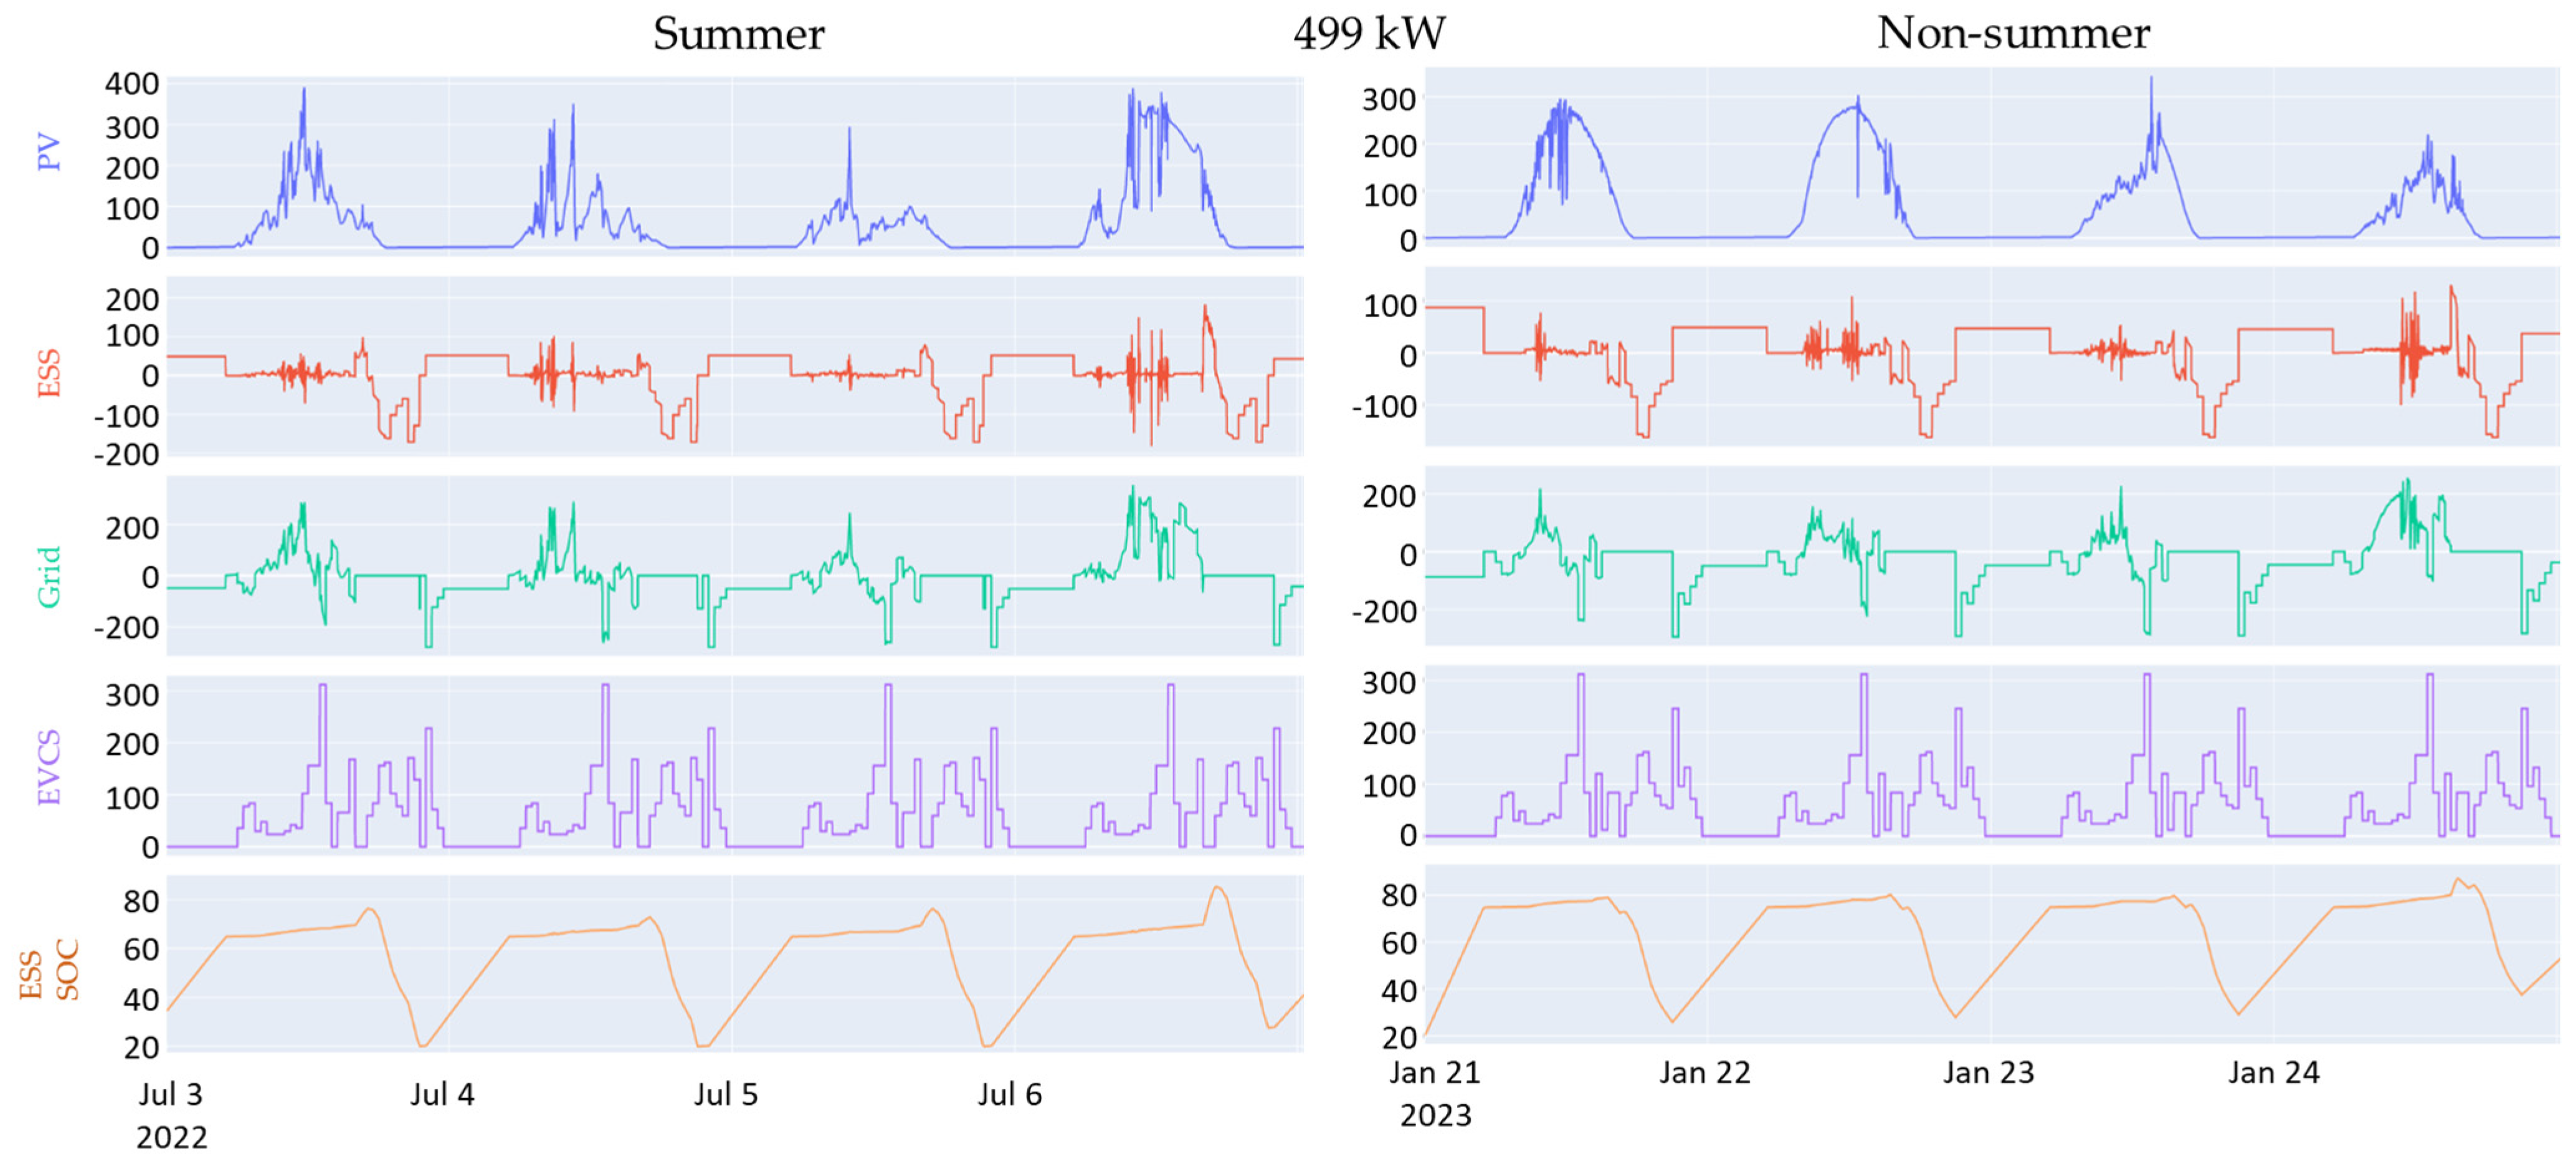
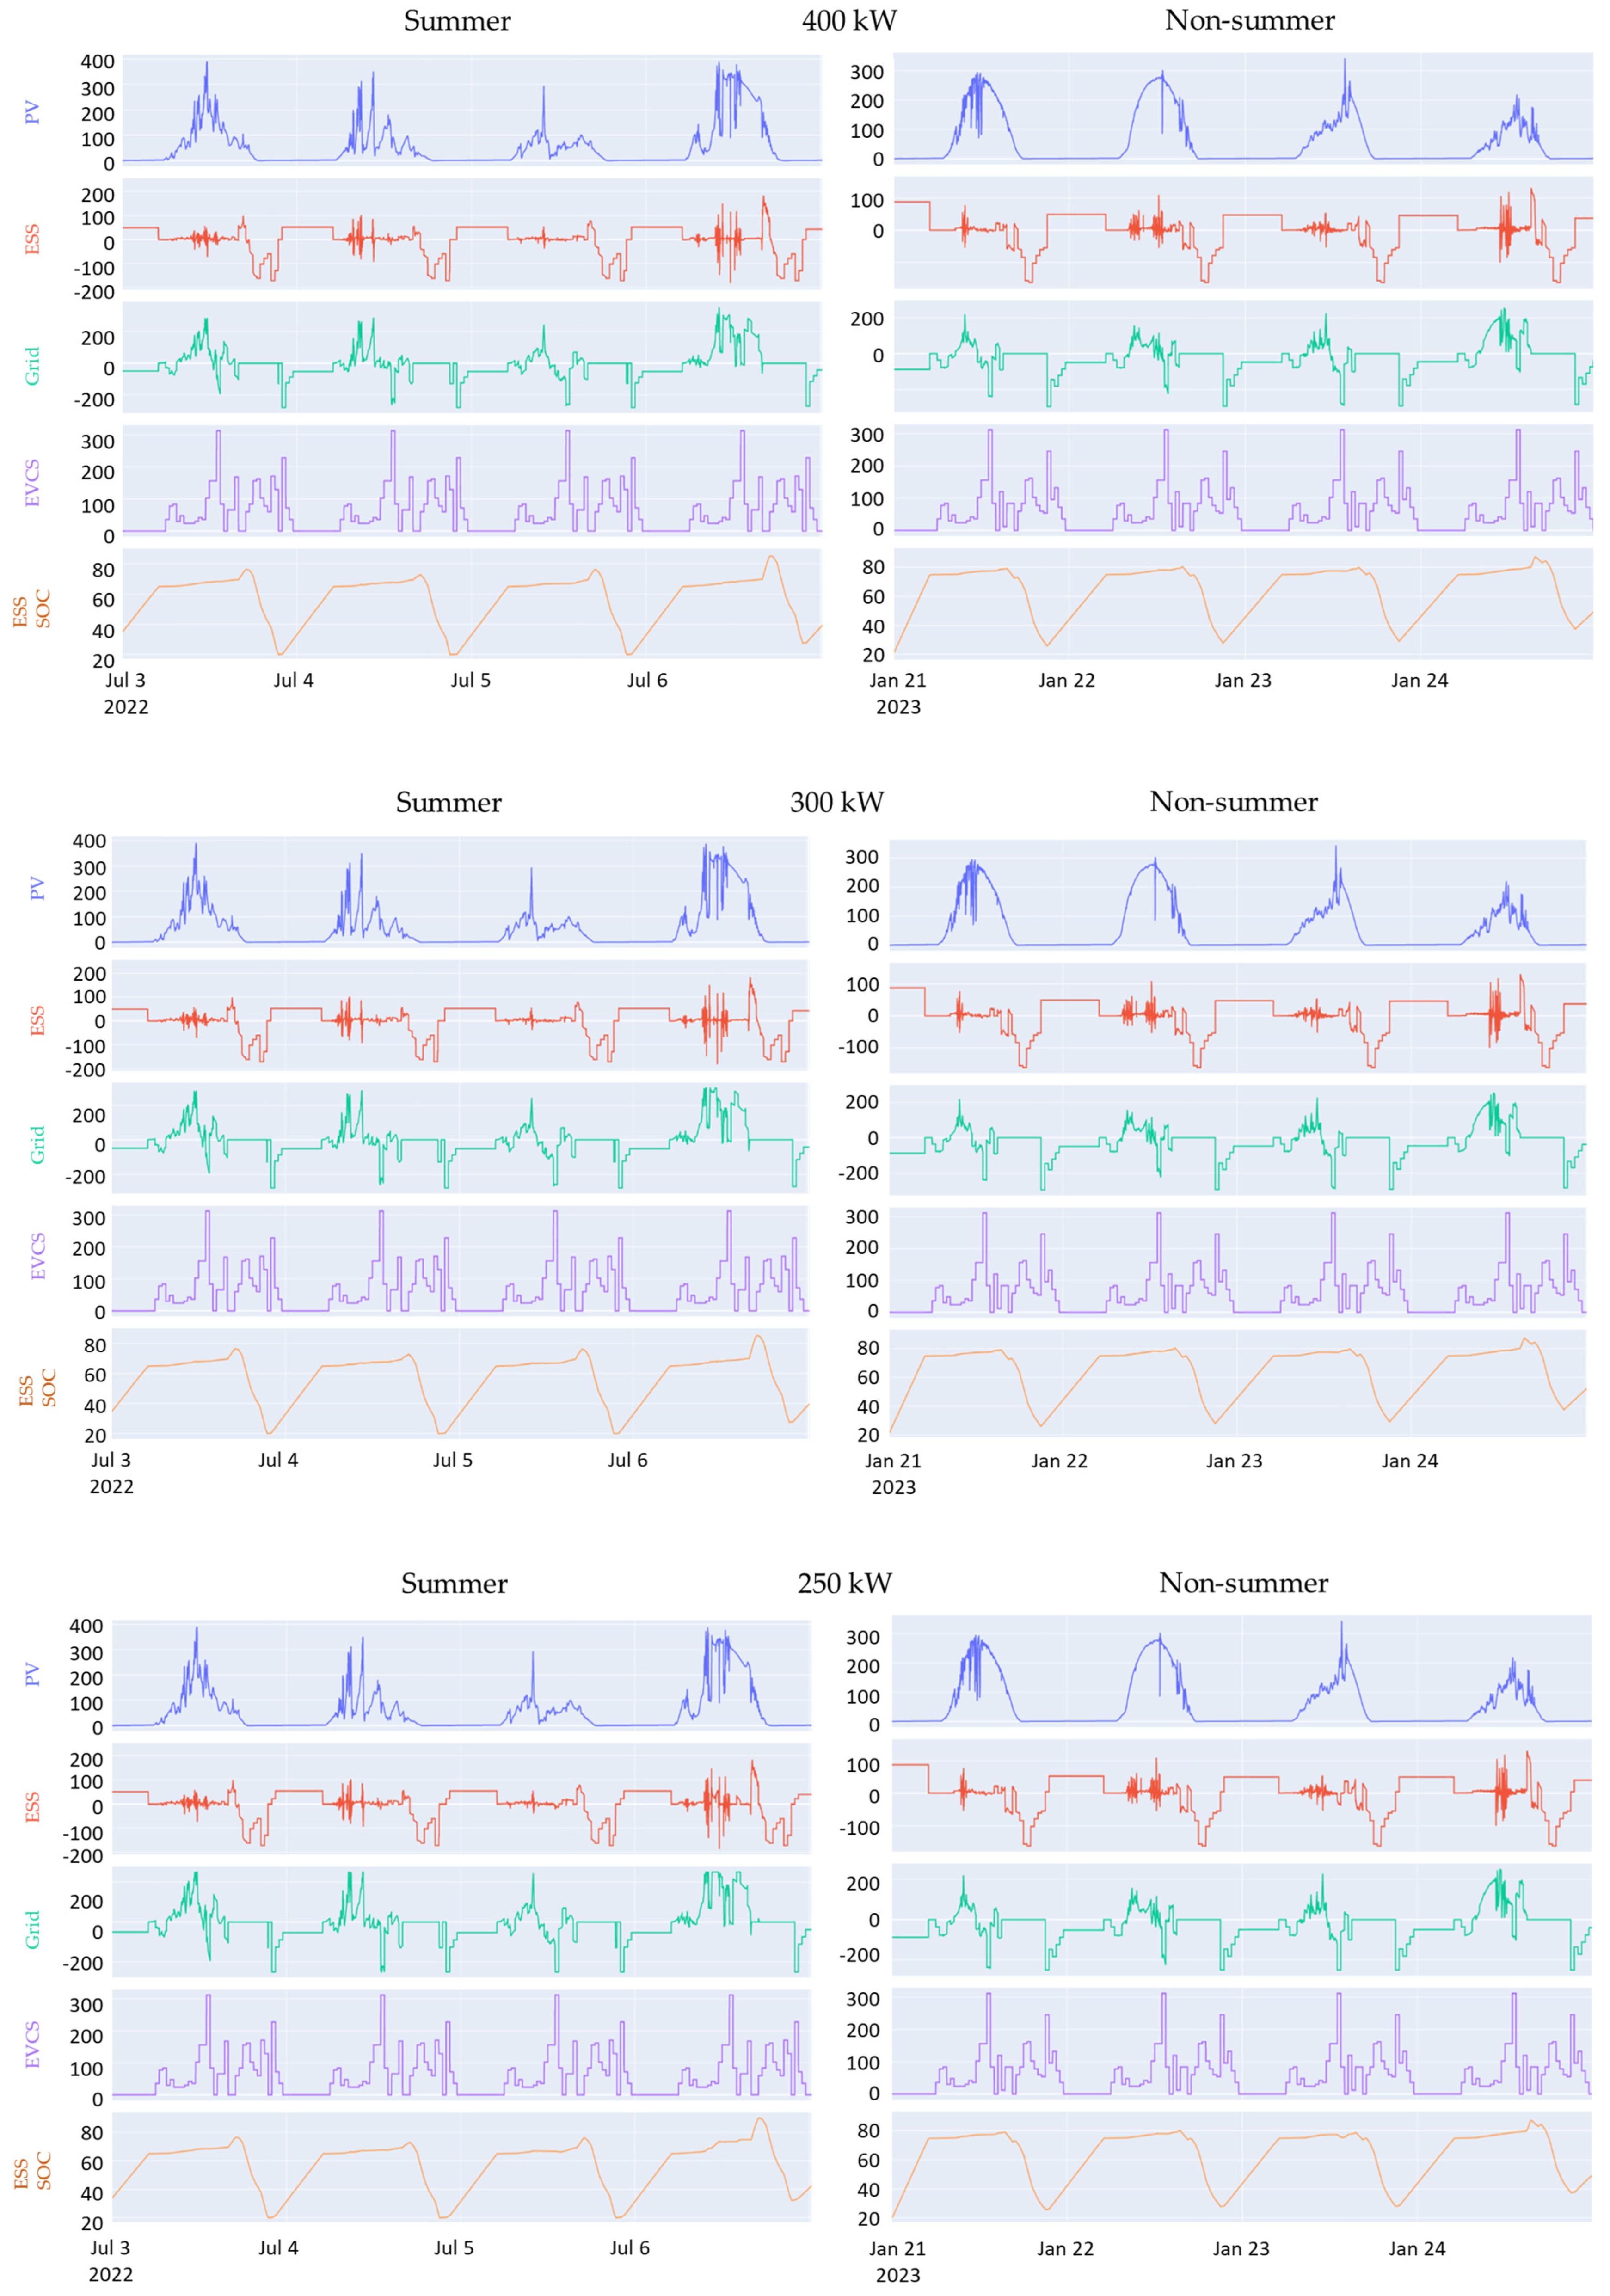
5.2.3. EVCS Operating Results under Different Contract Capacity

The operational scenarios of EVCSs under different contracted capacity settings are illustrated in Figure 11, using the week of 3 July 2022 for summer and the week of 21 January 2023 for non-summer observations. The results show alignment with the design of the three-period control strategy in this study: (1) During off-peak daytime hours, PV is maximally utilized not only to fulfill the charging station’s power demand but also to feed surplus PV into the grid for revenue generation. Additionally, an ESS assists in smoothing the PV output. (2) During peak hours, the ESS is maximally employed to minimize grid consumption, thereby reducing operational costs associated with peak-time electricity procurement. (3) During off-peak nighttime hours, the ESS is charged using grid electricity to restore the targeted energy capacity.

5.2.4. Operational Income of EVCS

This study simulated the situations for the entire months of July 2022 (summer) and January 2023 (non-summer) and derived the operational levels and cost scenarios as indicated in Table 3. A comparison is made between the conditions with and without the integration of the EMS (and photovoltaic ESS). Furthermore, the scenarios under different contract capacity assumptions with the implementation of the EMS were also assessed.
Based on the simulated operational outcomes, the overall revenue of the charging station (including revenue from charging and solar energy feed-in) is calculated, and the net operational income after deducting the total costs is shown in Table 4.
Based on the comprehensive analysis of simulation results and revenue evaluation (see Table 5), the optimal configuration for maximizing the net operational income of the EVCS involves the implementation of EMS, solar, and energy storage systems with the setting of a contracted capacity at 300 kW. This study confirms that the adoption of Smart EMS contributes significantly to the operational net income of the charging station by 1.25 times.
In the above simulation of economic performance and cost considerations, not all costs and long-term dynamic updates and corrections are fully included. In this regard, there is still room for improvement in modeling the lifespan and costs of the system, which needs to be expanded and realized. However, what is clearly observable is that the integration of solar systems and energy storage systems with charging stations has a significantly positive impact on economic efficiency.

6. Conclusions

This study focuses on the development of a solar-and-energy storage-integrated smart charging station located within densely populated urban areas, proposing an innovative energy management system (EMS). This EMS not only caters to the charging demands of EV owners and achieves power allocation for smooth load leveling but also leverages simulated EV charging loads from wholesale stores to enhance the utilization of solar and energy storage systems at the charging station. Additionally, real-time power dispatching considering Time of Use (tariff is employed to achieve price arbitrage) is applied. This EMS enhances overall energy efficiency and potentially increases operational income by reducing electricity costs and selling surplus solar energy. Furthermore, the utilization of energy storage with EMS for real-time charging and discharging scheduling allows for the effective control of the wholesale store’s electricity consumption within a lower contracted capacity, thus further reducing the charging station’s electricity costs. Results indicate that compared to installing charging infrastructure solely, the introduction of this solar-and-energy storage-integrated smart charging energy management system can increase the net income for wholesale store owners by up to 1.25 times.

Author Contributions

Conceptualization, K.-Y.W., T.-C.T. and B.-H.L.; methodology, K.-Y.W., T.-C.T. and B.-H.L.; software, B.-H.L.; formal analysis, K.-Y.W., T.-C.T. and C.-C.K.; writing—original draft preparation, B.-H.L.; writing—review and editing, K.-Y.W., T.-C.T. and C.-C.K.; visualization, T.-C.T. and B.-H.L.; supervision, C.-C.K.; All authors have read and agreed to the published version of the manuscript.

Funding

This research received no external funding.

Institutional Review Board Statement

Not applicable.

Informed Consent Statement

Not applicable.

Data Availability Statement

The data presented in this study are available in article.

Conflicts of Interest

The authors declare no conflicts of interest.

References

  1. IEA. CO2 Emissions in 2022, Paris. 2023. Available online: https://www.iea.org/reports/co2-emissions-in-2022 (accessed on 3 April 2023).
  2. IEA. Global EV Outlook 2023, Paris. 2023. Available online: https://www.iea.org/reports/global-ev-outlook-2023 (accessed on 16 May 2023).
  3. Razmjoo, A.; Ghazanfari, A.; Jahangiri, M.; Franklin, E.; Denai, M.; Marzband, M.; Astiaso Garcia, D.; Maheri, A. A Comprehensive Study on the Expansion of Electric Vehicles in Europe. Appl. Sci. 2022, 12, 11656. [Google Scholar] [CrossRef]
  4. Saldaña, G.; San Martin, J.I.; Zamora, I.; Asensio, F.J.; Oñederra, O. Electric vehicle into the grid: Charging methodologies aimed at providing ancillary services considering battery degradation. Energies 2019, 12, 2443. [Google Scholar] [CrossRef]
  5. Dang, Q. Electric vehicle (EV) charging management and relieve impacts in grids. In Proceedings of the 2018 9th IEEE International Symposium on Power Electronics for Distributed Generation Systems (PEDG), Charlotte, NC, USA, 25–28 June 2018; pp. 1–5. [Google Scholar]
  6. Khalid, M.R.; Khan, I.A.; Hameed, S.; Asghar, M.S.J.; Ro, J.S. A Comprehensive Review on Structural Topologies, Power Levels, Energy Storage Systems, and Standards for Electric Vehicle Charging Stations and Their Impacts on Grid. IEEE Access 2021, 9, 128069–128094. [Google Scholar] [CrossRef]
  7. Kumar, M.; Panda, K.P.; Naayagi, R.T.; Thakur, R.; Panda, G. Comprehensive Review of Electric Vehicle Technology and Its Impacts: Detailed Investigation of Charging Infrastructure. Appl. Sci. 2023, 13, 8919. [Google Scholar] [CrossRef]
  8. Justo, J.J.; Mwasilu, F.; Lee, J.; Jung, J.-W. AC-microgrids versus DC-microgrids with distributed energy resources: A review. Renew. Sustain. Energy Rev. 2013, 24, 387–405. [Google Scholar] [CrossRef]
  9. Wang, D.; Locment, F.; Sechilariu, M. Modelling, Simulation, and Management Strategy of an Electric Vehicle Charging Station Based on a DC Microgrid. Appl. Sci. 2020, 10, 2053. [Google Scholar] [CrossRef]
  10. Kouka, K.; Masmoudi, A.; Abdelkafi, A.; Krichen, L. Dynamic energy management of an electric vehicle charging station using photovoltaic power. Sustain. Energy Grids Netw. 2020, 24, 100402. [Google Scholar] [CrossRef]
  11. Cheikh-Mohamad, S.; Sechilariu, M.; Locment, F. Real-Time Power Management Including an Optimization Problem for PV-Powered Electric Vehicle Charging Stations. Appl. Sci. 2022, 12, 4323. [Google Scholar] [CrossRef]
  12. Yap, K.Y.; Chin, H.H.; Klemeš, J.J. Solar Energy-Powered Battery Electric Vehicle charging stations: Current development and future prospect review. Renew. Sustain. Energy Rev. 2022, 169, 112862. [Google Scholar] [CrossRef]
  13. Robisson, B.; Guillemin, S.; Marchadier, L.; Vignal, G.; Mignonac, A. Solar Charging of Electric Vehicles: Experimental Results. Appl. Sci. 2022, 12, 4523. [Google Scholar] [CrossRef]
  14. The Energy Storage System Integrated with Photovoltaic Power Generation—Taiwan’s 2022 Bidding and Capacity Allocation Guidelines—MOEA (Ministry of Economic Affairs, R.O.C.). Available online: https://www.moeaea.gov.tw/ecw/populace/Law/Content.aspx?menu_id=20835 (accessed on 19 April 2023).
  15. Taipower Company Business Rules—Chapter 6 Power Supply Methods and Engineering-TPC (Taipower Company). Available online: https://www.taipower.com.tw/tc/page.aspx?mid=158 (accessed on 27 May 2023).
  16. Olivier, A.; Dessaint, L.A. Experimental validation of a battery dynamic model for EV applications. World Electr. Veh. J. 2009, 3, 289–298. [Google Scholar]
Figure 1. Regular layout of wholesale store in taiwan (Google Satellite).
Applsci 14 01188 g001
Figure 2. System architectural diagram.
Applsci 14 01188 g002
Figure 3. Control strategy for off-peak daytime hours.
Applsci 14 01188 g003
Figure 4. Control strategy for peak hours.
Applsci 14 01188 g004
Figure 5. Control strategy for off-peak nighttime hours.
Applsci 14 01188 g005
Figure 6. Control flow of off-peak priority strategy.
Applsci 14 01188 g006
Figure 7. Charging schedule for each EVSE.
Applsci 14 01188 g007
Figure 8. Entry/departure SOC for EV charging behaviors of each EVSE.
Applsci 14 01188 g008
Figure 9. Weekly charging power temporal profile of EVCS.
Applsci 14 01188 g009
Figure 10. Charging power profile of EVCS with off-peak priority strategy.
Applsci 14 01188 g010
Figure 11. Operation scenarios of EVCSs with different contracted capacities.
Applsci 14 01188 g011aApplsci 14 01188 g011b
Table 1. Taipower Electricity Tariff of EV charging and swapping facility.
Taipower Electricity TariffSummer
(June–September)
Non-
Summer
(October–May)
BasicCharged by HouseholdPer Household Per Month262.50
Contract CapacityPer kWh Per Month47.2034.60
VariableMonday to FridayPeakSummer16:00~22:00Per kWh8.35
Non-summer15:00~21:008.13
Off-peakSummer00:00~16:00 22:00~24:002.051.95
Non-summer00:00~15:00 21:00~24:00
Saturday, Sunday, and HolidayAll Day
Table 2. Configuration of the solar-and-energy storage-integrated charging station.
ESS Power ESS Capacity Solar Installation Capacity
Proportion of Configuration1.0 (kW)2.61 (kWh)1.5 (kW)
Installation Capacity300 kW800 kWh450 kW
Table 3. EVCS simulated operational outcomes and total costs (Unit: TWD).
SeasonEVCS
Setting
kWh/CostContract
Capacity
Basic
Rate
Grid
Supply
EVCS
Demand
ESS
Charging
PV
for EV Charging
PV
Fed in Grid
July 2022
Summer
Without
EMS
kWh 499 kW - 43,560.00 43,560.00 - - -
$/kWh 47.20 - 4.64 5.19 - - -
Total Cost ($)23,552.80 262.50 202,131.00 225,946.30 - - -
With EMS/
499 kW
kWh 499 kW - 19,251.54 43,560.00 14,597.78 26,003.38 34,789.52
$/kWh47.20 - 2.17 * 4.79 * - 3.40 3.40
Total Cost ($)23,552.80 262.50 41,783.58 209,010.35 55,000.00 88,411.48 118,284.35
With EMS/
400 kW
kWh 400 kW - 19,251.54 43,560.00 14,597.78 26,003.38 34,789.52
$/kWh47.20 - 2.17 * 4.69 * - 3.40 3.40
Total Cost ($)18,880.00 262.50 41,783.58 204,337.55 55,000.00 88,411.48 118,284.35
With EMS/
300 kW
kWh 300 kW - 19,249.33 43,560.00 14,598.93 26,002.24 34,758.95
$/kWh47.20 - 2.17 *4.58 * - 3.40 3.40
Total Cost ($)14,160.00 262.50 41,779.06 199,609.18 55,000.00 88,407.63 118,180.42
With EMS/
250 kW
kWh 250 kW - 18,868.16 43,560.00 14,755.03 29,880.81 33,916.46
$/kWh47.20 - 2.15 * 4.80 * - 3.40 3.40
Total Cost ($)11,800.00 262.50 40,478.53 209,135.79 55,000.00 101,594.76 115,315.96
January 2023
non-summer
Without
EMS
kWh 499 kW - 43,560.00 43,560.00 - - -
$/kWh34.60 - 4.44 4.84 - - -
Total Cost ($)17,265.40 262.50 193,401.00 210,928.90 - - -
With EMS/
499 kW
kWh 499 kW - 23,257.84 43,560.00 12,337.60 19,480.37 21,275.97
$/kWh34.60 - 1.95 * 4.23 * - 3.40 3.40
Total Cost ($)17,265.40 262.50 45,352.79 184,113.96 55,000.00 66,233.26 72,338.32
With EMS/
400 kW
kWh 400 kW - 23,257.84 43,560.00 12,337.60 19,480.37 21,275.97
$/kWh34.60 - 1.95 * 4.15 * - 3.40 3.40
Total Cost ($)13,840.00 262.50 45,352.80 180,688.56 55,000.00 66,233.26 72,338.32
With EMS/
300 kW
kWh 300 kW - 23,257.71 43,560.00 12,337.83 19,480.37 21,275.97
$/kWh34.60 - 1.95 * 4.07 * - 3.40 3.40
Total Cost ($)10,380.00 262.50 45,352.54 177,230.58 55,000.00 66,233.26 72,338.32
With EMS/
250 kW
kWh 250 kW - 23,228.92 43,560.00 12,374.16 19,508.40 21,261.59
$/kWh34.60 - 1.95 * 4.03 * - 3.40 3.40
Total Cost ($)8650.00 262.50 45,296.39 175,537.47 55,000.00 66,328.58 72,289.39
*: The average electricity cost based on Time of Use (TOU) tariffs for different time periods.
Table 4. EVCS total revenue and net operational income (Unit: TWD).
July 2022
Summer
January 2023
Non-Summer
Contract
Capacity
Electricity SalePVEVCSElectricity SalePVEVCS
Without
EMS
Electricity Sale (kWh) - 43,560.00 Electricity Sale (kWh) - 43,560.00
Price per kWh ($) - 9.00 Price per kWh ($) - 9.00
Revenue ($) - 392,040.00 Revenue ($) - 392,040.00
Net Income ($) - 166,093.70 Net Income ($) - 181,111.10
Net Income per kWh ($) - 3.81 Net Income per kWh ($) - 4.16
Total Net Income ($)166,093.70 Total Net Income ($)181,111.10
With EMS/
499 kW
Electricity Sale (kWh)34,789.52 43,560.00 Electricity Sale (kWh)21,275.98 43,560.00
Price per kWh ($)3.90 9.00 Price per kWh ($)3.90 9.00
Revenue ($)135,679.11 392,040.00 Revenue ($)82,976.30 392,040.00
Net Income ($)17,394.76 183,029.65 Net Income ($)10,637.99 207,926.04
Net Income per kWh ($)0.50 4.20 Net Income per kWh ($)0.50 4.77
Total Net Income ($)200,424.41 Total Net Income ($) 218,564.03
With EMS/
400 kW
Electricity Sale (kWh)34,789.52 43,560.00 Electricity Sale (kWh)21,275.98 43,560.00
Price per kWh ($)3.90 9.00 Price per kWh ($)3.90 9.00
Revenue ($)135,679.11 392,040.00 Revenue ($)82,976.30 392,040.00
Net Income ($)17,394.76 187,702.45 Net Income ($)10,637.99 211,351.44
Net Income per kWh ($)0.50 4.31 Net Income per kWh ($)0.50 4.85
Total Net Income ($)205,097.21 Total Net Income ($)221,989.43
With EMS/
300 kW
Electricity Sale (kWh)34,758.95 43,560.00 Electricity Sale (kWh)21,275.98 43,560.00
Price per kWh ($)3.90 9.00 Price per kWh ($)3.90 9.00
Revenue ($)135,559.89 392,040.00 Revenue ($)82,976.30 392,040.00
Net Income ($)17,379.47 192,430.82 Net Income ($)10,637.99 214,809.42
Net Income per kWh ($)0.50 4.42 Net Income per kWh ($)0.50 4.93
Total Net Income ($)209,810.29 Total Net Income ($) 225,447.41
With EMS/
250 kW
Electricity Sale (kWh)32,602.01 43,560.00 Electricity Sale (kWh)21,261.59 43,560.00
Price per kWh ($)3.90 9.00 Price per kWh ($)3.90 9.00
Revenue ($)127,147.84 392,040.00 Revenue ($)82,920.19 392,040.00
Net Income ($)16,958.23 182,904.21 Net Income ($)10,630.79 216,502.53
Net Income per kWh ($)0.50 4.20 Net Income per kWh ($)0.50 4.97
Total Net Income ($)199,862.44 Total Net Income ($)227,133.33
Table 5. Comparison of EVCS net operational income (Unit: TWD).
EVCS ConfigurationNet Operational Income
July 2022
Summer
January 2023
Non-Summer
SumProfit
Comparison
Without EMS166,093.70181,111.10347,204.801.00
With EMS/499 kW200,424.41218,564.03418,988.441.21
With EMS/400 kW205,097.21221,989.43427,086.641.23
With EMS/300 kW 209,810.29225,447.41435,257.701.25
With EMS/250 kW199,862.44227,133.33426,995.771.23
Disclaimer/Publisher’s Note: The statements, opinions and data contained in all publications are solely those of the individual author(s) and contributor(s) and not of MDPI and/or the editor(s). MDPI and/or the editor(s) disclaim responsibility for any injury to people or property resulting from any ideas, methods, instructions or products referred to in the content.

