Article

Hydrocarbon Generation and Accumulation in the Eastern Kuqa Depression, Northwestern China: Insights from Basin and Petroleum System Modeling

1
National Key Laboratory of Deep Oil and Gas, China University of Petroleum (East China), Qingdao 266580, China
2
School of Geosciences, China University of Petroleum (East China), Qingdao 266580, China
3
Research Institute of Exploration & Development, PetroChina Tarim Oilfield Company, Korla 841000, China
*
Author to whom correspondence should be addressed.
Appl. Sci. 2024, 14(3), 1217; https://doi.org/10.3390/app14031217
Submission received: 25 December 2023 / Revised: 22 January 2024 / Accepted: 31 January 2024 / Published: 31 January 2024
(This article belongs to the Special Issue Advance in Integrated Basin and Petroleum System Modeling)

Abstract

:
The eastern Kuqa Depression in the northern Tarim Basin, NW China, is rich in oil and gas. However, recent exploration has been hindered by a lack of knowledge on the evolution of the petroleum system. To address this, we conducted hydrocarbon generation and accumulation modeling using both the 2Dmove and PetroMod2017 software for a complex tectonic extrusion section in the Kuqa Depression. The results show that the source rocks in the northern slope zone became mature quite early at around 170 Ma, but the thermal maturity evolution stagnated subsequently because of tectonic extrusion and uplift. The source rocks in the central anticline zone, the southern slope zone, and the deep sag zone were of overall low maturity during the Jurassic to Paleogene but rapidly became mature to highly mature with the deposition of the Neogene Jidike and Kangcun formations. The main hydrocarbon generation periods are in the late Neogene and Quaternary, and the main hydrocarbon generation stratum is the lower Jurassic Yangxia formation. The amount of cumulative hydrocarbon generation gradually increases for carbonaceous mudstone, mudstone, and coal source rocks. Sourced from source rocks mainly in the northern slope zone, oil and gas migrated to anticlinal traps along sandstone transport layers and faults. Recent discoveries, such as the Tudong-2 gas field in the central anticline zone, underscore the richness of this region in petroleum resources. Some gas fields were also predicted in lithologic traps in the southern slope zone and the deep sag zone, as well as in fault-related traps in the northern part of the northern slope zone.

1. Introduction

The Tarim Basin is the largest onshore petroliferous basin in China [1], owning favorable hydrocarbon accumulation conditions. The Kuqa Depression, located in the northern part of the Tarim Basin, is rich in oil and gas and occupies about 90% of the proven natural gases of the whole basin [2]. In recent years, the Tudong-2 large gas field (e.g., the TD-2, TD-201, and TD-202 drilled wells) have been found in the Jurassic Yangxia (J1y) and Kezilenuer (J2kz) formations in the central anticline zone in the eastern Kuqa Depression. Oil and gas have also been found in the TG-6 well in the northern slope zone and the YT-1 well in the deep sag zone, which are two low-production wet gas reservoirs. This indicates that the eastern Kuqa Depression may still have large oil and gas exploration potential and that it is also an exploration front area [3].
Basin modeling stands at the forefront of modern petroleum exploration, petroleum geology comprehensive research, and petroleum resource evaluation. Basin modeling is based on the basic principles of physics, chemistry, and geological processes, serving as a pivotal tool that integrates processes such as petroleum generation, migration, and accumulation in a quantitative manner, and it can directly reveal the laws of petroleum basin evolution [4,5]. Based on the burial and thermal history modeling of some single wells, several researchers have mainly analyzed the hydrocarbon generation and charging process in the eastern Kuqa Depression, while the hydrocarbon generation of different lithologic source rocks has not been determined yet. In addition, one-dimensional basin modeling is not conducive to regional comparison [6,7,8]. Two-dimensional (2D) basin modeling is based on the accurate interpretation of geological tectonic patterns, which can accurately reflect the actual formation, lithology, and structure, especially regarding the regional distinction [9].
Two-dimensional basin modeling needs to be realized by meshing the geological section first. It is required that the same stratigraphic boundary can only appear once on the same vertical grid line. However, in the restoration process, not only thickness changes in the vertical strata but also compression in the horizontal direction should be considered. The occurrence of reverse faults can cause a set of strata to be drilled multiple times in the same vertical line, with multiple depth values [5,10]. The Kuqa foreland thrust belt has experienced intensive tectonic deformations, and a large number of thrust faults have developed, resulting in serious formation fragmentation, vertical repeated stacking, and complex structural characteristics, which make it difficult to carry out 2D basin modeling research in this area. This mainly manifests in two ways: (1) the accurate simulation of the effects of the thrust process, rapid deposition, and the erosion process on heat flow and source rock maturity is the key issue in thermal and maturity history analysis [9]; (2) it is hard to establish a 2D basin model for a tectonic compressional geological section.
In this study, based on an analysis of the effects of the extrusion thrust process, rapid deposition, and the erosion process on heat flow and source rock maturity, we take a north–south section of the eastern Kuqa Depression (Figure 1d) as the main object of research for 2D basin modeling. The main objectives are to (1) restore the structural evolution history of the section and clarify the tectonic movement; (2) to establish a reasonable 2D basin model and determine the thermal and maturity evolution history; (3) to quantitatively analyze source rock hydrocarbon generation and clarify the main hydrocarbon generation zones and main hydrocarbon generation periods; and (4) to investigate hydrocarbon migration and accumulation evolution in the area and predict favorable traps for oil and gas enriched.

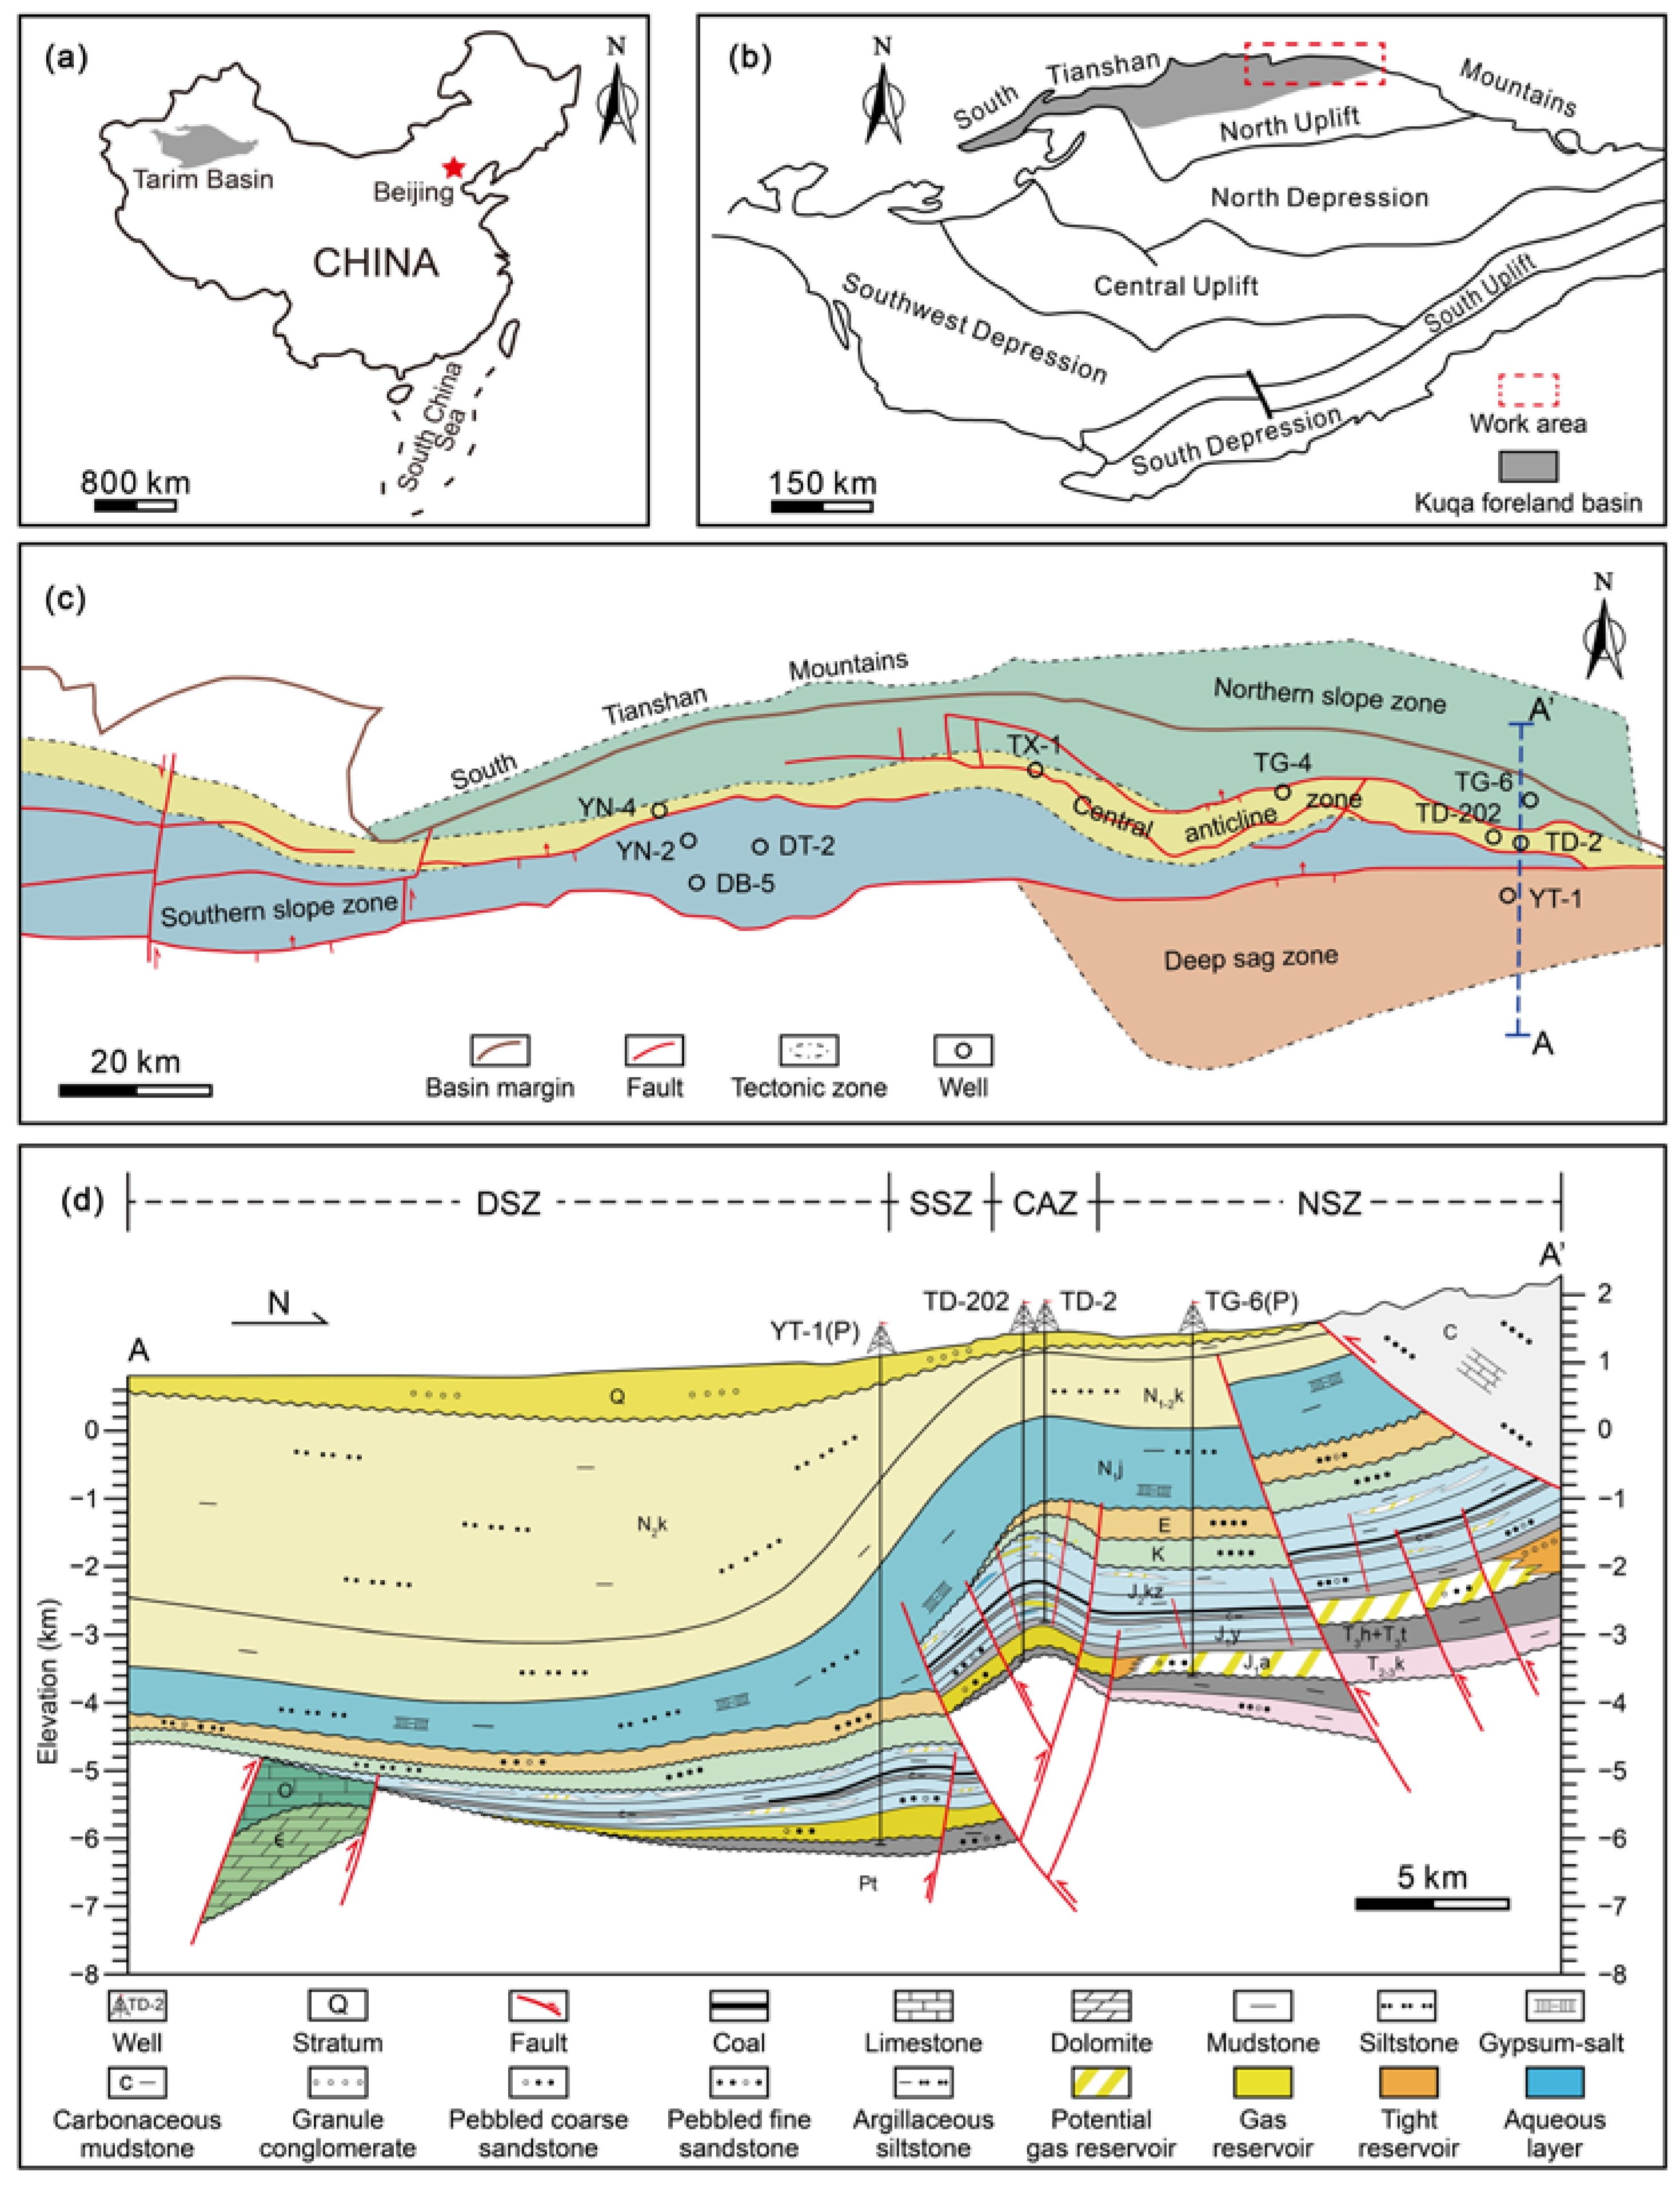
2. Geological Setting

The Kuqa Depression, situated on the northern margin of the Tarim Basin, is a foreland basin that has been developing since the late Permian and encompasses approximately 28,000 km2 (Figure 1a,b). It has experienced significant geological transformations and is characterized by multiple evolutional stages, including a foreland basin stage from the Late Permian to the Triassic, an extensional rift stage from the Jurassic to the Paleogene, and a rejuvenated foreland basin stage since the Neogene [11,12]. The intensive tectonic deformations and various depositional environments from the Neogene to the Quaternary form a complex structural pattern, which shows the characteristics of segmentation horizontally and stratification vertically [13]. The basin comprises four belts and three sags, namely, the Northern tectonic belt, the Kelasu and Qiulitage tectonic belts, and the southern slope region from north to south, with the Wushi, Baicheng, and Yangxia sags developed between the tectonic belts from the west to east [14,15,16].
The eastern Kuqa Depression mainly includes the middle-eastern section of the Northern tectonic belt, the Yangxia sag and its surrounding areas, with an area of 7000 km2, which can be further subdivided into four zones, namely, the northern slope zone (NSZ), the central anticline zone (CAZ), the southern slope zone (SSZ), and the deep sag zone (DSZ) from north to south [17] (Figure 1c). Affected by Yanshan (during the Late Jurassic to the Early Cretaceous) and Late Himalayan (in the Neogene) orogenic movements, the Kuqa Depression has experienced intensive lateral extrusion, especially in the mountain front, forming several large thrust belts (e.g., the Yiqikelike and Tugerming thrust belts) [18,19].
Source rocks in the eastern Kuqa Depression mainly developed in the Triassic and Jurassic formations, including an oil-prone lacustrine mudstone deposited in shallow to semi-deep lacustrine settings—as represented by the Upper Triassic Huangshanjie formation—and gas-prone coaly source rocks in paludal to lacustrine settings, as represented by the J1y and J2kz formations [16]. The source rocks mainly comprise mudstones with several interbedded carbonaceous mudstones and coal-thin seams. At present, the maturity of the source rocks is in a range of 0.6~1.5% Ro [20,21]. Thick and tight sandstone reservoirs primarily developed in the J1a and J1y formations and are dominated by medium and coarse sandstones and thin-bedded conglomerates. The property of tight sandstone reservoirs is recognized as ultra-low porosity and low permeability, with limited reservoir space mainly comprising the intra-granular pores, dissolved pores and micro-fractures [22]. The thick gypsum–salt rocks of the Jidike formation are regional seal rocks, and the thick mudstones of the Middle-Upper Jurassic are direct seal rocks. Source rocks, reservoirs, and seal rocks developed interbedded, forming several favorable source–reservoir–seal combinations.

3. Materials and Methods

Based on a structural analysis, a section through the TD-2 well in an N–S direction (Figure 1d) was selected to restore the area’s tectonic evolution and establish a 2D basin model in detail using the 2Dmove (2012) and PetroMod2017 software, respectively.

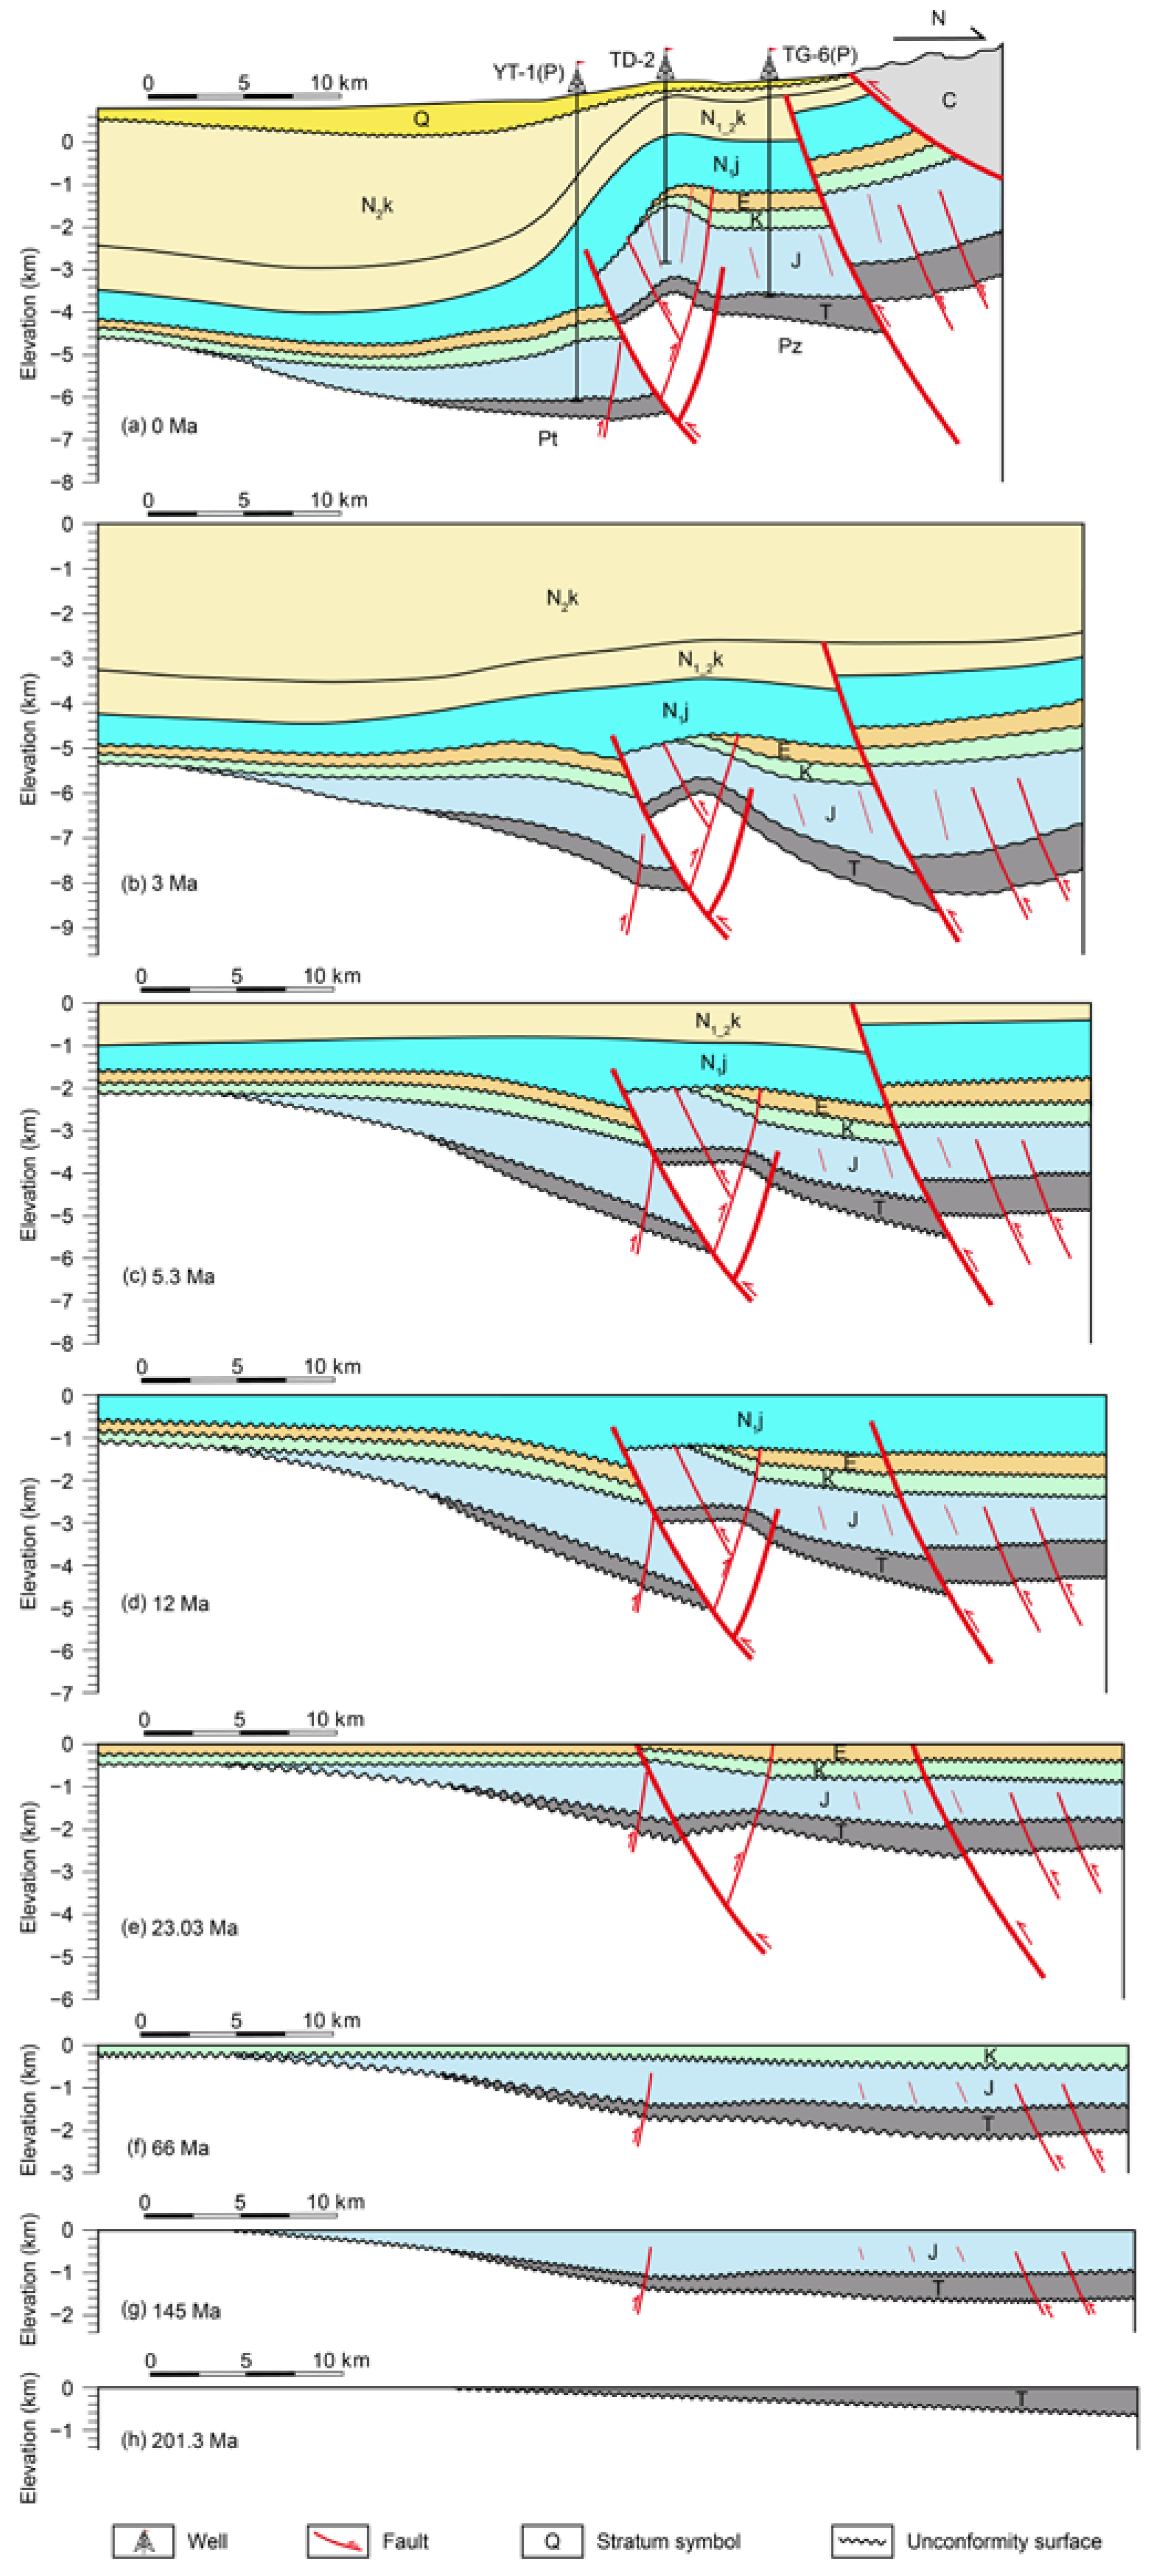
3.1. Restoration of the Tectonic Evolution

Balanced cross-section restoration is the process of quantitatively analyzing the tectonic evolution of a section and reasonably re-establishing its history. The balanced cross-section technique is based on the law of conservation of matter. The restoration of a section’s structure is based on the principle of geometric balance of equal area or length, which is used to restrict the randomness in section interpretation [23,24,25].
The 2Dmove software is used to make balanced cross-sections. Firstly, a geological section needs to be interpreted to establish a model of the area according to a seismic section, and then, the influence of fault displacement should be eliminated to invert its tectonic evolution history [24].
If there is a gypsum—salt layer in the section, the sedimentary strata should be divided into a post-salt layer, a salt layer, and a pre-salt layer. During the extrusion process, the salt layer undergoes plastic deformation, while the non-salt layer undergoes brittle or rigid deformation, resulting in different layered structural deformation characteristics in the vertical direction. Therefore, in the process of restoration, it is necessary to carry out layered reconstruction according to the characteristics of different layers and then combine the restored post-salt layer, salt layer, and pre-salt layer together to obtain the section before extrusion deformation [26]. In addition, the section of multi-stage structural superposition should eliminate the influence of fault displacement from shallow to deep areas layer by layer; that is, the later the fault develops, the earlier the fault displacement can be restored [24].
The post-salt layer first restores the fault displacement and then flattens the bottom boundary of each horizon to restore the strata before structural deformation. The length of the salt layer before deformation is equal to the length of the sedimentary layer after restoration. The shortening of the layers caused by the tectonic compression process is the only way to change the length of sedimentary layers. It should be noted that the restoration of the salt layer cannot meet the principle of area conservation. Considering the strengthening plasticity of the salt layer, it will flow around during the extrusion process, resulting in local thickening or thinning. The pre-salt layer is obtained by restoring the original state of the top boundary and fault displacement and flattening the salt layer.

3.2. Two-Dimensional Basin Modeling of an Extruded Structural Section

Basin modeling is the dynamic modeling of geological processes in sedimentary basins over geological time spans. A basin model is simulated forward through geological time starting with the sedimentation of the oldest layer until the entire sequence of layers has been deposited and the present day is reached. Several geological processes are calculated and updated at each time step [10] (Figure 2).

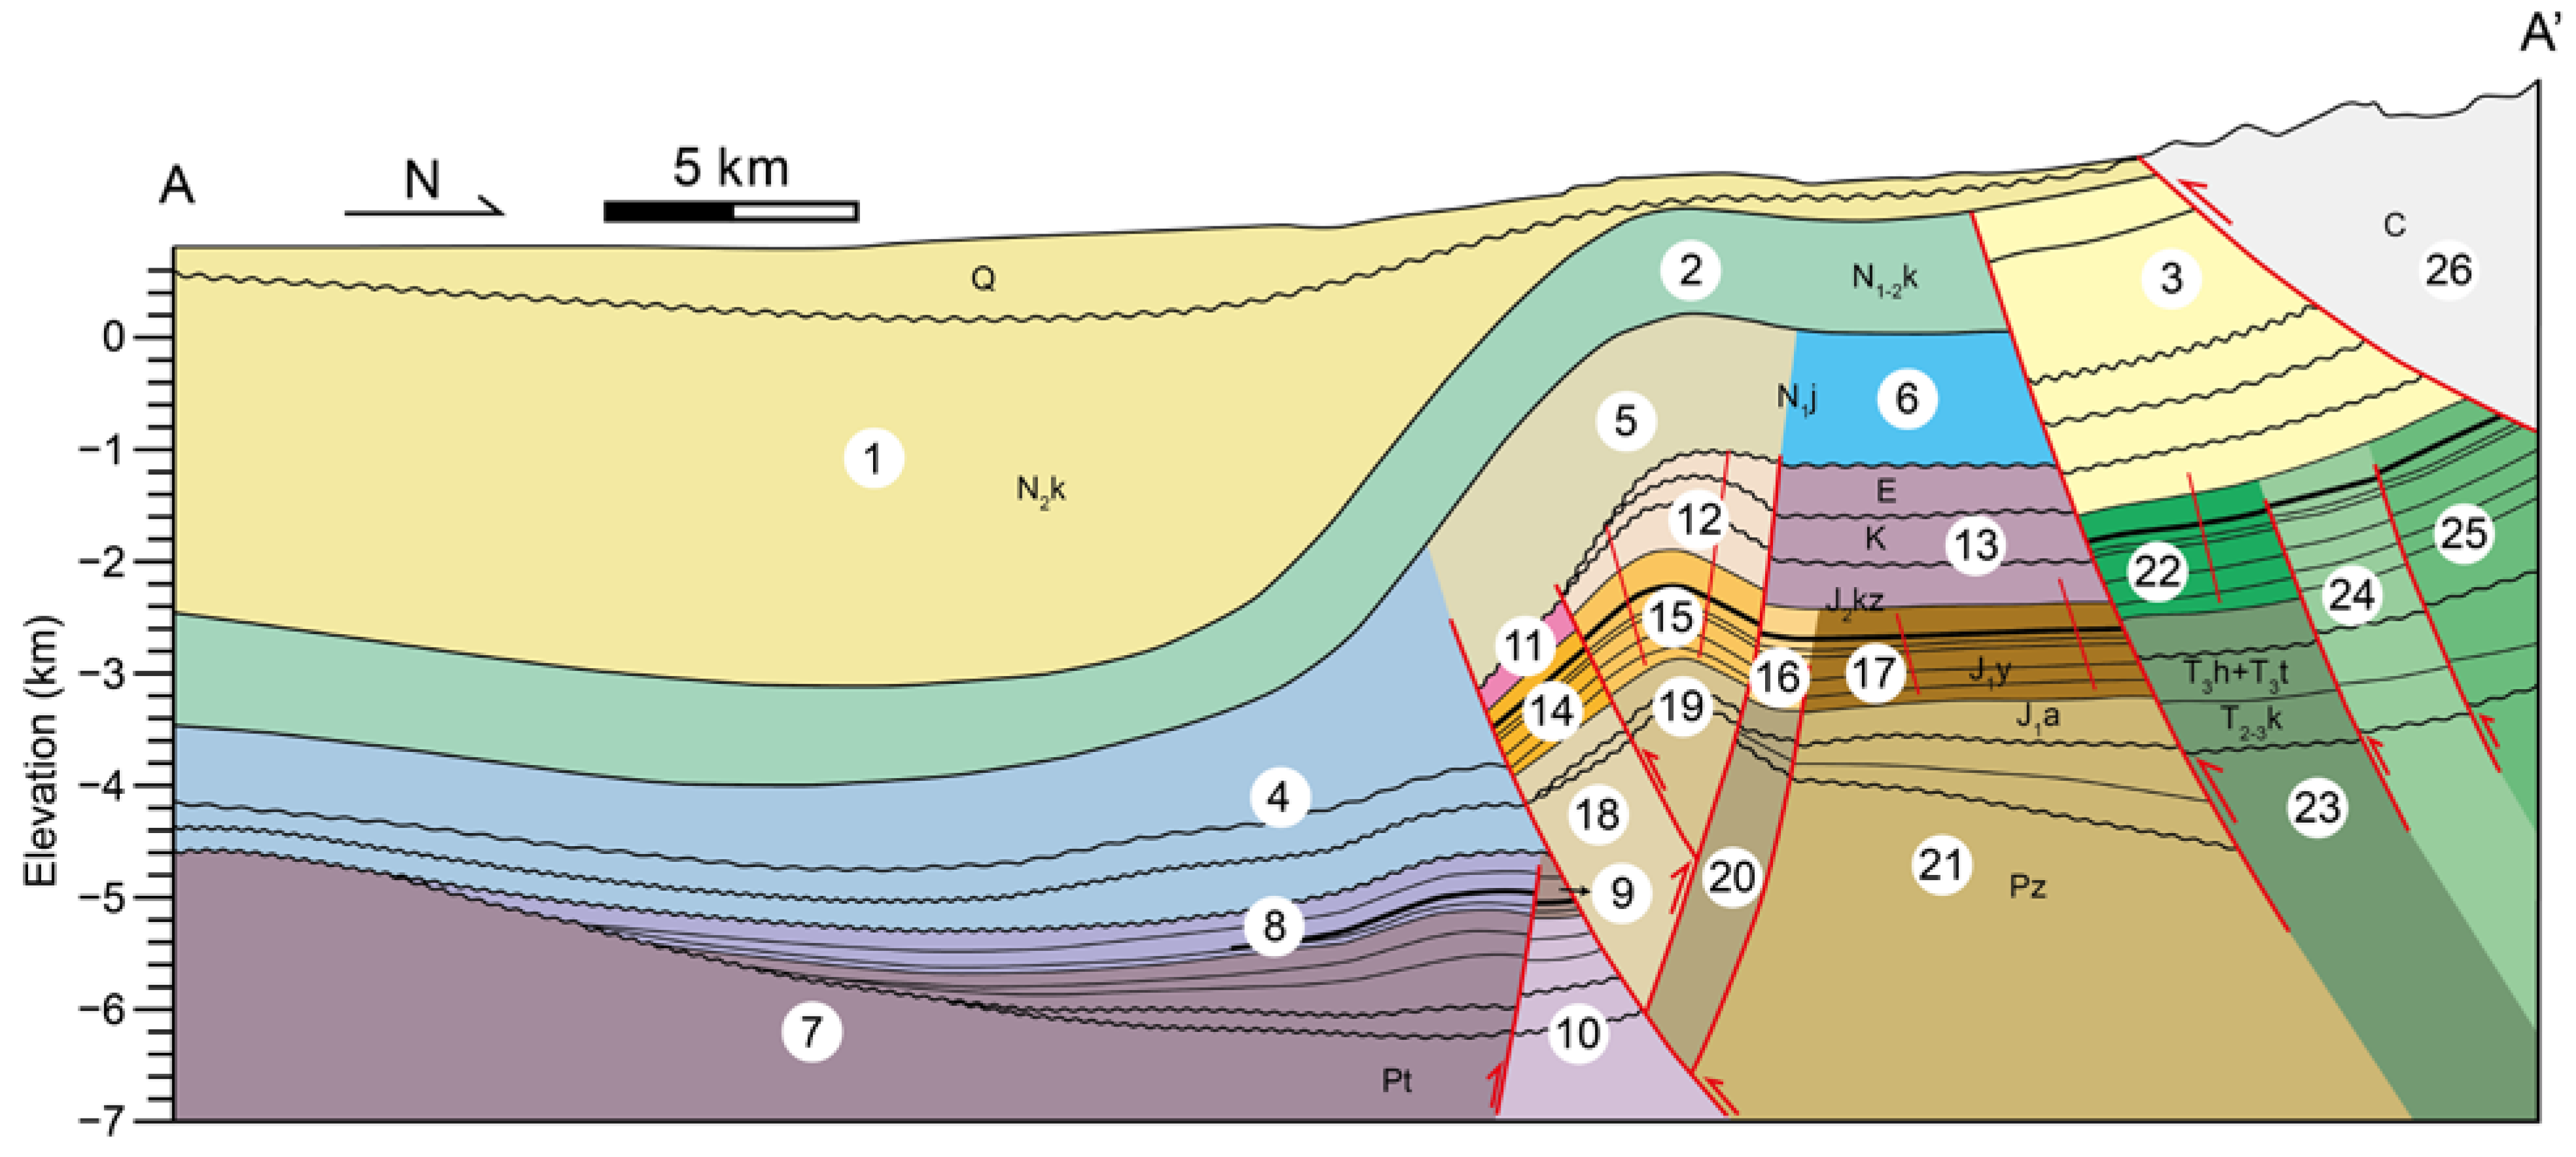
3.2.1. ‘Block’ Definition and Subdivision

For an extruded structural section with developed thrust faults, the ‘Block’ function in the Teclink module of the Schlumberger PetroMod2017 software should be utilized. The stratigraphic section can be divided into several blocks, but the integrity of its structure is still maintained during the tectonic evolution process. The application of the ‘Block’ function allows for the simulation of each block, thereby enabling a holistic simulation of the entire stratigraphic section [4,5].
It can be seen (Figure 1d) that the post-salt and pre-salt layers have different structural deformation characteristics, with the N1j formation as the boundary in the section. The thrust faults in the pre-salt strata disappear in the gypsum–salt layer, except for the northern slope zone. According to the actual geological characteristics of the section, the steps of establishing the model were as follows: the post-salt and pre-salt strata were divided into two systems. The pre-salt thrust faults were extended to the upper boundary of the gypsum–salt rock in the N1j formation, and then, each thrust block was divided into a ‘Block’ with the fault as the boundary. Based on the principle that one stratum can only appear once in a vertical grid line, the N–S section in this study was divided into 26 independent blocks (Figure 3).
The compressional structural section of the foreland thrust belt is complex, and it is difficult to accurately restore this section of the geological history with the conventional stratigraphic backstripping technology in the basin modeling software [9]. The section of the geological history period was input into the software according to the above method, and a block model was established to simulate the geological evolution history of the complex compressional structure section, which provided a basis for the whole simulation of the tectonic evolution history, burial history, thermal evolution history, and hydrocarbon generation history. The discretization process entailed defining vertical grids and horizontal event lines. The width of each section was 54 km, and the section was subdivided into 540 grid cells with a resolution of 100 m/cell. The parameters in the Table 1 were input into each grid.

3.2.2. Input Parameters

The 2D basin model hinges on a comprehensive set of input parameters, including geological layer thickness, depositional type, and paleo-environmental information. In addition, lithology, heat flow, source rock properties, and hydrocarbon generation kinetics also need to be obtained [4] (Table 1). The absolute ages of depositional events were constrained using the International Chronostratigraphic Chart (www.stratigraphy.org, accessed on 3 November 2023). The lithological data of the strata were derived from wells and published data [4,16,18]. Combined with the influence of different lithologies on ground temperature, deposition or erosion on heat flow, the thrust–nappe structure, and other geological processes on the thermal evolution of source rocks, the transient heat flow method was used to simulate the thermal history [27,28,29]. It is worth mentioning that five sets of source rocks were set up in this study, namely, Triassic mudstone, J1y mudstone, J1y carbonaceous mudstone J1y coal, and J2kz mudstone, with average thicknesses of 300 m, 150 m, 60 m, 50 m, and 200 m, respectively. In order to model hydrocarbon generation and migration, it is necessary to know the geochemical data of source rocks. In this study, we collected the measured TOC and rock-eval data of Triassic and Jurassic source rocks from both the literature and the Tarim Oilfield, PetroChina. The appropriate values are listed in Table 1.
It is significant to accurately select a heat flow value for the simulation of thermal evolution. Several researchers believe that the Kuqa Depression has been in a low heat flow stage since the Triassic, which is 50–55 mW/m2 [9,30,31]. The heat flow value has been continuously decreasing since the Cenozoic and finally changed to the present value of 40–45 mW/m2. The present average heat flow value in the Kuqa Depression is 44.6 mW/m2 [9]. The assignment of deposition and erosion events and heat flows was achieved by referring to previous studies of the Kuqa Depression [31]. The reasonability of the heat flow history was also calibrated using both measured borehole temperatures and vitrinite reflection data from several wells.

4. Results

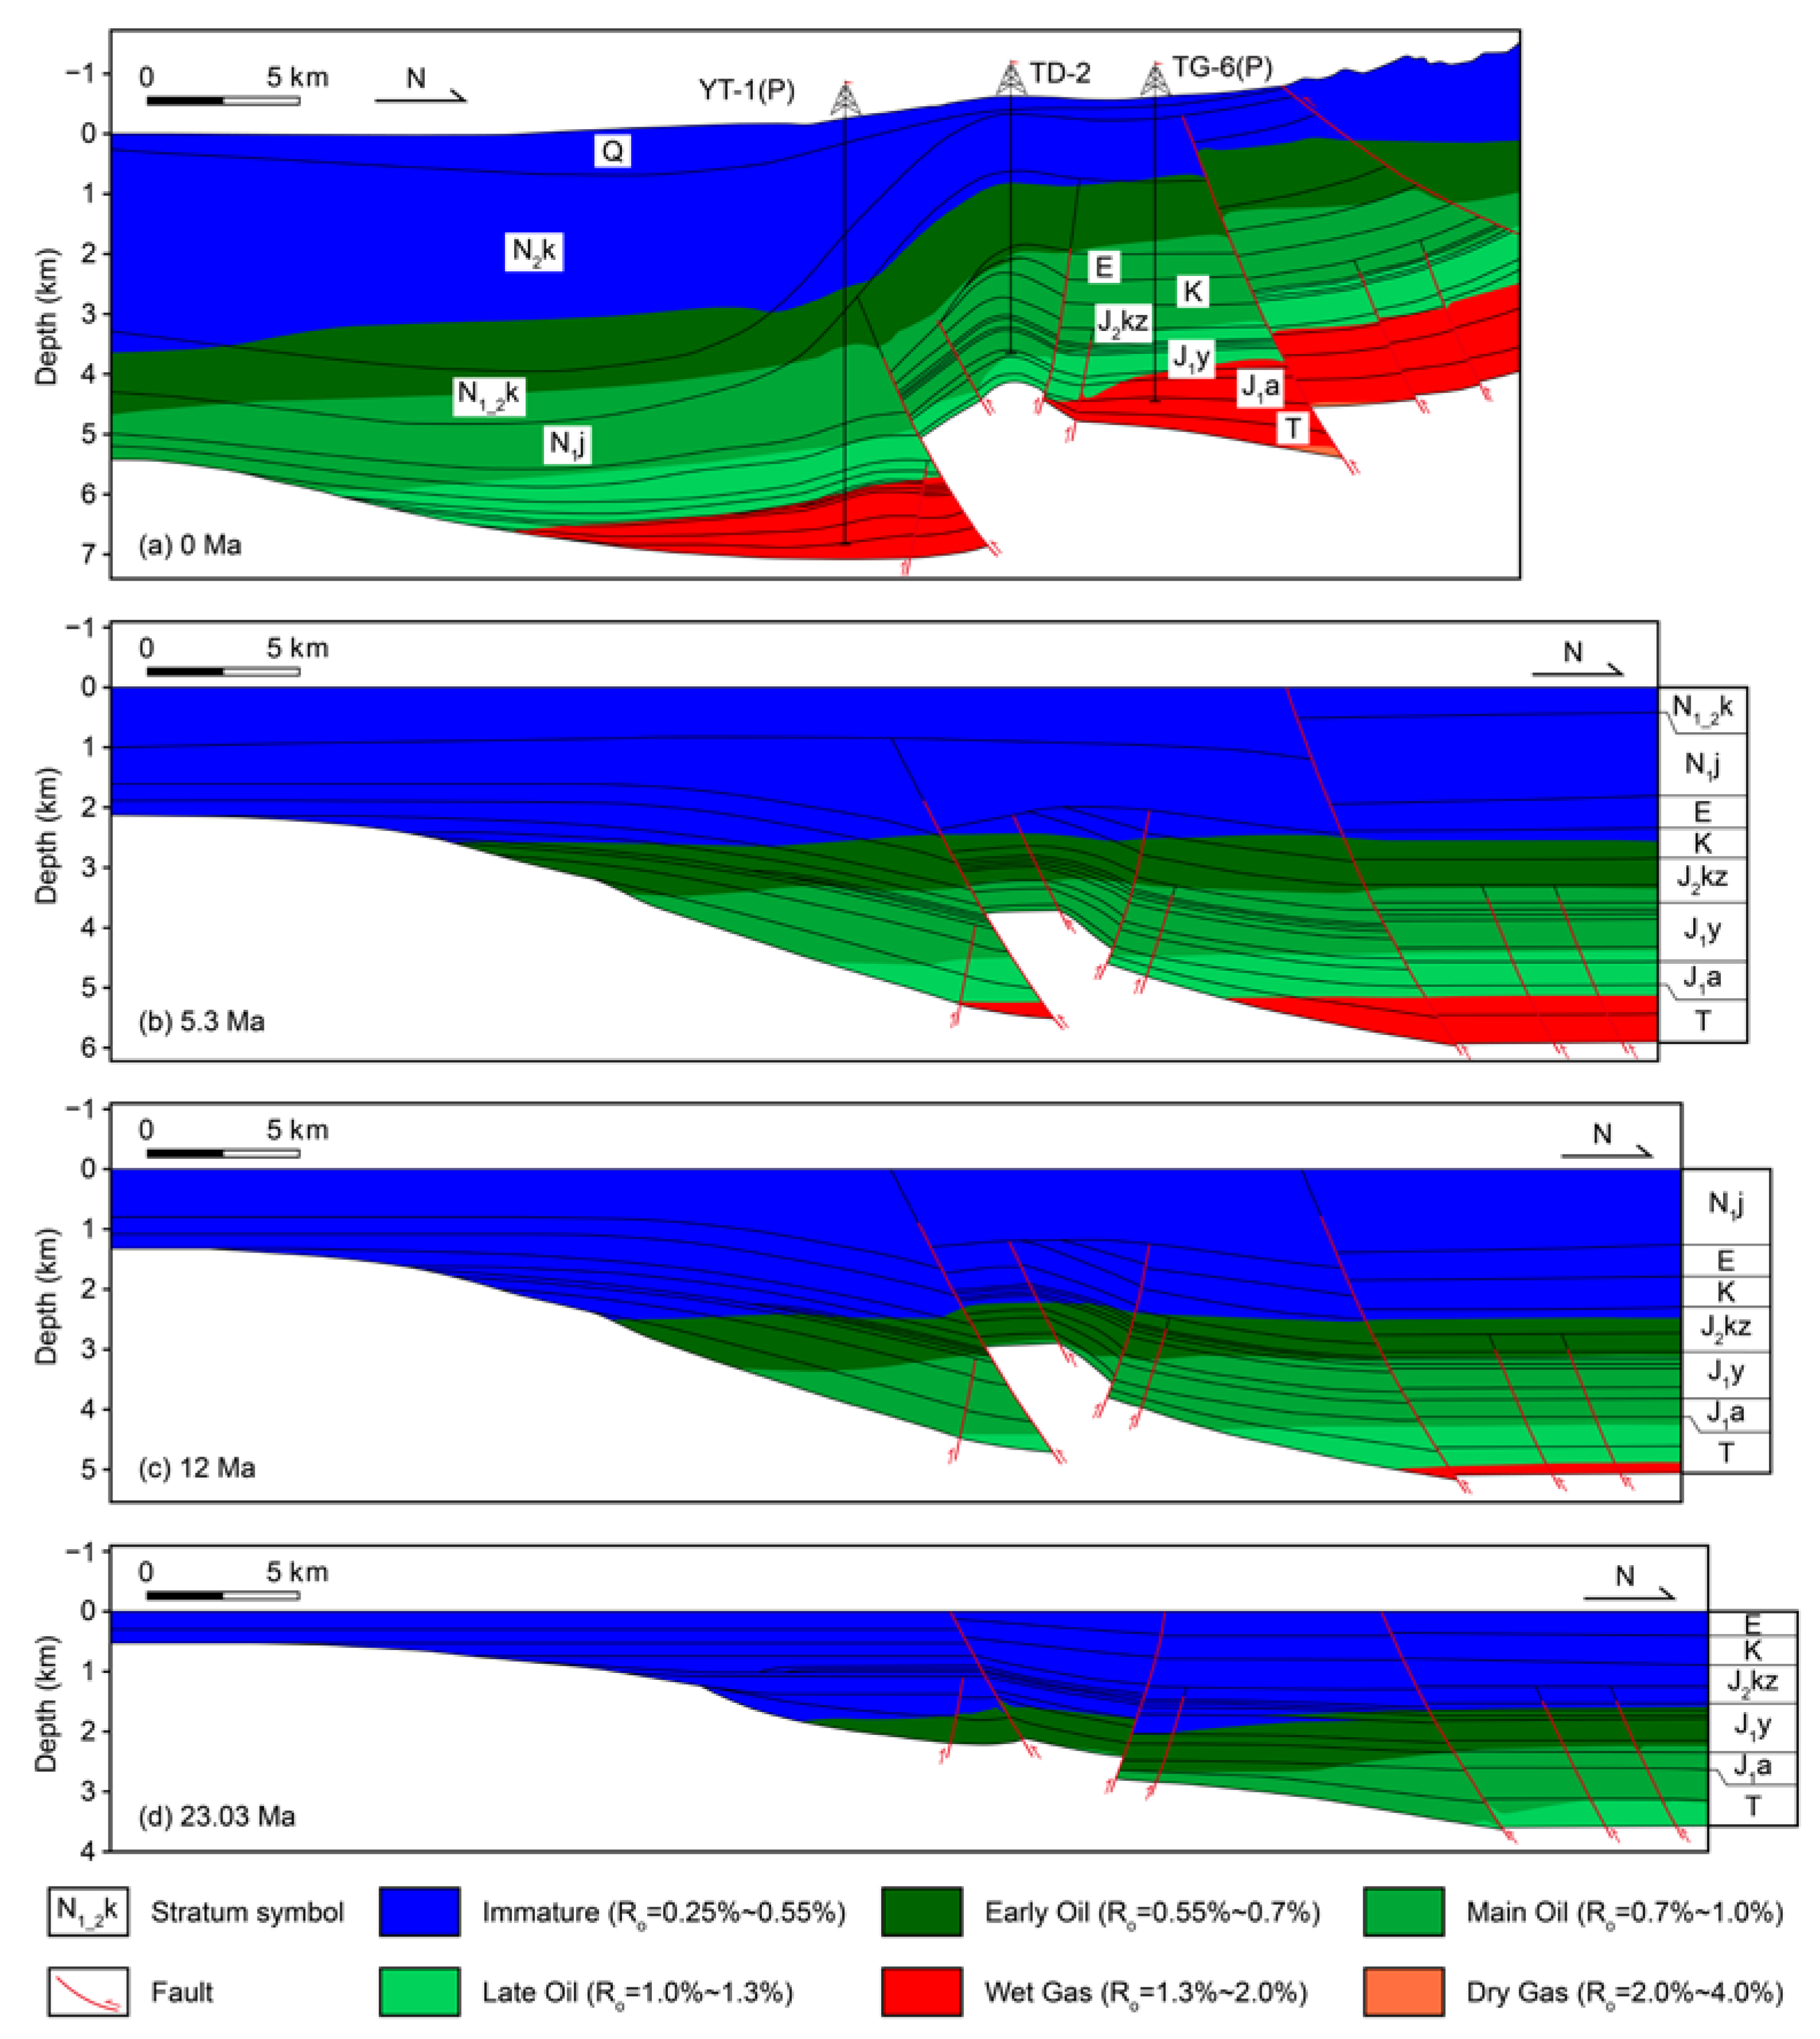
4.1. Tectono-Sedimentary Evolution of the Eastern Kuqa Depression

The restoration results for the balanced cross-section and one-dimensional (1D) modeling of three wells (YT-1, TD-2, and TG-6) are presented in Figure 4 and Figure 5. The results show that the section has undergone a long period of shallow burial and a short period of rapid subsidence and burial (Figure 5). Before the Paleogene, a small number of faults developed, there was no obvious fault displacement, and the strata showed a horizontal occurrence (Figure 4f–h). Two stages of uplift and erosion events occurred in the Late Jurassic and Late Cretaceous (Figure 5). Two major faults developed in the Paleogene, breaking through all strata and causing local strata to uplift and undergo erosion (Figure 4e). From the Neogene Jidike stage, a thick layer of gypsum–salt rock was deposited, plastic deformation occurred under the influence of tectonic extrusion, and underlying strata underwent bending deformation influenced by this extrusion (Figure 4d). At the end of the Neogene, secondary faults developed in the core of the section. With an increase in lateral compression, the hanging wall of the core fault formed a dome, setting the current section’s shape. The section has experienced more intensive shortening since the Pliocene. The Kuqa formation has suffered large-scale erosion, followed by the deposition of a thin Quaternary formation (Figure 4a).
The Hula Mountain in the South Tianshan Mountains was mainly the provenance of the Neogene strata, with a source direction from the northeast to the southwest [32,33]. Before the Late Miocene (5.3 Ma), the northern slope zone was close to the source area and became the depositional center. The thickness of strata along the provenance direction gradually became thinner toward the southern slope zone. The Kuqa Depression has experienced intensive lateral extrusion since the Pliocene, especially in the mountain front, forming several large thrust belts. At the same time, the northern strata of the section were uplifted and eroded, and the southern part formed a deep sag area, which provided a favorable sedimentary accommodation space. Since then, the depositional center has gradually moved southward. At present, the southern slope zone and the deep sag zone are the depositional center (Figure 4a).

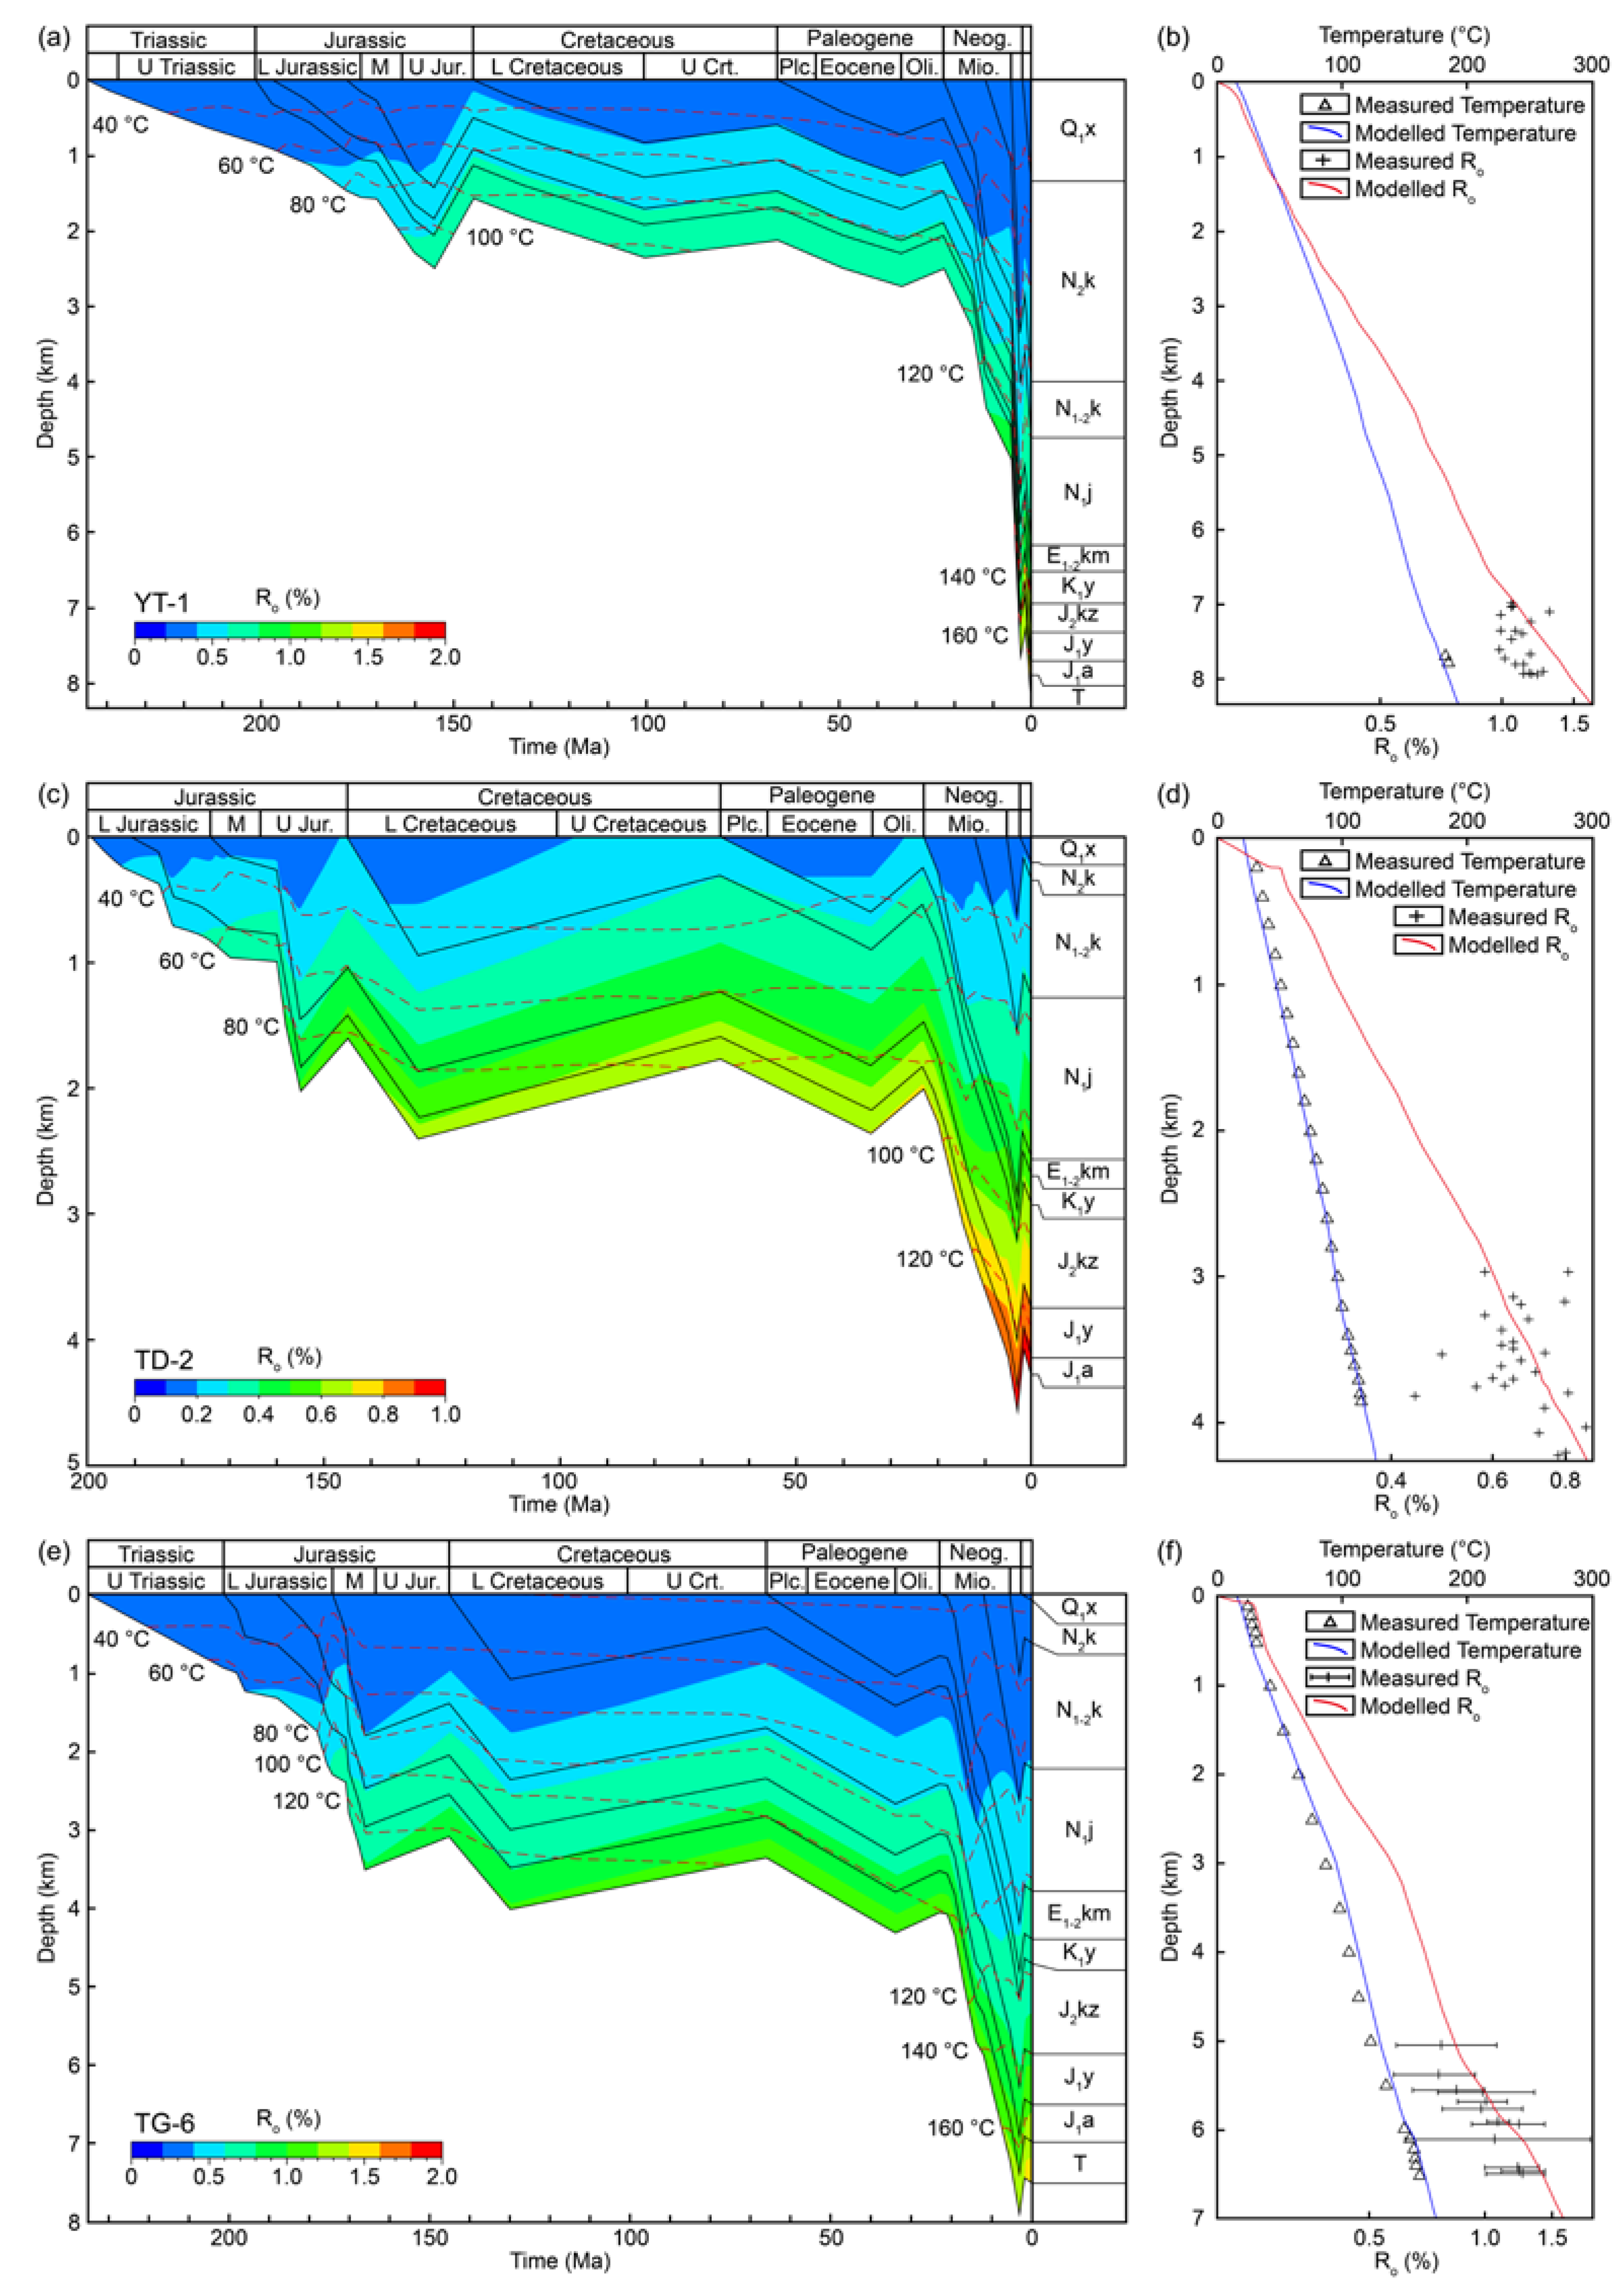
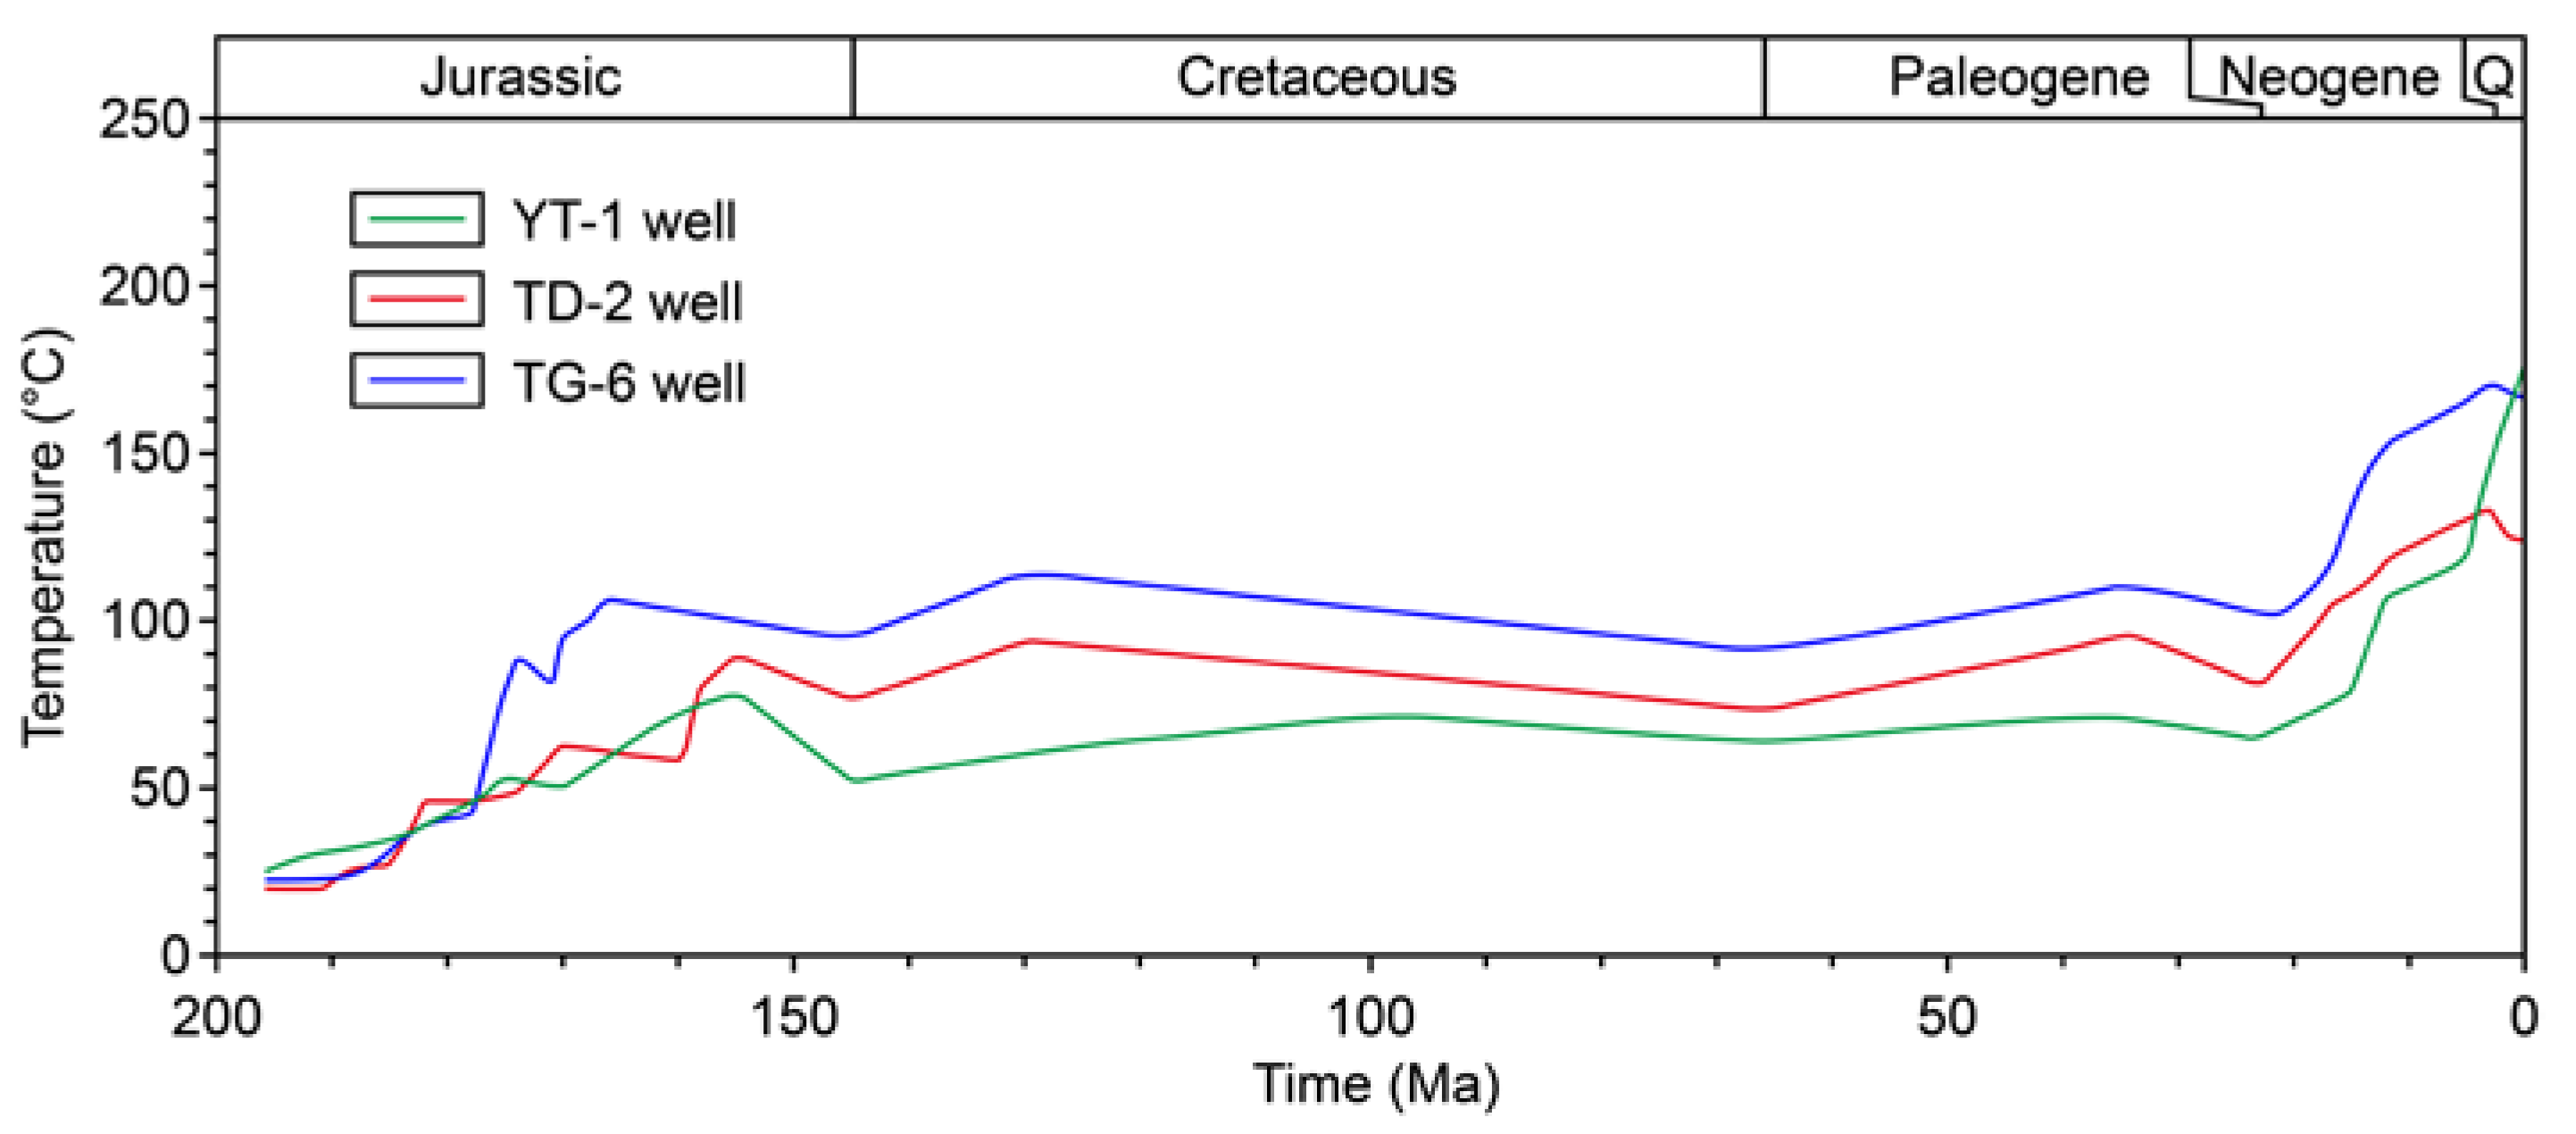
4.2. Thermal and Maturity History of the Eastern Kuqa Depression

In this model, the YT-1, TD-2, and TG-6 wells were selected to represent the deep sag zone, the central anticline zone, and the northern slope zone, respectively. By using some measured temperatures and Ro values in these wells, the modeled thermal and maturity histories were calibrated (Figure 5). The results show close fitness between the measured and modeled temperatures and Ro values in all three wells (Figure 5), indicating the reasonability of the thermal history. The thermal evolution of the J1a formation with respect to the three wells and the source rock maturity evolution of the section were simulated and are shown in Figure 6 and Figure 7.
In the Middle Jurassic, the northern slope zone (TG-6 well) was in the depositional center, with the maximum burial depth reaching 3500 m and a corresponding stratum temperature of 130 °C, significantly higher than the other two zones (TD-2 and YT-1 wells) (Figure 5). Given the relatively weak tectonic movement, the Kuqa Depression experienced a long period of slow burial and erosion cycles from the Jurassic to the Paleogene. It can be seen that the formation temperature throughout the entire section did not change greatly (Figure 5 and Figure 6) during this period. With the southward movement of the depositional center and the rapid burial from the Neogene, the bottom of the J1a temperature increased rapidly, especially in the northern slope zone and deep sag zone, with the highest temperature being greater than 160 °C at present (Figure 5a,e), while the highest temperature of the central anticline zone was only about 130 °C because of a relatively shallow burial depth (Figure 5c). It is clearly shown in Figure 6 that, in the whole historical period, the bottom of the J1a temperature of the northern slope zone (TG-6 well) was the highest before the late Neogene, followed by the central anticline zone (TD-2 well) and the deep sag zone (YT-1 well). The formation temperature has rapidly increased since the Neogene, with the heating rate of the formation in the deep sag zone obviously being the fastest (Figure 6).
The maturity evolution of the AA’ section was modeled to show its maturity characteristics in different periods and different parts of the section (Figure 7). At 23.03 Ma, the Triassic source rock in the northern slope zone reached a late mature stage (1.0–1.3% Ro) while other zones were in the early mature stage (0.55–1.0% Ro). The Jurassic J1y formation and J2kz formation source rocks were still in the immature stage (0.25–0.55% Ro) (Figure 7d). At 12 Ma, the temperature of the Triassic source rocks in the northern slope zone increased rapidly because of rapid burial and reached a highly mature stage (1.3–2.0% Ro). The Jurassic source rocks also reached a mature stage (0.55–1.0 Ro). The source rocks in the central anticline zone were still in an immature-to-early-mature stage (0.25–0.7% Ro) because of the shallow burial depth. The source rocks in the southern slope zone and the northern part of the deep sag zone became mature while the southern region was still in the immature stage (Figure 7c). At 5.3 Ma, the Ro values of the Triassic and Jurassic source rocks were all greater than 0.55%, mainly between 0.7% and 1.3%, and the Triassic source rocks in the southern slope zone and the northern slope zone were in a highly mature stage (1.3–2.0% Ro) (Figure 7b). The present maturities of both the Triassic and the Jurassic source rocks showed characteristics similar to the stage of their maximum burial depth and have similar features to the source rocks at 5.3 Ma (Figure 7a).

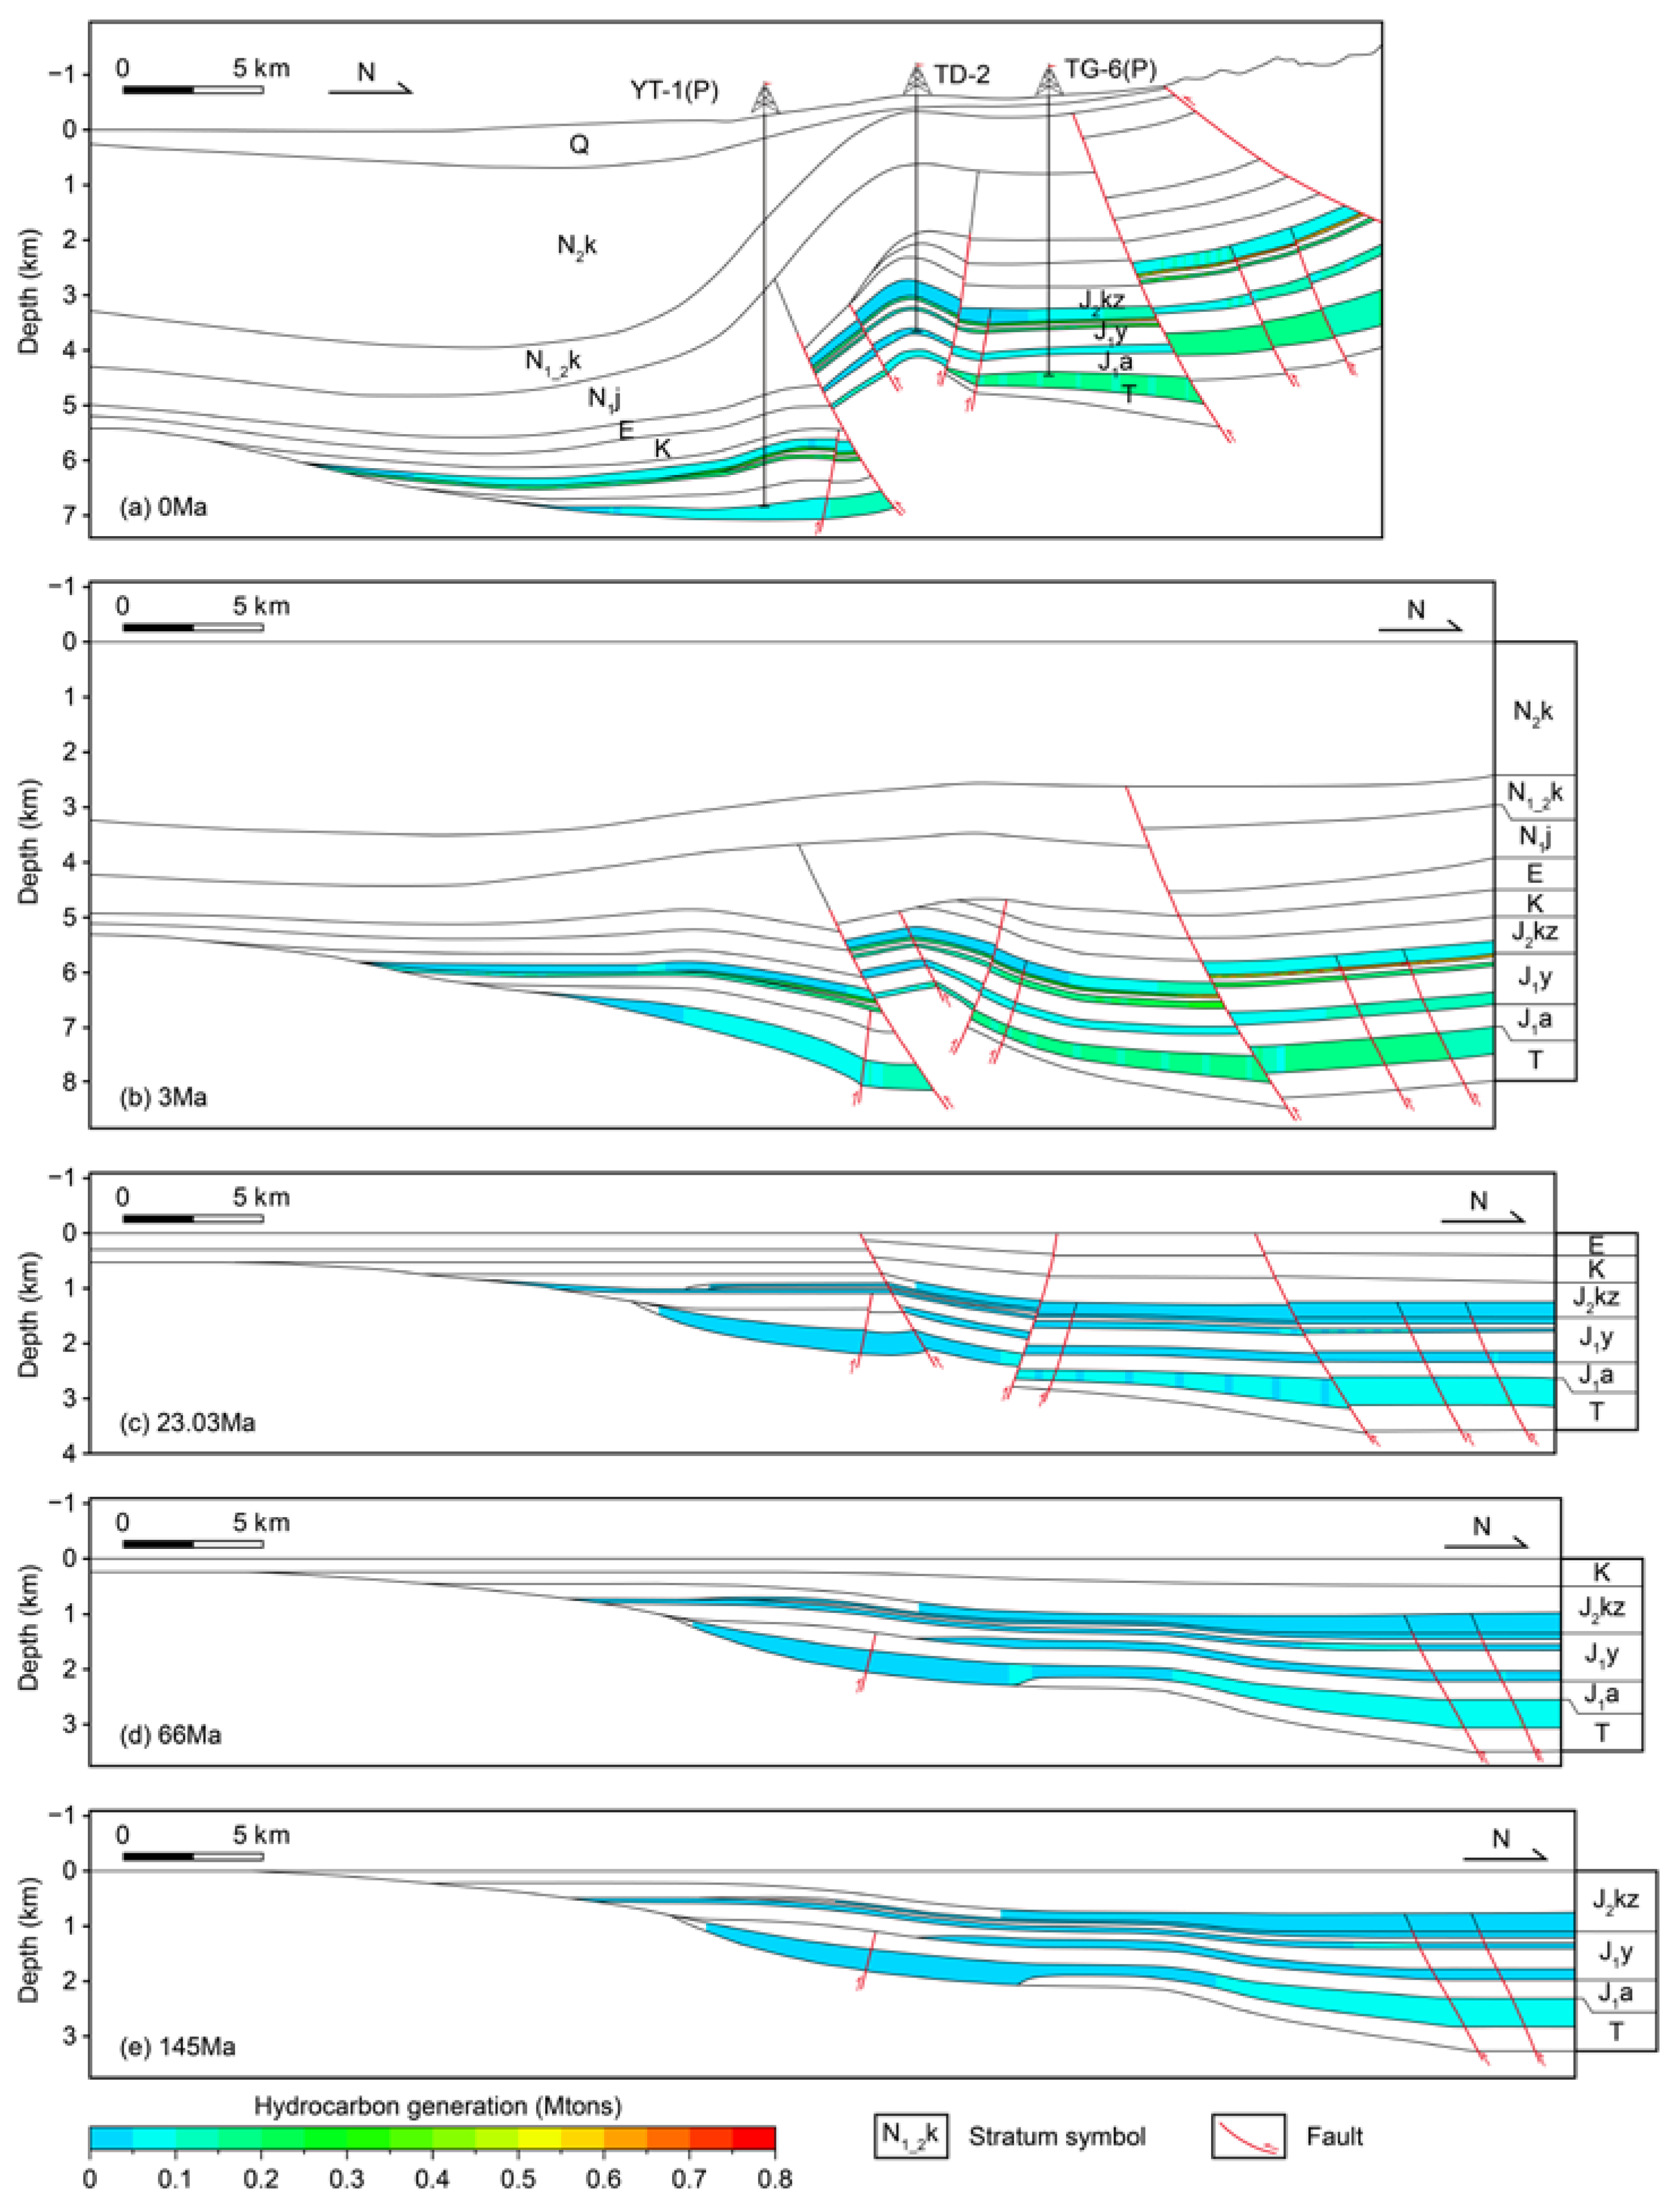
4.3. Hydrocarbon Generation History of the Eastern Kuqa Depression

On the basis of the reasonable burial and thermal history of the section, hydrocarbon generation quantity was then simulated, following the multi-component kinetics of previous research [12]. During the Jurassic to Paleogene periods (145–23.03 Ma), both the Triassic and the Jurassic source rocks were basically in the immature-to-early-mature stage, with a minor amount of oil and gas generated, especially in the northern slope zone (Figure 8c–e). At the end of the Neogene (3 Ma), all source rocks began to generate large amounts of hydrocarbons, especially Triassic mudstone and coal in the Jurassic J1y formation, which produced a large amount of oil and gas. Among them, the performance of coal is the most prominent. Although the source rocks in other zones also reached the mature-to-highly mature stage, only a small number of hydrocarbons were generated (Figure 8b). At present, the source rocks are mainly in the mature-to-highly mature stage and still generate a large number of hydrocarbons. The Triassic mudstone and coal of the J1y formation have entered a stage of generating a large amount of wet gas (Figure 8a).

5. Discussion

5.1. Comparisons of Hydrocarbon Generation

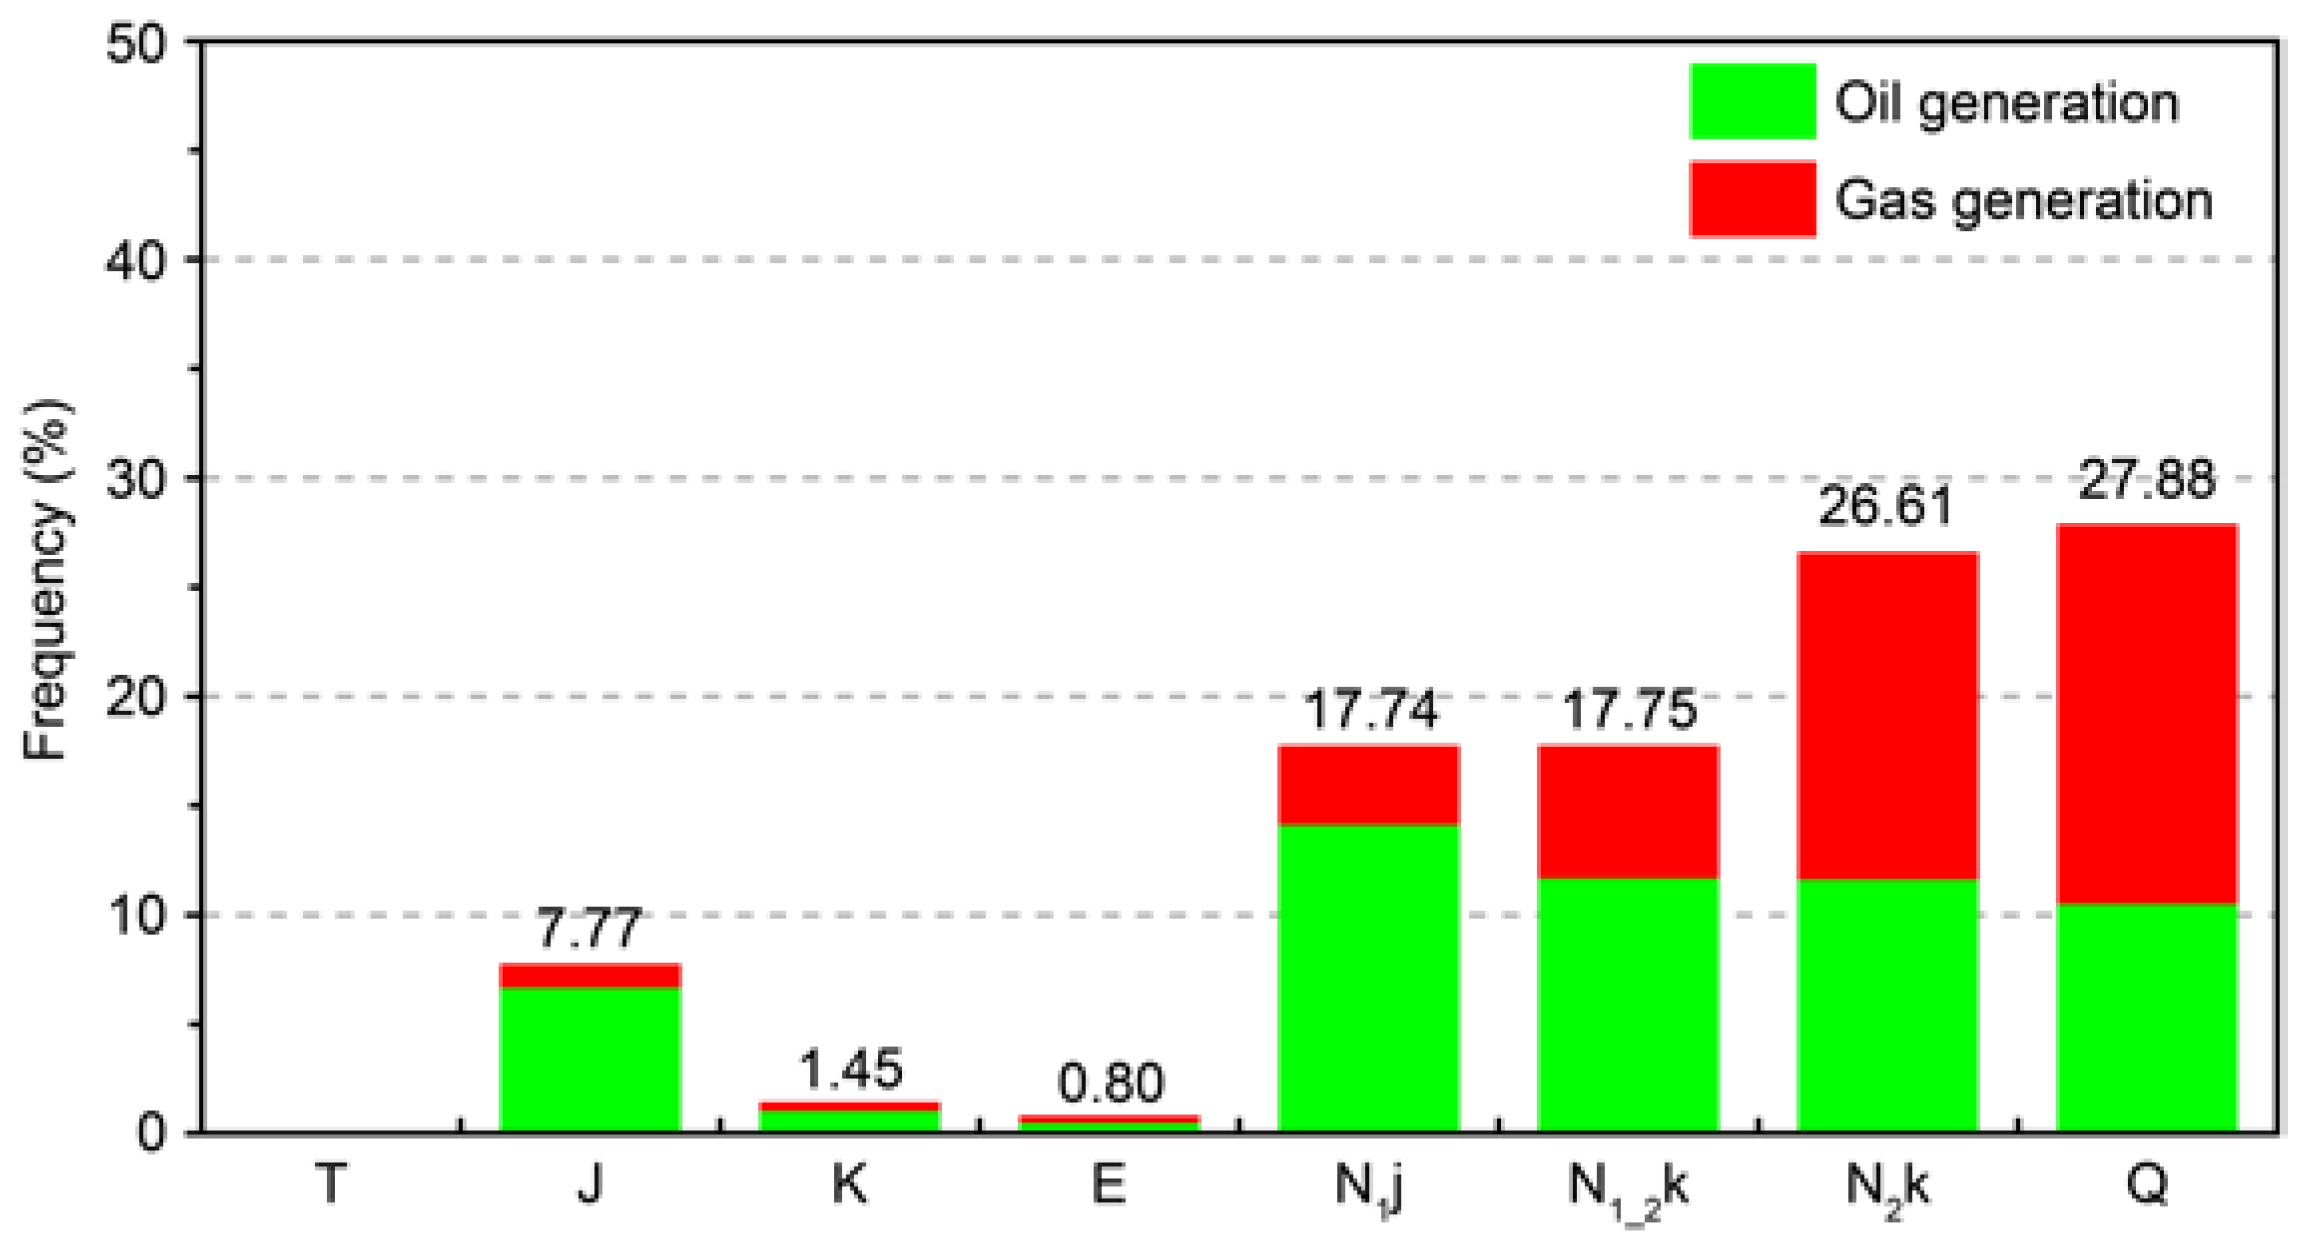
5.1.1. Hydrocarbon Generation in Different Geological Periods

In order to intuitively reflect the changes in hydrocarbon generation at different geological times, we quantitatively counted the hydrocarbon generation of the AA’ section (Figure 9). The results show that most of the source rocks were in the immature-to-early-mature stage from the Jurassic to the Paleogene (Figure 7), resulting in only a small amount of oil and gas generation, accounting for 10.02% of the total hydrocarbon generation in the whole historical period. Since the Neogene, the source rocks have matured rapidly and began to generate a large amount of oil and gas, showing a gradually increasing trend. Especially in the Pliocene, the proportion of hydrocarbon generation reached 26.61% (Figure 9). The maturity of the source rocks ranged from 0.70% to 2.0% during the Quaternary (Figure 7) and still generated a large amount of oil and gas in this period, accounting for 27.88% of the total hydrocarbons generated (Figure 9). It can also be seen from the above data that the main hydrocarbon generation periods in the eastern Kuqa Depression are the late Neogene and the Quaternary. During this period, the proportion of oil generation decreased, while the gas generation increased significantly, with gas dominant (Figure 9).

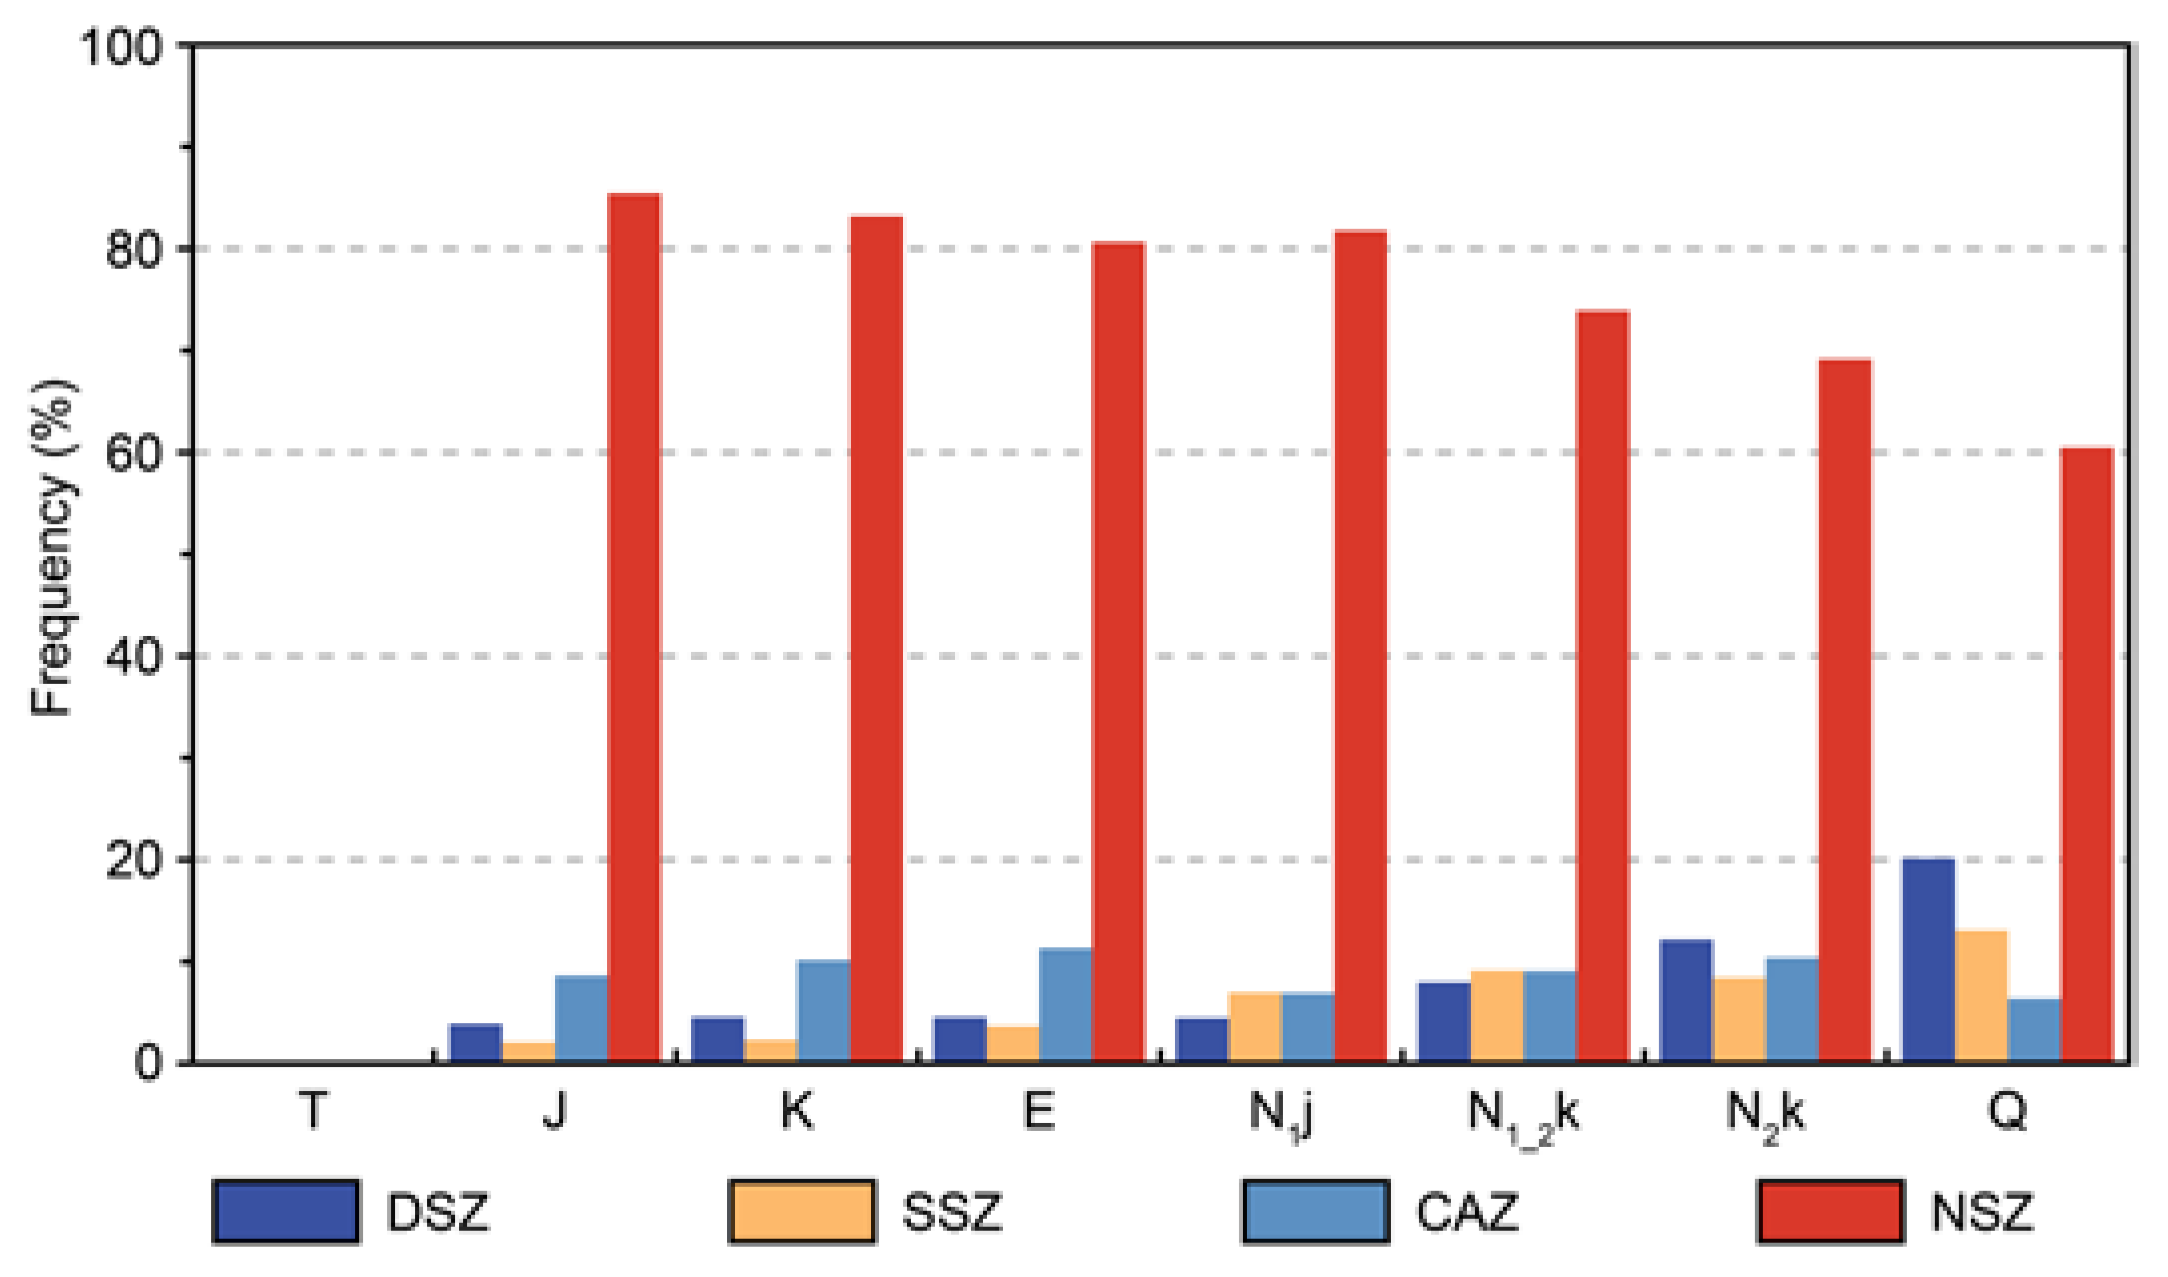
5.1.2. Hydrocarbon Generation in Different Zones

The spatial and temporal distribution of hydrocarbon generation is analyzed in Figure 8. The hydrocarbon generation of source rocks in different zones was counted for regional comparison. By comparing the proportion of different zones (Figure 1d) in the same geological period to highlight the favorability of hydrocarbon generation (Figure 10), it can be seen that the hydrocarbon generation of the northern slope zone (NSZ) is greater than that of the other zones. The proportion of hydrocarbon generation in the northern slope zone decreased from the early to late historical periods, but it still accounted for more than 60% in each period. However, the proportion of other zones showed low growth in general. The regional difference is mainly controlled by the following factors: (1) The northern slope zone has always been in the depositional center, with a large amount of sedimentary thickness and a deep burial depth for the source rocks. The time when the source rocks reached mature was early (Figure 7), resulting in an earlier initial hydrocarbon generation time, and they have continuously been in the hydrocarbon generation stage since then. (2) Coal is widely distributed in the northern slope zone, and a previous study showed that the hydrocarbon generation capacity of coal is better than that of mudstone or carbonaceous mudstone [12], which makes the hydrocarbon generation amount in the northern slope zone significantly greater than in other zones.

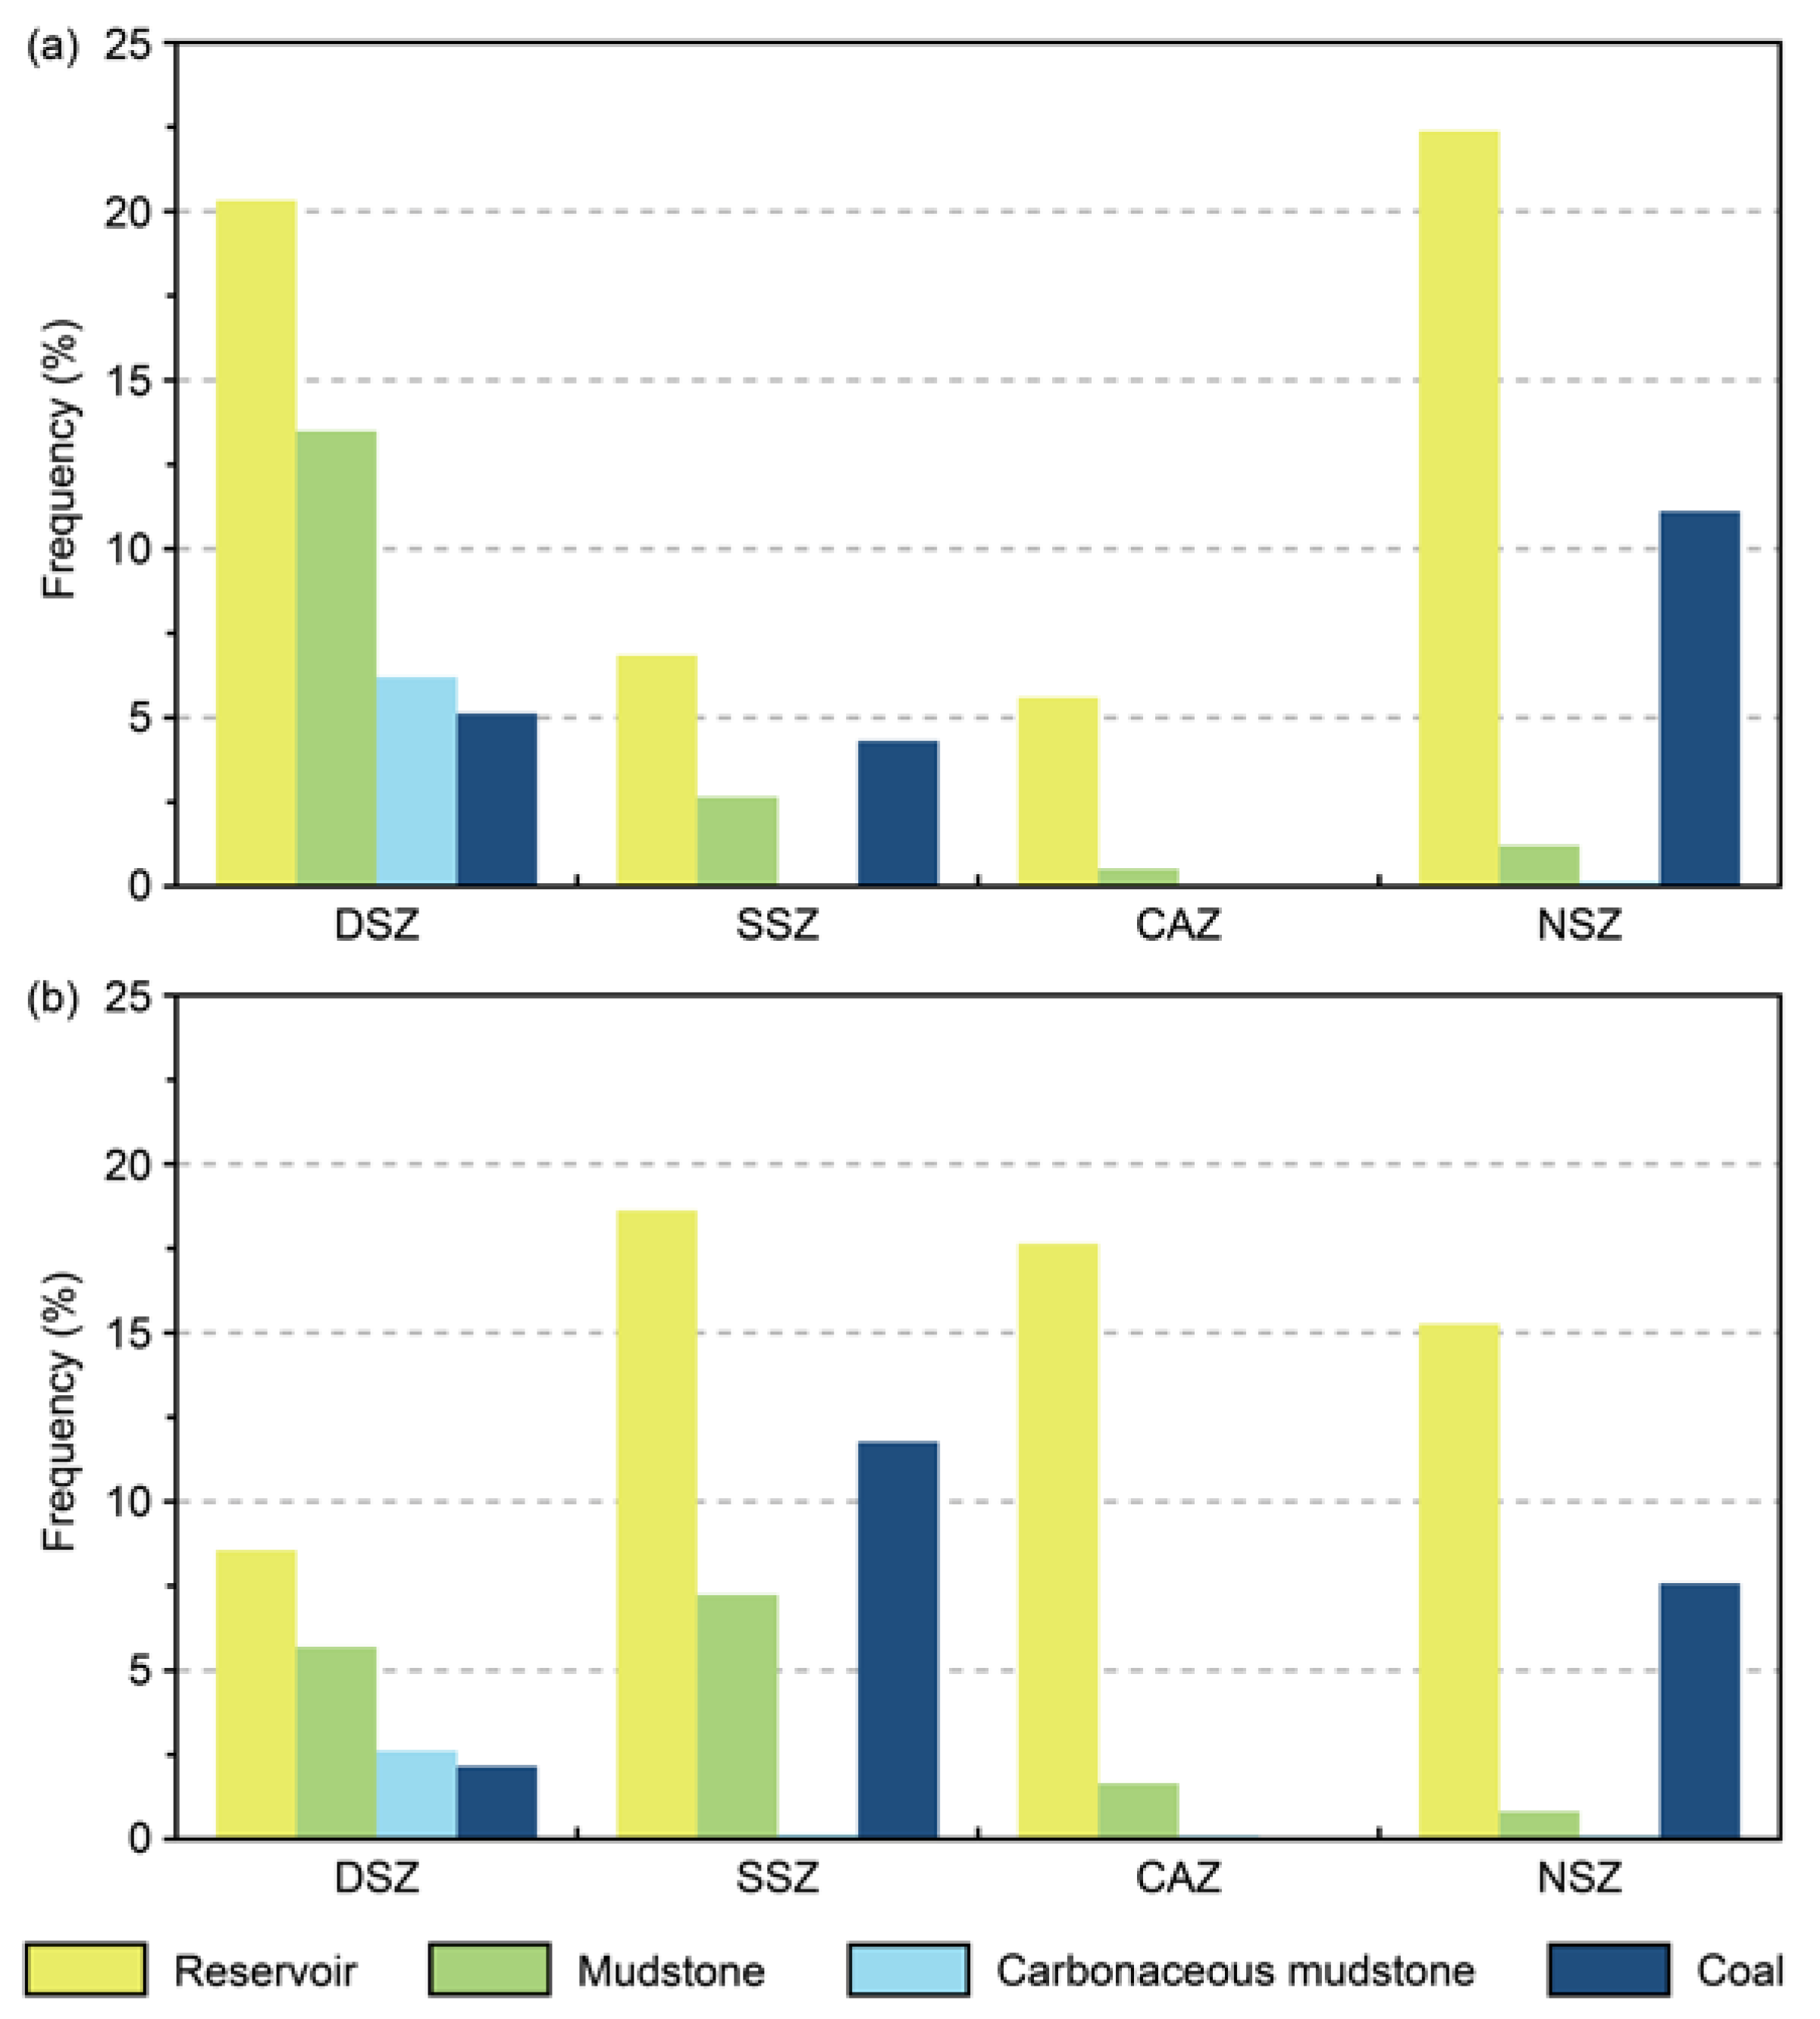
5.1.3. Hydrocarbon Generation in Different Strata

In this study, three sets of source rocks were set up, namely, Triassic source rock, Jurassic J1y formation source rock, and Jurassic J2kz formation source rock. Comparing the hydrocarbon generation of the three sets of source rocks has reference significance for oil-source correlation in the eastern Kuqa Depression (Figure 11). Before the Neogene, hydrocarbon generation from the Triassic source rock and the J1y formation source rock occupied the dominant position, and the quantity was basically the same. Since the Neogene, the source rocks of the J1y formation have begun to generate a larger amount of hydrocarbon, and the amount of hydrocarbon generation is far greater than the other two sets of source rocks. The proportion of hydrocarbon generation in Triassic source rocks gradually decreased, whereas with the mature J2kz formation source rock, the proportion of oil and gas generated continued to increase (Figure 11). The statistical results show that the cumulative hydrocarbon generation of the Jurassic source rocks is more than five times that of the Triassic source rock. Therefore, it can be considered that the oil and gas, especially in the J1y formation, were mainly derived from Jurassic source rocks.

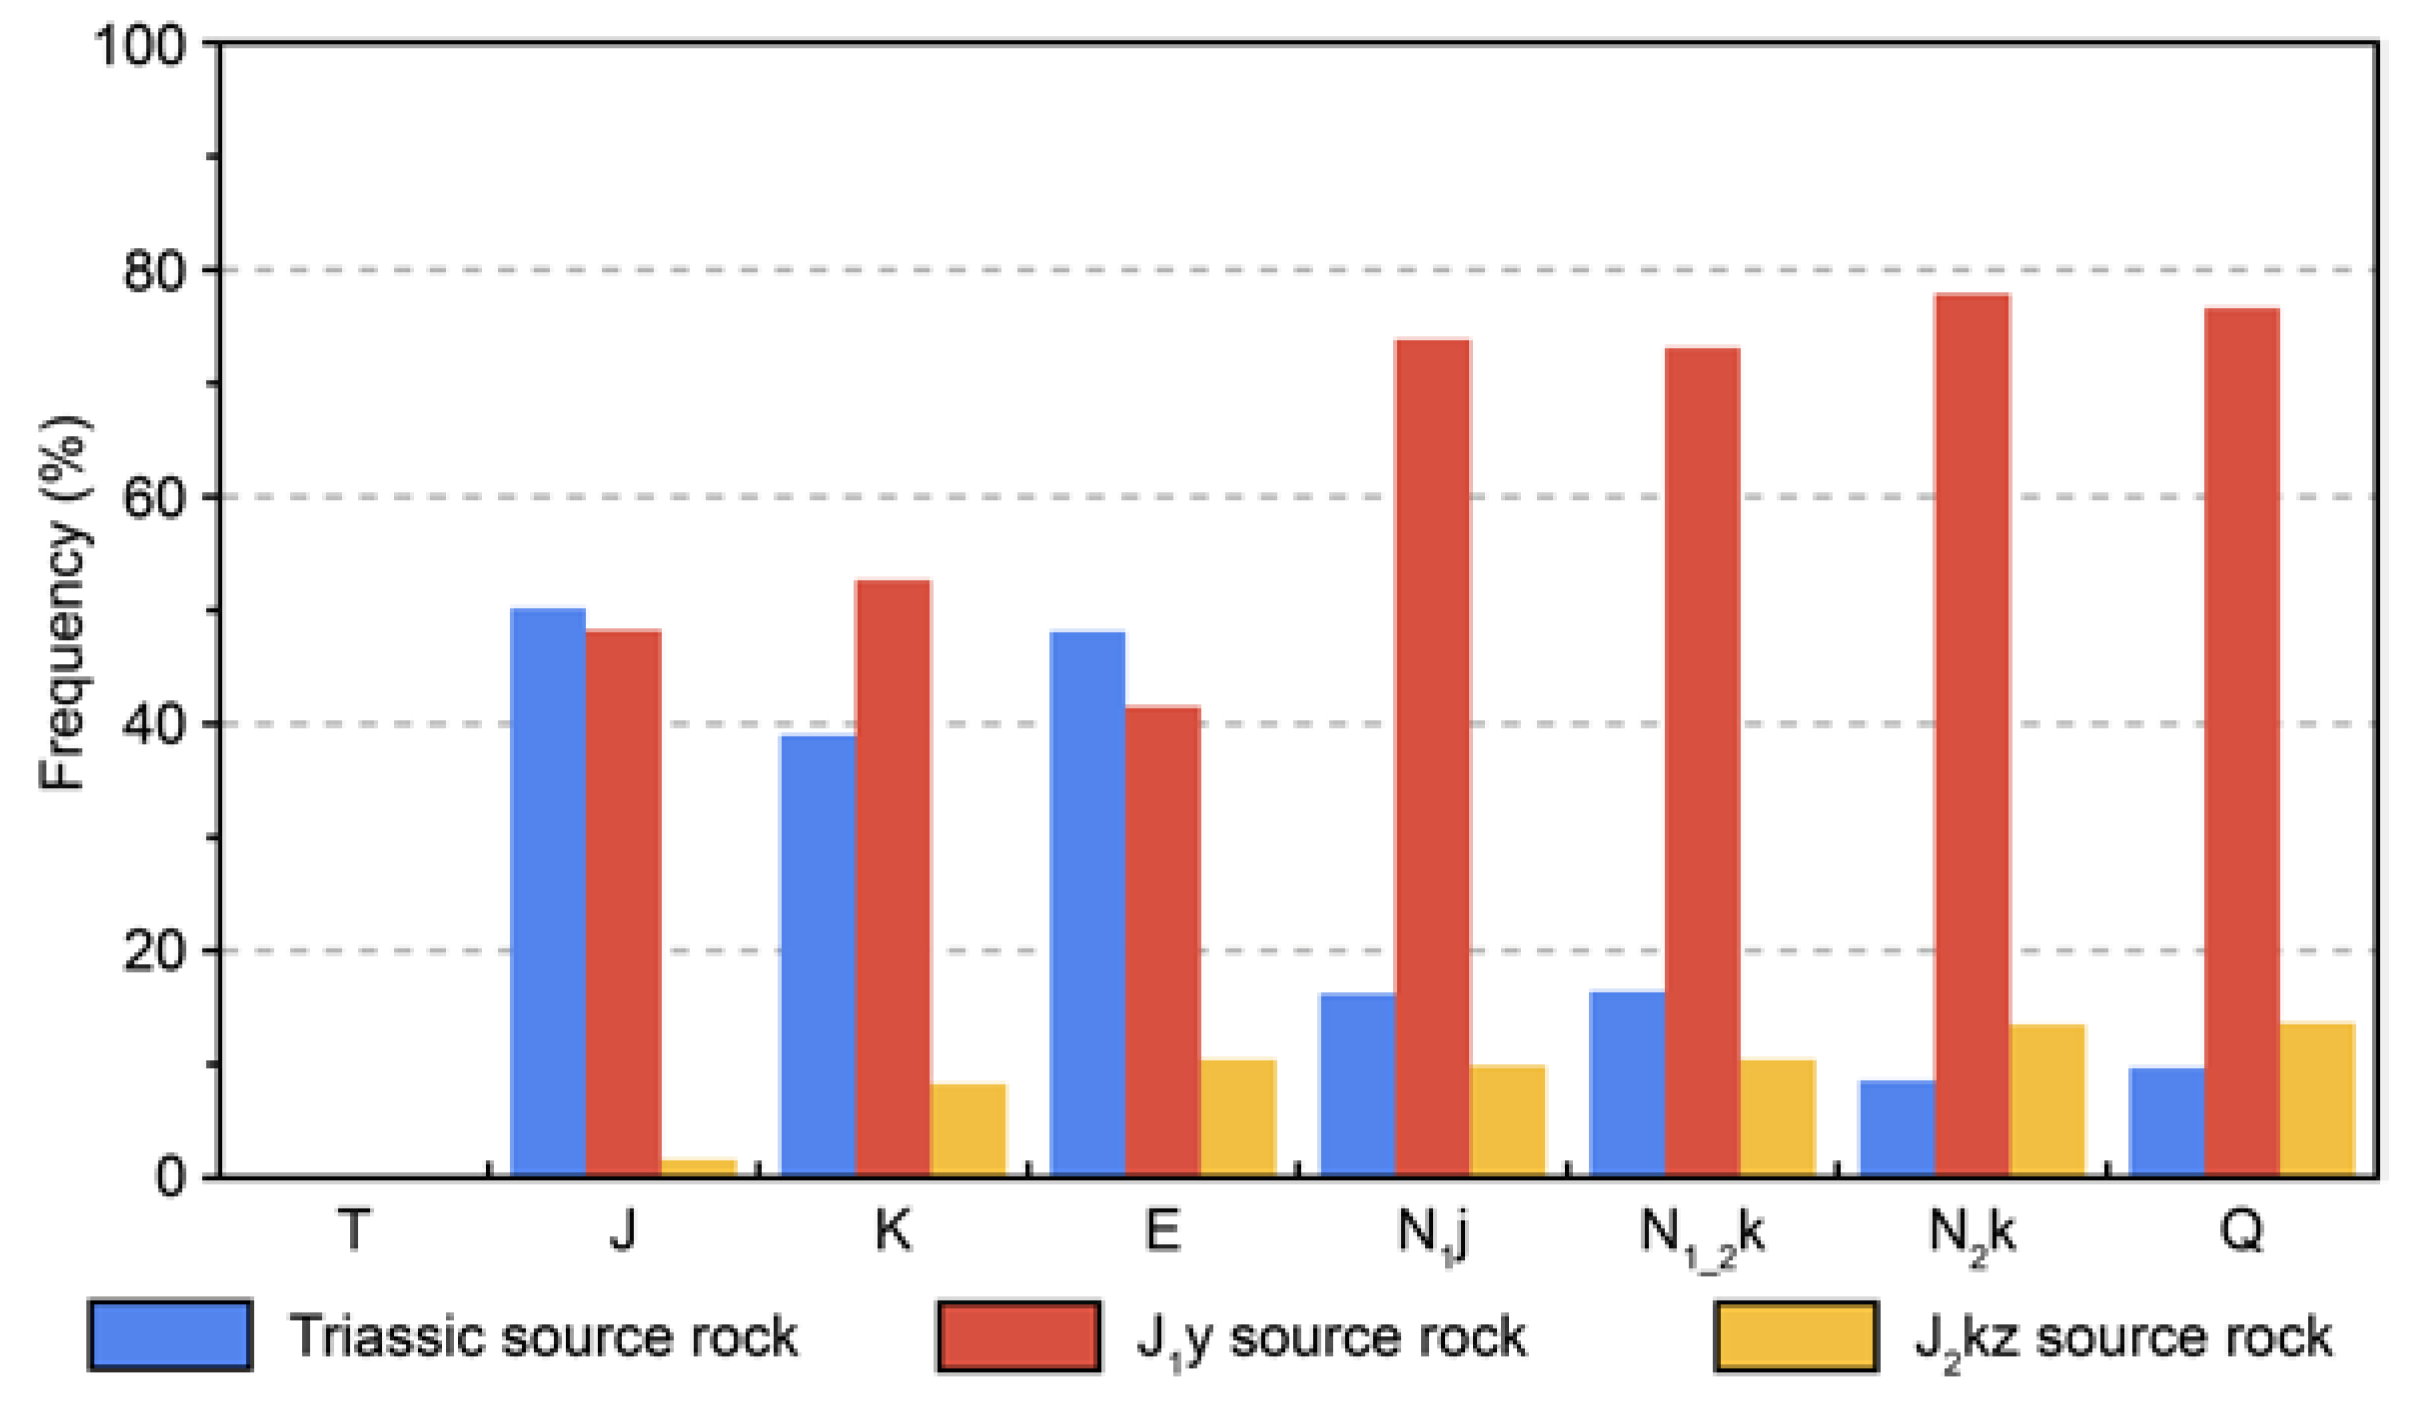
5.1.4. Hydrocarbon Generation of Different Lithologic Source Rocks

In order to accurately compare the cumulative hydrocarbon generation of different lithologic source rocks, the hydrocarbon generation of mudstone, carbonaceous mudstone, and coal was measured (Figure 12). The mudstone represents the sum of mudstones in the Triassic, the Jurassic J1y formation, and the Jurassic J2kz formation. The results show that the cumulative hydrocarbon generation of mudstone has been significantly more than that of carbonaceous mudstone and coal before the deposition of the N2k formation, which plays a dominant role in hydrocarbon generation. Since the Neogene, the hydrocarbon generation rate of coal and carbonaceous mudstone has accelerated, which is affected by source rock maturity. At present, the cumulative hydrocarbon generation of coal has reached the maximum, followed by mudstone and carbonaceous mudstone. In the section parameters, the average thickness of mudstone is 650 m, while the average thicknesses of coal and carbonaceous mudstone are only 50 m and 60 m, respectively. Therefore, among the three types of lithologic source rocks, the hydrocarbon generation capacity of mudstone, carbonaceous mudstone, and coal has gradually increased.

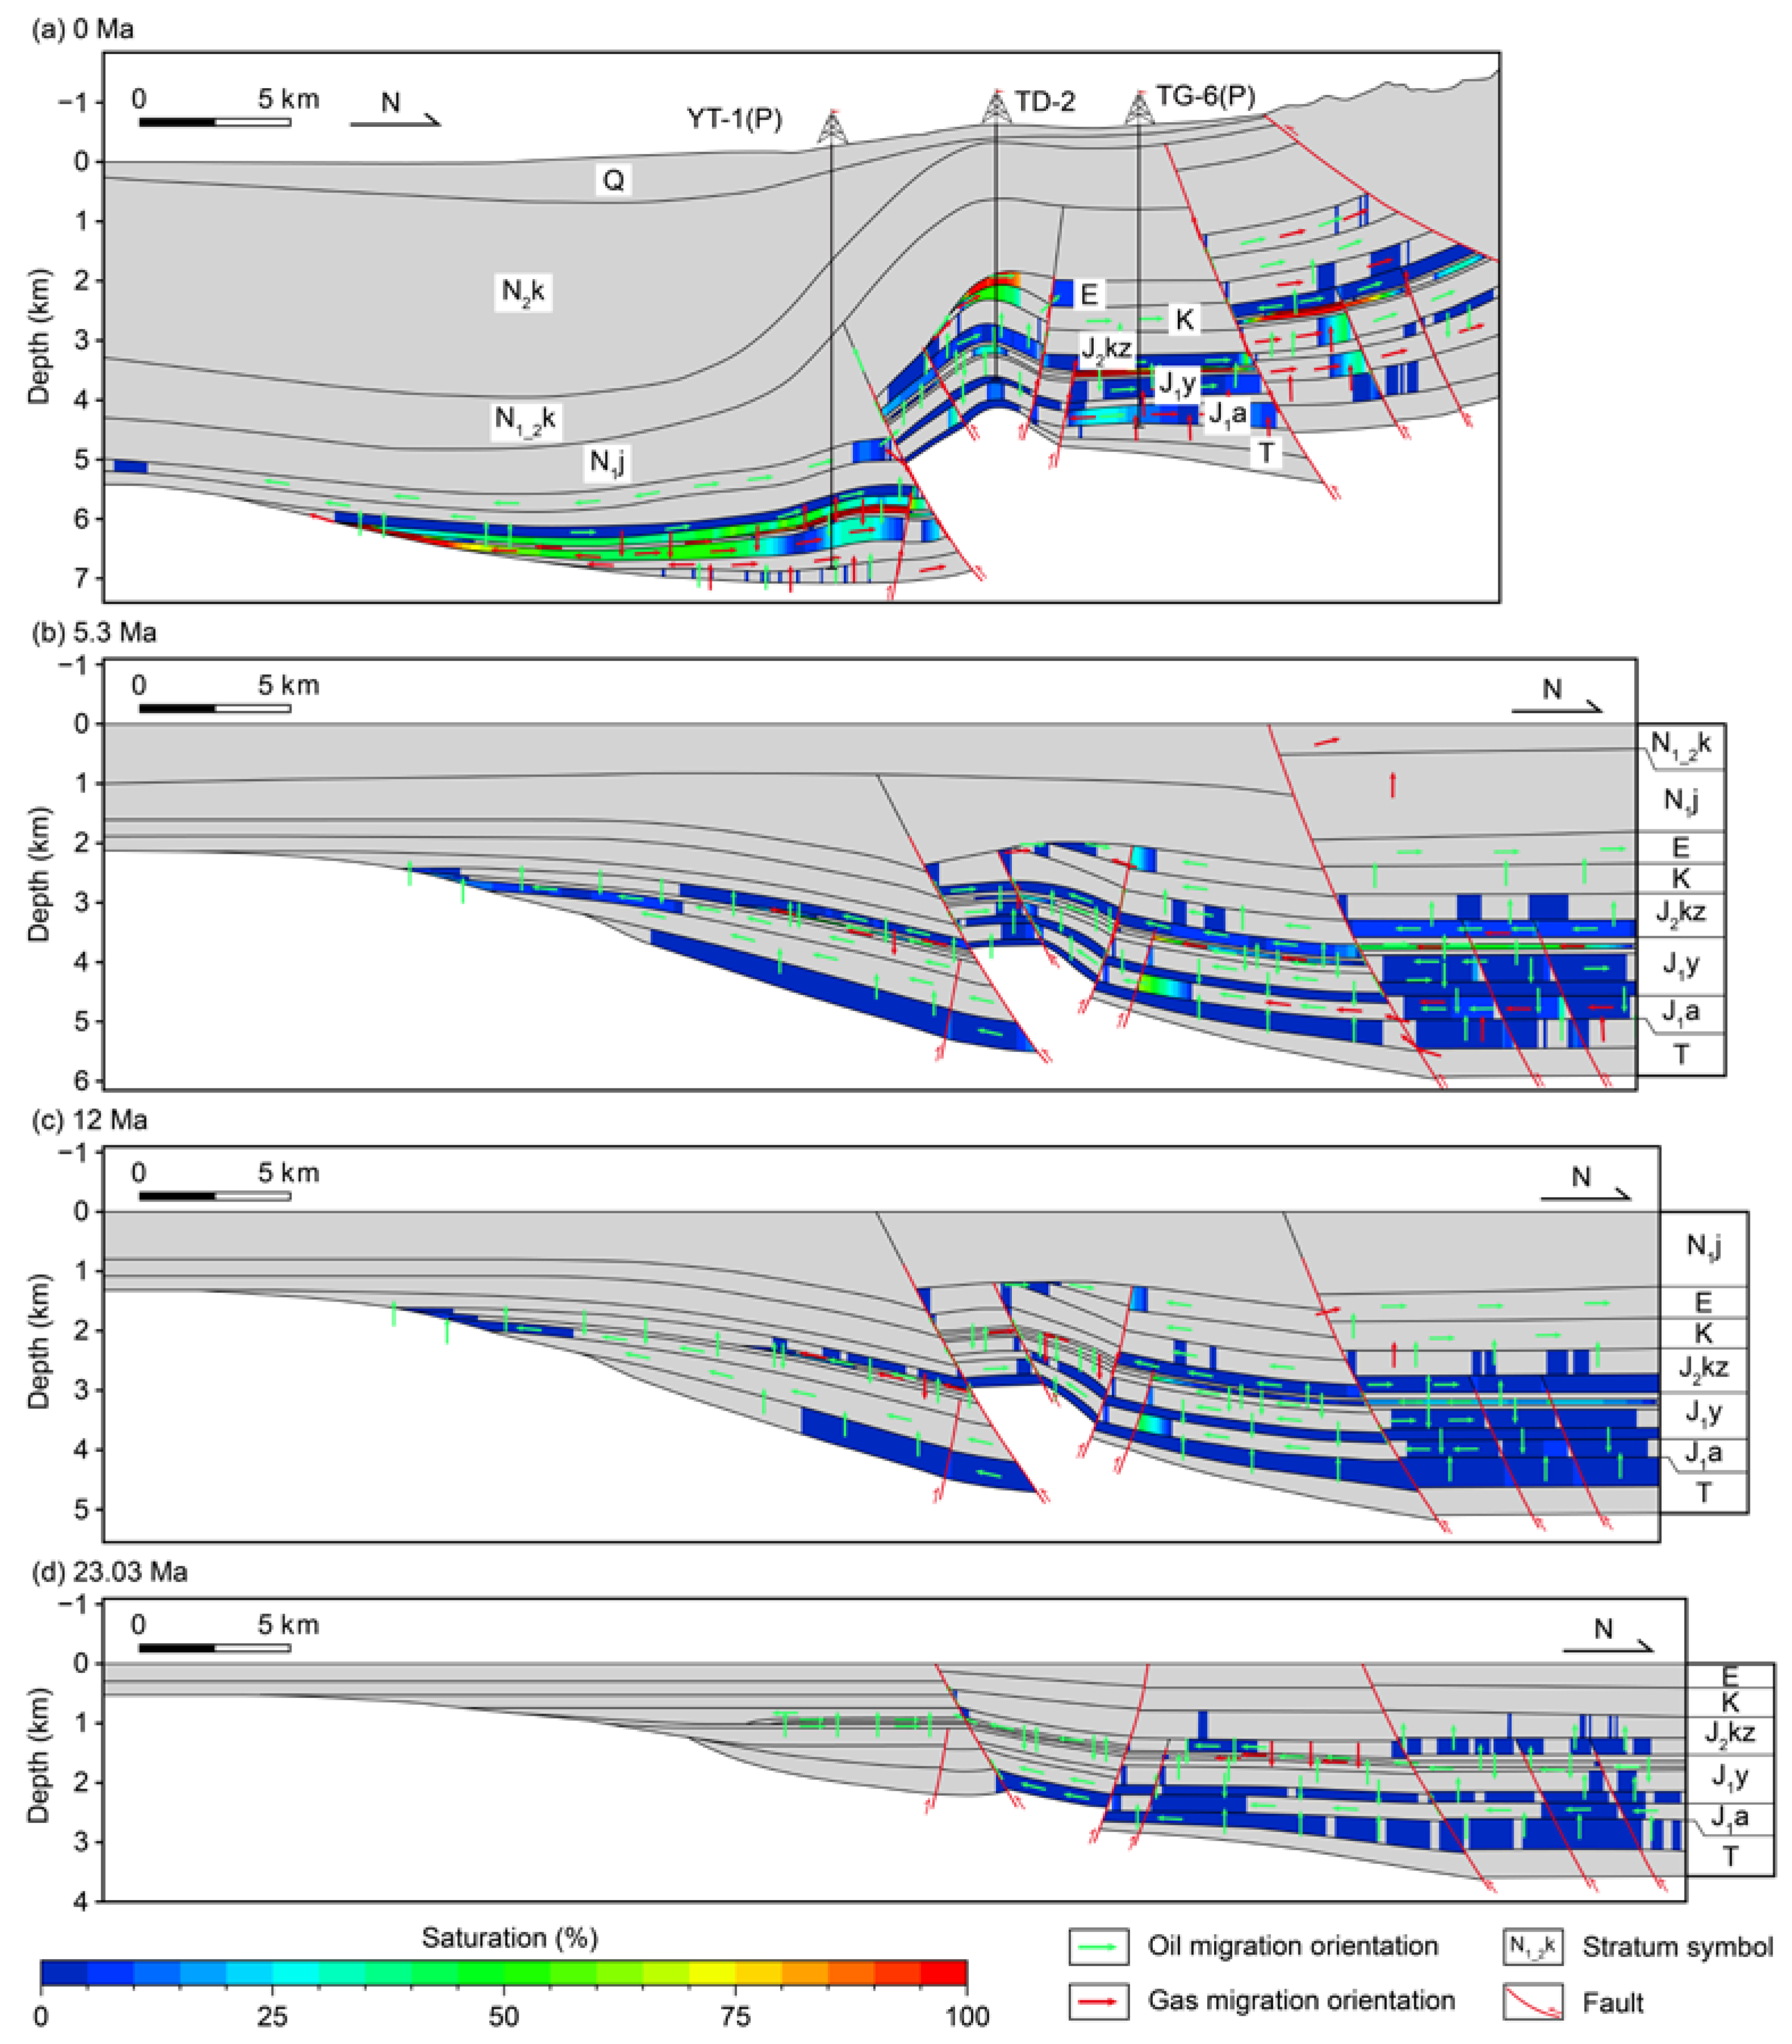
5.2. Migration and Accumulation Process

As mentioned above, oil and gas in the eastern Kuqa Depression were derived from Triassic and Jurassic source rocks. However, how oil and gas were expelled and migrated to the present position has not yet been researched. In this study, hydrocarbon migration history was modeled to help interpret this issue (Figure 13).
From the Jurassic to the Cretaceous, the Triassic and Jurassic source rocks began to expel a little liquid hydrocarbon into the adjacent layers over short distances.
At around 23.03 Ma, some Triassic oil migrated into the central anticline zone via short vertical migration and long lateral migration through the J1a layer. As no traps were formed at that time, no oil accumulated in the central anticline zone. A small amount of gas was expelled into the adjacent layers over short distances (Figure 13d).
At around 12 Ma, the Jurassic source rocks began to expel a large amount of oil. In the central anticline zone and the deep sag zone, oil was expelled upward, and some of this oil migrated through faults and lithological carrier beds. Some oil accumulated in faulted traps in the J1a formation. In the northern slope zone, a little oil generated by J1y coal was expelled, and most of the oil accumulated within the source or near the source. During that time, the J1y coal expelled gas into the adjacent layers, and some gas migrated into the central anticline zone and the deep sag zone via long lateral migration through the J1y layers (Figure 13c).
At around 5.3 Ma, a large amount of oil migrated from source rocks to the adjacent reservoirs through the sandstone transport layer. However, in the northern slope zone, gas was expelled upward, and some of this gas migrated through faults and lithological carrier beds. Some oil and gas accumulated in faulted traps in the J1a and J1y formations in the northern slope zone and the central anticline zone. Some oil generated by source rocks in the northern slope zone migrated southward to the deep sag zone (Figure 13b).
During the late Pliocene (3–1.8 Ma), uplift occurred in the Kuqa Depression related to the late Himalayan orogeny, with more than 1000 m of stratal erosion occurring in most parts of the depression. Therefore, hydrocarbons could not be generated and migrated during that time [4].
At present, oil and gas accumulations in the Jurassic, the Cretaceous and the Paleogene formations in the depression with the maximum petroleum saturation attaining about 90%. Petroleum saturation of the faulted reservoir in the Jurassic formation is approximately 10–40% (Figure 13a).
Hydrocarbon saturation in the reservoir accounts for 55.13% of the total, and both the deep sag zone and the northern slope zone account for more than 20%. In the deep sag zone, a large number of hydrocarbons have accumulated in the source, especially in the mudstone, and an amount in the northern slope zone has obviously accumulated in the coal (Figure 14a). In order to reflect the resource abundance of different zones, we normalized the hydrocarbon saturation. It can be seen that, except for the deep sag zone, the hydrocarbon abundance of the other zones is high and has mainly accumulated in reservoirs, especially in the central anticline zone (Figure 14b). In recent years of exploration, oil and gas have also been found in the TG-6 well in the northern slope zone and the YT-1 well in the deep sag zone, but there is no oil and gas reservoir available for exploitation. A large-scale gas field was found in the TD-2 well area of the central anticline zone.

5.3. Prediction of Oil and Gas Accumulation

The southern slope zone and the deep sag zone were buried quite shallowly before the Paleogene, and the source rocks were still in the immature-to-lower-mature stage during the Paleogene. It was not until the Neogene that the source rocks began to generate hydrocarbons. In addition, there may be only a small number of lithologic reservoirs because of a lack of favorable preservation conditions. The effective superposition of excellent reservoir and thick gypsum–salt cap rock makes the central anticline zone a favorable site for oil and gas accumulation. After the hydrocarbon generation of northern area source rocks, oil and gas migrated to anticline traps in the central anticline zone along sandstone translocation layers and faults. The recent discovery of the Tudong-2 gas field in the central anticline zone is a good example. In addition, the hydrocarbon saturation in the source rocks accounts for 44.87% of the total (Figure 14a), which also indicates that the eastern Kuqa Depression has great exploration potential.

6. Conclusions

(1)
Thermal anomalies are caused by extrusion thrust, the plastic deformation of gypsum–salt rock, and rapid deposition or erosion in the Kuqa Depression, all of which have had a significant influence on the heat flow and source rock maturity evolution history of the area. Numerous thrust faults have developed in the northern slope zone, where source rock maturity is the highest. Affected by rapid and deep burial, the source rocks in the southern slope zone and the deep sag zone became mature. The presence of a thick gypsum–salt rock layer with high thermal conductivity facilitated the fast heat transfer of the underlying strata, thus retarding the hydrocarbon generation process of the source rocks, which is conducive to oil and gas accumulation in the late stage.
(2)
A new understanding of the hydrocarbon generation and thermal evolution of the source rocks in the eastern Kuqa Depression has been obtained, mainly by simulating the thermal evolution history of the compressional structural section through the TD-2 well. The source rocks in the northern slope zone became mature in the early stage, but their maturation stagnated in the later stage as a result of extrusion and uplift. The source rocks in the central anticline zone, the southern slope zone, and the deep sag zone were at low maturation levels during the period between the Jurassic and Paleogene and reached a mature-to-highly mature stage after the deposition of the N1j and N1_2k formations. The main hydrocarbon generation periods in the eastern Kuqa Depression are the late Neogene and Quaternary, and the main hydrocarbon generation stratum is the J1y formation. The cumulative hydrocarbon generation of mudstone has been significantly greater than that of carbonaceous mudstone and coal before the deposition of the N2k formation, but the cumulative hydrocarbon generation of coal is the largest at present.
(3)
Hydrocarbon saturation in the reservoir of the Paleogene, Cretaceous, J1y formation, and J1a formation accounts for 55.13% of the total, and the other hydrocarbons have accumulated in the source rocks, especially mudstone in the deep sag zone and coal in the northern slope zone. Except for the deep sag zone, the hydrocarbon abundance of the other zones is high, and it has mainly accumulated in the reservoirs, especially in the central anticline zone. In the southern slope zone and the deep sag area, where the tectonic activity is weak, the stratum formation is horizontal; there are no major developed structural traps apart from a small number of lithologic oil and gas reservoirs. In the central anticline zone, the effective superposition of an excellent reservoir and thick gypsum–salt cap rock makes the area a favorable site for oil and gas accumulation. After hydrocarbon generation in the northern slope area source rocks, oil and gas migrated to anticline traps along sandstone transport layers and faults. This is confirmed by the recent Tudong-2 gas field discovery in the central anticline zone. Our model may provide further exploration of fault-related traps in the northern part of the northern slope zone.

Author Contributions

Methodology—J.L.; software—J.L. and Y.L.; resources—W.Y.; Writing—original draft—K.J.; writing—review and editing—K.J., J.L. and K.L.; project administration—X.Y.; funding acquisition—L.Z. (Liang Zhang) and L.Z. (Lu Zhou). All authors have read and agreed to the published version of the manuscript.

Funding

This research was funded by the China–Saudi Arabia Petroleum Energy ‘Belt and Road’ Joint Laboratory Construction and Research (2022YFE0203400); the Major Science and Technology Project of PetroChina, Grant No. ZD2019-183-01-04; and the National Natural Science Foundation of China, Grant No. 92055204 and 42372127.

Institutional Review Board Statement

Not applicable.

Informed Consent Statement

Not applicable.

Data Availability Statement

The data presented in this study are available on request from the corresponding author. The data are not publicly available due to privacy.

Conflicts of Interest

Author Wenfang Yuan, Xianzhang Yang, Liang Zhang and Lu Zhou were employed by the PetroChina Tarim Oilfield Company. The remaining authors declare that the research was conducted in the absence of any commercial or financial relationships that could be construed as a potential conflict of interest.

References

  1. Tian, J.; Wang, Q.H.; Yang, H.J.; Li, Y. Petroleum exploration history and enlightenment in Tarim Basin. Xinjiang Pet. Geol. 2021, 42, 272–282, (In Chinese with English Abstract). [Google Scholar]
  2. Wang, K.; Xiao, A.C.; Cao, T.; Zhang, R.H.; Wei, H.X.; Yu, C.F. Geological structures and petroleum exploration fields of the northern tectonic belt in the Kuqa depression, Tarim basin. Acta Geol. Sin. 2022, 96, 368–386, (In Chinese with English Abstract). [Google Scholar]
  3. Fan, S.; Lu, Y.H.; Li, L.; Wei, H.; Zhang, H.F.; Shen, L. Geochemical characteristics, distribution and petroleum geological significance of Triassic-Jurassic source rocks in the Tugeerming and surrounding area of Kuqa Depression, Tarim Basin. Nat. Gas Geosci. 2022, 33, 2074–2086, (In Chinese with English Abstract). [Google Scholar]
  4. Liu, J.L.; Jiang, Z.X.; Liu, K.Y.; Gui, L.L.; Xing, J.Y. Hydrocarbon sources and charge history in the Southern Slope Region, Kuqa Foreland Basin, northwestern China. Mar. Pet. Geol. 2016, 74, 26–46. [Google Scholar] [CrossRef]
  5. Liu, K.Y.; Liu, J.L. Current status and future development trends of basin and petroleum system modeling (BPSM). Pet. Sci. Bull. 2017, 2, 161–175, (In Chinese with English Abstract). [Google Scholar]
  6. Liu, Y.; Li, X.Q.; Zhao, G.J.; Liu, M.C.; Dong, C.Y.; Li, J.; Xiao, Z.Y. Geochemical characteristics of natural gas and hydrocarbon charging history of the Tugeerming area in the eastern Kuqa Depression. Geoscience 2022, 36, 988–991, (In Chinese with English Abstract). [Google Scholar]
  7. Jiang, Z.X.; Li, F.; Yang, H.J.; Li, Z.; Liu, L.F.; Chen, L.; Du, Z.M. Development characteristics of fractures in Jurassic tight reservoir in DiBei area of Kuqa Depression and its reservoir-controlling mode. Acta Petrol. Sin. 2015, 36, 102–111, (In Chinese with English Abstract). [Google Scholar]
  8. Zhang, B.S.; Yang, H.J.; Zhang, N.; Zhao, Q. Hydrocarbon Inclusion Characteristics of Jurassic Ahe Formation Ahe Formation and Analysis on Petroleum Accumulation in Dibei Gas Reservoir of Kuqa Depression. Xinjiang Pet. Geol. 2019, 40, 41–47, (In Chinese with English Abstract). [Google Scholar]
  9. Lu, X.S.; Song, Y.; Zhao, M.J.; Li, Y.; Zhuo, Q.G.; Wang, Y. Thermal history modeling of complicated extrusional section and source rock maturation characteristics in Kuqa foreland basin. Nat. Gas Geosci. 2014, 25, 1547–1557, (In Chinese with English Abstract). [Google Scholar]
  10. Hantschel, T.; Kauerauf, A.I. Fundamentals of Basin and Petroleum Systems Modeling; Springer: Dordrecht, The Netherlands; Heidelberg, Germany; London, UK; New York, NY, USA, 2009; 476p. [Google Scholar]
  11. Graham, S.A.; Hendrix, M.S.; Wang, L.B.; Carroll, A.R. Collisional successor basins of western China: Impact of tectonic inheritance on sand composition. Geol. Soc. Am. Bull. 1993, 105, 323–344. [Google Scholar] [CrossRef]
  12. Liu, J.L.; Yang, X.Z.; Liu, K.Y.; Xu, Z.P.; Jia, K.; Zhou, L.; Wei, H.X.; Zhang, L.; Wu, S.J.; Wei, X.Z. Differential hydrocarbon generation and evolution of typical terrestrial gas-prone source rocks: An example from the Kuqa foreland basin, NW China. Mar. Pet. Geol. 2023, 152, 106225. [Google Scholar] [CrossRef]
  13. He, D.F.; Zhou, X.Y.; Yang, H.J.; Lei, G.L.; Ma, Y.J. Geological structure and its controls on Giant oil and gas fields in Kuqa Depression, Tarim Basin: A Clue from new shot seismic data. Geotecton. Metallog. 2009, 33, 19–32, (In Chinese with English Abstract). [Google Scholar]
  14. Zhang, H.L.; Zhang, R.H.; Yang, H.J.; Yao, G.S.; Ma, Y.J. Quantitative evaluation methods and applications of tectonic fracture developed sand reservoir: A Cretaceous example from Kuqa foreland basin. Acta Petrol. Sin. 2012, 28, 827–835, (In Chinese with English Abstract). [Google Scholar]
  15. Zhang, L.Q.; Yan, Y.M.; Luo, X.R.; Wang, Z.B.; Zhang, H.Z. Diagenetic differences of tight sandstone of the Lower Jurassic Ahe Formation in the Yiqikelike Area of the Kuqa Depression, Tarim Basin. Earth Sci. Front. 2018, 25, 170–178, (In Chinese with English Abstract). [Google Scholar]
  16. Liu, L.W.; Sun, X.W.; Zhao, Y.J.; Jin, J.N. Hydrocarbon Distribution and Accumulation Mechanism of Dibei Tight Sandstone Gas Reservoir in Kuqa Depression, Tarim Basin. Xinjiang Pet. Geol. 2016, 37, 257–261, (In Chinese with English Abstract). [Google Scholar]
  17. Zhang, R.H.; Yang, H.J.; Wei, H.X.; Yu, C.F.; Yang, Z.; Wu, J. The sandstone characteristics and hydrocarbon exploration signification of Lower Jurassic in middle east section of northern tectonic belt in Kuqa Depression, Tarim Basin. Nat. Gas Geosci. 2019, 30, 1243–1252, (In Chinese with English Abstract). [Google Scholar]
  18. Wei, G.Q.; Zhang, R.H.; Zhi, F.Q.; Wang, K.; Yu, C.F.; Dong, C.Y. Formation conditions and exploration directions of Mesozoic structural-lithologic stratigraphic reservoirs in the eastern Kuqa Depression. Acta Petrol. Sin. 2021, 42, 1113–1125, (In Chinese with English Abstract). [Google Scholar]
  19. Liu, C.; Chen, S.J.; Zhao, J.L.; Chen, G.; Gao, Q. Hydrocarbon transportation system and accumulation simulation of Mesozoic-Cenozoic in south slope of Kuqa foreland basin. Nat. Gas Geosci. 2021, 32, 1450–1462, (In Chinese with English Abstract). [Google Scholar]
  20. Gong, L.; Cheng, Y.Q.; Gao, S.; Gao, Z.Y.; Feng, J.R.; Wang, H.T.; Su, X.C.; Lu, Q.; Wang, J. Fracture connectivity characterization and its controlling factors in lower Jurassic tight sandstone reservoirs of eastern Kuqa foreland basin. Earth Sci. 2023, 48, 2475–2488, (In Chinese with English Abstract). [Google Scholar]
  21. Wang, K.; Yang, H.J.; Li, Y.; Zhang, R.H.; Ma, Y.J.; Wang, B.; Yu, C.F.; Yang, Z.; Tang, Y.G. Geological characteristics and exploration potential of the northern tectonic belt of Kuqa Depression in Tarim Basin. Acta Petrol. Sin. 2021, 42, 885–905, (In Chinese with English Abstract). [Google Scholar]
  22. Wang, K.; Zhang, R.H.; Yu, C.F.; Yang, Z.; Tang, Y.G.; Wei, H.X. Characteristics and controlling factors of Jurassic Ahe reservoir of the northern tectonic belt, Kuqa Depression, Tarim Basin. Nat. Gas Geosci. 2020, 31, 623–635, (In Chinese with English Abstract). [Google Scholar]
  23. Liu, C.Y. The reproduction of paleo-structure and the establish of equilibrium profile for extension structure area. Exp. Pet. Geol. 1988, 1, 33–43, (In Chinese with English Abstract). [Google Scholar]
  24. Li, F.J. Application software to compile balanced section process and its application. Chem. Enterp. Manag. 2017, 8, 41–42. [Google Scholar]
  25. Yakovlev, F.; Gaidzik, K.; Voytenko, V.; Frolova, N. Balanced cross-section restoration in a complicated folded hinterland structure: Shilbilisaj profile, Talas ridge, Caledonian Tien Shan. Terra Nova 2023, 35, 1–14. [Google Scholar] [CrossRef]
  26. Duan, Y.J.; Huang, S.Y.; Luo, C.M.; Zhu, T.; Zhang, H.F.; Wang, Z.H.; Lou, H.; Yang, G.; Zhou, S.Y.; Wang, C. Discussion on balance restoration of salt structure deformation and related problems in Kuqa Depression, Tarim Basin. Nat. Gas Geosci. 2023, 34, 780–793. [Google Scholar]
  27. Edman, J.D.; Surdam, R.C. Influence of overthrusting on maturation of hydrocarbons in Phosphoria formation, Wyoming-Idaho-Utah overthrust belt. AAPG Bull. 1984, 68, 1803–1817. [Google Scholar]
  28. Deming, D.; Chapman, D.S. Thermal histories and hydrocarbon generation: Example from Utah-Wyoming thrust belt. AAPG Bull. 1989, 73, 1455–1471. [Google Scholar]
  29. Deming, D. Catastrophic release of heat and fluid flow in the continental crust. Geology 1992, 20, 83–86. [Google Scholar] [CrossRef]
  30. Wang, L.S.; Li, C.; Liu, S.W.; Li, H.; Xu, M.J.; Yu, D.Y.; Jia, C.Z.; Wei, G.Q. Terrestrial heat flow distribution in Kuqa foreland basin, Tarim, NW China. Petrol. Explor. Dev. 2005, 26, 113–124. [Google Scholar]
  31. Yang, K.J.; Xu, L.W.; Qi, J.F.; He, P.; Du, J.M.; Sun, T. Structural deformation of the Northern Monocline belt in the Kuqa Depression and implications for the Cenozoic uplift history of the South Tianshan Mountains. Tectonophysics 2023, 857, 229840. [Google Scholar] [CrossRef]
  32. Zhang, G.F.; Ma, Y.J.; Han, W.; Luo, J.H. Provenance analysis of the early-middle Jurassic deposits in eastern Kuqa depression in the Tarim Basin, Xinjiang. Sediment. Geol. Tethyan. Geol. 2011, 31, 39–46. [Google Scholar]
  33. Xu, X.B.; Wang, C.Y.; Liu, C.M.; Lin, S.G.; Li, D.J.; Gao, Z.Y. Provenance characteristics of upper Triassic-middle Jurassic in the eastern Kuqa Depression of Tarim basin, China and their geological significance. J. Earch Sci. Environ. 2020, 42, 172–187. [Google Scholar]
Figure 1. Location maps of (a) the Tarim Basin and (b) the Kuqa Depression. (c) Distribution of the four structural zones and (d) a present section through the TD-2 well from north to south in the eastern Kuqa Depression. YT-1 (P) and TG-6 (P) refer to the projection position of the YT-1 well and TG-6 well in this section. DSZ = deep sag zone, SSZ = southern slope zone, CAZ = central anticline zone, NSZ = northern slope zone, Q = Quaternary, N2k = Kuqa formation, N1_2k = Kangcun formation, N1j = Jidike formation, E = Paleogene, K = Cretaceous, J2kz = Kezilenuer formation, J1y = Yangxia formation, J1a = Ahe formation, T3h = Huangshanjie formation, T3t = Taliqike formation, T2_3k = Kelamayi formation, Pt = Proterozoic, C = Carboniferous, O = Ordovician, Є = Cambrian.
Applsci 14 01217 g001
Figure 2. Major geological processes in basin modeling (after Hantschel and Kauerauf, 2009 [10]).
Applsci 14 01217 g002
Figure 3. Block subdivisions (numbered) in the present AA’ section of the eastern Kuqa Depression.
Applsci 14 01217 g003
Figure 4. Structural deformation characteristics and evolution of the section through the TD-2 well from north to south in the eastern Kuqa Depression (see Figure 1 for section position). J = Jurassic; T = Triassic.
Applsci 14 01217 g004
Figure 5. Modeled burial history and thermal evolution of three wells in the eastern Kuqa Depression. (a,b) YT-1 well, (c,d) TD-2 well, and (e,f) TG-6 well (see Figure 1c for locations). Graphs at right show that the modeled temperature and Ro values fit the measured data closely. Q1x = Xiyu formation, E1_2km = Kumugeliemu formation, K1y = Yageliemu formation. The temperature and Ro value data are from the PetroChina Tarim Oilfield Company.
Applsci 14 01217 g005
Figure 6. The bottom temperature modeling result for the J1a formation in the YT-1, TD-2, and TG-6 wells.
Applsci 14 01217 g006
Figure 7. Maturity evolution of the AA’ section in the eastern Kuqa Depression.
Applsci 14 01217 g007
Figure 8. Hydrocarbon generation of the AA’ section at different geological times in the eastern Kuqa Depression; the thickness of the model perpendicular to the section direction is fixed at 1 km.
Applsci 14 01217 g008
Figure 9. Hydrocarbon generation in the AA’ section at different geological times in the eastern Kuqa Depression. The histogram is formed by the ratio of hydrocarbon generation at different times to that of the whole historical period.
Applsci 14 01217 g009
Figure 10. Hydrocarbon generation of the AA’ section at different zones in the eastern Kuqa Depression. The histogram is formed by the ratio of the hydrocarbon generation of different zones in a certain period to the total hydrocarbon generation amount in the same period; 100% represents the total hydrocarbon generation in a certain geological period.
Applsci 14 01217 g010
Figure 11. Hydrocarbon generation of three sets of source rocks at different geological times in the eastern Kuqa Depression. The histogram is formed by the ratio of the hydrocarbon generation of different source rocks in a certain period to the total hydrocarbon generation amount in the same period; 100% represents the total hydrocarbon generation in a certain geological period.
Applsci 14 01217 g011
Figure 12. Hydrocarbon generation of different lithologic source rocks at different geological times in the eastern Kuqa Depression. The histogram is formed by the cumulative hydrocarbon generation of different lithologic source rocks.
Applsci 14 01217 g012
Figure 13. Hydrocarbon migration conduits and accumulation saturation of the AA’ section at different geological times in the eastern Kuqa Depression.
Applsci 14 01217 g013
Figure 14. Hydrocarbon accumulation saturation of the reservoir and the different lithologic source rocks in different zones of the AA’ section at present in the eastern Kuqa Depression. (a) The histogram is formed by the ratio of the saturation of the reservoir and the different lithologic source rocks to the total saturation; (b) the histogram is composed of normalized saturation ratios.
Applsci 14 01217 g014
Table 1. General input parameters used for basin modeling. TOC = total organic carbon, HI = hydrogen index, C-mudstone = carbonaceous mudstone.
FormationDeposition AgeErosion/HiatusLithologyPetroleum System ElementTOC
(%)
HI
(mg HC/g TOC)
Kinetics
From
(Ma)
To
(Ma)
From
(Ma)
To
(Ma)
Q1.80 Conglomerate (Typical)Overburden rock
N2k5.3331.8Sandstone, Siltstone, ShaleOverburden rock
N1_2k125.3 Siltstone, ShaleOverburden rock
N1j23.0312 Shale, Siltstone, GypsumSeal rock
E66343423.03Conglomerate, SandstoneReservoir rock
K14513013066Sandstone, SiltstoneReservoir rock
J2kz158145 Shale (Typical)Seal rock
170158 Shale (Organic-Rich, Typical)Source rock3200Mudstone [12]
J1y175.5170 Coal (Pure)Source rock55250Coal [12]
178175.5 Sandstone (Typical)Reservoir rock
178.5178 Coal (Pure), Shale (Typical)Source rock20200C-mudstone [12]
182178.5 Conglomerate, SandstoneReservoir rock
188182 Shale (Organic-Rich, Typical)Source rock3200Mudstone [12]
J1a201.3188 Conglomerate, SandstoneReservoir rock
T203.5201.3 Shale (Organic-Rich, Typical)Source rock3200Mudstone [12]
210203.5 Conglomerate, Sandstone, ShaleUnderburden rock
Disclaimer/Publisher’s Note: The statements, opinions and data contained in all publications are solely those of the individual author(s) and contributor(s) and not of MDPI and/or the editor(s). MDPI and/or the editor(s) disclaim responsibility for any injury to people or property resulting from any ideas, methods, instructions or products referred to in the content.

