Article

Transferability Assessment of OBD-Related Calibration and Validation Activities from the Vehicle to HiL Applications

1
Chair of Thermodynamics of Mobile Energy Conversion Systems, 52074 Aachen, Germany
2
FEV Europe GmbH, 52078 Aachen, Germany
*
Author to whom correspondence should be addressed.
Appl. Sci. 2024, 14(3), 1245; https://doi.org/10.3390/app14031245
Submission received: 16 January 2024 / Revised: 29 January 2024 / Accepted: 30 January 2024 / Published: 2 February 2024

Abstract

:
With the Euro 7 pollutant emission legislation currently under discussion, advanced and more efficient exhaust aftertreatment systems are being developed. The technologies required for these are leading to an increase in the number of components and control systems requiring diagnoses strategies under the on-board diagnostics (OBD) legislation. With concurrent shorter development times and significant reductions in budgets allocated to conventional powertrain development, challenges in the field of OBD calibration and verification are already rising sharply. In response to these challenges, hardware-in-the-loop (HiL) approaches have been successfully introduced to support and replace conventional development methods. The use of complex simulation models significantly improves the quality of calibrations while minimizing the number of required prototype vehicles and test resources, thus reducing development costs. This paper presents a feasibility study for moving OBD-related calibration and validation tasks from the vehicle to a HiL platform. In this context, the calibration and verification process of an active diagnostic for monitoring the condition of the three-way catalyst (TWC) and the oxygen sensors in the exhaust aftertreatment system is presented. It is shown that all relevant signals are simulated with sufficient accuracy to ensure a robust transfer from the vehicle to a HiL test bench. Special attention is given to the simulation of aged components and their influence on the emission behavior of the system. Furthermore, it is discussed that transferring OBD tasks from the vehicle to the HiL test bench could result in significant savings in development time and a reduction in the number of physical prototype vehicles and test resources required.

1. Introduction

1.1. Motivation

Lower emission standards and new test protocols such as those for the Worldwide harmonized Light vehicles Test Procedure (WLTP) and Real Driving Emissions (RDE) have increased the challenges for Original Equipment Manufacturers (OEMs) and suppliers to develop advanced and more efficient exhaust gas aftertreatment systems [1,2,3]. With Euro 7 legislation under discussion, these challenges will continue to increase [4,5].
Considering EU6d, additional hardware and their respective control functionalities, such as gasoline particulate filters (GPF), already have been introduced [6,7,8,9,10,11,12]. Additionally, advanced methods are being developed to ensure emission robustness and compliance up to the full useful life of the exhaust aftertreatment system (EATS) [6,13]. State of the art strategies ensuring RDE compliance have also been developed to cope with the broad and comprehensive test matrix required to effectively cover all possible RDE scenarios [14,15,16,17]. Hence, the ultimate goal is the zero impact emission vehicle, such as investigated by Maurer et al. and Boger et al. [1,18].
To comply with Euro 7 emission targets, both internal and external engine measures are being considered. For example, second-generation GPFs with higher filtration efficiencies as well as engine operation with a stoichiometric air-fuel ratio (λ = 1) in the entire engine map are two examples of modern measures being used [19,20,21]. Also, the installation of additional components into the exhaust aftertreatment system is an option. For example, electrically heated catalysts, hydrocarbon (HC) absorbers and secondary air systems are currently further developed, which require new operating strategies as well [22,23].
The technologies associated with advanced aftertreatment systems, as well as the introduction of hybrid powertrain technologies, translate into a substantially larger number of components and control systems to be diagnosed under on-board diagnosis (OBD) legislation. On one hand, the number of diagnosis concepts are becoming more and more comprehensive; on the other hand, the calibration and validation efforts are increasing notably with increased and more elaborate test scopes. With the current conventional calibration methodology, this necessitates an increased need for additional prototype vehicles and chassis dynamometer time.
In the context of Road-to-Rig-to-Desktop approaches [24,25,26], this paper presents a feasibility study for transferring OBD-related calibration and validation tasks from the vehicle to a Hardware-in-the-Loop (HiL) platform. The next subchapter describes the methodology and the requirements to enable HiL-based OBD engineering tasks during powertrain development. The second chapter introduces the reference vehicle, the main engine and the exhaust aftertreatment specifications. It also introduces the specifications of the closed-loop HiL platform, including a brief introduction of the real-time powertrain models. To demonstrate the performance of the HiL platform, the subsequent chapter discusses the case example of the active diagnosis for monitoring the status of the three-way catalyst (TWC) and the oxygen sensors in the exhaust gas aftertreatment system. Finally, the presented approach is discussed with regard to its advantages in terms of project time and required resources.

1.2. HiL-Based Virtual Calibration and Validation

The majority of the current HiL systems focus on functional hardware and software testing [27,28]. The main aim of the investigations and analyses presented in this work is to broaden this conventional scope with the incorporation of virtual engine control unit (ECU) calibration. This is achieved by the extension of a conventional HiL platform to a closed-loop system simulation of the complete powertrain, as already described in several studies. A considerable number of HiL-based virtual calibration applications for light-duty vehicles in the field of diesel emission calibration have already been presented by Lee et al. [29,30,31,32] and Picerno et al. [33]. HiL-based applications for heavy-duty diesel engines are discussed by Riccio et al. [34]. For petrol engines, initial studies on HiL and driving cycle-based emission calibration have already been carried out by Dorscheidt et al. [35], Dorfer [36] and Xia et al. [37]. A study on HiL-based driveability calibration and validation was conducted by Schmidt et al. [38].
A closed-loop HiL system allows coupling of various control units—e.g., the ECU and Transmission Control Unit (TCU)—with real-time capable models for the simulation of a complete powertrain. Due to stringent real-time requirements of the respective powertrain models [39], the trade-off between model accuracy and computing time needs to be carefully balanced [40]. This is especially challenging when modelling complex physical phenomena, such as engine raw emissions and emission conversion mechanisms inside a TWC. Real-time simulation approaches for modelling these mechanisms and their application for HiL-based virtual calibration are currently being researched. Schmidgal [41] and Dorscheidt et al. [42] published approaches for the real-time simulation of engine-out emissions from a gasoline engine based on neural networks, whereby Dorscheidt achieved a relative deviation of <5% for all EU6d-relevant emissions components in WLTC operation. Picerno et al. developed a real-time simulation approach for engine-out emissions from a diesel engine, taking into consideration the detailed chemistry of the emission formation [43]. Real-time capable simulation models for the exhaust gas aftertreatment system are presented, for example, by Schürholz [44,45] (KNN-based approach) and Odendall [46] and Auckenthaler [47] (control-oriented models).
To reap the efficiency benefits associated with HiL-based virtualization, it is essential to accompany the powertrain development process with a seamless integration of virtual processes. Dorscheidt et al. [35] divide the HiL support during the powertrain development process into two major phases: While “HiL stage #1” facilitates support of calibration tasks in the scope of base calibration at the engine dynamometer test bench (as, e.g., described by Gottdorf [48]), “HiL stage #2” enables drive cycle-based calibration including tailored emission simulation for the target powertrain [35,49]. The feasibility study presented in this paper is carried out during “HiL stage #2”. To enable HiL stage #2, a real ECU with a high maturity dataset regarding its base calibration, as well as a prototype vehicle for validation purposes, should be available. In addition, a significant amount of steady-state and dynamic measurement data should be on hand for parameterization of the respective dynamic emission and TWC models.

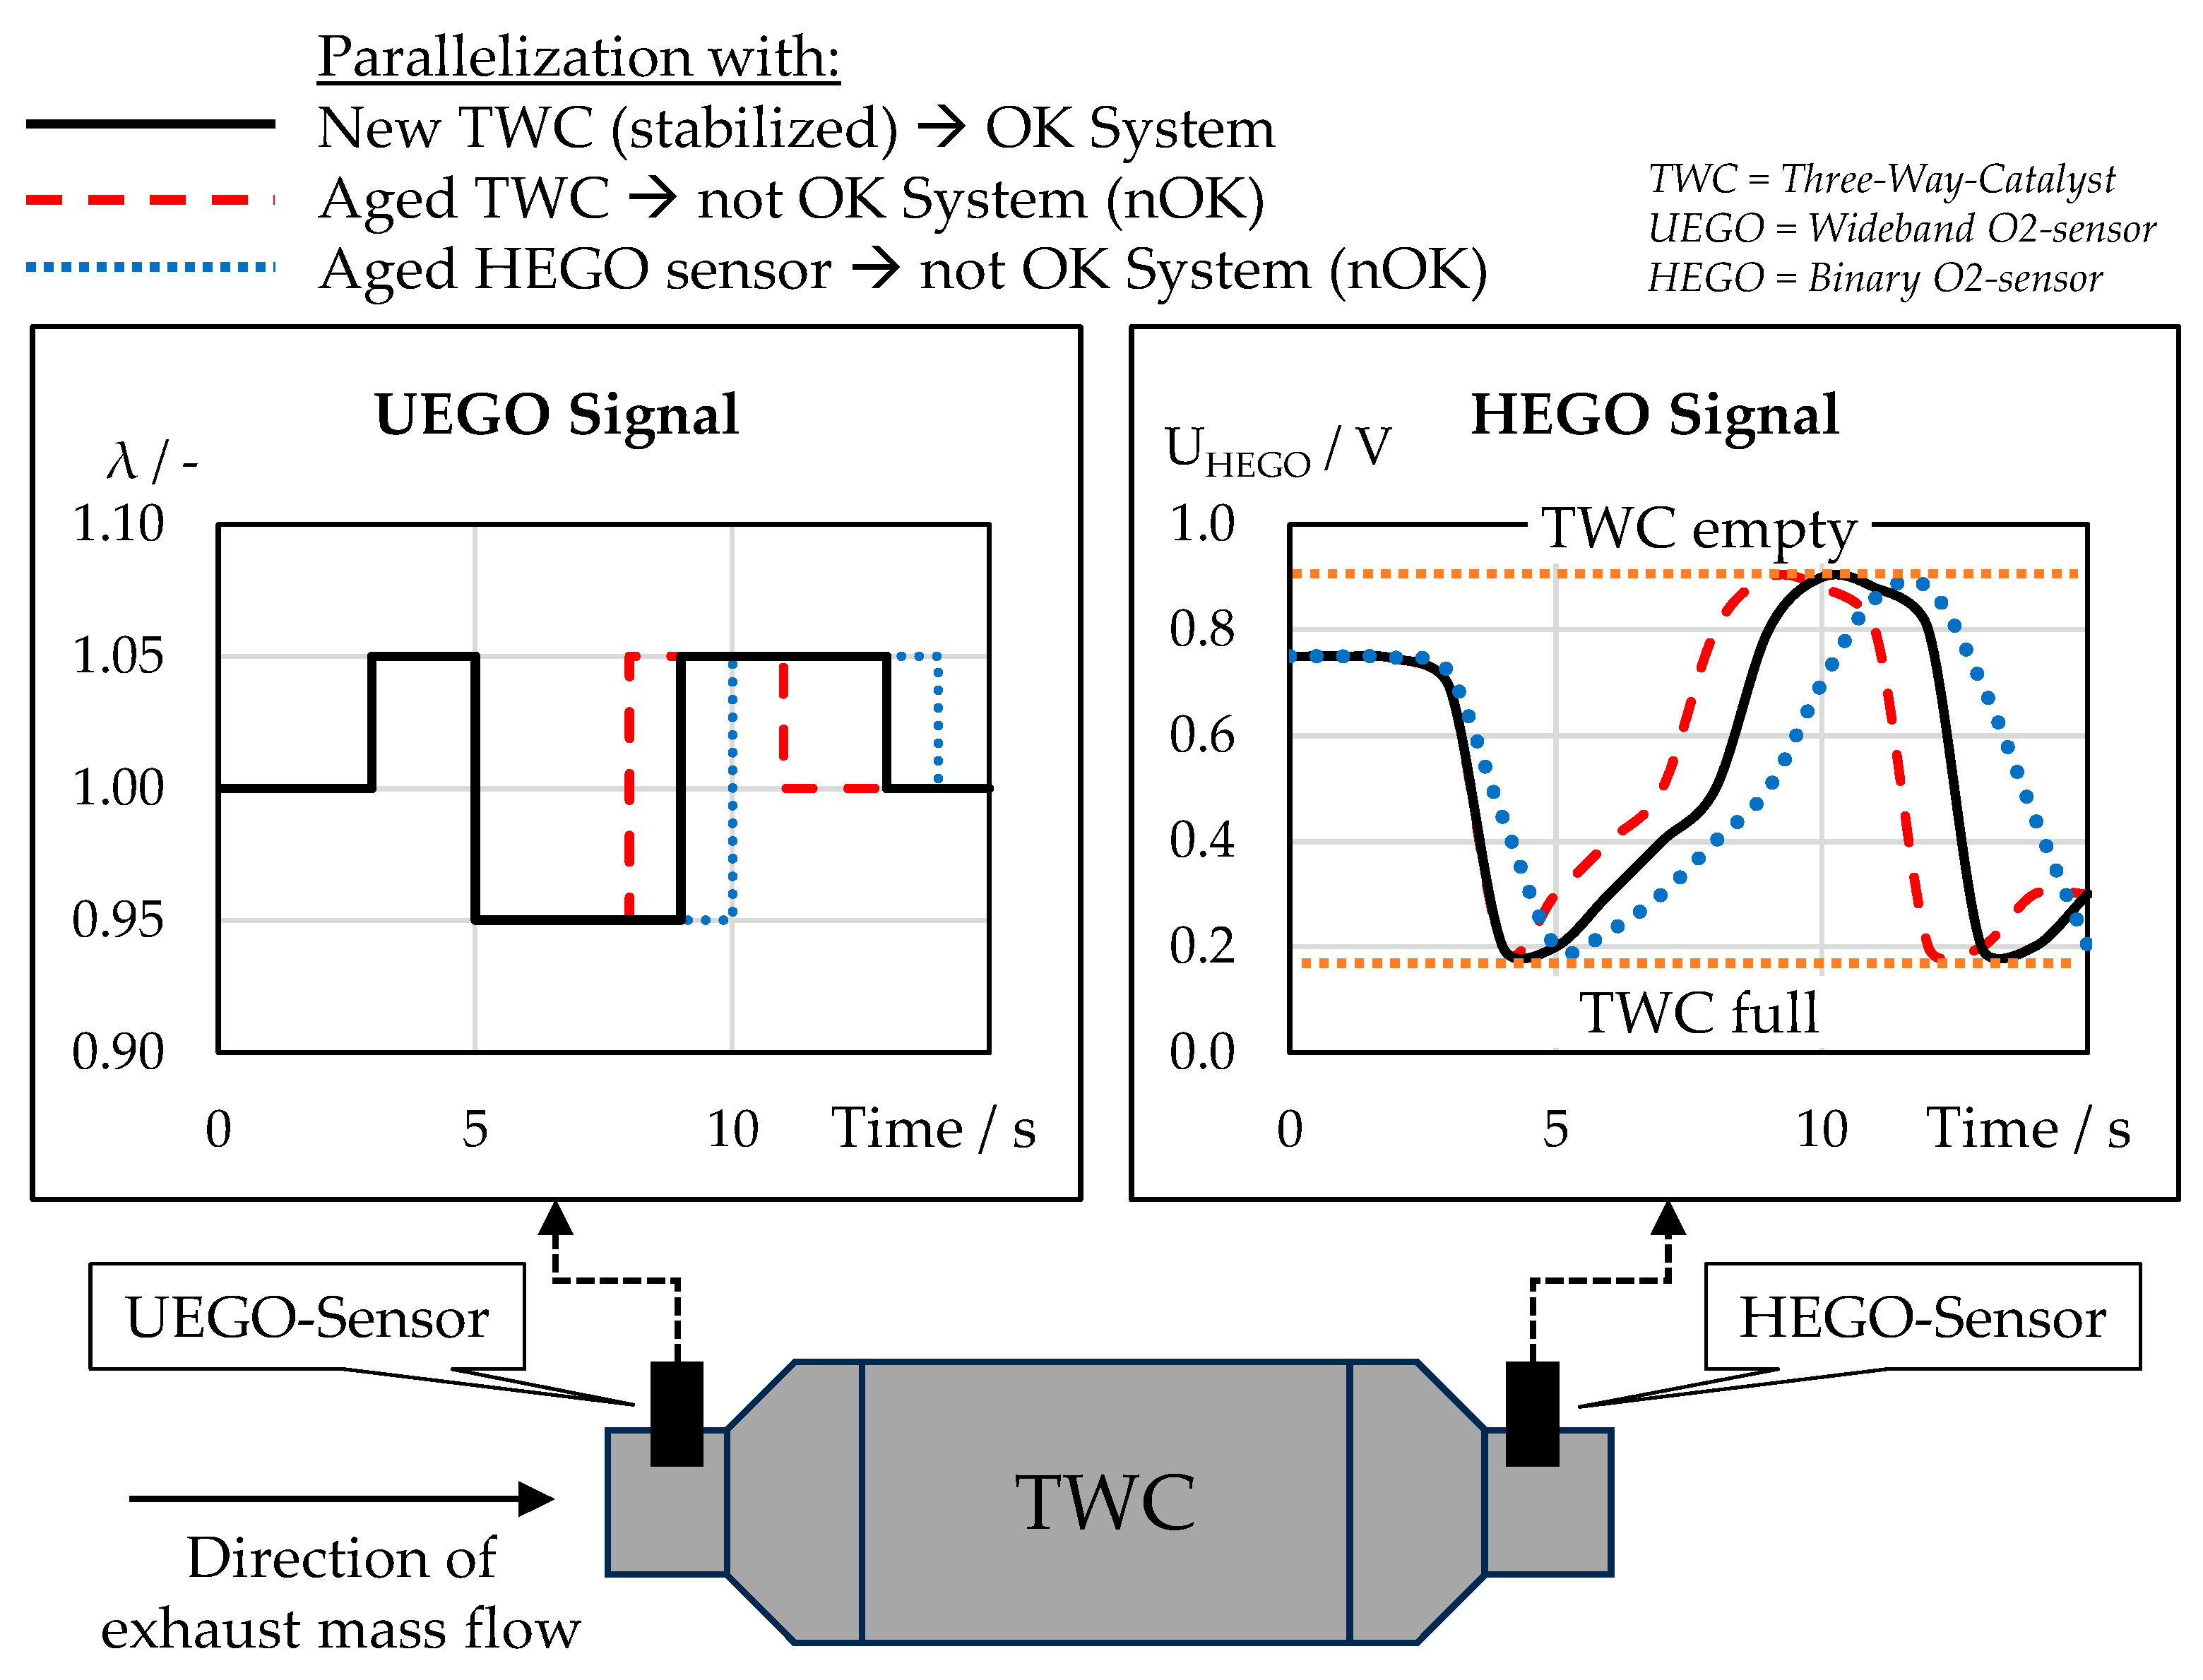
1.3. Case Example—Technical Fundamentals

In order to evaluate the transferability of OBD engineering tasks from a vehicle to a HiL platform, this study presents a case example that includes the diagnoses for monitoring the status of the TWC and the oxygen sensor downstream TWC (Heated Exhaust Gas Oxygen-sensor, HEGO) in the EATS.
The diagnoses of the corresponding components take place during an active rich/lean adjustment of the fuel-air mixture that is triggered by the ECU. Due to the active adjustment of the air-fuel mixture and the subsequent loading and unloading of the oxygen storage of the TWC, the so-called parallelization influences the tailpipe emission results during drive cycle operation. The target of the parallelization is to combine diagnoses that use the same active adjustment of the air-fuel mixture event. With this measure, the total diagnosis time and thus the emission influence is lowered.
The task of the TWC diagnosis is to give a statement about the ageing status and, therefore, the emission conversion capability of the component. This is achieved by determining the oxygen storage capacity (OSC) of the TWC. The OSC is calculated by the ECU according to Equation (1) [50].
O S C = m ˙ E x h · ( λ 1 ) · 0.23 · Δ t
where m ˙ E x h   represents the exhaust gas mass flow, λ the air-fuel ratio upstream TWC and Δ t the time of the lean event of the parallelization. The value 0.23 represents a fixed value for the mass ratio of oxygen in the exhaust gas.
The task of the HEGO sensor diagnosis is to give a statement about the response behavior of the HEGO sensor voltage U H E G O . A dynamically slow HEGO sensor can lead to falsified OSC results and to prolonged rich and lean phases during the parallelization event that is negatively impacting tailpipe emissions. The dynamic behavior, or the so-called latency, of the HEGO sensor voltage τ H E G O , l a t is represented as a PT1 behavior and determined as well as quantified by the ECU using Equation (2). A high latency value corresponds to a slow and, therefore, faulty sensor.
τ H E G O , l a t = Δ t · U H E G O , r e f U H E G O , 1 U H E G O , 2 U H E G O , 1
In Equation (2), U H E G O , r e f represents a fixed reference value indicating the corresponding sensor voltage that determines the start and the end of the transition time check lean-rich (or rich-lean, depending on the case). Furthermore, U H E G O , 1 represents the HEGO voltage at the start of the calculation and U H E G O , 2 the HEGO voltage at the end of the calculation. Δ t is the time between U H E G O , 1 and U H E G O , 2 .
Figure 1 provides an overview of the typical signal profile of the relevant sensor signals for a parallelization event both for so-called OK systems—considering a new catalyst and new oxygen sensors—and so-called not OK (nOK) systems—considering an aged TWC as well as an aged HEGO sensor.
The typical λ -signal profile upstream TWC is displayed in the UEGO (universal exhaust gas oxygen) sensor diagram; the HEGO sensor voltage downstream TWC is displayed in the HEGO sensor diagram.

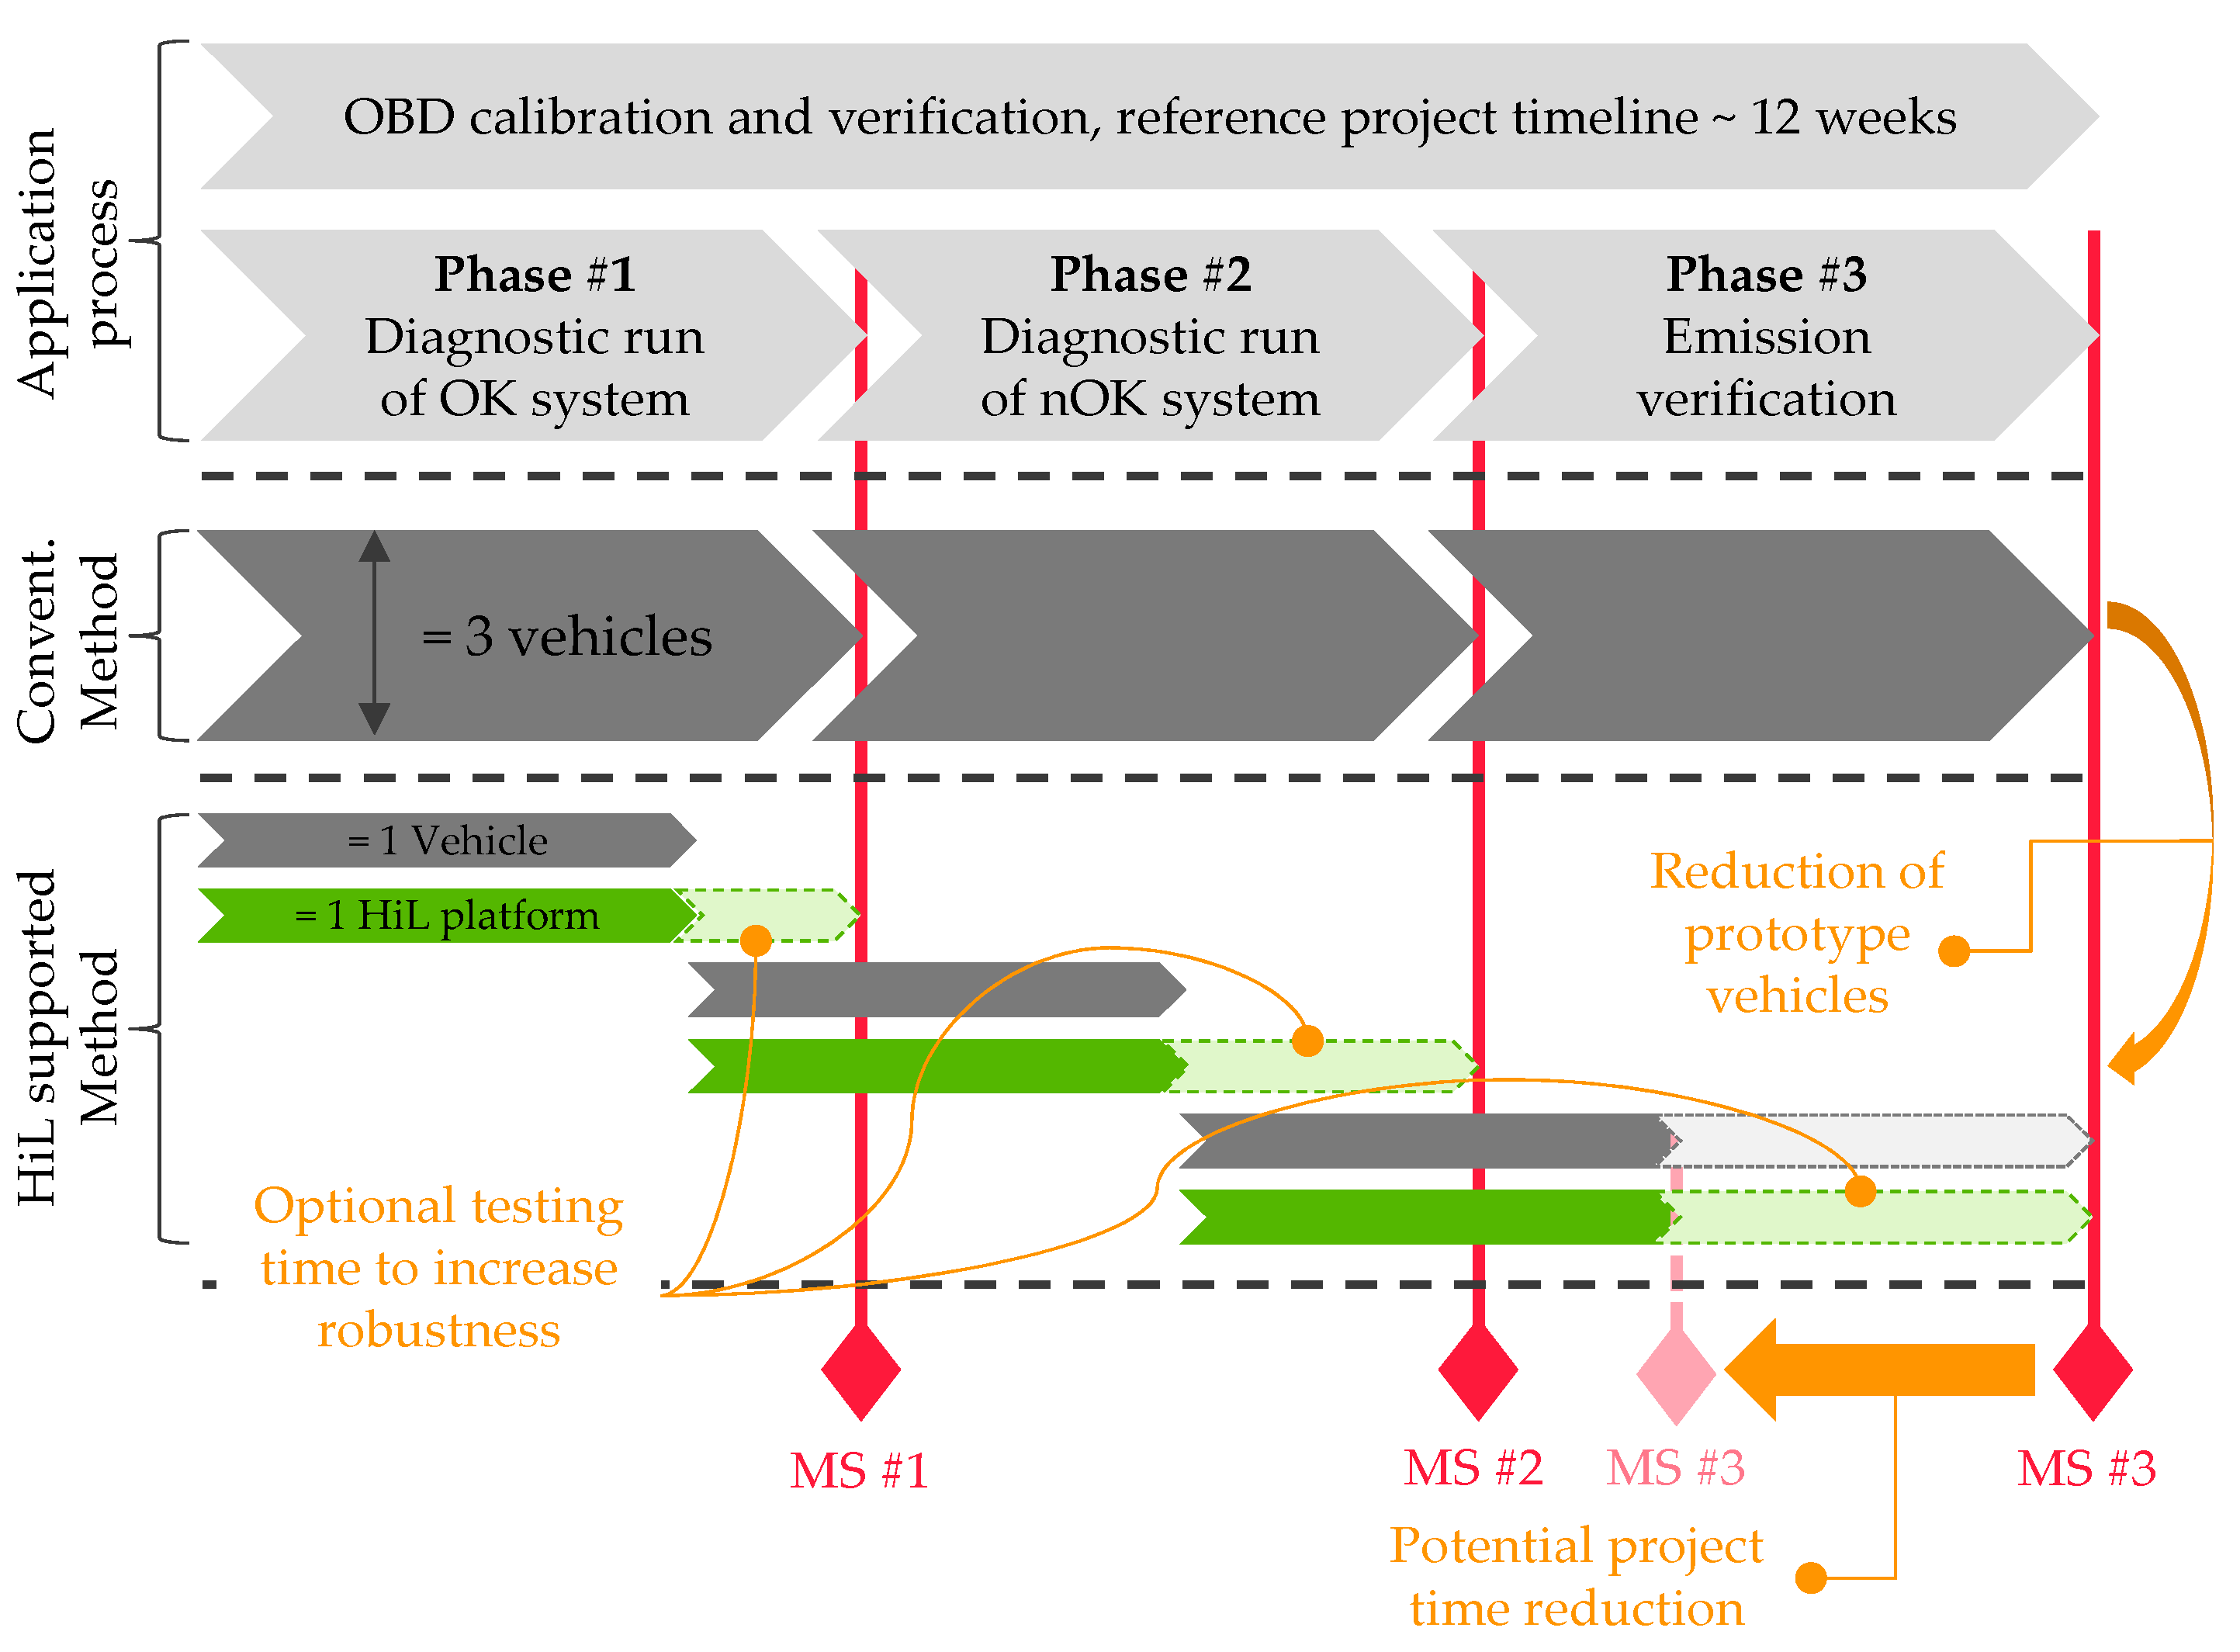
1.4. Reference Project Timeline and Benefits

A typical OBD reference project can be roughly divided into three phases: OK system testing (Phase #1), not OK (nOK) system testing (Phase #2) and final emissions verification (Phase #3). Figure 2 shows a reference project timeline and the required resources for both a conventional and a HiL-based method in a simplified manner.
A conventional full vehicle-based method typically requires about three prototype vehicles per project phase, depending on the respective project constraints. A HiL-based method could offer several potential benefits in terms of project delivery, such as a significant reduction in project time, more efficient use of resources and improved calibration quality and robustness [51,52]. However, in order to realize these potential benefits, sufficiently accurate simulation results must be achieved during each individual project phase using HiL-simulation.
The focus of this study is to show that HiL simulations can provide effective support in every phase of a typical OBD project. To this end, Section 3 “Results” shows that a sophisticated HiL approach can achieve sufficiently accurate results in every relevant project phase.

2. Materials and Methods

2.1. Reference Powertrain and Reference Vehicle

For the present study, a modern gasoline powertrain is used. It is a four-cylinder, direct injection gasoline engine (GDI) with >1.5 L displacement and a twin-scroll turbocharger. The valve train incorporates variable intake and exhaust valve timing and variable intake valve lift. The D-segment vehicle is equipped with an 8-speed automatic transmission and Front Wheel Drive (FWD). The ECU calibration dataset used for this study has an intermediate maturity level. The EATS only includes a TWC with two bricks and a total volume of 1.7 L, which is also the monitoring portion of the TWC. The TWC is located in a close-coupled position. The engine, aftertreatment and vehicle specifications are listed in Table 1, Table 2 and Table 3.

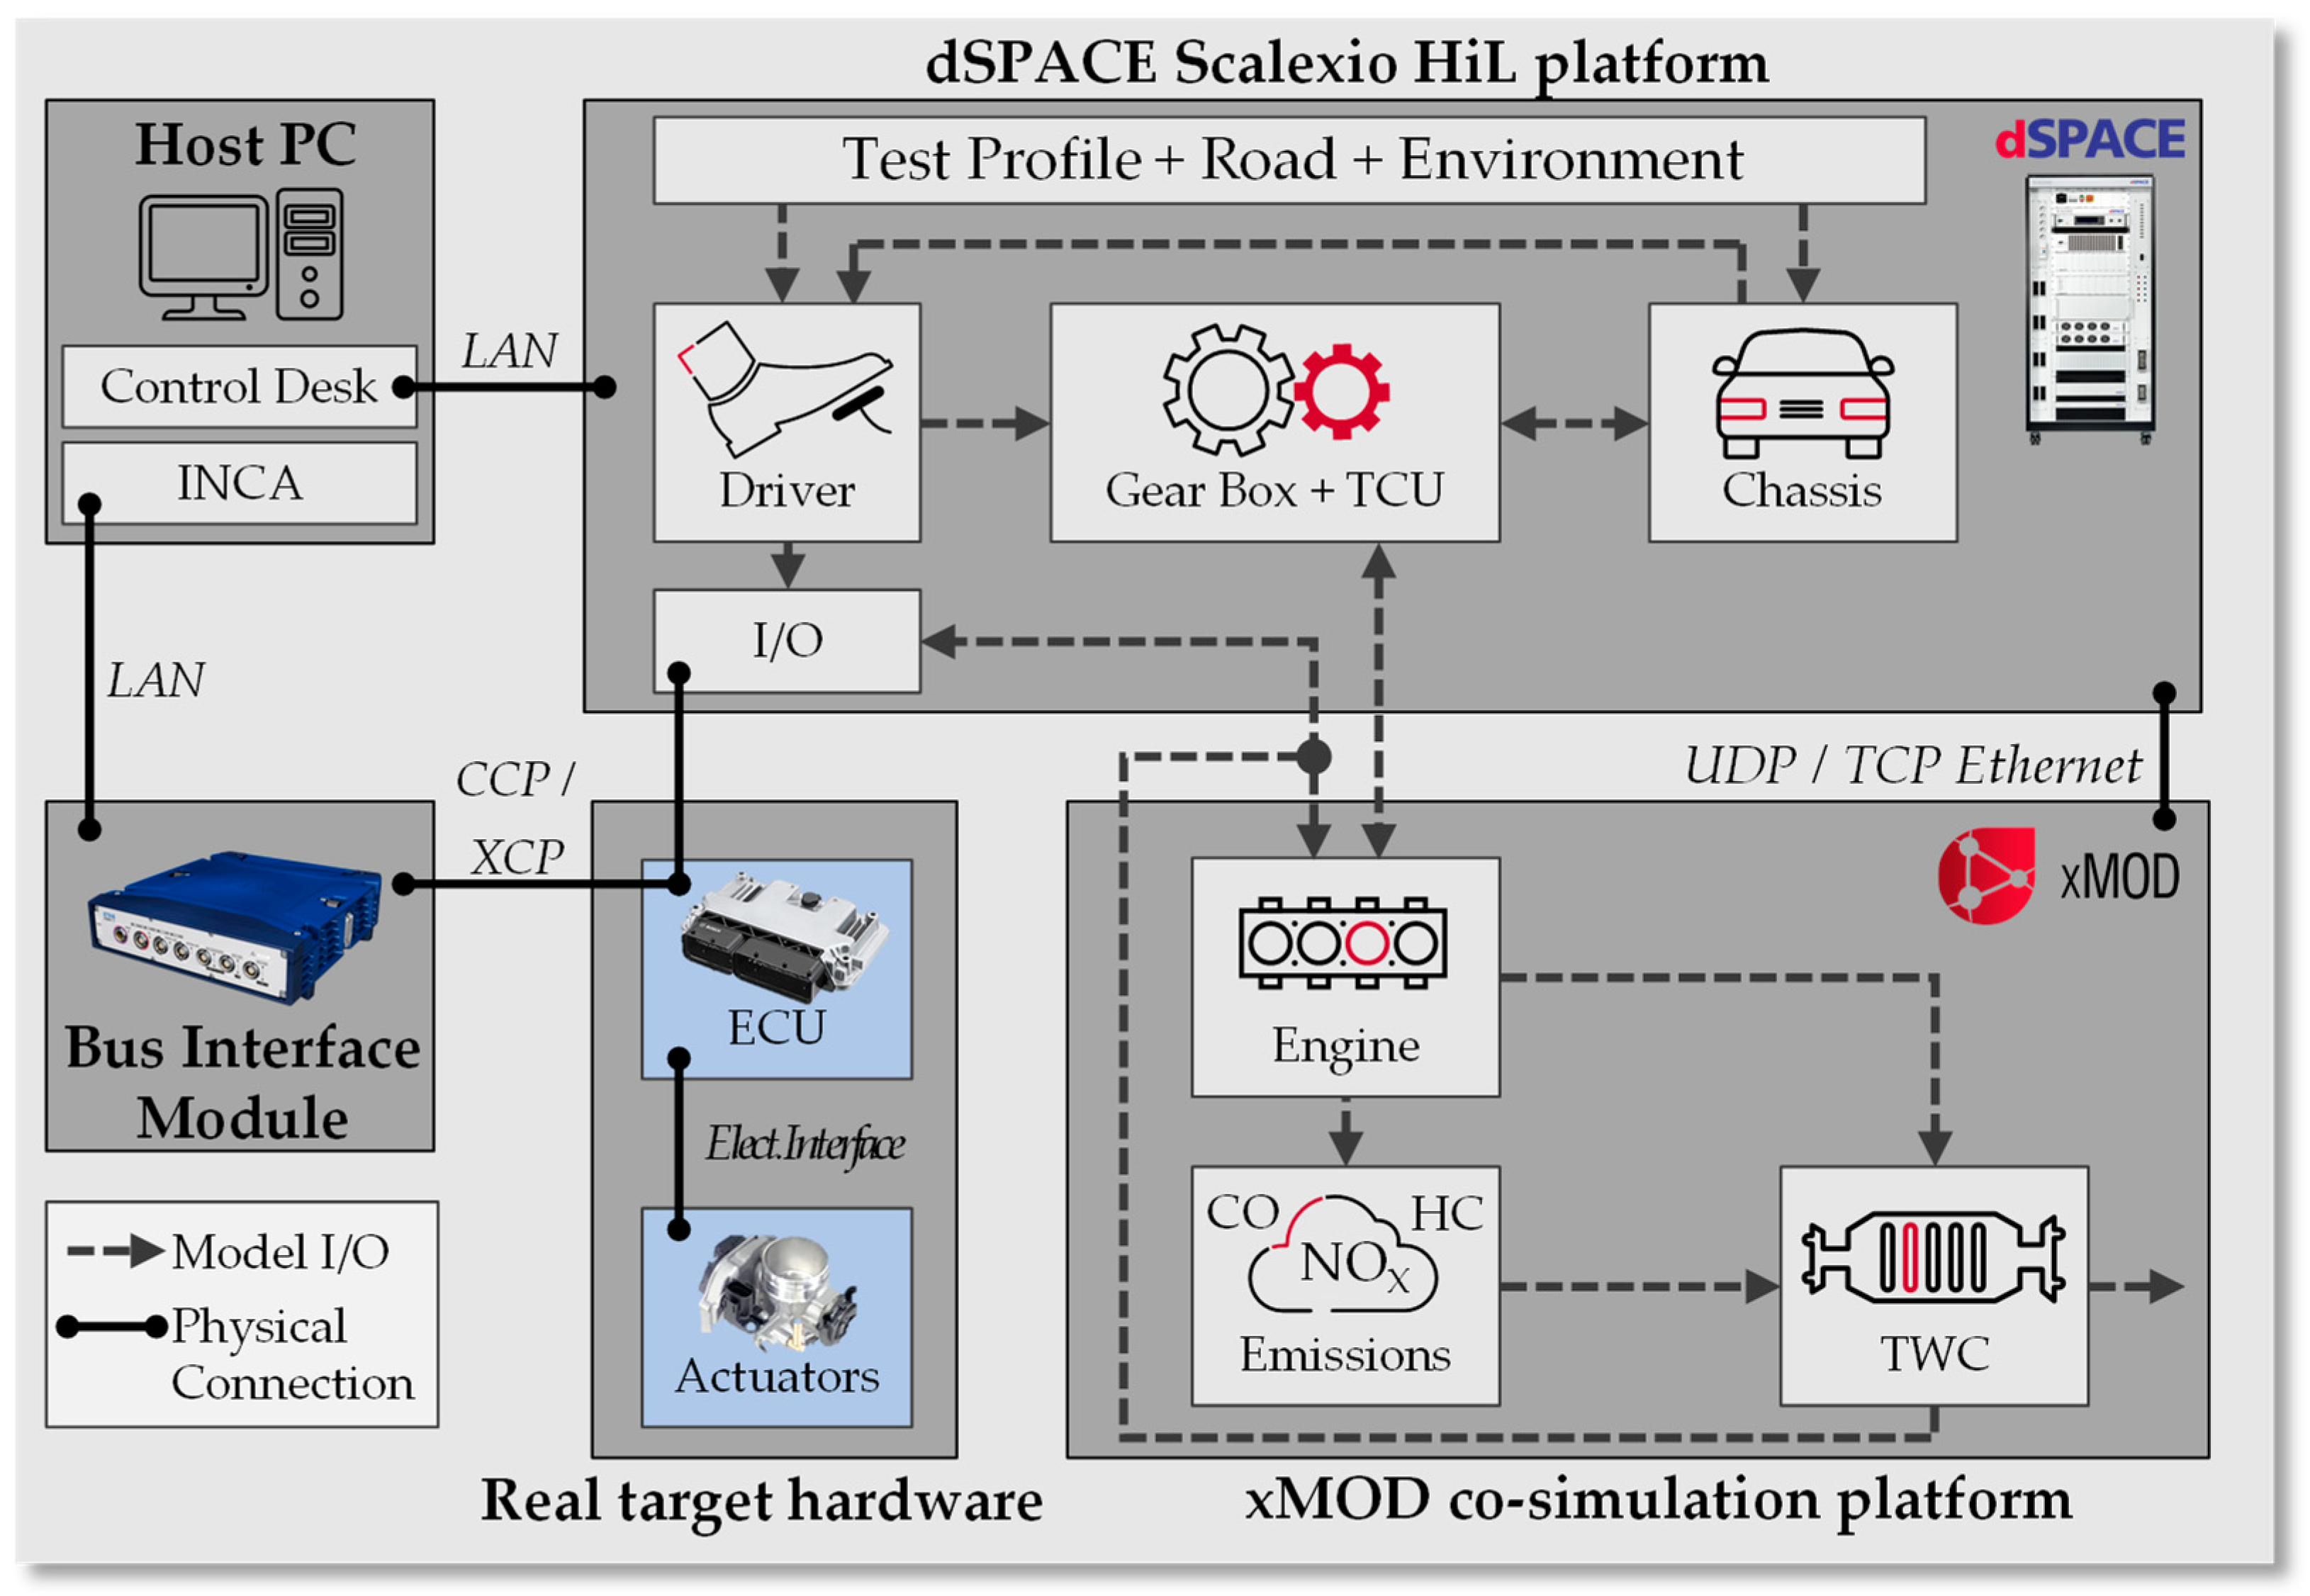
2.2. Real-Time Co-Simulation Platform

A schematic overview of the HiL platform setup process for a conventional powertrain is given in the Appendix A (Figure A1). As emission verification is essential for a comprehensive transfer of OBD calibration and validation tasks from the vehicle to the HiL test bench, a so-called “Level 6” model is required as shown in Figure A1. A “Level 6” model is considered to be a simulation model with the highest degree of fidelity and takes into account, for example, the modelling of physical phenomena, such as engine raw emissions and emission conversion mechanisms inside a TWC, enabling emission, EATS and advanced OBD calibration activities.
The system architecture of the HiL platform used for the investigations in this study is shown in Figure 3. The HiL platform for the presented approach is developed using a co-simulation concept. Regarding this approach, the overall simulation environment comprises two different simulative subsystems: a dSPACE Scalexio HiL including the I/O board and an xMOD high-performance workstation.
The Simulink-based real-time driver, transmissions, chassis and TCU models are executed on the dSPACE platform. The GT-SUITE-based real-time engine model and the Simulink-based emission and TWC models are executed on the xMOD platform. The separation into two distinct subsystems offers advantages in terms of improved computing power and increased flexibility at lower hardware costs. The GT-SUITE-based model used for the co-simulation approach was intensively used during the concept and the layout phase of the respective powertrain and then further refined during the development process with regards to the real-time behavior. These adaptions enable the models to be embedded in a real-time simulation environment, which in turn enables HiL-based virtual calibration.
The majority of the signal exchange between the target hardware and the model environment, required for closed-loop operation, takes place between the crank-angle resolved engine model and the ECU. The GT-based engine model has been developed by Xia, and the methodology and validation results both steady-state and transient were presented in several studies [35,37,53]. The empirical TWC and HEGO sensor models enable the simulation of the voltage of HEGO sensor downstream TWC. The TWC model is considering a map-based approach as already extensively discussed in several studies from Böhmer [54], Balasz et al. [55,56,57] and Morcinkowski [58].The core of the TWC model, responsible for loading and unloading the oxygen storage, is based on a model presented by Brandt et al. [59] with an adaption from Fiengo et al. [60].

3. Results—HiL-Based Calibration and Validation of TWC and HEGO Diagnoses

In order to evaluate the transferability of OBD engineering tasks from a vehicle to a HiL platform, this chapter presents the results of the case example of the diagnoses for monitoring the condition of the TWC and the HEGO sensor. This presentation of the results in this chapter is structured according to individual project phases as presented in Figure 2.
For a holistic assessment, the individual stages of the respective diagnosis, as schematically depicted in Figure 4, should be evaluated separately for Phase #1 and Phase #2 (Figure 1), respectively. For this purpose, the quality of simulation of the signals relevant for the release conditions should be evaluated first (Figure 4a). Secondly, the diagnostic run should be assessed for both an OK system and a nOK system (Figure 4b). Thirdly, it should be shown that the result of the diagnosis is valid for the entire operation range of the respective diagnosis (Figure 4c).

3.1. Phase #1—Diagnostic Run with an OK System

In order to release a diagnosis, two main release conditions must be fulfilled (Figure 4a): Firstly, there must be a release from the diagnostic state manager (DSM), and secondly, all relevant physical release conditions must be fulfilled. The DSM collects all diagnostic results and approves whether a corresponding diagnosis may be run based on all available diagnoses results. In the present example, the following physical release conditions must be fulfilled for an applicable time: The exhaust gas mass flow m ˙ E x h as well as the engine speed n E n g and relative load r l E n g must be within applicable thresholds. The exhaust gas mass flow should also show comparatively constant behavior, and the corresponding exhaust gas mass flow integral m E x h must exceed a certain applicable threshold. Also, the environmental temperature T E n v and pressure p E n v must be within applicable thresholds; furthermore, the vehicle speed v V e h and the engine coolant temperature T C o o l a n t must exceed applicable thresholds. Moreover, the lambda value upstream TWC λ U E G O must meet a certain stability criterion and the TWC temperature T T W C must be in the applicable release window as well as having a reasonably constant and even temperature. In Figure 5, HiL-based measurement results of the digital twin of the vehicle are compared to the ones of a real vehicle measurement on the chassis dynamometer during WLTC (Worldwide Harmonized Light-Duty Test Cycle) operation. In this figure, a selection of the aforementioned release conditions, including the respective applicable thresholds, is presented.
Since the DSM release for the HiL simulation occurs at the same point in the cycle as the vehicle measurement, it can be concluded that no other diagnoses block the parallelization and that the DSM behavior is comparable. Furthermore, the physical measurement signals show good alignment between the vehicle and HiL measurements, resulting in a release of the diagnosis at roughly the same time during the respective drive cycle.
To ensure transferability of OBD engineering tasks from the vehicle to a HiL platform, the diagnostic run on the HiL platform must match all relevant characteristics of the diagnostic run in the vehicle (Figure 4b). In Figure 6 the diagnostic run of the parallelization is shown for a stabilized TWC and an OK HEGO sensor (OK system).
The correct reproduction of the simulated HEGO sensor voltage U H E G O during the parallelization event implies an excellent modelling of the oxygen loading and unloading behavior of the TWC model and the subsequent conversion of the λ-signal downstream TWC into the respective voltage signal, which is necessary as input for the ECU. Furthermore, it can be observed that the applicable switching points for the parallelization (triggering and stopping OSC measurement), which indicate whether the TWC is completely filled or emptied with oxygen, correspond well between the HiL simulation and the vehicle measurement. The exact replication of all these described phenomena are mandatory prerequisites to ensure a safe transfer of respective engineering tasks to a simulation environment.
Besides a solid reproduction of the diagnostic run, it is all-important to have a reproducible diagnostic result of the corresponding diagnosis (Figure 4c) on the HiL platform, both for an OK and a nOK system over the entire relevant operating range of the respective component. Figure 7 shows OSC (a) and HEGO latency (b) results over the complete relevant exhaust gas mass flow range for OK as well as nOK components. In addition, the calibratable failure threshold and the exhaust gas mass flow-related release conditions are depicted in the figure as well.
The OSC results in Figure 7a have been determined during so-called catalyst mappings on the HiL as well as in the vehicle, where each point represents the OSC result of one parallelization event, calculated according to Equation (1). The OSC value infers the diagnostic result of the TWC diagnosis. This parameter is a chemical property of the TWC and is used as an evaluation criterion for its ageing condition. A low OSC value thus correlates to a low conversion efficiency. Owing to this fact, the OSC of the TWC should be monitored during every driving cycle according to OBD legislation. The simulated OSC values in Figure 7a show good agreement with the results from the vehicle measurement over the entire operating range. The correct reproduction of the OSC values suggests an excellent modelling of the oxygen loading and unloading behavior of the TWC over the entire operating range.
Figure 7b shows the HEGO sensor latency results over the complete relevant exhaust gas mass flow range for an OK (non-faulty HEGO sensor) as well as a nOK (faulty HEGO sensor) component. In addition, the calibratable failure threshold and the exhaust gas mass flow-related release conditions are shown in the figure as well. Similar to the OSC results, the HEGO latency results in Figure 7b have been determined during a mapping on the HiL as well in the vehicle, where each point represents the result of one parallelization event. The HEGO latency value implies the diagnostic result of the HEGO sensor latency diagnosis, calculated according to Equation (2). According to OBD legislation, the dynamic behavior of lambda sensor signals should be monitored, as dynamically slow lambda sensors (e.g., HEGO) can lead to falsified results for diagnoses that heavily depend on a reliable sensor signal. The simulated HEGO latency values in Figure 7b show good accordance with the results from the vehicle measurement over the entire operating range.

3.2. Phase #2—Diagnostic Run with an Not OK System

Referring to Figure 4a, the quality of simulation of the signals relevant for the release conditions have already been presented in Figure 5, since for a nOK system they do not differ from an OK system significantly for the considered case example.
For the diagnostic run (Figure 4b), however, the modelling environment should be able to simulate the failure patterns that correspond to the respective diagnoses. In Figure 8, the diagnostic run of the parallelization is shown for an aged TWC. To simulate the failure pattern of an aged TWC, the parametrization of the TWC model is changed accordingly. The oxygen de- and adsorption rates and the respective OSC map are fitted to those of an aged TWC. Also, the system behavior using an aged TWC model is in line with that of a corresponding vehicle measurement.
Figure 9 shows the parallelization for a nOK HEGO sensor. To simulate the failure pattern of a latent HEGO sensor signal in the direction from rich to lean, the HEGO sensor voltage is PT1 filtered on model side (with a time constant of 800 ms) and matches the rich to lean behavior of a nOK HEGO sensor from a vehicle measurement quite well.
Beyond the correct reproduction of the diagnostic run of a nOK system in one engine operating point, Figure 7 shows that the OSC and HEGO latency results for the respective system exhibit reproducible diagnostic results over the entire operating range (ref. Figure 4c). The diagnostic results obtained in the HiL simulation are in the same order of magnitude as those compared to vehicle measurements over the entire operating range.
By simulating the respective fault patterns accordingly, the so-called fault paths in the ECU can be validated. It depends on the legislation, according to which prerequisites a fault is stored in the fault code memory of the ECU and whether the malfunction indicator light (MIL) is activated. Figure 10 shows six consecutive HiL simulations of WLTC driving cycles. Cycles 1–3 are executed with an aged TWC model (nOK system). Cycles 4–6 are executed with a stabilized TWC model (OK system). In cycle 7, only the engine start is executed (stabilized TWC). For the example shown in Figure 10, the MIL is activated when a nOK system is detected for the third time in a row (MIL phase). The status check of the diagnosis changes within one driving cycle as soon as the diagnostic has run through successfully and a diagnostic result is available. After MIL activation, a virtual TWC change is performed, followed by a healing phase of three consecutive WLTC driving cycles. In Figure 10, the healing phase is completed when an OK system is detected three times in succession. Then, the MIL is deactivated at the beginning of the fourth cycle. For this example, MIL activation after three consecutive failure detections and MIL deactivation after three successful healing cycles is according to the respective EU6d legislation. The example described demonstrates the feasibility of enabling fault path testing on a HIL platform, including fault entry (MILing) and fault healing, in compliance with legislation.

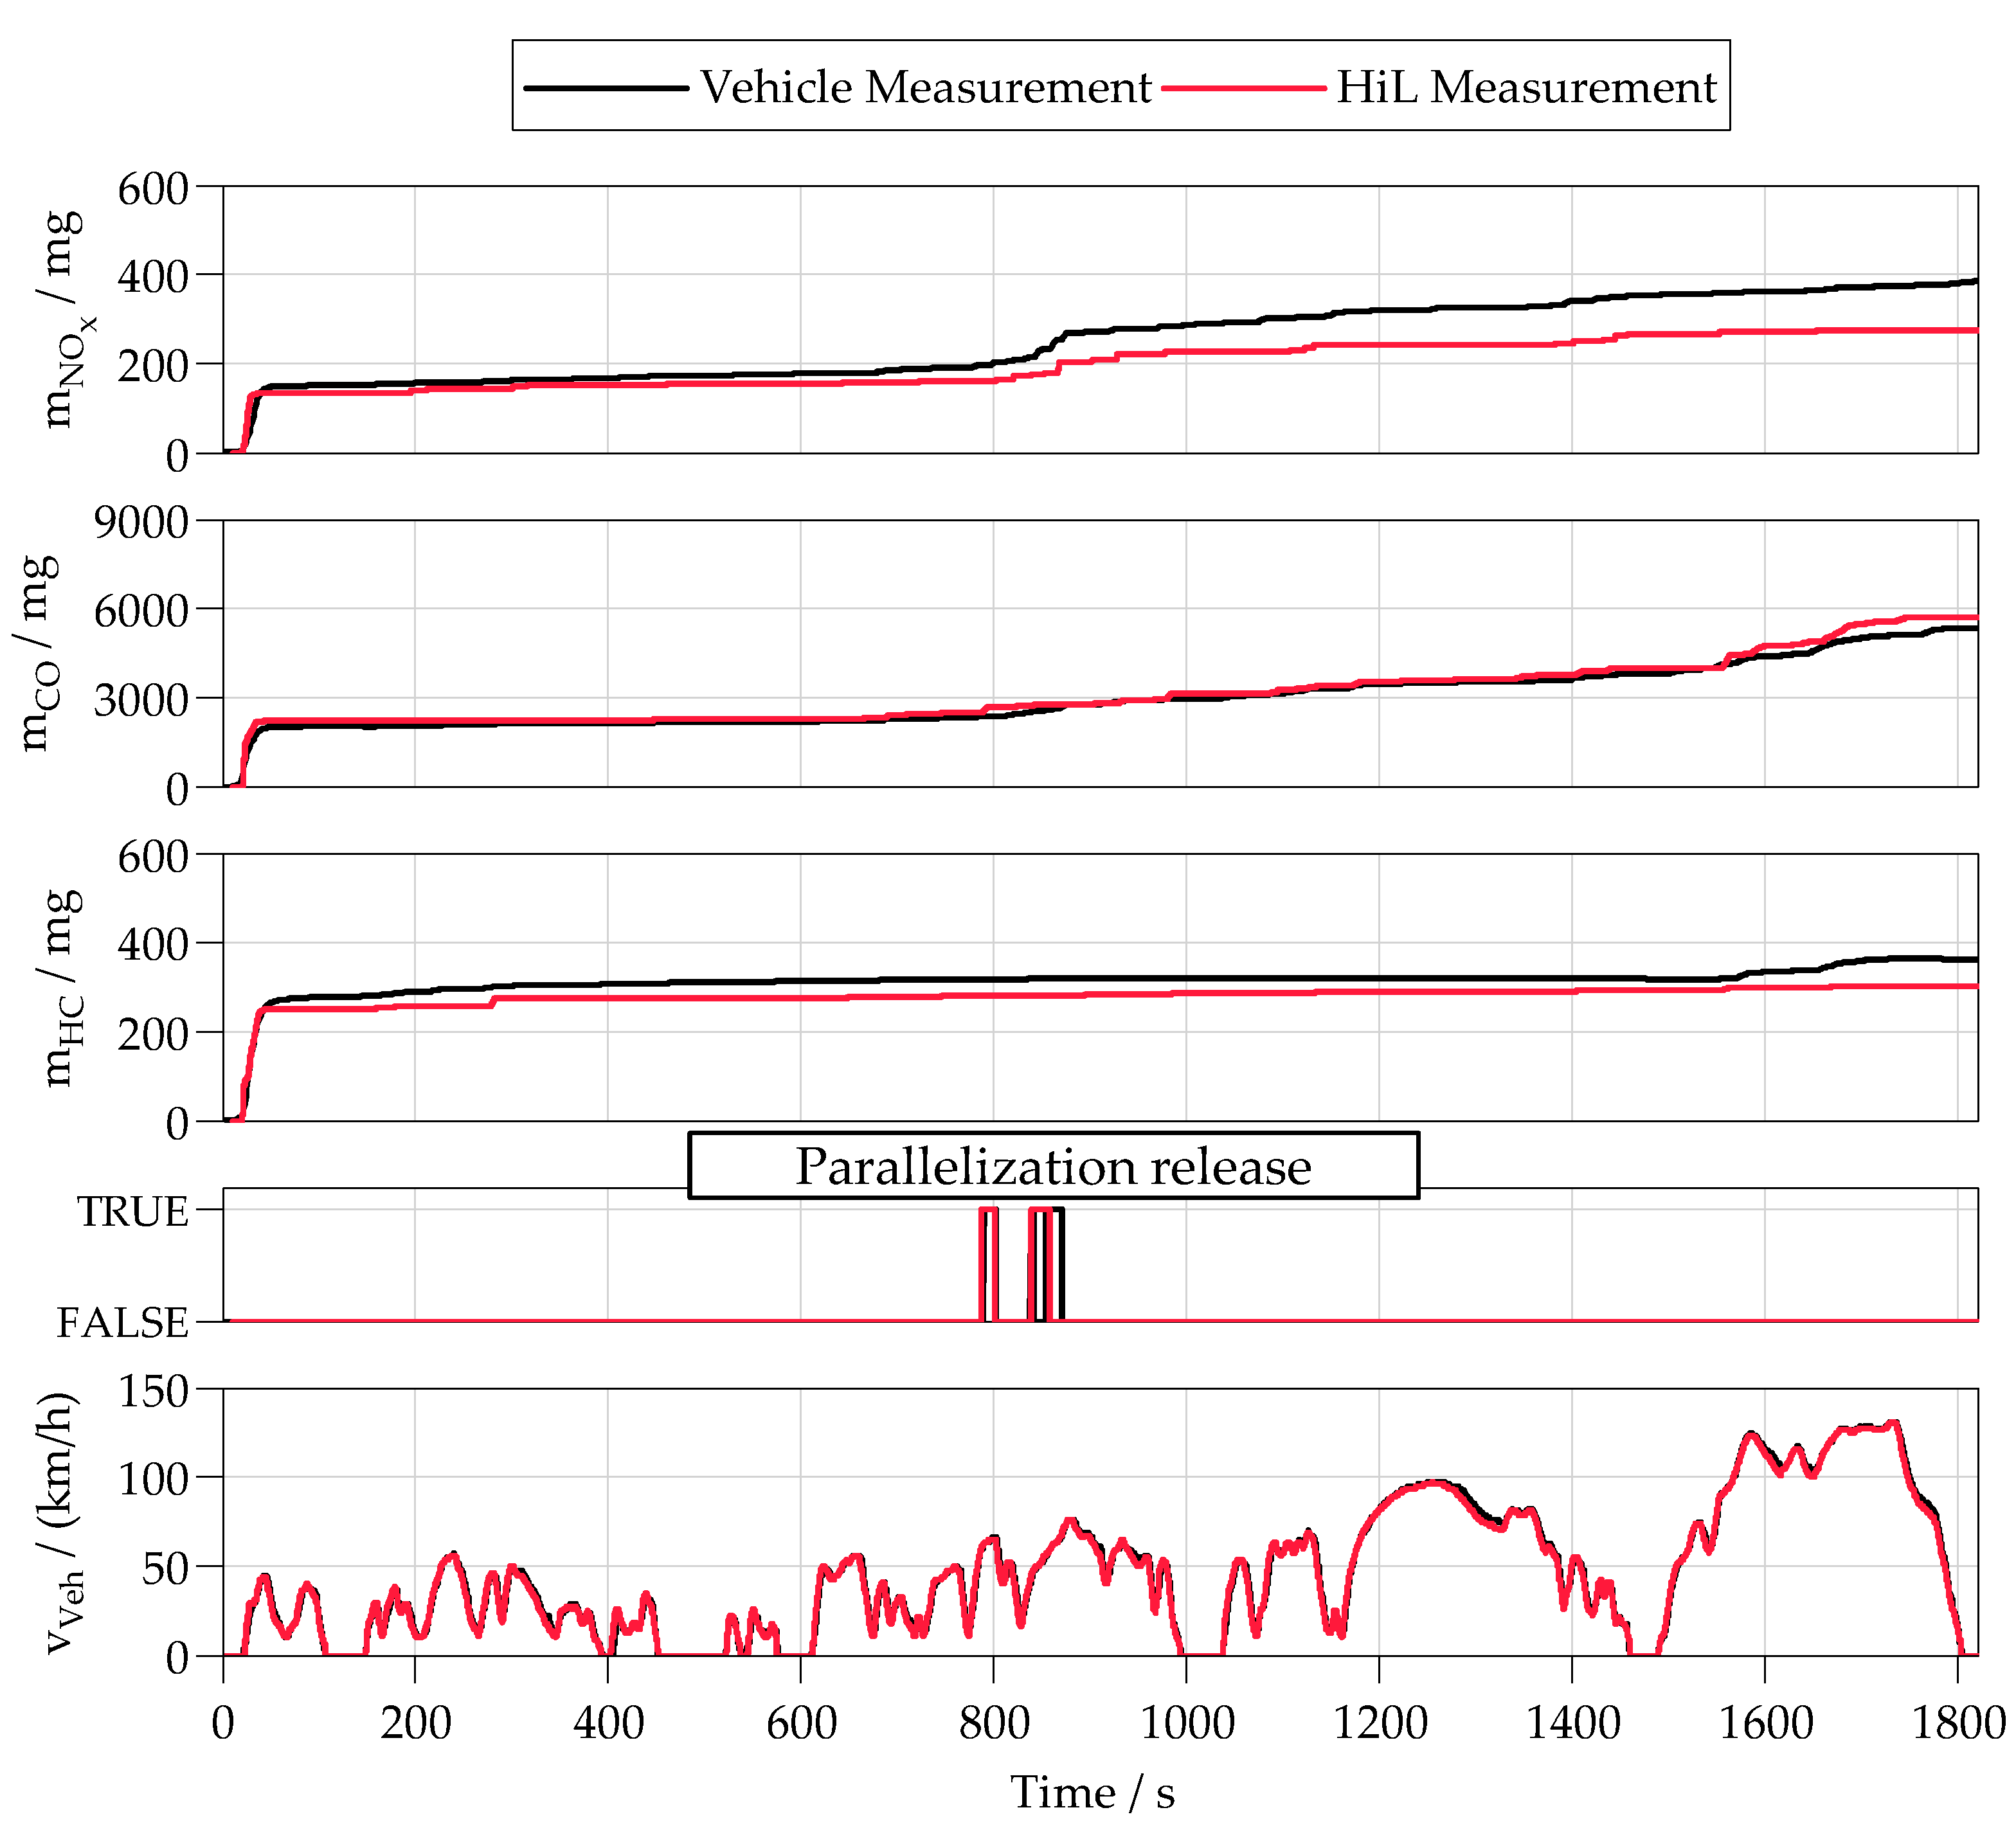
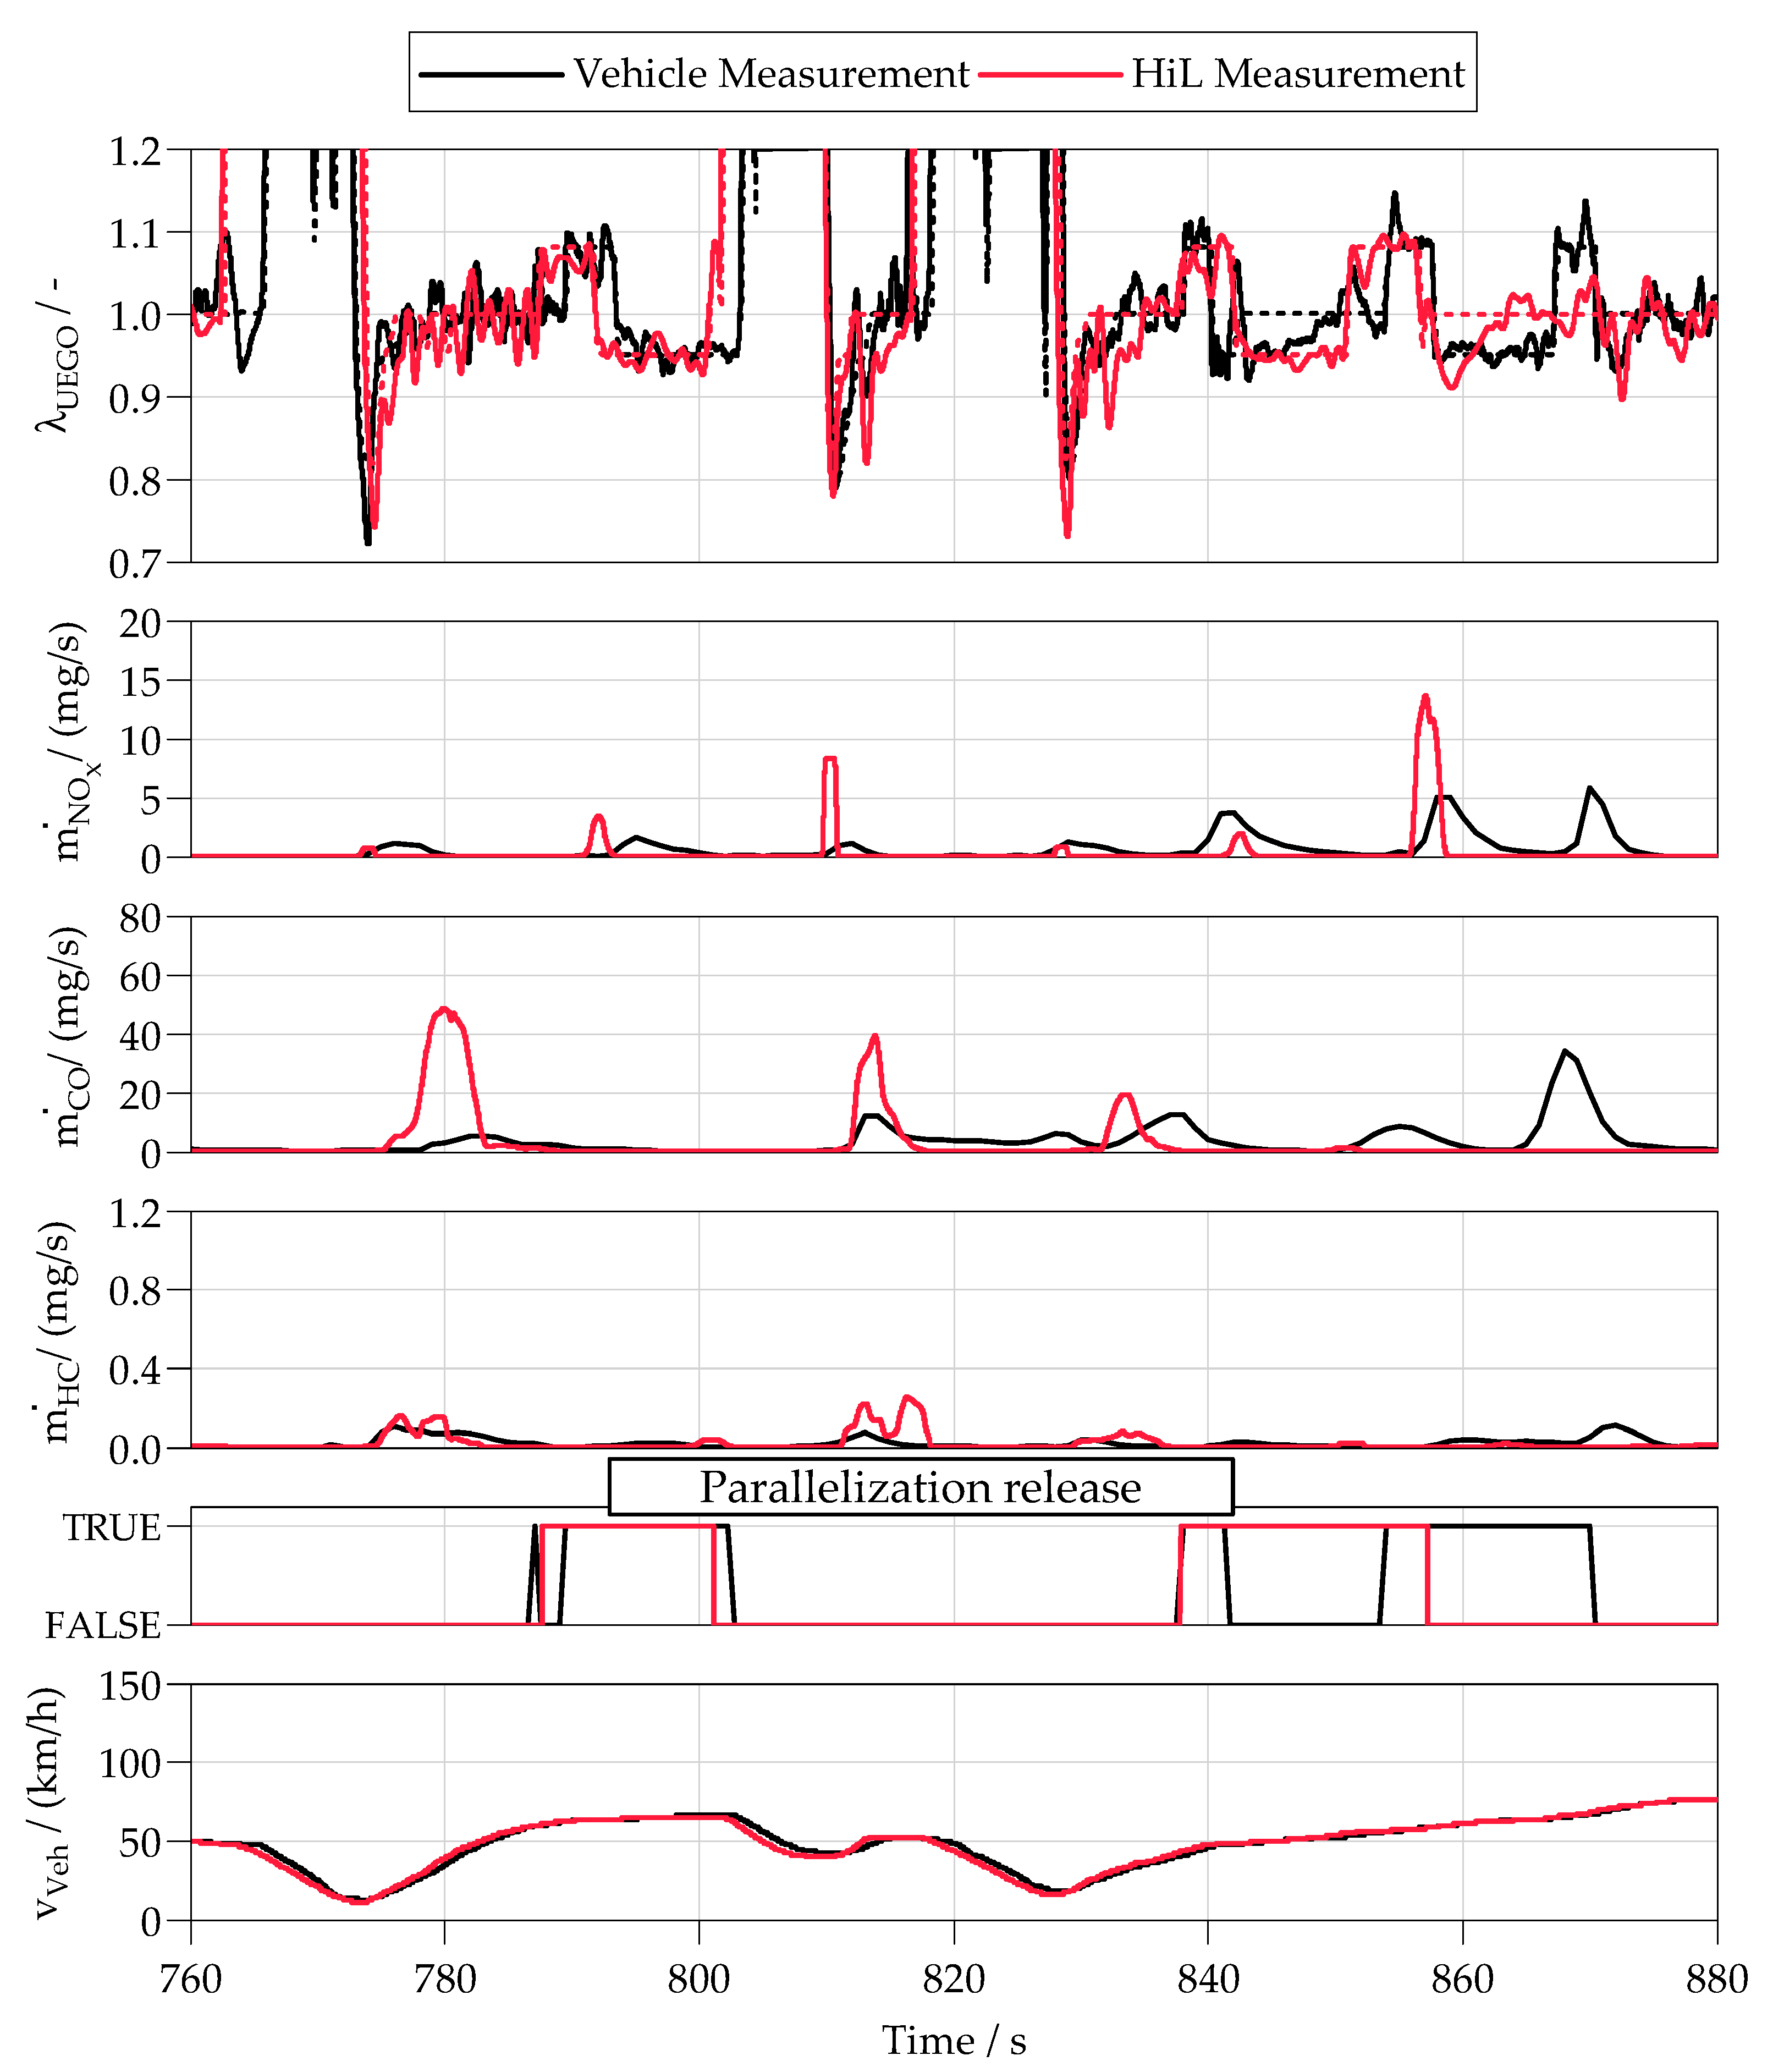
3.3. Phase #3—Emission Verification

Due to the active adjustment of the air-fuel mixture and the subsequent loading and unloading of the oxygen storage of the TWC, there is a risk that the parallelization event negatively affects the tailpipe emissions during drive cycle operation, especially when considering aged components. Therefore, it is imperative that a final OBD calibration is evaluated in terms of its emission impact, both for an OK and a nOK system. The emission verification of a final OBD calibration is the scope of “Phase #3—Emission Verification” (Figure 2). In order to ensure that the work from Phase #3 can also be supported by the HiL test bench, this chapter validates the performance of all real-time models in compound in closed loops with regard to the emission behavior at the tailpipe. In Figure 11, Figure 12, Figure 13 and Figure 14, HiL-simulations of the virtual vehicle are compared to the ones of a vehicle measurement on the chassis dynamometer during WLTC operation. Figure 11 shows the absolute cumulative results of gaseous tailpipe emissions, relevant for EU6d legislation, for the HiL simulation compared to the real measurements on the chassis dynamometer for an OK system. In order to make a meaningful statement about the simulation quality, both the emission values from the HiL simulation and those from the chassis dyno are displayed with regards to their respective legislative limits (Figure 14).
From Figure 14, a maximum deviation of 7%-points (NOx) between HiL simulation and chassis dyno measurement can be observed. Figure 11 also shows that both cold start emissions and the emission behavior during the parallelization event are well represented both quantitatively and qualitatively. The large relative difference in NOx emissions between the simulation and vehicle measurement can mainly be attributed to one event. The second parallelization attempt during the HiL simulation completes directly, while the second event in the vehicle measurement is interrupted and runs through completely in a third attempt. This event is causing one additional NOx breakthrough (Figure 12, 868 s–873 s) in the vehicle measurement, significantly influencing the overall NOx result.
Figure 12 gives a detailed insight into the transient emission results in the range of 760 s to 880 s of the WLTC (Figure 11) where the parallelization event occurs. Slight deviations between the simulated and the measured signals can be observed. These are due to minor differences in the operating points caused by slightly different driving behaviors.
Due to the behavior of the constant volume flow sampling (CVS) emission measurement system at the chassis dynamometer, a lag and mostly a slightly different profile of the simulated emission signal is observed compared to the chassis dynamometer measurement. Another reason for a slightly different emission behavior is that the parallelization in the HiL simulation starts at second 835 and fully completes. In the vehicle measurement, the parallelization starts but stops after approx. 10 s and starts again at second 850 and then successfully runs through. Despite these minor differences, overall, it can be stated that the emission behavior during the parallelization event (and other emission events such as TWC purge events) is reproduced with sufficient accuracy for all gaseous emission components, both qualitatively and quantitatively, considering an OK system.
Figure 13 shows the absolute cumulative results of gaseous tailpipe emissions, relevant for EU6d legislation, for the HiL simulation compared to the real measurements on the chassis dynamometer for a nOK system, a latent HEGO sensor.
Similar to the emission results considering the OK system shown in Figure 11, the emission results for the nOK system (Figure 13) are displayed in Figure 14 in relation to the respective legislative limits.
Because of the prolonged rich (oxygen storage of TWC completely empty) and lean (oxygen storage of TWC completely full) phases during a parallelization event with an aged HEGO sensor, it can be observed that this phenomenon leads to a significant increase in NOx and CO emissions during WLTC operation. This effect is also well represented in the HiL simulation. The deviation between the HiL simulation results and the measurements on the chassis dynamometer is less than 10%-points for all gaseous emission components NOx, CO and HC, which can be rated as particularly good compared to the literature. [61,62]

4. Discussion

The results presented in Figure 5, Figure 6, Figure 7, Figure 8, Figure 9 and Figure 10 demonstrate the feasibility of enabling fault path verification on a HiL platform for TWC and HEGO diagnosis, including fault entry in the fault memory (MILing) and the respective fault healing. As the MILing/healing sequence executed on the HiL test bench meets the legislative requirements, the HiL-based methodology is able to support during Phases #1 and #2 of the OBD development process (Figure 2). To execute typical MILing/healing verification on the HiL test bench, detailed modelling of the EATS (e.g., detailed simulation of component temperature and emission behavior) is not mandatory. Interpreting this in relation to Figure A1, only a “Level 5” model is needed to provide HiL support with the engineering tasks defined in Phases #1 and #2 (Figure 2) of the OBD development process. The active TWC and the HEGO diagnosis are among the most complex diagnoses in terms of modelling requirements (a closed-loop HiL configuration with perfectly simulated HEGO voltage is mandatory). Therefore, it can be assumed that diagnoses with lower levels of complexity in terms of model requirements can be examined via the same method and using the same modelling environment as well. Examples of this are sensor plausibility and/or electrical diagnostics, as these often only require a HiL configuration with open-loop control. An example of a HiL-based plausibility check of temperature sensors is presented by the authors in [63]. Figure 7 shows that the model environment, for both stabilized and aged components (borderline TWC and latent HEGO sensor), represents plausible system behavior over the entire operating area. Also, a clear separation between the stabilized and the aged components is apparent. Therefore, the system set-up would also be suitable for pre-calibrating of the respective failure thresholds, and a carry-over of selected OBD calibration tasks can be ensured.
The simulation results presented in Figure 11, Figure 12, Figure 13 and Figure 14 show good results in terms of the simulated emission behavior compared to vehicle measurements from the chassis dyno. As emission behavior can be simulated in good agreement with chassis dyno measurements, the HiL based methodology is able to support during Phase #3 of the OBD development process (Figure 2). For HiL support during Phase #3, detailed modelling of the engine-out emissions and the emission conversion of the TWC depending on the oxygen loading and monolith temperature is mandatory, which requires a “Level 6” model according to Figure A1.
Transferring OBD-related calibration and verification tasks from the vehicle to a HiL platform offers several advantages in terms of both flexibility and reduction of overall project time, as well as efficient use of resources:
  • The HiL platform enables a high degree of test automatization via dedicated automatization units (e.g., a failure insertion unit to simulate electrical faults). Furthermore, automated calibration can be realized using an application programming interface (API) to connect the automatization unit of the HiL platform with the calibration software (e.g., INCA V7.2). This advantage enables 24/7 testing with only limited human supervision. Furthermore, it paves the way for advanced software testing by executing test cases and sequences in an intelligent way.
  • The target powertrain components that are to be diagnosed can be easily replaced by corresponding failure components. Both real hardware (e.g., real throttle valve) and simulated hardware (e.g., simulated aged TWC) can be connected to the HiL platform and can be replaced quickly and automatically. With this advantage, elaborate workshop activities can be reduced to a minimum.
  • Virtual preconditioning for cold start tests enables the elimination of long vehicle conditioning times and avoids the use of expensive climate chambers. Furthermore, a high degree of test reproducibility in terms of oil and coolant start temperatures is achieved.
  • Conventional tools such as a fault simulation device (e.g., a break-out box) can be used. This advantage allows the conventional calibration engineer to use the virtual environment using his trusted tools and his established methods.
Taking into account the advantages of shifting OBD-related engineering tasks from the vehicle to a HiL platform on the one hand (Figure 2) and the presented results on the other, the following conclusions can finally be drawn for the presented method:
  • If the same number and type of test cases as during the conventional process is maintained, a strong reduction in total project time and thus costs can be achieved.
  • If no project time reduction is aimed, the number of test cases can be greatly increased. This results in a significant increase in the robustness and thus the final OBD calibration.
  • Reducing the number of real-world tests to perform selected OBD calibration and/or verification work packages allows for a significantly and more flexible development process that does not heavily rely solely on expensive and scarce resources, such as powertrain testing facilities and prototype vehicles. Obviously, a specific combination of points 1, 2 and 3 would be conceivable as well.

5. Summary

In this paper, a feasibility study for transferring On-Board Diagnosis (OBD)-related calibration and validation tasks from the vehicle to a Hardware-in-the-Loop (HiL)-platform is presented. As a case example, an active diagnostic for monitoring the condition of the three-way catalytic converter (TWC) and the oxygen sensors (UEGO and HEGO sensors) in the exhaust aftertreatment system is used. In order to evaluate this respective transferability, three typical phases of an OBD reference project have been considered: OK system testing (Phase #1), not OK (nOK) system testing (Phase #2) and final emission verification (Phase #3). For every phase, the simulation quality of the most important signals was assessed:
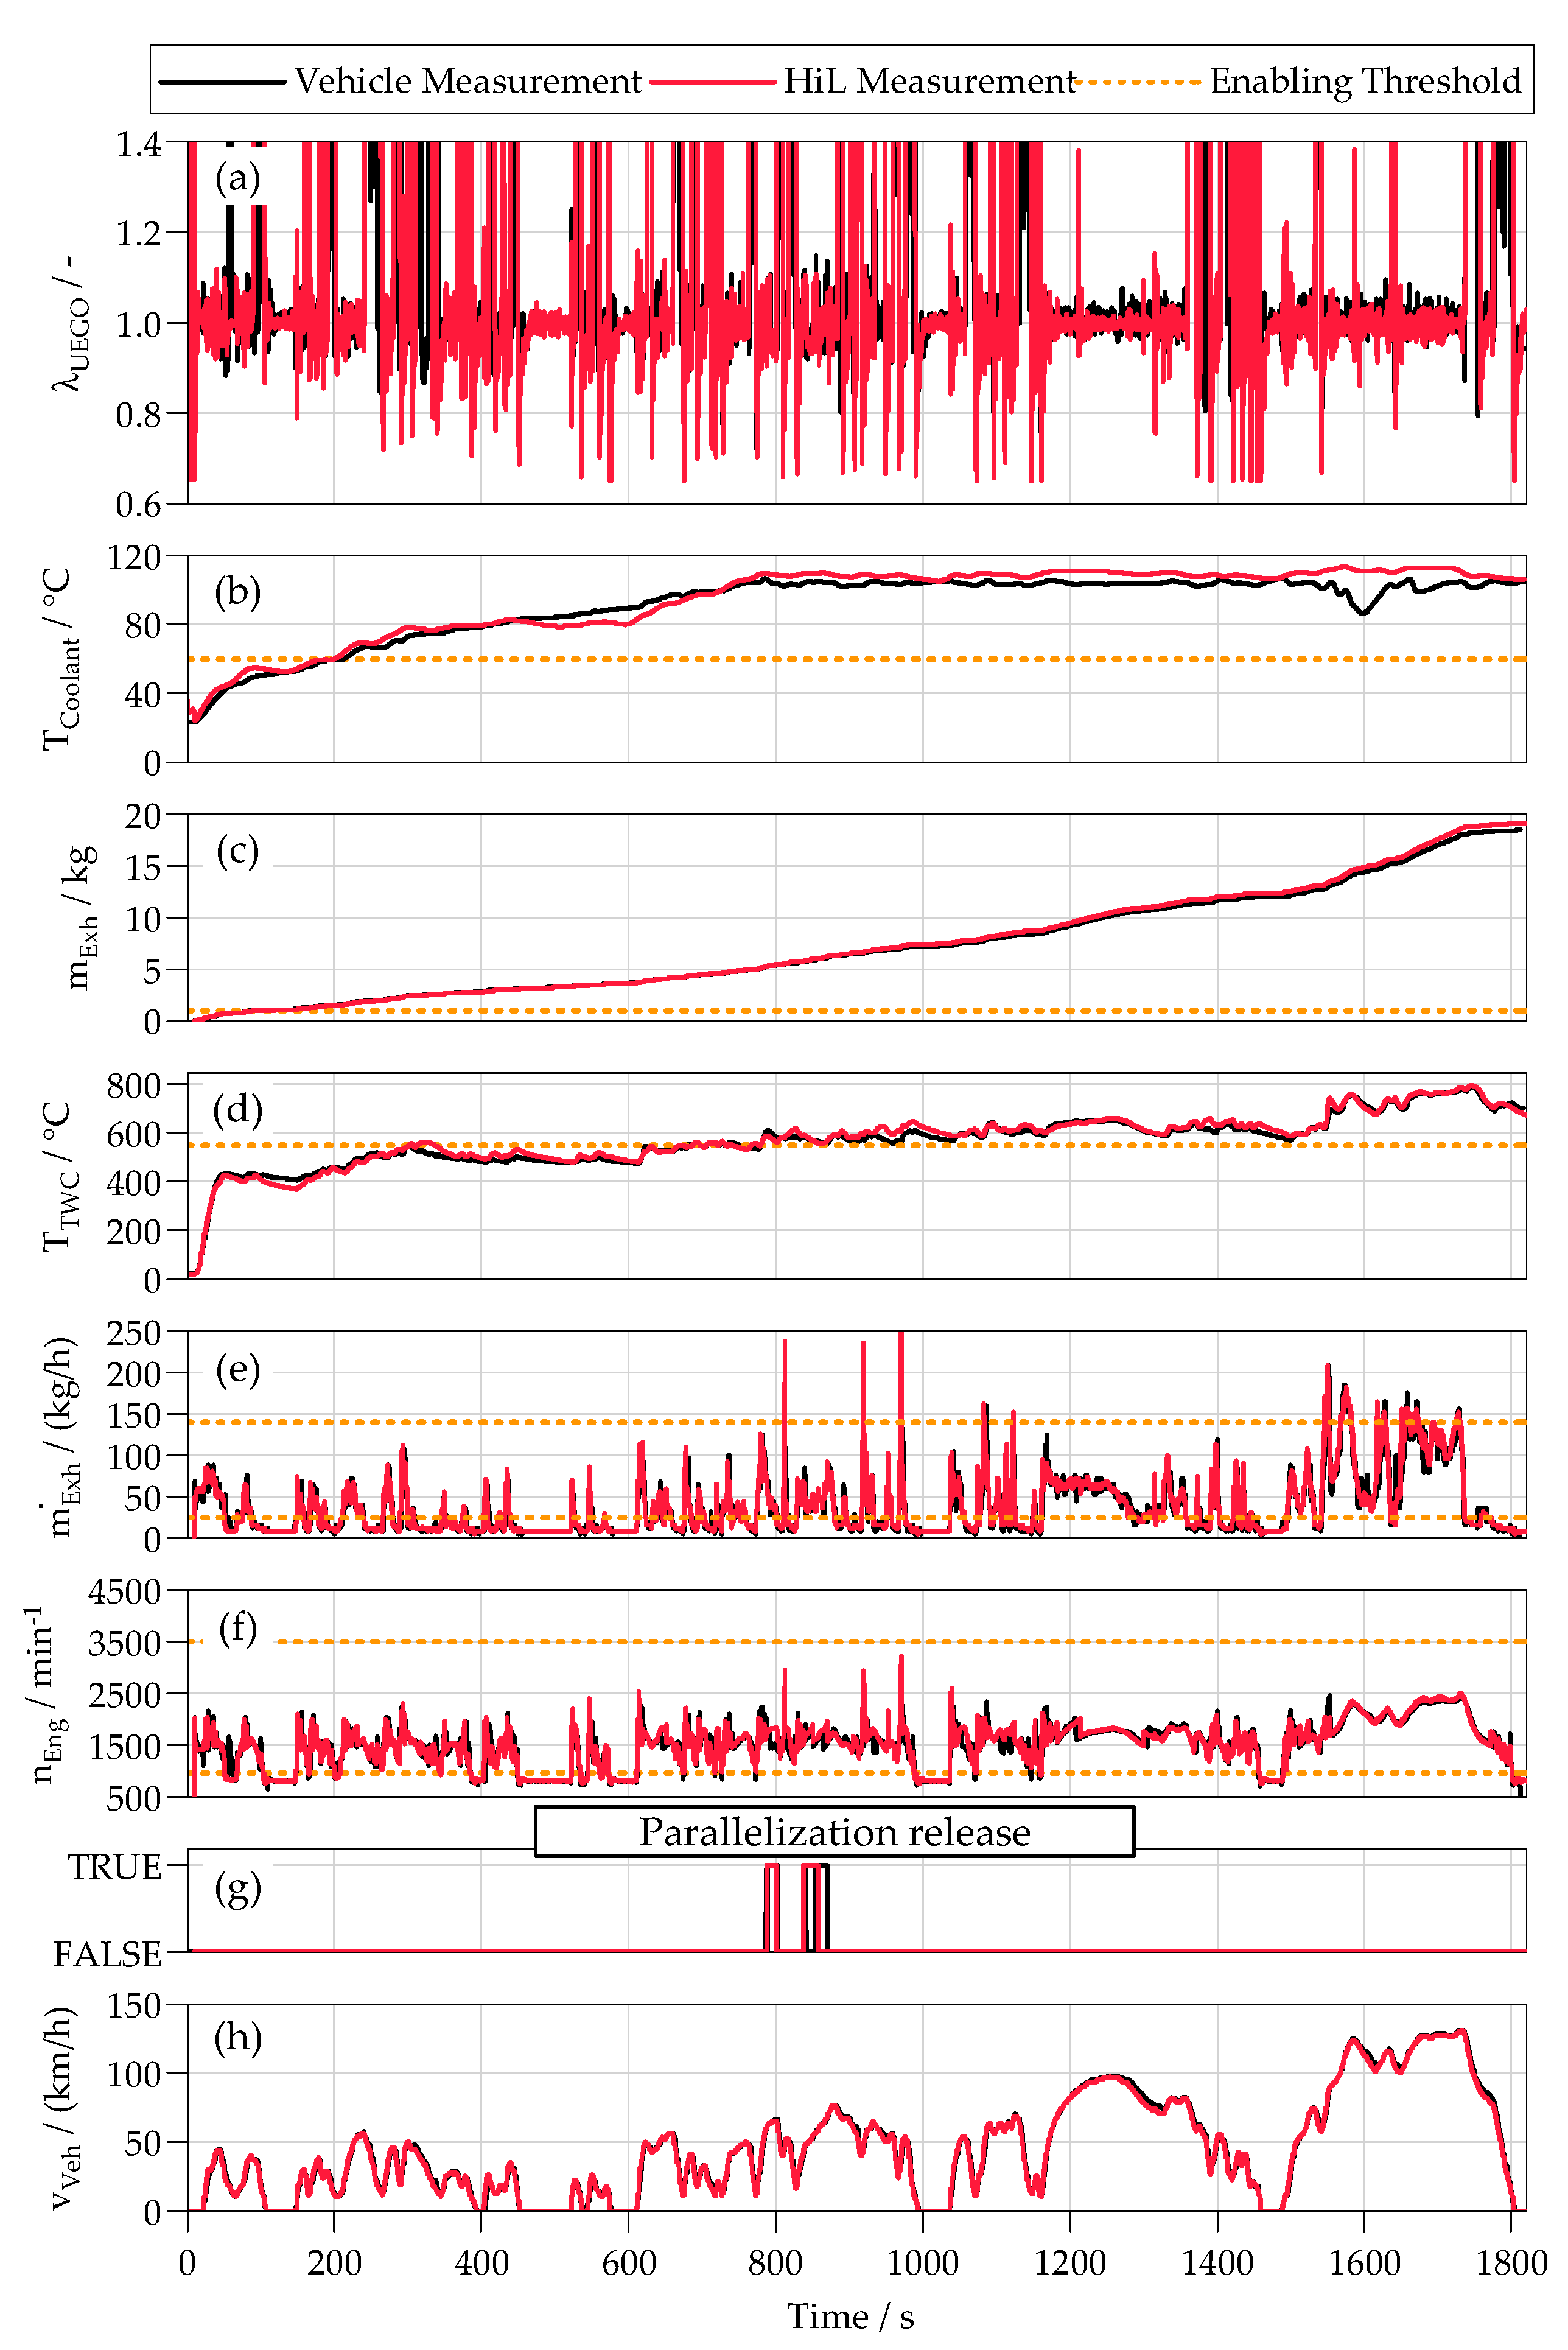
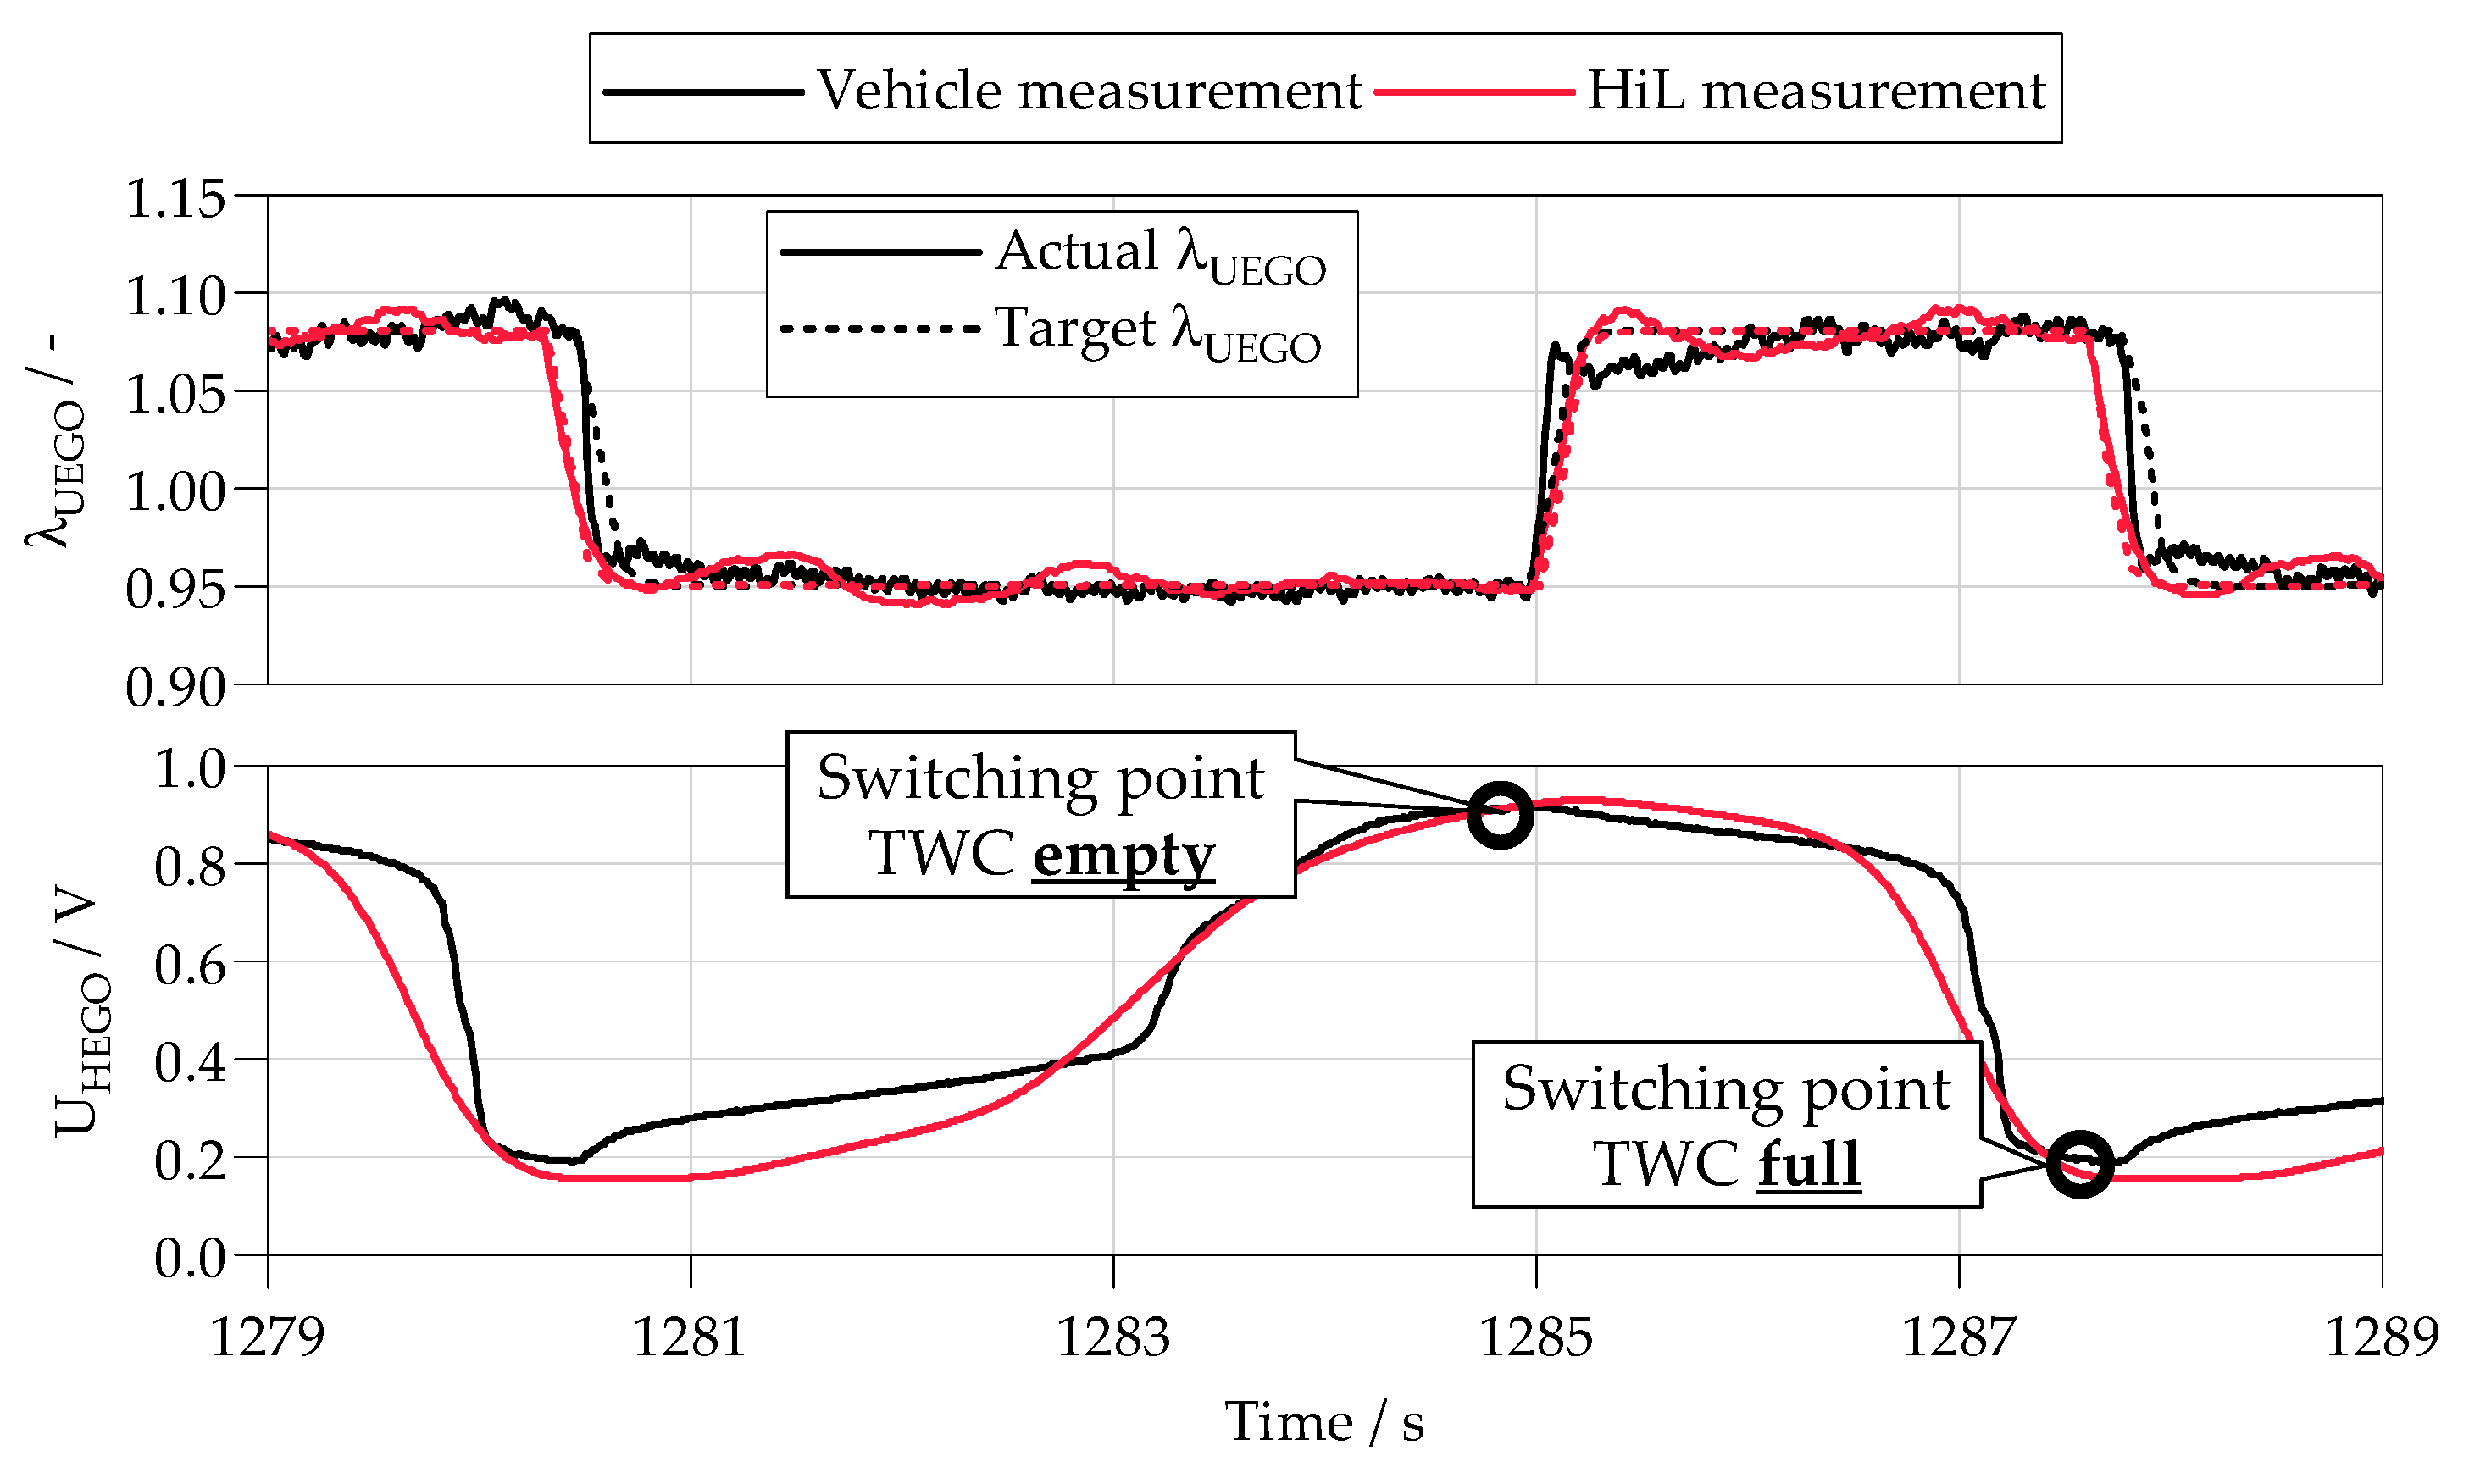
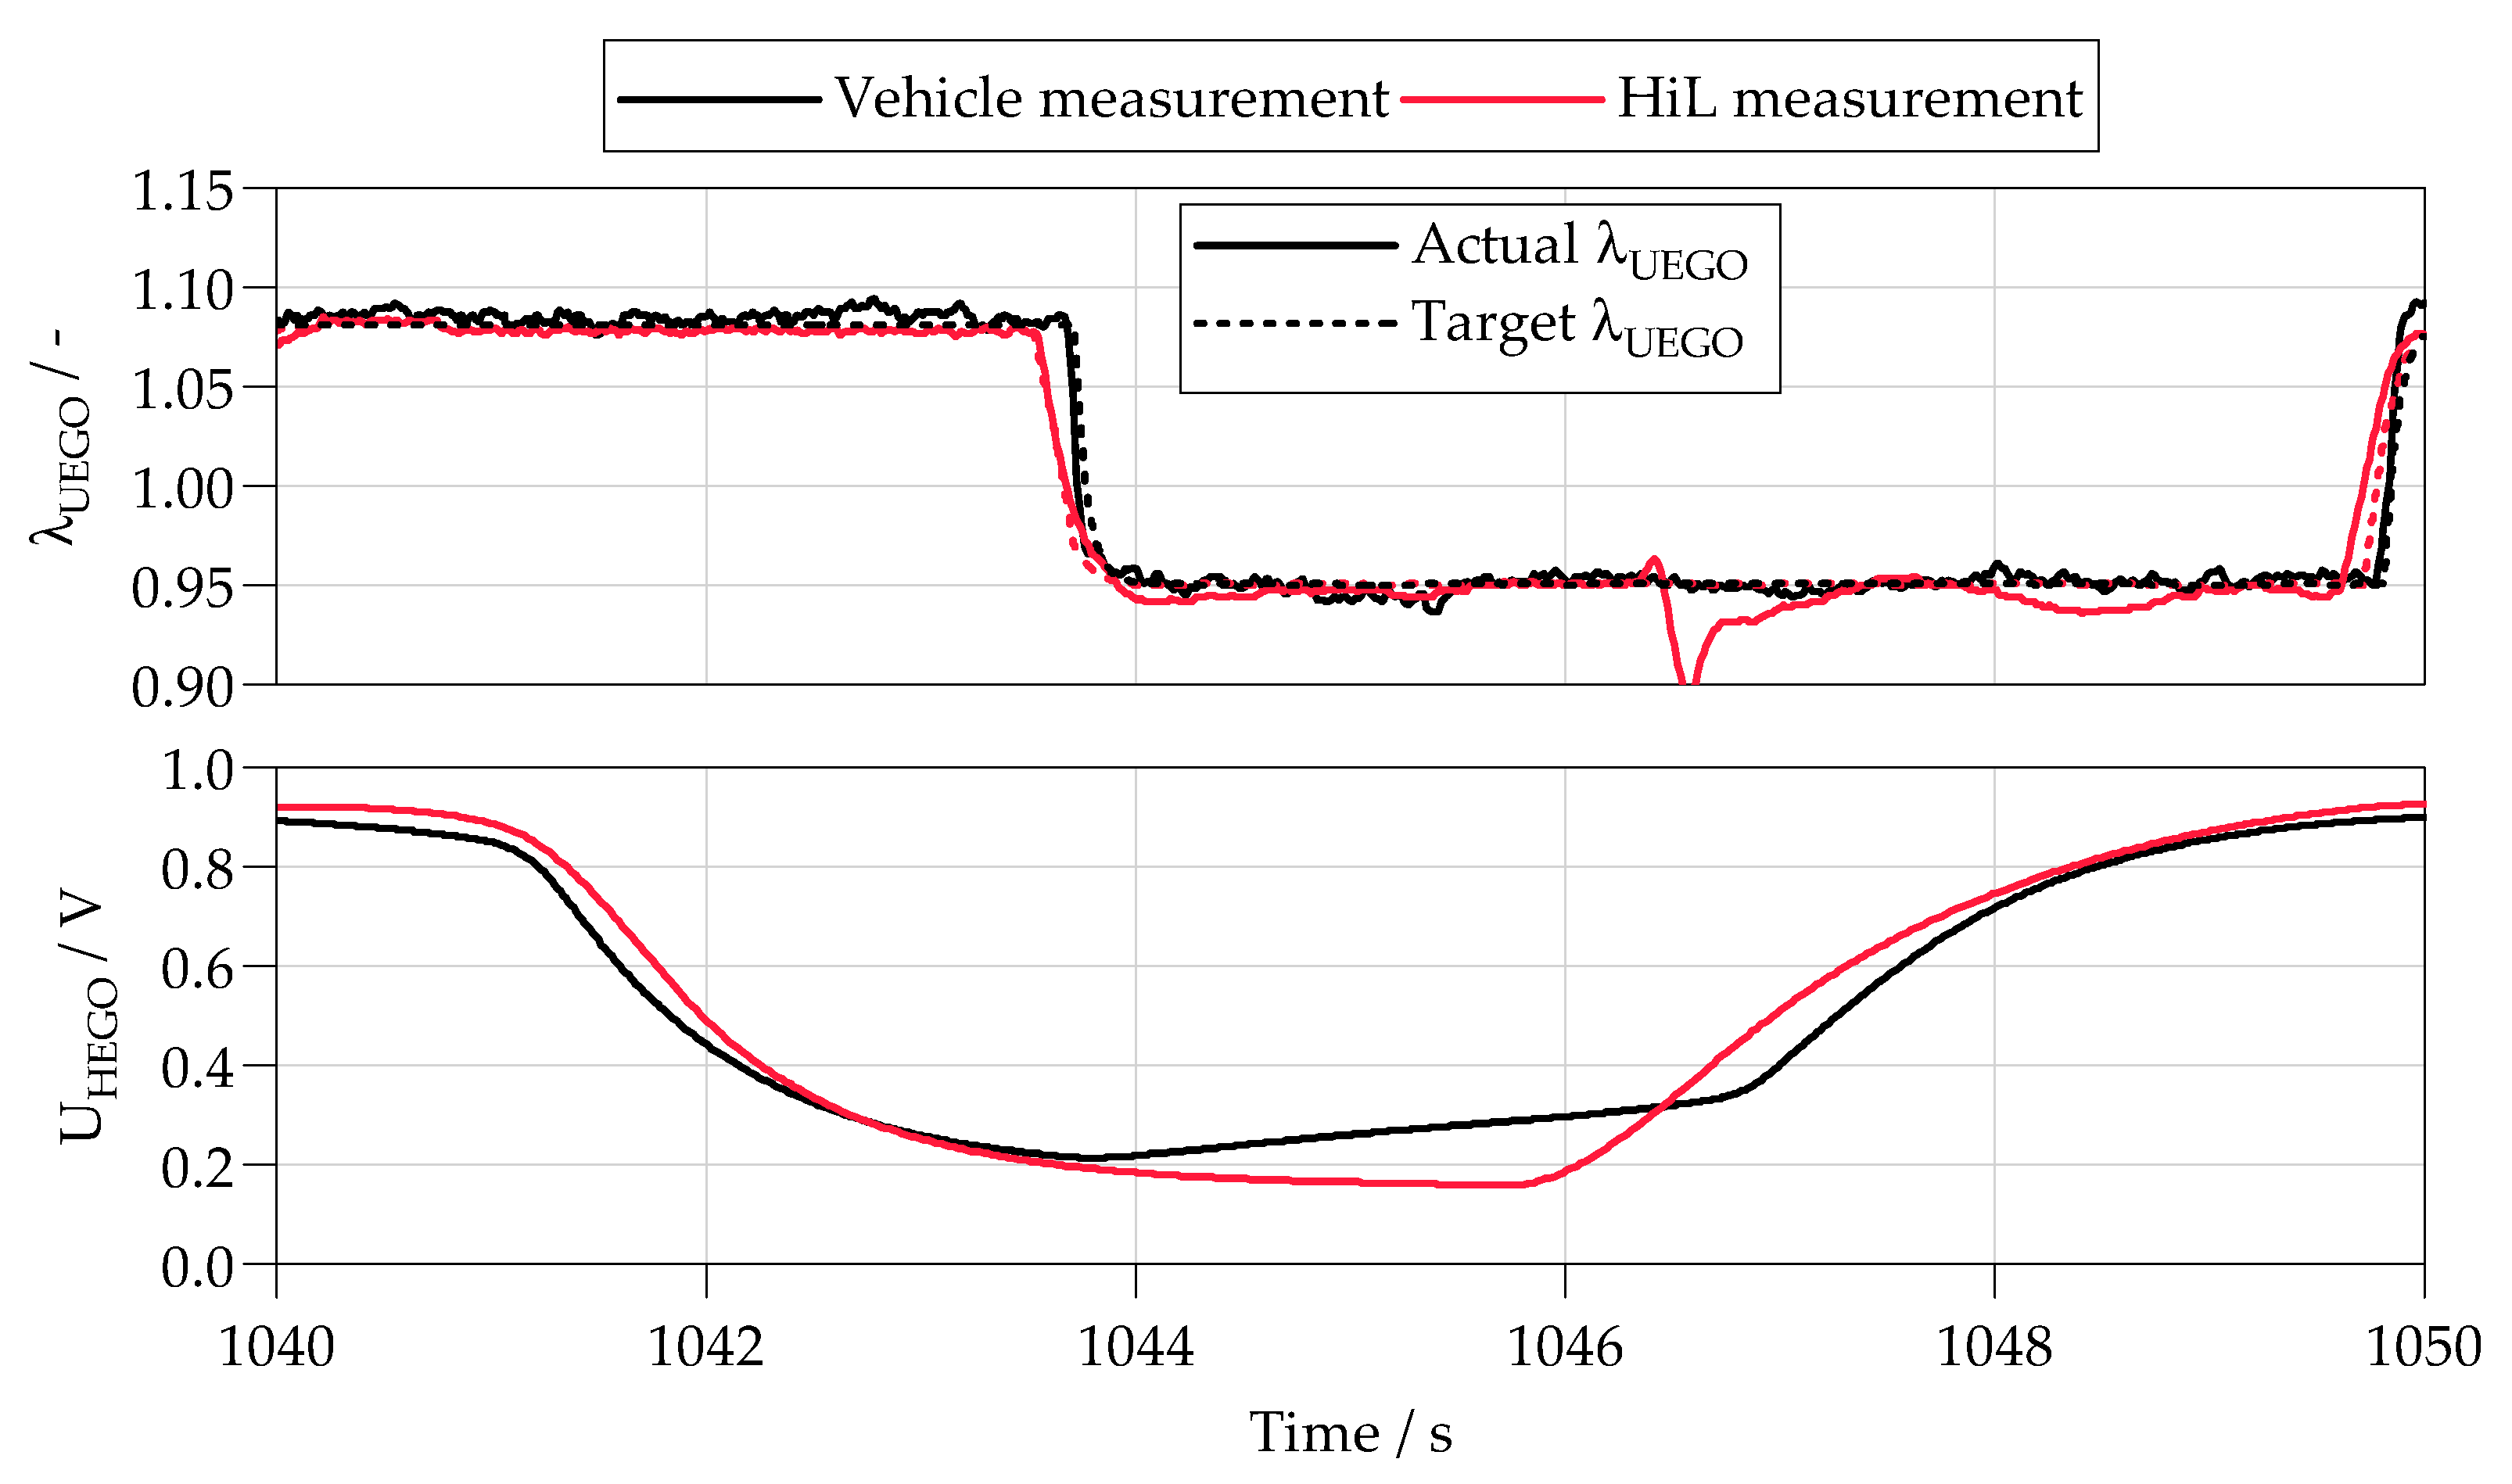
  • Phase #1—All simulated physical signals required to release the respective diagnostic event (release conditions) show good agreement with real vehicle measurement data, resulting in the diagnostic event occurring at approximately the same time during a WLTC drive cycle on both the HiL and the vehicle. It was also shown that during the diagnostic run on the HiL platform, all relevant characteristics of the most important sensor signals (UEGO and HEGO sensor signals) were modelled with sufficient accuracy and led to valid diagnostic results over the entire operating range.
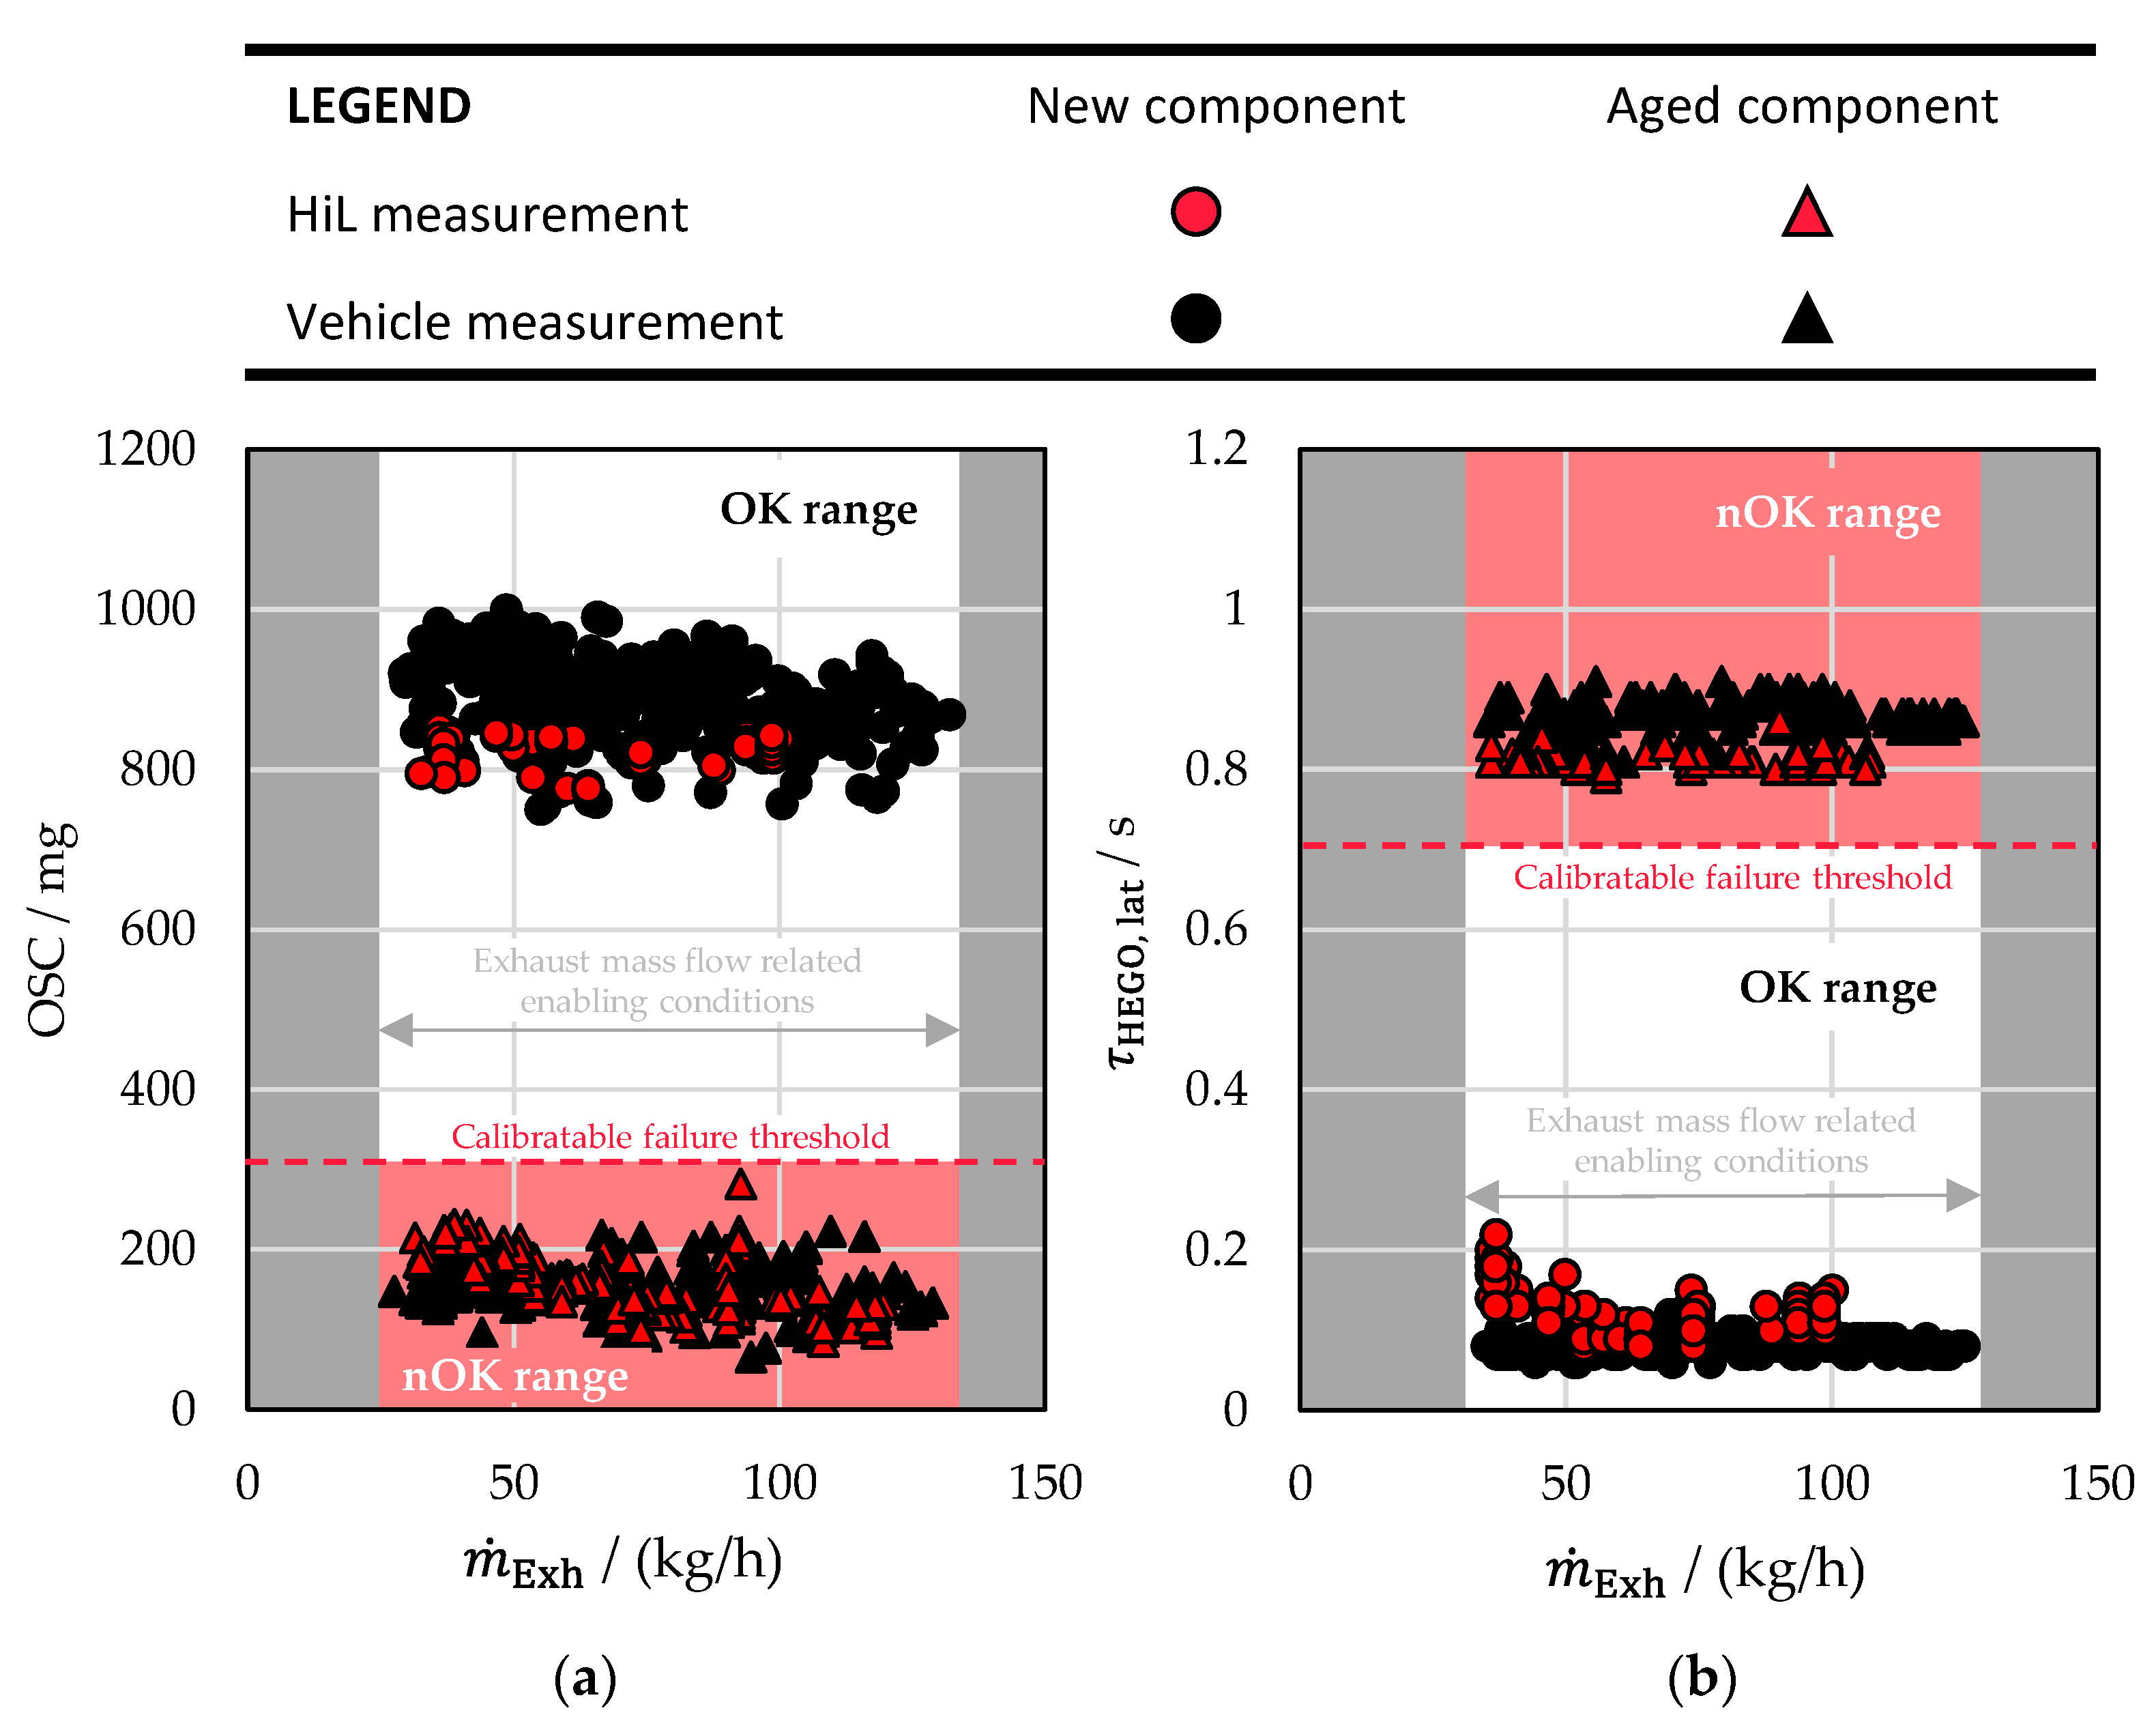
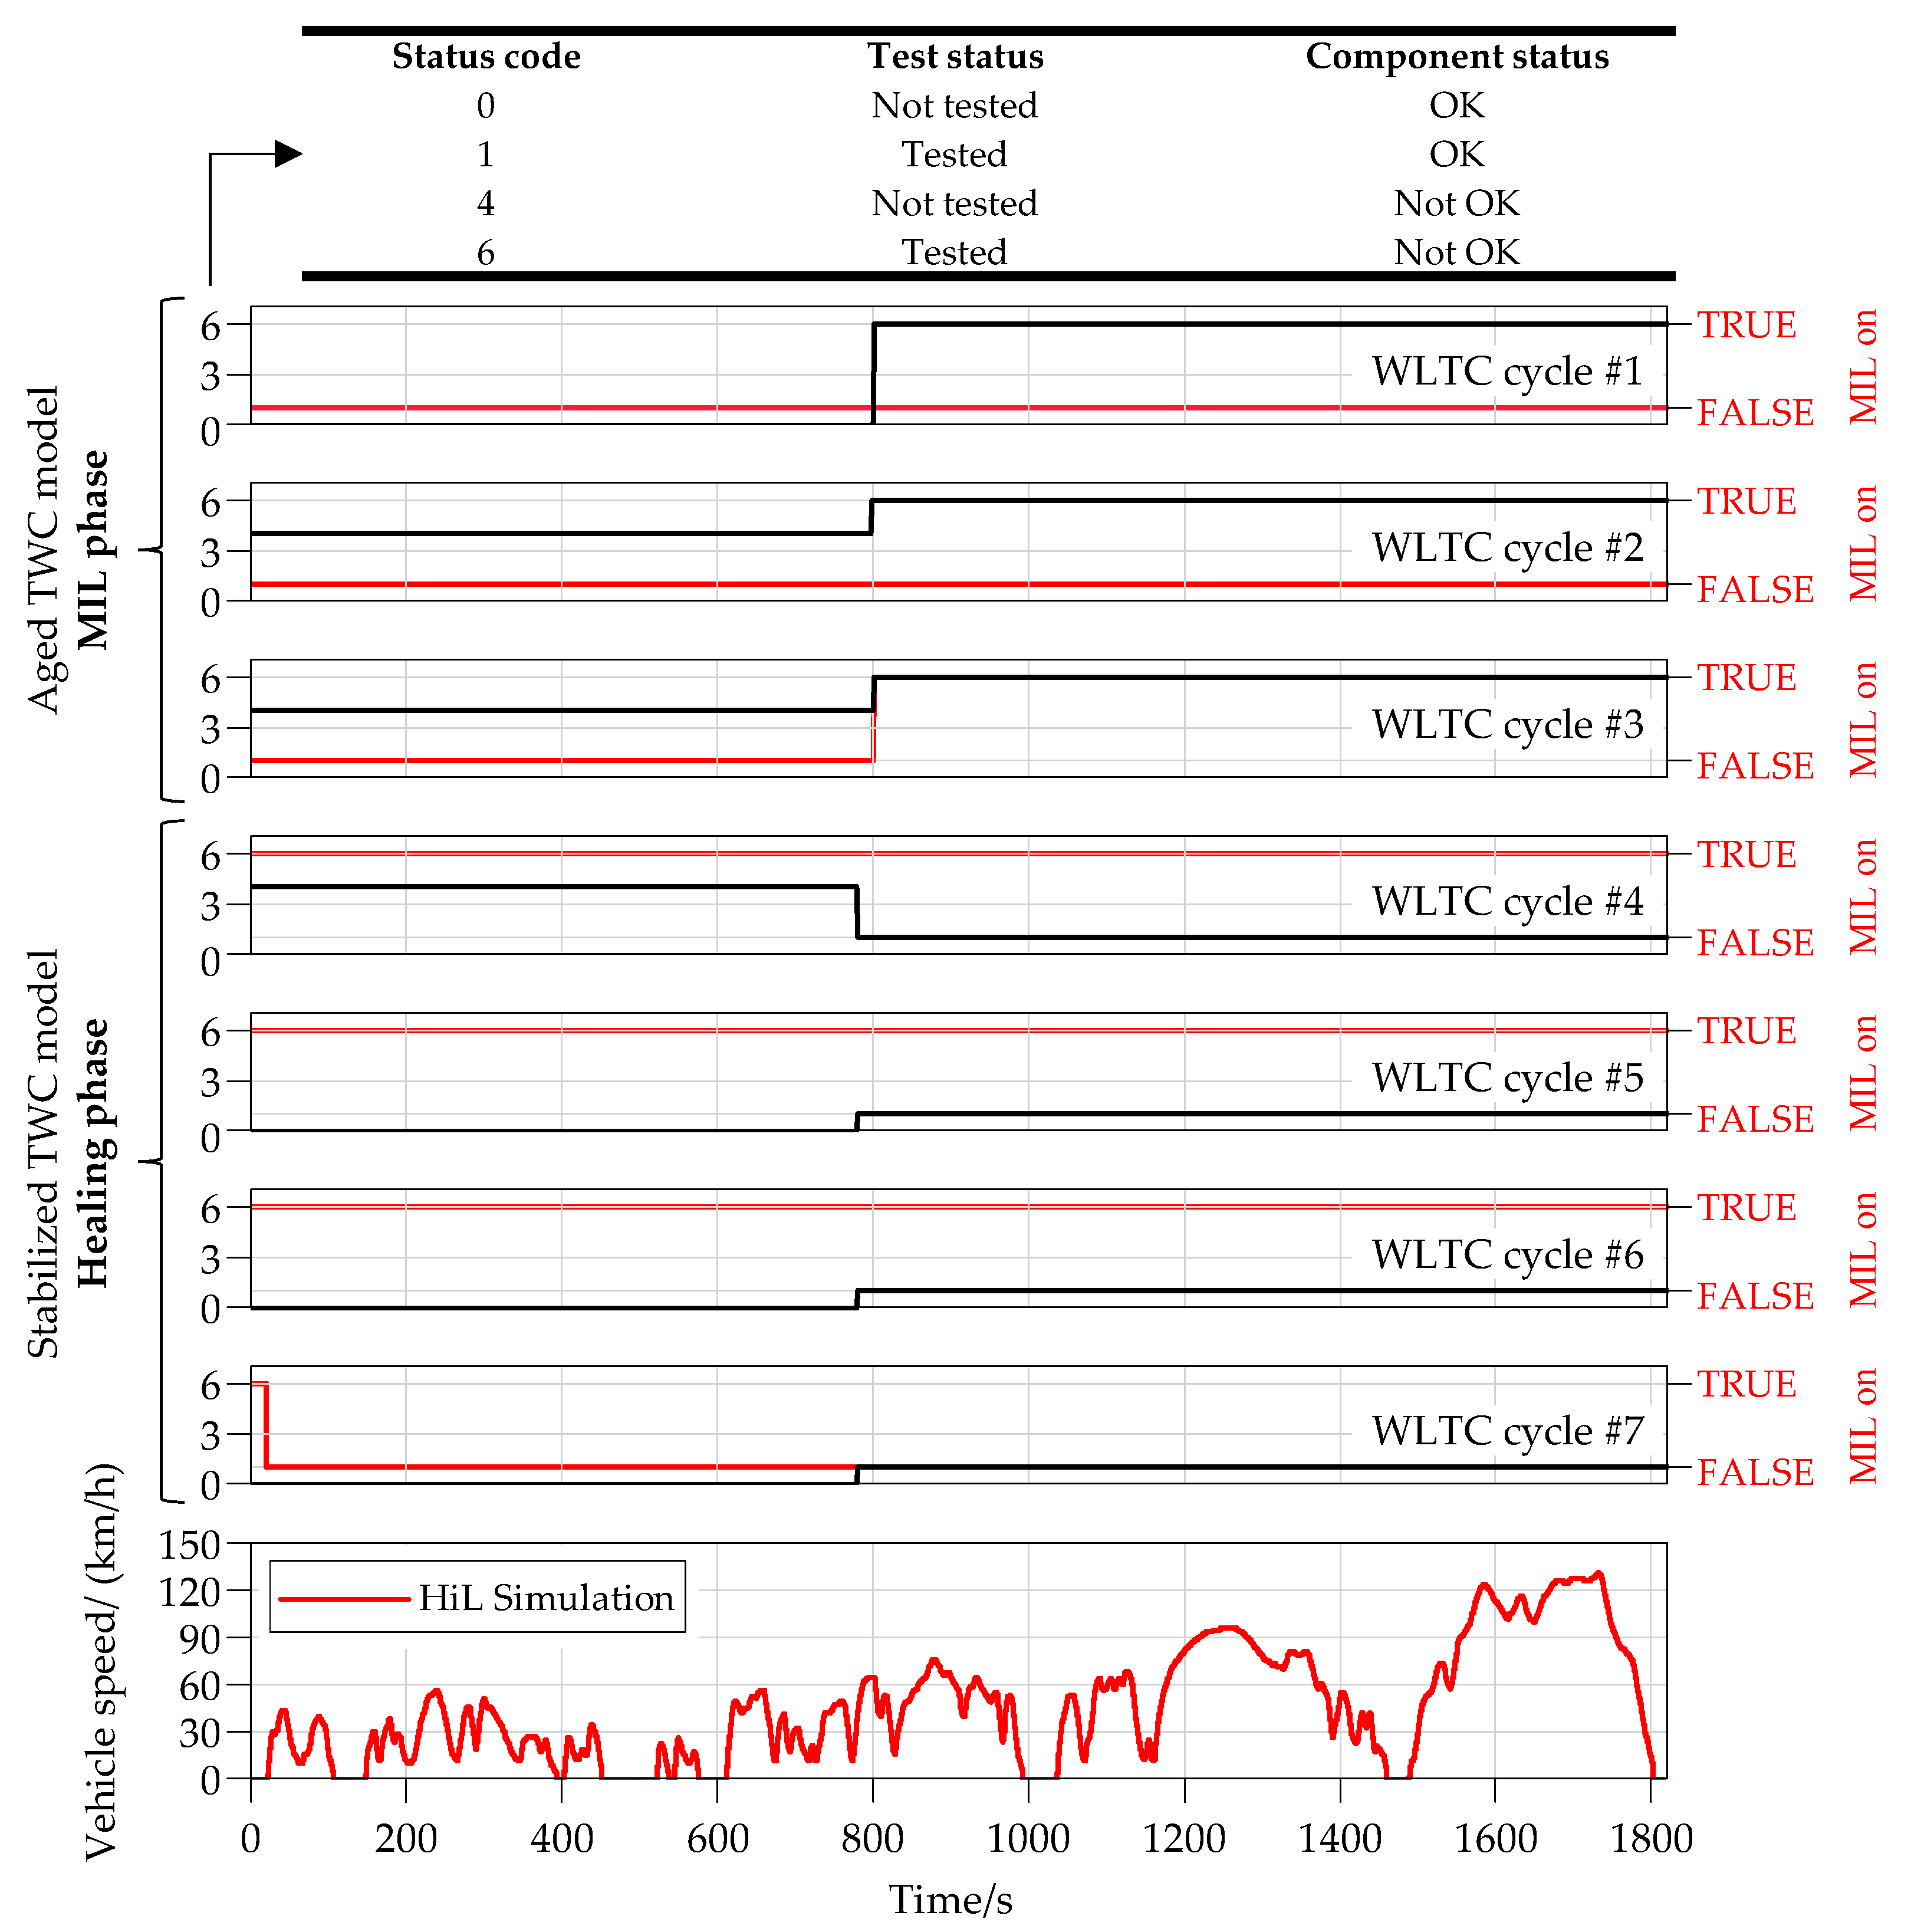
  • Phase #2—The respective fault patterns for both aged TWC and latent HEGO sensors are well represented on the HiL platform, which likewise leads to valid diagnostic results over the entire operating range.
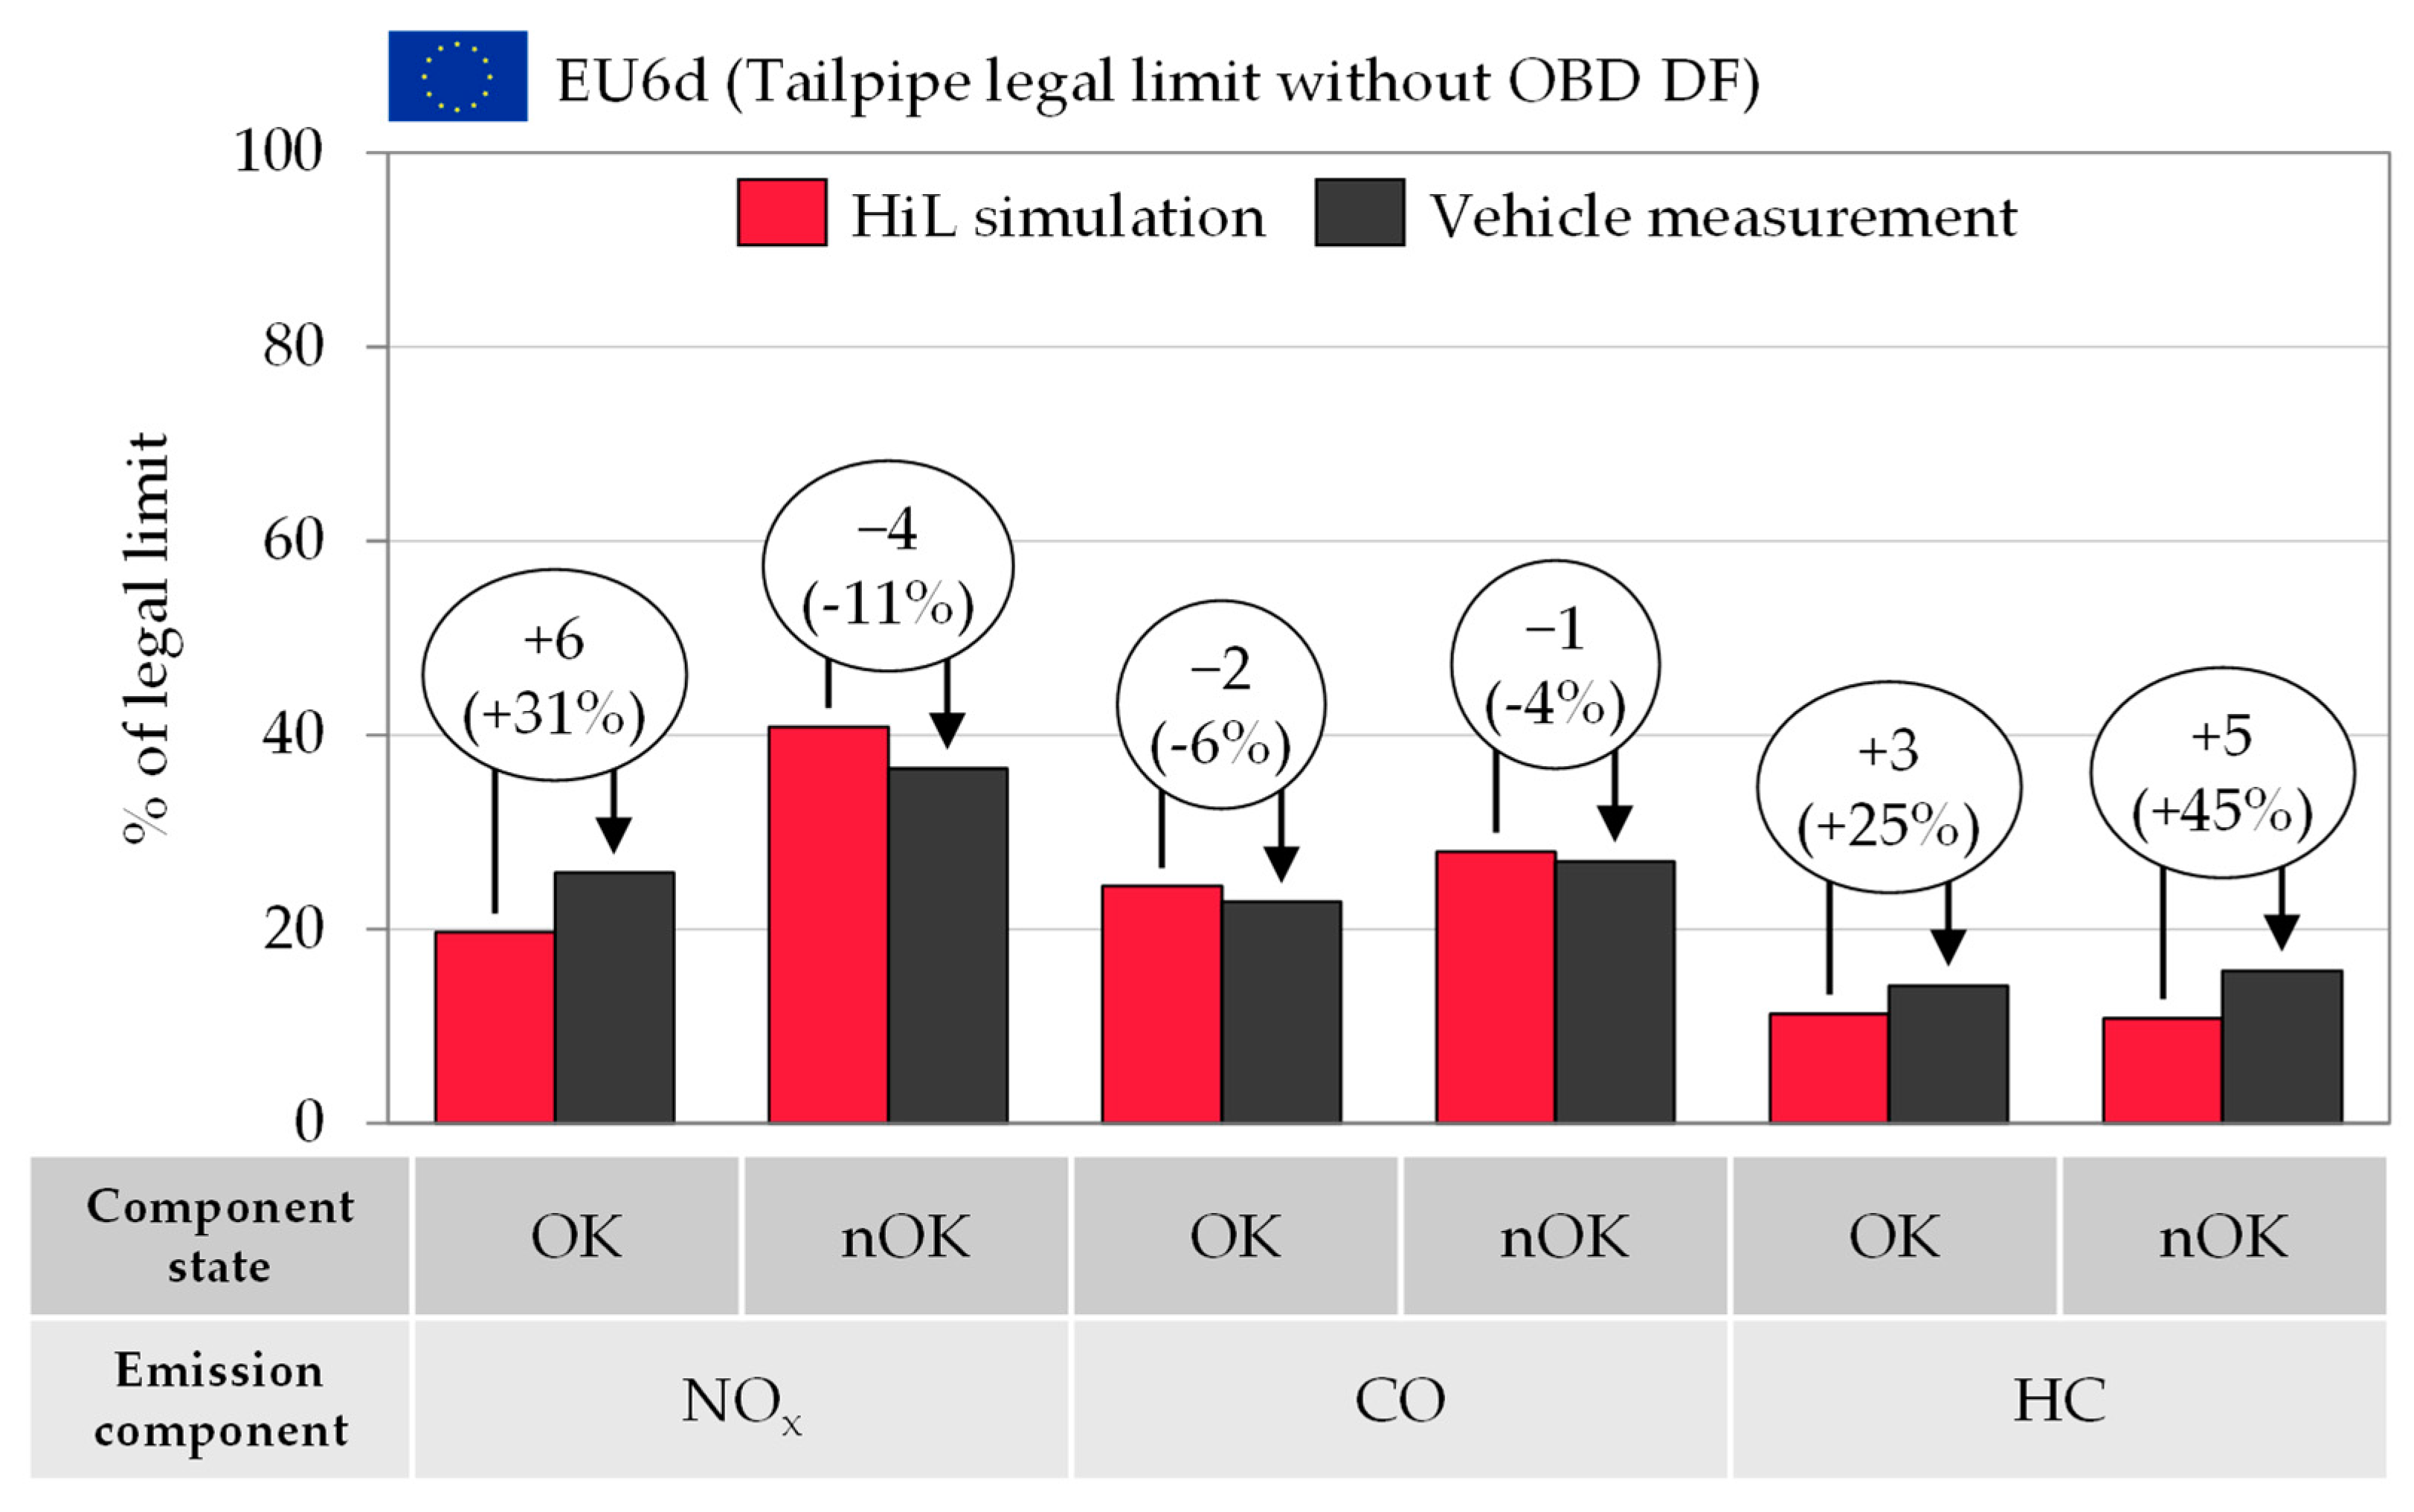
  • Phase #3—The relevant gaseous emission results at the tailpipe are well represented in the HiL-simulation in comparison to real vehicle measurements, both for a new system and for aged components. The simulation accuracy obtained (simulation vs. vehicle measurement) is as follows:
    • NOx emission +31% (6%-point with regards to the EU6d legal limit) considering an OK-system and −11% (−4%-point with regards to the EU6d legal limit) considering a nOK system.
    • CO emissions −6% (−2%-point with regards to the EU6d legal limit) considering an OK-system and −4% (−1%-point with regards to the EU6d legal limit) considering a nOK system.
    • HC emissions +25% (3%-point with regards to the EU6d legal limit) considering an OK system and +45% (+5%-point with regards to the EU6d legal limit) considering a nOK system.
Ultimately, it is demonstrated that all relevant signals are simulated with sufficient accuracy to ensure a robust transfer from the vehicle to a HiL platform. Based on the results obtained, it is concluded that transferring OBD work from the vehicle to the HiL test bench could lead to a significant saving in development time and that the number of prototype vehicles and test resources required can be significantly reduced.

Author Contributions

Conceptualization, F.D. and C.L.; methodology, F.D. and C.L.; software, P.B.; validation, F.D. and P.B.; formal analysis, F.D.; investigation, F.D. and P.B.; resources, M.N.; data curation, P.B.; writing—original draft preparation, F.D.; writing—review and editing, M.T.D., S.K., C.L.; visualization, F.D. and M.T.D.; supervision, S.P. and M.N.; project administration, F.D.; funding acquisition, M.G. and S.P. All authors have read and agreed to the published version of the manuscript.

Funding

The presented research was carried out at the Center for Mobile Propulsion (CMP) of RWTH Aachen University, funded by the German Science Council ‘Wissenschaftsrat’ (WR) and the German Research Foundation ‘Deutsche Forschungsgemeinschaft’ (DFG).

Institutional Review Board Statement

Not applicable.

Informed Consent Statement

Not applicable.

Data Availability Statement

The data presented in this study are available on request from the corresponding author. The full data setis not publicly available due to confidentiality reasons. On request, defined parts can be shared.

Acknowledgments

The authors thank Andreas Bollig, Frank Budde, Jaykumar Kansagara from the Business Unit Motor & Hybrid Powertrain of FEV Europe GmbH and Muhammad Abrar Islam from the Chair of Thermodynamics of Mobile Energy Conversion Systems for their support.

Conflicts of Interest

The authors Christoph Lisse, Martin Nijs and Michael Görgen were employed by the company FEV Europe GmbH. The remaining authors declare that the research was conducted in the absence of any commercial or financial relationships that could be construed as a potential conflict of interest.

Abbreviations

WLTPWorldwide harmonized Light vehicles Test Procedure
RDEReal Driving Emissions
OEMOriginal Equipment Manufacturer
GPFGasoline Particulate Filter
EATSExhaust Aftertreatment System
HCHydrocarbon
COCarbon Monoxide
NOxNitrogen Oxide
OBDOn-Board Diagnosis
HiLHardware-in-the-Loop
TWCThree-Way Catalyst
ECUEngine Control Unit
TCUTransmission Control Unit
HEGOHeated Exhaust Gas Oxygen sensor
OSCOxygen Storage Capacity
nOKnot OK
UEGOUniversal Exhaust Gas Oxygen sensor
GDIGasoline Direct Injection
FWDFront Wheel Drive
DSMDiagnostic State Manager
WLTCWorldwide Harmonized Light-Duty Test Cycle
MILMalfunction Indicator Light
CVSConstant Volume Flow Sampling
APIApplication Programming Interface
DFDeterioration Factor

Appendix A

Figure A1 shows the HiL platform setup process in a simplified manner for a conventional gasoline powertrain.
Figure A1. Schematic overview of the HiL platform setup process for a conventional powertrain.
Applsci 14 01245 g0a1

References

  1. Maurer, R.; Yadla, S.K.; Balazs, A.; Thewes, M.; Walter, V.; Uhlmann, T. Designing Zero Impact Emission Vehicle Concepts. In Experten-Forum Powertrain: Ladungswechsel und Emissionierung 2020; Liebl, J., Ed.; Springer: Berlin/Heidelberg, Germany, 2021; pp. 75–116. ISBN 978-3-662-63523-0. [Google Scholar]
  2. Mulholland, E.; Miller, J.; Bernard, Y.; Lee, K.; Rodríguez, F. The role of NOx emission reductions in Euro 7/VII vehicle emission standards to reduce adverse health impacts in the EU27 through 2050. Transp. Eng. 2022, 9, 100133. [Google Scholar] [CrossRef]
  3. European Commission. The European Green Deal: Communication from the Commission to the European Parliament, the European Council, the Council, the European Economic and Social Committee and The Committee of the Regions; European Commission: Brussels, Belgium, 2019; Volume 640.
  4. 2022/0365(COD); Final Text of the Agreement—Regulation on Type-Approval of Motor Vehicles and Engines and of Systems, Components and Separate Technical units Intended for Such Vehicles, with Respect to Their Emissions and Battery Durability (Euro 7). 2023. Available online: https://eur-lex.europa.eu/legal-content/EN/TXT/?uri=CELEX%3A52022PC0586 (accessed on 20 January 2024).
  5. European Comission. Proposal for a Regulation of the European Parliament and of the Council on Type-Approval of Motor Vehicles and Engines and of Systems, Components and Separate Technical Units Intended for Such Vehicles, with Respect to Their Emissions and Battery Durability (Euro 7) and Repealing Regulations (EC) No 715/2007 and (EC) No 595/2009; Proposal; European Commission: Brussels, Belgium, 2022.
  6. Dorscheidt, F.; Sterlepper, S.; Görgen, M.; Nijs, M.; Claßen, J.; Yadla, S.K.; Maurer, R.; Pischinger, S.; Krysmon, S.; Abdelkader, A. Gasoline Particulate Filter Characterization Focusing on the Filtration Efficiency of Nano-Particulates Down to 10 nm; SAE Technical Paper Series; SAE Powertrains, Fuels & Lubricants Meeting, 22 September 2020; SAE International: Warrendale, PA, USA, 2020. [Google Scholar]
  7. Archer, G. Principles for Euro Final Standards. In Proceedings of the European Commission Stakeholder Meeting; European Commission: Brussels, Belgium, 2018. [Google Scholar]
  8. Achleitner, E.; Frenzel, H.; Grimm, J.; Maiwal, O.; Rösel, G.; Senft, P.; Zhang, H. Systemansatz für ein Fahrzeug mit Benzindirekteinspritzung und Partikel Filter im RDE. In Proceedings of the 39. Internationales Wiener Motorensymposium. Internationales Wiener Motorensymposium, Vienna, Austria, 26–27 April 2018; Lenz, H.P., Geringer, B., Eds.; Springer: Wiesbaden, Germany, 2018. [Google Scholar]
  9. Lanzerath, P.; Wunsch, R.; Schön, C. The first series-production particulate filter for Mercedes-Benz gasoline engines. In 17. Internationales Stuttgarter Symposium; Bargende, M., Reuss, H.-C., Wiedemann, J., Eds.; Springer Fachmedien Wiesbaden: Wiesbaden, Germany, 2017; pp. 851–865. ISBN 978-3-658-16987-9. [Google Scholar]
  10. Proust, M.; Arandyelovitch, A.; Trochet, P.; Mohsen, O.; Gödecke, T.; Koch, P.; Maass, T.; Schnüpke, H. The New 1.0-Liter Turbo Gasoline Engine from the Renault-Nissan Alliance—HR10DDT. In 27. Aachener Kolloquium; Aachener Kolloquium: Aachen, Germany, 2018. [Google Scholar]
  11. Hentschel, L.; Demmelbauer-Ebner, W.; Theobald, J.; Wendt, W.; Thiele, M.; Blume, H. The New 1.0 l TSI with 85 kW and Petrol Particulate Filter—Clean, Efficient Performance for the Up! GTI. In 26. Aachener Kolloquium; Aachener Kolloquium: Aachen, Germany, 2017. [Google Scholar]
  12. Commission Regulation (EU) 2017/1151. 2017. Available online: https://eur-lex.europa.eu/eli/reg/2017/1151/oj (accessed on 20 January 2024).
  13. Sterlepper, S. Entwicklung einer beschleunigten Aschebeladung zur Analyse des Alternungverhaltens von Ottopartikelfiltern. Ph.D. Thesis, RWTH Aachen University, Aachen, Germany, 2021. [Google Scholar]
  14. Claßen, J. Entwicklung Statistisch Relevanter Prüfszenarien zur Bewertung der Fahrzeug-Emissionsrobustheit unter Realen Fahrbedingungen. Ph.D. Thesis, RWTH Aachen University, Aachen, Germany, 2022. [Google Scholar]
  15. Krysmon, S.; Dorscheidt, F.; Claßen, J.; Düzgün, M.; Pischinger, S. Real Driving Emissions—Conception of a Data-Driven Calibration Methodology for Hybrid Powertrains Combining Statistical Analysis and Virtual Calibration Platforms. Energies 2021, 14, 4747. [Google Scholar] [CrossRef]
  16. Wasserburger, A.; Hametner, C. Automated Generation of Real Driving Emissions Compliant Drive Cycles Using Conditional Probability Modeling. In Proceedings of the 2020 IEEE Vehicle Power and Propulsion Conference (VPPC), Gijon, Spain, 18 November–16 December 2020; pp. 1–6, ISBN 978-1-7281-8959-8. [Google Scholar]
  17. Roberts, P.; Mason, A.; Whelan, S.; Tabata, K.; Kondo, Y.; Kumagai, T.; Mumby, R.; Bates, L. RDE Plus—A Road to Rig Development Methodology for Whole Vehicle RDE Compliance: Overview; SAE Technical Paper Series; WCX SAE World Congress Experience, 21 April 2020; SAE International: Warrendale, PA, USA, 2020. [Google Scholar]
  18. Boger, T.; Rose, D.; He, S.; Joshi, A. Developments for future EU7 regulations and the path to zero impact emissions—A catalyst substrate and filter supplier’s perspective. Transp. Eng. 2022, 10, 100129. [Google Scholar] [CrossRef]
  19. Giechaskiel, B.; Valverde, V.; Kontses, A.; Melas, A.; Martini, G.; Balazs, A.; Andersson, J.; Samaras, Z.; Dilara, P. Particle Number Emissions of a Euro 6d-Temp Gasoline Vehicle under Extreme Temperatures and Driving Conditions. Catalysts 2021, 11, 607. [Google Scholar] [CrossRef]
  20. Samaras, Z.C.; Kontses, A.; Dimaratos, A.; Kontses, D.; Balazs, A.; Hausberger, S.; Ntziachristos, L.; Andersson, J.; Ligterink, N.; Aakko-Saksa, P.; et al. A European Regulatory Perspective towards a Euro 7 Proposal. SAE Int. J. Adv. Curr. Prac. Mobil. 2023, 5, 998–1011. [Google Scholar] [CrossRef]
  21. Szabados, G.; Szűcs, H.; Hézer, J.; Sanders, B. Investigation of Possibilities of λ = 1 Full Load Operation for Gasoline Engines in the Light of Future Emission Regulation. Period. Polytech. Transp. Eng. 2022, 50, 111–127. [Google Scholar] [CrossRef]
  22. Brück, R.; Stock, H.; Rösel, G.; Achleitner, E.; Graf, F.; Rodatz, P.; Senft, P. Lowest Real Driving Emissions: Solutions for Electrified Gasoline Engines. In 28. Aachener Kolloquium; Aachener Kolloquium: Aachen, Germany, 2019. [Google Scholar]
  23. Jean, E.; Sommier, T.; Capirchia, M. Electric Heating for Exhaust Converters: The Key to Very Low Emission Levels. In 28. Aachener Kolloquium; Aachener Kolloquium: Aachen, Germany, 2019. [Google Scholar]
  24. Andert, J.; Xia, F.; Klein, S.; Guse, D.; Savelsberg, R.; Tharmakulasingam, R.; Thewes, M.; Scharf, J. Road-to-rig-to-desktop: Virtual development using real-time engine modelling and powertrain co-simulation. Int. J. Engine Res. 2019, 20, 686–695. [Google Scholar] [CrossRef]
  25. Xia, F.; Lee, S.-Y.; Andert, J.; Kampmeier, A.; Scheel, T.; Ehrly, M.; Tharmakulasingam, R.; Takahashi, Y.; Kumagai, T. Crank-Angle Resolved Real-Time Engine Modelling: A Seamless Transfer from Concept Design to HiL Testing. SAE Int. J. Engines 2018, 11, 1385–1398. [Google Scholar] [CrossRef]
  26. Dorscheidt, F.; Pischinger, S.; Claßen, J.; Sterlepper, S.; Krysmon, S.; Görgen, M.; Nijs, M.; Straszak, P.; Abdelkader, A.M. Development of a Novel Gasoline Particulate Filter Loading Method Using a Burner Bench. Energies 2021, 14, 4914. [Google Scholar] [CrossRef]
  27. Fathy, H.K.; Filipi, Z.S.; Hagena, J.; Stein, J.L. Review of hardware-in-the-loop simulation and its prospects in the automotive area. In Proceedings of the Modeling and Simulation for Military Applications. Defense and Security Symposium, Orlando, FL, USA, 17 April 2006; Schum, K., Sisti, A.F., Eds.; SPIE: Bellingham, WA, USA, 2006; p. 62280E. [Google Scholar]
  28. Fagcang, H.; Stobart, R.; Steffen, T. A review of component-in-the-loop: Cyber-physical experiments for rapid system development and integration. Adv. Mech. Eng. 2022, 14, 168781322211099. [Google Scholar] [CrossRef]
  29. Lee, S.-Y.; Andert, J.; Neumann, D.; Querel, C.; Scheel, T.; Aktas, S.; Miccio, M.; Schaub, J.; Koetter, M.; Ehrly, M. Hardware-in-the-Loop-Based Virtual Calibration Approach to Meet Real Driving Emissions Requirements; SAE Technical Paper Series; WCX World Congress Experience, 10 April 2018; SAE International: Warrendale, PA, USA, 2018. [Google Scholar]
  30. Lee, S.Y. Virtuelle Kalibrierung von Motorsteuergeräten Mittels Hardware-in-the-Loop Simulationen. Ph.D. Thesis, RWTH Aachen University, Aachen, Germany, 2023. [Google Scholar]
  31. Lee, S.-Y.; Andert, J.; Quérel, C.; Schaub, J.; Kötter, M.; Politsch, D.; Hadj-amor, H. X-in-the-Loop-basierte Kalibrierung: HiL Simulation eines virtuellen Dieselantriebsstrangs. In Simulation und Test 2017; Liebl, J., Beidl, C., Eds.; Springer Fachmedien Wiesbaden: Wiesbaden, Germany, 2018; pp. 53–79. ISBN 978-3-658-20827-1. [Google Scholar]
  32. Lee, S.-Y.; Picerno, M.; Andert, J.; Ehrly, M.; Schaub, J.; Schu, F.; Maquet, R.; Gautier, P. Kalibrierung von Motorsteuergeräten mittels virtueller Methoden. In Experten-Forum Powertrain: Simulation und Test 2020; Liebl, J., Ed.; Springer: Berlin/Heidelberg, Germany, 2021; pp. 105–120. ISBN 978-3-662-63605-3. [Google Scholar]
  33. Picerno, M.; Lee, S.-Y.; Schaub, J.; Ehrly, M.; Millo, F.; Scassa, M.; Andert, J. Co-Simulation of Multi-Domain Engine and its Integrated Control for Transient Driving Cycles. IFAC-PapersOnLine 2020, 53, 13982–13987. [Google Scholar] [CrossRef]
  34. Riccio, A.; Monzani, F.; Landi, M. Towards a Powerful Hardware-in-the-Loop System for Virtual Calibration of an Off-Road Diesel Engine. Energies 2022, 15, 646. [Google Scholar] [CrossRef]
  35. Dorscheidt, F.; Düzgün, M.; Claßen, J.; Krysmon, S.; Pischinger, S.; Görgen, M.; Dönitz, C.; Nijs, M. Hardware-in-the-Loop Based Virtual Emission Calibration for a Gasoline Engine; SAE Technical Paper; SAE International: Warrendale, PA, USA, 2021. [Google Scholar]
  36. Dorfer, F.J. Virtuelle Kalibrierung von Emissionen für künftige Antriebssysteme. In Ladungswechsel und Emissionierung 2018: Im Spannungsfeld von Luftqualität, Klimaschutz und Elektrifizierung 11. MTZ-Fachtagung; Liebl, J., Ed.; Springer Fachmedien; Springer Vieweg: Wiesbaden, Germany, 2019; pp. 200–214. ISBN 9783658249847. [Google Scholar]
  37. Xia, F.; Dorscheidt, F.; Lücke, S.; Andert, J.; Gardini, P.; Scheel, T.; Walter, V.; Tharmakulasingam, J.K.R.; Böhmer, M.; Nijs, M. Experimental Proof-of-Concept of HiL Based Virtual Calibration for a Gasoline Engine with a Three-Way-Catalyst; SAE Technical Paper Series; 2019 JSAE/SAE Powertrains, Fuels and Lubricants, 26 August 2019; SAE International: Warrendale, PA, USA, 2019. [Google Scholar]
  38. Schmidt, H.; Büttner, K.; Prokop, G. Methods for Virtual Validation of Automotive Powertrain Systems in Terms of Vehicle Drivability—A Systematic Literature Review. IEEE Access 2023, 11, 27043–27065. [Google Scholar] [CrossRef]
  39. Walter, S.; Guse, D.; Klein, S.; Meyer, N.; Andert, J.; Schulze, T. Engine-in-the-Loop—Auswirkung der Echtzeitperformance auf die Abbildungsgüte von Fahrzyklen. In Experten-Forum Powertrain: Simulation und Test 2019; Liebl, J., Ed.; Springer Fachmedien Wiesbaden: Wiesbaden, Germany, 2020; pp. 153–171. ISBN 978-3-658-28706-1. [Google Scholar]
  40. Mihalič, F.; Truntič, M.; Hren, A. Hardware-in-the-Loop Simulations: A Historical Overview of Engineering Challenges. Electronics 2022, 11, 2462. [Google Scholar] [CrossRef]
  41. Schmidgal, J. Verfahren zur echtzeitfähigen Simulation dynamischer Emissionsverläufe ausgewählter Schadstoffe von Ottomotoren. Ph.D. Thesis, Universität Kassel, Kassel, Germany, 2010. [Google Scholar]
  42. Dorscheidt, F.; Meli, M.; Claßen, J.; Krysmon, S.; Pischinger, S.; Görgen, M.; Dönitz, C.; Bailly, P.; Nijs, M. Modelling of Gasoline Engine-Out Emissions Using Artificial Neural Networks. In FISITA World Congress 2021—Technical Programme; FISITA World Congress 2021, September 2021; FISITA: Prag, Czech Republic, 2021; ISBN 9781916025929. [Google Scholar]
  43. Picerno, M.; Lee, S.-Y.; Pasternak, M.; Siddareddy, R.; Franken, T.; Mauss, F.; Andert, J. Real-Time Emission Prediction with Detailed Chemistry under Transient Conditions for Hardware-in-the-Loop Simulations. Energies 2022, 15, 261. [Google Scholar] [CrossRef]
  44. Schürholz, K.; Brückner, D.; Abel, D. Modelling the Exhaust Gas Aftertreatment System of a SI Engine Using Artificial Neural Networks. Top. Catal. 2019, 62, 288–295. [Google Scholar] [CrossRef]
  45. Schürholz, K.; Brückner, D.; Gresser, M.; Abel, D. Modeling of the Three-way Catalytic Converter by Recurrent Neural Networks. IFAC-PapersOnLine 2018, 51, 742–747. [Google Scholar] [CrossRef]
  46. Odendall, B. Ein vereinfachtes Modell des Lambda-geregelten Dreiwegekatalysators zum Einsatz in Motor-Steuergeräten und zur On-Board-Diagnose. Ph.D. Thesis, Stuttgart University, Stuttgart, Germany, 2017. [Google Scholar]
  47. Auckenthaler, T.S. Modelling and Control of Three-Way Catalytic Converters; ETH Zurich: Zürich, Switzerland, 2005. [Google Scholar]
  48. Gottdorf, S. Entwicklung eines echtzeitfähigen semi-physikalischen Motormodells zum Betrieb von Ottomotoren und der virtuellen Kalibrierung von Steuergeräten. Ph.D. Thesis, RWTH Aachen University, Aachene, Germany, 2021. [Google Scholar]
  49. Düzgün, M.T.; Dorscheidt, F.; Krysmon, S.; Bailly, P.; Lee, S.-Y.; Dönitz, C.; Pischinger, S. Virtual Multi-Criterial Calibration of Operating Strategies for Hybrid-Electric Powertrains. Vehicles 2023, 5, 1367–1383. [Google Scholar] [CrossRef]
  50. Rathod, D.; Hoffman, M.A.; Onori, S. Determining Three-Way Catalyst Age Using Differential Lambda Signal Response. SAE Int. J. Engines 2017, 10, 1305–1312. [Google Scholar] [CrossRef]
  51. Trampert, S.; Nijs, M.; Huth, T.; Guse, D. Simulation von realen Fahrszenarien am Prüfstand. MTZ Extra 2017, 22, 12–19. [Google Scholar] [CrossRef]
  52. Gerstenberg, J.; Hartlief, H.; Tafel, S. Introducing a method to evaluate RDE demands at the engine test bench. In 16. Internationales Stuttgarter Symposium; Springer: Wiesbaden, Germany, 2016. [Google Scholar] [CrossRef]
  53. Xia, F. Echtzeitfähige eindimensionale Verbrennungsmotor-Prozesssimulation für X-in-the-Loop Anwendungen. Ph.D. Thesis, RWTH Aachen University, Aachen, Germany, 2020. [Google Scholar]
  54. Böhmer, M. Simulation der Abgasemissionen von Hybridfahrzeugen für reale Fahrbedingungen. Ph.D. Thesis, RWTH Aachen University, Aachen, Germany, 2017. [Google Scholar]
  55. Balazs, A.; Böhmer, M.; Baumgarten, H.; Scharf, J.; Thewes, M.; Uhlmann, T.; Yadla, S.K. Simulationsbasierte Entwicklungsmethode für zukünftige Abgasemissionsgesetzgebung. In 8. Emission Control 2016; Atzler, F., Ed.; Real Driving Emissions; Emission Control: Dresden, Germany, 2016; Contribution to a conference proceedings: Emission Control Conference 2016 Dresden. [Google Scholar]
  56. Balazs, A.; Böhmer, M.; Yadla, S.K.; Scharf, J.; Plum, T.; Eisenbarth, M.; Wegener, M.; Andert, J. Der Einfluss von vernetztem und autonomen Fahren auf den optimalen Ottomotorenantriebstrang. In 10. Emission Control 2019; Atzler, F., Ed.; Real Driving Emissions; Emission Control: Dresden, Germany, 2019; Contribution to a conference proceedings: Emission Control Conference 2019 Dresden. [Google Scholar]
  57. Baumgarten, H.; Scharf, J.; Thewes, M.; Uhlmann, T.; Balazs, A.; Böhmer, M. Simulationsbasierte Entwicklungsmethode für zukünftige Abgasemissionsgesetzgebung. In 37. Internationales Wiener Motorensymposium; Internationales Wiener Motorensymposium, Wien, 28–29 April 2016; Lenz, H.P., Geringer, B., Eds.; Springer Vieweg: Wiesbaden, Germany, 2016. [Google Scholar]
  58. Morcinkowski, B.; Adomeit, P.; Mally, M.; Esposito, S.; Walter, V.; Yadla, S.K. Emissionsvorhersage in der Entwicklung ottomotorischer EU7-Antriebe. In Experten-Forum Powertrain: Ladungswechsel und Emissionierung 2019: Moderne Antriebe—Emissionsarm, Elektrifiziert und Variabel; Liebl, J., Ed.; Springer Fachmedien Wiesbaden: Wiesbaden, Germany; Springer Vieweg: Wiesbaden, Germany, 2020; ISBN 9783658287092. [Google Scholar]
  59. Brand, P.; Wang, Y.; Grizzle, J.W. Dynamic modeling of a three-way catalyst for SI engine exhaust emission control. IEEE Trans. Contr. Syst. Technol. 2000, 8, 767–776. [Google Scholar] [CrossRef]
  60. Fiengo, G.; Grizzle, J.W.; Cook, J.A.; Karnik, A.Y. Dual-UEGO active catalyst control for emissions reduction: Design and experimental validation. IEEE Trans. Contr. Syst. Technol. 2005, 13, 722–736. [Google Scholar] [CrossRef]
  61. Nebel, M. Entwicklung einer virtuellen Streckenbeschreibung einer Verbrennungskraftmaschine für Aufgaben der Applikation. Ph.D. Thesis, Technischen Universität Graz, Graz, Austria, 2010. [Google Scholar]
  62. Platner, S.; Kordon, M.; Fakiolas, E.; Atzler, H. Modellbasierte Serienkalibrierung—der effiziente Weg für Variantenentwicklung. MTZ—Mot. Z. 2013, 74, 754–761. [Google Scholar] [CrossRef]
  63. Görgen, M.; Nijs, M.; Thewes, M.; Balazs, A.; Yadla, S.K.; Scharf, J.; Uhlmann, T.; Claßen, J.; Dorscheidt, F.; Krysmon, S.; et al. Holistic Hybrid RDE Calibration Methodology for EU7. In 8. Internationalen Motorenkongress Baden Baden; Springer Fachmedien Wiesbaden: Baden-Baden, Germany, 2021. [Google Scholar]
Figure 1. Schematic overview of the principal of the parallelization taking into account an OK system and a nOK system, considering the failure patterns of an aged TWC and an aged HEGO sensor.
Applsci 14 01245 g001
Figure 2. OBD calibration and verification—reference project timeline and required resources for both conventional and HiL-based methods.
Applsci 14 01245 g002
Figure 3. Schematic overview of the set-up of the real-time co-simulation platform including the closed-loop simulation environment.
Applsci 14 01245 g003
Figure 4. Schematic flow diagram of the individual stages for TWC and HEGO diagnosis.
Applsci 14 01245 g004
Figure 5. Comparison of WLTC HiL and chassis dynamometer measurement—Selection of physical release conditions for the parallelization, including applicable enabling thresholds. (a) Lambda upstream TWC λ U E G O ; (b) coolant temperature T C o o l a n t ; (c) exhaust gas mass flow integral m E x h ; (d) exhaust gas temperature T E x h ; (e) exhaust mass flow m ˙ E x h ; (f) engine speed n E n g ; (g) parallelization release; (h) vehicle speed v V e h .
Applsci 14 01245 g005
Figure 6. Comparison of HiL and chassis dynamometer measurement—Diagnostic run of the parallelization for an OK system at m ˙ E x h = 90 k g h and T T W C = 700   ° C .
Applsci 14 01245 g006
Figure 7. Comparison of mappings performed on the HiL and on the vehicle—OSC (a) and HEGO latency (b) results over the entire relevant exhaust gas mass flow range for an OK and a nOK system for both TWC and HEGO sensors.
Applsci 14 01245 g007
Figure 8. Comparison of HiL and chassis dynamometer measurement—Diagnostic run of the parallelization for a nOK system with an aged TWC at m ˙ E x h = 90 k g h and T T W C = 700   ° C .
Applsci 14 01245 g008
Figure 9. Comparison of HiL and chassis dynamometer measurement—Diagnostic run of the parallelization for a nOK system with an aged HEGO sensor at m ˙ E x h = 90 k g h and T T W C = 700   ° C .
Applsci 14 01245 g009
Figure 10. HiL-based failure path validation (MILing/Healing).
Applsci 14 01245 g010
Figure 11. Comparison of WLTC HiL and chassis dynamometer measurement for an OK system—Tailpipe emissions NOx, CO and HC (cumulated).
Applsci 14 01245 g011
Figure 12. Comparison of WLTC HiL and chassis dynamometer measurement for an OK system (between 760 s and 950 s)—Tailpipe emissions NOx, CO and HC (mass flow).
Applsci 14 01245 g012
Figure 13. Comparison of WLTC HiL and chassis dynamometer measurement for a nOK system (aged HEGO sensor)—Tailpipe emissions NOx (cumulated).
Applsci 14 01245 g013
Figure 14. Total simulated and measured NOx, CO and HC emission results for an OK and a nOK (aged HEGO sensor) system in relation to the EU6d legal limit.
Applsci 14 01245 g014
Table 1. Engine specifications.
Displacement>1.5 L
Engine architecture4 cylinders in-line
Number of valves per cylinder4
Boosting systemTwin-scroll turbo
Max. power>160 kW @ 5500 min−1
Max. torque>280 Nm @ 2250 min−1
Variable valve liftIntake side
Variable valve timingIntake and exhaust side
Table 2. TWC specifications.
Number of bricks2
Total TWC volume1.7 L
Position in the vehicleClose-coupled
Ageing statusOK TWC: 2500 km (stabilized)
nOK TWC: 160.000 km (borderline aged)
Table 3. Reference vehicle specifications.
VehicleD-segment
Transmission8-speed AT
Wheel driveFWD
Total vehicle weight including payload>1500 kg
Disclaimer/Publisher’s Note: The statements, opinions and data contained in all publications are solely those of the individual author(s) and contributor(s) and not of MDPI and/or the editor(s). MDPI and/or the editor(s) disclaim responsibility for any injury to people or property resulting from any ideas, methods, instructions or products referred to in the content.

