Article

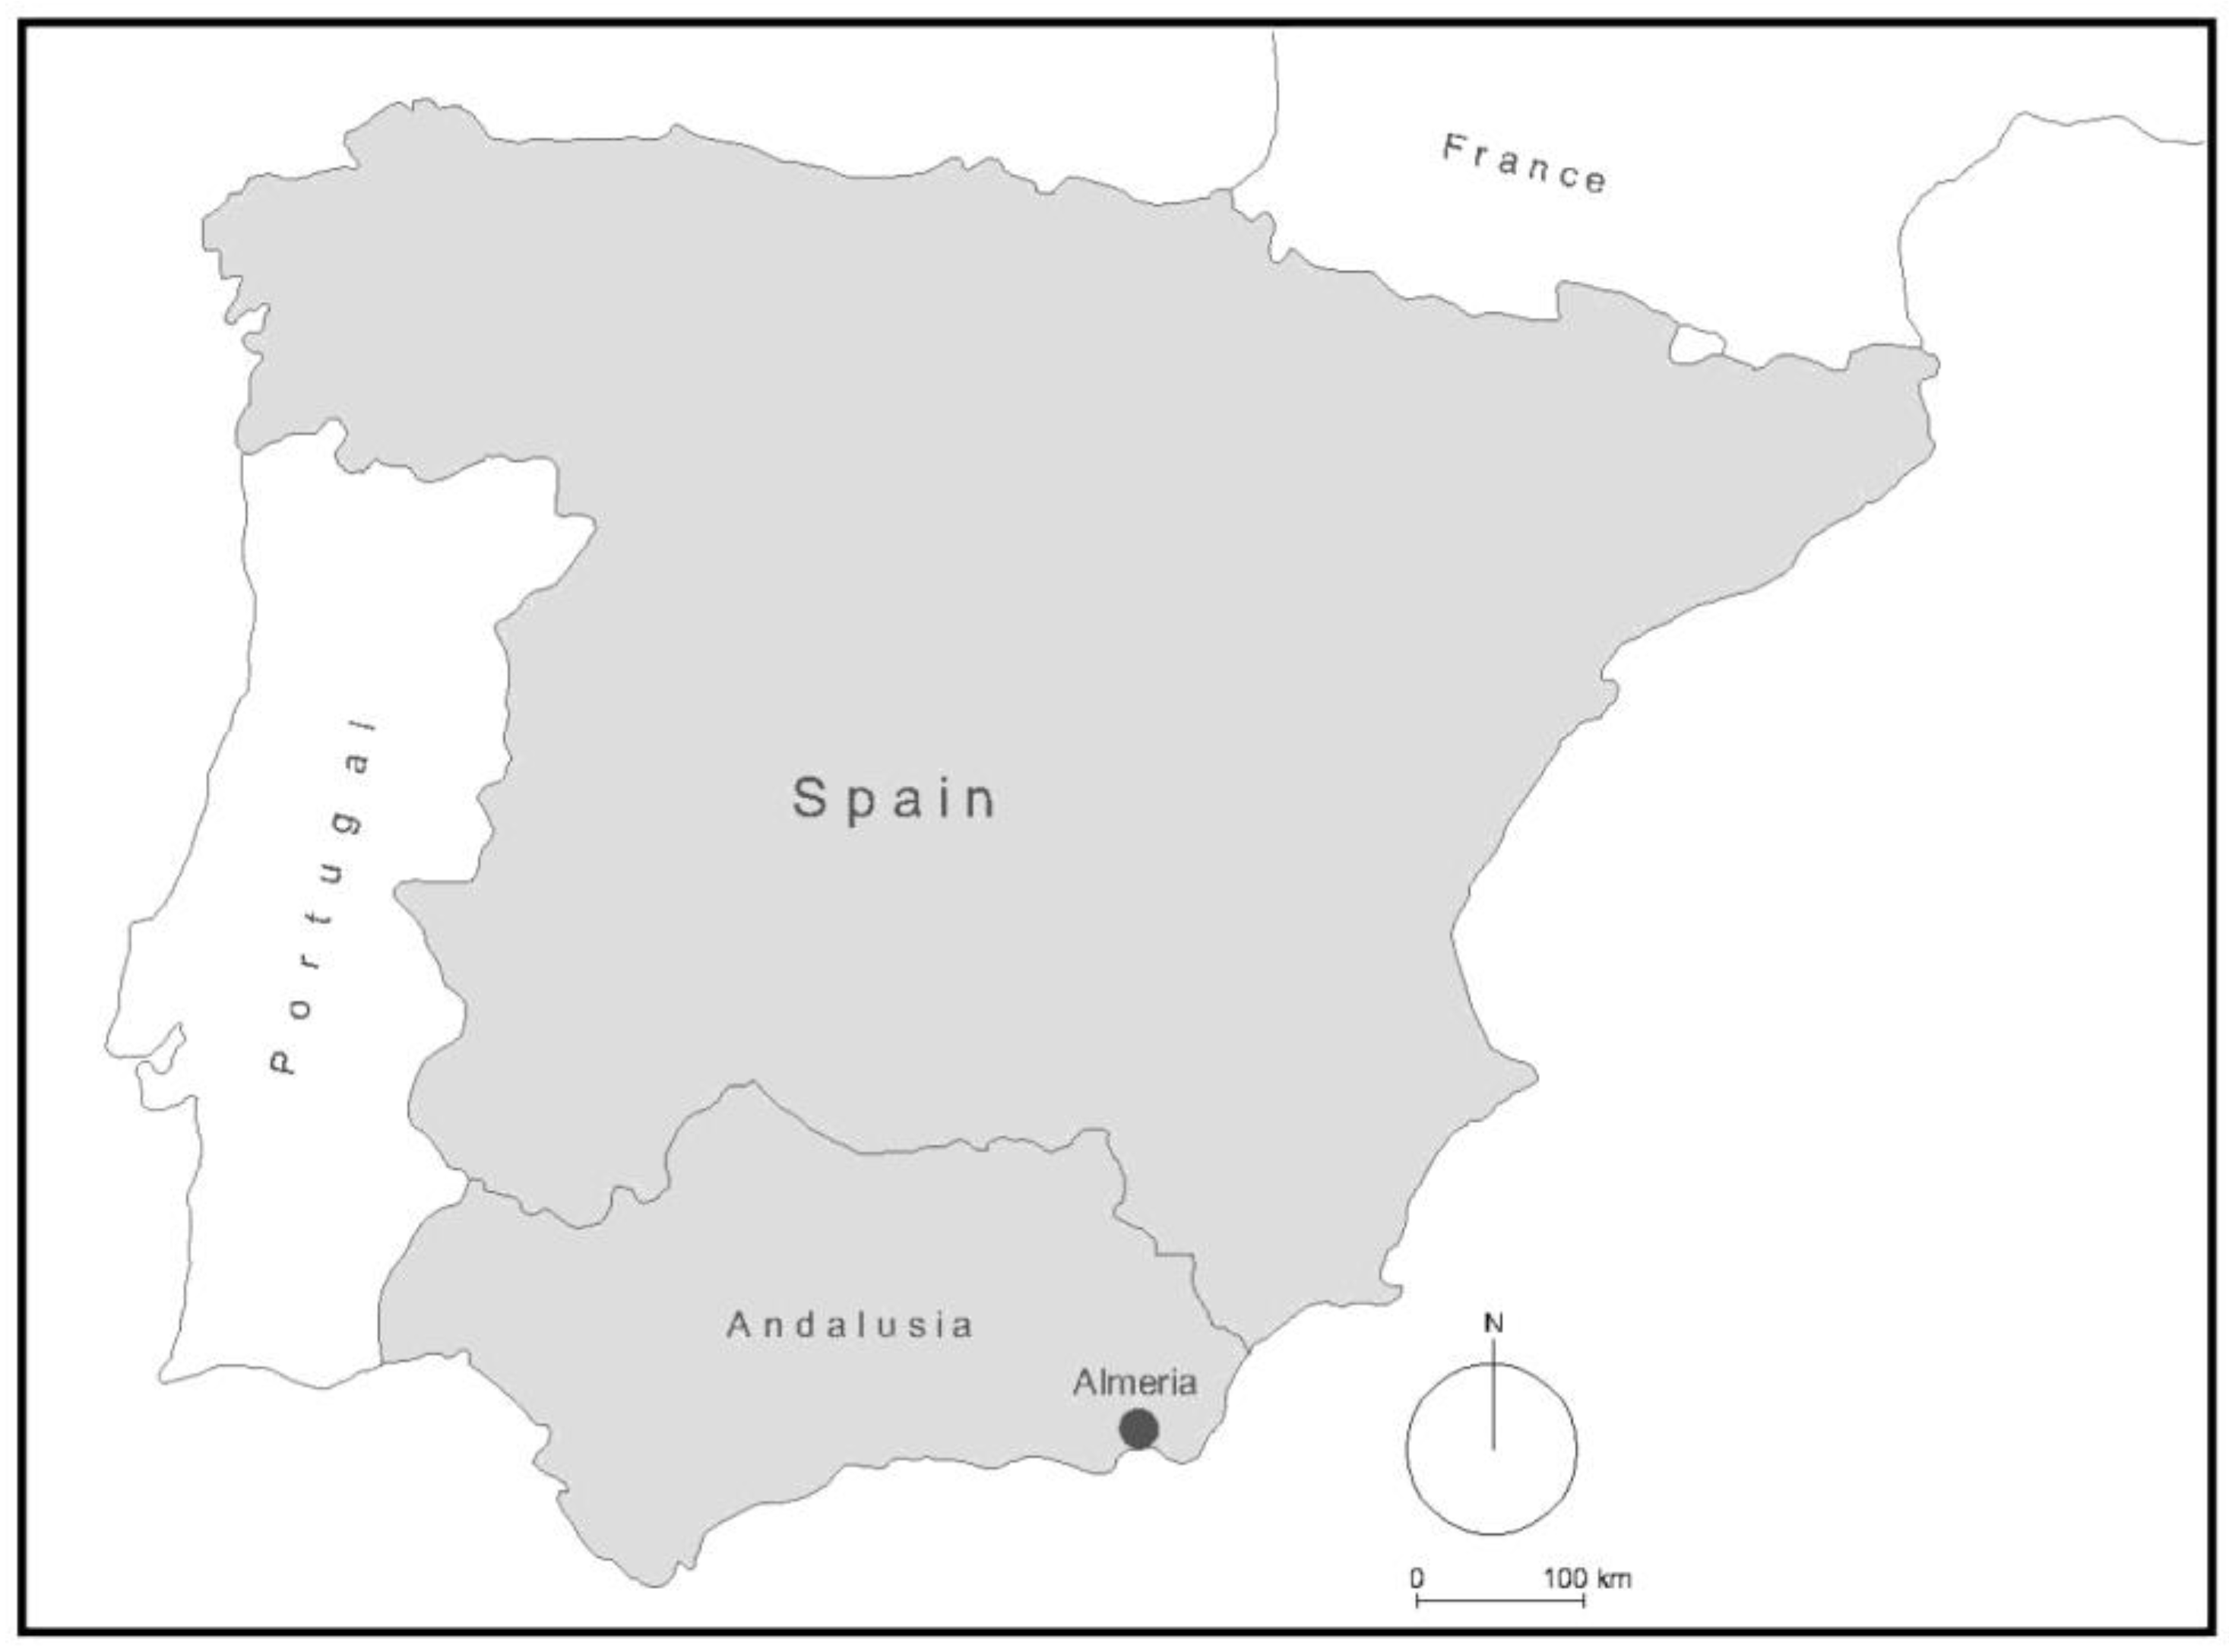
Recovering Sustainable Mobility after COVID-19: The Case of Almeria (Spain)

by
Francisco Javier Garrido-Jiménez
1,*,
María I. Rodríguez-Rojas
2 and
Manuel Ricardo Vallecillos-Siles
3
1
Almeria City Planning Board—Department of Engineering, University of Almeria, 04120 Almeria, Spain
2
Department of Urban and Regional Planning, Higher School of Civil Engineering, University of Granada, 18071 Granada, Spain
3
City of Almeria Sustainability Area—Department of Economics and Business, University of Almeria, 04120 Almeria, Spain
*
Author to whom correspondence should be addressed.
Appl. Sci. 2024, 14(3), 1258; https://doi.org/10.3390/app14031258
Submission received: 15 December 2023 / Revised: 28 January 2024 / Accepted: 1 February 2024 / Published: 2 February 2024
(This article belongs to the Section Energy Science and Technology)

Abstract

:
The COVID-19 pandemic brought about a significant change in mobility habits within cities, leading to a significant decrease in the use of collective urban transport in many countries that has been only partially and unevenly reversed. In this context, many cities are analyzing what factors are hindering this recovery process to design actions to promote sustainable mobility. Thus, this study, carried out in the city of Almeria (Spain), tried to analyze whether the main operating variables of the municipal bus network (frequency, average vehicle occupancy, the length of the lines, urban or suburban character, circularity, nodality, and intermodality) have an impact on the annual number of users recovered in 2022 compared to 2019. Although a strong statistical correlation between variables was not observed, the overall results show that the lines that have recovered the most users on average are suburban lines, as well as the nodal lines that serve key centroids such as the university, highlighting that the dependence of users on public transport might be the most important determinant in the recovery process, more than other variables representative of the service’s intrinsic quality such as frequency or average vehicle occupancy. This result shows the importance of facilitating public transport to those who lack alternatives, as well as the convenience of restrictions on less sustainable transportation alternatives for the prompt recovery of the space lost by urban public transportation.

1. Introduction

1.1. Context

In 2017, the United Nations established 17 sustainable development goals to achieve a more sustainable and peaceful world by 2030. In the specific case of public transport, target 11.2 was to provide access to safe, affordable, accessible, and sustainable transport systems for all. However, the starting point for this common objective is not the same in all regions, since urban public transport (UPT) has very different characteristics and level of use depending on many factors, among which socioeconomic ones stand out. For example, according to comparative studies carried out with data from the International Association for Public Transport, cities in Western Europe, the United States, and Oceania have UPT systems with better environmental and social performance, whilst developed Asian countries have more efficient services from an economic point of view due to the better level of vehicle occupancy and intermodality. On the other hand, Latin American regions have good public transportation systems from an economic operation perspective, although, as in Africa, transport can be very expensive considering average family incomes [1,2]. However, most studies show the importance of public subsidies for the poorest strata of the population [3].
Among other consequences, the COVID-19 pandemic has jeopardized these objectives of more sustainable urban transport, since most of the collective means of transport have not recovered the number of users prior to the pandemic in many countries. Thus, a global decrease in public transport demand between 16 and 39% remains despite the end of the main restrictions [4]. For example, in Norway, the percentage of recovered users was 83% at the end of 2022, whereas in Australia it was around 60% [5,6]. The main causes might lie in the sustained increase in telecommuting, the persistent perception of contagion risk, the modal change towards other means of transport, and the lack of adaptation of public transport to the new social reality. On the other hand, the decline in UPT demand in developing countries was much smaller, especially among the poorest segments of the population [7]. In this context, public managers in charge of the operation and management of UPT are promoting all kinds of measures to attract both the users who abandoned UPT during the pandemic, and those who, not having been users at any time, may be tempted to use it. However, given the large number of socioeconomic, urban pattern, governance, or quality service variables that influence the attractiveness of UPT, it is not easy to determine which measures might be most effective at this time. Within the broad spectrum of variables involved, this study tried to analyze the correlation between both qualitative and quantitative representative variables of the service operation (frequency, average vehicle occupancy, the length of the lines, urban or suburban route, circularity, nodality, and intermodality), and the average of users recovered by UPT compared to the year prior to the COVID-19 pandemic.
This study was carried out in Almeria, a city of 200,000 inhabitants located in the south of Spain, since its intrinsically complex territory is covered by a municipal bus service of 16 lines which provides a very broad range of values for all the variables analyzed. Although it is difficult to draw conclusions from the analysis of a single city’s transport network, the results obtained are expected to be of great interest to public administrations promoting sustainable urban mobility, since this study only focused on variables intrinsic to public transport, where the undertaking of short-term actions is feasible.
This study is structured as follows. Firstly, a review of the existing literature is carried out, from general aspects such as the impact of the COVID-19 pandemic on UPT to those studies that have analyzed the role of specific variables of the service in this topic. Next, the data collected to perform the study are presented and the correlation obtained between the variables analyzed. Finally, the results are discussed and the most relevant conclusions highlighted.

1.2. Literature Review

Mobility restrictions during the COVID-19 pandemic led to a significant decrease in the number of both long-distance daily trips [8] and those in metropolitan areas [9,10]. This general pattern especially affected the means of collective UPT, such as the bus [11], the metropolitan train [12], or the subway [13], reaching a decrease of around 90% in Italy and France, 85% in Spain, 75% in the United Kingdom, and 70% in Germany [14]. The number of users of urban taxis also had a very significant drop, by 94–96% [15]. Apart from these purely quantitative aspects, the impact of the pandemic on UPT was also qualitative, affecting modal choice [16]. Thus, within the general decline in mobility, a preference for means considered safer in that context, such as traveling on foot, by bicycle, or by private vehicle, could be clearly observed among travelers [17,18]. For example, the decrease in passengers on the subway in New York reached 90% compared to 71% in the bike-sharing service, where the average travel time increased from 13 to 19 min, which shows the attraction of new users [19]. Moreover, during the toughest phase of the pandemic, the private vehicle was the preferred option within motorized transportation [20], even competing with traveling on foot as the main way to move around in countries such as Germany or Italy [21].
The process of returning to normality is also highlighting some significant data, showing mobility patterns somewhat different from those prior to the pandemic [22,23]. The most significant could be that UPT has not recovered the number of daily users prior to the pandemic, with a similar behavior in all collective means of transport [24]. Thus, although some of the infrastructure generated during the pandemic, for example, the bike-lane network, could help return to the path marked before the COVID-19 outbreak [25], many of the advances made in terms of sustainable urban mobility in recent decades are currently at risk [26]. As a whole, the share of trips that UPT lost has translated into an increase in those made on foot, by bicycle, as well as by private vehicle [27,28]. In addition, there are other aspects influencing this change such as the emergence of new alternative means of transport such as electric scooters and bicycles [29].
However, the percentage of UPT users’ decline during the toughest phase of the pandemic, as well as that of recovery in the post-pandemic phase, are influenced by numerous variables affecting both the supply and demand of transport. Among those variables, there are those of a socioeconomic nature, the availability of transportation alternatives, urban patterns, and the quality of the public service [30]. Logically, the impact of the pandemic on public transportation was also strongly affected by governance and regulations emanating from public authorities [31].
Thus, from a socioeconomic perspective, studies have shown that the decline in mobility during the harshest phase of the COVID-19 lock-down was greater in areas with higher income levels [32], linked to a greater ease for telecommuting [33] despite the greater availability of private vehicles [34]. In fact, the biggest shift from UPT to private vehicles has been associated with low-income areas [35], except in those with the highest percentages of captive travelers, i.e., those who do not have alternative means of transportation. This was the case in some regions of India, where no decrease in the use of public transportation was observed during the pandemic [36]. For its part, the recovery of travelers after the first wave of COVID-19 was greater in areas mostly inhabited by blue-collar workers [37].
From an urban pattern point of view, changes in users’ behavior depend on variables such as density or the size of urban settlements, which undoubtedly affect the viability of the shift from UPT to non-motorized means of transport [21]. Urban zoning and the origin and destination of UPT lines have also been shown to be crucial factors in this field. For example, a study on the bus network of the city of A Coruña (Spain) [38] shows that the smallest drops in the number of users during the first phase of the pandemic were those linked to the hospital (79%), the central business district (CBD) (85%), or the train station (83%), while the number of those whose destination was the university or the main mall fell between 98 and 100%. For its part, the recovery in the phase immediately after deconfinement (June 2020) was greater in the mall and the CBD, where around 70% of trips were recovered compared to 2019.
Finally, some variables intrinsic to the design of the lines have also shown their impact on the change in UPC use. For example, in Lisbon, suburban lines were observed to suffer a slighter reduction in users during the first wave of COVID-19 compared to urban ones [39]. The management of the lines’ frequency was also very important during the event. For example, while most European cities reduced the frequency of trips due to the drop in demand, Hong Kong maintained the frequency of the service, thus reducing the average occupancy of vehicles, although this led to a significant economic cost [40].
While studies on the impact of the COVID-19 pandemic on UPT are very abundant, those related to the measures to be taken by transport companies or public managers to recover the market share lost are not as numerous [41]. For example, the importance of increasing the frequency of the lines to avoid a feeling of overcrowding has been pointed out [42], in addition to improving the cleanliness of the vehicles [43,44]. Other variables to recover users would be to improve daily schedules, as well as the intermodality with other means of transport [40]. Naturally, all telematic systems associated with bus operations, such as apps, average vehicle occupancy announcements, etc., favor the attraction of users lost during the pandemic and are also useful to attract new users [45]. Finally, on-demand transportation has also been proposed in some studies as a viable solution to increase the share of UPT in less dense areas [46].
Thus, the present study’s objective was to delve into the latter issue, by analyzing individually the role of the main variables that define an urban bus operating in the process of recovering the users lost during the COVID-19 pandemic [47].

1.3. Methodology Context

Depending on their specific objective and scope, the literature review highlights that the studies on the impact of the COVID-19 pandemic on UPT have used different methods to characterize mobility as well as for the analysis of the results obtained. Thus, to quantify the general traffic, broad-spectrum sources such as Google Mobility or traffic cameras have been used [48,49], whilst in order to measure the number of users and their movements in UPT (especially bus and train), the most common source has been the counting of tickets supplied by public administrations in charge of urban transport, usually the municipalities [38,43,50]. In addition, surveys have allowed researchers to know other aspects such as the motivation, service perception, needs, and intentions of users [51,52]. Regarding the analysis of the relationship between variables, simple or multiple regressions have been performed [53,54], as well as multiple correspondence analysis (MCA) when the relationship between variables is apparently less direct [4,55,56].
Considering the above, as well as the remarkable exploratory nature of this study, in order to analyze the impact of urban bus network characteristics on the recovery of UPT users in the post-pandemic scenario in the city of Almeria, an MCA was performed including both the operating network variables and the evolution of the annual number of users in each bus line during the period 2019–2022. The use of a MCA seemed the most appropriate approach in this study, since it allows the authors to explore to what extent there is a relationship between the variables involved, independently of the statistical significances, which is crucial in studies with small-size samples, as in this case, when only 16 urban bus lines with their operating variables are analyzed.

2. Materials and Methods

As indicated, the main objective of the present study was to analyze whether any of the basic operating design variables of an urban bus network play a significant role in the recovery of users in the post-COVID-19 scenario in the city of Almeria, as an example of a complex medium-sized city. In the analysis, only variables intrinsic to the urban bus operating, both qualitative and quantitative, were considered, discarding other broad-spectrum variables external to the service, which public managers have fewer possibilities to tackle in the short term. To analyze the level of correlation between the variables selected, a two-dimension MCA was performed by using SPSS v.29 and XLSTAT2019 software. In addition, the individual lineal correlation between the operating variables and the percentage of recovered passengers in each bus line in 2022 as compared to 2019 was analyzed. More complex non-lineal or multilinear models were discarded due to the exploratory nature of the study and the limitation of the data, which come only from a medium urban transport service.
The city of Almería, located in the south of Spain, with a population of 199,237 inhabitants (2022), is especially appropriate to carry out this study, due to the diversity of characteristics in the urban bus lines that provide service within the municipality. Thus, the city has a municipal area of 295.51 km2 where there are 17 small urban settlements apart from the main city, which concentrates 84% of the population. Population density reaches 11,922 inhabitants/km2 in the main city (an example of a compact Mediterranean city) and 674 inhabitants/km2 in the municipality as a whole, showing the diversity in the territory occupation pattern. In addition, an international airport, a state-level port for goods and passengers, the main hospital of the region, as well as a public university with approximately 12,000 students are located in the city. The location of the city at a national and regional level is shown in Figure 1.
This diversity results in an intrinsically complex UPT network, which allows the authors of this study to analyze the role of very different operating variables, both qualitative and quantitative, with a wide internal range of values, which is crucial in an exploratory study of this nature. The main city is located at the western end of the municipality, which results in long bus lines towards the small urban settlements located to the east. Thus, the urban bus network of Almeria city consists of 16 lines, whose routes are schematically shown in Figure 2 on Google Earth v.7.3.6.9750:
The evolution in the number of users of the UPT (bus) in the city of Almeria from 2019 to 2022, according to the data provided by the Mobility Area of the City Council, is indicated in Table 1. Only trips on weekdays have been considered, since the particularities during weekends and holidays could bias the results.
As can be observed, during 2020, the COVID-19 pandemic drove half of the users to leave the UPT. In 2022, the last year with partial restrictions on UPT (use of masks), the recovery in the number of users compared to 2019 amounted to 78%, similar to other UPT systems [4,5,6,7]. The evolution in the number of users during the 2019–2022 period, disaggregated at bus line level, is reflected in Figure 3.
As can be observed, three levels of lines according to the number of users can be distinguished. There are seven lines with fewer than 200,000 annual users, eight lines with around 500,000, and one line (L18) with over one million. There is no route pattern explaining the difference in the number of users among lines, even though it is remarkable that L18 connects simultaneously the hospital and the university with the city center.
As indicated, for each bus line, all those variables, both qualitative and quantitative, and intrinsic to the service operation, that the literature has considered relevant were measured during 2022, the last complete year with data available, as well as the percentage of users recovered in 2022 compared to 2019. Thus, the qualitative variables considered were the urban or suburban character of the lines, regarding as suburban those which leave the main urban center (Figure 2); intermodality, where it is analyzed whether the line connects with the intermodal station (railway and interurban bus); nodality, considering nodal those lines that provide service to a strong transport centroid such as the hospital, the university, or the main mall (Figure 2); and, finally, the circular geometry of the line or its absence. The quantitative variables analyzed were the average vehicle occupancy, understood as the relationship between the annual number of users and the service capacity, as well as the frequency and length of the lines. Other variables such as the schedules, the level of vehicle cleaning, and technology support to the line’s operation (apps, etc.) were not considered because they are almost identical in all lines. The data collected for each of these variables are reflected in Table 2.
It should be noted that the variety of characteristics of the UPT lines in the city of Almeria that cover its complex territory allowed the authors of this study to obtain a reasonable sample for all qualitative variables, since 9/16 lines are suburban, 5/16 are intermodal, 10/16 nodal, and 4/16 circular, which is necessary for the consistency of the results obtained.

3. Results

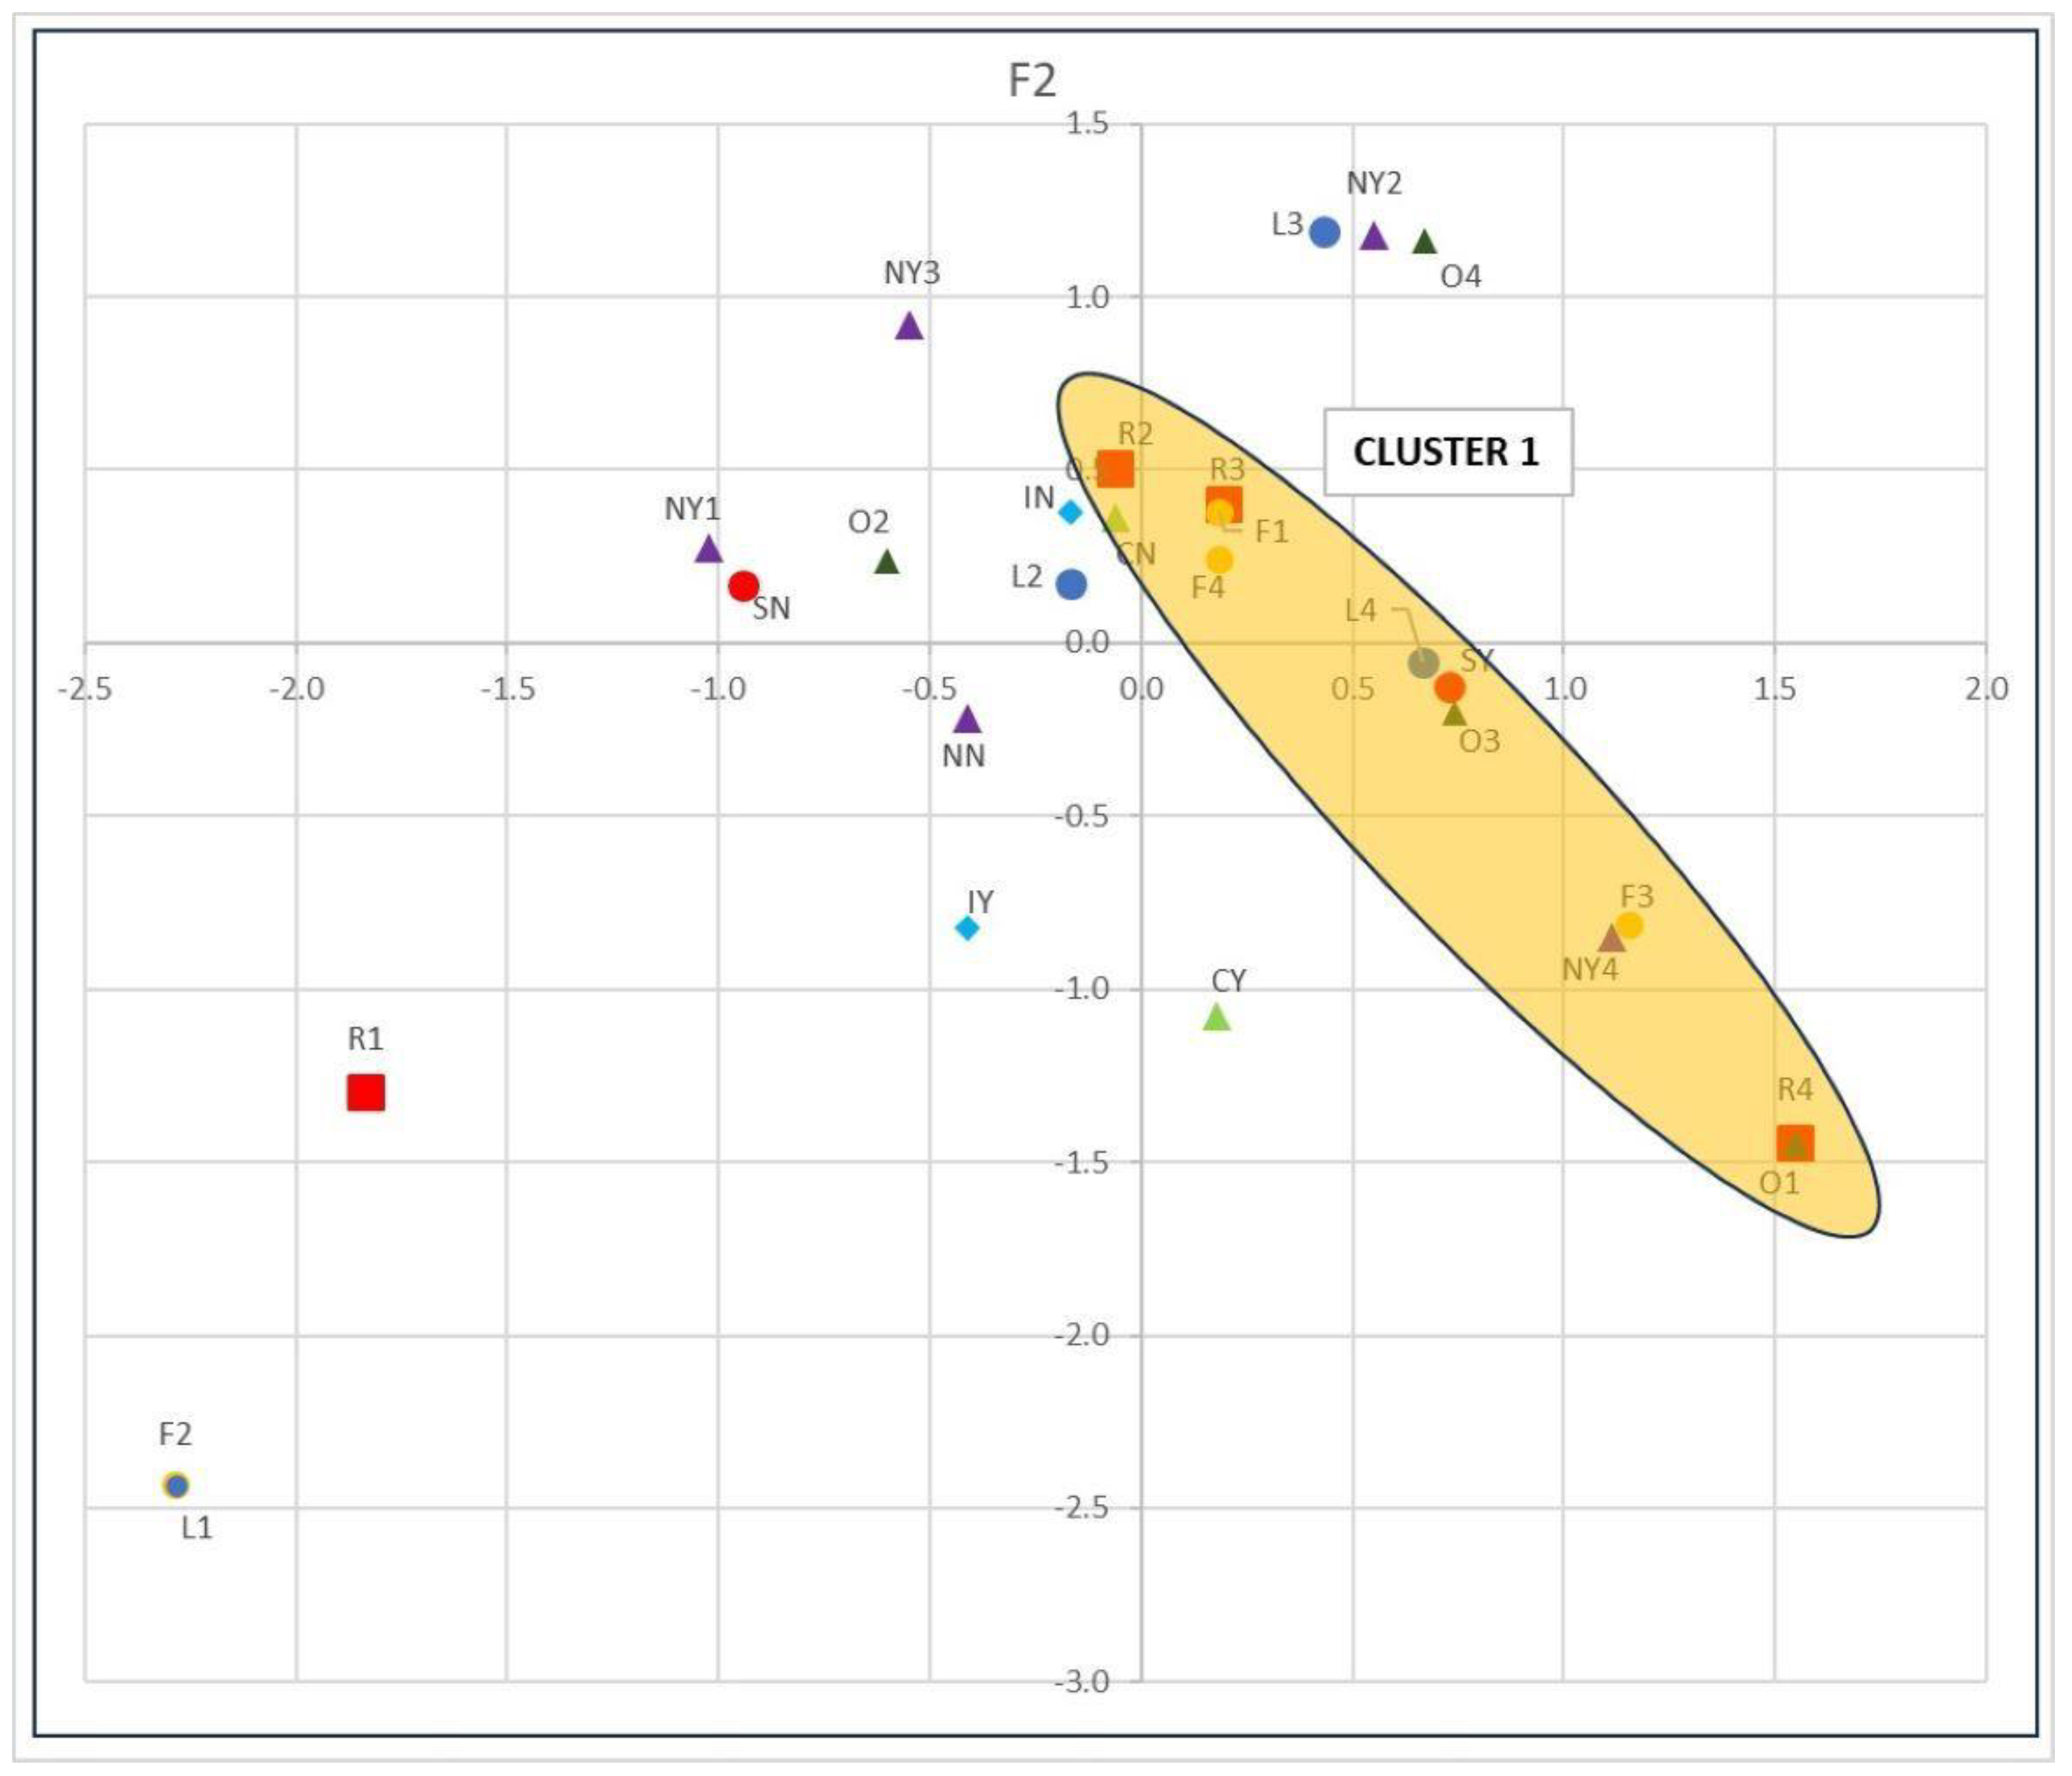
3.1. Multiple Correspondence Analysis

As indicated, due to the exploratory nature of this study, a comprehensive two-dimension MCA was performed to determine the existence or not of a significant correlation between the variables involved, especially among some of the public bus operating variables and the percentage of users recovered by bus lines in 2022 as compared to 2019. The discretization and coding of the variables are shown in Table 3.
Results for both inertia and Cronbach’s alpha confirm that the two-dimension MCA analysis is robust enough for the purpose of this study, considering its limitations, since data come exclusively from a medium-sized urban transport system (Table 4).
As can be observed, the inertia values and Cronbach’s alpha above 0.80 show a good fitting of the variables and categories. The discrimination values for the two dimensions and all the variables considered in this study are indicated in Table 5.
With a global inertia of 87.4% for the two dimensions, Dimension 1 discriminates the variables from the percentage of users recovered, the level of occupancy of the vehicles, and the urban or suburban route of the buses. Dimension 2 does so from the percentage of users recovered, frequency, and nodality. The fact that the level of occupancy discriminates in the two dimensions can make the interpretation of the results more complicated. Figure 4 illustrates the perceptual plot of both dimensions.
As can be seen in Figure 4, the dispersion of the variables does not highlight any robust correlation between the variables as a result of the MCA. By analyzing Cluster 1, and in the specific case of the percentage of users recovered in 2022 compared to 2019 (R), only a weak correlation is found with variables such as frequency (F) and average occupancy of vehicles (O). In fact, there is a relationship between the maximum recovery of users and the lowest occupancy, due to the influence of lines L15 and L19, which are the ones with the lowest average occupancy (19% and 25%, respectively) and the highest percentage of users recovered compared to the pre-pandemic situation (Table 2). The MCA also suggests a good behavior of the lines serving the university (NY4). These results confirm the reliability of the statistical model.

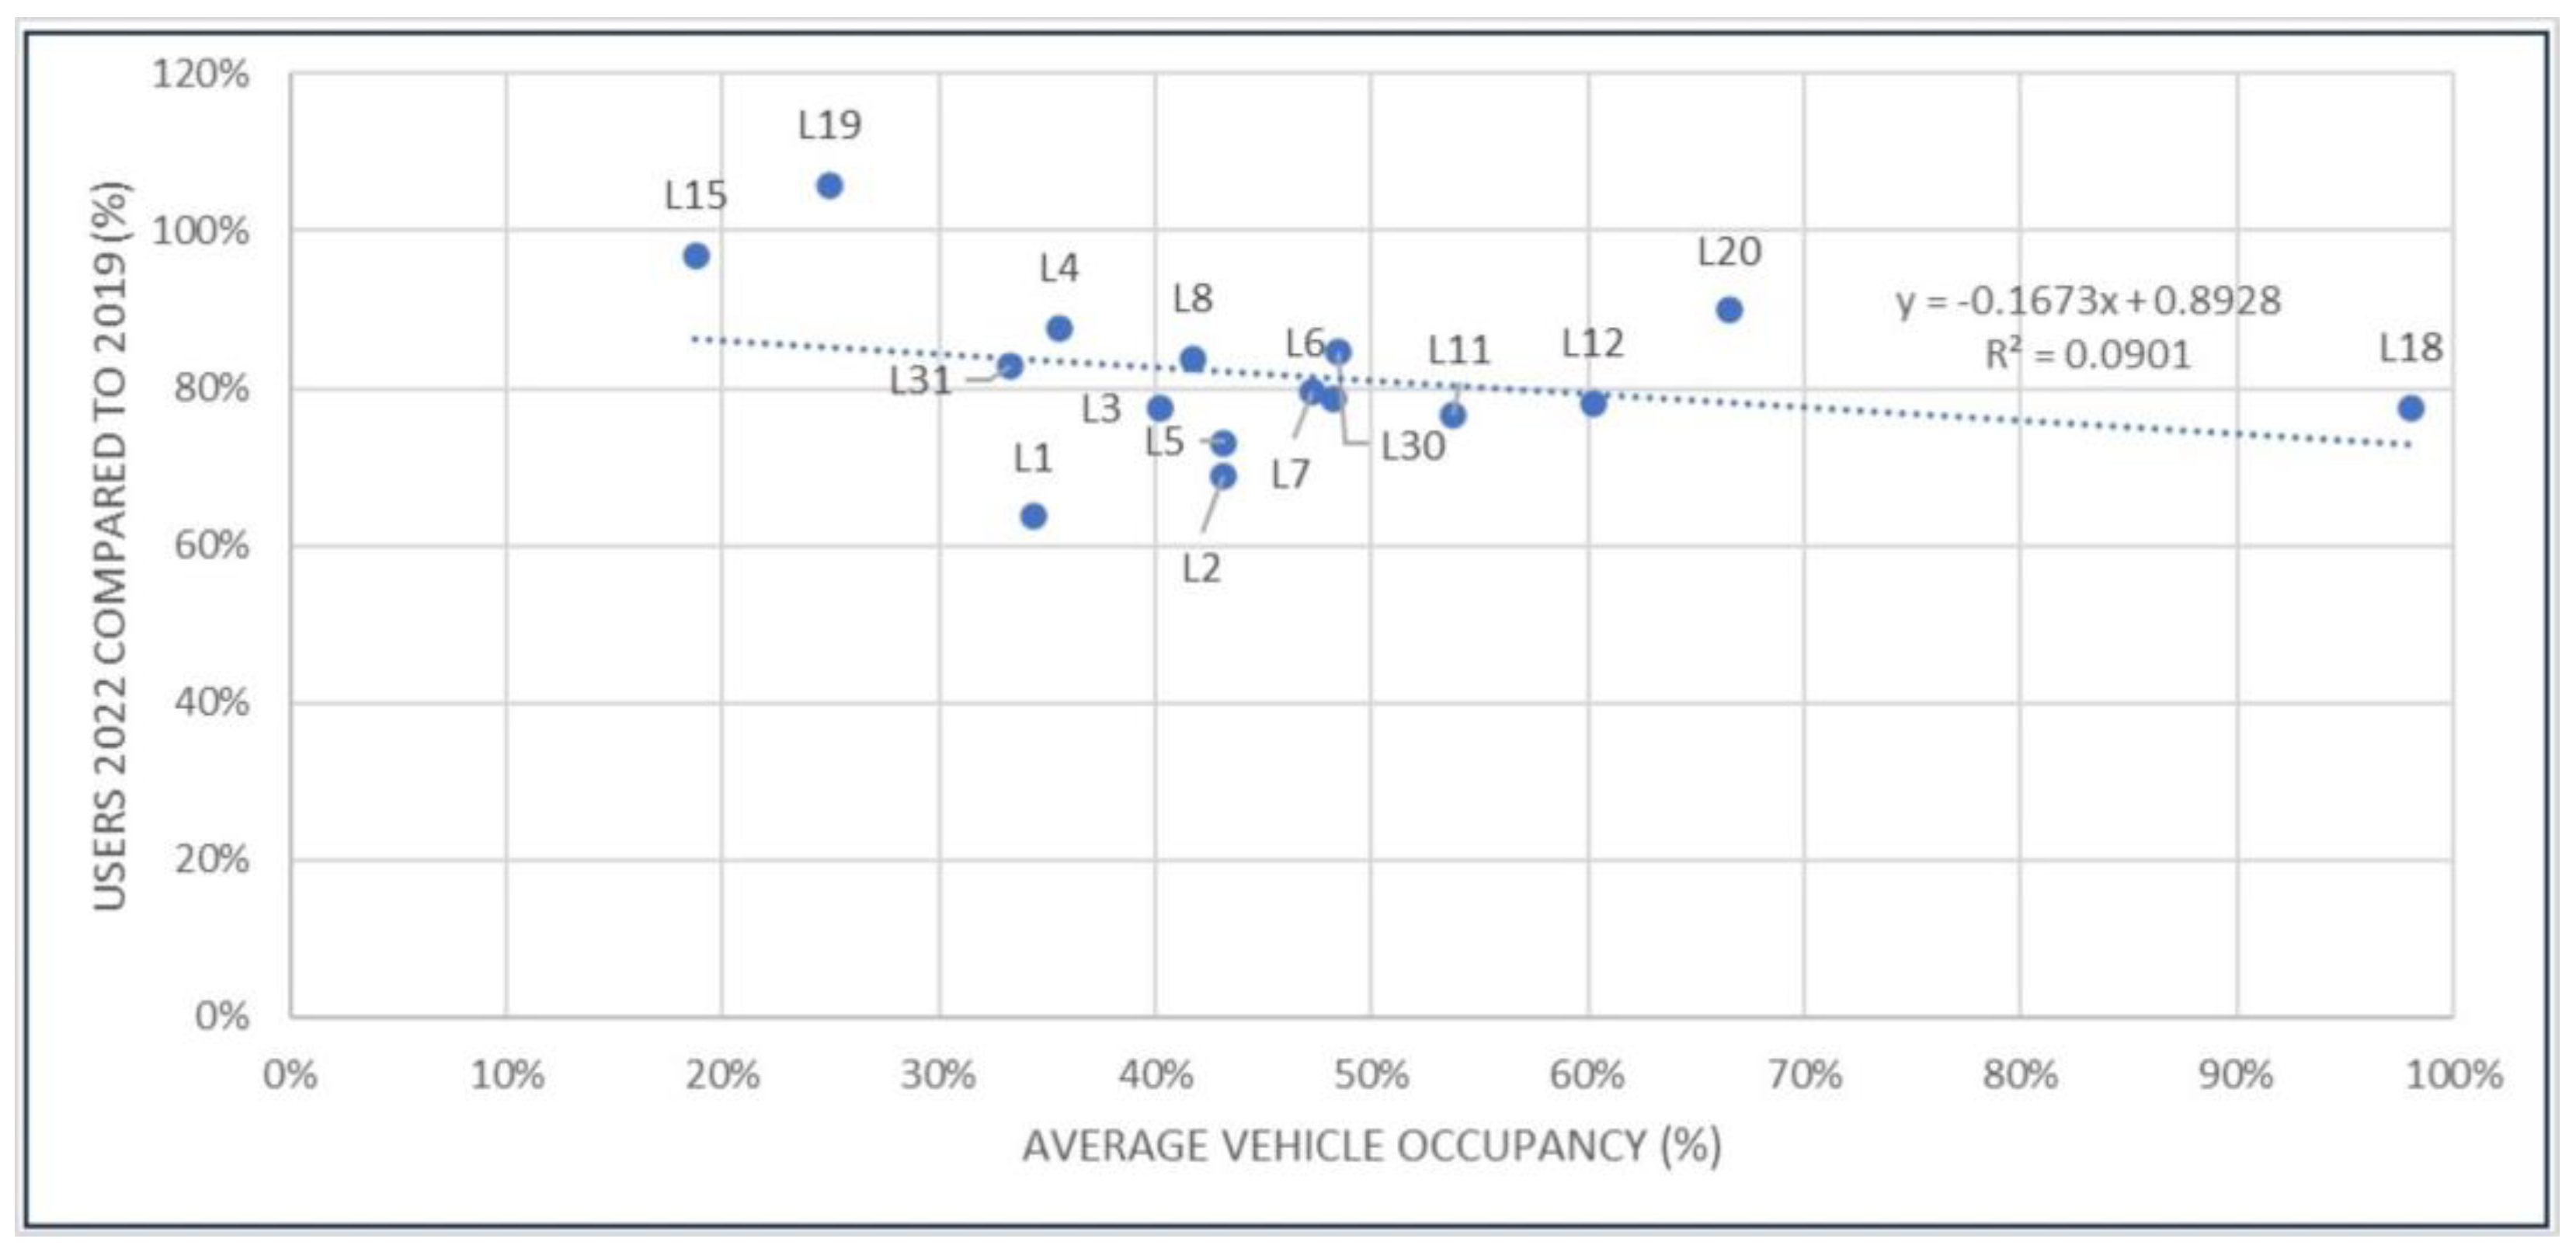
3.2. Average Vehicle Occupancy
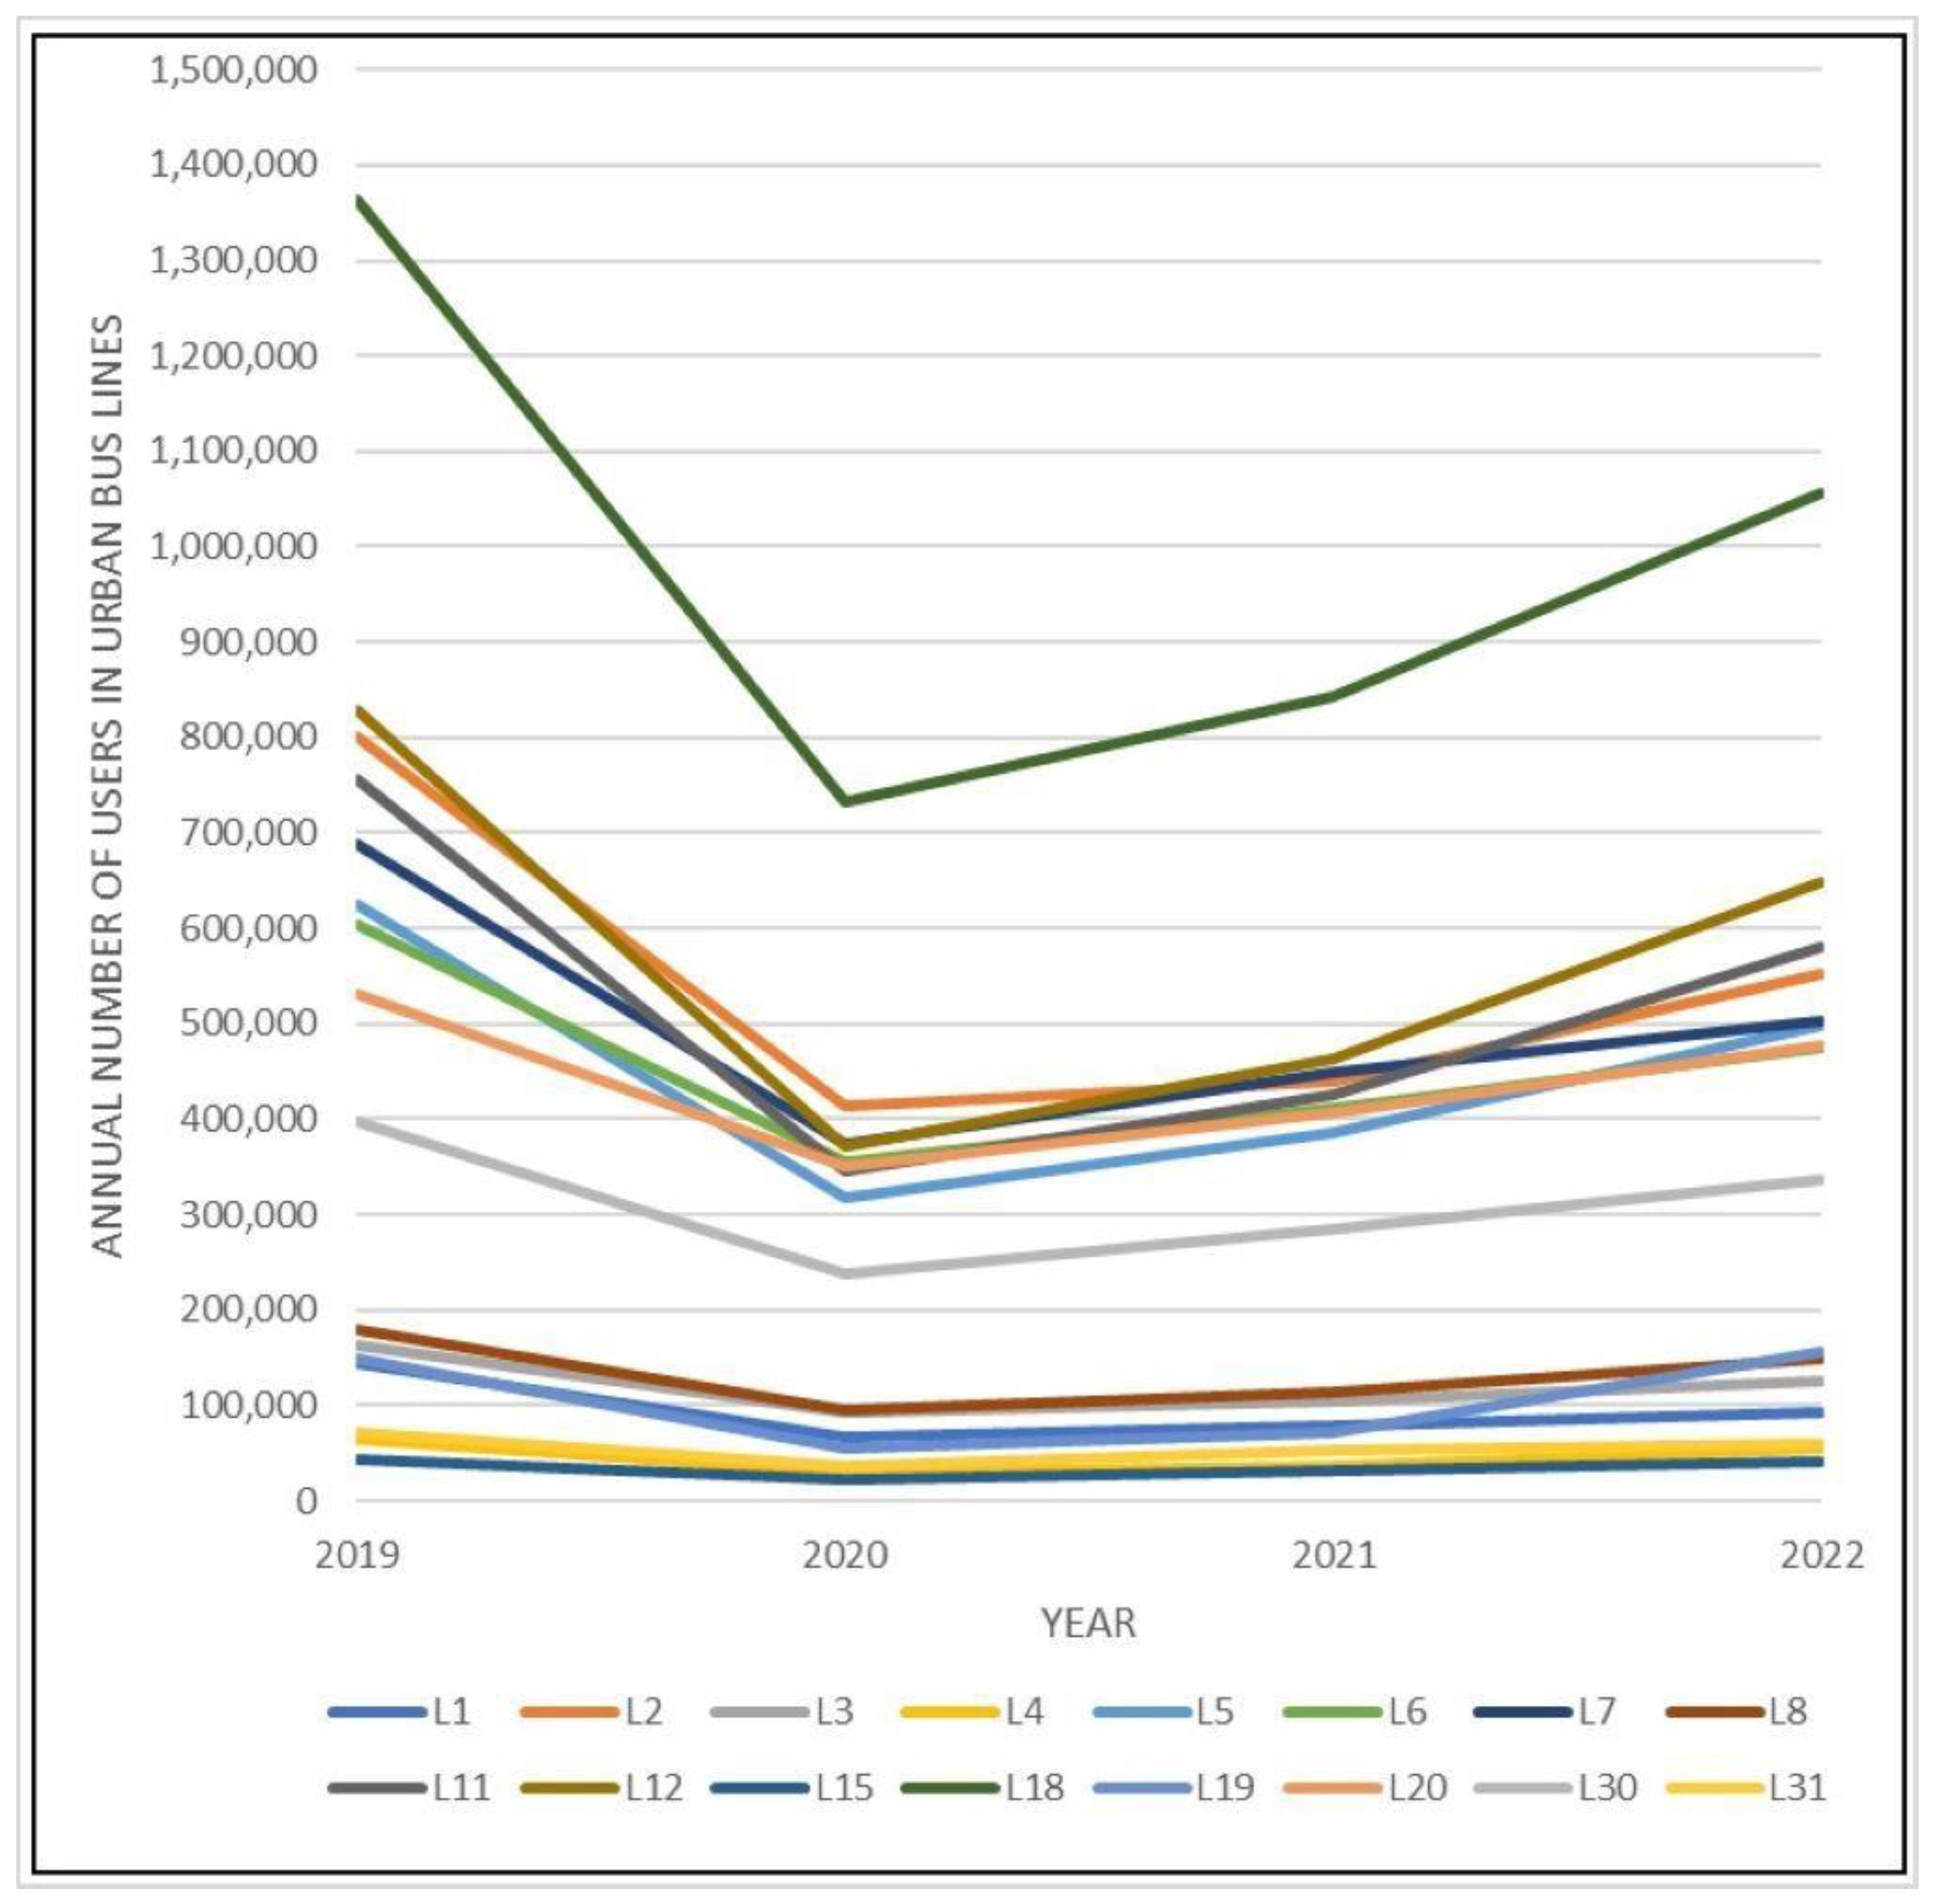
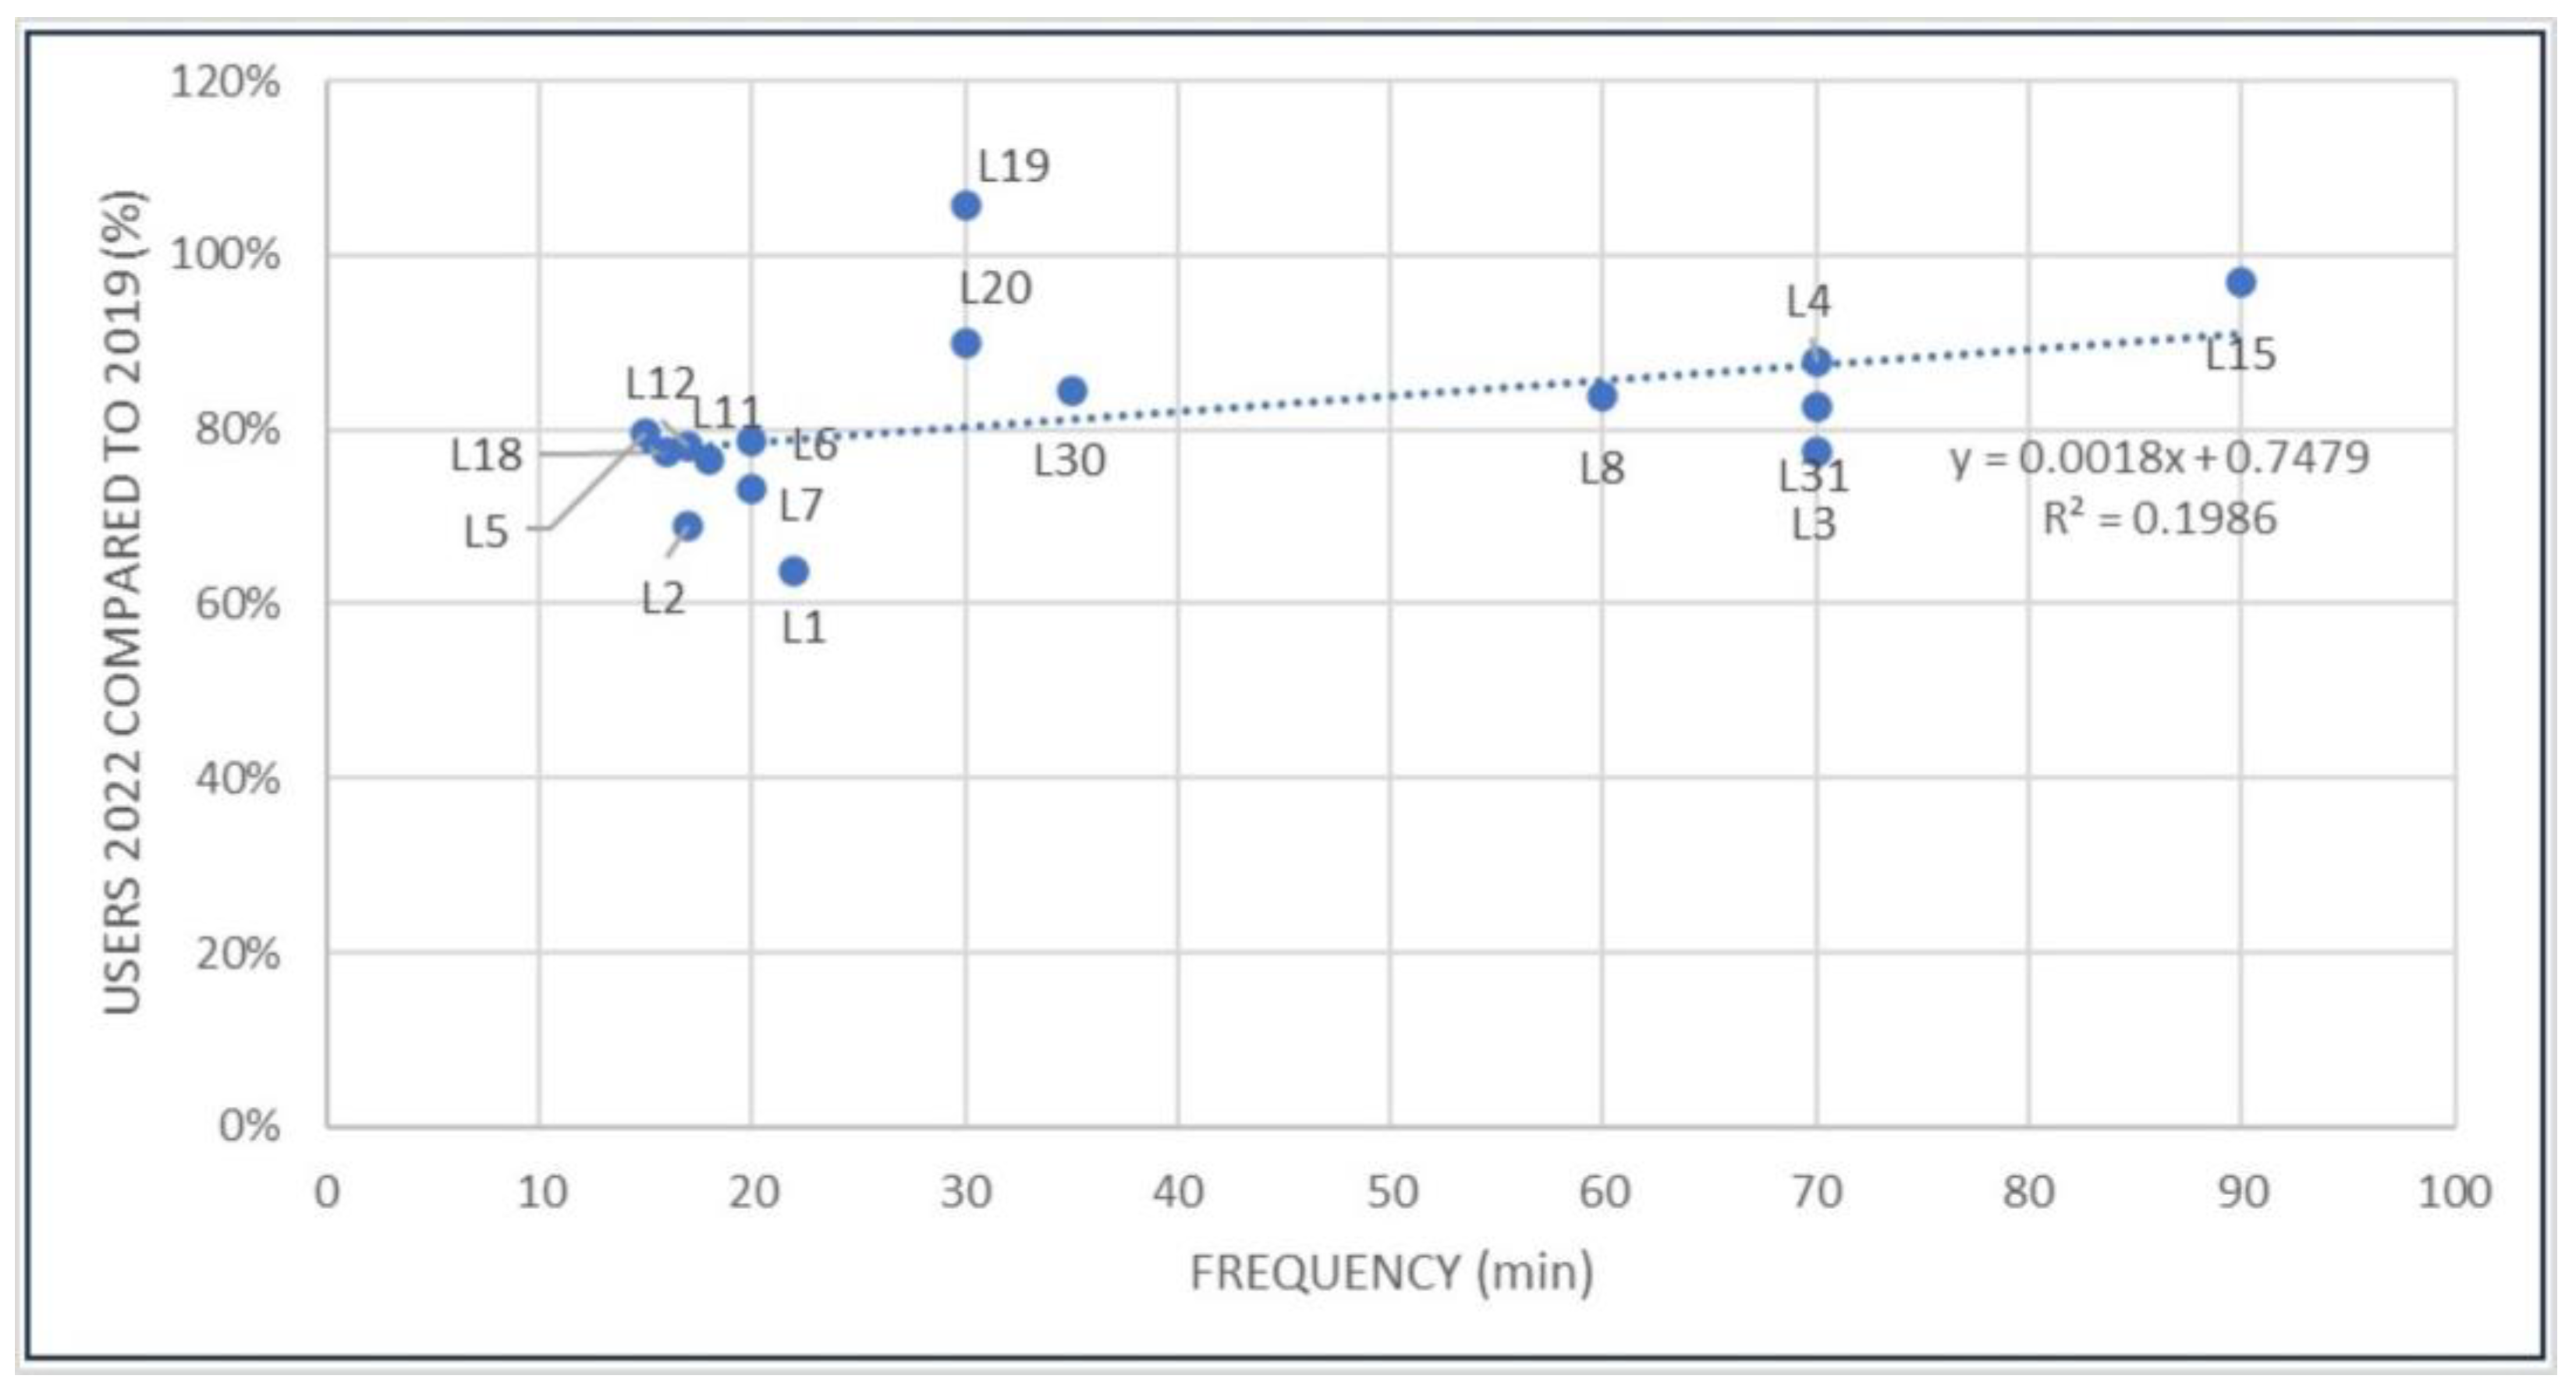
The correlation between the percentage of users recovered in 2022 when compared to 2019 and average vehicle occupancy, the latter estimated as the quotient between the number of users and service supply in each urban bus line, is shown in Figure 5.
As can be observed, there is a negative, albeit very weak, correlation between both variables despite the wide variety in the average occupancy values of the lines, which ranges between 19% for L15, which covers the smaller urban centers of the east of the municipality, and 98% for L18, which connects Costacabana (a small urban center to the east of the main city) with the university and the hospital. Moreover, apart from these extreme values, average occupancy usually ranges between 30% and 70%. Despite the discreet overall correlation value, which is not enough to infer a correlation between the variables, it is remarkable that the two lines with the lowest occupancy, L15 (19%) and L19 (25%), are also the ones with the highest percentage of users recovered, with 97% and 106%, respectively. However, it should be noted that the effective occupancy level of the vehicles is always somewhat lower than represented, since, especially in longer lines, each seat offered can be occupied by different partial users along the same route.

3.3. Frequency

The correlation between the average of users recovered in 2022 compared to the pre-pandemic situation and the frequency of service in the urban bus lines can be seen in Figure 6.
With moderate correlation values, it is observed that, in general, there is a positive but weak relationship between the frequency in minutes of the line and the percentage of users recovered. It should be pointed out that none of the lines with a frequency of less than 25 min, which in theory provides a better service, has reached 80% of recovered users. Instead, with one exception, all the lines with a frequency over 30 min have recovered more than 80% of passengers. In fact, L15, which is the line that has by far the worst frequency (90 min), ranks second in user recovery (97%), with demand levels similar to those prior to the pandemic. L19, which is the only one that in 2022 exceeded the number of users it had in 2019 (city center to the university), has a frequency of 30 min. This can be described as intermediate in the context of UPT in the city of Almeria.

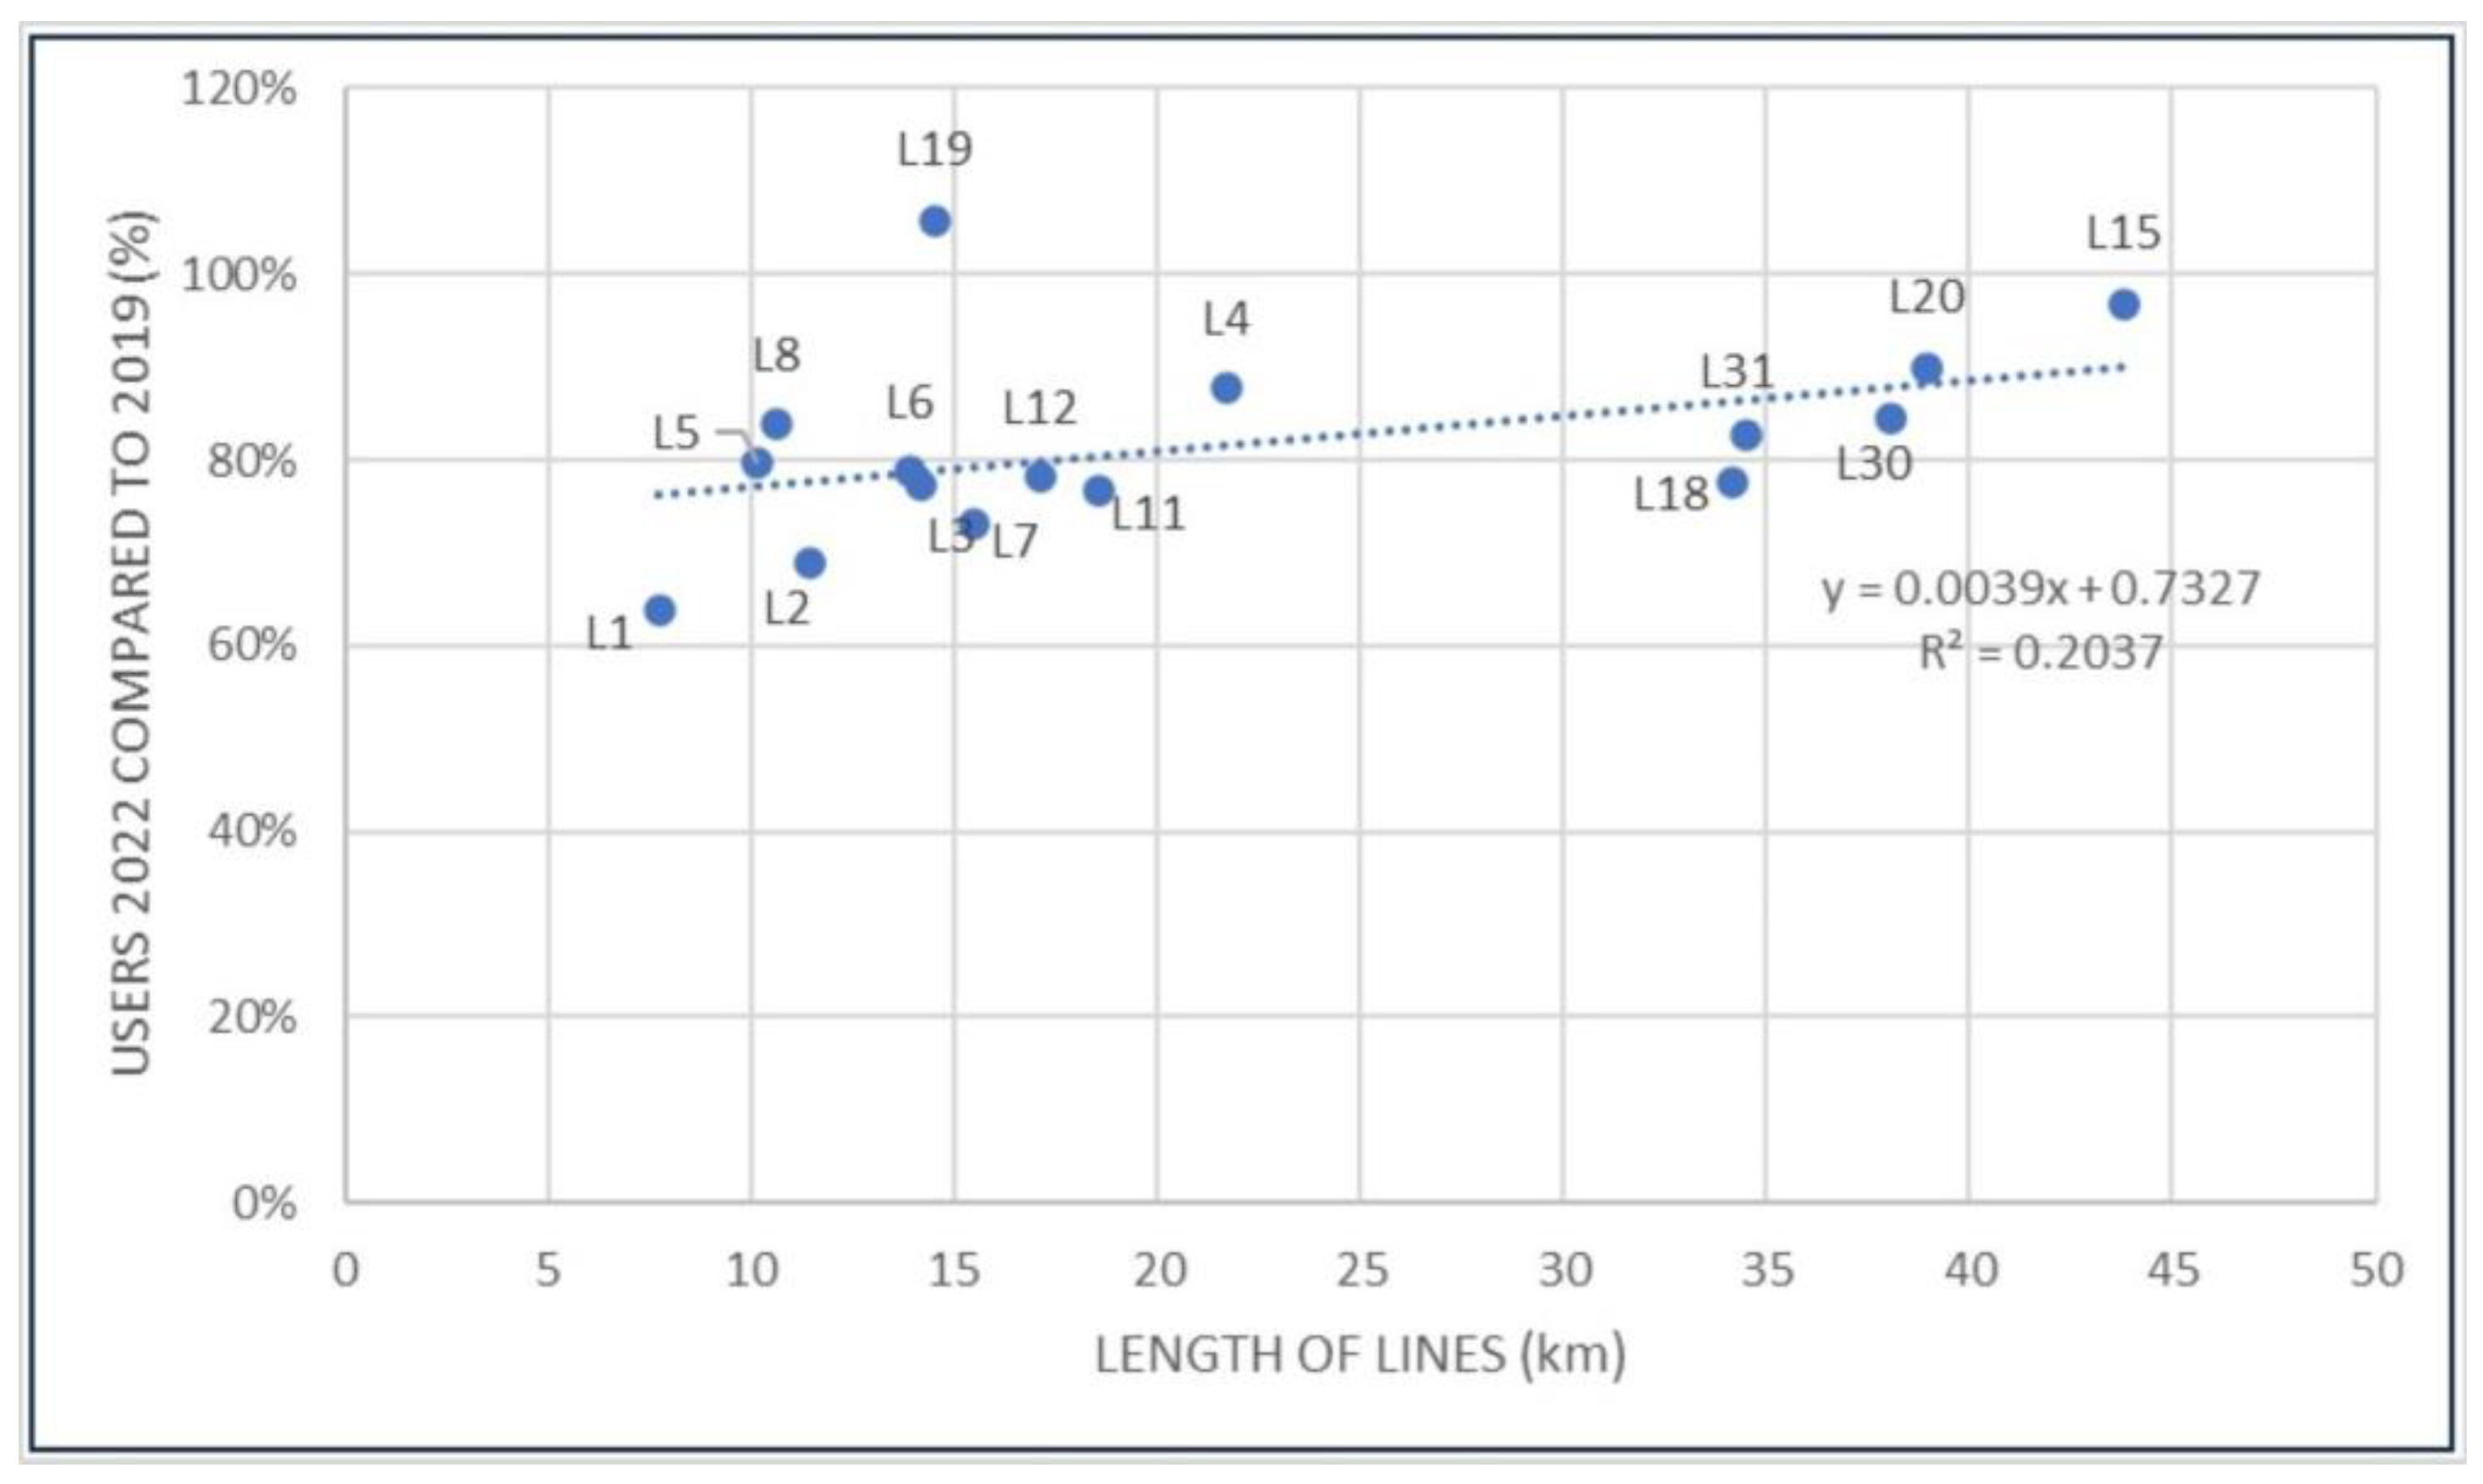
3.4. Length of Bus Line

The correlation between the average of users recovered in 2022 when compared to 2019 and the length of urban bus lines is shown in Figure 7.
In this case, a positive but not very significant correlation between the length of the bus lines and demand recovery can be observed, with a general good behavior of the longest lines. It is noteworthy that the two longest lines (L15 and L20) have the second and third highest percentage of user recovery, with 97% and 90% compared to 2019. It is also significant that the shortest line (L1), serving the historic center, is the one that has recovered the fewest travelers compared to the pre-pandemic situation.

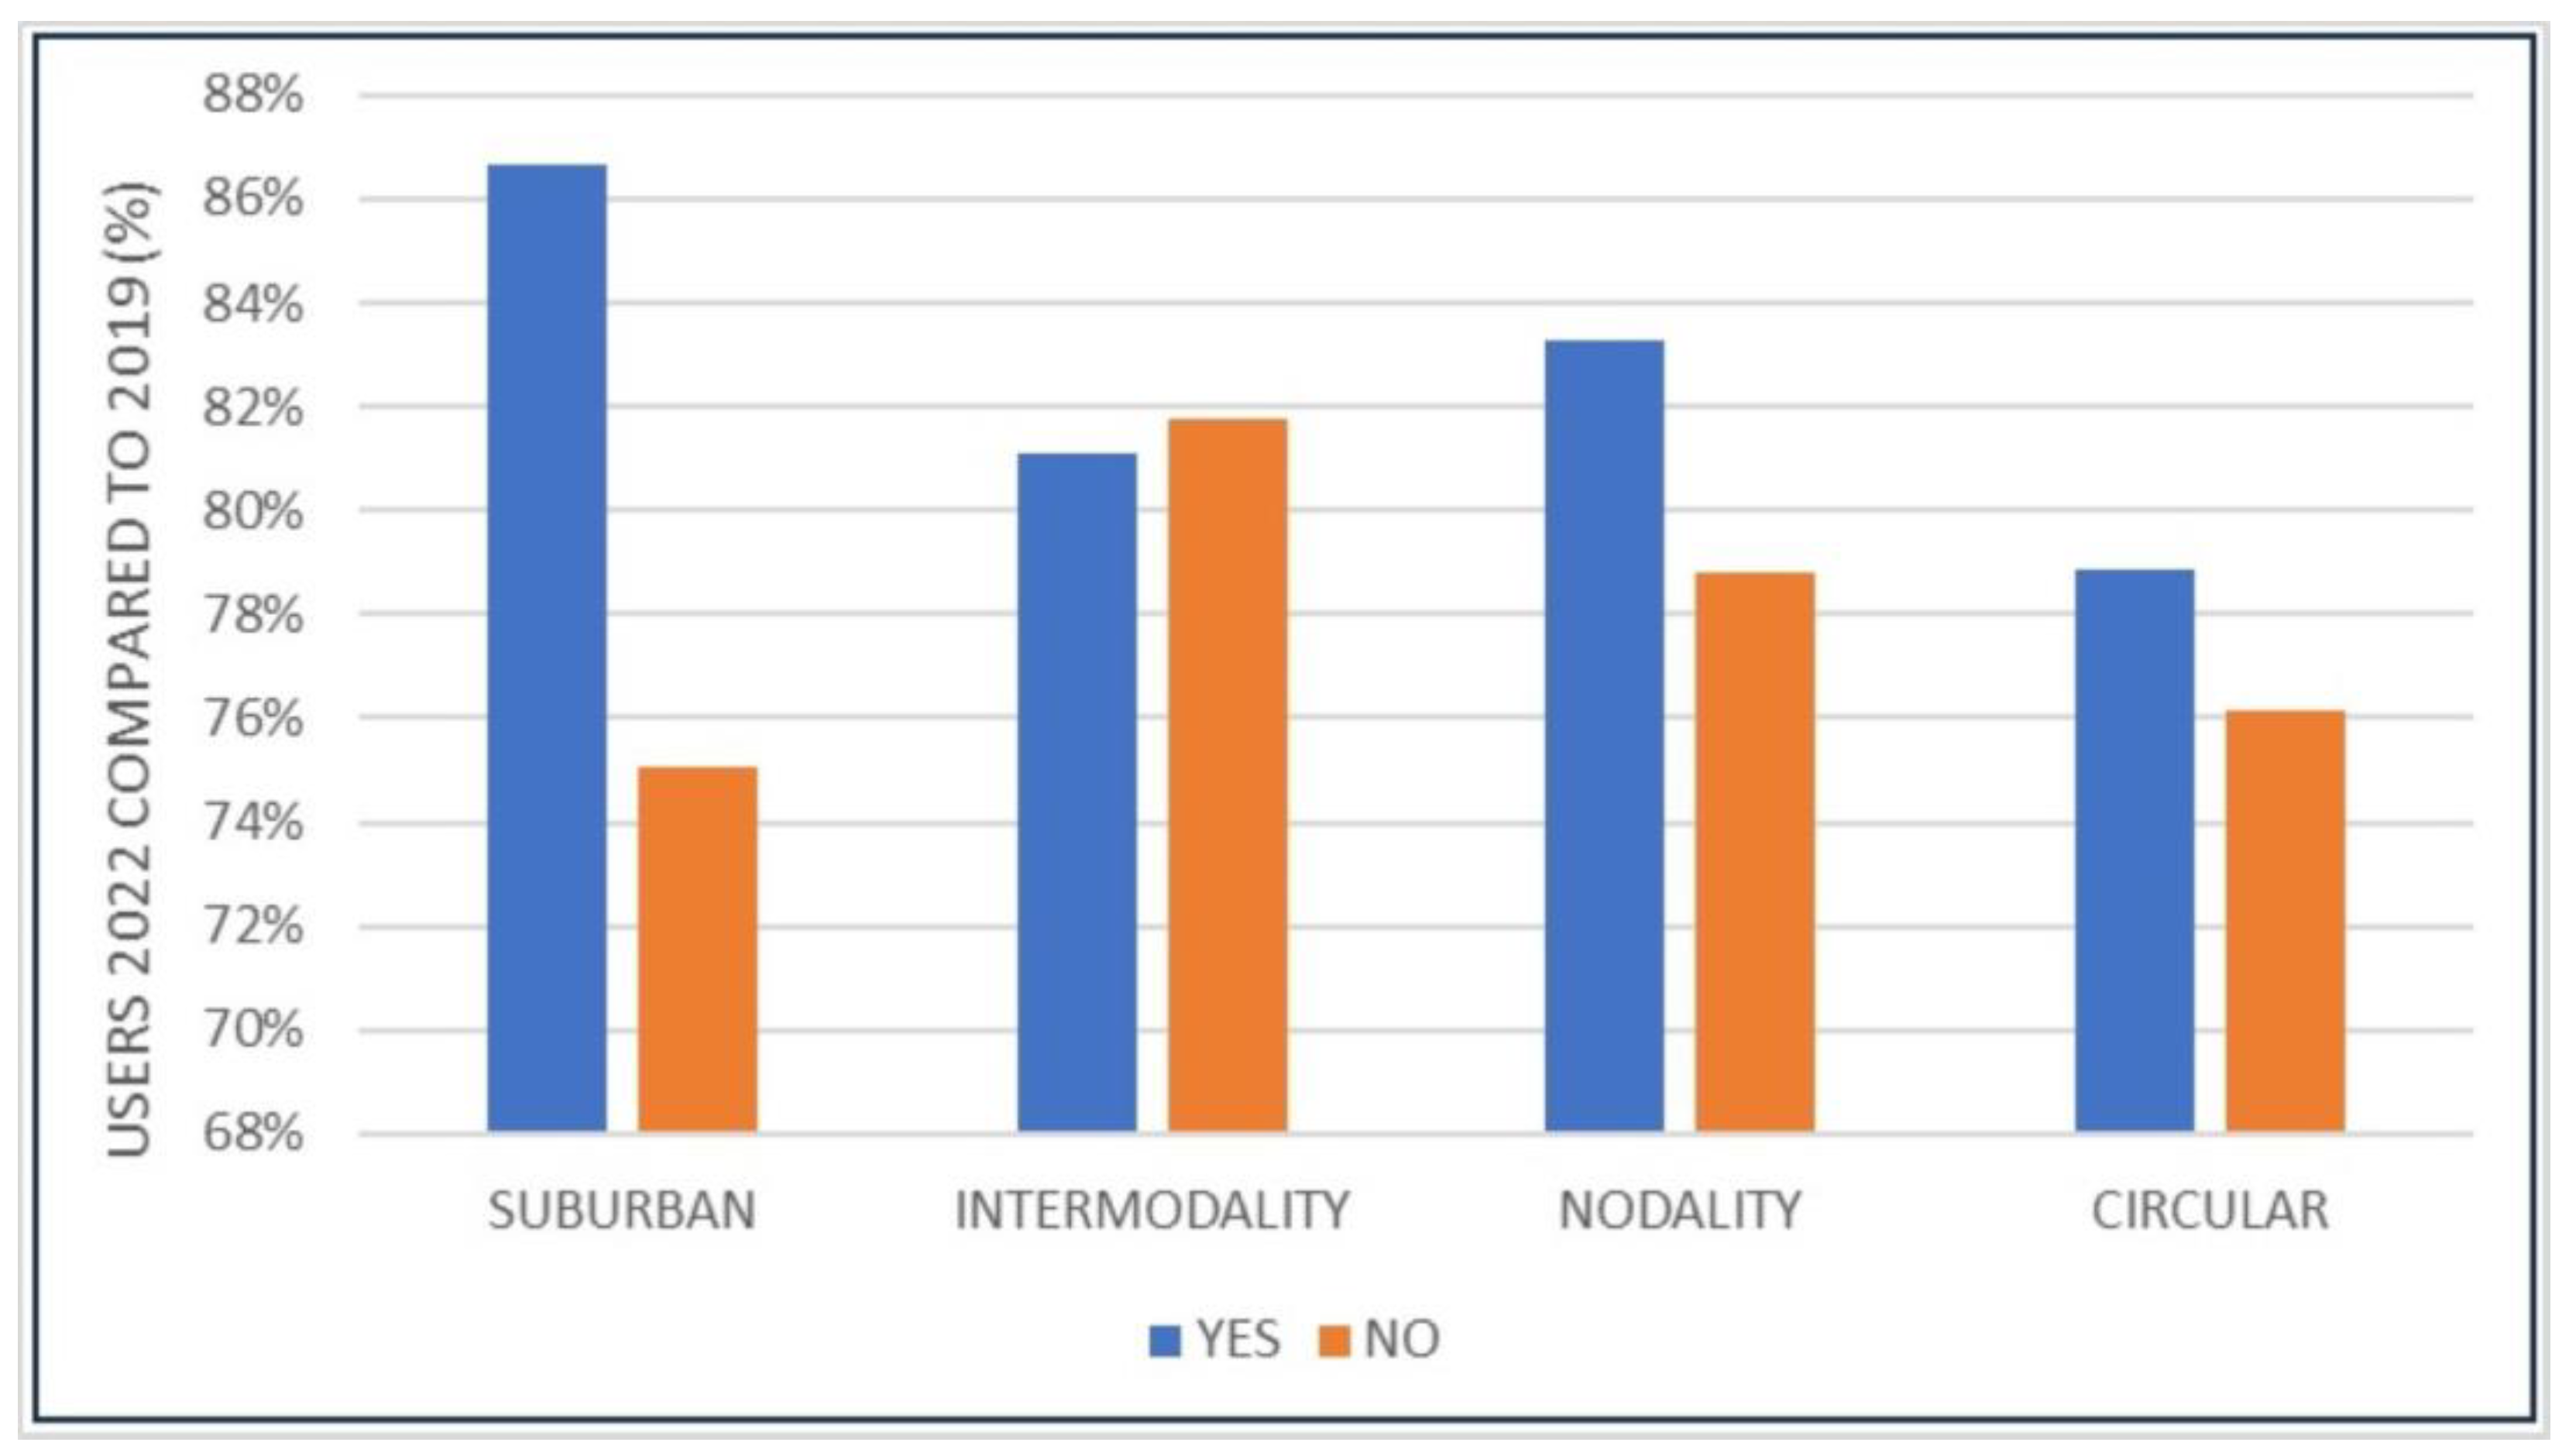
3.5. Qualitative Variables

The qualitative variables analyzed for the urban bus service lines in the present study were their urban or suburban nature (although all belong to the city’s municipal service), their connection or not with other means of interurban transport such as railway and intercity bus (intermodality), their circular or lineal route, and their service, or not, to the main urban transport centroids (university, hospital, and main mall). The results obtained for the correlation between this set of variables and the average of users recovered in 2022 compared to 2019 are summarized in Figure 8:
As shown, except for the urban or suburban character of the lines, in none of the other variables analyzed are there differences exceeding 4%. For instance, the intermodal lines connecting with the intermodal train–intercity bus station have not recovered more users than those that do not have that characteristic. In addition, the lines serving well-identified transportation centroids (hospital, university, main mall) have on average only recovered 4% of users more than the rest. Finally, a more difficult variable to analyze is the linear or circular route of the bus, as it barely affects the users’ recovery process.
On the other hand, it is remarkable that suburban lines have recovered 12% more users on average than those whose route is entirely within the main city center. It should be noted that the suburban lines serve the smaller population centers of the municipality (up to 17, scattered, and with a total population of around 35,000 people) as well as the university, an important transportation centroid located on the coast at about 3 km from the eastern edge of the city and about 6 km from its center (Figure 2). In fact, significant differences can be observed within the nodal lines (Table 2). For example, discarding both L4 and L18, which simultaneously serve the university and hospital, the lines reaching the university have recovered 89% of users on average (a percentage somewhat higher than the average for suburban lines as a whole), while those serving the main mall have recovered 82% and those serving the hospital only 73%.

4. Discussion

The overall statistical analysis as well as the individual correlations performed did not show a significant relationship between any of the operating variables and the average of users recovered in urban bus lines, highlighting the intrinsic complexity not only of the UPT system but also of its physical, economical, and social context. Apart from the poor statistical correlations obtained, which could even be biased by extreme values due to the small sample size, the most remarkable result would be the better recovery of users in suburban lines, an aspect which has already been observed in other studies [39]. Thus, compared to an average recovery of users of 78% in the city of Almeria bus service as a whole, the suburban lines have recovered 87% of the pre-pandemic occupancy level, the same average as the six lines serving the university (Table 2). Although, at a first sight, it could be thought that the lines to the university are the ones driving the average upwards, the results of other suburban lines such as L15 are also surprising, since, despite being the longest and that with the worst frequency (90 min), it ranks second in recovering users compared to 2019 (97%); and L31, the fourth line in length and the second with the worst frequency (70 min), has recovered 83% of users. Instead, despite the best frequency of the lines serving the main city (32 min on average compared to 42 min for the suburban lines), these are the ones whose behavior is worst in the post-pandemic situation, considered as a whole (Figure 8).
This seems to indicate that, regardless of whether they are urban or suburban lines, and independently of the quality of the service, the most determinant factor to choose UPT could be the more or less captive nature of the users, both in the case of students, who are understood to choose UPT for economic reasons [57], and those citizens living in areas no transportation alternatives other than private cars, such as those needing to travel between the smaller centers of the municipality where bike-lanes and pedestrian sidewalks are usually not available [58]. Instead, considering that the dimensions of the main city are approximately 5 km both from north to south and from east to west, the lack of recovery might be due to the shift of users to trips on foot or by bicycle/electric scooter, and it is difficult to attract this percentage of the population back to UPT [59,60]. Although no specific measurements were taken about the modal shift in the city of Almeria, it is necessary to consider that the average routes within the city would not exceed 30 min on foot [61] and 15 min by bicycle [62]; these values are very competitive taking into account the average frequency of the bus. In this context, it is not surprising that the line with the smallest geographical scope, L1 that serves the historic center, is the one with the worst recovery average. Thus, the captive passengers were more resilient both during the worst phase of the pandemic, when despite perceiving a higher level of risk, they were unable to change their behavior [36], and in the current recovery phase, due to the lack of alternatives [63]. This pattern is likely to be similar in other medium-sized cities, especially in those with housing densities ranging from medium to high, as is the case of many Mediterranean ones.
Although these results must be interpreted with caution since only a specific UPT system was analyzed, they seem to indicate that the annual evolution of the number of UPT users should not be approached from a unitary perspective, but considering the existence or not of mobility alternatives for the most popular destinations in the different areas. Thus, in central areas of dense medium-sized cities, where a higher demand for short intra-urban journeys exists, it is necessary to assume that users who have shifted to other non-motorized means of transport will be unlikely to return to UPT (which is not negative in itself), and public efforts should instead focus on attracting those who chose to shift to private vehicles (supposedly temporarily) or to those who have never been users of UPT, which could be more complicated. In this sense, it seems that the most effective measures could be to restrict internal mobility in private vehicles within the cities rather than improving UPT service parameters such as frequency or capacity, especially in areas that already have a good service [64]. By way of contrast, in the case of areas with less developed UPT services, public administrations should focus their policies on offering a more developed, sustainable, comfortable, and reliable transport alternative to all those who currently lack it. This would be one of the most plausible alternatives to increase the UPT share as a whole.
An unexpected result, although consistent with the previous ones, is the scarce impact that the average vehicle occupancy seems to have on the recovery of users in this time (Figure 5). Thus, although this factor was decisive for risk perception during the hardest phase of the pandemic, especially among frequent UPT users [65], it does not seem that an increase either in the frequency of the service or in the capacity of the vehicles for the sole purpose of decongesting vehicles has the effect of attracting new users [66].
Therefore, in general, the results of this study seem to indicate that, in central areas with a mature UPT network, public transport users do so more out of personal conviction than due to the lack of other viable alternatives. Thus, in these areas, the improvement of service parameters to increase the attractiveness of the UPT would not be a determining factor to attract new users, and that is the reason why public policies to promote a more sustainable urban transport should mainly their focus on reducing alternatives for private vehicle users.
Any study of this nature, essentially exploratory, has many limitations that necessitate great caution when drawing conclusions. The most obvious limitation results from the impossibility to analyze different UPT network alternatives in the same territory. Thus, although the comparison of this study with others carried out in cities of similar or different characteristics has helped to interpret or even question the results obtained here, it will always be from the perspective of two different physical, social, and governance realities, compromising the generalization of the results. For example, it would be necessary to confirm whether the decrease in the number of UPT users in central zones, at least in dense medium-sized cities, results from a shift to non-motorized sustainable means of transport. Moreover, even though studies conducted during the COVID-19 pandemic have revealed the existence of abundant data for analysis, they have also detected numerous shortcomings. Thus, as it happened in this study, the wide-scope data available can usually be disaggregated at the line level only, which does not allow researchers to study individual patterns within them. This issue can be crucial in analyzing long lines serving very heterogeneous territories since, as indicated, it is paramount to differentiate UPT users according to their options when choosing among different mobility alternatives. This type of more specific analysis can only be carried out through more selective and expensive field studies, which can be generalized in the future through the monitoring of the occupancy vehicle levels or the moment at which users leave them.

5. Conclusions

The results of this study show how UPT continues its gradual recovery in the number of users as compared to the pre-pandemic situation, but it is evident that the modal shift towards other means of transport is still persistent, and the efforts of public administrations to return to the path of sustainable urban mobility are still necessary. Among the measures that may most easily be adopted in the short term would be those related to the modification of some of the operating variables of the UPT system. However, from the analysis carried out on the city of Almeria urban bus network, no clear correlation was detected between any of the basic operating variables of a typical urban bus network (frequency, average vehicle occupancy, the length of lines, nodality, urban or suburban route, circularity, or intermodality) and the percentage of users recovered in 2022 compared to 2019.
Nevertheless, this study has highlighted other interesting results. For example, suburban lines have recovered a significant 12% more users than purely urban lines, despite the better quality of service in those lines, especially in terms of frequency. Although deeper studies about the modal shift are necessary, especially in central locations where non-motorized mobility alternatives are more suitable, the overall analysis seems to indicate that the most determinant factor in the recovery of the number of users in a given UPT line could be the level of dependence of those users on public transport, since the lines which have recovered best are those linked to captive users, either for economic reasons, or due to the lack of viable transport alternatives, regardless of the intrinsic characteristics of the service such as the frequency or the average vehicle occupancy. In fact, these last two variables, possibly the two most representative ones of the quality of the service, did not show a significant correlation with the percentage of recovered users. This is especially striking when compared to the majority of studies carried out during the pandemic or in its aftermath, when both factors were shown to be decisive, especially combined, in maintaining a feeling of safety among users.
Given the above, it does not seem that an improvement in the offer, by increasing the frequencies or using vehicles with a greater capacity, could have strong enough an appeal to significantly increase the number of users, especially in already well-served urban areas. In these urban areas, dissuasive measures against the use of private vehicles could be more effective to attract both new users and those who began using UPT during the pandemic. In the same way, public policies aimed at improving the spatial and social coverage of UPT to the maximum extent possible might significantly contribute to increasing the number of users, providing transport alternatives to those who still lack them.
The present study reveals new lines of research and leaves some open questions. For example, the analysis of the city of Almeria’s bus service should be extended to other medium-sized cities to complete or even question the results obtained here, especially if such studies start with a different modal distribution of transport. It could also be revealing to perform a similar study in areas with a less mature UPT network, where, the improvement in the characteristics of public transport themselves could probably be a sufficient tool to incorporate new users eager to have cheaper and more efficient transport alternatives. Finally, it would also be useful to compare the results obtained in this study regarding the average of users recovered in UPT with those reached in municipalities that have implemented significant restrictions to private vehicles during the past three years such as those that this study suggests. This would allow future research to delve into the effectiveness of the different public policies in promoting a more sustainable urban mobility.

Author Contributions

F.J.G.-J., conceptualization, methodology, investigation, and editing; M.I.R.-R., investigation, validation, and writing—review; M.R.V.-S., investigation, data curation, and writing—review. All authors have read and agreed to the published version of the manuscript.

Funding

This research received no external funding.

Data Availability Statement

Restrictions apply to the availability of these data. Data was obtained from Almeria city council and are available with email [email protected].

Acknowledgments

The authors would like to thank the City of Almeria Mobility Area, especially Antonio Sierra as responsible for the municipal urban bus service.

Conflicts of Interest

The authors declare no conflicts of interest.

References

  1. De Gruyter, C.; Currie, G.; Rose, G. Sustainability measures of urban public transport in cities: A world review and focus on the Asia/Middle East Region. Sustainability 2016, 9, 43. [Google Scholar] [CrossRef]
  2. Wu, H.; Avner, P.; Boisjoly, G.; Braga, C.K.; El-Geneidy, A.; Huang, J.; Kerzhner, T.; Murphy, B.; Niedzielski, M.A.; Pereira, R.H.M.; et al. Urban access across the globe: An international comparison of different transport modes. NPJ Urban Sustain. 2021, 1, 16. [Google Scholar] [CrossRef]
  3. Guzman, L.A.; Hessel, P. The effects of public transport subsidies for lower-income users on public transport use: A quasi-experimental study. Transp. Policy 2022, 126, 215–224. [Google Scholar] [CrossRef]
  4. Yang, B.; Wu, G. Multi-criteria analysis of cross-regional railways interconnection under the post COVID-19 pandemic crisis: A hybrid BWM-FAISM-DFS evaluation framework. Transp. Res. Part E Logist. Transp. Rev. 2023, 179, 103316. [Google Scholar] [CrossRef]
  5. Nordbakke, S.T.D. Changes in travel behaviour during the pandemic: Exploring why public transport is not back to pre-pandemic levels. Findings 2022. [Google Scholar] [CrossRef]
  6. Beck, M.J.; Nelson, J.D.; Hensher, D.A. Attitudes toward public transport post Delta COVID-19 lockdowns: Identifying user segments and policies to restore confidence. Int. J. Sustain. Transp. 2023, 17, 827–844. [Google Scholar] [CrossRef]
  7. Thomas, N.; Jana, A.; Bandyopadhyay, S. Physical distancing on public transport in Mumbai, India: Policy and planning implications for unlock and post-pandemic period. Transp. Policy 2022, 116, 217–236. [Google Scholar] [CrossRef]
  8. Galeazzi, A.; Cinelli, M.; Bonaccorsi, G.; Pierri, F.; Schmidt, A.L.; Scala, A.; Pammolli, F.; Quattrociocchi, W. Human mobility in response to COVID-19 in France, Italy and UK. Sci. Rep. 2021, 11, 13141. [Google Scholar] [CrossRef]
  9. Bucsky, P. Modal share changes due to COVID-19: The case of Budapest. Transp. Res. Interdiscip. Perspect. 2020, 8, 100141. [Google Scholar] [CrossRef]
  10. Rodríguez González, A.B.; Wilby, M.R.; Vinagre Díaz, J.J.; Fernández Pozo, R. Characterization of COVID-19′s impact on mobility and short-term prediction of public transport demand in a mid-size city in Spain. Sensors 2021, 21, 6574. [Google Scholar] [CrossRef]
  11. Kim, S.; Lee, S.; Ko, E.; Jang, K.; Yeo, J. Changes in car and bus usage amid the COVID-19 pandemic: Relationship with land use and land price. J. Transp. Geogr. 2021, 96, 103168. [Google Scholar] [CrossRef]
  12. Sung, H. Impacts of the Outbreak and Proliferation of the Middle East Respiratory Syndrome on Rail Transit Ridership in the Seoul Metropolitan City. J. Korea Plan. Assoc. 2016, 51, 163. [Google Scholar] [CrossRef]
  13. Wang, K.Y. How change of public transportation usage reveals fear of the SARS virus in a city. PLoS ONE 2014, 9, e89405. [Google Scholar] [CrossRef]
  14. Falchetta, G.; Noussan, M. The impact of COVID-19 on transport demand, modal choices, and sectoral energy consumption in Europe. IAEE Energy Forum 2020, 2020, 48–50. [Google Scholar] [CrossRef]
  15. Zhang, J.; Hayashi, Y. Research frontier of COVID-19 and passenger transport: A focus on policymaking. Transp. Policy 2022, 119, 78–88. [Google Scholar] [CrossRef]
  16. Echaniz, E.; Rodríguez, A.; Cordera, R.; Benavente, J.; Alonso, B.; Sañudo, R. Behavioural changes in transport and future repercussions of the COVID-19 outbreak in Spain. Transp. Policy 2021, 111, 38–52. [Google Scholar] [CrossRef] [PubMed]
  17. Abdullah, M.; Dias, C.; Muley, D.; Shahin, M. Exploring the Impacts of COVID-19 on Travel Behavior and Mode Preferences. Transp. Res. Interdiscip. Perspect. 2020, 8, 100255. [Google Scholar] [CrossRef] [PubMed]
  18. Scorrano, M.; Danielis, R. Active mobility in an Italian city: Mode choice determinants and attitudes before and during the COVID-19 emergency. Res. Transp. Econ. 2021, 86, 101031. [Google Scholar] [CrossRef]
  19. Teixeira, J.F.; Lopes, M. The link between bike sharing and subway use during the COVID-19 pandemic: The case-study of New York’s Citi Bike. Transp. Res. Interdiscip. Perspect. 2020, 6, 100166. [Google Scholar] [CrossRef]
  20. Eisenmann, C.; Nobis, C.; Kolarova, V.; Lenz, B.; Winkler, C. Transport mode use during the COVID-19 lockdown period in Germany: The car became more important, public transport lost ground. Transp. Policy 2021, 103, 60–67. [Google Scholar] [CrossRef]
  21. Ciuffini, F.; Tengattini, S.; Bigazzi, A.Y. Mitigating increased driving after the COVID-19 pandemic: An analysis on mode share, travel demand, and public transport capacity. Transp. Res. Rec. 2023, 2677, 154–167. [Google Scholar] [CrossRef] [PubMed]
  22. Przybylowski, A.; Stelmak, S.; Suchanek, M. Mobility behaviour in view of the impact of the COVID-19 pandemic—Public transport users in Gdansk case study. Sustainability 2021, 13, 364. [Google Scholar] [CrossRef]
  23. Zhang, J.; Hayashi, Y.; Frank, L.D. COVID-19 and transport: Findings from a world-wide expert survey. Transp. Policy 2021, 103, 68–85. [Google Scholar] [CrossRef] [PubMed]
  24. Fernández Pozo, R.F.; Wilby, M.R.; Díaz JJ, V.; González AB, R. Data-driven analysis of the impact of COVID-19 on Madrid’s public transport during each phase of the pandemic. Cities 2022, 127, 103723. [Google Scholar] [CrossRef] [PubMed]
  25. Griffiths, S.; Del Rio, D.F.; Sovacool, B. Policy mixes to achieve sustainable mobility after the COVID-19 crisis. Renew. Sustain. Energy Rev. 2021, 143, 110919. [Google Scholar] [CrossRef] [PubMed]
  26. Campisi, T.; Basbas, S.; Skoufas, A.; Akgün, N.; Ticali, D.; Tesoriere, G. The impact of COVID-19 pandemic on the resilience of sustainable mobility in Sicily. Sustainability 2020, 12, 8829. [Google Scholar] [CrossRef]
  27. De Haas, M.; Faber, R.; Hamersma, M. How COVID-19 and the Dutch ‘intelligent lockdown’ change activities, work and travel behaviour: Evidence from longitudinal data in the Netherlands. Transp. Res. Interdiscip. Perspect. 2020, 6, 100150. [Google Scholar] [CrossRef] [PubMed]
  28. Nikiforiadis, A.; Mitropoulos, L.; Kopelias, P.; Basbas, S.; Stamatiadis, N.; Kroustali, S. Exploring mobility pattern changes between before, during and after COVID-19 lockdown periods for young adults. Cities 2022, 125, 103662. [Google Scholar] [CrossRef]
  29. Nikiforiadis, A.; Paschalidis, E.; Stamatiadis, N.; Raptopoulou, A.; Kostareli, A.; Basbas, S. Analysis of attitudes and engagement of shared e-scooter users. Transp. Res. Part D Transp. Environ. 2021, 94, 102790. [Google Scholar] [CrossRef]
  30. Lucchesi, S.T.; Tavares, V.B.; Rocha, M.K.; Larranaga, A.M. Public transport COVID-19-safe: New barriers and policies to implement effective countermeasures under user’s safety perspective. Sustainability 2022, 14, 2945. [Google Scholar] [CrossRef]
  31. Sharifi, A.; Khavarian-Garmsir, A.R. The COVID-19 pandemic: Impacts on cities and major lessons for urban planning, design, and management. Sci. Total Environ. 2020, 749, 142391. [Google Scholar] [CrossRef]
  32. Hu, S.; Chen, P. Who left riding transit? Examining socioeconomic disparities in the impact of COVID-19 on ridership. Transp. Res. Part D Transp. Environ. 2021, 90, 102654. [Google Scholar] [CrossRef]
  33. Liu, L.; Miller, H.J.; Scheff, J. The impacts of COVID-19 pandemic on public transit demand in the United States. PLoS ONE 2020, 15, e0242476. [Google Scholar] [CrossRef]
  34. Jiao, J.; Hansen, K.; Azimian, A. Disparities in the Impacts of the COVID-19 Pandemic on Public Transit Ridership in Austin, Texas, USA. Transp. Res. Rec. 2023, 2677, 287–297. [Google Scholar] [CrossRef]
  35. Vega-Gonzalo, M.; Gomez, J.; Christidis, P. How has COVID-19 changed private car use in European urban areas? An analysis of the effect of socio-economic characteristics and mobility habits. Transp. Res. Part A Policy Pract. 2023, 172, 103679. [Google Scholar] [CrossRef] [PubMed]
  36. Pawar, D.S.; Yadav, A.K.; Akolekar, N.; Velaga, N.R. Impact of physical distancing due to novel coronavirus (SARS-CoV-2) on daily travel for work during transition to lockdown. Transp. Res. Interdiscip. Perspect. 2020, 7, 100203. [Google Scholar] [CrossRef]
  37. Dueñas, M.; Campi, M.; Olmos, L.E. Changes in mobility and socioeconomic conditions during the COVID-19 outbreak. Humanit. Soc. Sci. Commun. 2021, 8, 101. [Google Scholar] [CrossRef]
  38. Orro, A.; Novales, M.; Monteagudo, Á.; Pérez-López, J.B.; Bugarín, M.R. Impact on city bus transit services of the COVID–19 lockdown and return to the new normal: The case of A Coruña (Spain). Sustainability 2020, 12, 7206. [Google Scholar] [CrossRef]
  39. Aparicio, J.T.; Arsenio, E.; Henriques, R. Understanding the impacts of the COVID-19 pandemic on public transportation travel patterns in the City of Lisbon. Sustainability 2021, 13, 8342. [Google Scholar] [CrossRef]
  40. Gkiotsalitis, K.; Cats, O. Public transport planning adaption under the COVID-19 pandemic crisis: Literature review of research needs and directions. Transp. Rev. 2021, 41, 374–392. [Google Scholar] [CrossRef]
  41. Caramuta, C.; Giacomini, C.; Longo, G.; Poloni, C. Managerial decisions to recover from COVID-19 disruption: A multi-objective optimization approach applied to public transport operators. Transp. Eng. 2023, 11, 100163. [Google Scholar] [CrossRef]
  42. Nikolaidou, A.; Kopsacheilis, A.; Georgiadis, G.; Noutsias, T.; Politis, I.; Fyrogenis, I. Factors affecting public transport performance due to the COVID-19 outbreak: A worldwide analysis. Cities 2023, 134, 104206. [Google Scholar] [CrossRef] [PubMed]
  43. Aloi, A.; Alonso, B.; Benavente, J.; Cordera, R.; Echániz, E.; González, F.; Ladisa, C.; Lezama-Romanelli, R.; López-Parra, Á.; Mazzei, V.; et al. Effects of the COVID-19 lockdown on urban mobility: Empirical evidence from the city of Santander (Spain). Sustainability 2020, 12, 3870. [Google Scholar] [CrossRef]
  44. Tirachini, A.; Cats, O. COVID-19 and public transportation: Current assessment, prospects, and research needs. J. Public Transp. 2020, 22, 1–21. [Google Scholar] [CrossRef] [PubMed]
  45. Wagner, A.; Ibold, S.; Medimorec, N. The COVID-19 Outbreak and Implications to Sustainable Urban Mobility; Sustain. Transport.; SloCaT: Brussels, Belgium, 2020. [Google Scholar]
  46. Potter, S.; Enoch, M.; Valdez Juarez, A.; Cook, M. Demand Responsive Transport: Is Milton Keynes developing a post-COVID revolution in public transport? In Proceedings of the Universities Transport Study Group Annual Conference, Online, 5–6 July 2021. [Google Scholar]
  47. Parady, G.; Taniguchi, A.; Takami, K. Analyzing risk perception and social influence effects on self-restriction Behavior in response to the COVID-19 pandemic in Japan: First results. Transp. Res. Interdiscip. Perspect. 2020, 7, 100181. [Google Scholar] [CrossRef]
  48. Macioszek, E.; Kurek, A. Extracting road traffic volume in the city before and during COVID-19 through video remote sensing. Remote Sens. 2021, 13, 2329. [Google Scholar] [CrossRef]
  49. Chen, L.; Grimstead, I.; Bell, D.; Karanka, J.; Dimond, L.; James, P.; Smith, L.; Edwardes, A. Estimating vehicle and pedestrian activity from town and city traffic cameras. Sensors 2021, 21, 4564. [Google Scholar] [CrossRef]
  50. Jenelius, E.; Cebecauer, M. Impacts of COVID-19 on public transport ridership in Sweden: Analysis of ticket validations, sales and passenger counts. Transp. Res. Interdiscip. Perspect. 2020, 8, 100242. [Google Scholar]
  51. Das, S.; Boruah, A.; Banerjee, A.; Raoniar, R.; Nama, S.; Maurya, A.K. Impact of COVID-19: A radical modal shift from public to private transport mode. Transp. Policy 2021, 109, 1–11. [Google Scholar] [CrossRef]
  52. Fatmi, M.R. COVID-19 impact on urban mobility. J. Urban Manag. 2020, 9, 270–275. [Google Scholar] [CrossRef]
  53. Qi, Y.; Liu, J.; Tao, T.; Zhao, Q. Impacts of COVID-19 on public transit ridership. Int. J. Transp. Sci. Technol. 2023, 12, 34–45. [Google Scholar] [CrossRef]
  54. Wilbur, M.; Ayman, A.; Sivagnanam, A.; Ouyang, A.; Poon, V.; Kabir, R.; Vadali, A.; Pugliese, P.; Freudberg, D.; Laszka, A.; et al. Impact of COVID-19 on public transit accessibility and ridership. Transp. Res. Rec. 2023, 2677, 531–546. [Google Scholar] [CrossRef]
  55. Harantová, V.; Kalašová, A.; Skřivánek Kubíková, S.; Mazanec, J.; Jordová, R. The impact of mobility on shopping preferences during the COVID-19 Pandemic: The evidence from the Slovak Republic. Mathematics 2022, 10, 1394. [Google Scholar] [CrossRef]
  56. Štefancová, V.; Kalašová, A.; Čulík, K.; Mazanec, J.; Vojtek, M.; Mašek, J. Research on the impact of COVID-19 on micromobility using statistical methods. Appl. Sci. 2022, 12, 8128. [Google Scholar] [CrossRef]
  57. Rauws, R.; van Lierop, D. Returning to public transit after an epidemic. Findings 2020. [Google Scholar] [CrossRef]
  58. De Borger, B.; Proost, S. COVID-19 and optimal urban transport policy. Transp. Res. Part A Policy Pract. 2022, 163, 20–42. [Google Scholar] [CrossRef] [PubMed]
  59. Kraus, S.; Koch, N. Provisional COVID-19 infrastructure induces large, rapid increases in cycling. Proc. Natl. Acad. Sci. USA 2021, 118, e2024399118. [Google Scholar] [CrossRef] [PubMed]
  60. Büchel, B.; Marra, A.D.; Corman, F. COVID-19 as a window of opportunity for cycling: Evidence from the first wave. Transp. Policy 2022, 116, 144–156. [Google Scholar] [CrossRef]
  61. Fitzpatrick, K.; Brewer, M.A.; Turner, S. Another look at pedestrian walking speed. Transp. Res. Rec. 2006, 1982, 21–29. [Google Scholar] [CrossRef]
  62. Mohamed, A.; Bigazzi, A. Speed and road grade dynamics of urban trips on electric and conventional bicycles. Transp. B Transp. Dyn. 2019, 7, 1467–1480. [Google Scholar] [CrossRef]
  63. Zhao, P.; Gao, Y. Public transit travel choice in the post COVID-19 pandemic era: An application of the extended Theory of Planned behavior. Travel Behav. Soc. 2022, 28, 181–195. [Google Scholar] [CrossRef] [PubMed]
  64. Downey, L.; Fonzone, A.; Fountas, G.; Semple, T. The impact of COVID-19 on future public transport use in Scotland. Transp. Res. Part A Policy Pract. 2022, 163, 338–352. [Google Scholar] [CrossRef] [PubMed]
  65. Astroza, S.; Tirachini, A.; Hurtubia, R.; Carrasco, J.A.; Guevara, A.; Munizaga, M.; Figueroa, M.; Torres, V. Mobility changes, teleworking, and remote communication during the COVID-19 pandemic in Chile. Findings 2020. [Google Scholar] [CrossRef]
  66. Basnak, P.; Giesen, R.; Muñoz, J.C. Estimation of crowding factors for public transport during the COVID-19 pandemic in Santiago, Chile. Transp. Res. Part A Policy Pract. 2022, 159, 140–156. [Google Scholar] [CrossRef]
Figure 1. City of Almeria location.
Applsci 14 01258 g001
Figure 2. Municipal urban bus network area coverage.
Applsci 14 01258 g002
Figure 3. Evolution of annual number of users in urban bus lines in the city of Almeria, 2019–2022.
Applsci 14 01258 g003
Figure 4. Relationship of all the categories studied in two dimensions.
Applsci 14 01258 g004
Figure 5. Correlation between the average of users recovered (2022 compared to 2019) and average vehicle occupancy.
Applsci 14 01258 g005
Figure 6. Correlation between the average of users recovered (2022 compared to 2019) and the frequency of lines.
Applsci 14 01258 g006
Figure 7. Correlation between the average of users recovered (2022 compared to 2019) and the length of lines.
Applsci 14 01258 g007
Figure 8. Correlation between the average of users recovered (2022 compared to 2019) and the quantitative variables.
Applsci 14 01258 g008
Table 1. Evolution of urban public transport users in the city of Almeria (2019–2022).
Year
2019202020212022
Annual users7,410,5833,898,0984,601,2375,810,103
% annual users compared to 2019100%53%62%78%
Table 2. Service variables of urban public transport in the city of Almeria.
Service Variables
Line% Vehicle
Occupancy
2022
Frequency
(Min)
SuburbanIntermodalityNodalityLength
(km)
CircularUsers
(2019)
Users
(2022)
% Users
Recovered
2022/2019
L134%22NOYES (Bus/train)NO7.733YES144,54392,07264%
L243%17NOYES (Bus/train)YES (Hosp)11.477NO800,205551,17269%
L340%70NONOYES (Hosp)14.169NO162,887126,14677%
L436%70YESNOYES (Hosp-Univ)21.701NO63,70755,83288%
L547%15NONOYES (Mall)10.171NO625,744498,18780%
L648%20NONONO13.914NO604,147475,80579%
L743%20NONONO15.450NO688,768503,52573%
L842%60NONOYES (Mall)10.632NO178,711149,74784%
L1154%18YESNOYES (Univ)18.586YES755,889579,44477%
L1260%17YESNOYES (Univ)17.133YES829,895648,96678%
L1519%90YESNOYES (Univ)43.820YES43,27841,93597%
L1898%16YESNOYES (Hosp-Univ)34.155NO1,362,5261,056,25478%
L1925%30YESYES (Bus/train)YES (Univ)14.497NO148,100156,700106%
L2067%30YESNONO38.926NO531,709478,02790%
L3048%35YESYES (Bus/train)NO38.024NO398,304336,61785%
L3133%70YESYES (Bus/train)NO34.485NO72,17059,67483%
TOTAL7,410,5835,810,10378%
Table 3. Qualitative and quantitative variable coding.
VariableCategoriesCoding
% Users recovered (R)≤70%R1
70% < x ≤ 80%R2
80% < x ≤ 90%R3
>90%R4
% Vehicle occupancy 2022 (O)≤25%O1
25% < x ≤ 50%O2
50% < x ≤ 75%O3
>75%O4
Frequency (min) (F)≤20F1
20 < x ≤ 25F2
25 < x ≤ 30F3
>30F4
Length of line (km) (L)≤10L1
10 < x ≤ 20L2
20 < x ≤ 30L3
>30L4
Suburban (S)YESSY
NOSN
Intermodality (I)YESIY
NOIN
Nodality (N)HospitalNY1
Hospital/UniversityNY2
MallNY3
UniversityNY4
NONN
Circular (C)YESCY
NOCN
Table 4. MCA output.
DimensionCronbach’s AlphaVariance Accounted for
Total (Singular Value)Inertia% Proportion of Inertia
10.8393.7560.46946.947
20.7903.2430.40540.535
Total 6.9990.875
Mean0.8163.4990.43743.741
Table 5. MCA measures of discrimination.
VariableDimensionAverage
12
R0.7340.6340.684
O0.6560.3890.522
F0.5170.5360.527
L0.4920.4750.484
S0.6900.0210.355
I0.0760.3120.194
N0.5800.4880.534
C0.0110.3880.200
Total3.7563.2433.499
% Proportion of inertia46.94740.53543.741
Disclaimer/Publisher’s Note: The statements, opinions and data contained in all publications are solely those of the individual author(s) and contributor(s) and not of MDPI and/or the editor(s). MDPI and/or the editor(s) disclaim responsibility for any injury to people or property resulting from any ideas, methods, instructions or products referred to in the content.

