Article

Recognition of Tunnel Fracture Zones in Seismic Waves and Ground-Penetrating Radar Data

1
Faculty of Information Engineering and Automation, Kunming University of Science and Technology, Kunming 650500, China
2
Yunnan Aerospace Engineering Geophysical Detecting Co., Ltd., Kunming 650200, China
*
Author to whom correspondence should be addressed.
Appl. Sci. 2024, 14(3), 1282; https://doi.org/10.3390/app14031282
Submission received: 31 December 2023 / Revised: 23 January 2024 / Accepted: 25 January 2024 / Published: 3 February 2024

Abstract

:
Fracture zones in front of tunnel faces can easily cause falling blocks and landslides during the construction process. Using seismic waves and ground-penetrating radar (GPR) data, we extracted the features of fracture zones and achieved the advanced prediction of tunnel fracture zones. The energy variation in the reflected waves propagated by seismic waves at interfaces with different impedances of contact waves was found to manifest as positive and negative reflections, and the amplitude of reflected signals within the fracture zone areas thus increased. We designed a superimposed velocity spectrum, divided the areas of variation in wave velocity, and constructed the three-dimensional spatial distribution of the tunnel fracture zones. Based on the phase change, increase in amplitude, and increase in the center-frequency characteristics of the one-dimensional time waveform of the electromagnetic waves in the fault zone area (A-scan), we located the characteristic points of the fracture zones and observed the occurrence of in-phase axis misalignment in two-dimensional scanning (B-scan). We then implemented the identification of fracture zones. This method predicted the fractured area in the rock surrounding the Liangwangshan Tunnel, and during the tunnel excavation, the fracture zones appeared in the recognition area.

1. Introduction

Tunnel construction areas are often geologically complex, and the rock body in the construction area contains numerous rock fragmentation zones, which often leads to the collapse of these zones. Therefore, accurately forecasting the fracture zones within the rock mass becomes an indispensable step. The accuracy of tunnel prediction can be improved by using a combination of geophysical methods.
The seismic wave method is often used in long-distance detection to identify hazardous areas in front of tunnels, as it is more sensitive to fractured rock masses. Currently, the seismic reflection method represented by tunnel seismic prediction (TSP) [1], known as true reflection tomography (TRT) [2], is the dominant method in the advanced prediction of hazardous areas in tunnels. With the development of seismic exploration technology for tunnels, migration imaging in the critical stage of tunnel seismic processing is becoming increasingly precise, and the diffraction stacking migration method [3] has been widely applied. In addition, seismic advanced prediction methods also include tunnel seismic tomography (TST) systems [4], TGP tunnel construction advanced geological prediction (TGP), and other advanced detection methods for use in tunnels. In 2015, Lu et al. [5] predicted changes in the geological conditions in front of the palm face in advance based on the engineering geological background of the tunnel, combined with the seismic wave reflection characteristics of typical geological hazards in karst tunnels. They thus proved the feasibility of using earthquake methods for advanced prediction. In 2017, Brodic et al. [6] used active-source surface–tunnel–surface seismic data to analyze the structure of the rock between a tunnel and the surface; these authors used physical parameters, such as the P-wave and S-wave velocities, to characterize fracture zones. These fracture zones were characterized on a scale corresponding to seismic exploration waves. In 2020, Hong Kee Tzou et al. [7] applied a seismic wave advanced prediction method to tunnel detection, identified unstable areas, and successfully detected and verified the positions of river faults and fracture zones. In 2023, Wang et al. [8] proposed a 3c–3d tunnel seismic imaging method using acoustic wave equations for forward and backward wave field extrapolation. This method effectively eliminated the imaging artifacts of converted waves and accurately determined the spatial positions of faults and cracks in front of the tunnel. In 2014, Shi et al. [9] proposed an optimized classification method for advanced prediction in tunnels based on the fuzzy analytic hierarchy process (FAHP). By using the comprehensive weight method to determine the reasonable weights of each evaluation index, an optimized FAHP evaluation model for the rock surrounding a given tunnel was established, and a hierarchical analysis of surrounding rock optimization classification was achieved.
Detection with ground-penetrating radar (GPR) [10] is the main method of short-range prediction. This method involves analyzing waveform characteristics through changes in the reflection coefficient and attenuation coefficient of the medium [11,12]; predicting fractured rock masses, water bodies, and karst caves before the excavation of underground tunnels; and inspecting tunnel lining defects. In 2011, Heikkinen et al. [13] evaluated the applicability of the GPR method for locating large fractures. Their findings indicated that ground-penetrating radar is effective and useful in measuring the surfaces of tunnels. In 2011, Li et al. [14] achieved the automatic identification and positioning of tunnel lining layers through the characteristics of variations in the Fresnel reflection coefficient of electromagnetic waves in the tunnel lining and the peak-point characteristics of a single waveform. In 2019, Chen et al. [15] processed geological radar images by filtering, binarization, and refinement to make radar image recognition more accurate and mitigate the effect of noise on the image. The neural network pattern recognition technique was used to achieve the automatic detection of curved targets in B-scan images. In 2020, Fhatuwani Sengani [16] used improved ground-penetrating radar to detect unknown geological features in front of a tunnel and identify more fractured rock masses. Their findings indicated that ground-penetrating radar is an effective tool for solving the problem of deep gold mining. In 2020, Molron et al. [17] evaluated the detection capability of GPR for cracks. Their results indicated that GPR imaging can effectively detect open sub-horizontal fractures with submillimeter apertures. In 2023, Li et al. [18] used attenuation and reflection coefficients to determine the location of rebar’s feature points with A-SCAN technology and superimposed them to display the selected rebar feature points on B-SCAN images. These authors thus realized the automatic identification and location of reinforcement in tunnel linings. In 2023, Li et al. [19] combined the reflection coefficient and attenuation coefficient characteristics of voids and constructed geometric features to identify voids.
For the overcasting of tunnels, a variety of geophysical techniques are widely used for the prediction of fracture zones. In 2013, Wang et al. [20] used the Dadu Mountain Tunnel as their research object and employed advanced geological prediction using TRT to obtain a three-dimensional seismic wave map. By combining this with the GPR geological prediction method, fault fracture zones and developments of karst fissures during the construction of the tunnel were comprehensively assessed. In 2015, Li et al. [21] integrated the application of GPR and geological drilling (Geo-D) techniques for tunnel overcasting. Their results indicated that through the joint analysis of two geophysical methods, the geometric characteristics of karst caves and their spatial relationship with tunnels could be identified and predicted. In 2019, Chen et al. [22] conducted an advanced geological analysis of tunnels using geophysical methods, such as TSP, TEM [23], and GPR. The TSP method was first used for long-range detection to identify poor geology with geohazard risks. Then, the transient electromagnetic method combined with GPR was used to distinguish the bad geology. The results showed that the joint use of multiple physical exploration methods improves the accuracy of the prediction results. In 2021, Liu et al. [24] utilized the advantages of TSP and GPR in distinguishing different geological bodies to conduct advanced forecasting and cross-validated the forecasting results. Their results showed that utilizing the complementarity of long-range prediction and short-range prediction improves the accuracy of detecting the spatial locations of undesirable geological bodies. In 2023, Liu et al. [25] used a combination of the TST method and GPR to identify broken rock bodies and fissures in the rock surrounding a tunnel. Moreover, their results were verified with the tunnel excavation results and were found to effectively predict the existence of broken rock bodies and ensure the safety of construction.
In this paper, the identification of fracture zones has been achieved by combining seismic wave and ground-penetrating radar detection data. The anomalous reflection points in the stack velocity spectrum with the characteristics of fracture zones are identified according to the seismic reflection signal, and a three-dimensional tunnel model is constructed to judge the area of the fractured rock mass in front of the tunnel face. The algorithm for the identification of fracture zones is realized based on the increased amplitude, increased center frequency, and phase change in the radar reflection waveforms that occur when electromagnetic waves contact a broken rock body. The results show that the prediction results of the fracture zone are consistent with the actual excavation results of the Liangwangshan Tunnel in Yunnan Province, China.

2. Characteristics of the Detected Signal in Fracture Zones

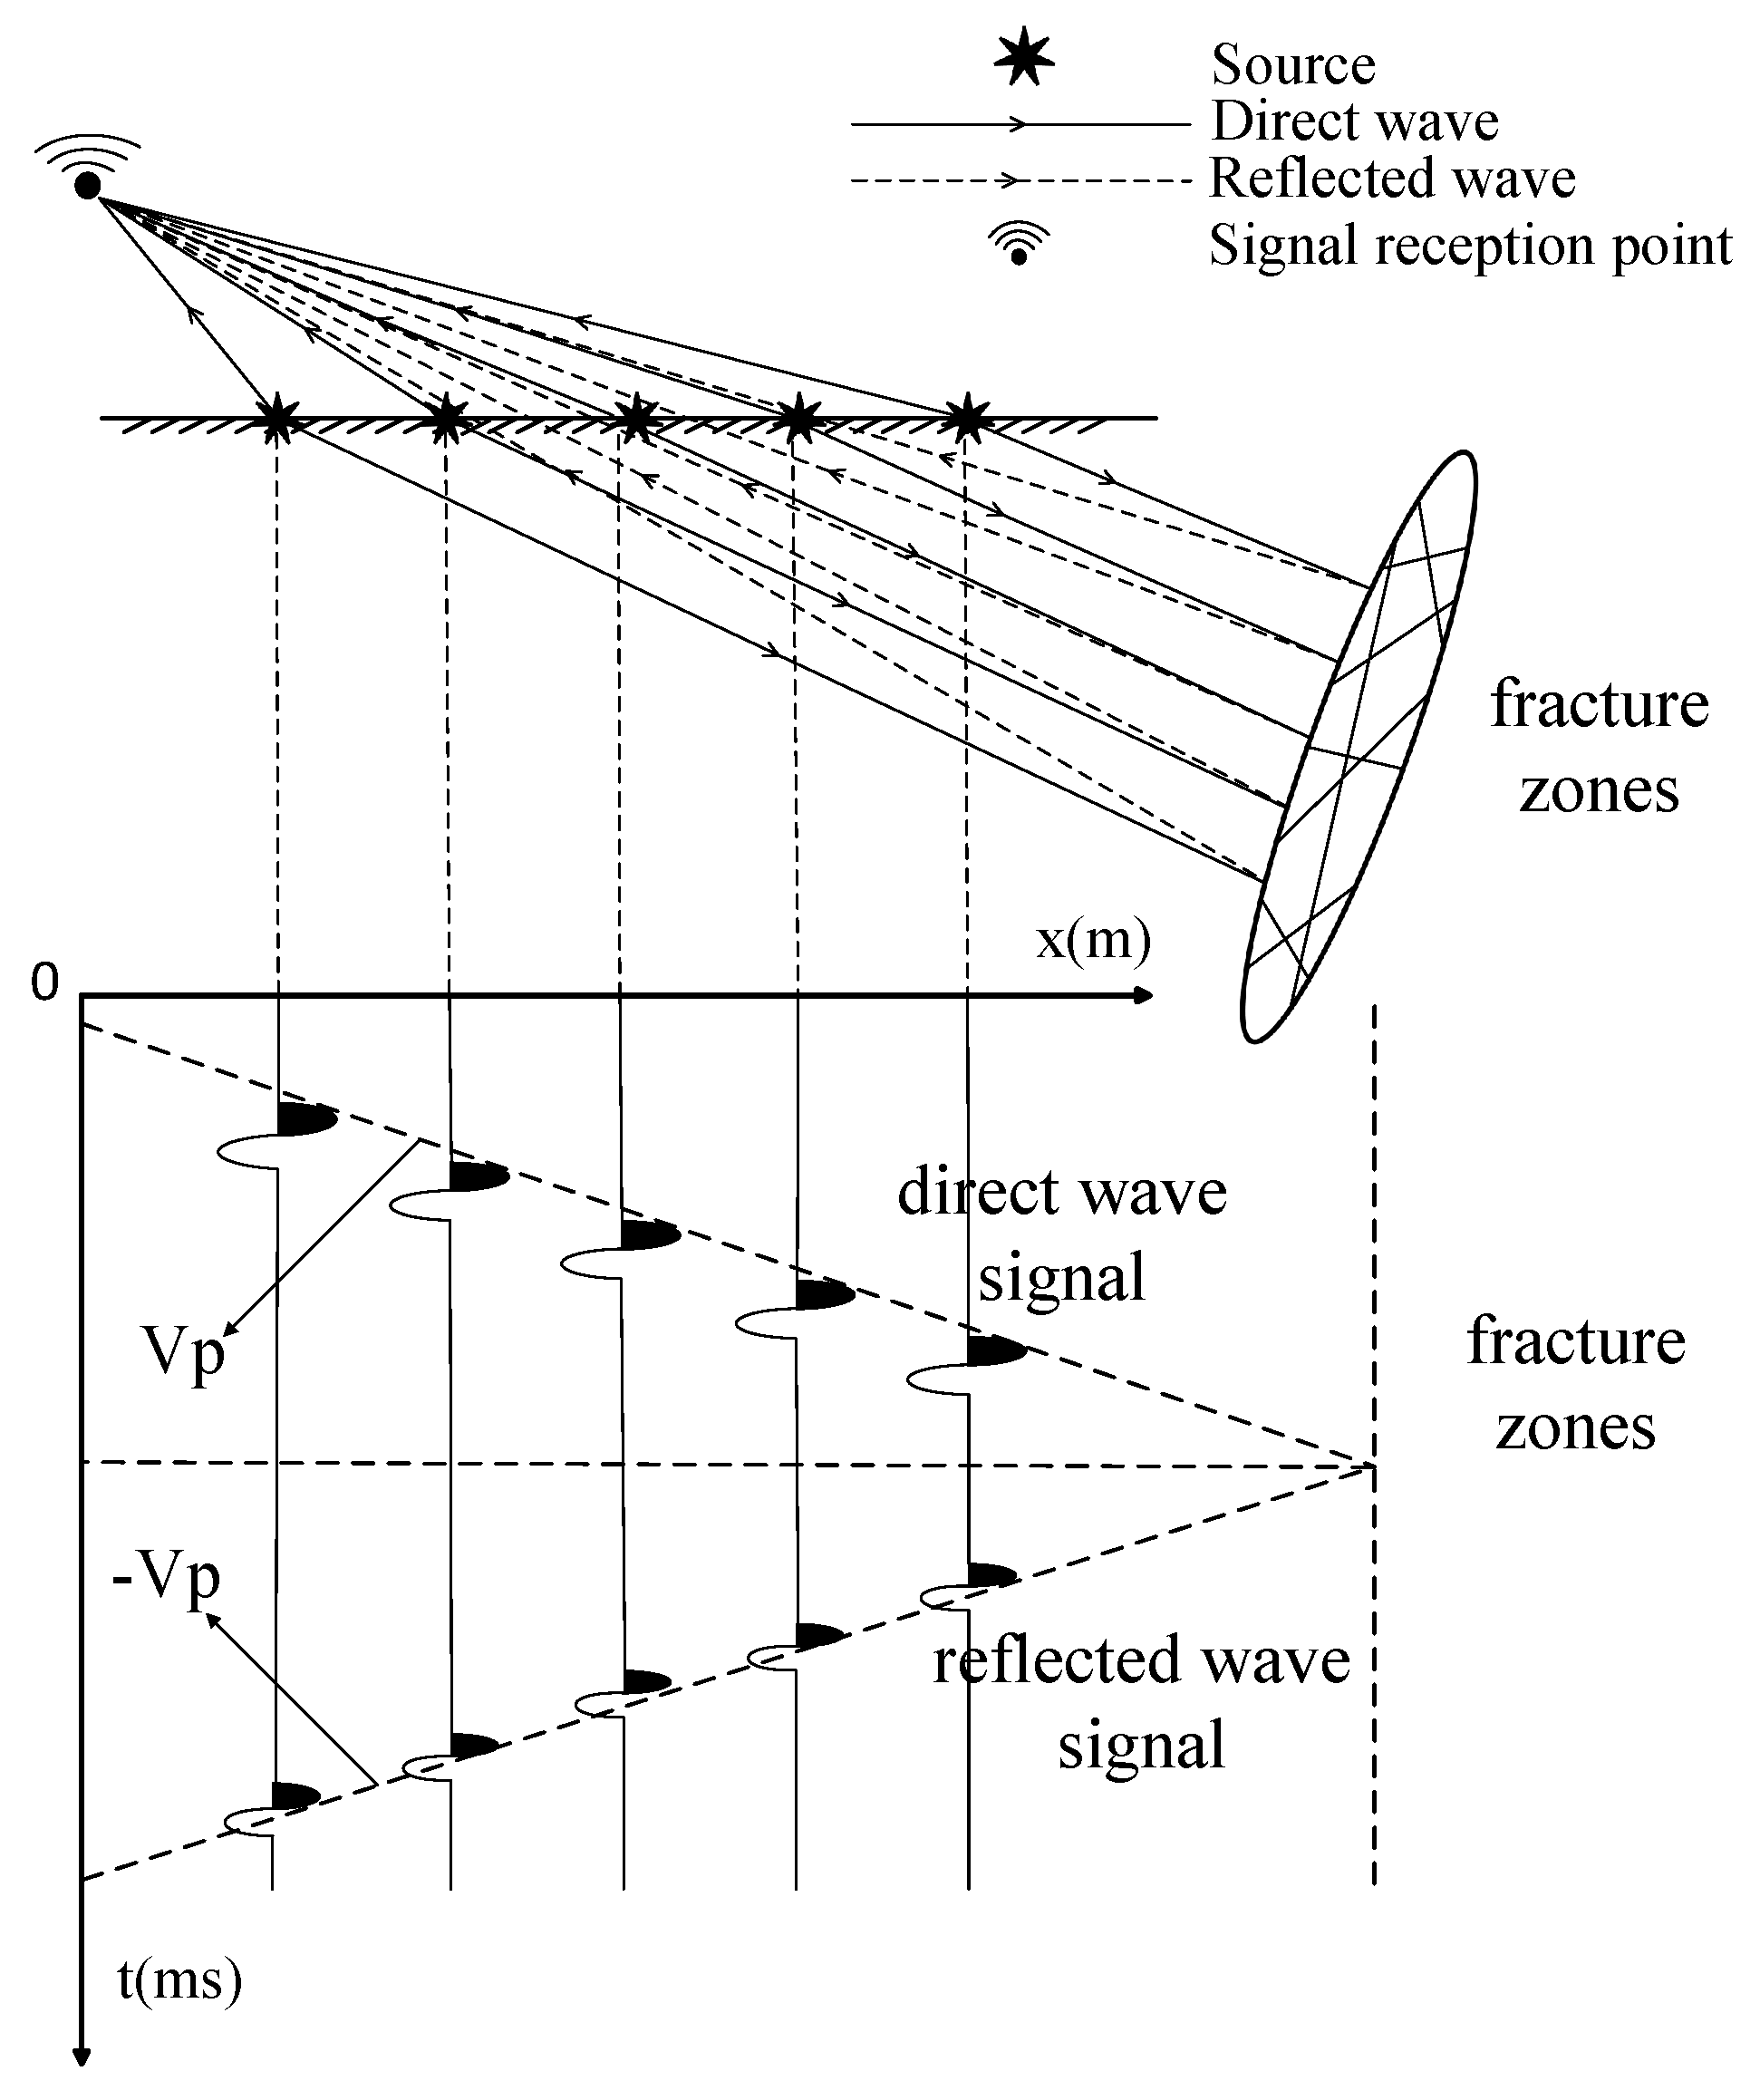
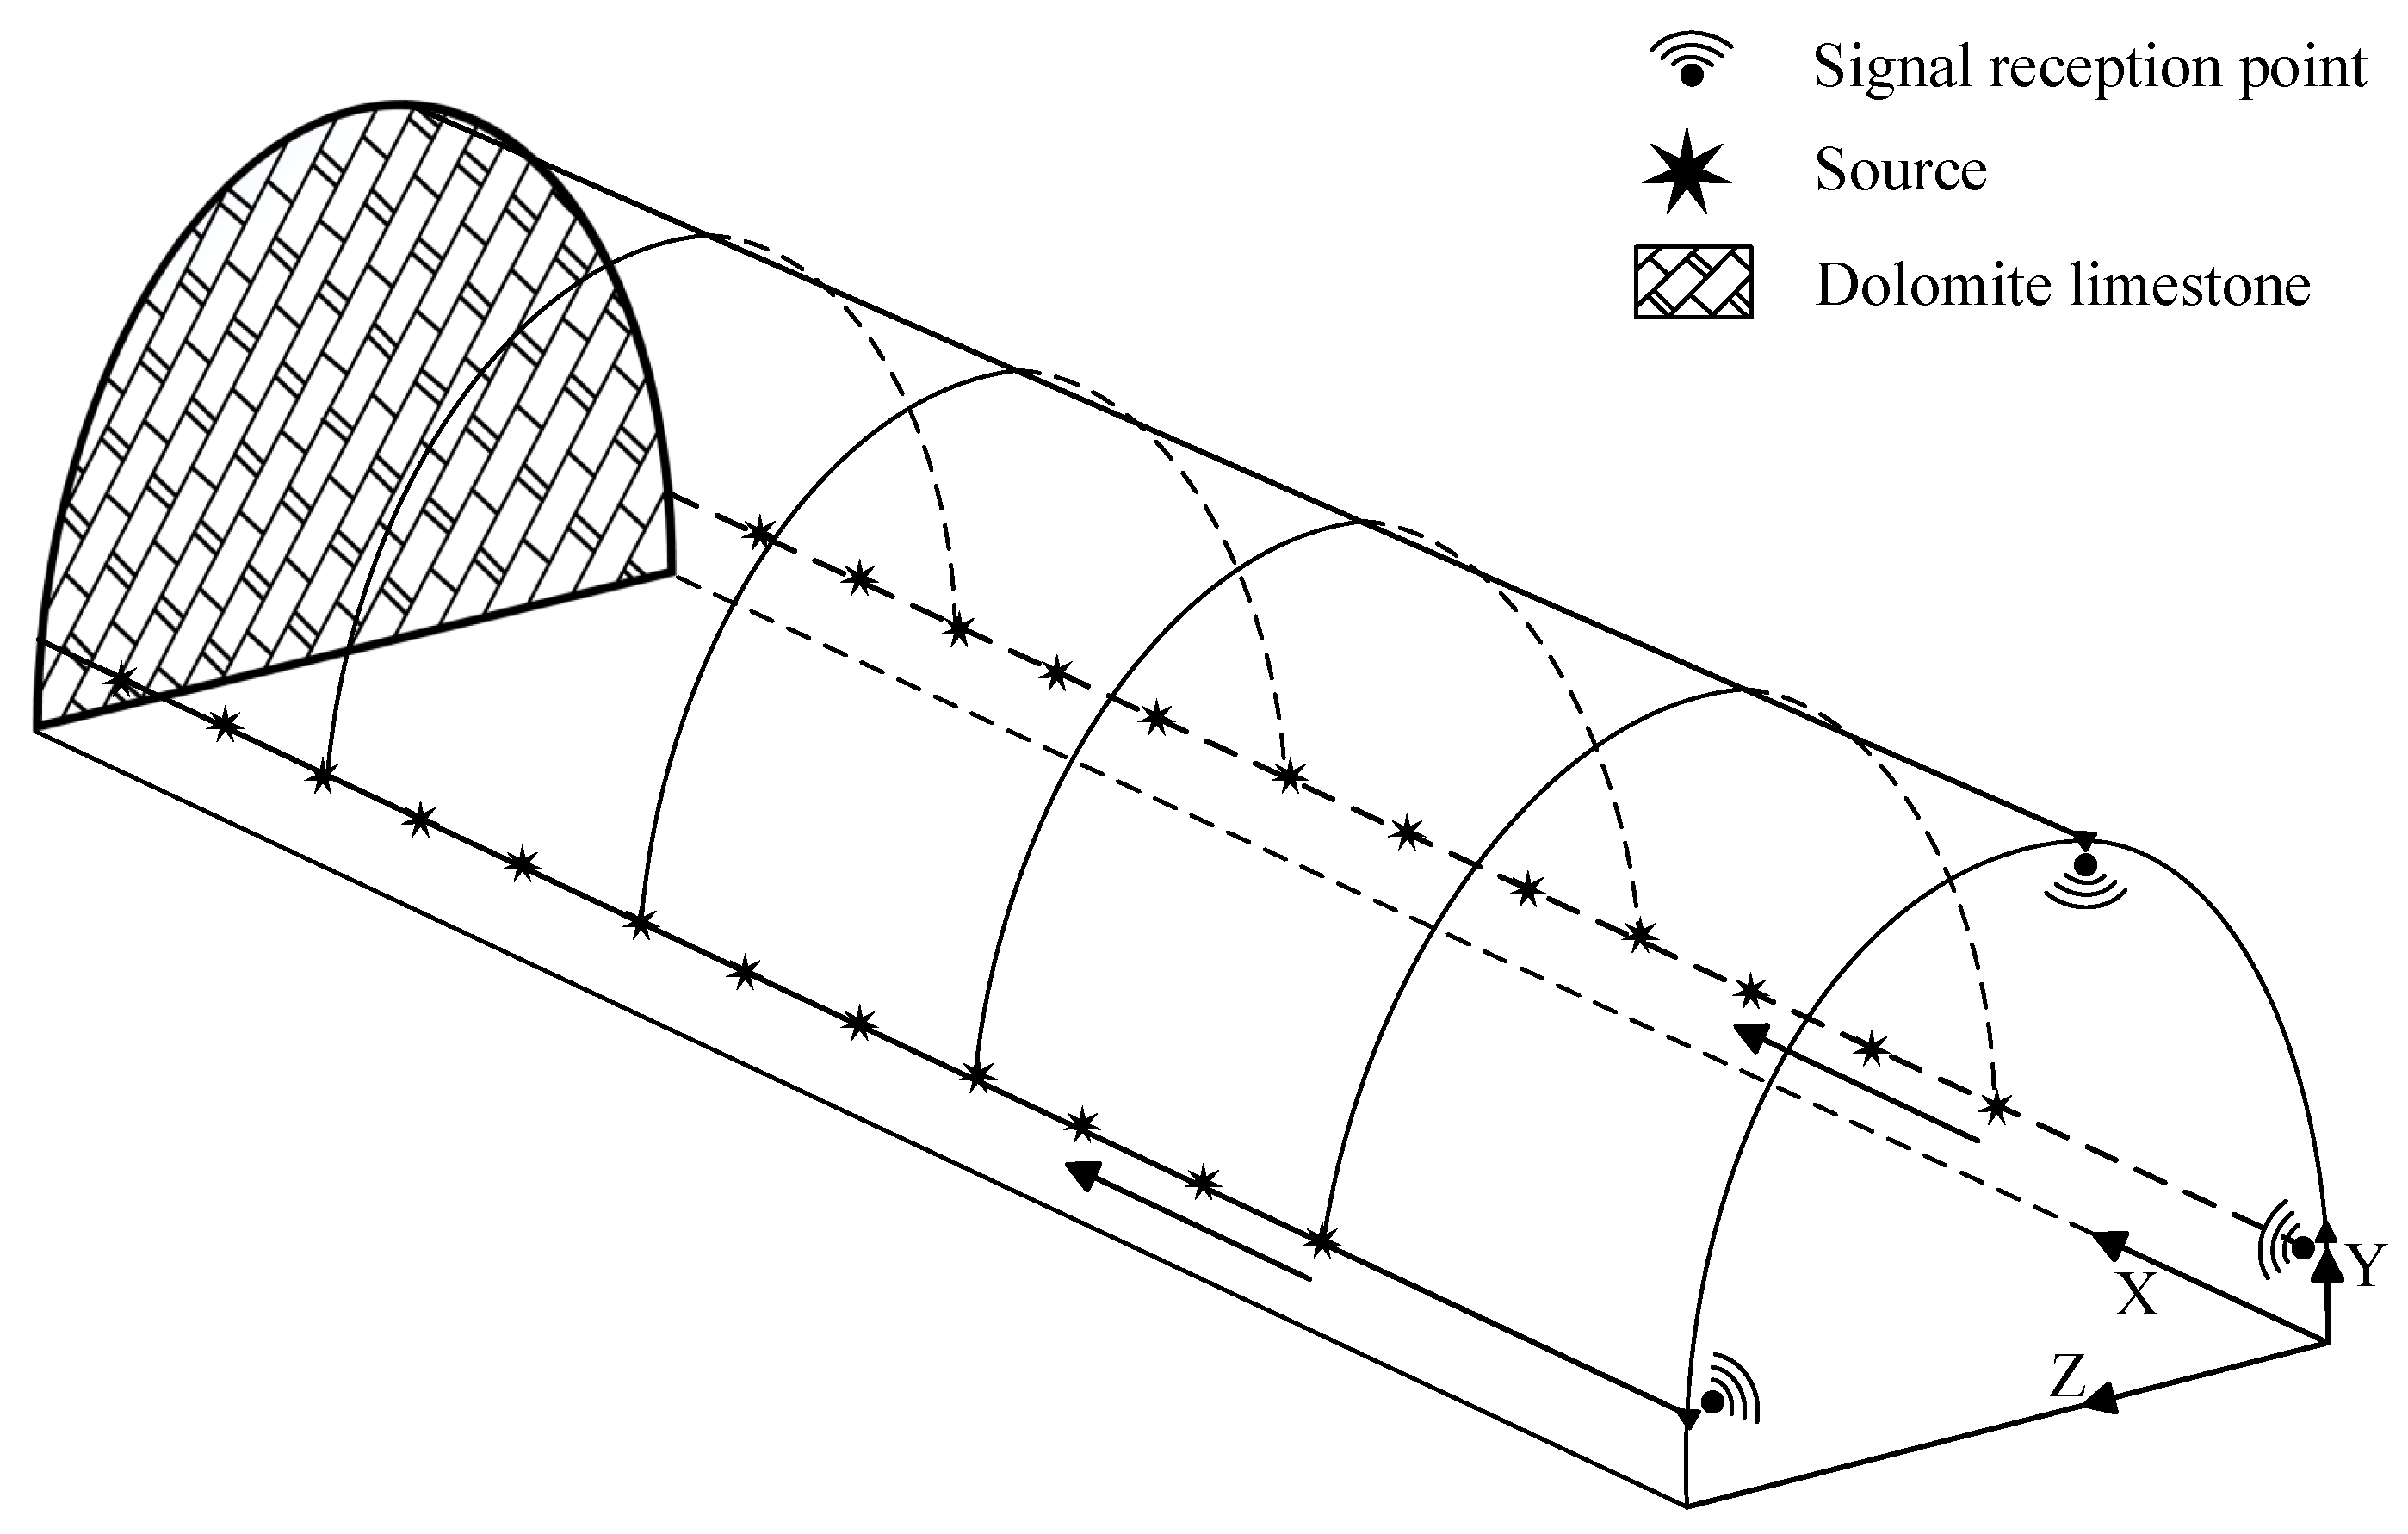
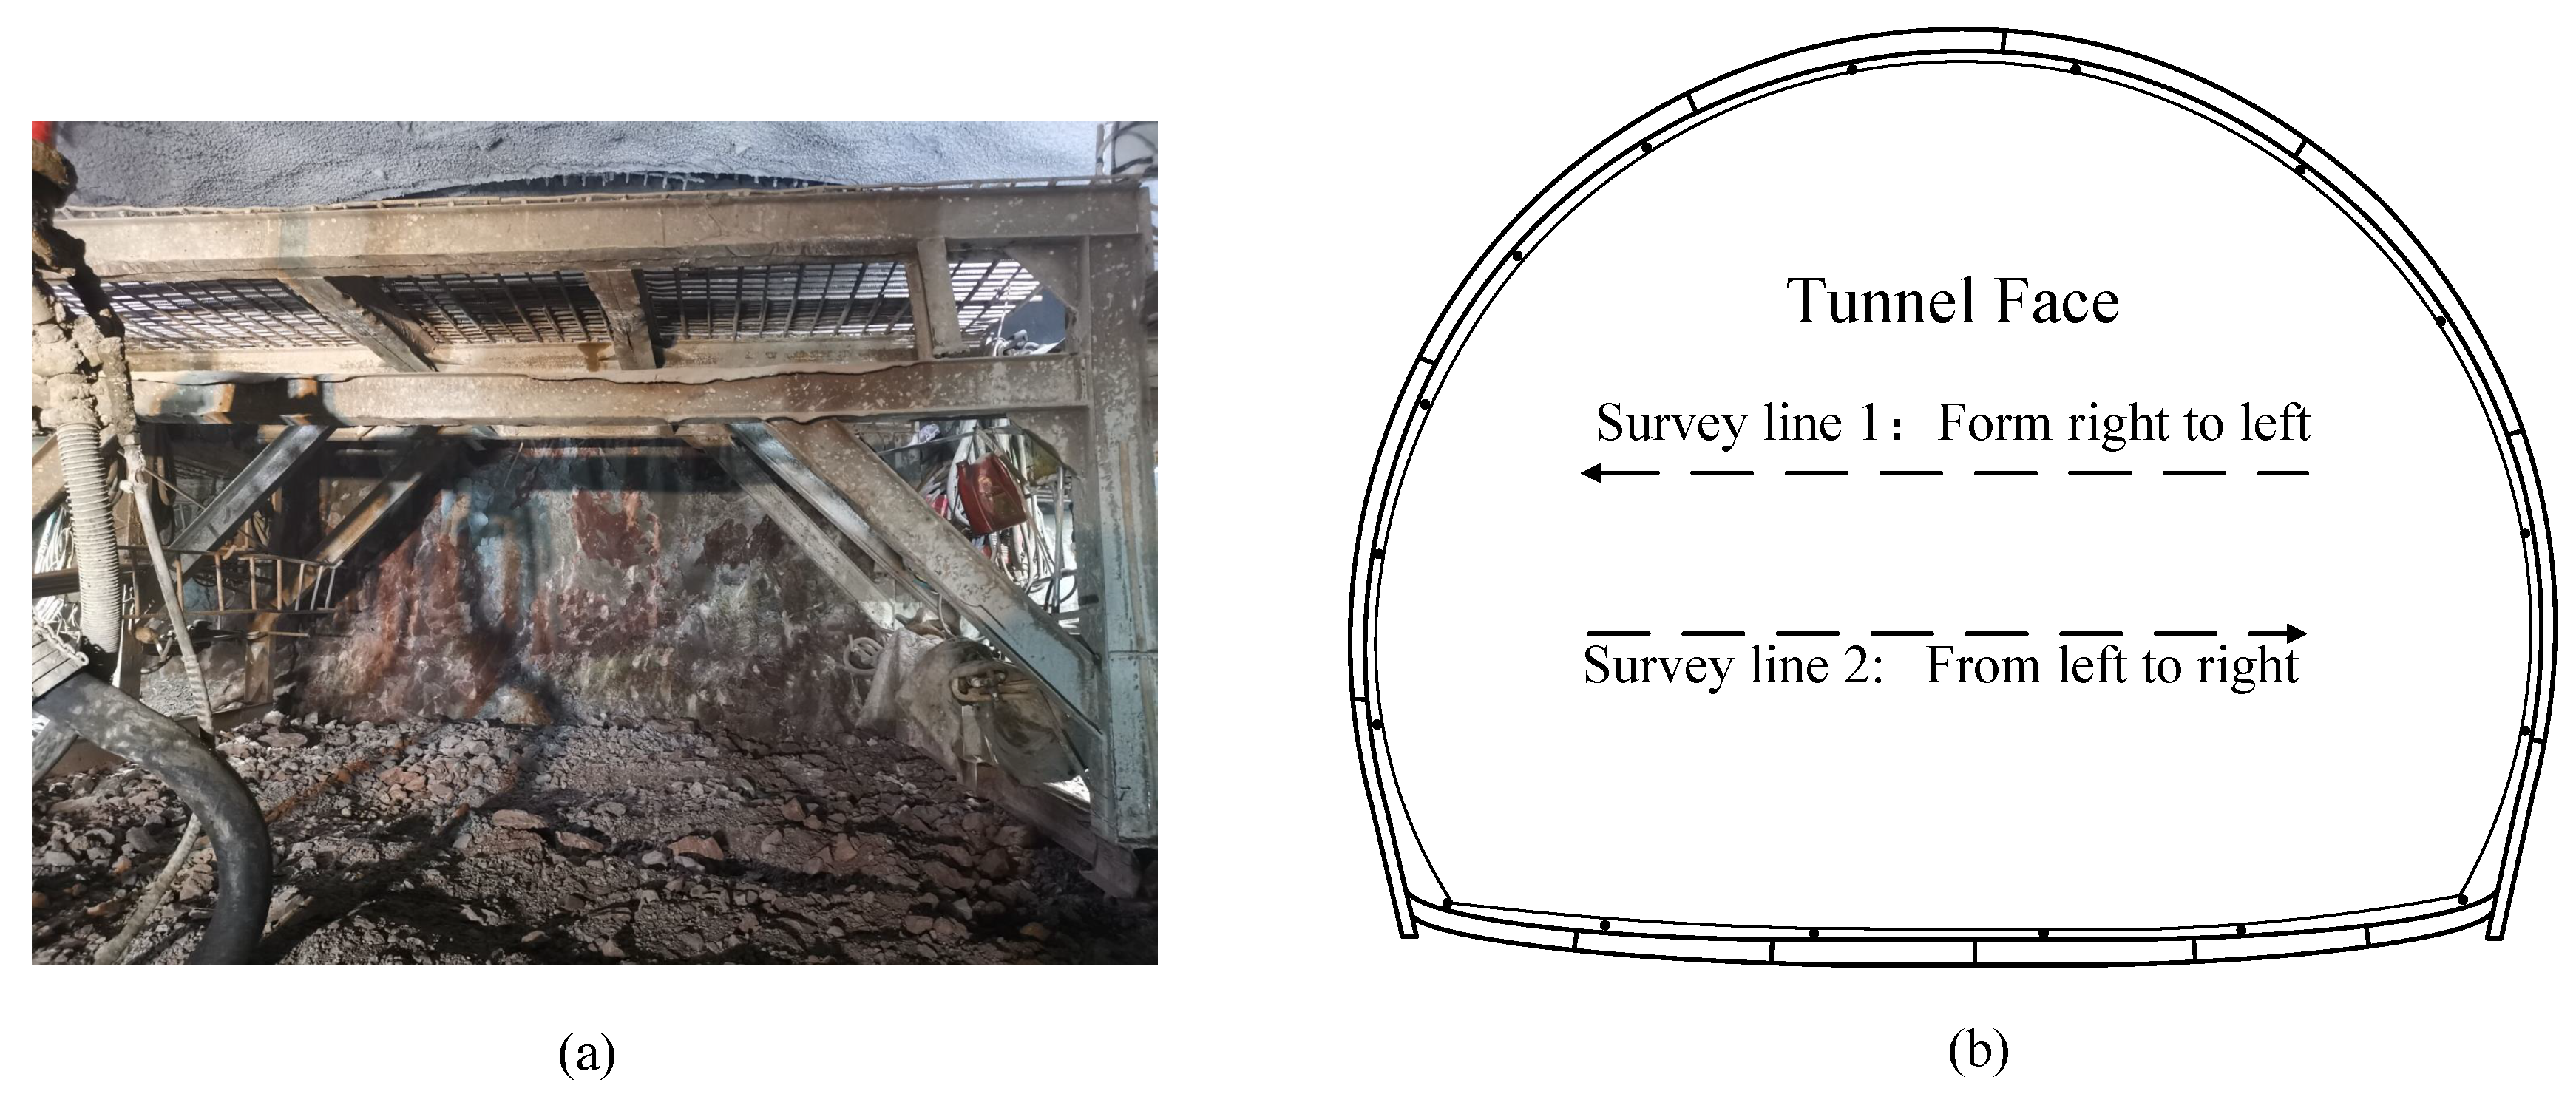
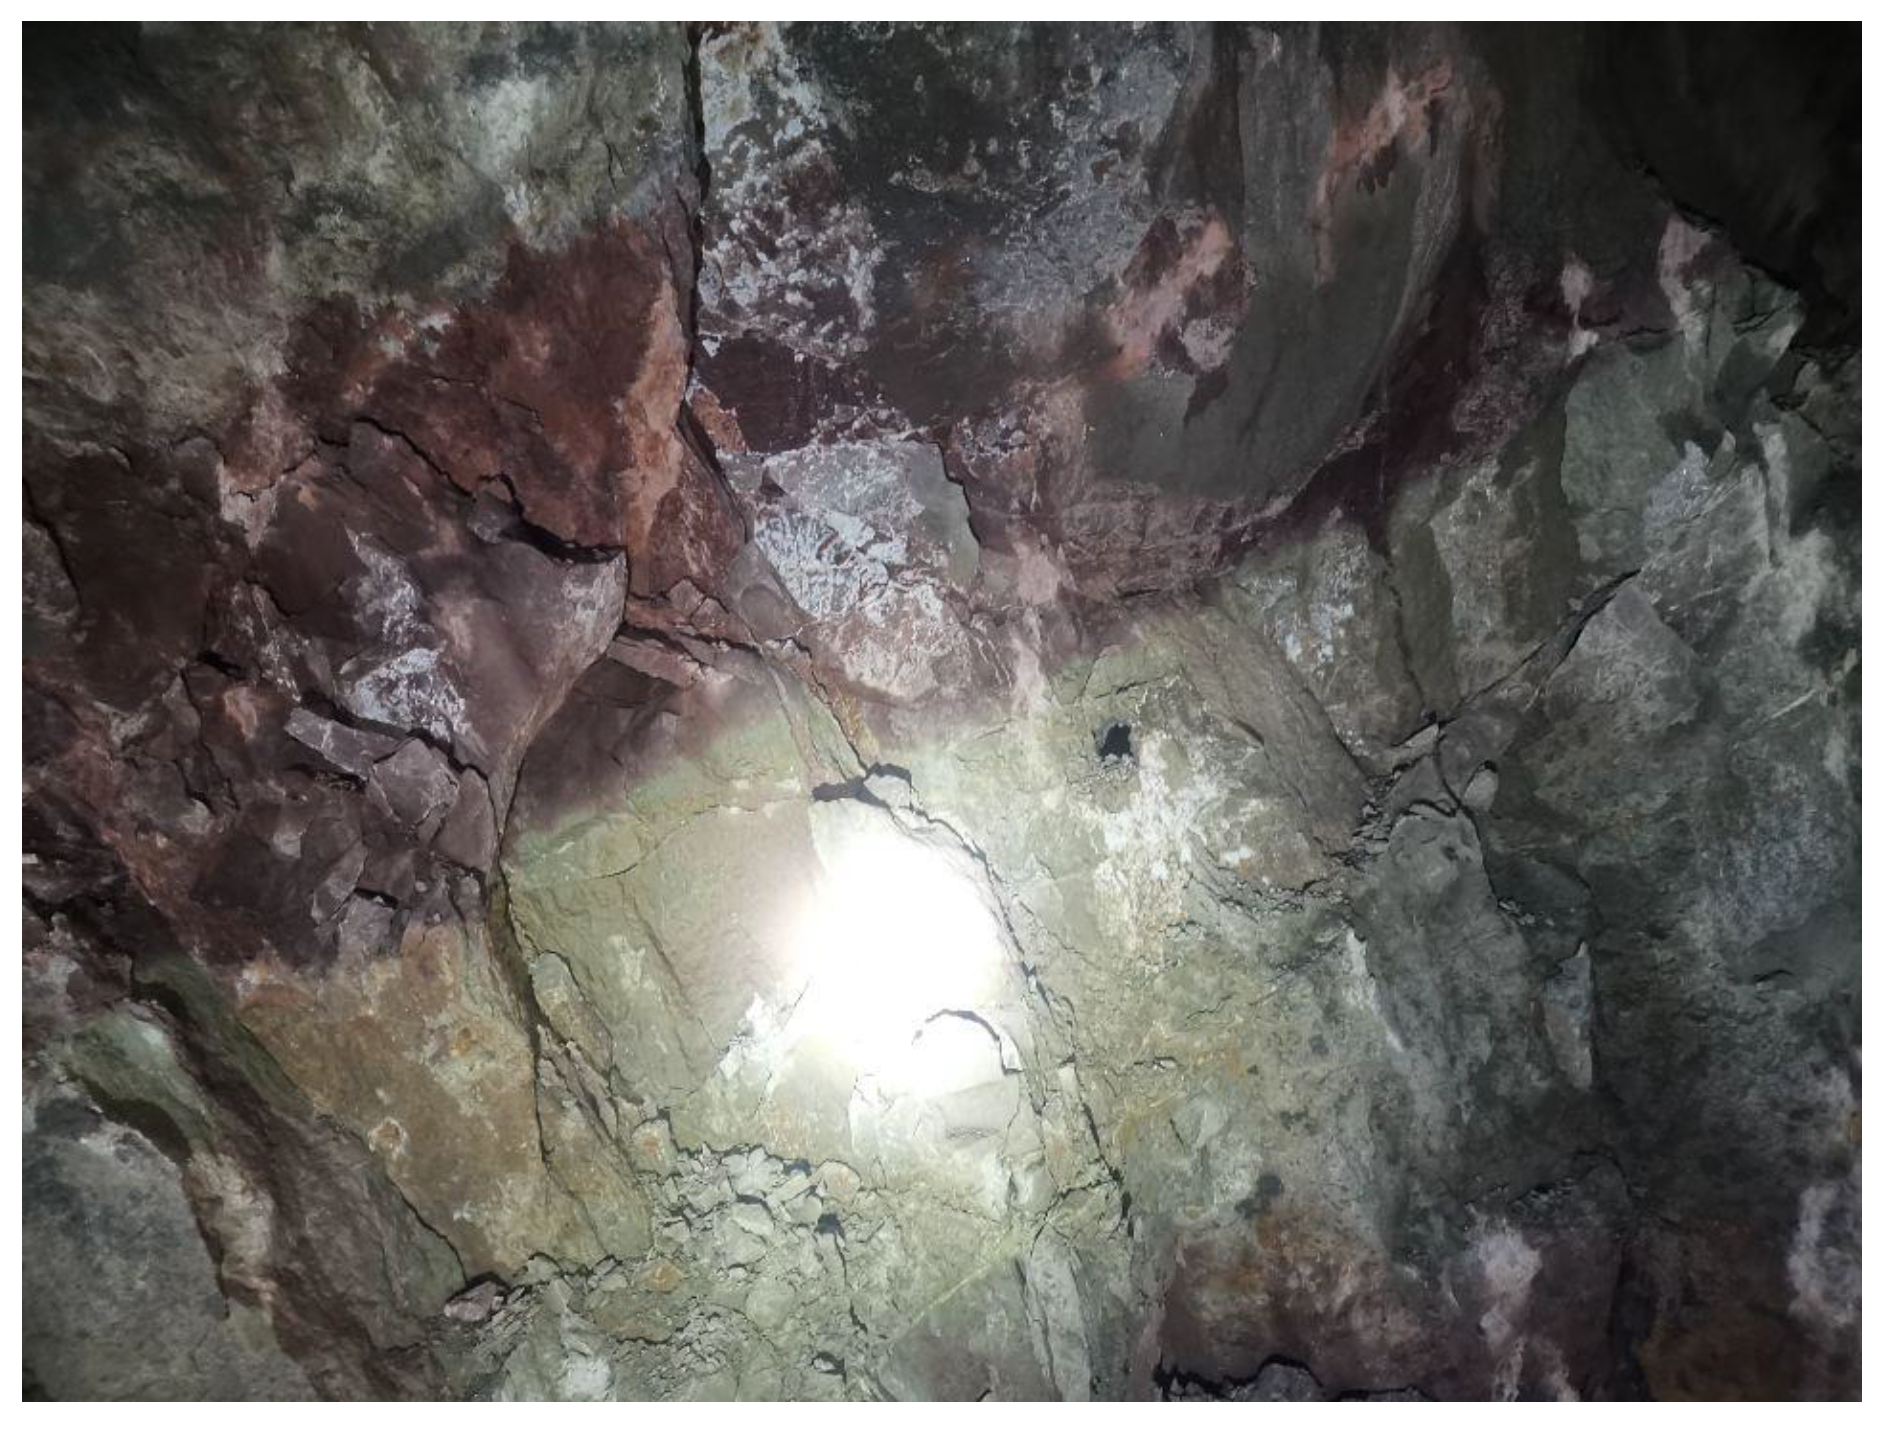
2.1. Characteristics of Seismic Wave Data in Fracture Zones

Seismic waves are reflected when they encounter different wave impedance interfaces during propagation. The principle of seismic wave detection is shown in Figure 1. Geological changes in front of the tunnel face, as well as the distribution and nature of hazardous bodies, can be detected according to changes in the amplitude and wave velocity of seismic wave reflection signals. Because a reflected wave takes longer to travel, the receiving point first receives a direct wave signal, and the amplitude of the reflected wave becomes smaller than that of the direct wave, separating the reflected wave from the direct wave and other interfering signals, further enabling the identification of fracture zones by analyzing changes in reflected wave signals.
The changes in reflected waves depend on the reflection coefficient, which is expressed as
R = ρ 2 V P 2 ρ 1 V P 1 ρ 2 V P 2 + ρ 1 V P 1
where ρ 1 and ρ 2 are the rock densities on both sides of the reflecting interface, and V P 1 and V P 2 are the seismic wave propagation velocities on both sides of the reflecting interface.
The reflection coefficient varies as seismic waves encounter interfaces with different wave impedances during propagation according to Equation (1). Positive reflection occurs when seismic waves transition from interfaces with low wave impedance to those with high wave impedance. Conversely, negative reflection is observed when they transition from interfaces with high wave impedance to those with low wave impedance.
Spatial imaging of the collected 3D signal data in front of the tunnel face enables the visualization of information about the location of abnormal reflected interfaces based on the principles of the seismic wave common reflection surface (CRS) and diffraction scanning offset superposition. The principle of diffraction scanning offset superposition is shown in Figure 2.
The diffraction scanning offset superposition principle involves relocating the reflected waves to their actual positions. The exploration area is divided into a grid to achieve this, with each point treated as a reflection point. The process entails a systematic scan along the grid points. Let P represent a reflection point on the reflecting interface, where the travel time t i j of the reflected wave, generated by the source point S i and received by the detection point R j , can be determined as follows:
t i j = H 2 + X P X S i 2 + H 2 + X R j X P 2 V
where H is the vertical depth of the scanning point P; X P , X S i , and X R j are the horizontal coordinates of scanning point P, source point S i , and detector R j ; and t i j is the vertical two-way travel time of scanning point P.
The amplitude values a t i j of n receiver channels from m different sources passing through the same scanning point P are superimposed, and the total amplitude is calculated:
a Σ = i = 1 m j = 1 n a t i j P
Drawing upon the principles of CRS theory, Equation (3) highlights the cumulative amplitude augmentation of points along the reflection interface, contrasting with the relatively diminished total amplitude of points away from the reflection interface. Consequently, the reflection interface is prominently highlighted and accurately repositioned in three-dimensional space, delineating the spatial distribution of fracture zones. This approach aims to discern and enhance information on subsurface structures in seismic data, thereby amplifying the efficacy of signals. This method offers heightened precision in depicting subsurface structures by accentuating the energy and coherence along the identical phase axis of weakly reflected waves. It emphasizes the region of reflected energy in the fracture zones.

2.2. Characteristics of GPR Detection Data in Fracture Zones

Ground-penetrating radar operates by transmitting high-frequency electromagnetic waves toward a target using a transmitting antenna and capturing the reflected waves via a receiving antenna. During propagation, electromagnetic waves encounter electrical differences in the stratum or target body, resulting in reflection. The working principle of GPR in detecting fracture zones in front of the tunnel face is illustrated in Figure 3. The spatial location of the fracture zone is deduced by analyzing the waveform, amplitude intensity, and phase variation characteristics of the received reflected electromagnetic waves.
When an electromagnetic wave propagates in a propagation medium, the propagation constant is described by the attenuation coefficient and phase coefficient of the amplitude of the electromagnetic wave, which are expressed as follows:
k = α + j β
where α and β are the attenuation coefficient and phase coefficient, respectively, and are expressed as follows:
α = ω μ ε 2 1 + σ ω ε 2 1 β = ω μ ε 2 1 + σ ω ε 2 + 1
where ω is the angular frequency of the electromagnetic wave; μ is the permeability of the medium; ε is the dielectric constant of the medium; and σ is the conductivity of the medium.
γ = ε 1 ε 2 ε 1 + ε 2
When an electromagnetic wave propagates from the intact surrounding rock to the fracture zone, as indicated by Equation (5), the amplitude of the reflected signal increases due to the disparity between the dielectric constants of the fracture zone and the intact rock mass. Equation (6) states that γ is negative when a wave propagates from a low-dielectric-constant medium to a high-dielectric-constant medium. The reflection coefficient is positive when a wave propagates from a high- to a low-dielectric-constant medium. Therefore, the electromagnetic wave’s phase as it enters the fracture zones from the intact surrounding rock is opposite to that as it enters the tunnel face rock from the air.

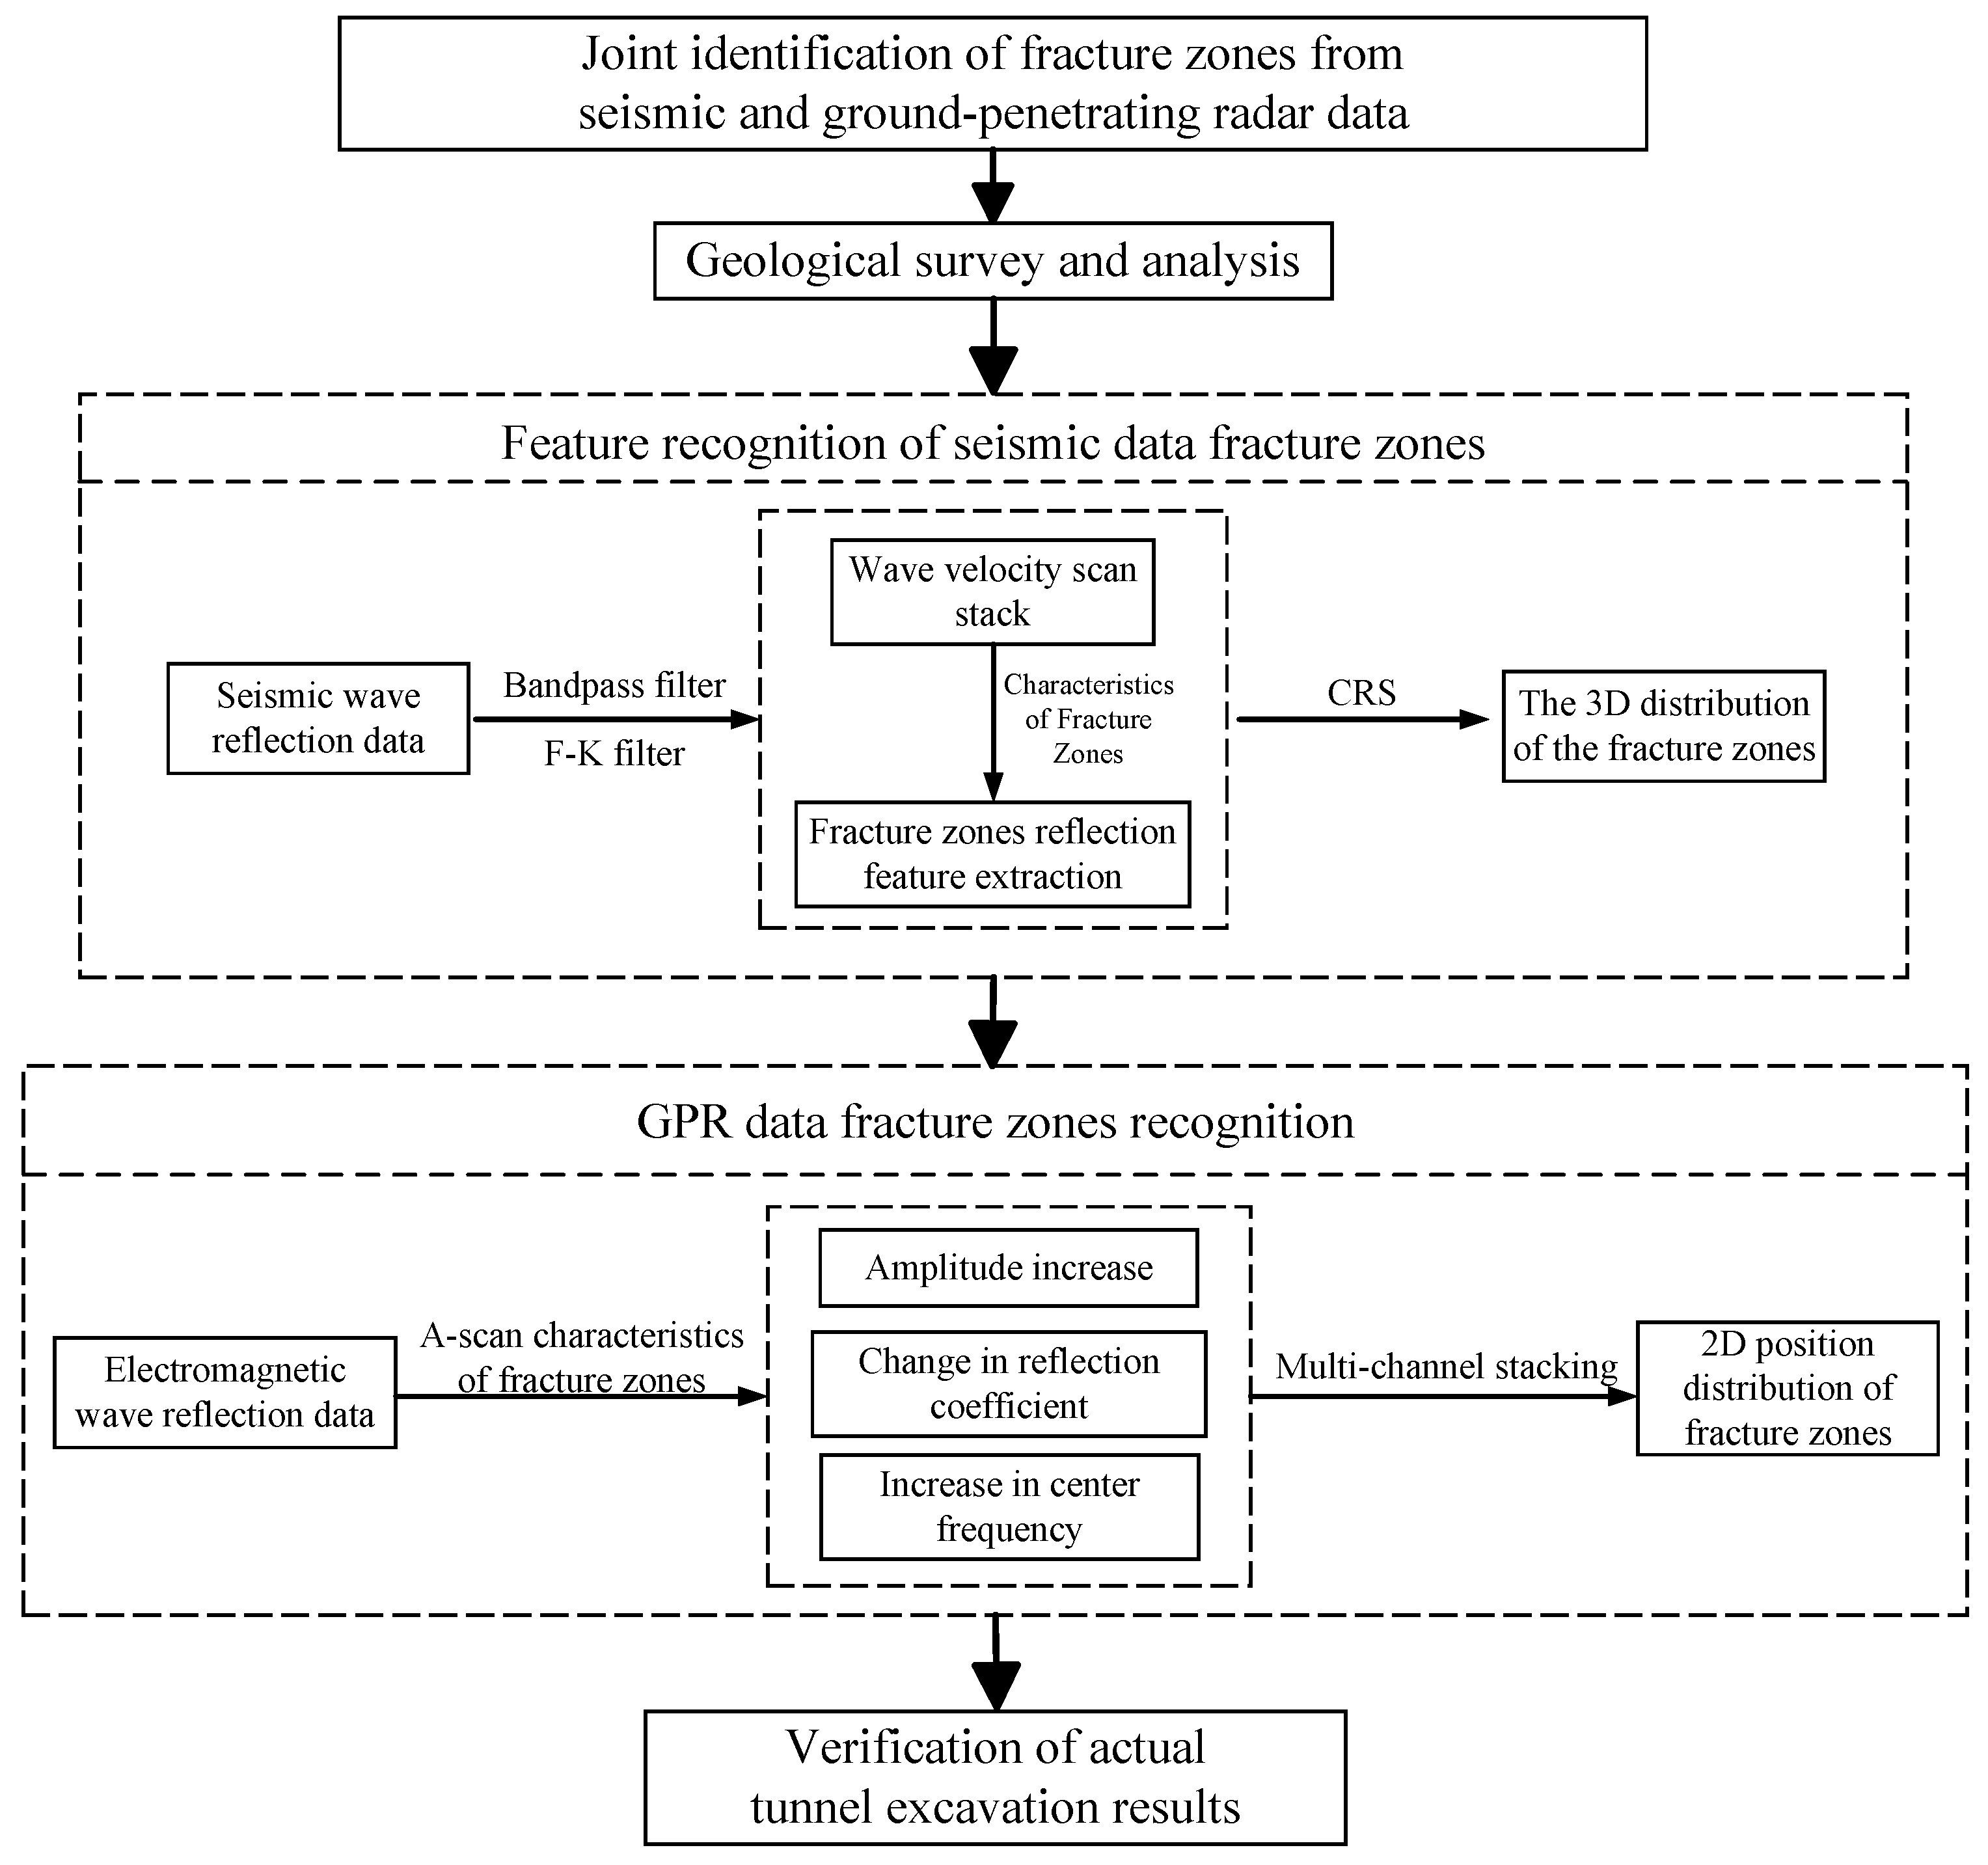
3. Recognition of Tunnel Fracture Zones

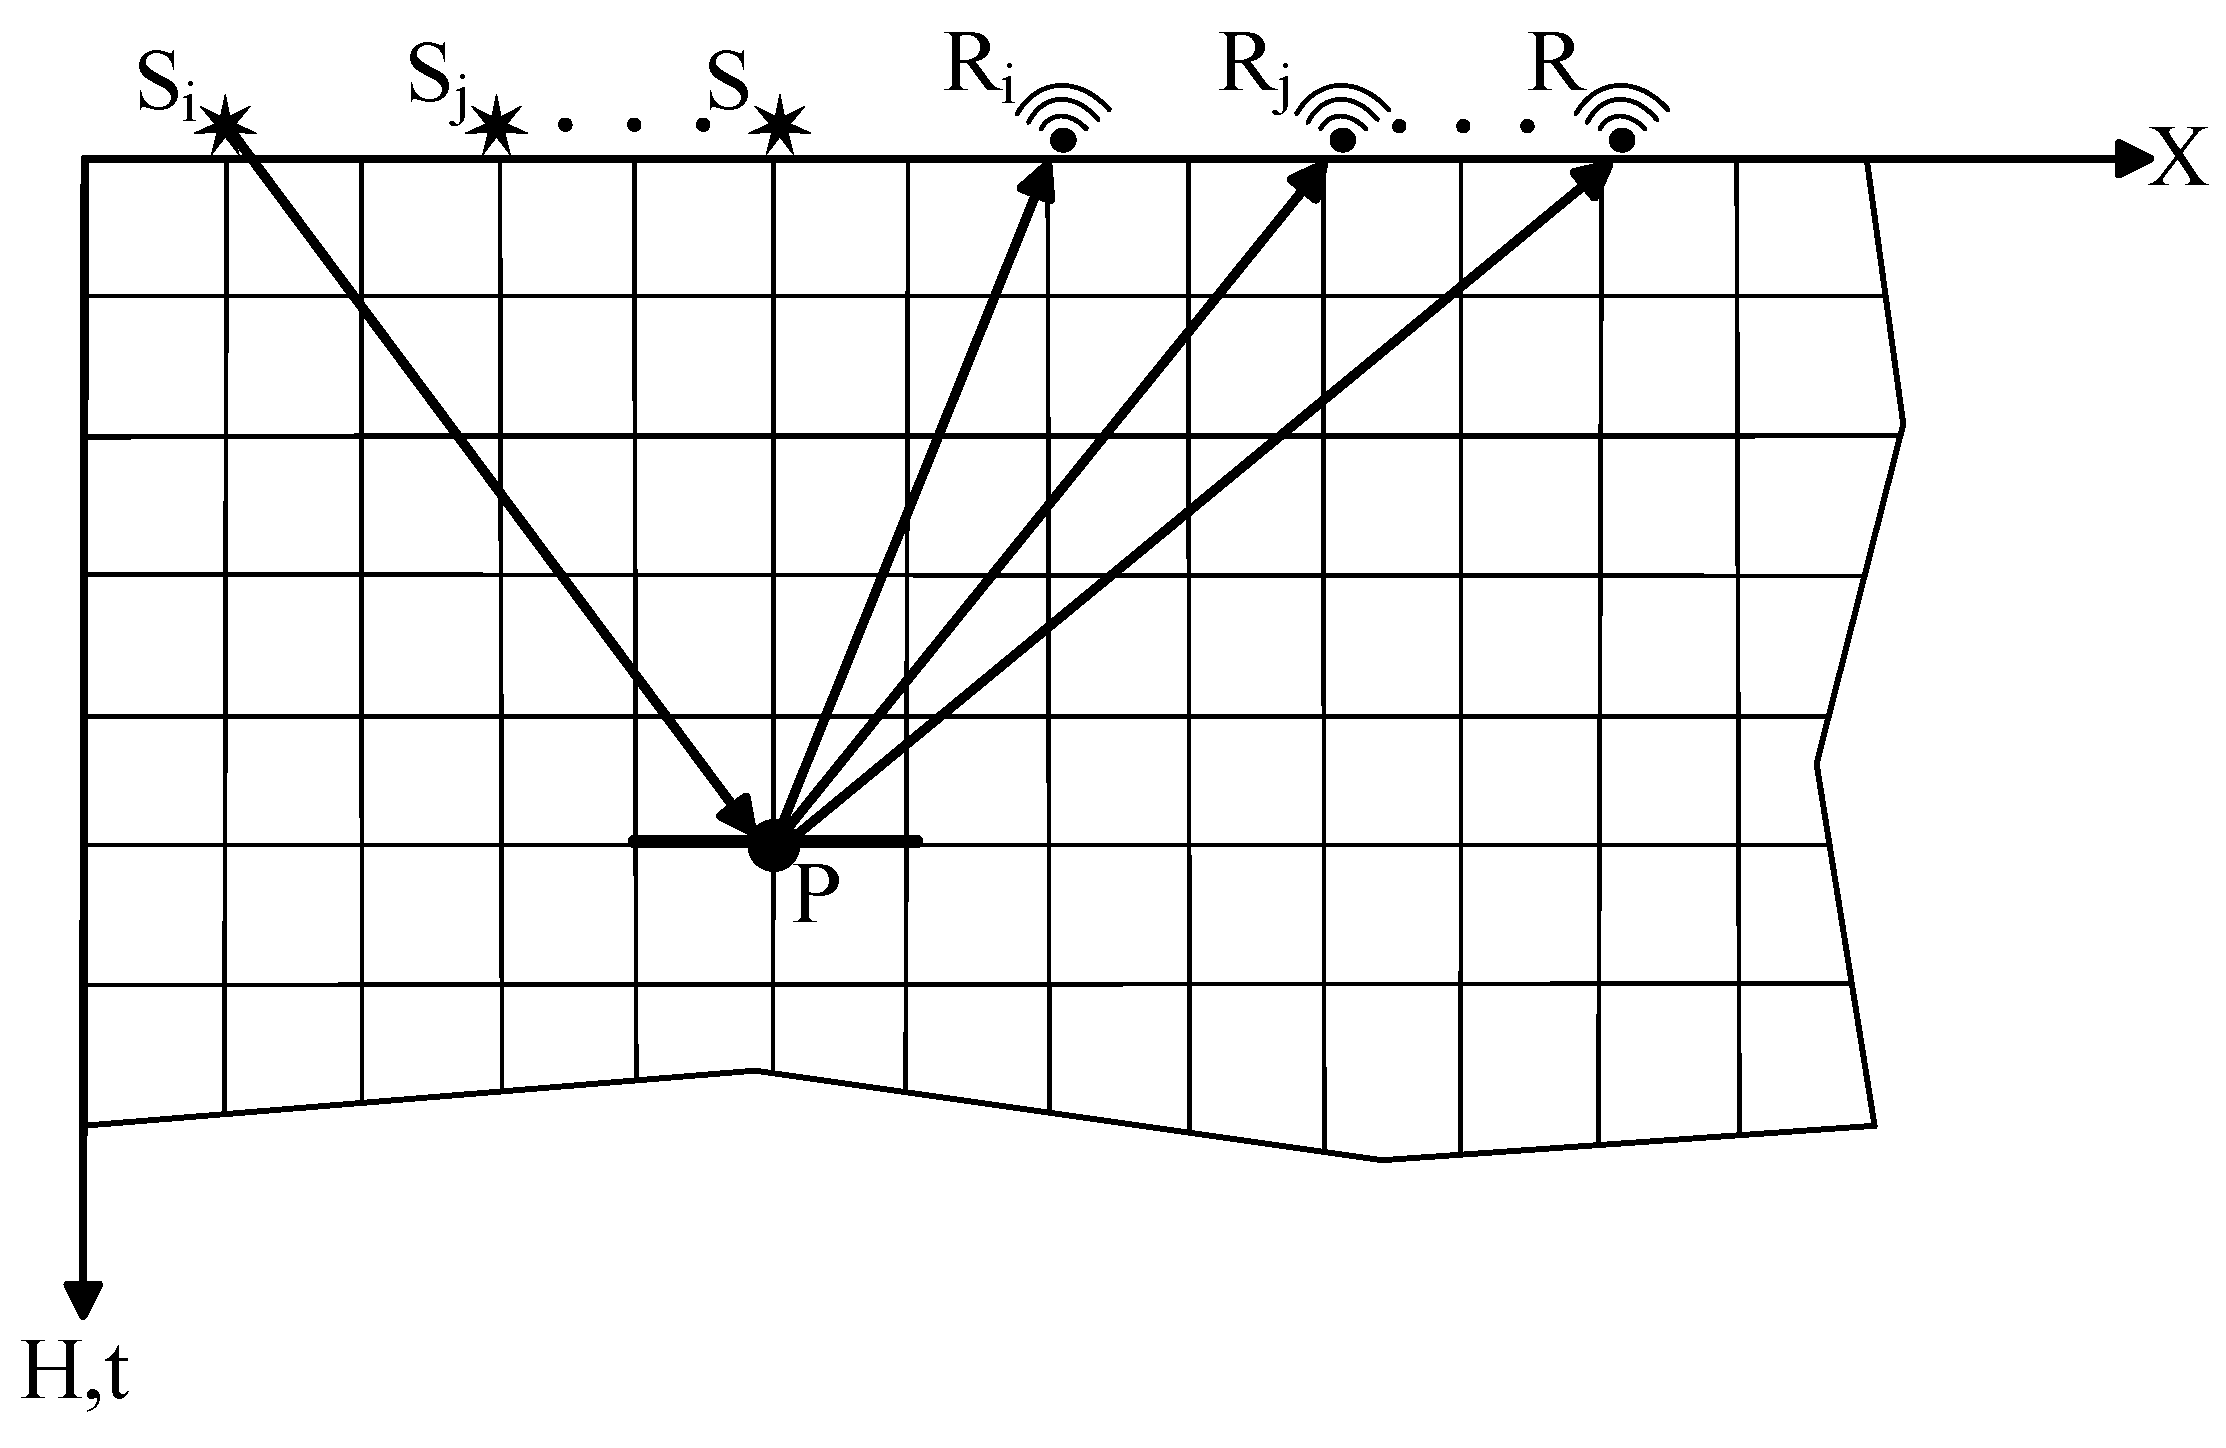
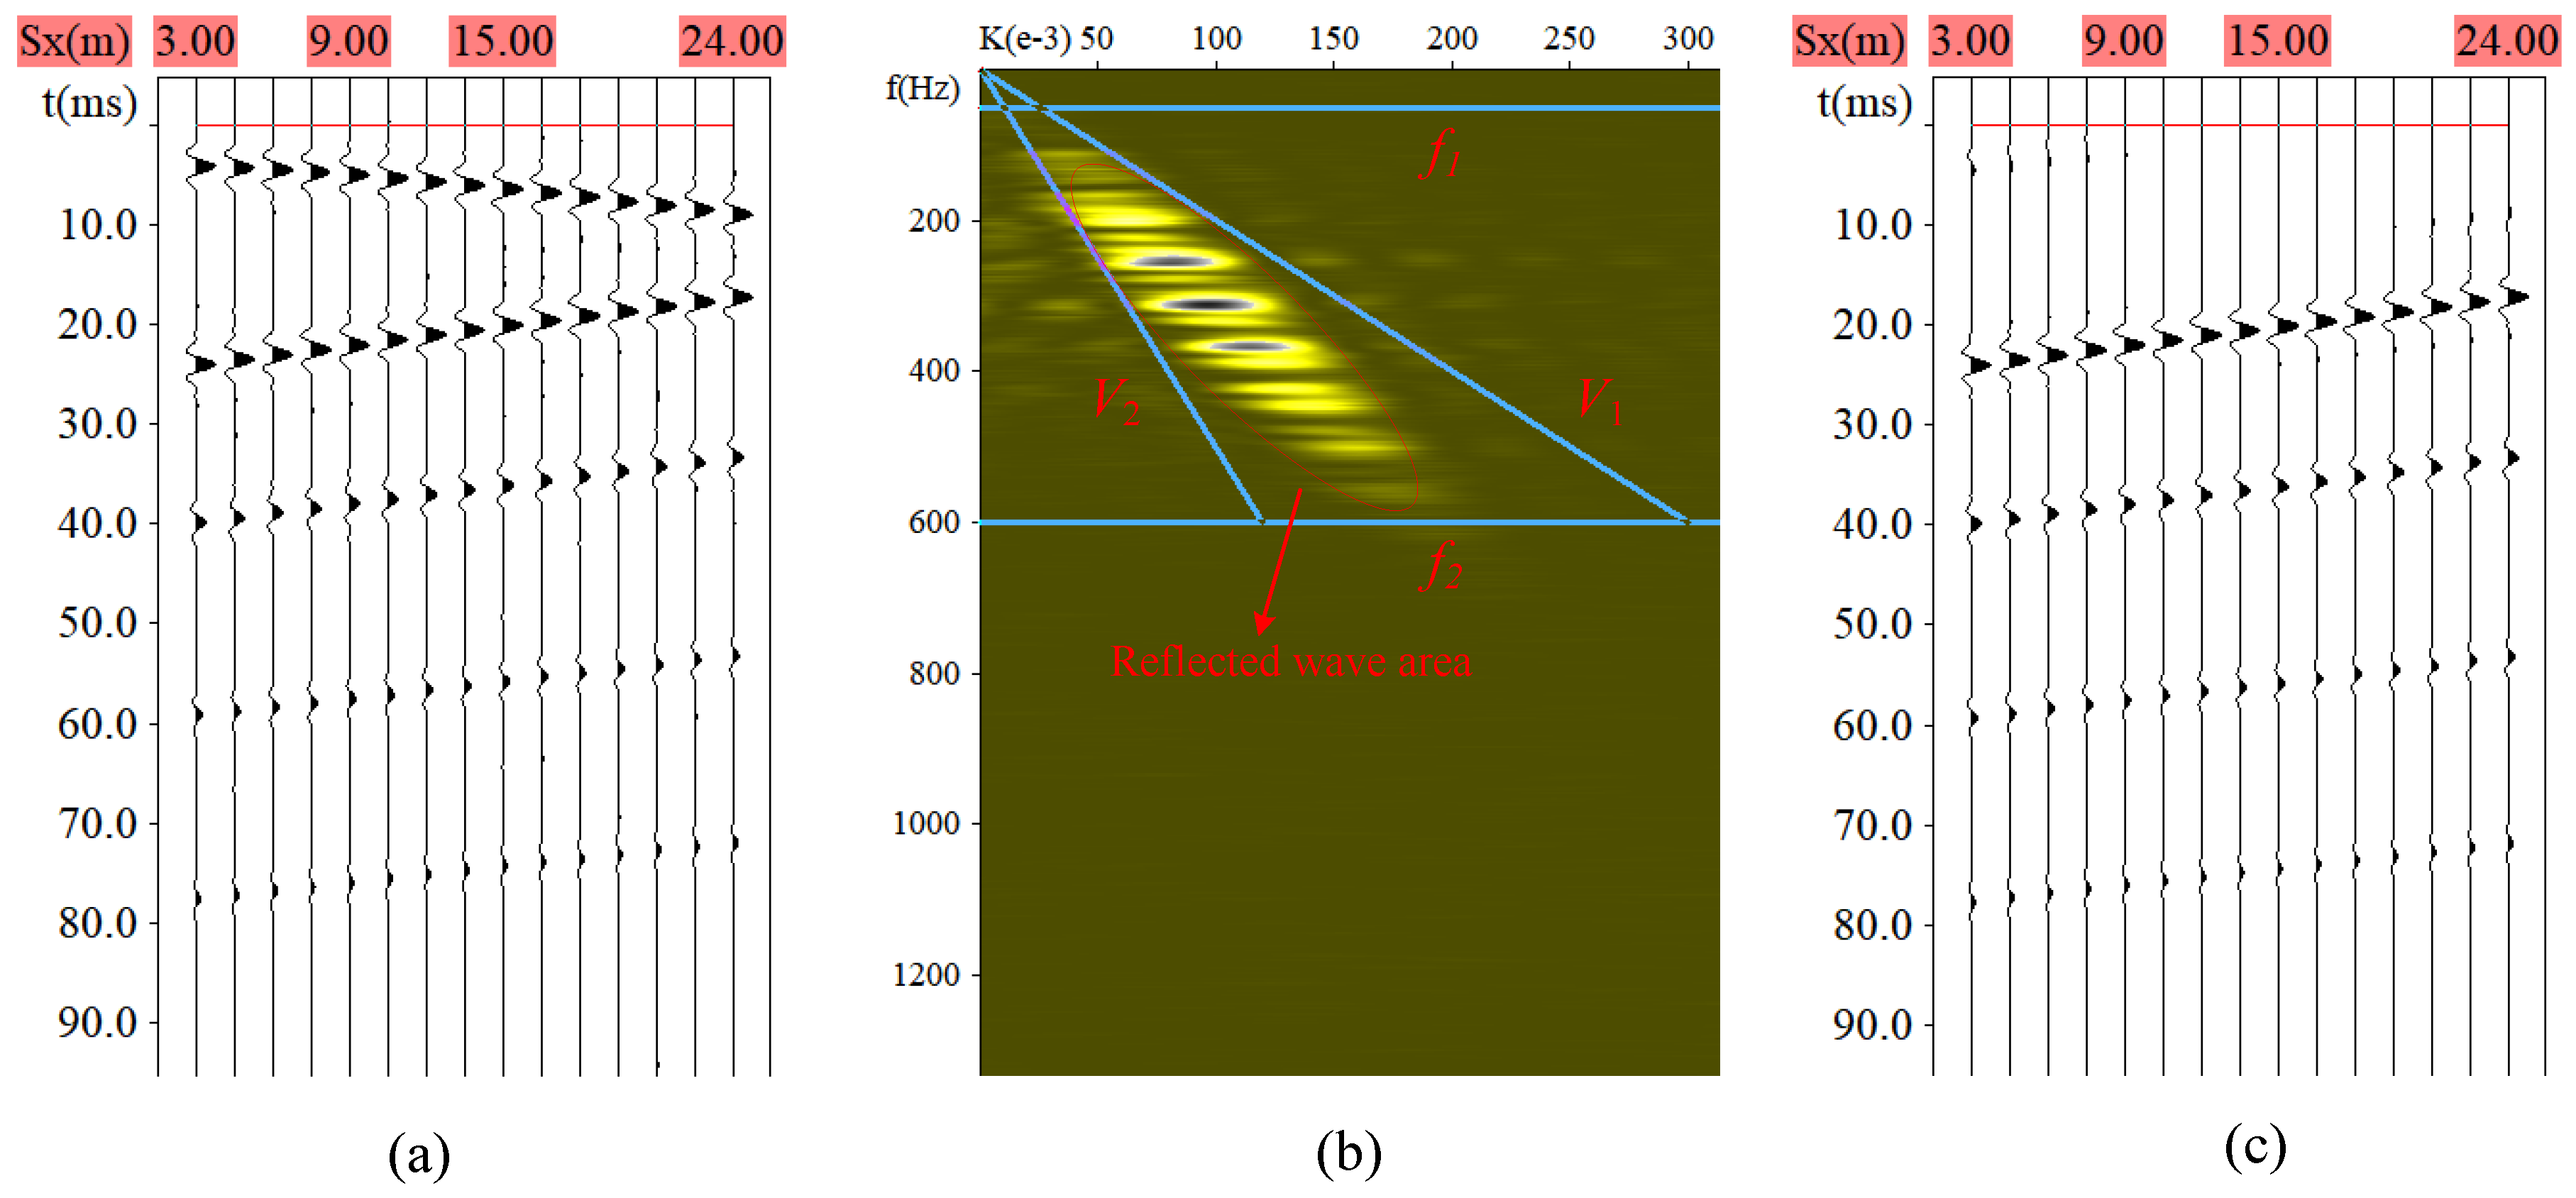
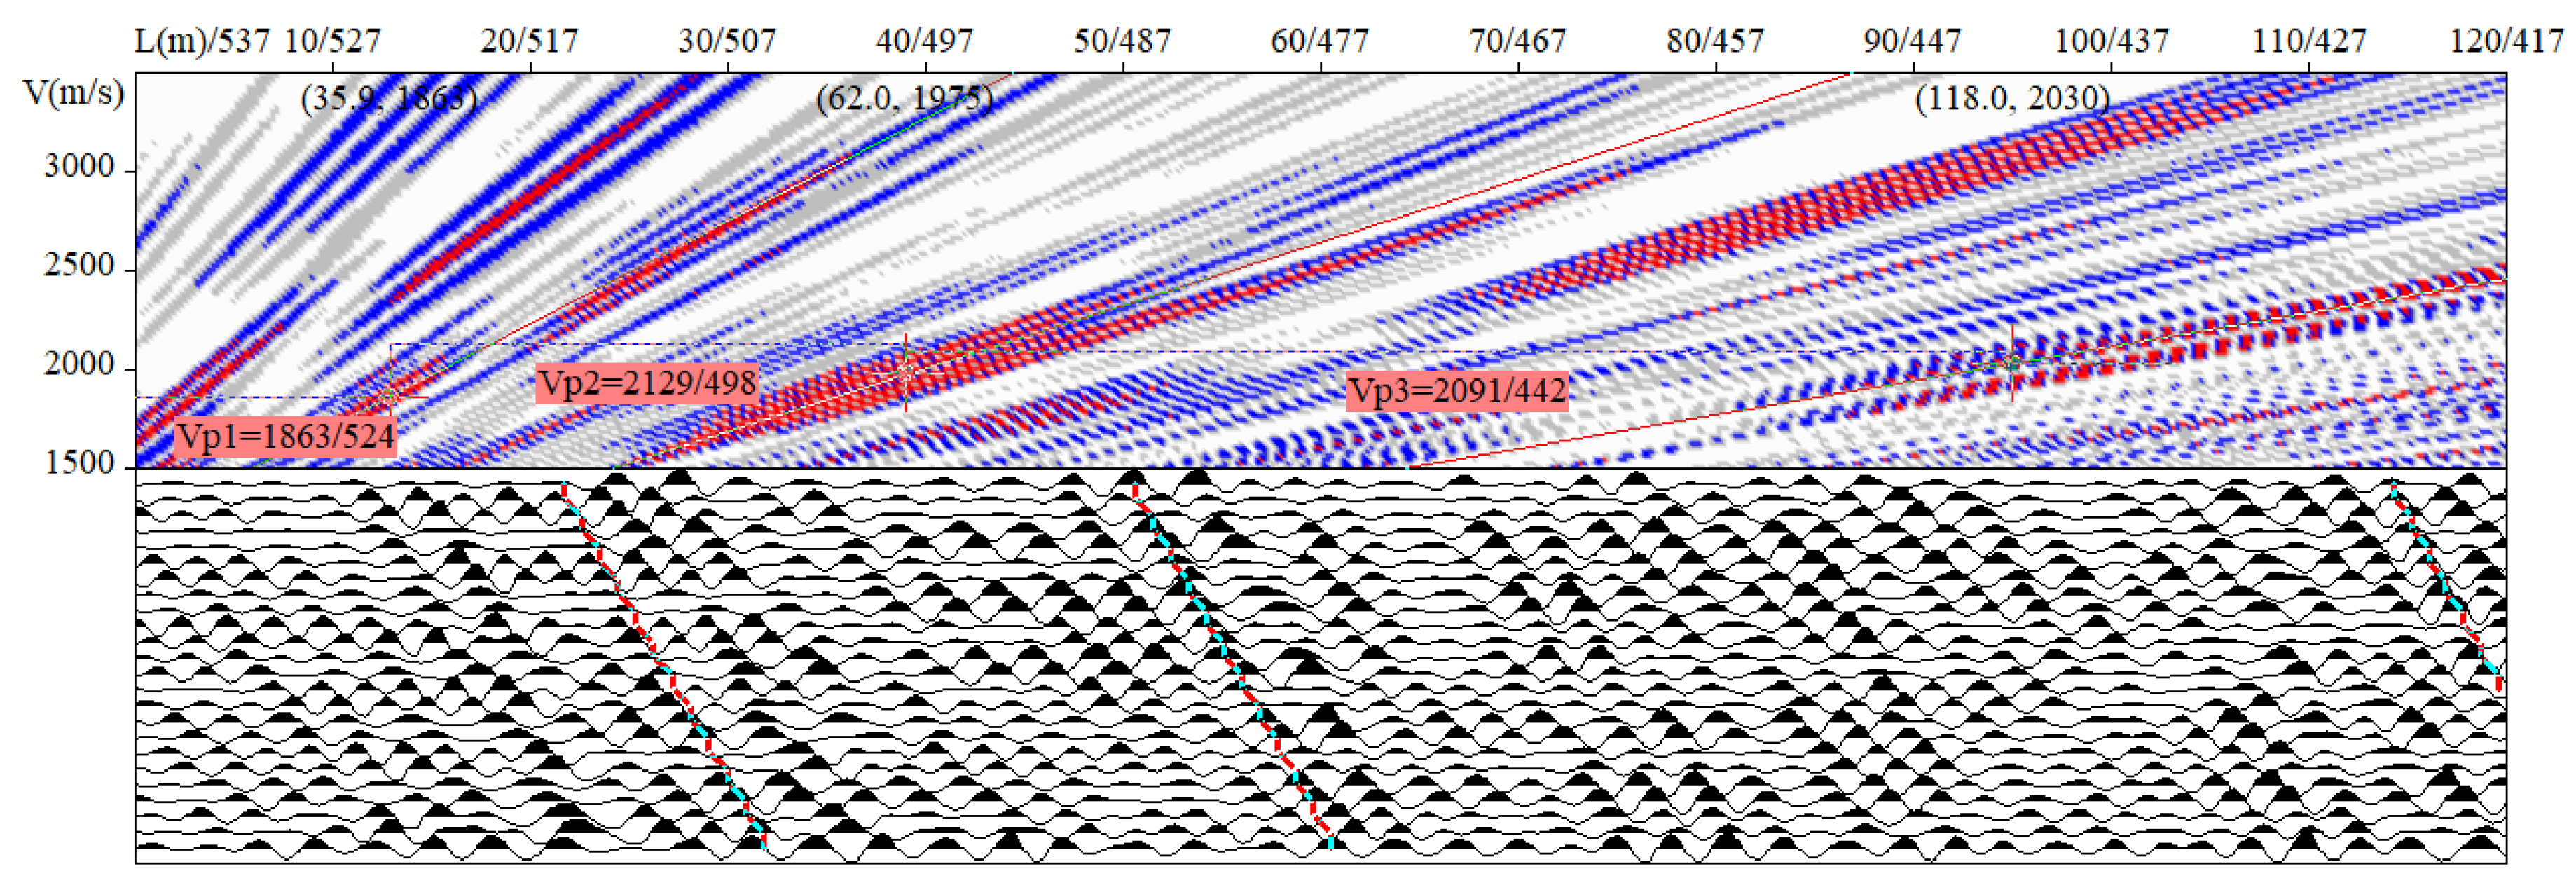
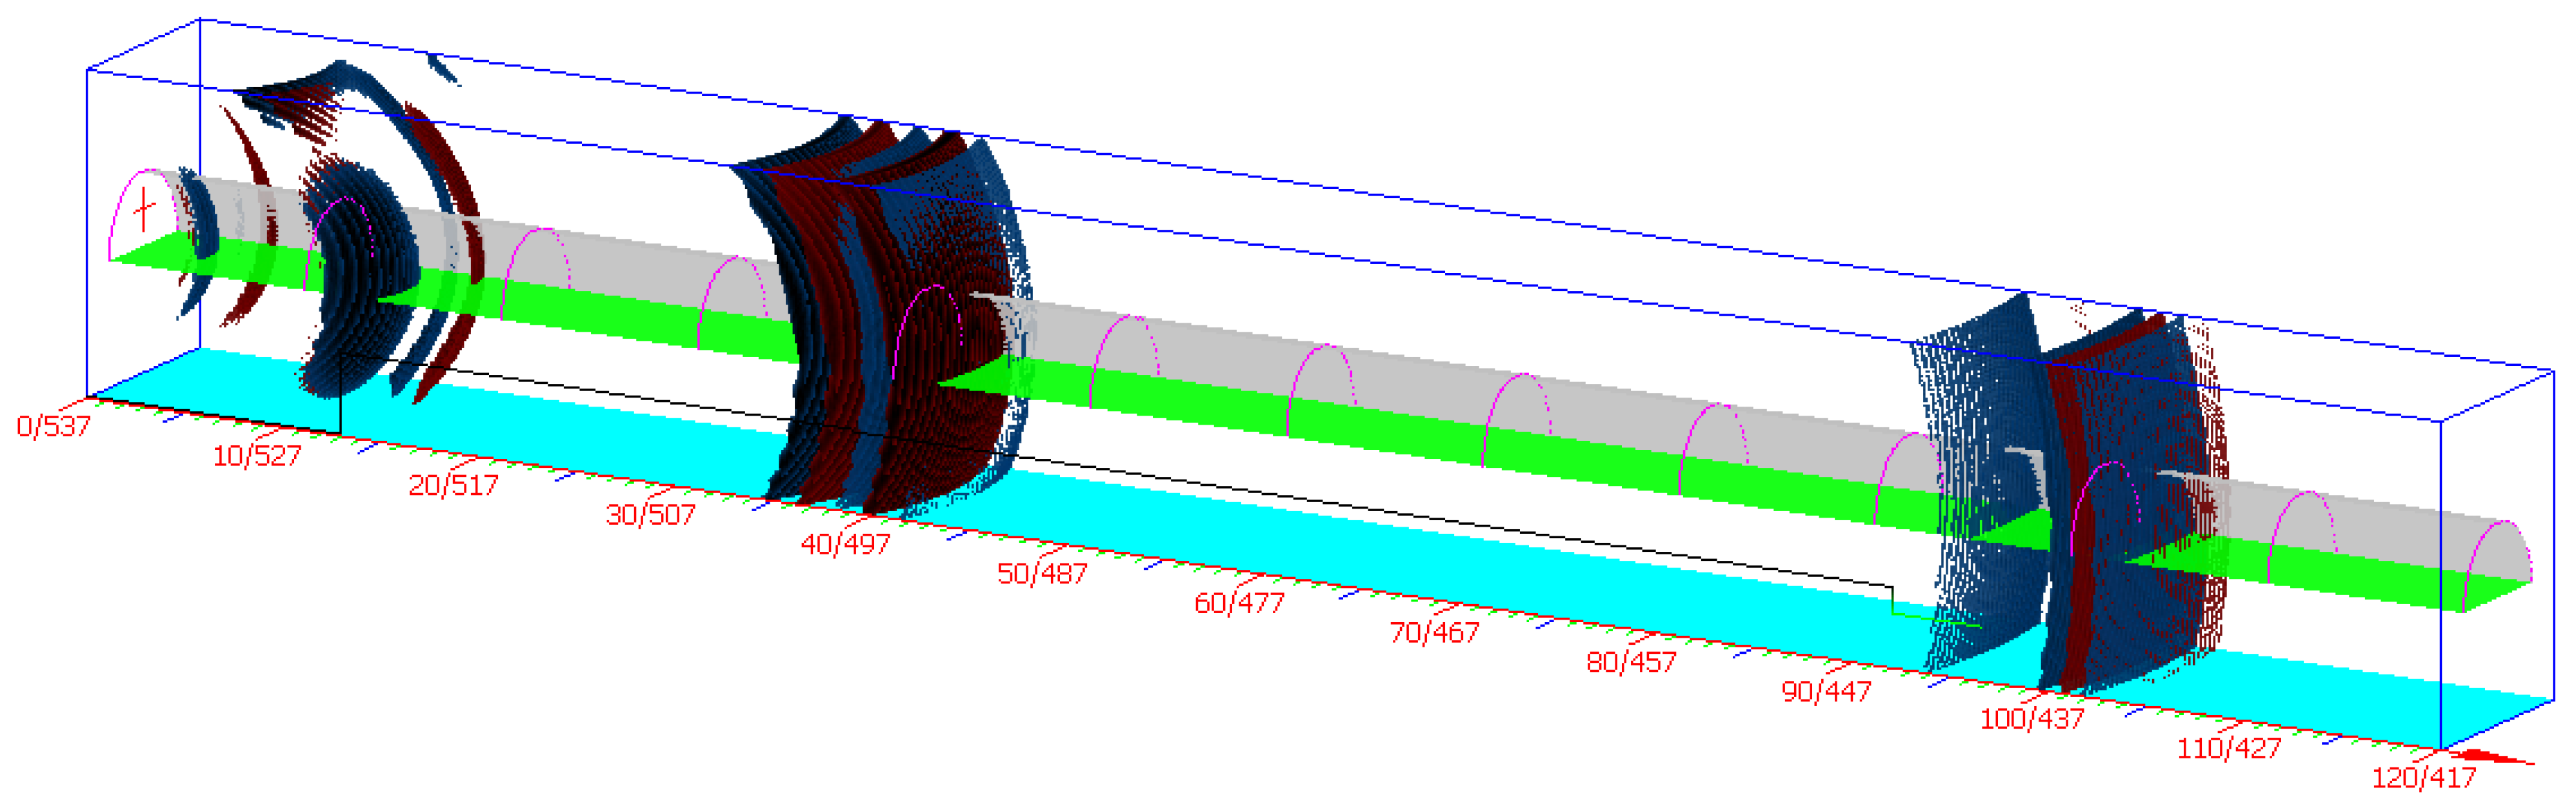
3.1. Recognition of Fracture Zones in Seismic Wave Data

The seismic wave reflection data and ground-penetrating radar data are used to identify the fracture zones, in combination with the physical properties of the fracture zones. The technical route of the fracture zone identification algorithm is shown in Figure 4.
In seismic wave detection, the direct wave is considered an interfering signal, while the reflected wave contains the effective signal. The direct wave suppression process is shown in Figure 5. The frequency–wavenumber (F-K) filtering method utilizes the differences in speed and frequency between the direct and reflected waves to suppress the direct signal and retain the effective signal within the reflected wave. The apparent velocity can be described in terms of frequency and wavenumber:
V = f K
where V is the apparent velocity, f is the wave frequency, and K is the wavenumber.
Figure 5b presents the frequency–wavenumber domain image of the seismic channel signal, where horizontal lines represent intercepted frequency ranges. The diagonal line signifies the apparent velocity calculated by Equation (7). The region delineated by the reflected wave energy cluster is identified by contrasting the direct and reflected wave signals. This facilitates the joint screening of reflected wave signals based on their apparent velocity and frequency characteristics, effectively suppressing the direct wave signal. The outcomes of direct wave suppression are depicted in Figure 5c.
Velocity scanning and stacking are conducted on the data after applying bandpass and F-K filtering. The correlation between energy clusters and the temporal evolution of reflected signals are calculated from the wave velocity scanning map. This process yields the stacking velocity and the associated propagation velocity at various depths. Figure 6 illustrates the velocity spectrum of the tunnel. The corresponding superimposed velocity is determined by employing the maximum superimposed amplitude of multiple signals. Subsequently, the average velocity between any two points is computed based on the superimposed velocity at different depth positions.
The designed velocity spectrum reflects the strength of the amplitude superposition of the corresponding time–distance curve according to Equation (1). In the energy cluster, regions with a positive reflection coefficient and significant superposition amplitude are highlighted in red, while negative reflections are distinctly represented in blue.
Figure 6 illustrates the continuous and dense peaks and valleys in the channel records within the divided area. The calculated velocity spectrum exhibits numerous interference bands, with positive and negative reflections displaying a regional distribution. This suggests that the rock mass in front of the tunnel face is fragmented, impacting the propagation of seismic waves. A three-dimensional image of the tunnel face is obtained by superimposing the three-dimensional seismic wave signals collected by the three-component detector, as shown in Figure 7. This image reveals the spatial locations of the fracture zones.

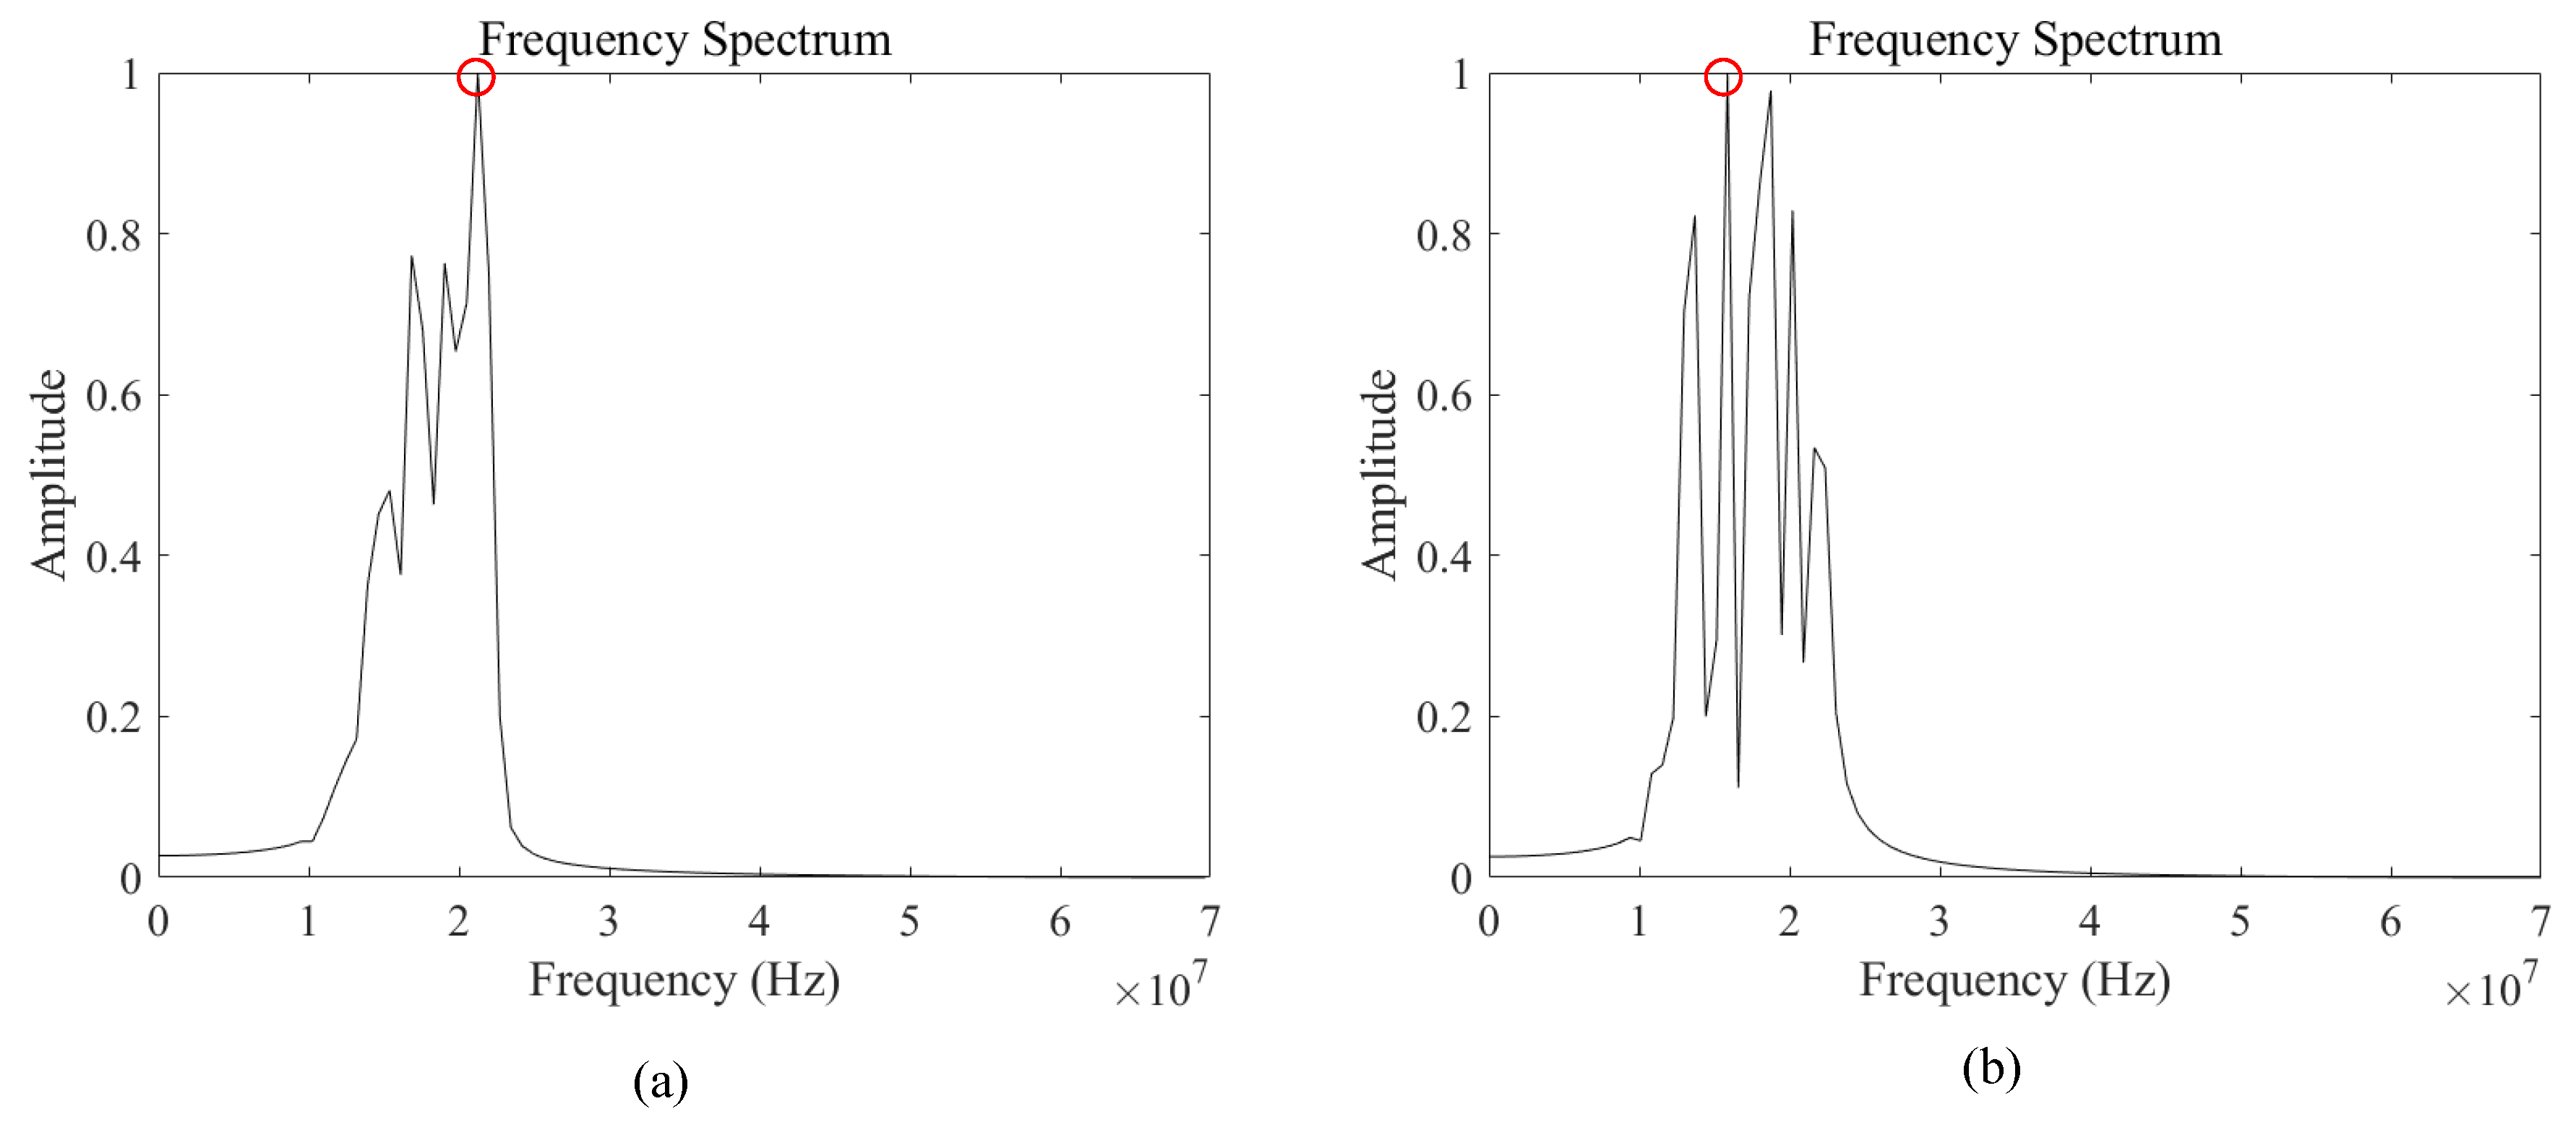
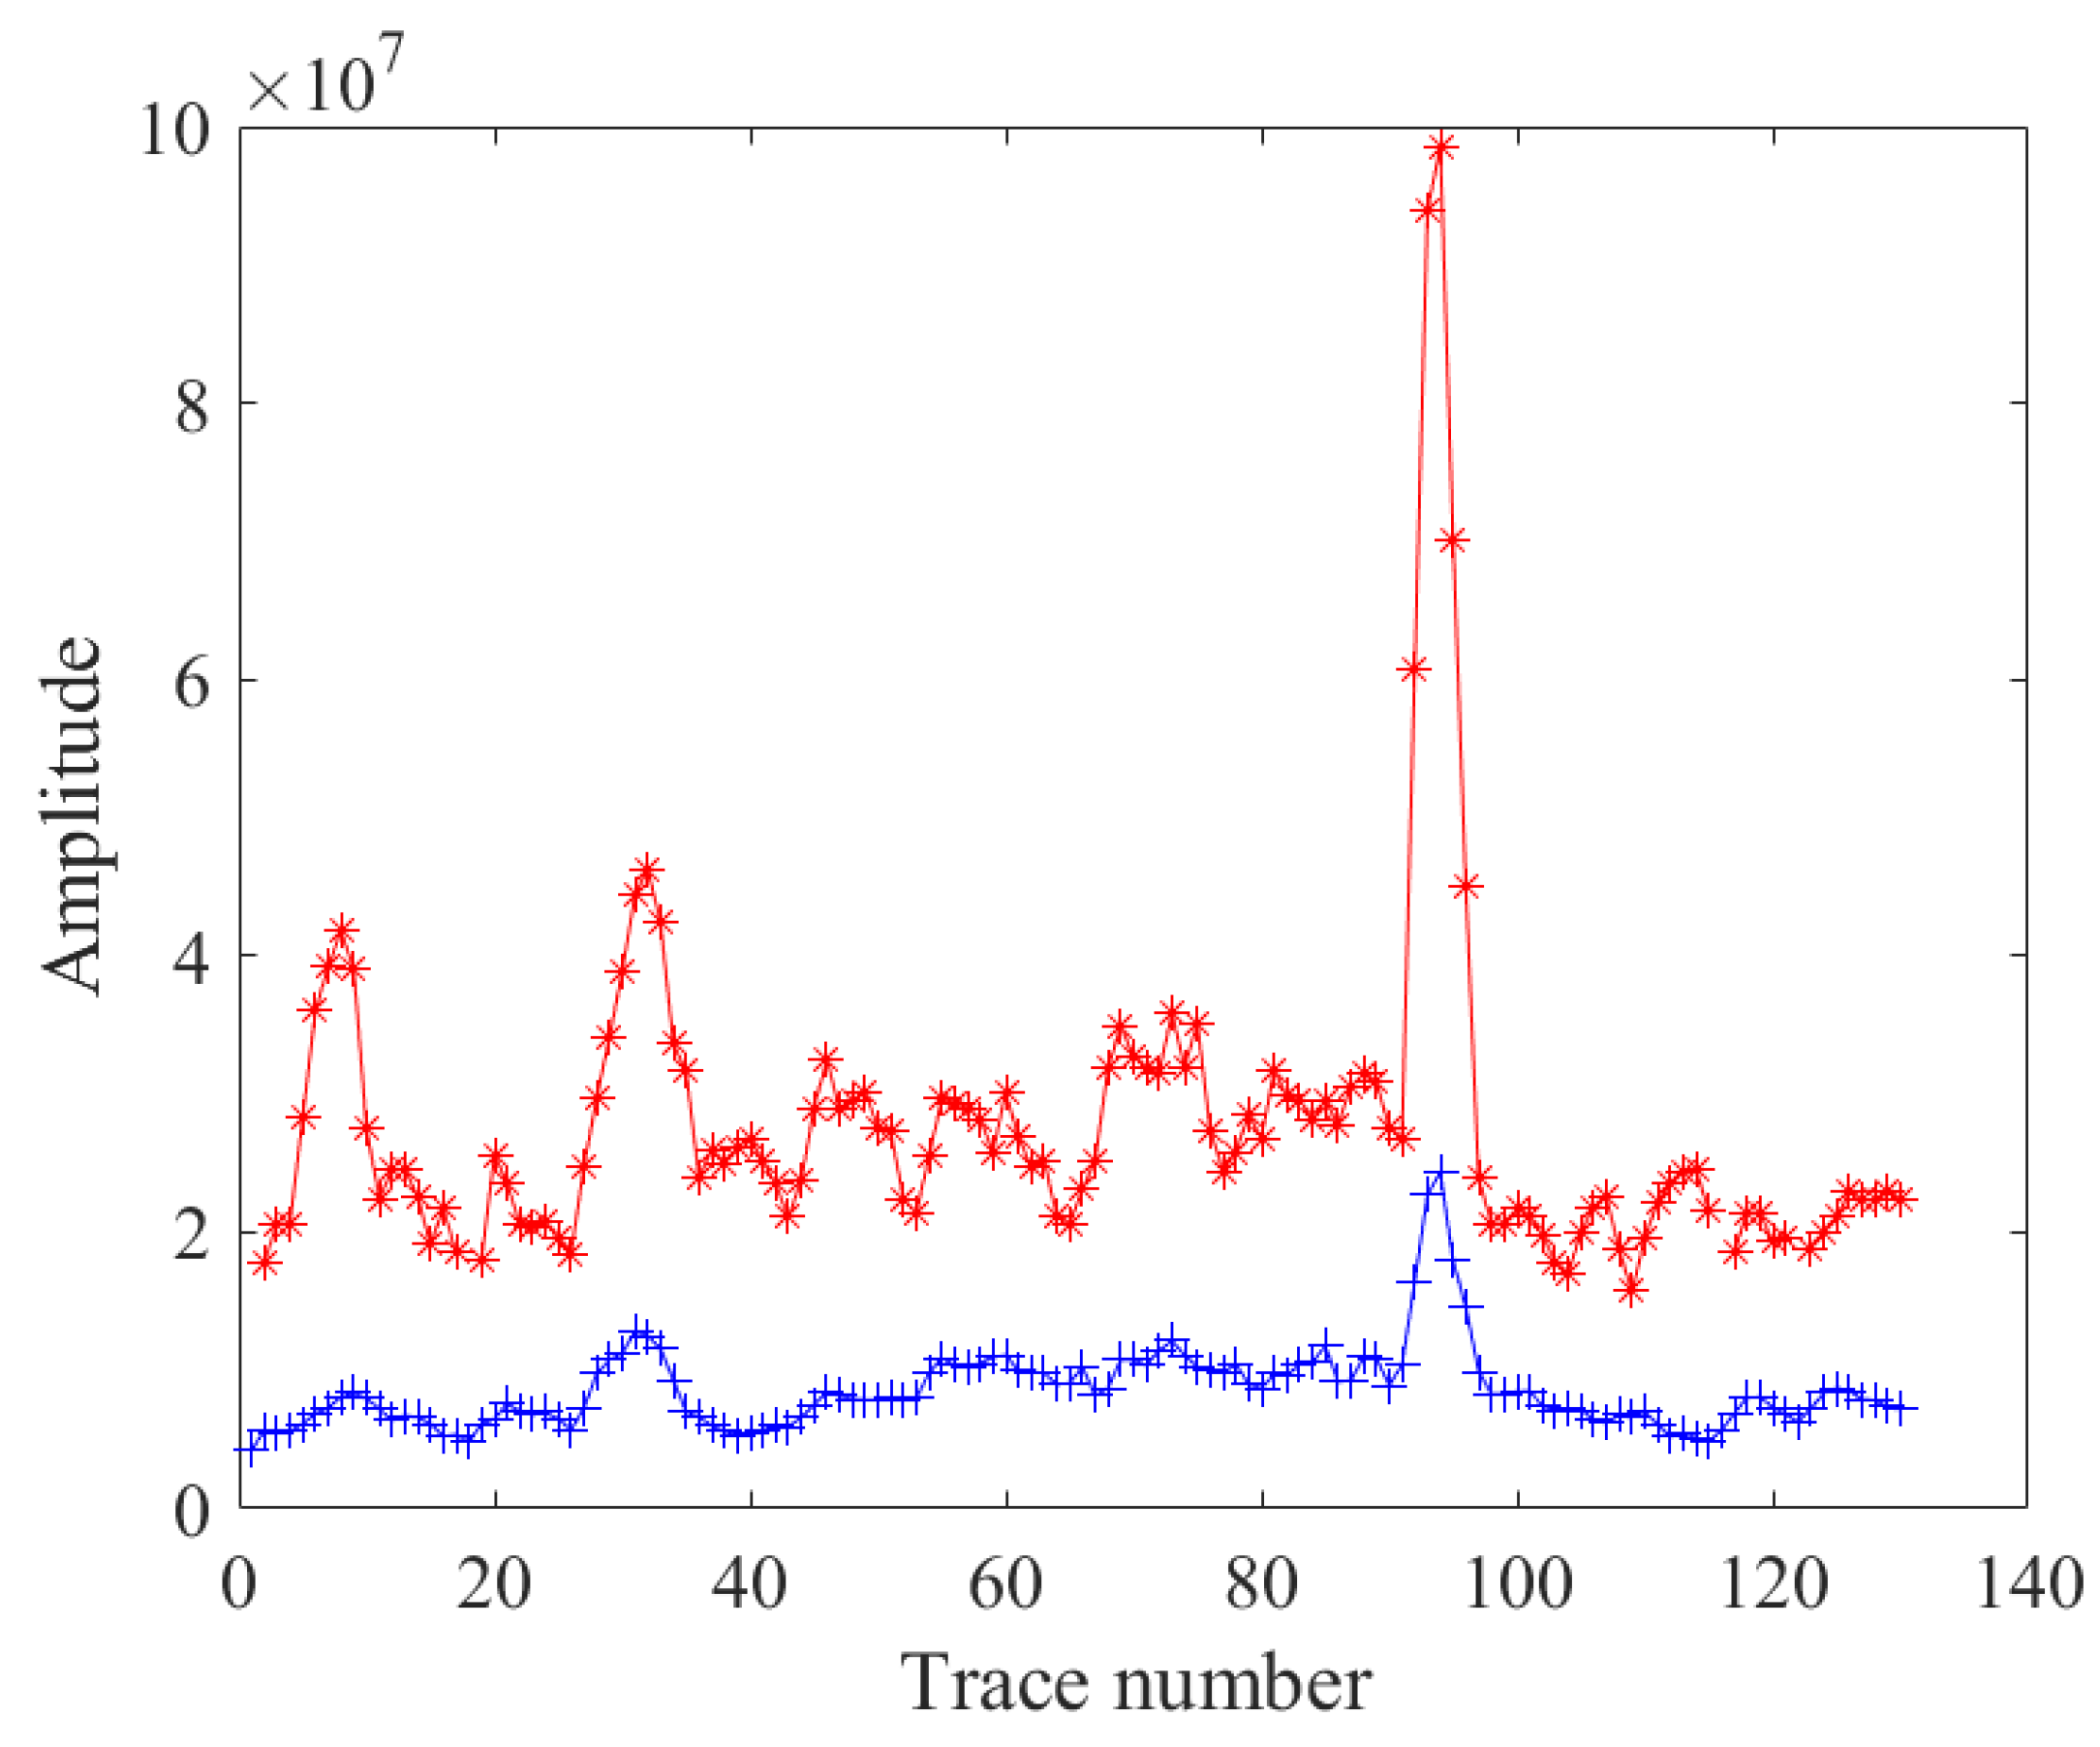
3.2. Recognition of Fracture Zones in GPR Data

Electromagnetic waves exhibit a significant increase in reflection strength upon encountering interfaces with distinct electrical properties. This noticeable rise in amplitude is a critical feature in the identification algorithm for fracture zones. Figure 8a shows the waveform of a radar single-channel reflection signal.
When ground-penetrating radar detects a tunnel, electromagnetic waves initially penetrate the surrounding rock from the air. Due to the difference in the dielectric constant between the air and the surrounding rock, the initial phase of the A-scan image is negative, as described by Equation (6). This negative phase occurs when electromagnetic waves transition from a medium with a smaller dielectric constant to that with a larger one. As the electromagnetic wave enters the fracture zone from the intact surrounding rock, the reflection coefficient changes due to the presence of voids in the fracture zone. This change is reflected in the A-scan image as a positive phase, opposite to the initial negative phase. The alteration in the phase of the electromagnetic wave entering the fracture zones from the intact surrounding rock is a characteristic for identifying the fracture zones. This characteristic condition is utilized to achieve the identification of fracture zones.
Utilizing the high-center-frequency characteristics of electromagnetic waves in fracture zones, identifying fracture zones within a single-channel waveform involves comparing the center frequency of a preliminarily selected area with that of an unselected area. Figure 9 illustrates the normalized center spectrograms in selected fracture zones versus unselected areas, demonstrating higher center frequencies in the selected regions compared to the unselected ones. This center-frequency comparison identifies the region of broken bands localized by phase and amplitude.
The statistical analysis of each radar signal in the data quantifies the average amplitude of signal points in both the broken and unselected areas. A comparison curve is established for radar waveform amplitude data. Figure 10 shows that the two curves exhibit a distinct energy difference, where the selected fracture zones display higher energy than the unselected area. This observation indicates a notable increase in amplitude within the fracture zones.
The stacking of multiple A-scans depicts the locations of characteristic points of fracture zones in the B-scan, as shown in Figure 8c. The B-scan has frequent recognition feature points, indicating their alignment with the characteristic features of fracture zones. The discontinuity in phase axes points to a lack of continuity in the surrounding rock within the measurement area, suggesting the frequent development of rock fracture zones.

4. Advance Forecasting and Verification of Fracture Zones in Liangwangshan Tunnel

The starting and ending mileage of the right line tunnel of Liangwangshan Tunnel has a total length of 7978 m. The starting and ending mileage of the left tunnel has a total length of 7961 m. The maximum burial depth of the tunnel is determined to be 384.6 m, which belongs to an extra-long tunnel, by analyzing the stability of excavation, the degree of fragmentation, and the development of cracks. Based on the characteristics of rock extension, the information of the rock layer in front of the tunnel face can be inferred. This method is highly accurate in determining faults and fracture zones, usually revealing the direction of fracture zones.
The seismic wave method’s work arrangement is shown in Figure 11. Starting from the tunnel face, 12 seismic source points were established on both the left and right tunnel walls, with a spacing of approximately 1.5 m between points. Three-component detectors were placed at a distance of about 3.0 m from the first seismic source point, using a hammer strike as the seismic source. Additionally, one three-component detector was installed at a height of approximately 1.0 m on both the left and right tunnel walls and at the crown of the tunnel. The tunnel’s axis was used as the reference line. The seismic reflection signals generated by the hammer strikes were collected, and preprocessing techniques were applied to filter out noise and unwanted signals. This process resulted in the acquisition of effective seismic reflection signals from the front of the tunnel face. Based on the characteristics of seismic wave propagation in the fracture zone, the fracture zone in front of the tunnel working face can be preliminarily identified.
Figure 12a shows the face of the tunnel. The tunnel face is yellowish brown with weak and strong weathering and is composed of thin- to medium-layered dolomitic limestone with soft rock. Affected by the geological structure, the joints and fissures are relatively developed, and the rock mass is relatively broken. There is no water in the tunnel face. The binding force between surrounding rock layers is poor, and they easily fall off and collapse. The lithology of the tunnel face is dolomitic limestone, and two structural planes are mainly developed at the top, presenting a loose cataclastic structure.
The seismic trace data collected from tunnel K37 + 537 to K37 + 417 were processed. The clutter signal was eliminated by bandpass filtering, and the direct wave signal was suppressed by F-K filtering. The stack velocity spectrum was obtained by the velocity scanning stack.
The peaks and troughs in the channel record are continuous and dense, as shown in Figure 6. There are many energy bands and interference bands in the calculated velocity spectrum. This shows that the rock in front of the tunnel is relatively broken. The recognition results show three abnormal reflection regions. A three-dimensional imaging result for the area between K37 + 537 and K37 + 417 was obtained by the principles of seismic wave common reflection surface stacking and diffraction scanning offset superposition, combined with the wave velocity scanning analysis results, as shown in Figure 7.
From the extracted three-dimensional superimposed reflection surfaces, it is observed that there are three anomalous reflection areas within the entire detection range. The positive and negative reflection interfaces within these three areas exhibit a chaotic pattern, with alternating red and blue interfaces discernible in the 3D image. The positive and negative reflection amplitudes inside the areas are relatively large, indicating the presence of rock fragmentation zones in front of the tunnel. Based on the tunnel face’s geological conditions, wave velocity scanning, and three-dimensional imaging results, the following conclusions are drawn for the region between K37+537 and K37+417: within the predicted range, the integrity and stability of the surrounding rock in the three areas are weak, and there are areas of rock fragmentation.
Ground-penetrating radar detection was performed on three areas to identify the fracture zone area in front of the tunnel face. Ground-penetrating radar was used for data collection. The radar data underwent preprocessing, such as editing and zero-point correction. The layout of the survey lines is shown in Figure 12b.
The fracture zone features of the radar signals in the three abnormal reflection areas were identified according to the collected radar reflection signals. The identification results for each survey line are shown in Figure 13, as well as the discontinuity in phase axes. The results indicate fracture zones within the three regions.
The excavation site photo of the Liangwangshan Tunnel is shown in Figure 14. In the detected abnormal area, there are fracture zones in front of the tunnel excavation, which is consistent with the identification results of the seismic wave data and GPR data, verifying the accuracy of this method.

5. Discussion

The seismic wave data and ground-penetrating radar data were combined to identify the fracture zones of the tunnel, and they are consistent with the tunnel excavation results, which ensures the feasibility of the method. However, the seismic wave method may not be able to provide sufficiently fine information for smaller-scale fracture zones or fine structures when detecting the fracture zones of the tunnel-surrounding rock. The high water saturation of the rock mass has a certain absorption and attenuation effect on the energy of seismic and electromagnetic waves. This results in a gradual loss of energy during propagation, reducing the resolution and detection capability. At the same time, fluctuations in the water cause the scattering of seismic and electromagnetic waves, which complicates the waveforms. This complicates the interpretation and analysis of fracture zones.

6. Conclusions

In this study, the fracture zone in front of the tunnel face was recognized based on the seismic and electromagnetic wave characteristics. The method is used to identify the fracture zones in front of the tunnel face before tunnel excavation, which improves the safety of tunnel construction, allows for better planning of project progress, improves the work efficiency, and reduces the extra costs caused by unanticipated fracture zones. The following are the main contents of this study.
The difference in the wave impedance of seismic waves in cracks and rock masses leads to changes in reflected waves during the propagation of seismic waves. When local seismic waves propagate to the fault zone of the surrounding rock, the amplitude of the superimposed reflection signal is used to locate the positive and negative strong reflection areas. The area of the fracture zone is determined according to the characteristics of the seismic waves. The reflection coefficient of electromagnetic waves propagating into the air is opposite to that of waves injected into the surface of the tunnel, and the fault zone area shows an increased amplitude in the A-scan signal, with a higher center frequency compared to the intact surrounding rock area. The fracture zones are identified based on the characteristics of electromagnetic waves. The identification results of seismic waves and electromagnetic waves in the fracture zones are consistent with the excavation results of the Liangwangshan Tunnel, achieving the advanced prediction of the fracture zones.

Author Contributions

Conceptualization, C.L. and H.W.; methodology, C.L., H.W. and L.W.; software, H.W.; validation, X.Y. and Y.W.; formal analysis, H.W.; investigation, L.W.; data curation, X.W., Y.W. and X.Y.; writing—original draft preparation, H.W.; writing—review and editing, C.L.; project administration, C.L. and X.W.; funding acquisition, C.L. All authors have read and agreed to the published version of the manuscript.

Funding

This work was supported by the National Natural Science Foundation of China (Grant No. 62263015).

Institutional Review Board Statement

Not applicable.

Informed Consent Statement

Not applicable.

Data Availability Statement

The data presented in this study are available on request from the corresponding author. The data are not publicly available due to the confidentiality requirements of the project.

Conflicts of Interest

Author Yunsheng Wang and Xi Yang were employed by the company Yunnan Aerospace Engineering Geophysical Detecting Co., Ltd. The remaining authors declare that the research was conducted in the absence of any commercial or financial relationships that could be construed as a potential conflict of interest.

References

  1. Sattel, G.; Sander, B.; Amberg, F.; Kashiwa, T. Predicting ahead of the Face. In Tunnels and Tunnelling International; Progressive Media Markets, Ltd.: London, UK, 1996. [Google Scholar]
  2. Otto, R.; Button, E.; Bretterebner, H.; Schwab, P. The application of TRT-true reflection tomography-at the Unterwald Tunnel. Felsbau 2002, 20, 51–56. [Google Scholar]
  3. Ashida, Y. Seismic imaging ahead of a tunnel face with three-component geophones. Int. J. Rock Mech. Min. Sci. 2001, 38, 823–831. [Google Scholar] [CrossRef]
  4. Zhao, Y.; Jiang, H.; Zhao, X. Tunnel seismic tomography method for geological prediction and its application. Appl. Geophys. 2006, 3, 69–74. [Google Scholar] [CrossRef]
  5. Lu, W.; Wu, J.; Li, S.; Xu, Z.; Zhou, L. Application study of the Tunnel Seismic Prediction method in Qiyueshan tunnel. In Proceedings of the 3rd International Conference on Material, Mechanical and Manufacturing Engineering, Guangzhou, China, 27–28 June 2015. [Google Scholar]
  6. Brodic, B.; Malehmir, A.; Juhlin, C. Delineating fracture zones using surface-tunnel-surface seismic data, P-S, and S-P mode conversions. J. Geophys. Res. Solid Earth. 2017, 122, 5493–5516. [Google Scholar] [CrossRef]
  7. Tzou, H.K.; Chu, T.S.; Liu, T.Y. Enhancing the safety management of NATM using the tunnel seismic prediction method: A case study. Innov. Infrastruct. Solut. 2020, 5, 106. [Google Scholar] [CrossRef]
  8. Wang, J.; Yang, S.; Xu, X.; Jiang, P.; Ren, Y.; Du, C.; Du, S. 3C-3D tunnel seismic reverse time migration imaging: A case study of Pearl River Delta Water Resources Allocation Project. J. Appl. Geophys. 2023, 210, 104954. [Google Scholar] [CrossRef]
  9. Shi, S.S.; Li, S.C.; Li, L.P.; Zhou, Z.Q.; Wang, J. Advance optimized classification and application of surrounding rock based on fuzzy analytic hierarchy process and Tunnel Seismic Prediction. Autom. Constr. 2014, 37, 217–222. [Google Scholar] [CrossRef]
  10. Jol, H.M. Ground Penetrating Radar: Theory and Applications; Elsevier: Amsterdam, The Netherlands, 2009. [Google Scholar]
  11. Mierczak, M.; Karczewski, J. Location of agate geodes in Permian deposits of Simota gully using the GPR. Acta Geophys. 2021, 69, 655–664. [Google Scholar] [CrossRef]
  12. Puntu, J.M.; Chang, P.Y.; Lin, D.J.; Amania, H.H.; Doyoro, Y.G. A Comprehensive Evaluation for the Tunnel Conditions with Ground Penetrating Radar Measurements. Remote. Sens. 2021, 13, 4250. [Google Scholar] [CrossRef]
  13. Heikkinen, E.; Kantia, P. Suitability of Ground Penetrating Radar for Locating Large Fractures; POSIVA: Eurajoki, Finland, 2011. [Google Scholar]
  14. Li, C.; Li, M.J.; Zhao, Y.G.; Liu, H.H.; Wan, Z.; Xu, J.; Xu, X.P.; Chen, Y.; Wang, B. Layer recognition and thickness evaluation of tunnel lining based on ground penetrating radar measurements. J. Appl. Geophys. 2011, 73, 45–48. [Google Scholar] [CrossRef]
  15. Chen, H.; Liu, S. Advanced geological prediction technology of tunnel based on image recognition. Arab. J. Geosci. 2019, 12, 601. [Google Scholar] [CrossRef]
  16. Sengani, F. The use of ground Penetrating Radar to distinguish between seismic and non-seismic hazards in hard rock mining. Tunn. Undergr. Space Technol. 2020, 103, 103470. [Google Scholar] [CrossRef]
  17. Molron, J.; Linde, N.; Baron, L.; Selroos, J.; Darcel, C.; Davy, P. Which fractures are imaged with Ground Penetrating Radar? Results from an experiment in the Äspö Hardrock Laboratory, Sweden. Eng. Geol. 2020, 273, 105674. [Google Scholar] [CrossRef]
  18. Li, C.; Zhang, Y.; Wang, L.; Zhang, W.; Yang, X.; Yang, X. Recognition of Rebar in Ground-Penetrating Radar Data for the Second Lining of a Tunnel. Appl. Sci. 2023, 13, 3203. [Google Scholar] [CrossRef]
  19. Li, C.; Li, M.; Yang, X.; Zhang, W.; Fan, M.; Yang, X.; Wang, L. Boundary recognition of tunnel lining void from ground penetrating radar data. J. Geophys. Eng. 2023, 20, 723–734. [Google Scholar] [CrossRef]
  20. Wang, C.; Bai, M.; Du, Y.; Kuang, X. Application Analysis of Comprehensive Advanced Geological Prediction in Karst Tunnel. Appl. Mech. Mater. 2013, 405–408, 1309–1313. [Google Scholar] [CrossRef]
  21. Li, S.; Zhou, Z.Q.; Ye, Z.; Li, L.P.; Qi, Z.; Xu, Z. Comprehensive geophysical prediction and treatment measures of karst caves in deep buried tunnel. J. Appl. Geophys. 2015, 116, 247–257. [Google Scholar] [CrossRef]
  22. Chen, L.; Wang, H.; Xu, X.; Zhang, Y.; Wang, C.; Song, J.; Han, L. Geological Exploration Using Integrated Geophysical Methods in Tunnel: A Case. Geotech. Geol. Eng. 2019, 38, 1111–1119. [Google Scholar] [CrossRef]
  23. Xue, G.Q.; Yan, Y.J.; Li, X.; Di, Q.Y. Transient electromagnetic S-inversion in tunnel prediction. Geophys. Res. Lett. 2008, 34. [Google Scholar] [CrossRef]
  24. Liu, H.; Yu, Z.; Zhang, H. Application of comprehensive advanced geological prediction technology in Da-puling tunnel. E3S Web Conf. 2021, 283, 1013. [Google Scholar] [CrossRef]
  25. Liu, M.; Gan, Q. Applied research of comprehensive advance geological prediction in Daluoshan water diversion tunnel. Sci. Rep. 2023, 13, 9162. [Google Scholar] [CrossRef] [PubMed]
Figure 1. Principles of reflection at fracture zones for seismic wave detection.
Applsci 14 01282 g001
Figure 2. Diffraction scanning offset superposition principle.
Applsci 14 01282 g002
Figure 3. Principles of GPR for detecting fracture zones.
Applsci 14 01282 g003
Figure 4. The technical route of fracture zone identification.
Applsci 14 01282 g004
Figure 5. F-K filtering process: (a) 2D pre-filtered channel; (b) spectral analysis with F-K filtering; (c) 2D post-filter channel.
Applsci 14 01282 g005
Figure 6. Superposition velocity spectrum.
Applsci 14 01282 g006
Figure 7. Three-dimensional image of tunnel.
Applsci 14 01282 g007
Figure 8. (a) Recognition results of surrounding rock fracture zones in A-scan. (b) B-scan of tunnel envelope. The red line shows the location of the A-scan. (c) The blue area is the result of identifying the fracture zones in the B-scan.
Applsci 14 01282 g008
Figure 9. (a) Spectrogram of selected areas. (b) Spectrogram of unselected areas.
Applsci 14 01282 g009
Figure 10. Amplitude comparison curves for fracture zones and intact surrounding rock.
Applsci 14 01282 g010
Figure 11. Work arrangement for seismic wave method.
Applsci 14 01282 g011
Figure 12. (a) Tunnel face. (b) The survey line arrangement for GPR detection.
Applsci 14 01282 g012
Figure 13. Results of recognition of fracture zones. (a) Abnormal interface 1, survey line 1. (b) Abnormal interface 1, survey line 2. (c) Abnormal interface 2, survey line 1. (d) Abnormal interface 2, survey line 2. (e) Abnormal interface 3, survey line 1. (f) Abnormal interface 3, survey line 2.
Applsci 14 01282 g013
Figure 14. Photograph of the fracture zones during tunnel excavation.
Applsci 14 01282 g014
Disclaimer/Publisher’s Note: The statements, opinions and data contained in all publications are solely those of the individual author(s) and contributor(s) and not of MDPI and/or the editor(s). MDPI and/or the editor(s) disclaim responsibility for any injury to people or property resulting from any ideas, methods, instructions or products referred to in the content.

