Article

Research on the Safety Evaluation Method for Quayside Container Cranes Based on the Best–Worst Method–Pythagorean Fuzzy VIKOR Approach

1
Sanya Science Education Innovation Park, Wuhan University of Technology, Sanya 572000, China
2
School of Transportation and Logistics Engineering, Wuhan University of Technology, Wuhan 430063, China
*
Author to whom correspondence should be addressed.
Appl. Sci. 2024, 14(3), 1312; https://doi.org/10.3390/app14031312
Submission received: 31 December 2023 / Revised: 28 January 2024 / Accepted: 29 January 2024 / Published: 5 February 2024

Abstract

:
In the port domain, quayside container cranes are an indispensable component of maritime freight transport. These cranes are not only costly but also associated with safety accidents that often result in casualties and property loss, severely impacting port operations and the surrounding environment. Given their complex operational environment, rapid technological updates, high dependency on human factors, and the challenges of maintenance and inspection, the safety of quayside container cranes is a significant concern for port enterprises and managers. This paper, based on the operational modes and structural characteristics of the cranes, divides them into five main systems and identifies twenty-eight safety evaluation indicators, covering a comprehensive range of risk factors from equipment integrity to operator behavior, as well as environmental factors. However, numerous pain points exist in the safety risk evaluation process of quayside container cranes, such as fuzziness, uncertainty, and complex multi-criteria decision-making (MCDM) environments. These issues make traditional safety evaluation methods inadequate in accurately reflecting the actual safety conditions. Therefore, this paper proposes a safety evaluation method for quayside container cranes based on the Best–Worst Method (BWM) and Pythagorean hesitant fuzzy VIKOR. This method effectively overcomes the uncertainties and fuzziness of traditional safety evaluation methods by integrating the decision maker’s preference information from the BWM and the fuzzy handling capability of Pythagorean hesitant fuzzy sets, enhancing the accuracy and reliability of the evaluation results. A case study was conducted on a quayside container crane at a specific port. Through empirical analysis, the feasibility of the proposed method was validated. Overall, the safety evaluation method for quayside container cranes based on the BWM and Pythagorean hesitant fuzzy VIKOR proposed in this paper enriches the theoretical research on the safety risk assessment of quayside container cranes and offers a new approach and tool for port enterprises and managers in practice.

1. Introduction

With the advancement of socio-economic development, the scale of industrial production and logistics transportation has been expanding significantly. As an indispensable component within this sector, quayside container cranes have garnered widespread attention. Concurrently, with the ongoing research and development in new technologies, the crane manufacturing industry is progressively incorporating an array of innovative processes, materials, and technological applications. The research findings of Li [1] and Pandeya [2] demonstrate substantial potential and prospects for application in future crane manufacturing endeavors.
Despite these innovations in manufacturing techniques, the safety concerns associated with quayside container cranes remain a critical issue for port enterprises. This is primarily due to harsh working conditions, challenges in maintenance, prolonged service lifetimes, high manufacturing costs, and the severe implications of accidents. As such, ensuring the safety of these cranes continues to be a focal point of concern that demands rigorous attention and strategic planning to mitigate risks effectively.
The safety risk evaluation of quayside container cranes constitutes a type of multi-criteria decision-making (MCDM) problem, which involves a wide array of both qualitative and quantitative indicators. It is determined by various factors affecting the overall safety status of the equipment, collectively defining the safety condition of the equipment under evaluation. In traditional MCDM methods, all evaluation indicators are assumed to have precise values. However, in the field related to gantry cranes, obtaining accurate data is often challenging due to the harsh dock environment, the limitations of measuring instrument precision, and the presence of numerous qualitative indicators. To address these issues, an increasing number of scholars have recognized the necessity of incorporating factors such as uncertainty and fuzziness into MCDM methods [3].
In 1965, the concept of fuzzy sets was pioneered by Zadeh, effectively addressing issues characterized by uncertainty and fuzziness [4]. This theory has been widely applied by scholars across various fields. Building upon fuzzy set theory, researchers from different countries have expanded it into various forms for application in multiple areas. Cornelis and others discussed the differences in construction, classification, and application between intuitionistic fuzzy sets and interval-valued fuzzy sets [5]. In intuitionistic fuzzy sets, both membership and non-membership degrees are considered, but their sum is required to be less than or equal to 1. In contrast, the membership function within interval-valued fuzzy sets is denoted by a range. McCulloch suggested an approach to expand interval type-2 similarity measures to encompass general type-2 fuzzy sets [6]. Torra introduced hesitant fuzzy sets (HFSs) on the basis of traditional fuzzy sets, offering a new approach to address uncertainty and fuzziness [7]. An HFS has greater advantages over other fuzzy-set-based methods in handling fuzziness, especially in decision-making scenarios where different decision makers may have divergent views on the same evaluation criterion and find it hard to reach a consensus. Yager introduced Pythagorean fuzzy sets [8], in which the combined squares of membership and non-membership degrees are required to not exceed 1, offering a broader membership space compared to intuitionistic and interval intuitionistic fuzzy sets, thus offering enhanced benefits in addressing indeterminacy and vagueness [9,10]. Garg proposed a variety of Pythagorean fuzzy Einstein-combining operators and utilized them in MCDM [11]. Zhang addressed the limitations of the generalized Bonferroni mean by proposing a new dual generalized Bonferroni mean for multi-attribute group decision making (MGDM) [12]. Chen introduced a Pythagorean fuzzy VIKOR method grounded on the distance index [13]. Following this, Yang proposed a Pythagorean hesitant fuzzy cross-impact Bonferroni mean operator [14], and Garg introduced an MCDM method based on the Pythagorean hesitant fuzzy Maclaurin symmetric mean operator [15]. Generally, in MCDM problems, the degree to which one option or indicator is better than another is often represented by a value between 0 and 1. For instance, if one decision maker gives a rating of 0.5, another 0.7, and a third 0.8, this can be depicted as a hesitant fuzzy element (HFE) 0.5 , 0.7 , 0.8 . In such cases, the HFE can more accurately reflect the decision group’s evaluation of the option or indicator compared to interval-valued fuzzy numbers or intuitionistic fuzzy numbers.
The objective of MCDM problems can be understood as selecting the best option from a set of alternatives grounded on one or several criteria, or ranking these alternatives. Many MCDM methods have been proposed by scholars, founded on a compromise of programming principles initiated by Yu [16]. For example, Hwang and others proposed the TOPSIS method [17], Opricovic introduced the VIKOR method [18], and Brans and others developed the PROMETHEE method [19]. Opricovic and others carried out comparative analyses of the VIKOR approach alongside various MCDM techniques such as TOPSIS, PROMETHEE, and ELECTRE, finding that VIKOR has distinct advantages in dealing with MCDM problems, especially those with conflicting objectives [20].
VIKOR has seen extensive application across multiple domains, including but not limited to design, mechanical engineering, manufacturing, material selection, and new product development. Mohanty and others applied the VIKOR method to the selection of ergonomic office chairs [21]. Chanhan and others used VIKOR for selecting magnetic materials [22]. Yazdani and others analyzed and compared TOPSIS method, VIKOR method, and the Ashby method for material selection in micro-electromechanical system (MEMS) devices [23]. Bairagi and others utilized methods such as fuzzy VIKOR method, fuzzy TOPSIS method, and COPRAS-G method for the selection of casting robots [24]. Ghorabaee and others utilized the interval type-2 fuzzy VIKOR method for robot selection and compared it with several other MCDM methods [25]. Zhu and others proposed an MCDM method integrating rough-number analytic hierarchy process (AHP) and rough-number VIKOR, applied to design concept evaluation [26]. Azaryoon proposed an MCDM method founded on DEMATEL, ANP, and VIKOR, utilized for the selection of machining processes, workpiece materials, and features of workpiece shape [27].
In MCDM problems, the comparative significance of various evaluation indicators toward the decision-making goal varies, hence assigning scientific and reasonable weights to each indicator is a crucial consideration. Both TOPSIS and VIKOR methods ground their assessment on the proximity of alternatives to an optimal solution. However, traditional TOPSIS and VIKOR methods overlook the significance of these distances in relative terms. Approaches for ascertaining weights can be categorized into subjective and objective weighting methods. Subjective methods rely on expert experience and personal opinions to determine the relative weights of each evaluation indicator, while objective methods are based on objective experimental data.
Kaya and others proposed a VIKOR method grounded on the AHP, employing AHP principles to ascertain the relative weights of each indicator [28]. Bairagi and others used fuzzy AHP to determine indicator weights and applied fuzzy VIKOR, fuzzy TOPSIS, and COPRAS-G methods to manage the choice of casting robots [24]. Zhu and others proposed a weighting method based on rough-number-integrating AHP, applied to design concept evaluation [26]. Azaryoon and others used DEMATEL and ANP to determine the weights of evaluation indicators for processing technology, material selection, and workpiece shape characteristics [27]. Xu and others, addressing flood risk assessment, used an improved entropy weight method to calculate the relative weights of seven evaluation indicators and employed the k-means clustering algorithm to map flood risks in the study area [29]. Chen and others introduced a red tide risk assessment method based on the CRITIC method and TOPSIS-ASSETS, using CRITIC to calculate the weights of each evaluation indicator [30]. Ghodusinejad and others established an energy system regarding combined cooling, heating, and power (CCHP) and proposed a new weight calculation method using CRITIC and Shannon’s entropy methods, determining the weights of various evaluation indicators [31].
Fuzzy MCDM methods have been applied across various industrial sectors; however, research within the domain of port crane safety evaluation has largely been confined to metal structural systems, where indicators are more readily quantified and analyzed. There is a notable dearth of studies on comprehensive safety evaluations that include human, mechanical, managerial, and environmental aspects. In response, this research will investigate effective integration of uncertainty and fuzziness into the MCDM approach, specifically tailored for the safety risk assessment of quayside container cranes, aiming to establish a robust framework that addresses the inherent challenges of fuzziness and imprecision in safety evaluations of port equipment.
To achieve this, the remainder of the article is structured as follows: Section 2 presents fundamental notions pertinent to the safety evaluation index system for quayside container crane, the BWM, Pythagorean hesitant fuzzy sets, the VIKOR method, and the Pythagorean hesitant fuzzy VIKOR method. Section 3 proposes a safety risk evaluation method for quayside container cranes based on the Pythagorean hesitant fuzzy VIKOR method. Section 4 offers a case analysis to illustrate the practicability of the suggested approach. The article concludes with a summary in Section 5.

2. Methodology

In the field of port crane safety assessment, previous studies have attempted to quantify the inherent fuzziness and uncertainty of certain qualitative indicators, sometimes resulting in an oversimplified numerical approximation. This method, exemplified in Gan’s [32] safety evaluation approach using discrete Hopfield neural networks, may inadvertently discard important details contained within the indicators, thereby compromising the accuracy of the outcomes. For example, the safety status of wire ropes cannot be readily distilled into simple metrics such as the extent of wear or the number of broken strands, particularly given the practical challenges of obtaining such quantitative data in engineering contexts. Therefore, the introduction of fuzziness and uncertainty into the safety evaluation of port cranes has significant practical implications. Nadjafi et al. [33] proposed a new method based on possibility theory to determine the failure time distribution functions, and charted the failure and reliability curves for the Top Event. Yang et al. [34] introduced a new model for addressing the uncertainties in the degradation processes of multi-state systems, improving analytical efficiency and accuracy. Zaitseva et al. [35] developed a novel approach for mathematical modeling of multi-state systems with a particular focus on the uncertainty in initial data, enhanced by data mining classification procedures like Fuzzy Decision Trees. These research efforts inspire the integration of fuzziness and uncertainty analysis into the field of port crane safety evaluation.
This study proposes a safety risk evaluation method for gantry cranes through leveraging Pythagorean hesitant fuzzy sets combined with the VIKOR method, a tool that has seen wide application in decision making across various fields. Ren et al.’s [36] introduction of a novel multi-criteria group decision-making VIKOR method, which utilizes dual hesitant fuzzy sets, has been notably applied to partner selection, thereby enhancing decision making accuracy and reliability. Similarly, Kaya et al. [37] have advanced the application of the fuzzy VIKOR method in the selection of ship air compressors, significantly improving operational safety and efficiency for shipping companies. Despite these advancements, the domain of safety evaluation for port cranes still presents gaps, which this research aims to fill by introducing a method tailored to quayside container cranes. To achieve this, the subsequent section will provide a general introduction to the foundational knowledge pertinent to these methodologies, setting the stage for a comprehensive understanding of the proposed safety risk evaluation framework.

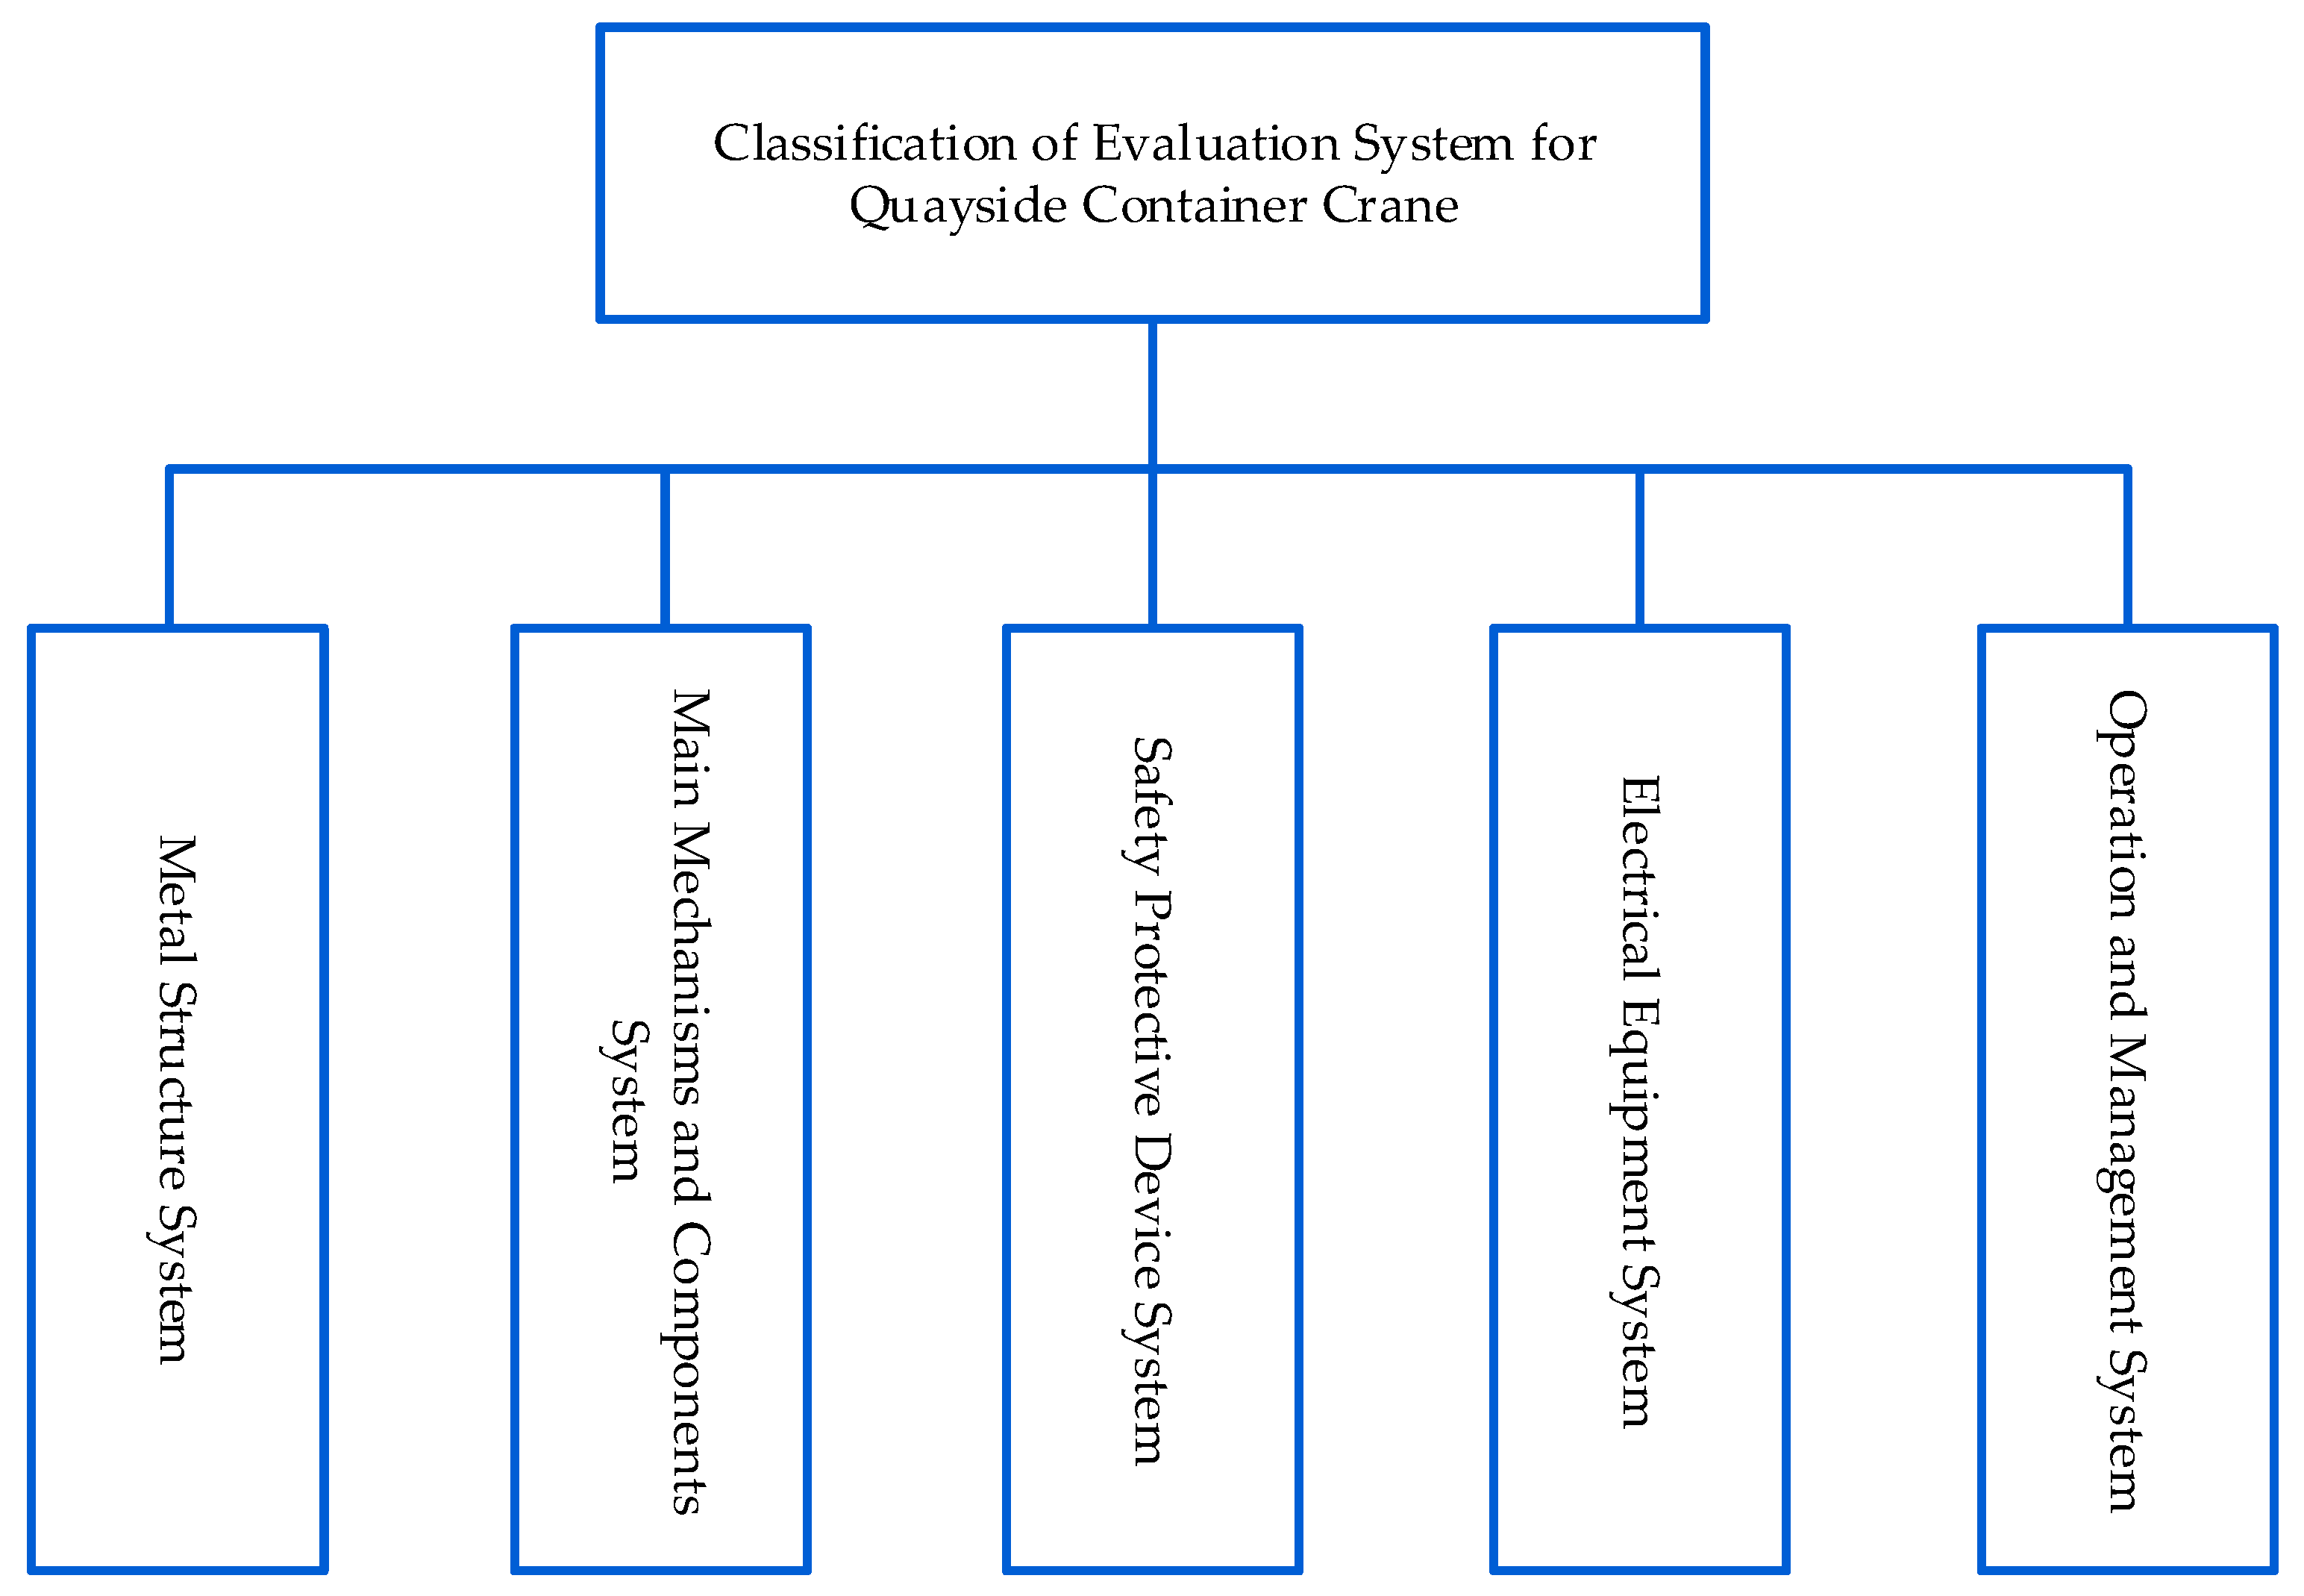
2.1. Quayside Container Crane Safety Evaluation Index System

A comprehensive and rational evaluation index system is essential for ensuring the accuracy, scientific rigor, and precision of equipment safety evaluations. Quayside container cranes are complex integrated systems, comprising multiple interdependent subsystems that work collaboratively to ensure the safe operation of the entire machinery.
The risk sources for quayside container cranes primarily include equipment factors, human factors, and environmental factors. Equipment factors encompass the metal structure of the equipment, various mechanisms, and protective devices. Human factors include aspects related to operators and management. Environmental factors, such as typhoons and earthquakes, often exhibit strong randomness and uncontrollability.
Based on the risk sources of gantry cranes, the safety evaluation index system can be divided into five parts: metal structure, main mechanisms and components, safety protective devices, electrical equipment, and operation and management. The index system is illustrated in Figure 1.
The metal structure of a quayside container crane serves as the load-bearing system for all its components. It is fundamental to the crane’s functionality and the primary stress-bearing part of the gantry crane. Damage or defects in the metal structure can impair the function of other parts, potentially leading to overall damage and serious safety accidents. Thus, the integrity of the metal structure is crucial for the overall safety of the gantry crane.
The types of damage commonly found in the metal structure of gantry cranes can be categorized into insufficient local strength of structural components, inadequate stiffness in bending members, local deformation of plates, cracks in plates and welds, and metal corrosion. Accordingly, five indicators have been selected for assessing the safety of the gantry crane’s metal structure: strength, stiffness, deformation, cracks, and corrosion. The strength indicator can be characterized by the maximum stress measured at the main load-bearing points under the rated load. Stiffness can be indicated by the deflection of the front beam under the rated load. Deformation can be assessed by local undulations. The crack indicator can be evaluated by the longest inspection cycle, and the corrosion indicator can be represented by the thickness of the corroded area of the plate.
The normal loading and unloading operations of quayside container cranes are carried out through the coordinated function of various main mechanisms and components. The safety condition of this part significantly impacts the overall safety of the crane. This section primarily includes the hoisting mechanism, luffing mechanism, gantry travel mechanism, trolley travel mechanism, and hydraulic system. Under each of these mechanisms, there are components like brakes, reducers, couplings, bearings, pulleys, wire ropes, drums, and wheels. The hydraulic system includes components such as hydraulic pumps, hydraulic cylinders, hydraulic valves, and pipelines.
Assessing the safety of these components and systems often cannot be characterized using quantitative data. Instead, it typically involves qualitative evaluations by experts, based on the specific conditions of each component and part.
The safety protection devices of quayside container cranes are crucial for ensuring safety in the event of equipment malfunction or operator misconduct. These devices serve a crucial function in the safe operation of the equipment and in preventing accidents, effectively safeguarding the overall safety of the machinery. This section mainly includes limit position limiters, load limiters, hatch cover protection devices, emergency stop devices, anti-wind skid devices, buffers, and other similar components.
Like the main mechanisms and components, the safety of these protective devices and systems is challenging to quantify with data. Their safety evaluation is predominantly conducted through qualitative assessments by experts, who consider the specific conditions of each component and part. These evaluations are essential for ensuring that the safety devices are functioning correctly and are capable of providing the necessary protection in critical situations.
The electrical equipment of quayside container cranes is essential for the functioning of various mechanisms. Without the control provided by electrical devices, the gantry crane would be unable to perform its functions or carry out loading and unloading operations. Malfunctions in electrical equipment can impact the normal operation of the entire equipment. The electrical components mainly include high-voltage cabinets, low-voltage cabinets, motors, speed control devices, feeding devices, transformers, and electrical protection devices.
The safety of these electrical components and systems is also challenging to quantify with data. Similar to the main mechanisms and safety protection devices, the evaluation of electrical equipment’s safety predominantly relies on qualitative assessments by experts. These assessments are based on the specific conditions of each component and part, ensuring that the electrical systems are functioning correctly and are capable of supporting the crane’s operations effectively.
Regarding the safety of quayside container cranes, the condition of the equipment itself is just one aspect. The quality of the operating personnel and the safety management systems of port enterprises also have a crucial impact on equipment safety. In the actual operation of gantry cranes, factors such as operators’ non-compliance, improper or delayed maintenance of equipment, and inadequacies in the enterprise’s safety management system often serve as significant catalysts for safety incidents. This section mainly encompasses personnel quality and environmental conditions, equipment management status, equipment maintenance and upkeep status, and the condition of the enterprise’s safety management system.
The evaluation indicators for this part are difficult to characterize using quantitative data. Similar to the other sections, the assessment of these aspects primarily relies on qualitative evaluations by experts, who consider the specific circumstances. These evaluations are vital to ensure that not only the mechanical and electrical components but also human factors and organizational policies are conducive to the safe and efficient operation of quayside container cranes.

2.2. The Best–Worst Method (BWM)

2.2.1. Overview of the BWM

The AHP is a well-established method for obtaining subjective weights, involving pairwise comparisons between various evaluation indicators to establish a hierarchy of their importance. However, AHP can be cumbersome, requiring n ( n 1 ) / 2 comparisons, and when there are many evaluation indicators, the process can lead to significant errors and inconsistencies.
In contrast, the BWM, introduced in 2015 by Rezaei, a scholar from the Netherlands, is a newer multi-attribute decision-making approach. BWM, which stands for the Best–Worst MCDM method, features multi-criteria, qualitative and quantitative aspects, mathematical expression, and statistical processing [38]. As a novel weighting method based on pairwise comparisons, BWM simplifies this process by only requiring comparisons between the best indicator against all others and all indicators against the worst. Compared to AHP, BWM is simpler and more accurate, reducing redundant parts. In handling multi-level mathematical models, BWM uses limited data to mathematize the decision-making process. It only requires 2 n 3 comparisons among the indicators to obtain optimal weight results, significantly reducing the number of comparisons needed. This not only ensures reliability, but also minimizes inconsistencies in the comparison process. The results obtained from BWM are closer to real situations and exhibit stronger consistency.

2.2.2. BWM Calculation Process

1.
Determination of the Best and Worst Criteria;
Let us consider a scenario where n distinct evaluation criteria are present. These criteria collectively constitute the set of evaluation criteria, denoted as Equation (1):
F = { f 1 , f 2 , , f n }
Subject matter experts in the relevant field assess these criteria to identify the best criterion F B and the worst criterion F W .
2.
Calculation of the Comparison Vector; Q B ;
Field experts employ a 1–9 scale for scoring each evaluation criterion, thereby determining the relative preference of the most favorable criterion. This is achieved by assessing how the best criterion fares in comparison to the others. Consequently, we obtain the comparison vector, as shown in Equation (2):
Q B = { p B 1 , p B 2 , , p B n }
In this vector, a value of 1 indicates that two criteria are of equal importance, whereas a value of 9 reflects the utmost importance of the best criterion F B in comparison to any other criterion. Evidently, p B B = 1 .
3.
Calculation of the Comparison Vector Q W .
Experts in the relevant field employ a 1–9 scale to appraise each evaluation criterion, gauging its level of preference compared to the least favorable criterion. This appraisal process leads to the formulation of the comparison vector, as shown in Equation (3):
Q W = { p 1 W , p 2 W , , p n W }
In this vector, a value of 1 indicates that two criteria are of equal importance, whereas a value of 9 reflects extreme importance of a criterion relative to the worst criterion F W . Evidently, p W W = 1 .
4.
Calculation of the Optimal Criterion Weights
Define the optimal set of weights as { w 1 * , w 2 * , , w n * } . This set is determined by the model that aims to minimize the maximum absolute deviation represented by Equation (4):
{ w B a B j w j , w j a j W w W }
Here, w B represents the weight of the best criterion, w W represents the weight of the worst criterion, w j represents the weight of the j-th criterion, a B j represents the degree of preference of the best criterion over the j-th criterion, and a j W represents the degree of preference of the j-th criterion over the worst criterion. All criterion weights are non-negative and their sum equals 1, which can be expressed as Equation (5):
min max { w B a B j w j , w j a j W w W } s . t . j = 1 n w j = 1 w j 0
In the optimization model presented, ‘s.t.’ introduces the constraints necessary for the solution.
Based on the properties of the BWM, the aforementioned model can be refined and transformed into a linear programming model, as shown in Equation (6):
min ξ s . t . w B a B j w j ξ w j a j W w w ξ j = 1 n w j = 1 , w j 0 ; j N
In this context, ξ represents the consistency error of the expert comparison results. A smaller value of ξ indicates a smaller error in the weight calculation results, meaning that the calculated weights are more reliable.

2.3. Pythagorean Hesitant Fuzzy VIKOR Method

2.3.1. Overview of Pythagorean Hesitant Fuzzy Sets

Consider a universe of discourse denoted by X . Within this universe, a set can be characterized as a Pythagorean fuzzy set on X , which is represented as Equation (7):
A = < x , u A ( x ) , v A ( x ) > x X
Here, u A ( x ) denotes the membership degree of an element x in set A , and v A ( x ) denotes the non-membership degree of x in set A . These functions must adhere to the condition, as shown in Equation (8):
u A 2 ( x ) + v A 2 ( x ) 1 , x X , u A ( x ) , v A ( x ) 0 , 1
Extending the concept of Pythagorean fuzzy sets, we introduce a universe of discourse denoted by X . In this context, a set is defined as a Pythagorean hesitant fuzzy set on X , which is given by Equation (9):
A = < x , h A ( x ) , g A ( x ) > x X
Here, h A ( x ) and g A ( x ) are non-empty finite subsets of 0 , 1 , representing the possible membership degree set and the possible non-membership degree set of element x in set A , satisfying the condition as shown in Equation (10):
u A 2 ( x ) + v A 2 ( x ) 1 , x X , u A ( x ) h A ( x ) , v A ( x ) g A ( x )
The hesitation degree of x toward A is denoted as π A ( x ) , which is defined by Equation (11):
π A ( x ) = 1 u A 2 ( x ) v A 2 ( x )
Such a set as α = h α , g α is referred to as a Pythagorean hesitant fuzzy number, abbreviated as PHFN.
For a Pythagorean hesitant fuzzy number α = h α , g α , the score function S ( α ) , which takes values in the interval 1 , 1 , is defined as Equation (12):
S ( α ) = 1 l ( h ) u h α u 2 1 l ( g ) v g α v 2
Similarly, the accuracy function G ( α ) , ranging in 0 , 1 , is given by Equation (13):
G ( α ) = 1 l ( h ) u h α u 2 + 1 l ( g ) v g α v 2
Here, l ( h ) and l ( g ) , respectively, represent the number of elements in h α and g α .
The comparison rules for two Pythagorean hesitant fuzzy numbers, α i = h i , g i , i = 1 , 2 are as follows:
  • If S ( α 1 ) > S ( α 2 ) , then α 1 α 2 ;
  • If S ( α 1 ) = S ( α 2 ) , then
    If G ( α 1 ) > G ( α 2 ) , then α 1 α 2 ;
    If G ( α 1 ) = G ( α 2 ) , then α 1 α 2 .
For the operations of Pythagorean fuzzy numbers:
Let α = h , g , α i = h i , g i , i = 1 , 2 and λ > 0 , then
  • α 1 α 2 = u α 1 h 1 u α 2 h 2 u α 1 2 + u α 2 2 u α 1 2 u α 2 2 , v α 1 g 1 v α 2 g 2 v α 1 v α 2 ;
  • α 1 α 2 = u α 1 h 1 u α 2 h 2 u α 1 u α 2 , v α 1 g 1 v α 2 g 2 v α 1 2 + v α 2 2 v α 1 2 v α 2 2 ;
  • λ α = u α h 1 ( 1 u α 2 ) λ , v α g v α λ ;
  • α λ = u α h u α λ , v α g 1 ( 1 v α 2 ) λ .
Suppose α 1 = h 1 , g 1 , α 2 = h 2 , g 2 are two Pythagorean hesitant fuzzy numbers. The distance between α 1 and α 2 is defined as Equation (14):
d α 1 , α 2 = 1 2 1 l h j = 1 l h ( u 1 σ ( j ) ) 2 ( u 2 σ ( j ) ) 2 + 1 l g j = 1 l g ( v 1 σ ( j ) ) 2 ( v 2 σ ( j ) ) 2
where l ( h ) = max l ( h 1 ) , l ( h 2 ) , l ( h i ) and l ( g i ) , i = 1 , 2 represent the number of elements in h i and g i , respectively. u i σ ( j ) and v i σ ( j ) represent the j-th largest element in α i , respectively.

2.3.2. The Basic Principle of the VIKOR Method

The VIKOR method is a multi-attribute decision-making approach that falls under the category of optimized compromise solutions in multi-attribute decision making. It utilizes an LP metric aggregation function and adopts a compromise philosophy. This method initially analyzes the ideal and anti-ideal solutions and then calculates various alternative solutions. The options are ordered and assessed in accordance with the ideal solution, achieving a compromise through mutual concessions among the attributes of each solution [39]. The strength of VIKOR lies in its capability to offer compromise solutions amidst a series of conflicting evaluation criteria, thereby facilitating problem resolution. Compared to the TOPSIS method, VIKOR is more effective in avoiding inversions, and its outcomes are generally more acceptable to decision makers.
Considering a decision-making scenario with m alternative solutions, we define the set of alternatives as Equation (15):
X = X 1 , X 2 , , X m
Furthermore, each alternative is assessed based on n evaluation criteria, denoted by Equation (16):
Y = Y 1 , Y 2 , , Y n
Here, h i j represents the evaluation value of the j-th criterion for the i-th alternative.
The weights assigned to each evaluation criterion are represented by the weight vector, as shown in Equation (17):
W = w 1 , w 2 , , w n
The VIKOR method, derived from the LP metric function, is founded on Equation (18):
L p , i = j = 1 n w j h j + h i j / h j + h j p 1 / p , 1 p ; i = 1 , 2 , , m
The calculation process for the VIKOR method is as follows:
1.
Data Normalization
Normalize the data using the method shown in Equation (19):
h i j = x i j i = 1 m x i j 2 , i = 1 , 2 , , m ; j = 1 , 2 , , n
2.
Determining the Ideal and Anti-ideal Solutions
Calculate the ideal and anti-ideal solutions using the method shown in Equation (20):
h j + = max h i j , h j = min h i j
3.
Calculating the Distance Ratios to the Ideal and Anti -Ideal Solutions
This includes calculating the group utility value S i and individual regret value R i for each alternative. The calculation methods are shown in Equations (21) and (22):
S i = j = 1 n w j h j + h i j / h j + h j
R i = max j w j h j + h i j / h j + h j
Here, S i is the group utility value, where a smaller value indicates a greater group benefit. R i is the individual regret value, where a smaller value indicates less individual regret.
4.
Calculating the Compromise Value
After calculating the group utility value S i and individual regret value R i for each alternative, use these to calculate the compromise value for each alternative. The specific calculation method is shown in Equation (23):
Q i = α S i + 1 α R i , i = 1 , 2 , , m
Here, Q i is the compromise value for the i-th alternative, and α is the decision-making coefficient.
The coefficient α reflects the weight of the group benefit value, while 1 α reflects the weight of the individual regret value. When α is greater than 0.5, the group utility is primarily considered; when α is less than 0.5, the individual regret mechanism is primarily considered for decision making; when α equals 0.5, it represents a balanced consideration of both group utility and individual regret. The most commonly used decision-making method is when α is set to 0.5.
5.
Ranking of Alternatives
Once the compromise values Q i for all alternatives are calculated, arrange them in ascending order. The smaller the compromise value of an alternative, the better it is considered.
6.
Acquiring the Optimal Solution
When the alternative with the smallest compromise value Q i , denoted as X ( 1 ) , satisfies the following two conditions, it is considered as the optimal solution:
Condition 1: Q ( X ( 2 ) ) Q ( X ( 1 ) ) D Q , where X ( 2 ) represents the alternative with the second smallest compromise value Q i when sorted in ascending order.
D Q = 1 m 1
Condition 2: The alternative with the smallest Q i value, after sorting in ascending order, must also rank first in either the S i or R i values when these are sorted in ascending order.
If both Condition 1 and Condition 2 cannot be satisfied simultaneously:
(a)
If Condition 1 is not met, the compromise solution includes both X ( 1 ) , X ( 2 ) ,   X ( m ) , where the value of m is determined by Equation (25):
Q ( X ( m ) ) Q ( X ( 1 ) ) D Q
(b)
If only Condition 2 is not satisfied, then both the alternatives X ( 1 ) and X ( 2 ) (the ones with the smallest and the second smallest Q i values, respectively) are considered as optimal solutions. In this case, both X ( 1 ) and X ( 2 ) are the compromise solutions.

2.3.3. The Basic Idea of the Pythagorean Hesitant Fuzzy VIKOR Method

Consider a set of m alternative options and a set of n evaluation criteria, denoted by Equations (26) and (27):
A = A 1 , A 2 , A m
F = F 1 , F 2 , , F n
Subject matter experts, leveraging their expertise, assign evaluation values to each criterion for every alternative. The evaluation of the i-th alternative A i , for the j-th criterion F j , is encapsulated by a Pythagorean hesitant fuzzy number:
k ^ i j = h i j , g i j
where h i j and g i j are the sets of membership degree u i j and non-membership degree v i j of the i-th alternative A i for the j-th evaluation criterion F j , respectively. We can obtain a Pythagorean hesitant fuzzy matrix about various alternative options and evaluation criteria.
The computational process for the Pythagorean hesitant fuzzy VIKOR method is as follows:
1.
Construct the Expert Decision Fuzzy Matrix
K = ( k ^ i j ) m × n = k ^ 11 k ^ 12 k ^ 1 n k ^ 21 k ^ 22 k ^ 2 n k ^ m 1 k ^ m 2 k ^ m n
In Equation (28), m is the number of alternative solutions, n is the number of evaluation criteria, and k ^ i j is the fuzzy evaluation result of the i-th alternative under the j-th criterion made by experts.
2.
Determine the Weights of Each Evaluation Criterion
Employing a method for weight determination, we identify the relative weights of the evaluation criteria. These weights are denoted by the set W , which is defined as Equation (29):
W = w 1 , w 2 , , w n
Here, w i represents the weight of the i-th evaluation criterion.
3.
Determine the Pythagorean Hesitant Fuzzy Ideal Solution K + and Anti-Ideal Solution K
The calculation is based on the method shown in Equation (30):
K + = k 1 + , k 2 + , , k n + K = k 1 , k 2 , , k n
Here, k j + = max i ( k ^ i j ) , k j = min i ( k ^ i j ) .
4.
Determine the Individual Regret Value R i and Group Utility Value S i for Each Alternative with Respect to Each Safety Evaluation Standard Level
The calculation methods are shown in Equations (31) and (32):
S i = j = 1 n w j × d k ^ j + , k ^ i j d k ^ j + , k ^ j , i = 1 , 2 , , m
R i = max j j = 1 n w j × d k ^ j + , k ^ i j d k ^ j + , k ^ j , i = 1 , 2 , , m
5.
Calculate the Compromise Value Q i
After obtaining the group utility value S i and individual regret value R i for each alternative, use these to calculate the compromise value for each alternative. The specific calculation method is shown in Equation (33):
Q i = α S i + 1 α R i , i = 1 , 2 , , m
where Q i is the compromise value for the i-th alternative, and α is the decision-making coefficient.
6.
Ranking of Alternatives
Order the options according to their compromise values Q i from lowest to highest; a smaller value indicates a more favorable alternative.
7.
Acquiring the Optimal Solution
The alternative with the smallest compromise value Q i denoted as X ( 1 ) , is considered the optimal solution if it satisfies the following two conditions:
Condition 1: Q ( X ( 2 ) ) Q ( X ( 1 ) ) D Q , where X ( 2 ) represents the alternative with the second smallest compromise value Q i when sorted in ascending order.
D Q = 1 m 1
Condition 2: The alternative with the smallest Q i value, after sorting in ascending order, must also rank first in either the S i or R i values when these are sorted in ascending order.
If both Condition 1 and Condition 2 cannot be satisfied simultaneously:
(a)
If Condition 1 is not met, the compromise solution includes both X ( 1 ) , X ( 2 ) , X ( m ) , where the value of m is determined by Equation (35):
Q ( X ( m ) ) Q ( X ( 1 ) ) D Q
(b)
If only Condition 2 is not satisfied, then both the alternatives X ( 1 ) and X ( 2 ) (the ones with the smallest and the second smallest Q i values, respectively) are considered as optimal solutions. In this case, both X ( 1 ) and X ( 2 ) are the compromise solutions.
This methodological framework provides a systematic approach for handling decision-making problems with multiple criteria and uncertain assessments, offering a balance between the maximum group benefit and the minimum individual regret.

3. Safety Risk Assessment Method for Quayside Container Cranes Based on BWM–Pythagorean Hesitant Fuzzy VIKOR Method

In this section, we will explore how to apply the BWM–Pythagorean hesitant fuzzy VIKOR method to address the safety risk assessment of quayside container cranes.
The safety condition assessment of quayside container cranes is a complex MCDM problem, involving multiple risk indicators affecting the overall safety of the equipment. It necessitates the involvement of experts in the relevant field for analysis. Due to the inherent fuzziness and the limitations of testing equipment precision and subjective variability among evaluators, the safety risk assessment of gantry cranes can be viewed as a multi-attribute decision-making problem represented by hesitant fuzzy elements (HFEs).
Often, decision makers may find it difficult to precisely express an evaluation value for a particular criterion. Different situations and different evaluators may have varying evaluation values for the same criterion, making it challenging to set a standard evaluation criterion applicable to all scenarios. Hence, it is reasonable to use hesitant fuzzy elements (HFEs) to represent the evaluation values of each criterion.
For determining the safety status of gantry cranes, we aim to obtain a safety risk level for the crane under evaluation, thereby providing guidance for the work and management of port enterprises and dock managers. Using the VIKOR method, we can obtain a ranking of the alternative solutions. Thus, by sorting the evaluation data of the crane under evaluation along with the boundary data of each safety risk level, we can determine the safety risk level of the crane under evaluation.
Generally, the safety risk levels of gantry crane equipment are divided into five levels, ranging from level one (excellent) to level five (very poor), indicating increasing levels of safety risk. With five levels, there are six boundary divisions. By sorting these six division boundaries along with the Pythagorean hesitant fuzzy evaluation set of the crane under evaluation using the principles of the VIKOR method, we can obtain the safety risk level of the crane under evaluation.
The weights of each evaluation indicator represent their relative importance. As the safety risk assessment indicators for gantry cranes are mostly qualitative and difficult to quantify, and the few quantitative indicators are also subject to the adverse experimental environment of the dock and the precision of testing equipment, there is inherent fuzziness and uncertainty. Therefore, we choose the BWM method to weigh each evaluation indicator; the specific weighting method is discussed in Section 2.2.
In the traditional VIKOR method, we sort the alternatives based on a specific distance measure from the ideal solution. Thus, in the Pythagorean hesitant fuzzy VIKOR method, we need to determine the ideal solution and the distance measure method. For this study, the ideal solution corresponds to the highest value in every column of the Pythagorean hesitant fuzzy evaluation matrix, and the separation between each option and the ideal solution can be determined by employing the distance equation for Pythagorean hesitant fuzzy numbers outlined in Section 2.3.
Calculate the individual regret value R i and the group utility value S i for the safety risk level boundaries and the crane under evaluation using the Pythagorean hesitant fuzzy VIKOR method, where R i represents the worst-case scenario of a particular evaluation criterion, and S i represents the overall state after considering all evaluation criteria. In gantry crane safety risk assessments, there are two scenarios: one where a particular evaluation criterion is excessively poor, and the other where no individual criterion reaches an extremely poor condition, but the coupling of various indicators leads to poor overall equipment condition. Therefore, both R i and S i should be considered, and appropriate weights should be selected for them to calculate the compromise value of the Pythagorean hesitant fuzzy VIKOR. Sorting these values will yield the safety risk level of the crane under evaluation. Given that the objective is solely to ascertain the safety risk level of the crane being assessed, there is no need for an optimal solution judgment.
The evaluation process is as follows:
Step 1: Experts deliberate to represent the boundaries of each safety level using Pythagorean hesitant fuzzy numbers k ^ i j = h i j , g i j , where h i j and g i j are the sets of membership u i j and non-membership degrees v i j , respectively, for the i-th safety level A i boundary concerning the j-th evaluation criterion F j . We can obtain a Pythagorean hesitant fuzzy matrix for various safety level boundaries and evaluation criteria, as shown in Equation (36):
K L = k ^ 11 k ^ 12 k ^ 1 n k ^ 21 k ^ 22 k ^ 2 n k ^ 61 k ^ 62 k ^ 6 n
Step 2: Experts deliberate and determine the Pythagorean hesitant fuzzy numbers k ^ x j = h x j , g x j for each evaluation criterion of the quayside container crane equipment under evaluation, where h x j and g x j are the sets of membership degree u x j and non-membership degree v x j for the j-th evaluation criterion F j of the equipment under evaluation. These are then expanded to K L , resulting in the expert decision Pythagorean hesitant fuzzy evaluation matrix, as shown in Equation (37):
K = k ^ 11 k ^ 12 k ^ 1 n k ^ 21 k ^ 22 k ^ 2 n k ^ 61 k ^ x 1 k ^ 62 k ^ x 2 k ^ 6 n k ^ x n
Step 3: Experts deliberate to determine the relative importance of each evaluation criterion and use the BWM, as described in Section 2.2, to determine the relative weights of each evaluation criterion, as shown in Equation (38):
W = w 1 , w 2 , , w n
where w i 0 , 1 for i = 1 , 2 , , n , and the weights satisfy Equation (39):
i = 1 n w i = 1
Step 4: Determine the Pythagorean hesitant fuzzy ideal solution K + and anti-ideal solution K using the calculation method shown in Equation (30).
Step 5: Determine the individual regret value R i and the group utility value S i for each alternative and safety evaluation standard level using the Pythagorean hesitant fuzzy VIKOR method. The calculation methods are shown in Equations (31) and (32):
Step 6: Determine the Pythagorean hesitant fuzzy VIKOR compromise value Q i for the crane under evaluation and each safety evaluation standard level using the calculation method shown in Equation (40):
Q i = α S i S + S S + + ( 1 α ) R i R + R R +
where S + = min i S i , S = max i S i , R + = min i R i , R = max i R i .
The α value is the decision-making coefficient reflecting the weight of group benefit and individual regret, and is determined by the decision maker based on the actual situation.
Step 7: Sort the compromise values Q i of the alternatives and safety evaluation standard levels from smallest to largest. Based on the sorting of each alternative and safety evaluation standard level, the safety risk level of each alternative can be determined, where a smaller value Q i represents a better safety condition.

4. Case Study Verification

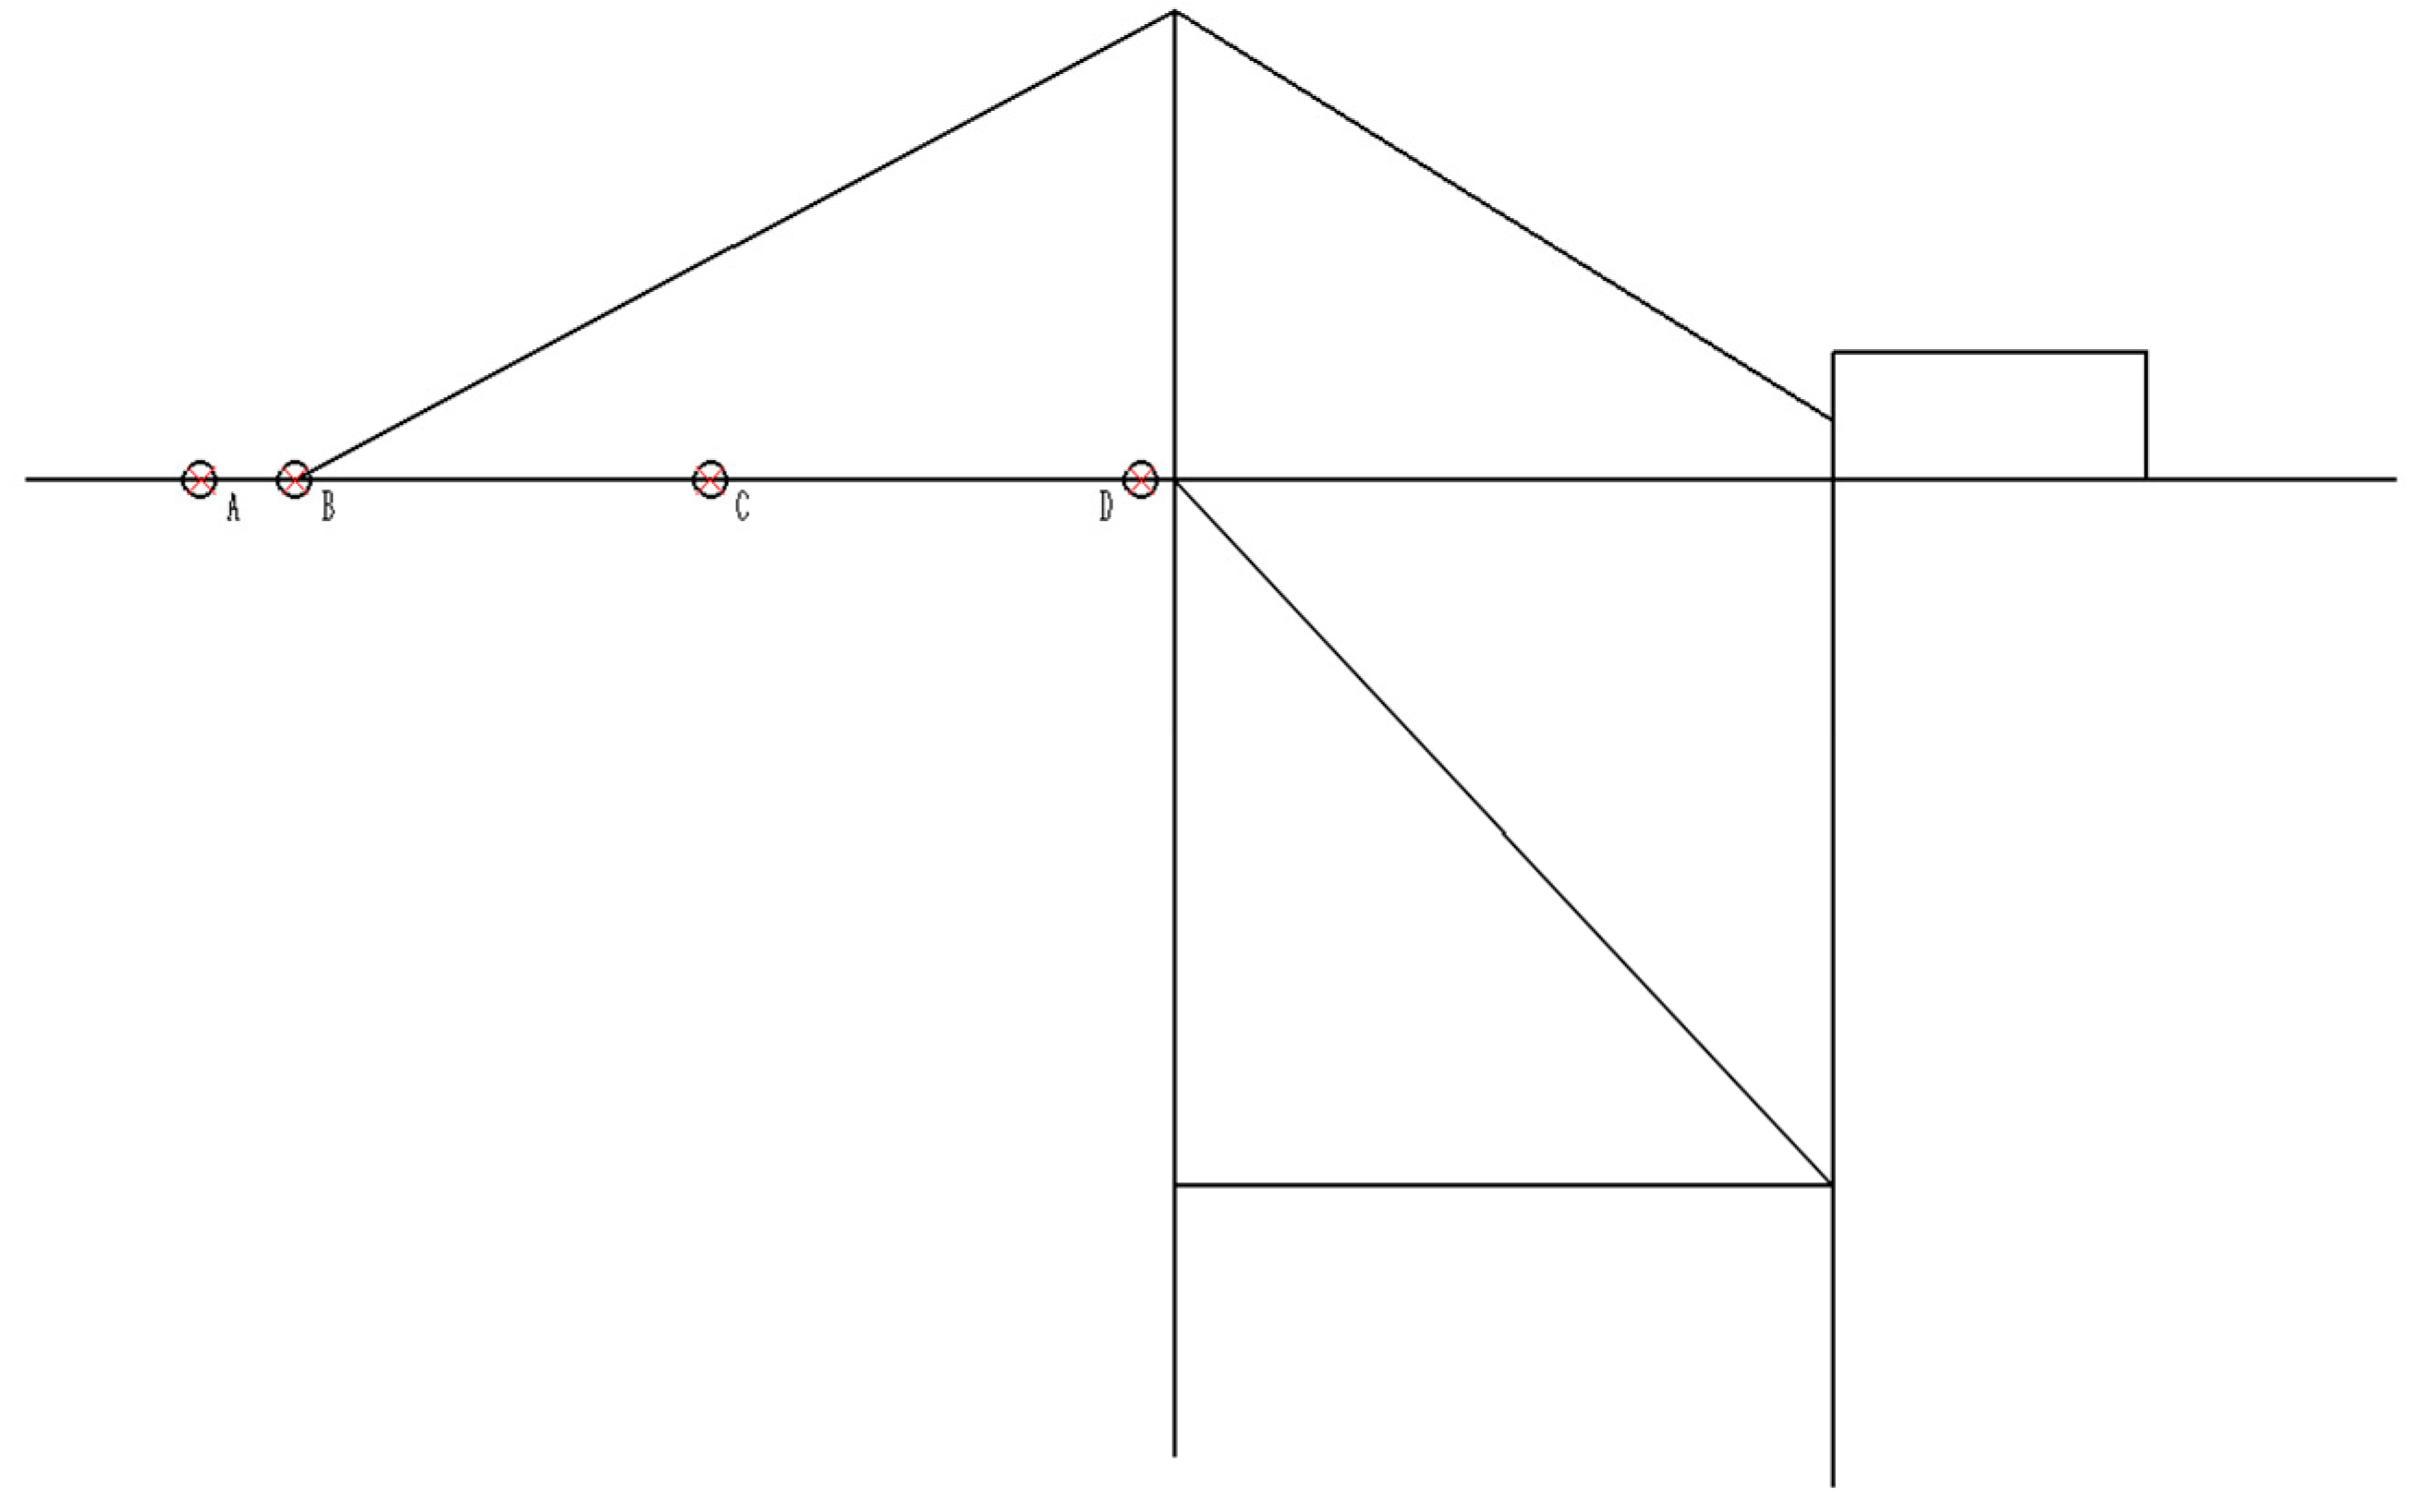
4.1. Basic Parameters of the Object under Evaluation

This section will utilize a particular quayside container crane at a certain port as a case study to confirm the practicability of the suggested safety evaluation method for quayside container cranes based on the Pythagorean hesitant fuzzy VIKOR method. The primary performance and technical specifications of the crane being assessed are displayed in Table 1.
Conduct on-site experimental tests on the quayside container crane equipment under evaluation and invite a panel of experts to discuss the condition of each safety evaluation criterion for the equipment, assessing the original data for each indicator.

4.2. Safety Evaluation Level Classification for Quayside Container Cranes

A panel of experts from the port crane-related field deliberated on the division boundaries for safety evaluation levels of quayside container cranes. They determined the Pythagorean hesitant fuzzy numbers for the boundaries of the 28 evaluation indicators across five subsystems: the metal structure subsystem, the main mechanisms and components subsystem, the electrical equipment subsystem, the safety protection device subsystem, and the operation and maintenance subsystem. The results are presented in Table 2.
A 1 to A 5 , respectively, represent the five evaluation indicators for the metal structure system: strength, stiffness, cracks, deformation, and corrosion. B 1 to B 4 , respectively, represent the four evaluation indicators for the main mechanisms and components system: hoisting mechanism, gantry traveling mechanism, trolley traveling mechanism, and luffing mechanism. C 1 to C 9 , respectively, represent the nine evaluation indicators for the electrical equipment system: high and low voltage cabinets, operating motors, speed control devices, contactors, controllers, feeding devices, transformers, insulation resistance, and protection devices. D 1 to D 5 , respectively, represent the five evaluation indicators under the safety protection device system: overload limiter, limit device, overspeed protector, wind anti-skid device, and anti-collision device. E 1 to E 5 , respectively, represent the five evaluation indicators for the operation and maintenance system: qualifications and capabilities of operators, qualifications and capabilities of maintenance personnel, safety assurance facilities, maintenance quality, and safety management systems. L 1 to L 6 represent the six safety risk level boundaries, with 1 to 6 indicating increasing levels of danger.

4.3. Data Collection for Indicators of the Equipment under Evaluation

For the qualitative indicators of the quayside container crane equipment under evaluation, experts provide their evaluations for each indicator using Pythagorean hesitant fuzzy numbers. It should be noted that the indicators for strength, stiffness, deformation, corrosion, and cracks under the metal structure subsystem can be quantified. Decision-making experts will provide corresponding linguistic evaluations based on experimental data, thereby obtaining the Pythagorean hesitant fuzzy evaluation matrix. Relevant test data are shown in Table 3, Table 4, Table 5, Table 6 and Table 7.
Resistance strain gauges were meticulously affixed at critical stress points on the principal components of the quayside container crane under evaluation. These gauges were linked to a strain gauge meter to measure the stress experienced by each component when subjected to the equipment’s rated load. Due to the numerous test points, only the maximum stress test values for each part are displayed in Table 3.
Use a total station to measure the deflection at various test points under different operating conditions of the quayside container crane under evaluation. Record the initial height values of the test points when the trolley is unloaded and at the parking position. Then, lift the test load with the trolley and move it to the corresponding position. After stabilization, record the height values of the test points under load. The deflection displacement of the main beam at that test point position is determined by the change in height of the test point before and after loading. The results are shown in Table 4.
In Figure 2, point A is located near the end of the front girder of the quayside container crane, point B is at the connection between the front girder and the front strut, point C is situated at the midpoint of the front girder, and point D is positioned at the rear part of the front girder.
Using a steel ruler, the local waviness of each component of the assessed equipment was quantitatively measured, focusing on the extent of protrusion or indentation over a span of 1 m. The results of these measurements are systematically compiled in Table 5.
Key welds of the metal structure of the quayside container crane equipment under evaluation are subjected to spot checks using the magnetic particle inspection method. Due to the numerous inspection points, this paper only displays the locations that did not meet the criteria. The results are shown in Table 6.
For the equipment under evaluation, the thickness of the corroded areas in various parts is measured, compared to the original thickness with the corroded area’s thickness. Due to numerous testing locations, this paper only compiles the maximum corrosion amount for each part into Table 7 for display.
Other subsystems of the equipment under evaluation are tested according to national standards such as GB/T 6067.1-2010, GB/T 3811-2008, GB/T 15361-2009, JT/T 79-2008 [40,41,42,43], etc. These tests assess the safety performance of the subsystems. Due to space limitations, detailed results are not displayed here.
Three experts from the field of port cranes are invited to evaluate the test results. The evaluation outcomes are shown in Table 8.
From the content mentioned in the previous section, the expert decision can be represented by the Pythagorean hesitant fuzzy evaluation matrix, as shown in Equation (41).
K = k ^ 11 k ^ 12 k ^ 1 n k ^ 21 k ^ 22 k ^ 2 n k ^ 61 k ^ x 1 k ^ 62 k ^ x 2 k ^ 6 n k ^ x n

4.4. Determination of Weights for Each Evaluation Indicator

Based on the BWM solution approach and procedure described in Section 2.2, calculate the subjective weights of each evaluation indicator for the metal structure subsystem of the quayside container crane under evaluation. First, invite experts from the relevant field to compare and score the five evaluation indicators of the metal structure subsystem under evaluation. The strength indicator is denoted as A 1 , the stiffness indicator as A 2 , the crack indicator as A 3 , the deformation indicator as A 4 , and the corrosion indicator as A 5 . Determine the best indicator as the strength indicator A 1 , and the worst indicator as the deformation indicator A 4 .
After determining the best indicator, the experts from the relevant field score each evaluation indicator on a scale of 1 to 9 to determine the degree of preference of the best indicator over the other indicators. The comparison results are shown in Table 9.
The best indicator comparison vector can be obtained as:
Q B = { 1 , 2 , 1 , 4 , 3 }
Similarly, after determining the worst indicator, experts from the relevant field score each evaluation criterion on a scale of 1 to 9 to determine the degree of preference of other indicators over the worst indicator. By comparing the degree of preference between each indicator and the worst indicator, the corresponding scale can be obtained. The comparison results are shown in Table 10.
The worst indicator comparison vector can be obtained as:
Q W = { 5 , 3 , 4 , 1 , 2 }
Based on Equation (6), we can formulate the following linear programming model as shown in Equation (42):
min ξ s . t . w 1 2 w 2 ξ w 1 w 3 ξ w 1 4 w 4 ξ w 1 3 w 5 ξ w 1 5 w 4 ξ w 2 3 w 4 ξ w 3 4 w 4 ξ w 5 2 w 4 ξ w 1 + w 2 + w 3 + w 4 + w 5 = 1
By solving this linear programming model using MATLAB 2021b software, the subjective weights according to the BWM are obtained:
W 1 = 0.3243 , 0.1891 , 0.2838 , 0.0812 , 0.1216 , ξ = 0.2
Similarly, the calculation methods for the main mechanisms and components subsystem, electrical equipment subsystem, safety protection device subsystem, and the operation, maintenance, and management subsystem are akin to those described earlier. The detailed explanations of these are omitted here, but the calculation results are shown in Table 11.
After determining the weights of each evaluation indicator within the five subsystems, the BWM is used to calculate the weights of each subsystem. The calculation process is similar to that for calculating the weights of evaluation indicators within each subsystem. The detailed explanations of these are also omitted here, but the calculation results are as follows:
W S = 0.3866 , 0.1092 , 0.0672 , 0.2185 , 0.2185
By multiplying the corresponding weights of each subsystem by the weights of each evaluation indicator within them, the weight of each evaluation indicator for the overall quayside container crane under evaluation can be obtained. The calculation results are shown in Table 12:

4.5. Determination of Safety Risk Level for the Quayside Container Crane Equipment under Evaluation

Upon obtaining the Pythagorean hesitant fuzzy matrix K L for each safety level boundary and the corresponding weights W of each evaluation indicator for the entire quayside container crane under evaluation, the safety risk level of the crane under evaluation can be determined.
Based on Equation (30), the ideal solution k ^ i + and anti-ideal solution k ^ i for each column in the matrix K L can be determined. The calculation results are presented in Table 13.
Based on Equations (31), (32) and (40), the individual regret values R i , group utility values S i , and compromise values Q i for each safety risk level boundary can be calculated using the Pythagorean hesitant fuzzy VIKOR method. Similarly, the individual regret value R x , group utility value S x , and compromise value Q x for the quayside container crane equipment under evaluation can also be determined. Here, the decision-making coefficient α is set to 0.5. The calculation results are presented in Table 14.
As observed, the Q x value of the quayside container crane under evaluation falls between the boundaries of Q 2 and Q 3 . Therefore, the safety risk level of this equipment is determined to be level 2, indicating a good safety status.

5. Conclusions

In this study, we expanded the realm of multi-criteria decision making under uncertainty by introducing an innovative application of the VIKOR method, which incorporates Pythagorean hesitant fuzzy sets. This enhanced method was specifically tailored for a holistic safety assessment of quayside container cranes in port environments, effectively gauging the safety risk levels of such critical equipment. Our research systematically deconstructed the quayside container crane into five distinct safety evaluation subsystems, pinpointing a suite of pertinent safety risk indicators for each. To accurately weigh these indicators, the Best–Worst Method (BWM) was employed, thereby providing a nuanced understanding of their collective impact on the overarching safety of quayside container crane operations.
Given the inherent qualitative nature and the accompanying challenges in quantifying many of the safety risk indicators for quayside container cranes, coupled with the limitations of expert evaluations in yielding precise numerical scores, the proposed Pythagorean hesitant fuzzy set-based VIKOR method emerged as a robust solution. It adeptly bridges the gap between qualitative judgment and quantitative analysis, offering a comprehensive tool for risk level assessment.
By applying this method to a real-world scenario, specifically an operational quayside container crane at a port in China, we delved into the practicality of this technique within the project risk evaluation sphere. The case study not only illustrated the approach’s applicability but also substantiated its viability, underscoring the potential benefits of integrating Pythagorean hesitant fuzzy sets into the VIKOR framework for enhanced decision making in complex, uncertain environments.
The traditional VIKOR method, primarily utilized for selecting optimal solutions, is expanded in this study through the Pythagorean hesitant fuzzy set-based VIKOR approach. This method enhances grading by ranking evaluation targets against standard levels, addressing existing challenges in the safety risk assessment of port quayside container cranes and pioneering future research directions. The method’s adaptability suggests potential applications in aviation, transportation, industrial production, and evaluations of efficiency and economy. However, adaptability issues arise when assessment targets change, necessitating re-evaluation of safety indicator weights due to variations in port equipment, work environments, management practices, and operator habits. Future research may concentrate on refining computational algorithms or expanding the model to include real-time data analytics for dynamic safety evaluations.

Author Contributions

Methodology, J.Y.; investigation, F.S. and L.Y.; resources, M.L.; data curation, F.S. and L.Y.; writing—original draft, J.Y.; writing—review and editing, J.Y.; supervision, H.X. and M.L.; project administration, H.X. and M.L. All authors have read and agreed to the published version of the manuscript.

Funding

This research was funded by the PhD Scientific Research and Innovation Foundation of Sanya Yazhou Bay Science and Technology City (Grant No. HSPHDSRF-2022-03-016).

Institutional Review Board Statement

Not applicable.

Informed Consent Statement

Not applicable.

Data Availability Statement

The data presented in this study are available upon request from the corresponding author. The data are not publicly available due to privacy.

Conflicts of Interest

The authors declare no conflicts of interest.

References

  1. Li, H.; Jiang, Z.; Li, Z.; Peng, Y.; Zhang, Q.; Xiao, X. The Interface Strengthening of Multi-Walled Carbon Nano-tubes/Polylactic Acid Composites via the In-Loop Hybrid Manufacturing Method. Polymers 2023, 15, 4426. [Google Scholar] [CrossRef]
  2. Pandeya, S.P.; Zou, S.; Roh, B.-M.; Xiao, X. Programmable Thermo-Responsive Self-Morphing Structures Design and Performance. Materials 2022, 15, 8775. [Google Scholar] [CrossRef]
  3. Fenton, N.; Wang, W. Risk and confidence analysis for fuzzy multicriteria decision making. Knowl.-Based Syst. 2006, 19, 430–437. [Google Scholar] [CrossRef]
  4. Zadeh, L.A. Fuzzy sets. Inform. Control 1965, 8, 338–353. [Google Scholar] [CrossRef]
  5. Cornells, C.; Deschrijver, G.; Kerre, E.E. Implication in intuitionistic fuzzy and interval-valued fuzzy set theory: Construction, classification, application. Int. J. Approx. Reason. 2004, 35, 55–95. [Google Scholar] [CrossRef]
  6. Mcculloch, J.; Wagner, C.; Aickelin, U. Extending Similarity Measures of Interval Type-2 Fuzzy Sets to General Type-2 Fuzzy Sets. In Proceedings of the 2013 IEEE International Conference on Fuzzy Systems (FUZZ-IEEE), Hyderabad, India, 7–10 July 2013. [Google Scholar]
  7. Vicenç, T. Hesitant Fuzzy Sets. Int. J. Intell. Syst. 2010, 25, 529–539. [Google Scholar]
  8. Yager, R.R.; Abbasov, A.M. Pythagorean Membership Grades, Complex Numbers, and Decision Making. Int. J. Intell. Syst. 2013, 28, 436–452. [Google Scholar] [CrossRef]
  9. Yager, R.R. Pythagorean Fuzzy Subsets. In Proceedings of the IFSA World Congress & NAFIPS Meeting, Edmonton, AB, Canada, 24–28 June 2013. [Google Scholar]
  10. Yager, R.R. Pythagorean Membership Grades in Multicriteria Decision Making. IEEE Trans. Fuzzy Syst. 2014, 22, 958–965. [Google Scholar] [CrossRef]
  11. Garg, H. Generalized Pythagorean Fuzzy Geometric Aggregation Operators Using Einstein T-Norm and T-Conorm for Multicriteria Decision-Making Process. Int. J. Intell. Syst. 2017, 32, 597–630. [Google Scholar] [CrossRef]
  12. Zhang, R.; Wang, J.; Zhu, X.; Xia, M.; Yu, M. Some Generalized Pythagorean Fuzzy Bonferroni Mean Aggregation Operators with Their Application to Multiattribute Group Decision-Making. Complexity 2017, 2017, 5937376. [Google Scholar] [CrossRef]
  13. Chen, T.Y. Remoteness Index-Based Pythagorean Fuzzy VIKOR Methods with a Generalized Distance Measure for Multiple Criteria Decision Analysis. Inf. Fusion 2018, 41, 129–150. [Google Scholar] [CrossRef]
  14. Yang, W.; Wang, C.; Liu, Y.; Sun, Y. Hesitant Pythagorean Fuzzy Interaction Aggregation Operators and Their Application in Multiple Attribute Decision-Making. Complex Intell. Syst. 2019, 5, 199–216. [Google Scholar] [CrossRef]
  15. Garg, H. Hesitant Pythagorean Fuzzy Maclaurin Symmetric Mean Operators and Its Applications to Multiattribute Decision-Making Process. Int. J. Intell. Syst. 2019, 34, 601–626. [Google Scholar] [CrossRef]
  16. Yu, P.L. A Class of Solutions for Group Decision Problems. Manag. Sci. 1973, 19, 936–946. [Google Scholar] [CrossRef]
  17. Hwang, C.L.; Yoon, K. Multiple Attribute Decision Making; Springer: Berlin/Heidelberg, Germany, 1981. [Google Scholar]
  18. Opricovic, S. Multicriteria Optimization of Civil Engineering Systems; Faculty of Civil Engineering: Belgrade, Serbia, 1998. [Google Scholar]
  19. Mareschal, B.; Brans, J.P.; Vincke, P. PROMETHEE: A New Family of Outranking Methods in Multicriteria Analysis; ULB Institutional Repository: Bruxelles, Belgium, 1984. [Google Scholar]
  20. Opricovic, S.; Tzeng, G.H. Extended VIKOR Method in Comparison with Outranking Methods. Eur. J. Oper. Res. 2007, 178, 514–529. [Google Scholar] [CrossRef]
  21. Mohanty, P.P.; Mahapatra, S.S. A Compromise Solution by VIKOR Method for Ergonomically Designed Product with Optimal Set of Design Characteristics. Procedia Mater. Sci. 2014, 6, 633–640. [Google Scholar] [CrossRef]
  22. Chauhan, A.; Vaish, R. Magnetic Material Selection Using Multiple Attribute Decision Making Approach. Mater. Des. 2012, 36, 1–5. [Google Scholar] [CrossRef]
  23. Yazdani, M.; Payam, A.F. A Comparative Study on Material Selection of Microelectromechanical Systems Electrostatic Actuators Using Ashby, VIKOR and TOPSIS. Mater. Des. 2015, 65, 328–334. [Google Scholar] [CrossRef]
  24. Bairagi, B.; Dey, B.; Sarkar, B.; Sanyal, S. Selection of Robot for Automated Foundry Operations Using Fuzzy Multi-Criteria Decision Making Approaches. Int. J. Manag. Sci. Eng. Manag. 2014, 9, 221–232. [Google Scholar] [CrossRef]
  25. Ghorabaee, K.M. Developing an MCDM Method for Robot Selection with Interval Type-2 Fuzzy Sets. Robot. Comput. Integr. Manuf. 2016, 37, 221–232. [Google Scholar] [CrossRef]
  26. Zhu, G.N.; Hu, J.; Qi, J.; Gu, C.C.; Peng, Y.H. An Integrated AHP and VIKOR for Design Concept Evaluation Based on Rough Number. Adv. Eng. Inform. 2015, 29, 408–418. [Google Scholar] [CrossRef]
  27. Azaryoon, A.; Hamidon, M.; Radwan, A. An Expert System Based on a Hybrid Multi-Criteria Decision Making Method for Selection of Non-Conventional Machining Processes. Appl. Mech. Mater. 2015, 735, 41–49. [Google Scholar] [CrossRef]
  28. Kaya, T.; Kahraman, C. Fuzzy Multiple Criteria Forestry Decision Making Based on an Integrated VIKOR and AHP Approach. Expert Syst. Appl. 2011, 38, 7326–7333. [Google Scholar] [CrossRef]
  29. Xu, H.; Ma, C.; Lian, J.; Xu, K.; Chaima, E. Urban Flooding Risk Assessment Based on an Integrated K-Means Cluster Algorithm and Improved Entropy Weight Method in the Region of Haikou, China. J. Hydrol. 2018, 563, 975–986. [Google Scholar] [CrossRef]
  30. Chen, Y.L.; Shen, S.L.; Zhou, A. Assessment of Red Tide Risk by Integrating CRITIC Weight Method, TOPSIS-Assets Method, and Monte Carlo Simulation. Environ. Pollut. 2022, 314, 120254. [Google Scholar] [CrossRef] [PubMed]
  31. Ghodusinejad, M.H.; Lavasani, Z.; Yousefi, H.; Lund, H.; Kaiser, M.J. A Combined Decision-Making Framework for Techno-Enviro-Economic Assessment of a Commercial CCHP System. Energy 2023, 276, 127609. [Google Scholar] [CrossRef]
  32. Gan, J. Discrete Hopfield Neural Network Approach for Crane Safety Evaluation. In Proceedings of the 2017 International Conference on Mechanical, System and Control Engineering (ICMSC), St. Petersburg, Russia, 19–21 May 2017. [Google Scholar]
  33. Nadjafi, M.; Farsi, M.A.; Zio, E.; Mousavi, A.K. Fault Trees Analysis Using Expert Opinion Based on Fuzzy-Bathtub Failure Rates. Qual. Reliab. Eng. Int. 2018, 34, 1142–1157. [Google Scholar] [CrossRef]
  34. Yang, L.; Rauzy, A. Epistemic Space of Degradation Processes. J. Appl. Non-Class. Log. 2020, 31, 1–25. [Google Scholar] [CrossRef]
  35. Zaitseva, E.; Levashenko, V.; Rabcan, J. A New Method for Analysis of Multi-State Systems Based on Multi-Valued Decision Diagram Under Epistemic Uncertainty. Reliab. Eng. Syst. Saf. 2023, 229, 108868. [Google Scholar] [CrossRef]
  36. Ren, Z.; Xu, Z.; Wang, H. Dual Hesitant Fuzzy VIKOR Method for Multi-Criteria Group Decision Making Based on Fuzzy Measure and New Comparison Method. Inf. Sci. 2017, 388–389, 1–16. [Google Scholar] [CrossRef]
  37. Kaya, A.; Bahan, V.; Ust, Y. Selection of Marine Type Air Compressor by Using Fuzzy VIKOR Methodology. Proc. Inst. Mech. Eng. Part M J. Eng. Marit. Environ. 2022, 236, 103–112. [Google Scholar] [CrossRef]
  38. Rezaei, J.; Wang, J.; Tavasszy, L. Linking Supplier Development to Supplier Segmentation Using Best Worst Method. Expert Syst. Appl. 2015, 42, 9152–9164. [Google Scholar] [CrossRef]
  39. Ploskas, N.; Papathanasiou, J. A Decision Support System for Multiple Criteria Alternative Ranking Using TOPSIS and VIKOR in Fuzzy and Nonfuzzy Environments. Fuzzy Sets Syst. 2019, 377, 1–30. [Google Scholar] [CrossRef]
  40. GB/T 6067.1-2010; Safety Rules for Lifting Appliances: Part 1: General. Standardization Administration of the People’s Republic of China: Beijing, China, 2010.
  41. GB/T 3811-2008; Design Rules for Cranes. Standardization Administration of the People’s Republic of China: Beijing, China, 2008.
  42. GB/T 15361-2009; Quayside Container Crane. Standardization Administration of the People’s Republic of China: Beijing, China, 2009.
  43. JT/T 79-2008; Inspection and Test Standards for Port Container Hoist Machines. Ministry of Transport of the People’s Republic of China: Beijing, China, 2008.
Figure 1. Quayside Container Crane Safety Evaluation Index System. The figure was created using Microsoft Visio 2016.
Applsci 14 01312 g001
Figure 2. Stiffness testing locations. The figure was created using AutoCAD 2021.
Applsci 14 01312 g002
Table 1. Primary performance and technical specifications of the quayside container crane under evaluation.
Rated Lifting CapacityRigging65tHoisting SpeedFull Load70m/min
Hook75No Load180m/min
Outreach-65mTrolley Travel Speed-240m/min
Backreach-16mGantry Travel Speed-45m/min
Gauge-30mGantry WheelsTotal/Drive40/20-
Lifting HeightAbove Track48mHoisting Motor2 × 450 KW750/1929rpm
Below Track17mTrolley Motor250 KW1150rpm
Main Beam Luffing Time0~80°<=6minGantry Motor20 × 18.5 KW1280rpm
Overall Working Class of the MachineU8-Q3-A8-Luffing Motor315 KW1500rpm
Table 2. Safety evaluation indicator level division boundaries for quayside container crane equipment.
A 1 A 2
L 1 0.98 , 0.98 , 0.98 , 0.05 , 0.05 , 0.05 0.98 , 0.98 , 0.98 , 0.05 , 0.05 , 0.05
L 2 0.6 , 0.6 , 0.6 , 0.55 , 0.55 , 0.55 0.8 , 0.8 , 0.8 , 0.35 , 0.35 , 0.35
L 3 0.4 , 0.4 , 0.4 , 0.75 , 0.75 , 0.75 0.6 , 0.6 , 0.6 , 0.55 , 0.55 , 0.55
L 4 0.25 , 0.25 , 0.25 , 0.85 , 0.85 , 0.85 0.4 , 0.4 , 0.4 , 0.75 , 0.75 , 0.75
L 5 0.15 , 0.15 , 0.15 , 0.9 , 0.9 , 0.9 0.2 , 0.2 , 0.2 , 0.88 , 0.88 , 0.88
L 6 0.05 , 0.05 , 0.05 , 0.98 , 0.98 , 0.98 0.05 , 0.05 , 0.05 , 0.98 , 0.98 , 0.98
A 3 A 4
L 1 0.98 , 0.98 , 0.98 , 0.05 , 0.05 , 0.05 0.98 , 0.98 , 0.98 , 0.05 , 0.05 , 0.05
L 2 0.9 , 0.9 , 0.9 , 0.15 , 0.15 , 0.15 0.8 , 0.8 , 0.8 , 0.35 , 0.35 , 0.35
L 3 0.8 , 0.8 , 0.8 , 0.35 , 0.35 , 0.35 0.6 , 0.6 , 0.6 , 0.55 , 0.55 , 0.55
L 4 0.7 , 0.7 , 0.7 , 0.45 , 0.45 , 0.45 0.4 , 0.4 , 0.4 , 0.75 , 0.75 , 0.75
L 5 0.5 , 0.5 , 0.5 , 0.65 , 0.65 , 0.65 0.2 , 0.2 , 0.2 , 0.88 , 0.88 , 0.88
L 6 0.05 , 0.05 , 0.05 , 0.98 , 0.98 , 0.98 0.05 , 0.05 , 0.05 , 0.98 , 0.98 , 0.98
A 5
L 1 0.98 , 0.98 , 0.98 , 0.05 , 0.05 , 0.05
L 2 0.8 , 0.8 , 0.8 , 0.35 , 0.35 , 0.35
L 3 0.6 , 0.6 , 0.6 , 0.55 , 0.55 , 0.55
L 4 0.4 , 0.4 , 0.4 , 0.75 , 0.75 , 0.75
L 5 0.2 , 0.2 , 0.2 , 0.88 , 0.88 , 0.88
L 6 0.05 , 0.05 , 0.05 , 0.98 , 0.98 , 0.98
B 1 B 4 C 1 C 9
L 1 0.98 , 0.98 , 0.98 , 0.05 , 0.05 , 0.05 0.98 , 0.98 , 0.98 , 0.05 , 0.05 , 0.05
L 2 0.8 , 0.8 , 0.8 , 0.35 , 0.35 , 0.35 0.8 , 0.8 , 0.8 , 0.35 , 0.35 , 0.35
L 3 0.6 , 0.6 , 0.6 , 0.55 , 0.55 , 0.55 0.6 , 0.6 , 0.6 , 0.55 , 0.55 , 0.55
L 4 0.4 , 0.4 , 0.4 , 0.75 , 0.75 , 0.75 0.4 , 0.4 , 0.4 , 0.75 , 0.75 , 0.75
L 5 0.2 , 0.2 , 0.2 , 0.88 , 0.88 , 0.88 0.2 , 0.2 , 0.2 , 0.88 , 0.88 , 0.88
L 6 0.05 , 0.05 , 0.05 , 0.98 , 0.98 , 0.98 0.05 , 0.05 , 0.05 , 0.98 , 0.98 , 0.98
D 1 D 5 E 1 E 5
L 1 0.98 , 0.98 , 0.98 , 0.05 , 0.05 , 0.05 0.98 , 0.98 , 0.98 , 0.05 , 0.05 , 0.05
L 2 0.8 , 0.8 , 0.8 , 0.35 , 0.35 , 0.35 0.8 , 0.8 , 0.8 , 0.35 , 0.35 , 0.35
L 3 0.6 , 0.6 , 0.6 , 0.55 , 0.55 , 0.55 0.6 , 0.6 , 0.6 , 0.55 , 0.55 , 0.55
L 4 0.4 , 0.4 , 0.4 , 0.75 , 0.75 , 0.75 0.4 , 0.4 , 0.4 , 0.75 , 0.75 , 0.75
L 5 0.2 , 0.2 , 0.2 , 0.88 , 0.88 , 0.88 0.2 , 0.2 , 0.2 , 0.88 , 0.88 , 0.88
L 6 0.05 , 0.05 , 0.05 , 0.98 , 0.98 , 0.98 0.05 , 0.05 , 0.05 , 0.98 , 0.98 , 0.98
Table 3. Stress test values for critical parts of the quayside container crane equipment under evaluation.
Test AreaFront Main BeamTruss FrameGantry LegRear Tie RodCrossbeam
Test Value/MPa110.7107.388.5118.450.3
Table 4. Stiffness test values for critical parts of the quayside container crane equipment under evaluation.
Test AreaMeasurement Point AMeasurement Point BMeasurement Point CMeasurement Point D
No-Load Test Value/m35.200735.197735.207535.2067
Rated Load Test Value/m35.030435.142035.146135.1978
Deflection Amount/m−0.1703−0.0557−0.0614−0.0089
Table 5. Local waviness test values for critical parts of the quayside container crane equipment under evaluation.
Test AreaMain BeamGantry LegTruss FrameTie RodCrossbeam
Deformation Amount/mm-4.22.7-1.5
Table 6. Crack detection for critical parts of the quayside container crane equipment under evaluation.
Crack LocationRight Main BeamRight Main BeamRight Main BeamConnection Point of Left Gantry Leg and Lower Crossbeam
Crack Length/mm22251817
Table 7. Corrosion conditions of critical parts of the quayside container crane equipment under evaluation.
Test AreaMain BeamGantry LegTruss FrameTie RodCrossbeam
Uncorroded Area/mm14.8024.7430.1211.9715.38
Corroded Area/mm14.1714.6529.0911.8915.27
Loss Ratio−4.26%−40.78%−3.42%−0.67%−0.72%
Table 8. Expert evaluation results.
Evaluation CriteriaEvaluation Results
A 1 0.6 , 0.7 , 0.7 , 0.4 , 0.4 , 0.6
A 2 0.7 , 0.8 , 0.8 , 0.2 , 0.4 , 0.4
A 3 0.7 , 0.7 , 0.8 , 0.4 , 0.4 , 0.4
A 4 0.8 , 0.8 , 0.9 , 0.2 , 0.3 , 0.3
A 5 0.5 , 0.5 , 0.5 , 0.4 , 0.6 , 0.7
B 1 0.7 , 0.7 , 0.8 , 0.4 , 0.4 , 0.4
B 2 0.7 , 0.8 , 0.8 , 0.2 , 0.4 , 0.4
B 3 0.6 , 0.8 , 0.8 , 0.4 , 0.4 , 0.5
B 4 0.5 , 0.7 , 0.8 , 0.4 , 0.4 , 0.5
C 1 0.8 , 0.8 , 0.8 , 0.3 , 0.4 , 0.4
C 2 0.6 , 0.8 , 0.8 , 0.3 , 0.4 , 0.5
C 3 0.7 , 0.8 , 0.8 , 0.2 , 0.2 , 0.4
C 4 0.5 , 0.7 , 0.7 , 0.2 , 0.4 , 0.6
C 5 0.6 , 0.6 , 0.6 , 0.3 , 0.4 , 0.4
C 6 0.5 , 0.7 , 0.8 , 0.4 , 0.4 , 0.5
C 7 0.3 , 0.4 , 0.5 , 0.4 , 0.7 , 0.7
C 8 0.3 , 0.3 , 0.3 , 0.6 , 0.7 , 0.8
C 9 0.5 , 0.5 , 0.6 , 0.4 , 0.7 , 0.7
D 1 0.7 , 0.8 , 0.8 , 0.2 , 0.2 , 0.4
D 2 0.5 , 0.5 , 0.6 , 0.4 , 0.7 , 0.7
D 3 0.6 , 0.8 , 0.8 , 0.3 , 0.4 , 0.5
D 4 0.4 , 0.4 , 0.4 , 0.5 , 0.5 , 0.6
D 5 0.5 , 0.7 , 0.7 , 0.2 , 0.4 , 0.6
E 1 0.3 , 0.4 , 0.5 , 0.7 , 0.8 , 0.8
E 2 0.6 , 0.6 , 0.6 , 0.3 , 0.4 , 0.4
E 3 0.8 , 0.8 , 0.9 , 0.1 , 0.2 , 0.3
E 4 0.8 , 0.8 , 0.8 , 0.3 , 0.4 , 0.4
E 5 0.6 , 0.8 , 0.8 , 0.4 , 0.4 , 0.5
Table 9. Comparison table for the best indicator.
Indicator Strength   A 1 Stiffness   A 2 Crack   A 3 Deformation   A 4 Corrosion   A 5
Degree of Preference p B j 12143
Table 10. Comparison table for the worst indicator.
Indicator Strength   A 1 Stiffness   A 2 Crack   A 3 Deformation   A 4 Corrosion   A 5
Degree of Preference p j W 53412
Table 11. Results of weight calculation.
Evaluation CriteriaEvaluation Results
W 1 0.3243 , 0.1891 , 0.2838 , 0.0812 , 0.1216
W 2 0.4846 , 0.0924 , 0.2538 , 0.1692
W 3 0.1017 , 0.2679 , 0.0462 , 0.0762 , 0.0762 , 0.1016 , 0.0762 , 0.1016 , 0.1524
W 4 0.1571 , 0.4143 , 0.1571 , 0.2000 , 0.0715
W 5 0.3698 , 0.2055 , 0.1370 , 0.2055 , 0.0822
Table 12. Calculation results of weights for each evaluation criterion.
Evaluation CriteriaEvaluation ResultsEvaluation CriteriaEvaluation Results
A 1 0.1254 C 6 0.0068
A 2 0.0731 C 7 0.0052
A 3 0.1097 C 8 0.0068
A 4 0.0314 C 9 0.0102
A 5 0.0470 D 1 0.0343
B 1 0.0529 D 2 0.0905
B 2 0.0101 D 3 0.0343
B 3 0.0277 D 4 0.0437
B 4 0.0185 D 5 0.0156
C 1 0.0068 E 1 0.0808
C 2 0.0180 E 2 0.0449
C 3 0.0031 E 3 0.0299
C 4 0.0052 E 4 0.0449
C 5 0.0052 E 5 0.0180
Table 13. Calculation results of k ^ i + and k ^ i .
k ^ i + k ^ i
Column 1 0.98 , 0.98 , 0.98 , 0.05 , 0.05 , 0.05 0.05 , 0.05 , 0.05 , 0.98 , 0.98 , 0.98
Column 2 0.98 , 0.98 , 0.98 , 0.05 , 0.05 , 0.05 0.05 , 0.05 , 0.05 , 0.98 , 0.98 , 0.98
Column 3 0.98 , 0.98 , 0.98 , 0.05 , 0.05 , 0.05 0.05 , 0.05 , 0.05 , 0.98 , 0.98 , 0.98
Column 4 0.98 , 0.98 , 0.98 , 0.05 , 0.05 , 0.05 0.05 , 0.05 , 0.05 , 0.98 , 0.98 , 0.98
Column 5 0.98 , 0.98 , 0.98 , 0.05 , 0.05 , 0.05 0.05 , 0.05 , 0.05 , 0.98 , 0.98 , 0.98
Table 14. Pythagorean hesitant fuzzy VIKOR calculation results.
R i S i Q i
L 1 000
L 2 0.24460.05980.1522
L 3 0.47120.08900.2801
L 4 0.65800.10140.3797
L 5 0.85450.11430.4844
L 6 10.12540.5627
L x 0.38640.05830.2224
Disclaimer/Publisher’s Note: The statements, opinions and data contained in all publications are solely those of the individual author(s) and contributor(s) and not of MDPI and/or the editor(s). MDPI and/or the editor(s) disclaim responsibility for any injury to people or property resulting from any ideas, methods, instructions or products referred to in the content.

