Article

Improvements in Rock Mass Description for Stope Design by Geophysical and Geochemical Methods

Department of Civil Engineering, School of Engineering, Aalto University, 02150 Espoo, Finland
*
Author to whom correspondence should be addressed.
Appl. Sci. 2024, 14(3), 957; https://doi.org/10.3390/app14030957
Submission received: 23 November 2023 / Revised: 8 January 2024 / Accepted: 17 January 2024 / Published: 23 January 2024

Abstract

:
Stope design is an important part of mine planning, and it aims to balance ore recovery, ore dilution, and production costs without compromising the safety aspects. This paper summarizes the main results from the research, which aims to introduce new techniques to describe the ore body and surrounding rock mass at the tunnel face prior to stope excavation. The research comprises a literature review and a survey among mining professionals to assess current stope design practices. The study identifies geotechnical data, software improvements, and integration of design into mine planning as the most critical areas for improvement. The empirical part of the study proposes new techniques for fast data acquisition. The laser-induced breakdown spectrometry (LIBS) technique is developed for measurements at the tunnel face and from core boxes to provide mineralogical and geometallurgical data. Ground-penetrating radar (GPR) studies are conducted to improve discontinuity characterization, and rapid photogrammetric methods are proposed for efficient tunnel geometry characterization. The techniques discussed in this paper already have many industrial applications. This study reveals their potential to be adopted and further developed to serve ore and rock mass characterization for stope design.

1. Introduction

Selective mining of ore in underground environments is achieved by blasting, which creates open spaces known as stopes. Rock joints and other discontinuities in the rock mass can cause instability and collapses in stope walls and roofs, leading to ore dilution and safety concerns. Stope design, therefore, is a critical component of underground mining that aims to optimize ore recovery, minimize ore dilution and production costs, and maximize profits while ensuring safety. Key design parameters in stope design include ore geometry, rock mechanics conditions, mine infrastructure, and available equipment. Large stopes lower the unit costs but may lead to unstable stopes. Successful stope design requires a sound understanding of ore geology and rock mass conditions [1]. Real-time acquisition of mineralogical data of the ore improves grade control and helps to optimize ore processing.
Current methods in stope design, although effective to an extent, often fall short in real-time, accurate characterization of the ore body and the surrounding rock mass. This gap leads to reactive rather than proactive decision-making, where changes in stope design are often made post factum, resulting in increased costs and safety risks.
This research aims to improve the stope design process by integrating advanced geophysical and geochemical methods, thereby offering a proactive approach to mining planning. The specific objectives of this study are not only aimed at specifying mineralogy and estimating ore content but also at mapping the structural features of the rock mass, including its position, direction, and continuity. The novelty of this study lies in its comprehensive, real-time acquisition of mineralogical data at the tunnel face using laser–spectral measurements. This approach can offer immediate, on-site analysis of ore grade and mineral composition, thereby facilitating more accurate and efficient ore recovery. In addition, understanding rock mass conditions using innovative, non-destructive geophysical methods, coupled with laboratory analyses and photogrammetric rock mass characterization, is investigated. This work represents a significant departure from conventional stope design methodologies, marking a substantial advancement in the field. The study began with an extensive literature review to identify current challenges in stope design and to pinpoint areas where existing practices fall short. This was complemented by a survey directed towards mining professionals, ensuring that the research addresses practical, industry-specific challenges.
This multifaceted approach, encompassing both theoretical and practical aspects, aims to develop a data-driven methodology for stope design. The integration of detailed mineralogical information with rock mass characteristics is set to provide a more robust and accurate framework for stope design, addressing the critical challenge of maintaining stope stability while optimizing ore recovery.

2. Recent Research in Stope Design Methods

The mining industry needs to adopt more sustainable methods to reduce the impact of mining activity on the surface. Stoping-based methods are a potential solution to reduce unwanted surface effects. However, these methods still have risks related to the local instability of the rock mass, making site-specific rock mass characterization, evaluation of the in situ stress and induced stresses, and stope design essential.
Mine design schemes based on experience and intuition have been used since the 1970s and are still used today for detailed planning. Empirical methods, such as the rock mass rating (RMR and MRMR) system, Q-system, geological strength index (GSI), Laubscher block caving rules, hard rock pillar design chart, and tributary area method, are commonly used [2]. A comprehensive overview of these methods can be found in [3]. A recent software development that enables the creation of regional and mine-specific case studies is presented in [4].
With advancements in computing power, numerical modelling methods may take local rock-type domains and rock mass features such as fractures or brittle failure zones into account more accurately when conducting numerical model-based stope design [5]. Both continuum and discrete numerical methods are used to simulate jointed rock masses in the stope scale, mainly to optimize stope boundaries, blasting design, the production schedule, and development activities [6]. Software for stope design and mine planning is discussed in [7]. Recent research to improve stope design is summarized in Table 1.

3. Industry Survey on Stope Design

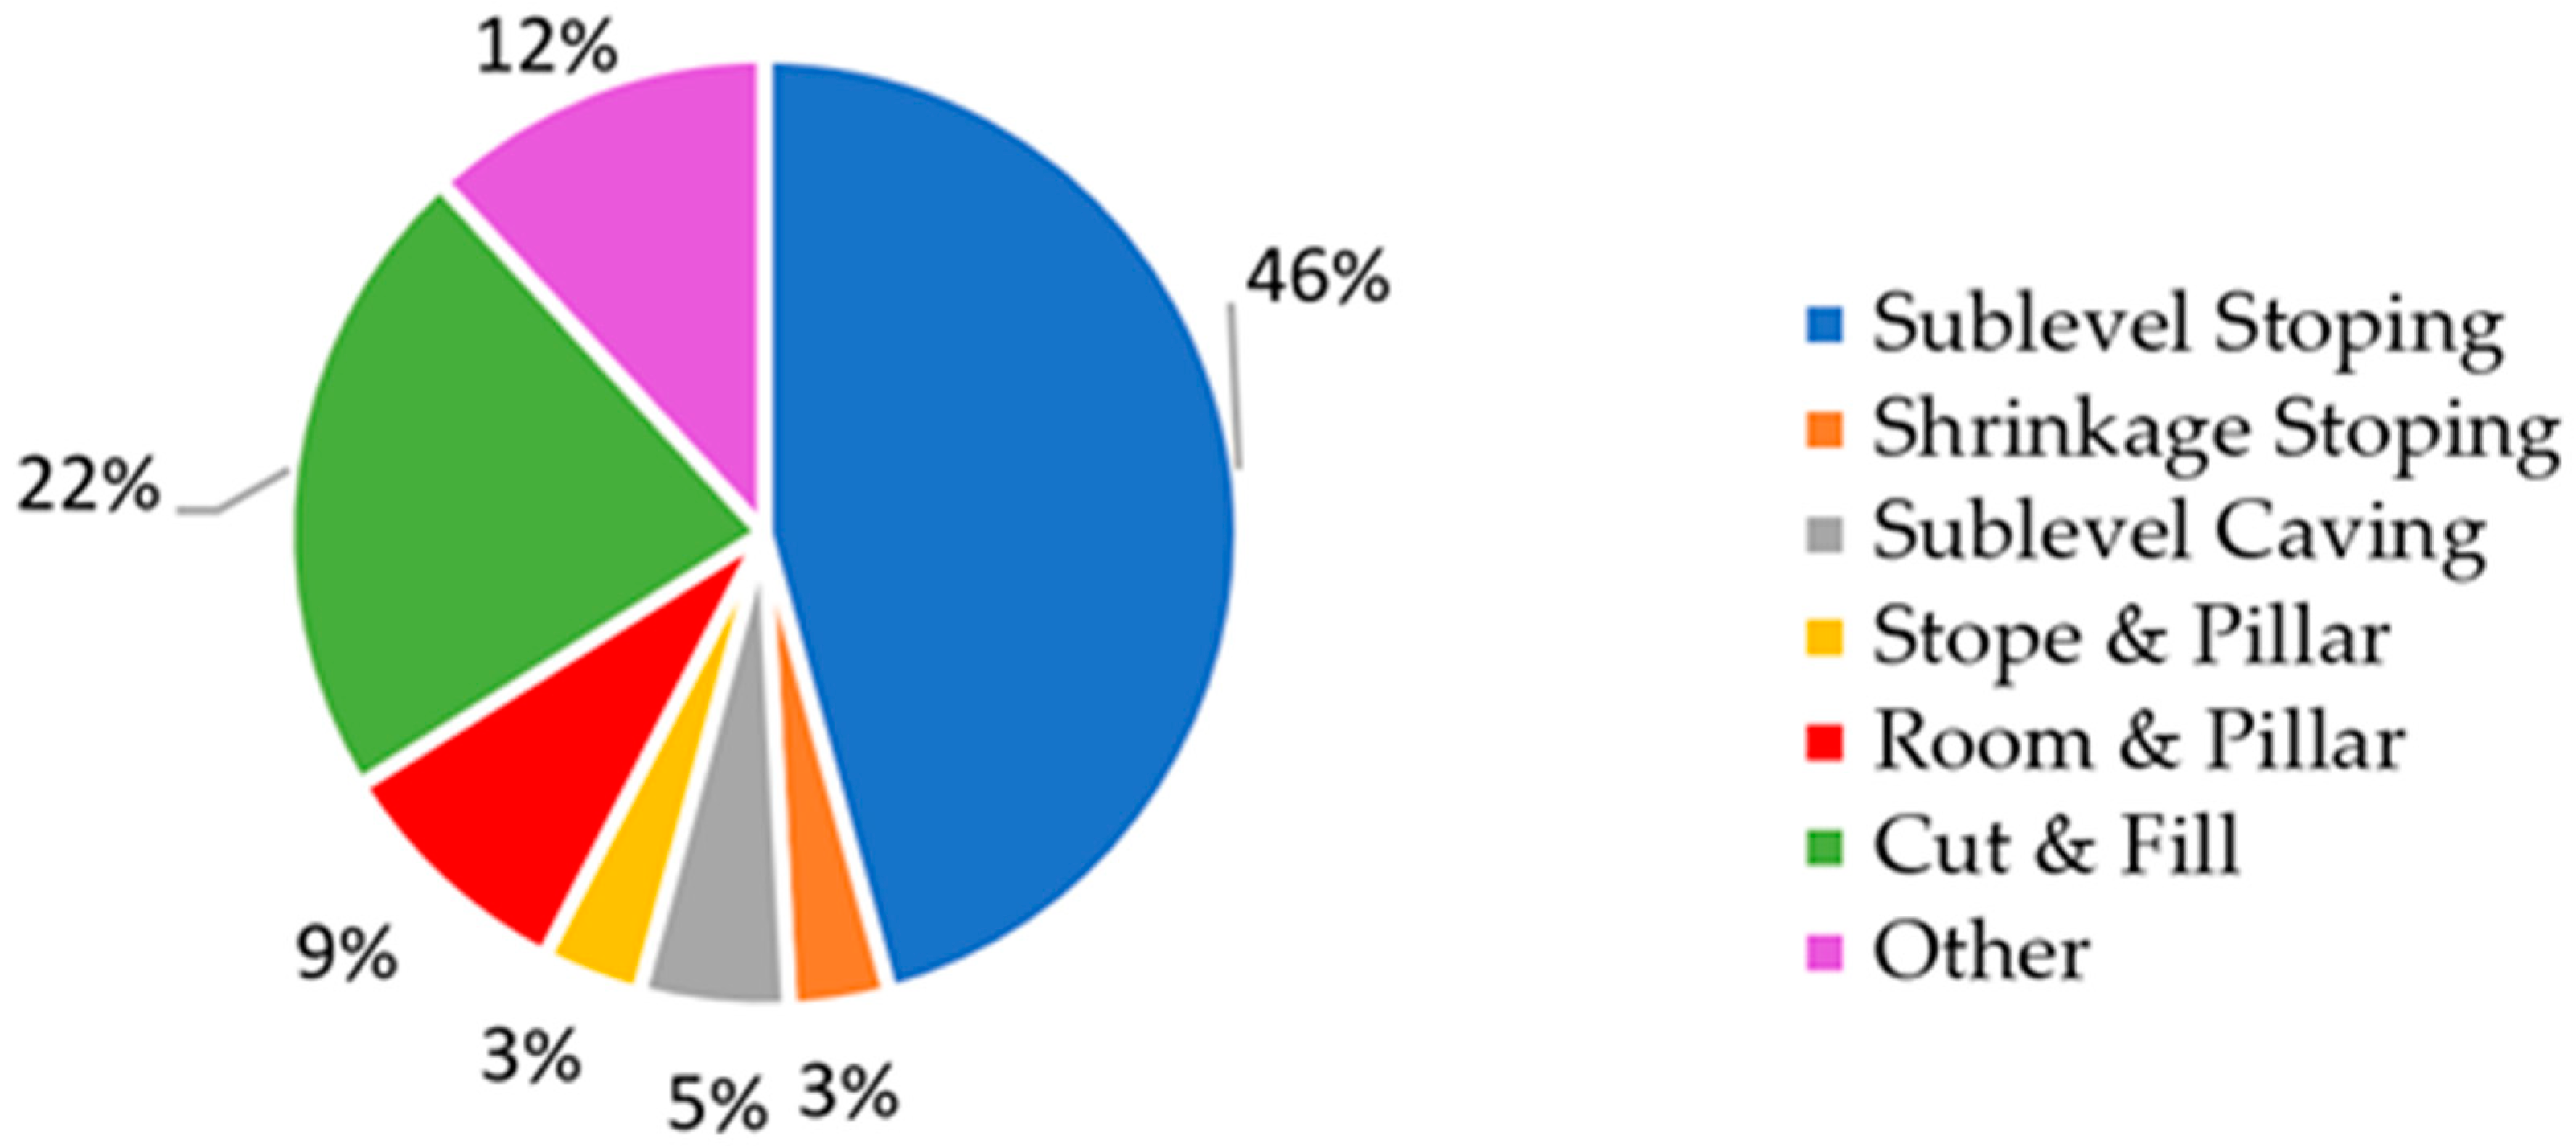
3.1. Survey Methodology

A survey was conducted among mining industry professionals to analyze stope design practices, identify the degree of implementation of new design tools, and characterize the most pressing challenges in stope design. The survey included 19 questions with multiple-choice and free-answer options. The following topics were asked of the respondents: (1) mining method employed and changes in the mining method selection, (2) stope design methods applied, (3) timing of stope design and allocated resources, (4) parameters affecting stope design, (5) stope stability monitoring, (6) the most urgent improvements for stope design, (7) utilization of rock mass characterization, and (8) willingness to improve the stope design process.
Altogether, 36 responses were received from 20 countries across different regions, including Africa (4 responses), Asia (7), Australia (4), Europe (10), North America (2), South America (5), and other regions (4).

3.2. Survey Results and Discussion

The survey began by inquiring about the mining method employed, as shown in Figure 1. The results indicate that sublevel stoping was the most used method (46%), with cut and fill as the second most popular method (22%) followed by the room-and-pillar method (9%).
Additionally, respondents were asked whether their currently applied mining method had been used since the start of the mining operation or whether changes had been made due to economic, geological, technical, or geotechnical factors. About 69% of respondents reported changes.
Regarding stope design methods, the survey assessed which methods were most frequently utilized. Personal expertise (38%) and numerical methods (37%) were found to be more popular than empirical methods (25%).
Personal expertise is employed by stope design professionals, and it is typically used to assess the size and geometry of the stope. Professionals involved in stope design encompass a diverse range of mining specialists. This group includes mine planners, drill and blast engineers, geologists, and experts in geotechnical and rock mechanics. These experts often depend on their individual experiences in particular geological contexts, an approach that can be considered to be empirically driven and based on personal expertise. Although frequently used, personal expertise is not a scientific or standardized stope design method.
The primary use of empirical methods was predominantly focused on utilizing Mathew’s stability graph (28%) and its modified version (48%), along with other techniques, such as the rock mass rating (RMR) (24%). A variety of computational tools for stope design are available and were applied in 37% of the studied mines. Commonly employed software comprised Maptek Vulcan, Surpac, Micromine, Deswik (Microstation), Map3D, Gantt Scheduler, Auto Stope Designer, and Stope Optimizer, along with Rocscience tools (including Slide, Phase2 and RS2, Examine, DIPS, Unwedge, and CPillar) and Recursos Mineros.
When asked about the timing of stope design, 45% of respondents reported that they design stopes during mine planning before excavation, whereas 34% reported that they design stopes during production. An iterative approach with multiple stages and feedback loops accounted for 21% of responses. More than half (52%) of respondents stated that stope design takes less than a week, whereas some reported that they design stopes in minutes and others reported taking several weeks. Stope size and geological complexity were identified as key factors affecting the time needed for stope design.
The average number of people involved in the stope design process was 3, with some reporting as few as 1 person and a maximum of 15. The number of people involved varied based on how much previous planning work was included in the stope design process.
Respondents ranked cutoff grade and dilution as the key parameters affecting stope design. Development costs, equipment size, deposit recovery, and stope stability were also identified as important factors, along with productivity, ventilation, mining cost, sequencing, drilling and blasting, flexibility in mine planning, rock mass, labor efficiency, the selective mining unit (SMU), and safety.
Almost all respondents (97%) reported that they monitor stope stability, with cavity monitoring systems (CMS) being the most used method (77%). Other methods included planned and mucked ton comparison, visual inspections, seismic controls, borehole extensometers, and laser scanning with point cloud data.
The most urgent improvements for stope design included additional geotechnical data (20%), improvements in software (18%), and integration into general mine planning (17%). Respondents also suggested improvements in speed, automation, backfill predictability, implementation of more reliable grade data, a variable cutoff, and reliable performance indication for dilution cable bolt utilization.
Rock mass investigations were reported to be utilized by 45% of respondents, with most using geomechanical methods (73%) and some using geophysical (14%) and geochemical (13%) investigations. Commonly used geomechanical evaluation methods included RQD, RMR, MRMR, the Q-system, the LOM stress model, deformation monitoring, core logging, and ELOS charts. Geophysical methods included optical and acoustical televiewer and gravimetric testing. Geochemical methods mostly used atomic absorption spectroscopy and fire assay.
More than half of the respondents expressed a willingness to implement novel methods in rock mass characterization and change the stope design process. However, the availability of additional data from the site within a reasonable timeframe was identified as a key issue for the use of new technology. More than 70% of respondents stated that additional data available within three days would satisfy their needs, but some were willing to wait longer if the data added substantial value to the stope design process. Machine and deep learning approaches were suggested as potential solutions to meet these requirements due to their speed, automation, and data utilization capabilities.

4. Laser-Induced Breakdown Spectrometry (LIBS) for Geochemical and Geometallurgical Characterization

Laser-induced breakdown spectrometry (LIBS) is a flexible method for studying rock composition [24,25]. In this process, a laser pulse is used to bombard the material being studied, which ablates a small amount of the material and turns it into a plasma emitting light at wavelengths characteristic of the material’s composition. Some of the laser pulse’s energy is transformed from electromagnetic energy (light from the laser source) to mechanical energy, creating a distinct sound [26]. LIBS essentially provides information on the chemistry at the laser-excited target point. As rocks often contain more than one mineral, methods such as multiparameter correlation statistics or machine learning algorithms may be necessary to quantitatively estimate mineral contents [27]. Recent studies have shown that the laser ablation sound energy is correlated with the Vickers hardness of minerals, indicating that LIBS sound signals could be used to estimate mechanical properties of a rock mass [28].

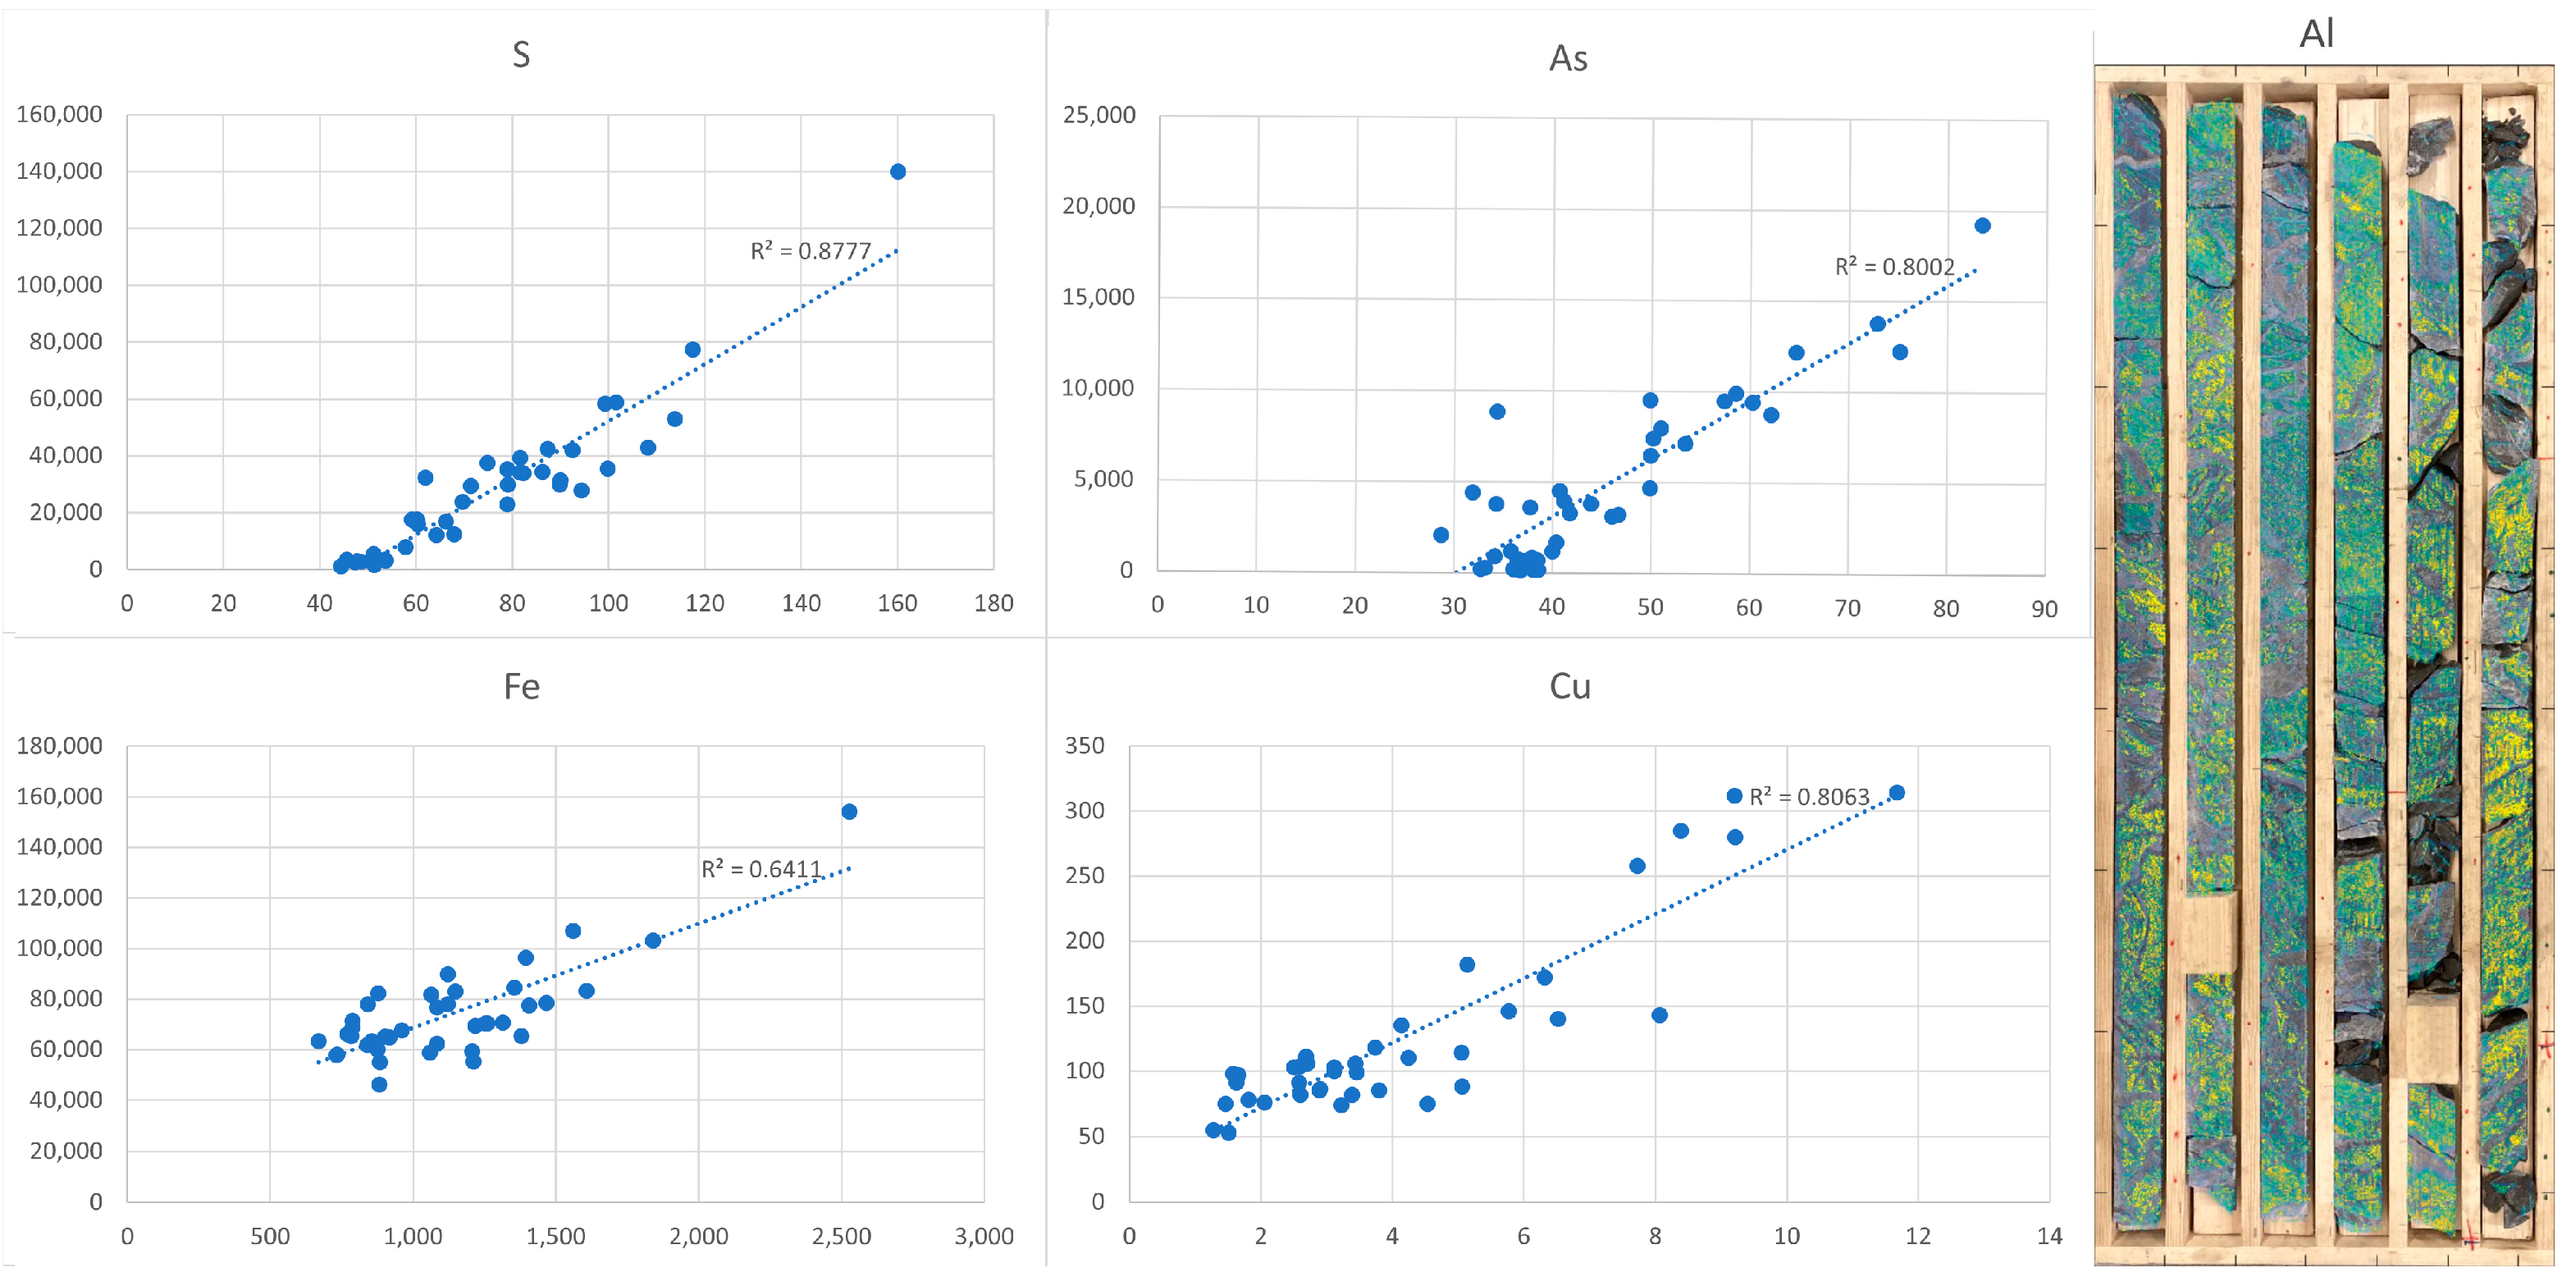
4.1. LIBS Methodology
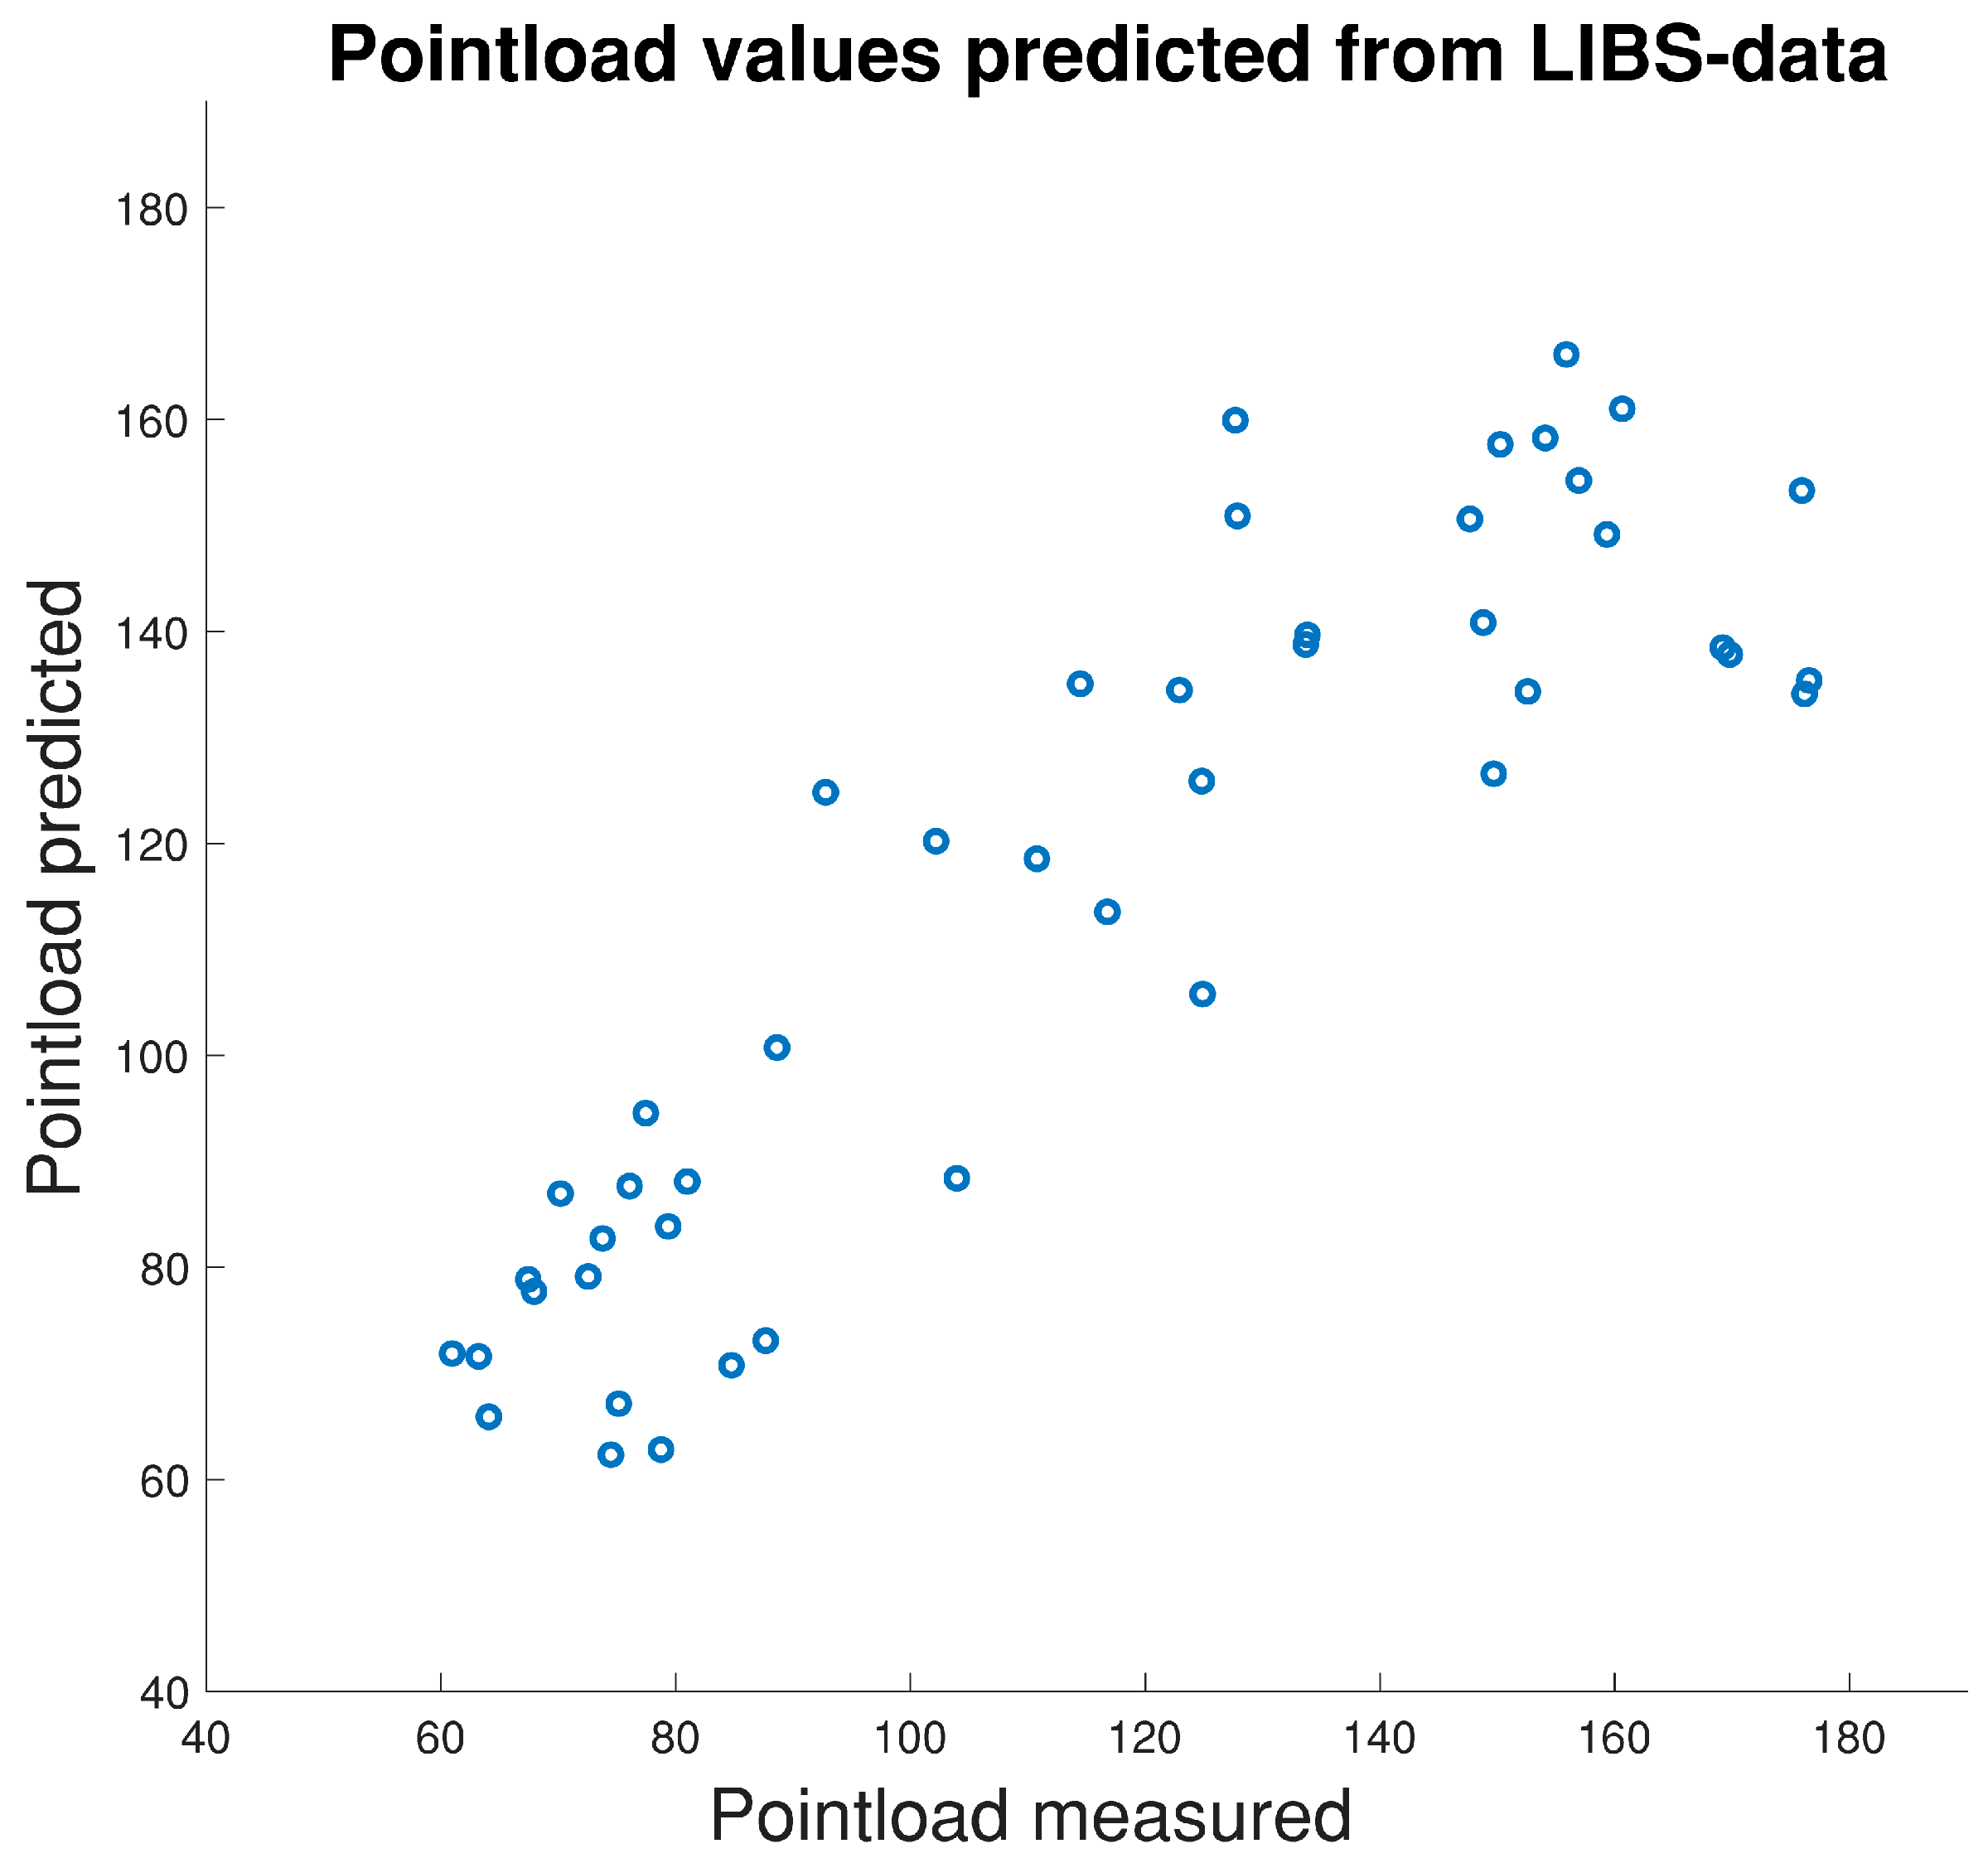
In our research, LIBS was used to assess rock composition and mineral content, as well as to evaluate geotechnical and geometallurgical properties. To study this, scanning LIBS measurements were taken both at a tunnel face and from drill cores (Figure 2 and Figure 3, respectively) of an active mine with prototype equipment, and methods were developed to estimate mineralogy and other geometallurgical properties from high-resolution LIBS images. Our investigations to calibrate LIBS data for rapid elemental analysis of pellet data and drill core samples are reported in [29]. A prototype stand-off LIBS device was developed for mine wall imaging along with the experimental results [30].

4.2. Results

The preliminary analysis demonstrated the potential value of LIBS remote scanning analysis for delineating ore and geochemical alterations while highlighting the challenges encountered in mining conditions, such as accumulated dirt, dust, and moisture complicating the interpretation of the LIBS signals.
Comminution tests were conducted on a gold deposit to investigate the relationship between geometallurgical properties, crushability, and grindability. More detailed information on the comminution study is reported in [31]. The point load test was found to be a useful tool for determining ore hardness, in contrast to the more complex bond ball mill test. To further explore this relationship, a machine learning model was trained using data from LIBS and the point load test. The results were compared and demonstrated a strong correlation between the point load test and LIBS data, as depicted in Figure 4, validating that the LIBS signal can be used for geometallurgical characterization of rock mass.

5. Ground-Penetrating Radar (GPR) for Representation of Fracture Surface Geometry
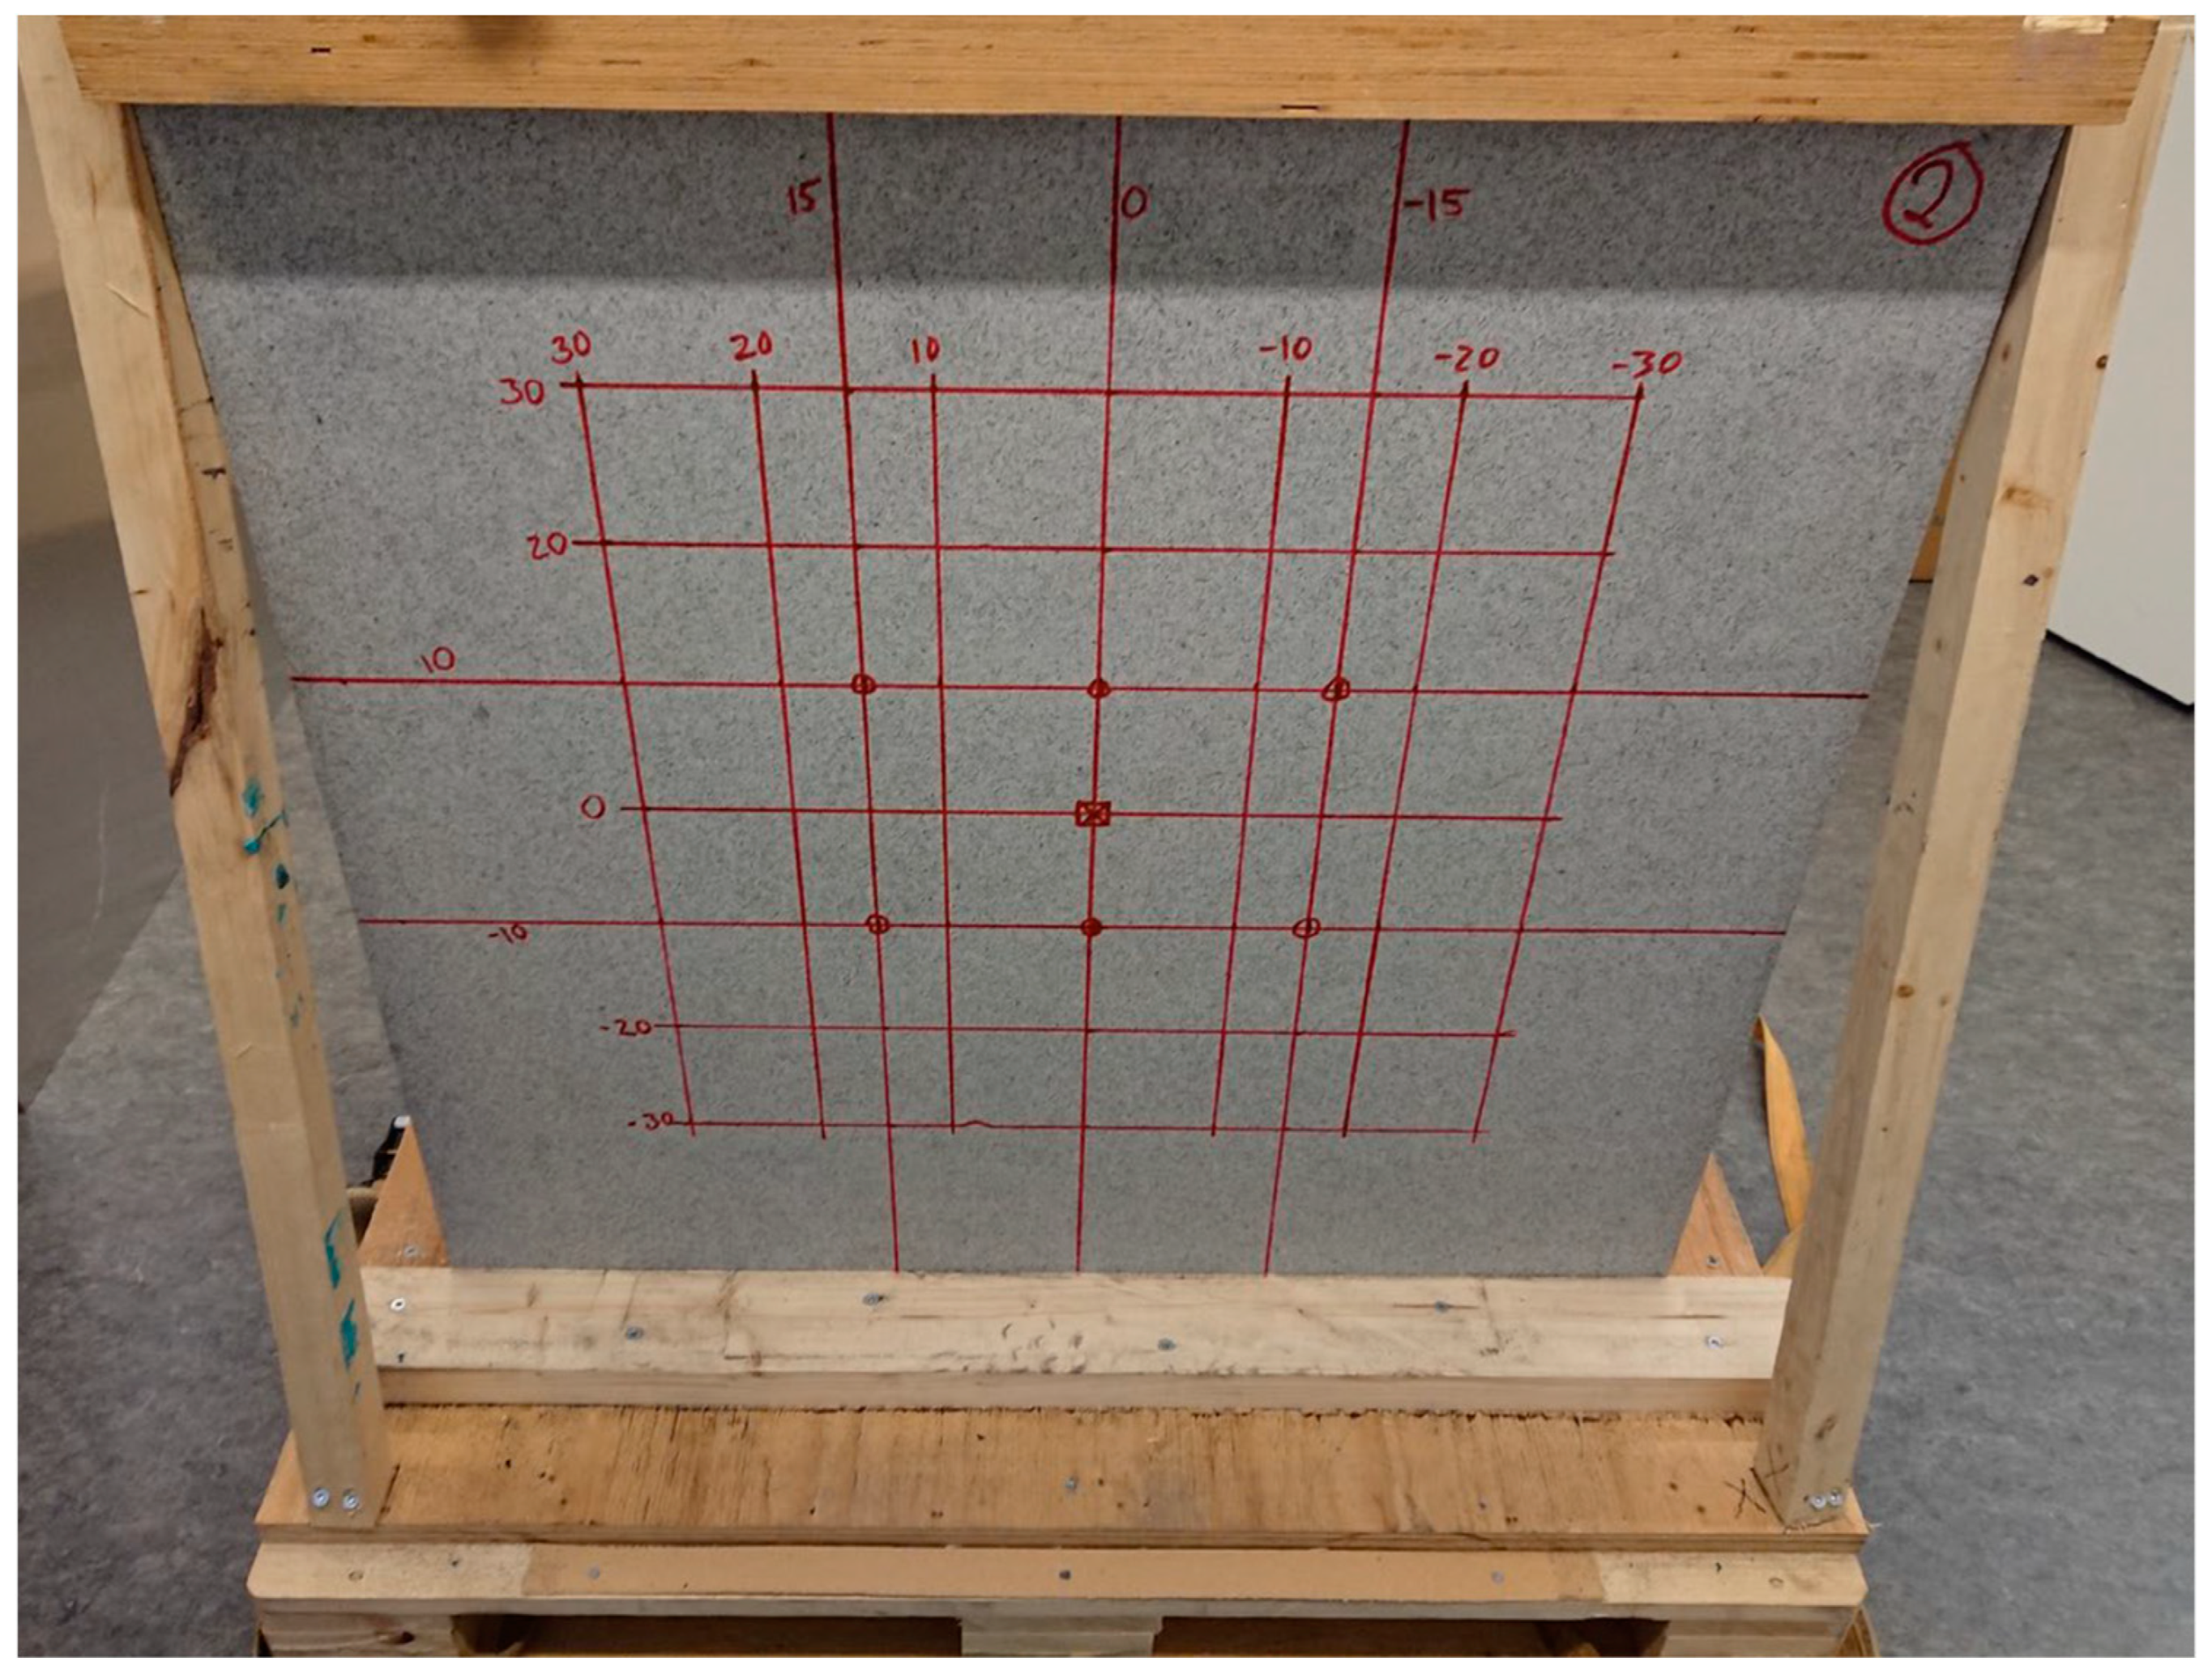
Stoping in mining operations usually requires prior exploration drilling from the production tunnels. Exploration drilling typically produces good-quality holes that are also suitable for geophysical measurements. Traditionally, the suite of downhole geophysical methods has been limited to properties such as density, magnetic susceptibility, and resistivity, with the addition of downhole imaging methods. In this project, focus was given to downhole ground-penetrating radar (GPR), which has so far rarely been used in mining despite being widely utilized in subsurface imaging. The goal was to combine GPR with other methods in order to determine the location, size, and orientation of geological features such as major fractures.

5.1. Methodology

GPR is a non-destructive electromagnetic method that is widely used in civil engineering [32,33,34,35,36] and exploration [37]. In mining, the application of GPR has mainly been limited to hazard detection [38,39,40,41] and structural mapping [42,43,44]. Reflections of the GPR signal from the target can provide information on rock mass integrity and geological and geometric features such as fractures, shear zones, voids, and lithological contacts. Analysis of the frequency content of a reflected GPR signal has successfully been used to determine the level of excavation damage [45].
As a baseline for the experimental work, a 100 cm × 90 cm × 30 cm slab was sawcut from an intact block of Kuru grey granite (Figure 5). Single-point GPR measurements were carried out on both surfaces of a 60 cm × 60 cm grid in order to study the propagation of the GPR signal in the rock mass [46]. A total of 63 points were measured on each side of the slab, with 250 scans per point and using a GPR antenna with a central frequency of 1600 MHz. Relative dielectric permittivity of the material was obtained based on the measured true thickness of the slab at each point. These results acted as a reference for the propagation and attenuation of the GPR signal in intact Kuru grey granite for the system used. They were used in the next phase of the study to improve the accuracy of the interpreted location and the orientation of the fracture surfaces.
The accuracy of the GPR interpretation was tested on three slabs of Kuru grey granite of approximately 100 cm × 100 cm × 40 cm. An artificial fracture surface was induced in each of the slabs by carefully splitting them in the middle while avoiding excessive damage to the sides. At this point, the halves were not yet separated in order to avoid damaging the induced fracture surface. The same 1600 MHz GPR system was used to measure a grid of 9 by 9 scanlines with a 10 cm line separation from the top of each slab. Measurements were carried out in a continuous measurement mode with 200 traces per meter and 2048 samples per trace. During the measurement, a thin sheet of steel was used as a back plate under the slab to provide a strong reflection for reference. The obtained data were processed to create 2D profiles along the scan lines (Figure 6). The time-to-distance conversion was completed using the median value of the relative dielectric permittivities obtained from the measurements in phase 1. Finally, the profiles were processed to determine the profile of the fracture surface at each scan line.
After the GPR measurements were completed, each slab was carefully opened by lifting the top half. Both halves were photographed using a Canon 5DS R DSLR camera and a Canon 35 mm f/1.4L II USM lens. The camera was held in place using a tripod and the slab was rotated 8.4 degrees between the photographs from dip angles of 30, 45, and 60 degrees, resulting in a total of 129 photographs per half. The photogrammetric modelling and automatic scaling using a distance marker were carried out in RealityCapture 1.0.3.9696 software. Further processing and rotation and translation of the point clouds were completed using CloudCompare 2.10.1 software. The true vertical position of the fracture surface was obtained as two raster X–Y grids with unit dimensions of 1 mm × 1 mm and 0.5 mm × 0.5 mm. An example of the resulting photogrammetric models is shown in Figure 7 and a close-up of the models is shown in Figure 8.

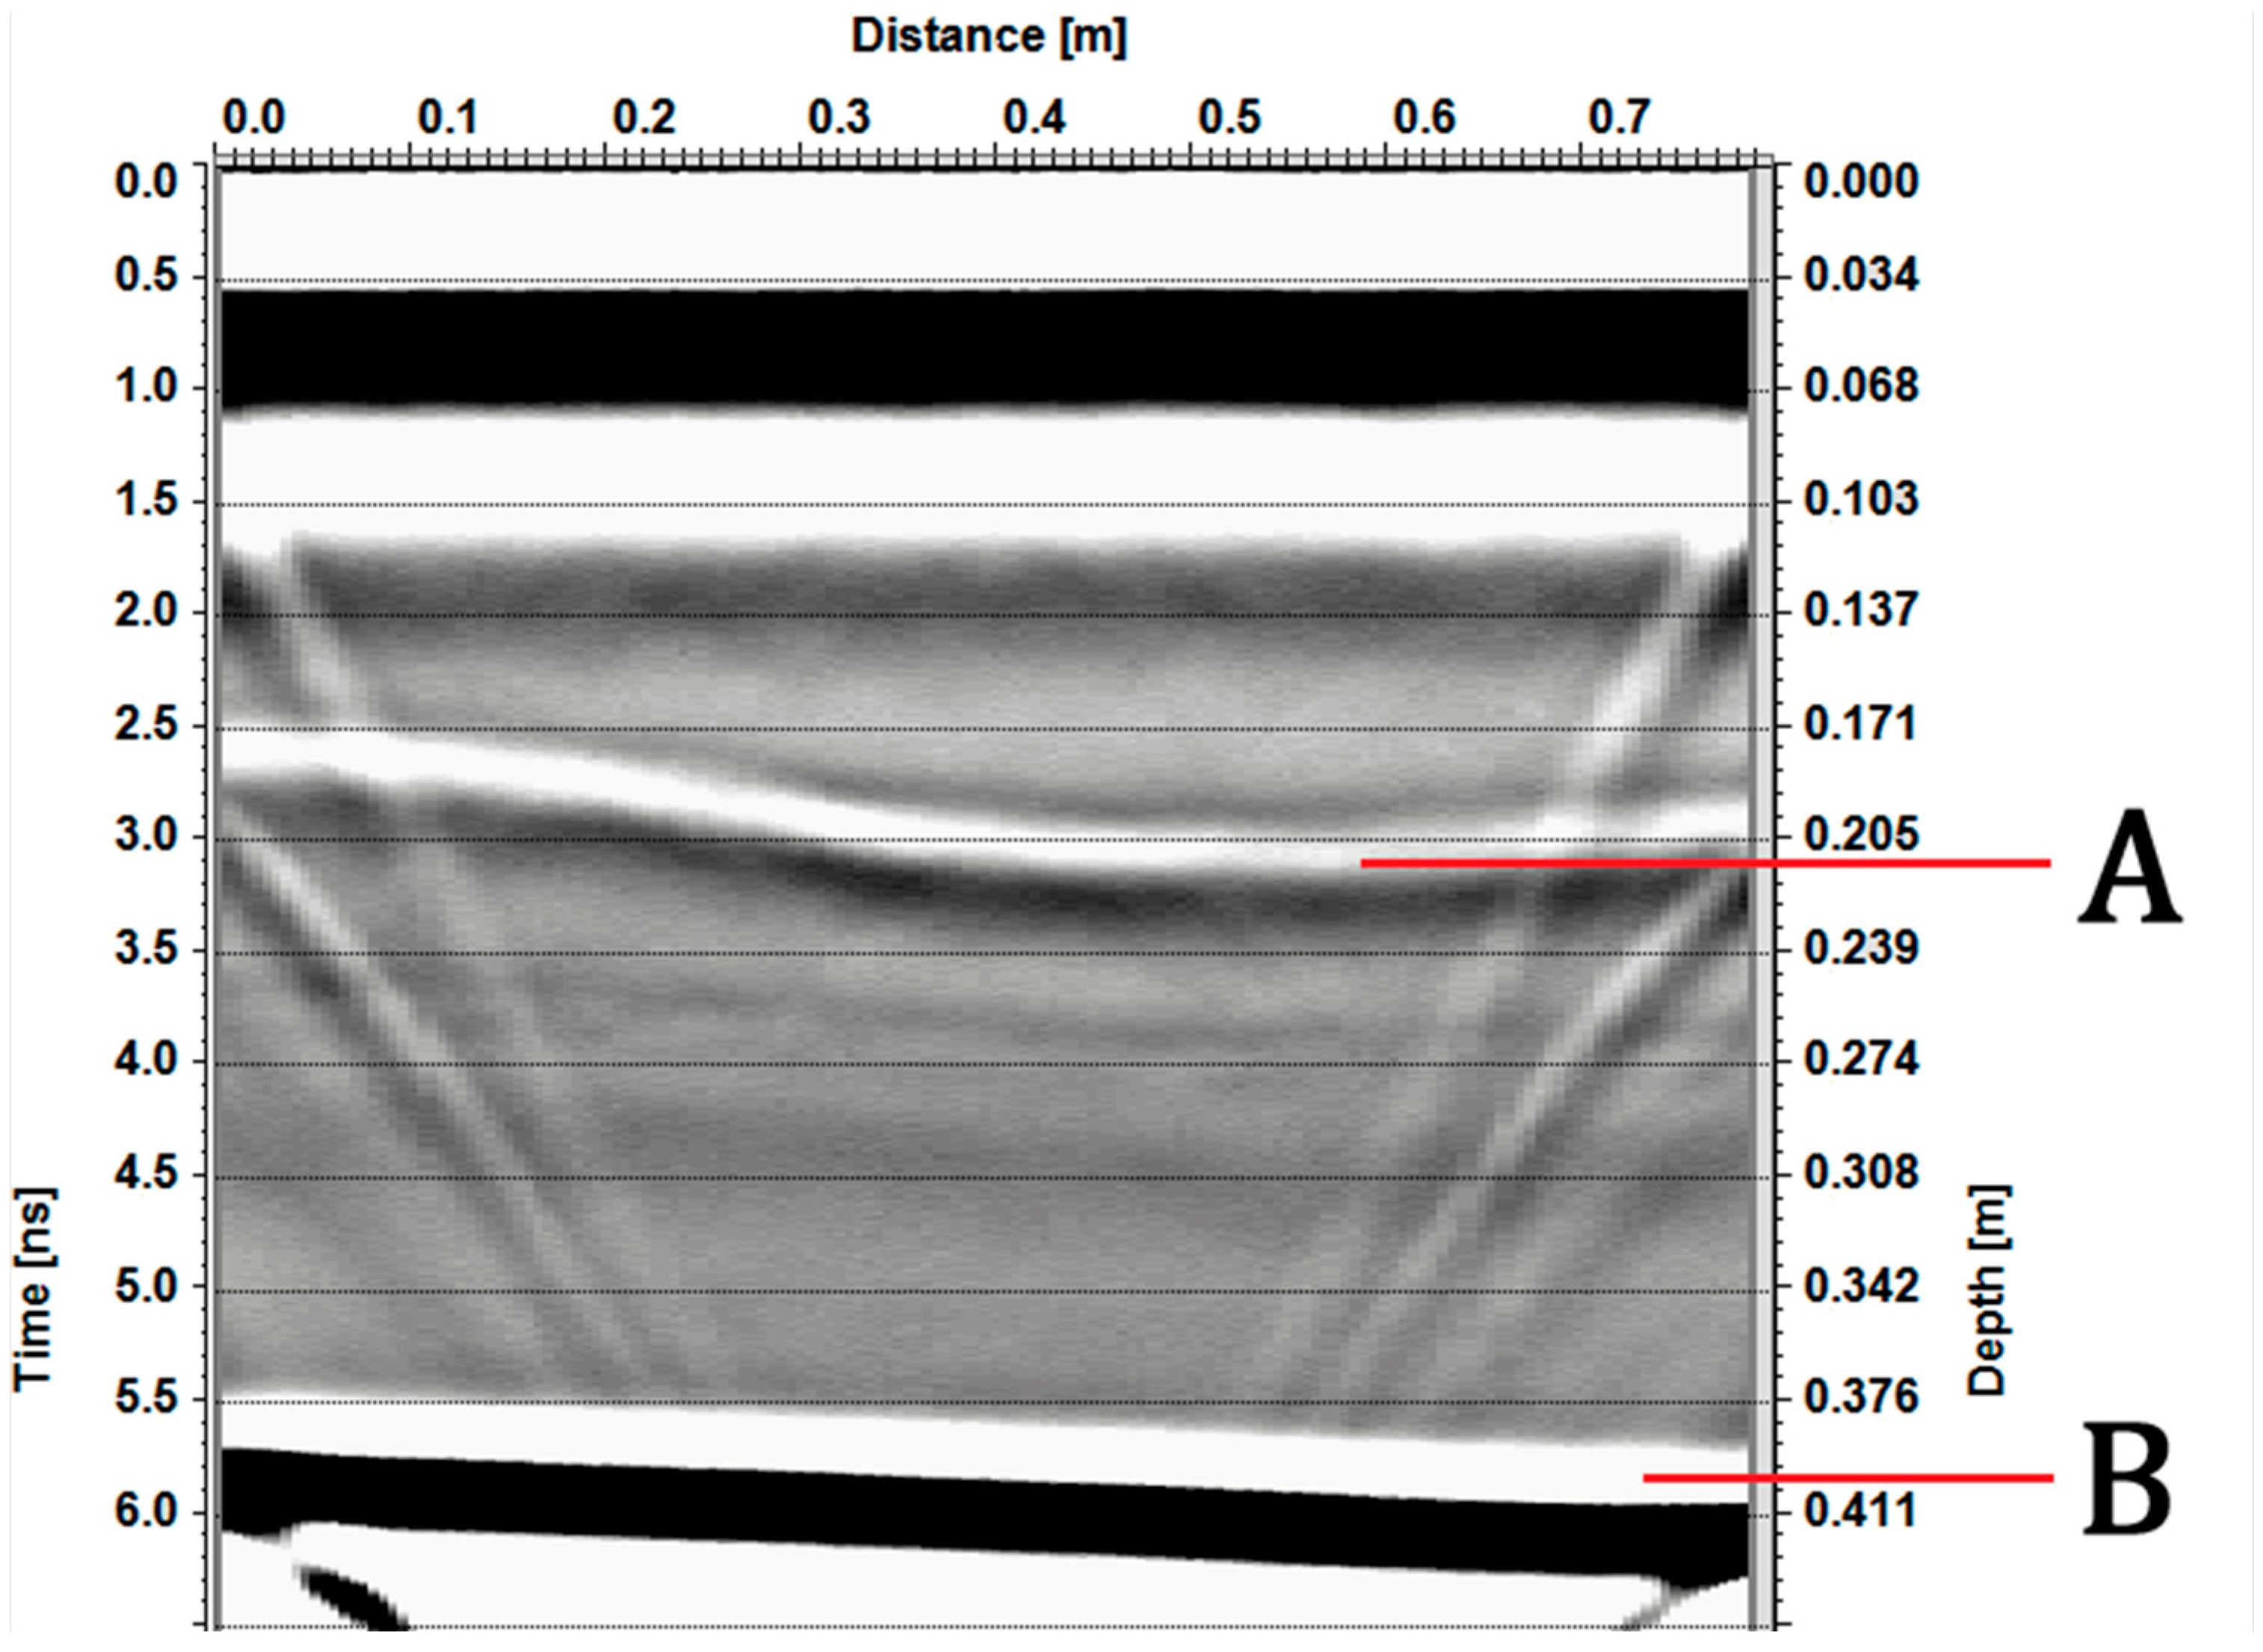
5.2. Results and Discussion

The photogrammetrically obtained fracture surface geometry was compared to the results from the GPR measurements. Both datasets were downsampled to 10 mm in the X and Y directions, and the Z values were compared point by point. Initial mean differences in the Z values were between 6.10 and 10.55 mm, with standard deviations of between 2.84 and 3.55 mm (Figure 9, left). This level of accuracy is representative of the general performance of the method using locally sourced relative dielectric permittivity values for calibration. To account for uncertainty in the relative dielectric permittivity values, the GPR measurements were then calibrated with a constant shift using the median difference values rounded to 1 mm. This resulted in mean differences in the Z values of between 2.33 and 2.70 mm, with standard deviations of between 1.70 and 2.34 mm (Figure 9, right). This in turn is representative of the performance of the model with respect to small-scale variations. It was thus shown that, with proper calibration, GPR can accurately map the geometry of the fracture surface to the millimeter level.

6. Photogrammetric Scanning for Rapid Geometrical Characterization

Structure-from-motion–multi-view stereo (SfM-MVS) photogrammetry is an effective technique for digitizing underground spaces for remote and rapid rock mass mapping. However, the conventional image acquisition process can be laborious and time-consuming. This can be problematic, especially if there is a need for fast access to geotechnical data to be applicable in the stope design process, as identified in the industry survey. Therefore, a method for rapid photogrammetric digitization of tunnels and stopes for rock mass mapping was developed. It provides the orientation of rock mass features such as discontinuities and their statistical properties within a reasonable time frame.

6.1. Methodology

Three different approaches to capture the images were tested. First, the method was demonstrated in a 10 m-long tunnel section of granitic rock, which was captured with a 360-degree camera (Figure 10a). The camera takes six photos at the same time, which increases the acquisition speed. Pictures were taken from 27 locations (Figure 10c) and a 3D model was reconstructed using SfM-MVS photogrammetry. To enable fracture orientation measurements, the model was oriented using an orientation board with the control points proposed in [47]. The resulting model was then compared with a reference laser scan and a more conventional digital single-lens reflex (DSLR) camera-based model. The 360 camera-based model was then used to remotely map rock mass properties. The mean orientation of three identified discontinuity sets was measured from the point cloud using a semi-automatic clustering-based method [48].
The second acquisition method for rapid photogrammetry was based on a multi-camera rig, which offers advantages over traditional methods in terms of time and cost efficiency. A multi-camera rig with four GoPro Hero 8 cameras was designed to quickly capture images of the tunnel surface (Figure 11b). The method was tested at the Underground Research Laboratory of Aalto University (URLA), where a tunnel drift was digitized using the multi-camera rig and a portable lighting setup (Figure 11a). Data were acquired by recording 4K videos with each camera, with frames extracted at 1 s intervals. The frames were processed using RealityCapture photogrammetric software v1.2, resulting in a 3D model and a point cloud. Reference distance measurements on the 3D model showed a mean error of 3.7 mm and a maximum error of 8.6 mm. Discontinuity orientation measurements were obtained using the computer-assisted remote mapping method with the Compass plugin in CloudCompare software v2.12.0 [49] and the semi-automatic method in Discontinuity Set Extractor (DSE) software v3.01 [48]. In addition, reference fracture orientation measurements were taken manually using a geological compass and compared with the remote measurements.
Finally, UAV (drone) photogrammetry was explored as a third rapid method for rock mass characterization in underground excavations, particularly for stope design. For this purpose, an open drone image dataset [50] consisting of 2105 images recorded inside a stope in the Golden Sunlight Mine in Montana, USA, were processed. The 3D stope model was reconstructed photogrammetrically, and discontinuity mapping was then performed using a semi-automatic approach to identify rock discontinuities and measure their orientation (Figure 12).
Figure 10. Photogrammetric scanning of an underground tunnel with a 360-degree camera (a). The 3D model (b) was produced from a series of images captured at 27 locations (c). The discontinuity sets were extracted from the 3D models using a semi-automatic method by [48] (d,e) with three discontinuity sets: J1 = blue, J2 = green, J3 = red, and compared with conventional geological compass measurements (f) (modified after [51]).
Applsci 14 00957 g010
Figure 11. Tunnel drift (a) digitized in this study using photogrammetry with a multi-camera rig (b) into a 3D model (c) that was mapped remotely, and four discontinuity planes were identified using manual, computer assisted, and semi-automatic methods (d) (modified after [52]).
Applsci 14 00957 g011
Figure 12. Stope 3D model (a) digitized in this study from UAV images captured in an underground mine, with four discontinuity sets (DS1-4) mapped remotely using a semi-automatic method (b), and their orientation plotted on a stereonet, with mean dip direction and dip angle (c).
Applsci 14 00957 g012

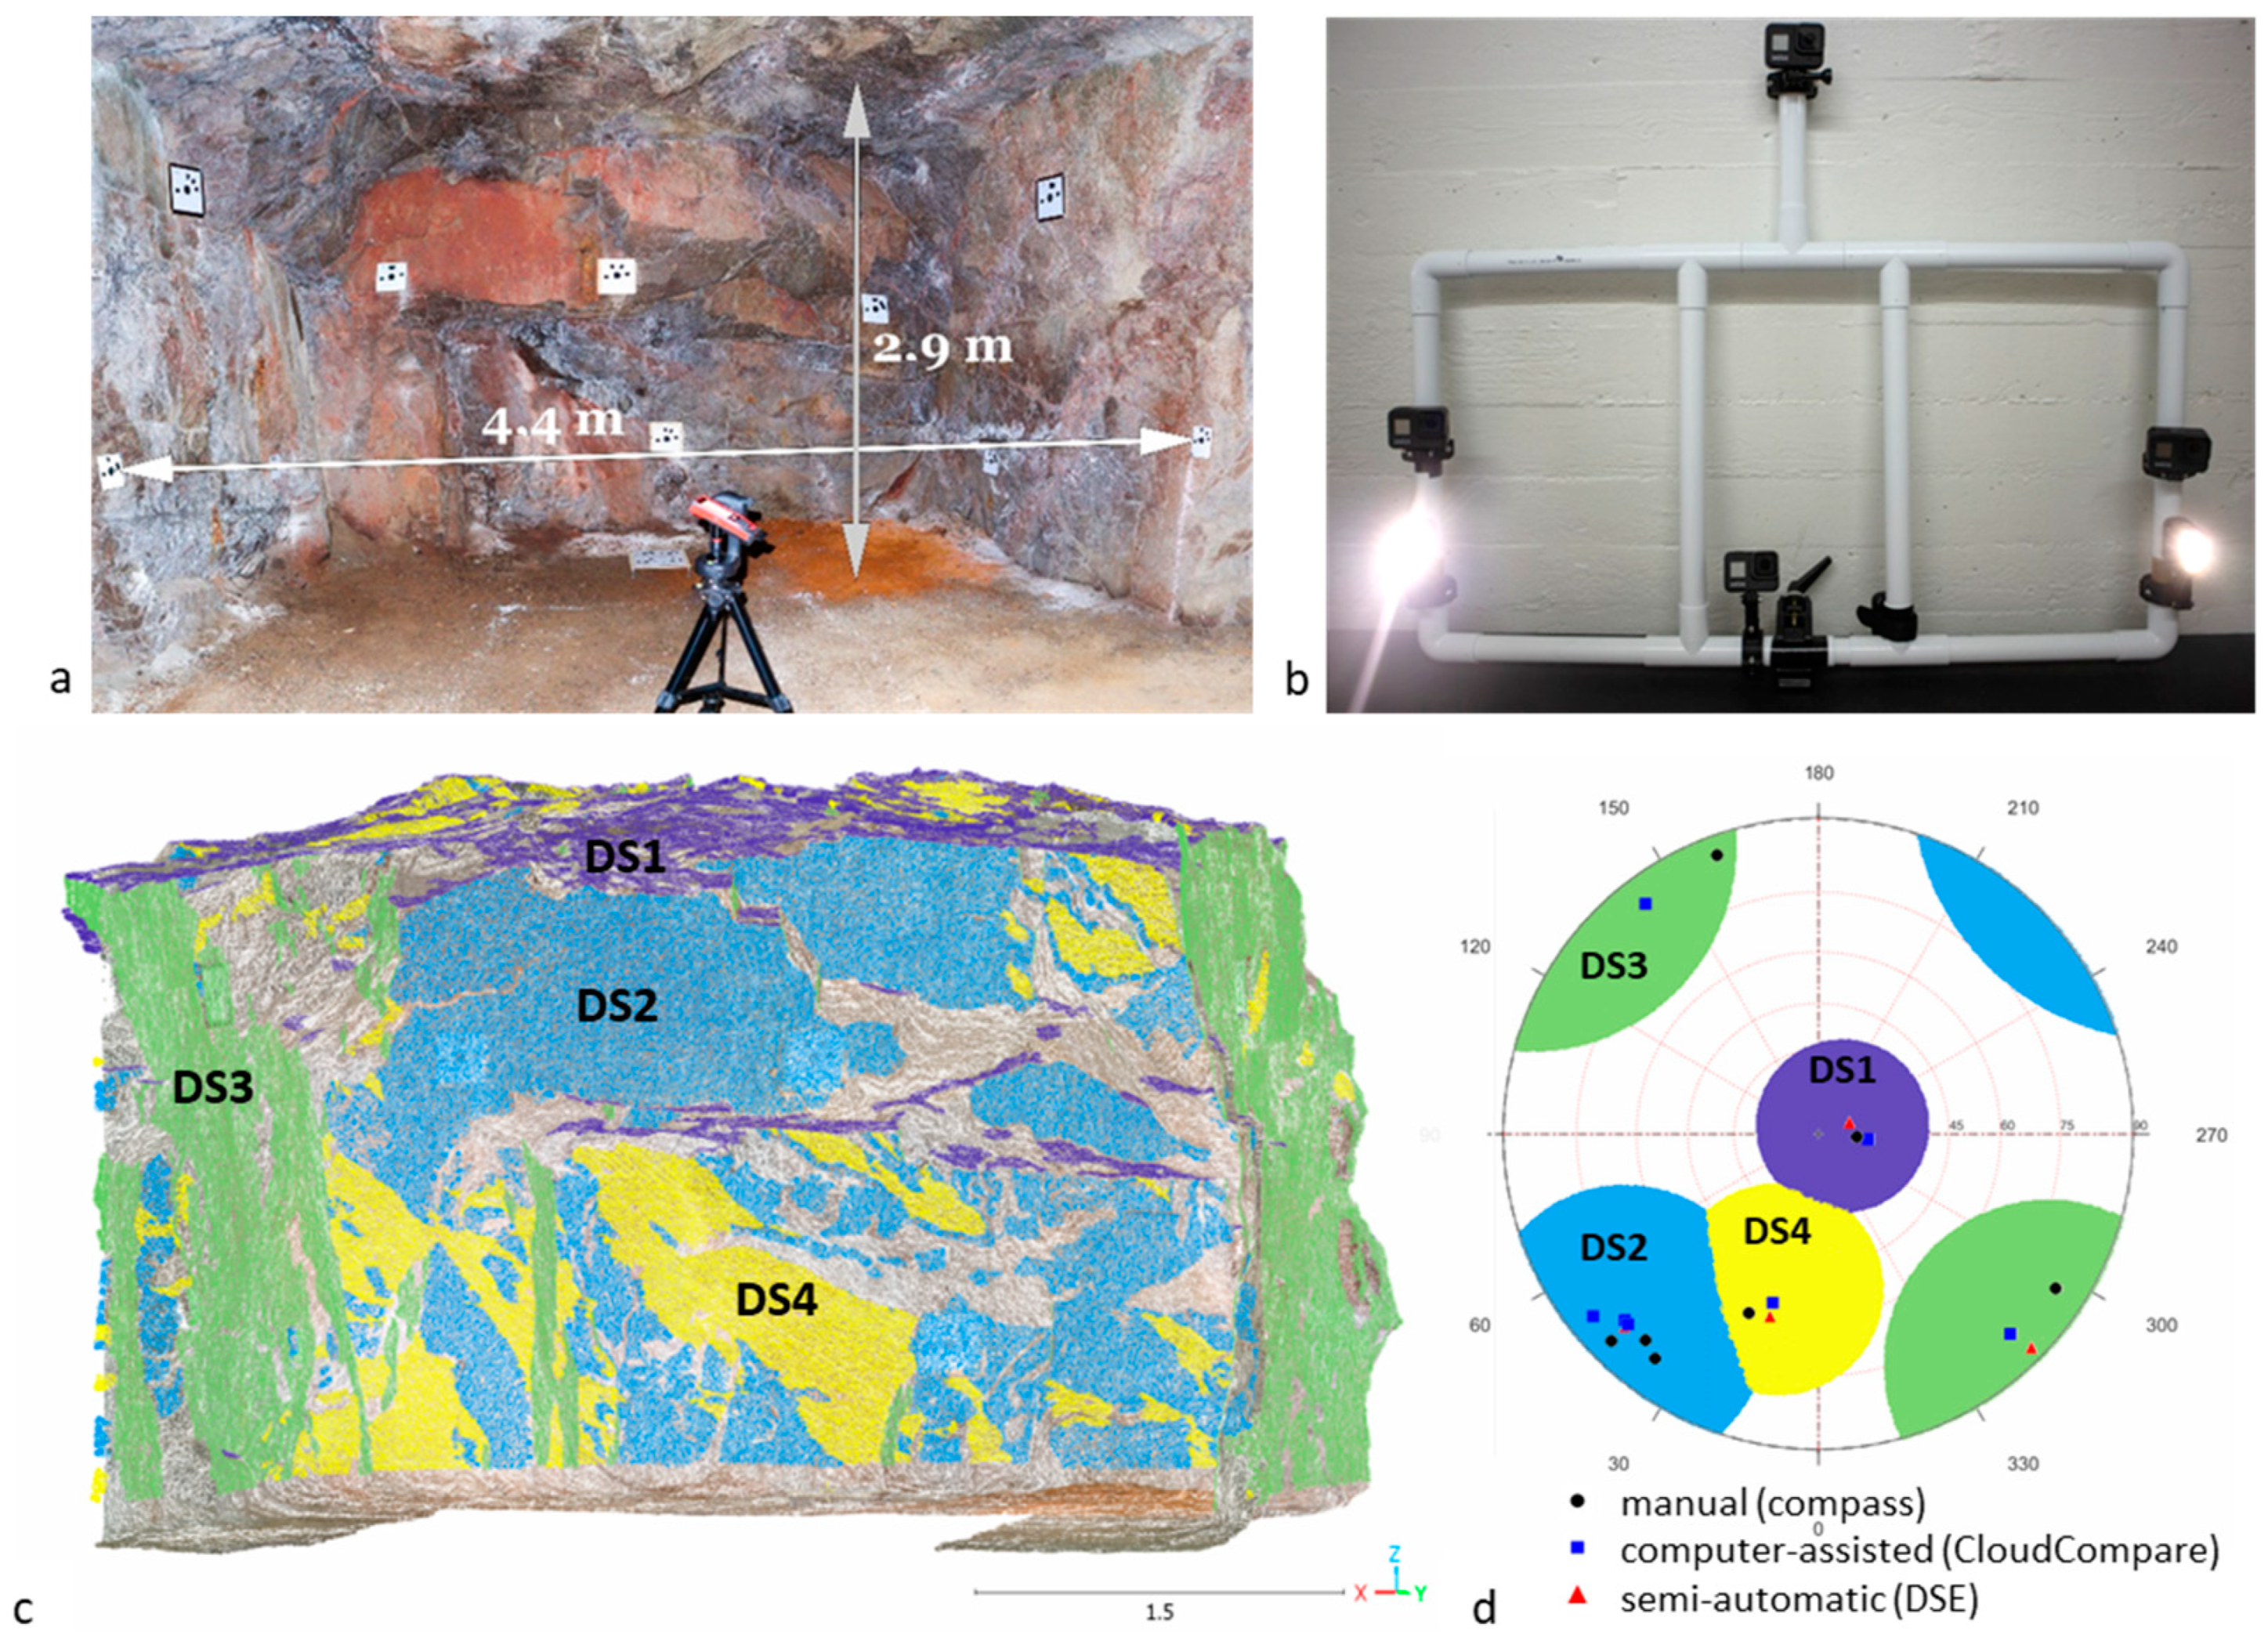
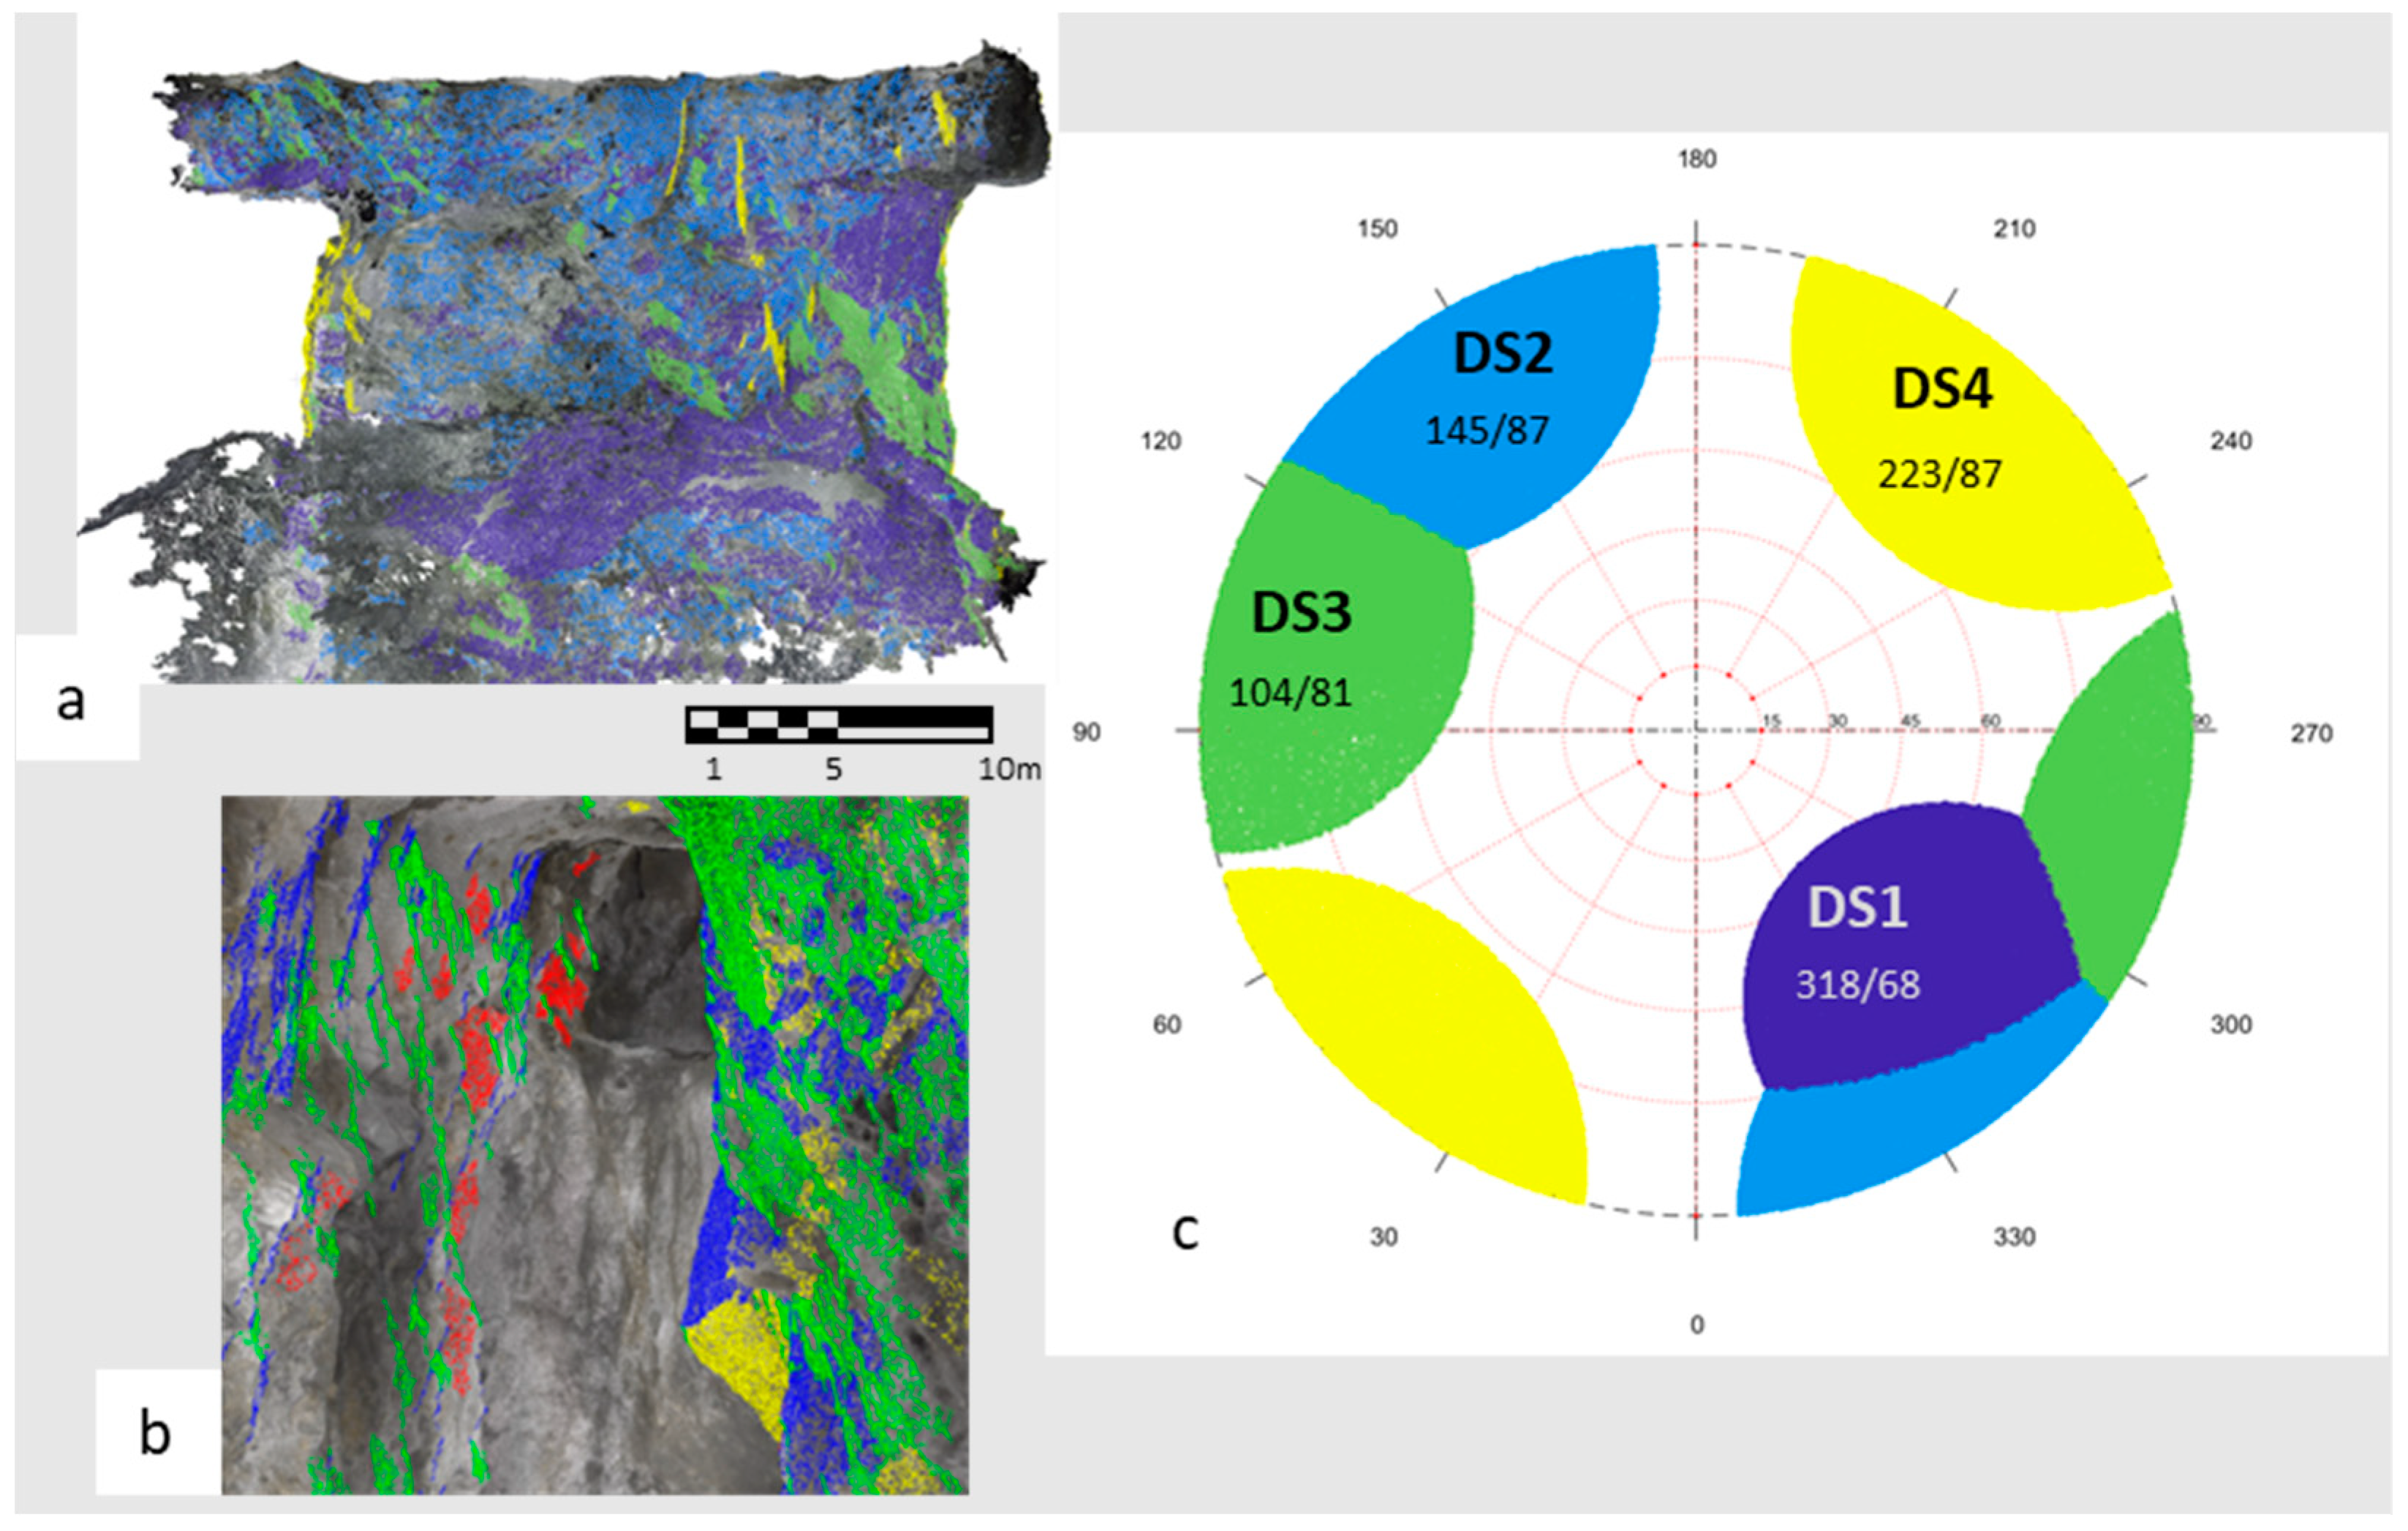
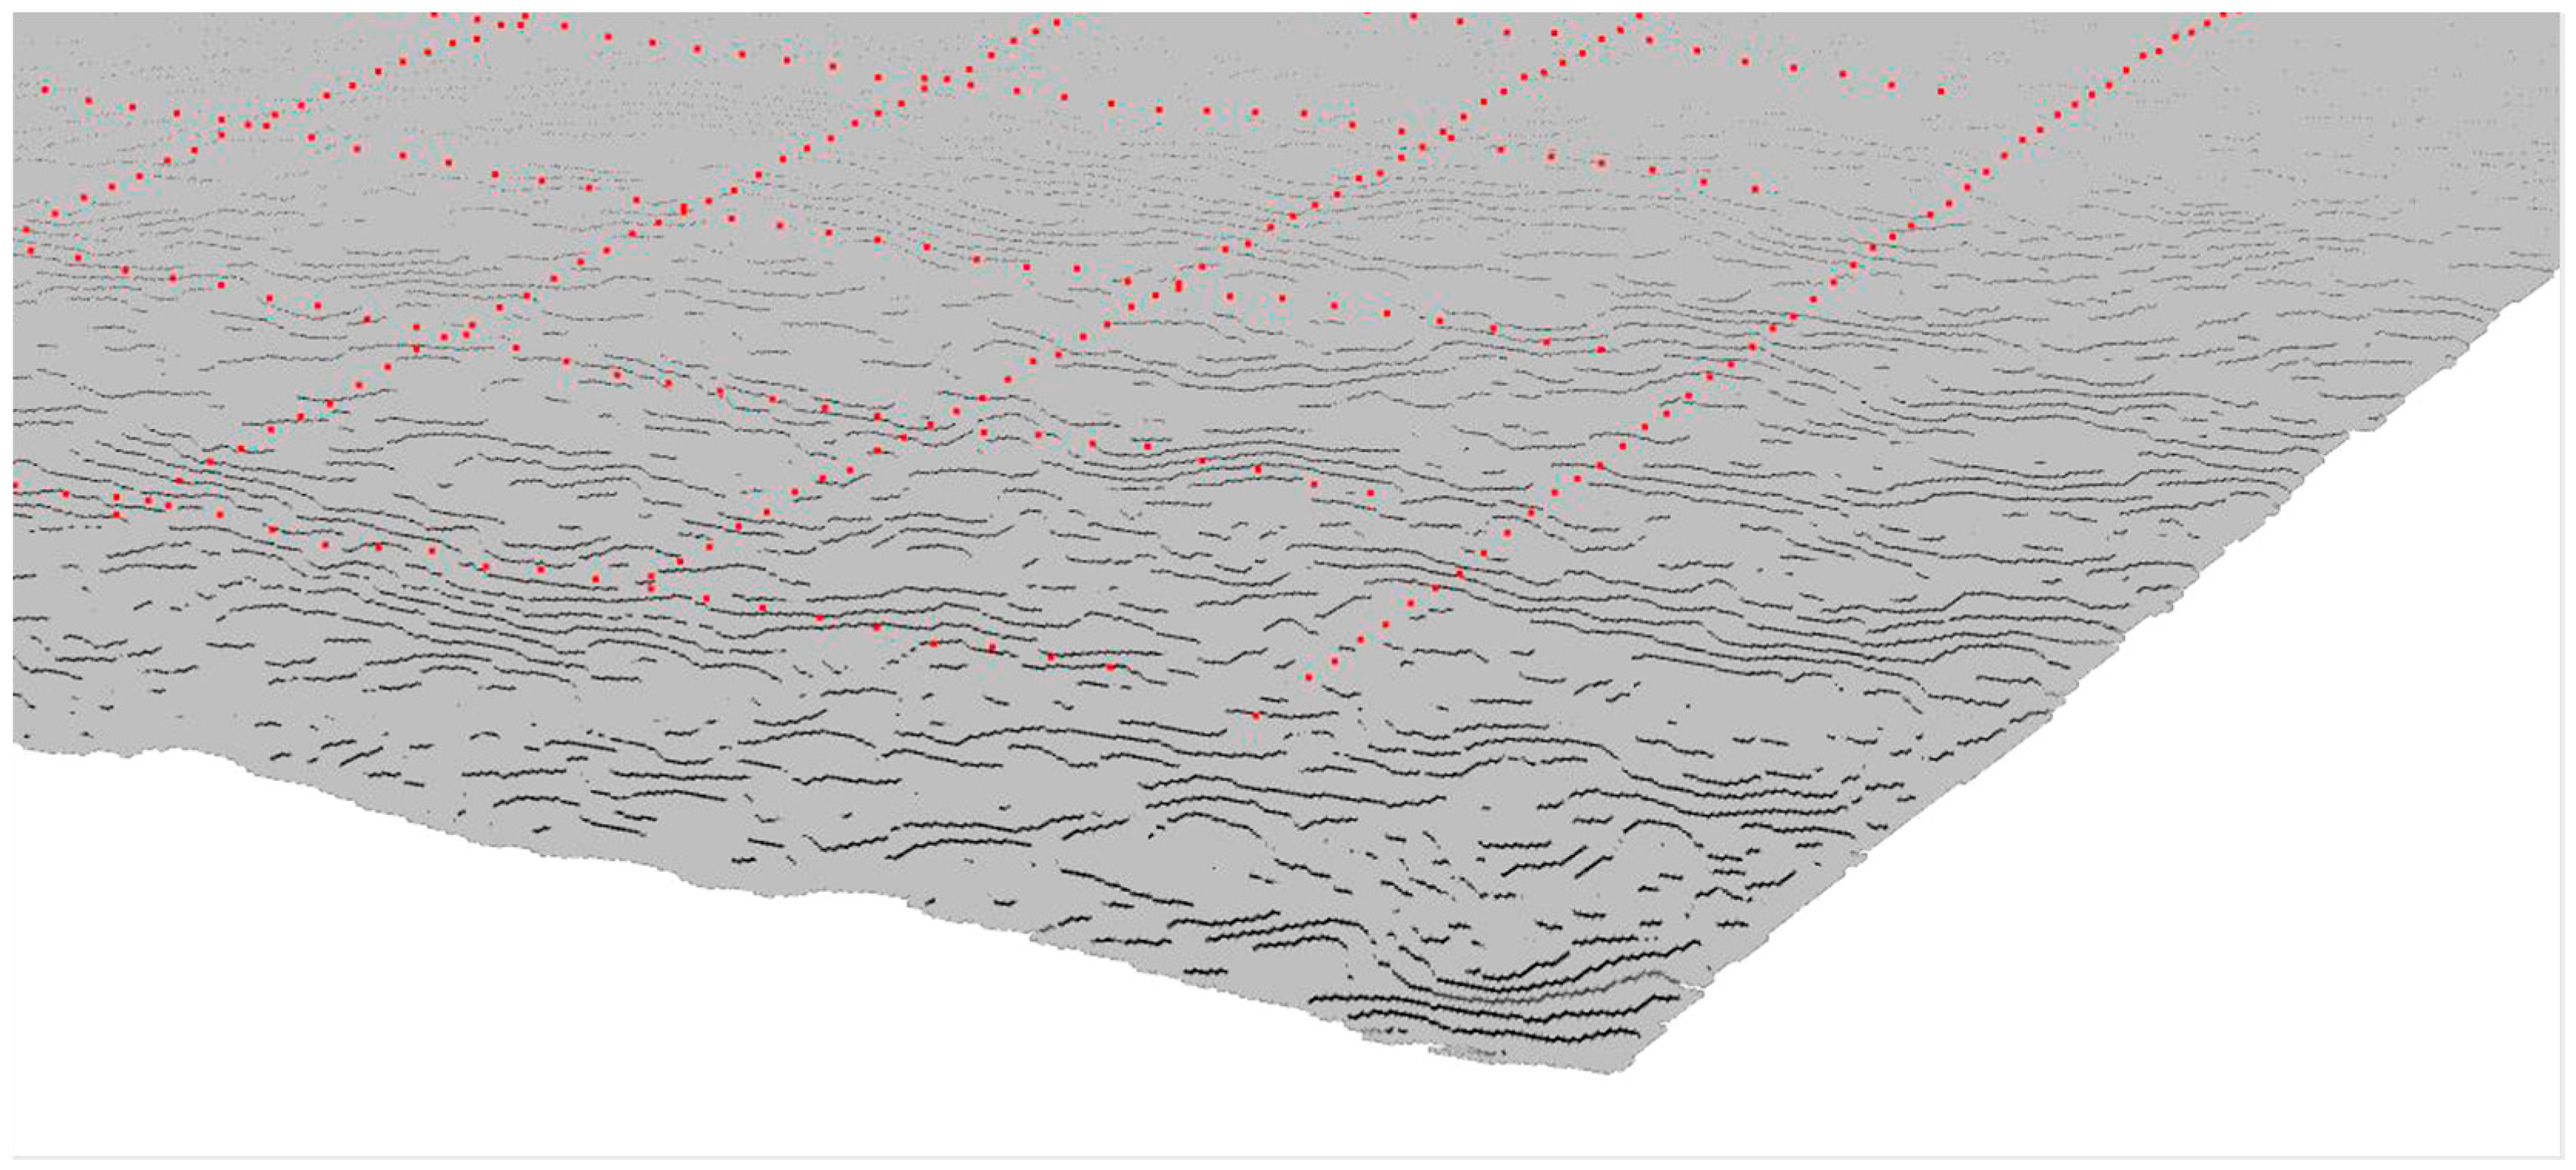
6.2. Results and Discussion

The results of tunnel digitization with a 360-degree camera are presented in Figure 10. Image acquisition with a 360-degree camera was three times faster than with a conventional DSLR camera approach, and the workflow was easier and less prone to errors. The observations from the reconstructed 3D model matched the field measurements obtained using a conventional geological compass (Figure 10f). Some discrepancies were observed for sub-horizontal planes, which is a common issue reported in the literature.
The results from the multi-camera data acquisition are presented in Figure 11c,d. The computer-assisted remote mapping method showed a mean difference of 8.3 and 2.4 degrees for dip direction and dip, respectively. The semi-automatic method resulted in a mean difference of 10.4 and 3.6 degrees for dip direction and dip, respectively (Figure 11d). The results obtained from remote mapping are comparable to reality, with mean differences within acceptable ranges for engineering applications.
The results demonstrate the feasibility of using drone photogrammetry for remote fracture mapping in stopes, reducing data acquisition time and increasing safety by minimizing personnel exposure in hazardous areas. The most significant of these is the reduced data acquisition time. Drones enable rapid coverage of extensive areas, capturing high-quality images or videos necessary for detailed analysis, a task that would be considerably more time-consuming using traditional methods [53]. This aspect is crucial in dynamic underground environments where timely data are essential for decision-making. Another vital benefit is the increased safety that drone usage ensures. By minimizing the need for personnel to enter hazardous areas within stopes, the risk associated with geological hazards like rock falls or unstable ground is significantly reduced. This safety aspect is particularly critical in underground excavations where traditional access methods pose considerable risks. Drones offer coverage and accessibility, enabling the capture of images from otherwise difficult-to-reach areas. This capability ensures a more comprehensive mapping of discontinuities, contributing to a more accurate and deeper understanding of the rock mass. The the data obtained from UAV photogrammetry, as demonstrated in our study, were of a high resolution, allowing for precise mapping and analysis of the rock mass features required for stope design.
However, there are limitations to this approach, including the high cost of specialized UAVs and their limited battery life. The cost factor associated with specialized drones is a significant barrier, particularly for smaller mining operations. Additionally, the limited battery life of drones restricts the duration of continuous data acquisition, which can be a hindrance in extensive underground excavations. The requirement for technical expertise in both operating drones and processing the acquired data is another consideration. The need for skilled personnel underscores the importance of training and development in this evolving technological field. Furthermore, the effectiveness of drones can be compromised by underground environmental conditions such as dust, moisture, and poor lighting, which can affect image quality and, consequently, the accuracy of photogrammetric models.
Despite these challenges, advancements in drone technology, such as multi-camera systems, improved battery life, and enhanced navigation capabilities, suggest a promising future for UAV-based photogrammetry in underground excavations, particularly in the context of ore and rock mass characterization for stope design. The integration of multi-camera systems in drones could enhance both the quality and the speed of data capture, leading to more detailed and comprehensive 3D models. Improvements in battery technology could extend drones’ operational duration, making them more practical for large-scale underground mappings. Also, advancements in navigation systems, particularly for GPS-denied environments like underground excavations, could increase the precision and reliability of data acquisition. Developing drones that are more resilient to harsh underground conditions would also be a significant step forward. Additionally, streamlined and automated data-processing software could make drone photogrammetry more accessible and reduce dependence on highly specialized technical expertise. By incorporating these advancements, drone technology holds considerable promise for revolutionizing rock mass characterization in underground excavations, particularly in the context of stope design. The combination of rapid data acquisition, safety enhancement, and comprehensive geological analysis positions drone photogrammetry as a valuable tool in the future of geotechnical engineering and underground space utilization.

7. Conclusions

This paper provides an overview of a research project that aimed to improve stope design by addressing the needs of mining professionals and by developing promising techniques to improve the stope design process. According to the literature research, numerical modelling has become an important tool for stope design. Both continuum and discrete numerical methods are used to simulate jointed rock masses in the stope scale, mainly to optimize stope boundaries, the production schedule, and development activities.
According to the survey within the industry, additional geotechnical data, software improvements, and integration of design into mine planning are identified as the most urgent topics for improvement. Fast data acquisition and automation of the design process were also highlighted. Respondents ranked cutoff grade and dilution as the most important parameters affecting stope design. The survey also indicated that sublevel stoping is the most used underground mining method (46% of respondents), followed by the cut-and-fill method (22%). Personal expertise, numerical methods, and empirical methods are all commonly used in stope design.
Laser-induced breakdown spectrometry (LIBS) techniques were improved in order to be conduct measurements at the tunnel face and from core boxes to facilitate rapid decision-making and to provide new insights into the ore body. Point load test correlation with point load values predicted from LIBS data suggest that the LIBS signal can also be used for geometallurgical characterization.
Ground-penetrating radar (GPR) studies were conducted to improve discontinuity characterization. This research indicated that ground-penetrating radar might be a valuable tool for the mapping and characterization of the location, size, geometry, and orientation of fractures, fracture zones, and other geological features. This in turn allows for a more optimized planning of the excavation of rock mass.
The rapid photogrammetric method presented in this study offers efficient and accurate rock mass data acquisition, specifically tailored for stope design in underground excavations. Three presented approaches demonstrate the effectiveness in capturing detailed rock mass measurements such as the location and orientation of planar discontinuities inside tunnels and stopes.
The techniques discussed in this paper already have many industrial applications. This study suggests that they have a strong potential to be adopted and further developed to serve for ore and rock mass characterization for stope design.

Author Contributions

Methodology, M.R., M.J., S.P., R.K., L.K., I.L. and J.L.; investigation, M.J., S.P., R.K., L.K. and I.L.; data curation, M.J., S.P., R.K. and I.L.; writing—original draft preparation, M.R., M.J., S.P., L.U., R.K., L.K., I.L. and J.L.; writing—review and editing, M.R., M.J., S.P., L.U., R.K., L.K., I.L. and J.L.; visualization, M.J., S.P., R.K. and I.L.; supervision, M.R. and J.L.; project administration, R.K.; funding acquisition, M.R., M.J., S.P., L.U., R.K., L.K. and J.L. All authors have read and agreed to the published version of the manuscript.

Funding

This research was funded by the Academy of Finland grant number 319798 and the APC was funded by Aalto University School of Engineering.

Institutional Review Board Statement

Not applicable.

Informed Consent Statement

Not applicable.

Data Availability Statement

The raw data supporting the conclusions of this article will be made available by the authors on request.

Acknowledgments

The authors kindly acknowledge the survey respondents for participating in the industrial survey. The international partners TU Delft, University of A Coruña, and University of Vigo are acknowledged for their good cooperation.

Conflicts of Interest

The authors declare no conflict of interest.

References

  1. Wagner, H. Deep Mining: A Rock Engineering Challenge. Rock Mech. Rock Eng. 2019, 51, 1417–1446. [Google Scholar] [CrossRef]
  2. Mark, C. Science of empirical design in mining ground control. Int. J. Min. Sci. Technol. 2016, 26, 461–470. [Google Scholar] [CrossRef]
  3. Suorineni, F.T. Reflections on empirical methods in geomechanics–The unmentionables and hidden risks. In Proceedings of the 3rd Australasian Ground Control in Mining Conference, Sydney, Australia, 5–6 November 2014. [Google Scholar]
  4. Vallejos, J.A.; Miranda, R.; Burgos, L.; Perez, E. Development of New Design Tools for Open Stoping Underground Mines. In Proceedings of theAmerican Rock Mechanics Association, San Francisco, CA, USA, 25–28 June 2017. [Google Scholar]
  5. Zhou, X.; Zhao, X.; Qu, Q.; Shi, J. Stope Structural Parameters Design towards Green and Deep Mining: A Review. Processes 2023, 11, 3125. [Google Scholar] [CrossRef]
  6. Erdogan, G.; Yavuz, M. Application of Three Existing Stope Boundary Optimisation Methods in an Operating Underground Mine; IOP Publishing: Bristol, UK, 2017; Volume 95, p. 042077. [Google Scholar]
  7. Erdogan, G.; Cigla, M.; Topal, E.; Yavuz, M. Implementation and comparison of four stope boundary optimization algorithms in an existing underground mine. Int. J. Min. Reclam. Environ. 2017, 31, 389–403. [Google Scholar] [CrossRef]
  8. Pontow, S. Evaluation of Methods for Stope Design in Mining and Potential of Improvement by Pre-Investigations. Master’s Thesis, Aalto University, School of Engineering, Espoo, Finland, 2019. [Google Scholar]
  9. Janiszewski, M.; Pontow, S.; Rinne, M. Industry Survey on the Current State of Stope Design Methods in the Underground Mining Sector. Energies 2022, 15, 240. [Google Scholar] [CrossRef]
  10. Grieco, N.; Dimitrakopoulos, R. Managing grade risk in stope design optimisation. Min. Techn. 2007, 116, 49–57. [Google Scholar] [CrossRef]
  11. Villalba Matamoros, M.E.; Kumral, M. Underground mine planning: Stope layout optimisation under grade uncertainty using genetic algorithms. Int. J. Min. Recl. Environ. 2019, 33, 353–370. [Google Scholar] [CrossRef]
  12. Bootsma, M.; Alford, C.; Benndorf, J.; Buxton, M. Cut-off Grade Based Sublevel Stope Mine Optimisation. In Advances in Applied Strategic Mine Planning; Springer: Cham, Switzerland, 2018; pp. 537–557. [Google Scholar]
  13. Will, K.; Vendla, S. Underground Cut-off Grade Optimisation in Narrow Vein Deposits Based on an Innovative Mine Design Algorithm. Min. Rep. Glückauf 2018, 154, 452–459. [Google Scholar]
  14. Hou, X.; Dowd, P. Integrated optimisation of stope boundary and access layout for underground mining opera-tions. Min. Technol. 2019, 128, 193–205. [Google Scholar] [CrossRef]
  15. Hou, J.; Li, G.; Wang, H.; Hu, N. Genetic algorithm to simultaneously optimise stope sequencing and equipment dispatching in underground short-term mine planning under time uncertainty. Int. J. Min. Recl. Environ. 2019, 34, 307–32519. [Google Scholar] [CrossRef]
  16. Razavi, M.; Espley, S.; Yao, M. Open Stope Stability Analysis of VRM Stope in the Vicinity of Creighton Fault by Numerical and Empirical Methods; American Rock Mechanics Association: San Francisco, CA, USA, 2011. [Google Scholar]
  17. Mishra, R.; Kiuru, R.; Uotinen, L.; Janiszewski, M.; Rinne, M. Combining expert opinion and instrumentation data using Bayesian networks to carry out stope collapse risk assessment. In Proceedings of the Conference on Mining Geomechanical Risk, Perth, Australia, 9–11 April 2019. [Google Scholar]
  18. Mousavi, A.; Sellers, E. Optimisation of production planning for an innovative hybrid underground mining method. Resour. Policy 2019, 62, 184–192. [Google Scholar] [CrossRef]
  19. McGaughey, J. Artificial intelligence and big data analytics in mining geomechanics. In Proceedings of the Conference on Deep and High Stress Mining, SAIMM, Johannesburg, South Africa, 24–25 June 2019; pp. 45–54. [Google Scholar]
  20. Adoko, A.C.; Saadaari, F.; Mireku-Gyimah, D. A Feasibility Study on the Implementation of Neural Network Classifiers for Open Stope Design. Geotech. Geol. Eng. 2021, 1–20. [Google Scholar] [CrossRef]
  21. Bazarbay, B.; Adoko, A.C. A Comparison of Prediction and Classification Models of Unplanned Stope Dilution in Open Stope Design. In Proceedings of the 55th U.S. Rock Mechanics/Geomechanics Symposium, Virtual Event, 22 June 2021. [Google Scholar]
  22. Bouzeran, L.; Pierce, M.; Jalbout, A.; Ruest, M. Stoping sequence optimisation at Eleonore Mine based on stress analysis through horizon scale numerical modelling. In Proceedings of the 9th International Conference on Deep and High Stress Mining, SAIMM, Johannesburg, South Africa, 24–25 June 2019; pp. 253–266. [Google Scholar]
  23. Sotoudeh, F.; Kakaie, R.; Ataei, M. Development of a computer program for underground mine stope optimisation using a heuristic algorithm. In Proceedings of the Conference on Underground Mining Technology, Sudbury, ON, Canada, 11–13 October 2017; pp. 689–700. [Google Scholar]
  24. Harmon, R.S.; Senesi, G.S. Laser-Induced Breakdown Spectroscopy—A Geochemical Tool for the 21st Century. Appl. Geochem. 2021, 128, 104929. [Google Scholar] [CrossRef]
  25. Senesi, G.S. Laser-Induced Breakdown Spectroscopy (LIBS) Applied to Terrestrial and Extraterrestrial Analogue Geomaterials with Emphasis to Minerals and Rocks. Earth-Sci. Rev. 2014, 139, 231–267. [Google Scholar] [CrossRef]
  26. Zorov, N.B.; Gorbatenko, A.A.; Labutin, T.A.; Popov, A.M. A review of normalization techniques in analytical atomic spectrometry with laser sampling: From single to multivariate correction. Spectrochim. Acta Part B At. Spectrosc. 2010, 65, 642–657. [Google Scholar] [CrossRef]
  27. Kangas, L.; Leveinen, J. Towards Real-Time Ore Grade Evaluation Using Laser-Induced Breakdown Spectroscopy. In Proceedings of the 33rd Nordic Geological Winter Meeting, Kgs. Lyngby, Denmark, 10–20 January 2018. [Google Scholar]
  28. Maurice, S.; Jacob, X.; Couvert, L.; Mimoun, D.; Wiens, R.C.; Rapin, W.; Cousin, A.; Forni, O.; Gasnault, O.; Lasue, J.; et al. Acoustic Recording of LIBS Analyses in Preparation for Mars 2020. In Proceedings of the Lunar and Planetary Science XLVIII, The Woodlands, TX, USA, 20–24 March 2017. [Google Scholar]
  29. Millington, J. Site Specific Calibration of Laser Induced Breakdown Spectroscopy for Rapid Elemental Analysis of Gold Ore Drill Core Samples. Master’s Thesis, Aalto University, School of Engineering, Espoo, Finland, 2020. [Google Scholar]
  30. Laine, I. Scanning Laser-Induced Breakdown Spectrometer for Mine Walls. Master’s Thesis, Aalto University, School of Engineering, Espoo, Finland, 2019. [Google Scholar]
  31. Lange, M. Development of Geometallurgical Characterization and Comminution Testing of the Kittilä Gold Deposit. Master’s Thesis, Aalto University, School of Engineering, Espoo, Finland, 2019. [Google Scholar]
  32. Wai-Lok Lai, W.; Dérobert, X.; Annan, P. A review of Ground Penetrating Radar application in civil engineering: A 30-year journey from Locating and Testing to Imaging and Diagnosis. NDT E Int. 2018, 96, 58–78. [Google Scholar] [CrossRef]
  33. Hou, F.; Rui, X.; Fan, X.; Zhang, H. Review of GPR Activities in Civil Infrastructures: Data Analysis and Applications. Remote Sens. 2022, 14, 5972. [Google Scholar] [CrossRef]
  34. Garambois, S.; Sénéchal, P.; Perroud, H. On the use of combined geophysical methods to assess water content and water conductivity of near-surface formations. J. Hydrol. 2002, 259, 32–48. [Google Scholar] [CrossRef]
  35. Dérobert, X.; Iaquinta, J.; Klysz, G.; Balayssac, J.-P. Use of capacitive and GPR techniques for the non-destructive evaluation of cover concrete. NDT E Int. 2008, 41, 44–52. [Google Scholar] [CrossRef]
  36. Orlando, L.; Slob, E. Using multicomponent GPR to monitor cracks in a historical building. J. Appl. Geophys. 2009, 67, 327–334. [Google Scholar] [CrossRef]
  37. Francke, J. A review of selected ground penetrating radar applications to mineral resource evaluations. J. Appl. Geophys. 2012, 81, 29–37. [Google Scholar] [CrossRef]
  38. Sengani, F. The use of ground Penetrating Radar to distinguish between seismic and non-seismic hazards in hard rock mining. Tunn. Undergr. Space Technol. 2020, 103, 103470. [Google Scholar] [CrossRef]
  39. Grodner, M. Delineation of rockburst fractures with ground penetrating radar in the Witwatersrand Basin, South Africa. Int. J. Rock Mech. Min. Sci. 2001, 38, 885–891. [Google Scholar] [CrossRef]
  40. Caselle, C.; Bonetto, S.; Comina, C.; Stocco, S. GPR surveys for the prevention of karst risk in underground gypsum quarries. Tunn. Undergr. Space Technol. 2019, 95, 103137. [Google Scholar] [CrossRef]
  41. Baggett, J.; Abbasi, A.; Monsalve, J.; Bishop, R.; Ripepi, N.; Hole, J. Ground-Penetrating Radar for Karst Detection in Underground Stone Mines. Min. Metall. Explor. 2020, 37, 153–165. [Google Scholar] [CrossRef]
  42. Church, R.; Webb, W.; Boyle, J. Ground-Penetrating Radar for Strata Control. In USDOI Bureau of Mines Report of Investigations; United States Department of the Interior: Washington, DC, USA, 1985; p. 8954. [Google Scholar]
  43. Orlando, L. Semiquantitative evaluation of massive rock quality using ground penetrating radar. J. Appl. Geophys. 2003, 52, 1–9. [Google Scholar] [CrossRef]
  44. Kovin, O. Mapping of evaporite deformation in a potash mine using ground penetrating radar: Upper Kama deposit, Russia. J. Appl. Geophys. 2011, 7, 131–141. [Google Scholar] [CrossRef]
  45. Follin, S.; Koskinen, L.; Suikkanen, J.; Riihiluoma, N.; Kantia, P.; Kiuru, R.; Mustonen, S. Characterisation of EDZ for Final Disposal Facility of Spent Nuclear Fuel in Olkiluoto; POSIVA Report 2021-16; Posiva Oy: Eurajoki, Finland, 2021. [Google Scholar]
  46. Kiuru, R.; Kantia, P. Attenuation of ground penetrating radar signal in Kuru granite. In Proceedings of the EUROCK 2020, Virtual, 14–19 June 2020. [Google Scholar]
  47. García-Luna, R.; Senent, S.; Jurado-Piña, R.; Jimenez, R. Structure from Motion photogrammetry to characterize underground rock masses: Experiences from two real tunnels. Tunn. Undergr. Space Technol. 2019, 83, 262–273. [Google Scholar] [CrossRef]
  48. Riquelme, A.J.; Abellán, A.; Tomás, R.; Jaboyedoff, M. A new approach for semi-automatic rock mass joints recognition from 3D point clouds. Comput. Geosci. 2014, 68, 38–52. [Google Scholar] [CrossRef]
  49. Thiele, S.T.; Grose, L.; Samsu, A.; Micketwaite, S.; Vollgger, S.A.; Cruden, A.R. Rapid, semi-automatic fracture and contact mapping for point clouds, images and geophysical data. Solid Earth 2017, 8, 1241–1253. [Google Scholar] [CrossRef]
  50. Flyability. Photogrammetry dataset. Available online: https://info.flyability.com/photogrammetry-dataset (accessed on 14 December 2022).
  51. Janiszewski, M.; Torkan, M.; Uotinen, L.; Rinne, M. Rapid photogrammetry with a 360-degree camera for tunnel mapping. Remote Sens. 2022, 14, 5494. [Google Scholar] [CrossRef]
  52. Janiszewski, M.; Prittinen, M.; Uotinen, L.; Torkan, M.; Rinne, M. Rapid photogrammetric method for rock mass characterization in underground excavations. In Proceedings of the Nordic Rock Mechanics Symposium NROCK2023, Reykjavik, Iceland, 25–26 May 2023. [Google Scholar]
  53. Leem, J.; Kim, J.; Choi, J.; Song, J.-J. Comparison of an underground rock face 3D modeling performance: SfM-MVS with optimum photographing settings and LiDAR technology. In Proceedings of the 15th ISRM Congress 2023 & 72nd Geomechanics Colloquium, Salzburg, Austria, 4–9 October 2023; pp. 638–643. [Google Scholar]
Figure 1. Applied mining methods according to the survey of mining industry professionals. See details in [8].
Applsci 14 00957 g001
Figure 2. LIBS scanning from the tunnel face carried out for this study. Yellow tape indicates no entrance due to unsupported tunnel section (left). (Upper middle): LIBS signal allocated to arsenopyrite on scan area located on the left side of the tunnel. (Upper right): Laser ablation acoustic energy signal intensity changes revealing an ore vein as the highest intensity yellow and larger lithological changes across the tunnel wall. (Lower right): Prototype device for LIBS scanning of drill cores.
Applsci 14 00957 g002
Figure 3. Diagrams shows scatter plots of the LIBS pellet measurements and the mine laboratory data for the linear correlations for S, As, Fe, and Cu. Each X-axis is the LIBS measurement mean value in counts, the Y-axis displays the mg/kg analyzed by ICP-AES (inductively coupled plasma–atomic/optical emission spectroscopy). The figure on the right denotes the concentration of aluminum of drill cores scanned with LIBS overlayed on top of a photo of the same cores (see [29] for additional information).
Applsci 14 00957 g003
Figure 4. Point load test correlation with point load value predicted from LIBS data.
Applsci 14 00957 g004
Figure 5. Slab of Kuru grey granite used in this study with the measurement grid.
Applsci 14 00957 g005
Figure 6. Example of the obtained GPR profile for slab RAKKA-1. (A) Reflection from the induced fracture surface. (B) Reflection from the back plate.
Applsci 14 00957 g006
Figure 7. Example of the obtained photogrammetric model of the bottom half of slab RAKKA-1. The opened fracture surface is facing up. The origin of the coordinate system is at the top side corner at the bottom of the image. Distance markers can be seen in the corners.
Applsci 14 00957 g007
Figure 8. An example of the photogrammetric model of the mapped fracture surface (grey) and fracture locations as interpreted from the GPR survey, downsampled to 10 mm (red). Close up of the bottom half of slab RAKKA-1.
Applsci 14 00957 g008
Figure 9. Cumulative plot of the differences between the GPR and photogrammetric models of the facture surfaces, all scan lines. (Left): differences observed with the initial calibration based on the median of the measured dielectric permittivity values, representative of the general performance of the method. (Right): differences after a constant shift in all GPR values by the prior median difference rounded to 1 mm, representative of the performance with respect to small-scale variation in the geometry.
Applsci 14 00957 g009
Table 1. Recent research on stope design. Compiled and modified from [7,8,9].
Research AreaAdvantages and Disadvantages
Grade uncertainty and associated risk with stope design optimization [10,11]+ Cutoff grade-related optimization
+ Conclusive approach
− Iterative evaluation necessary
Iterative cutoff grade optimization [12,13]+ Conclusive approach
− High computing power need
Integration of stope design into mine planning [14,15]+ Most conclusive approach
− Challenges in the inclusion towards iteration
Empirical software to create deposit-specific case studies [4,16]+ Based on real experience
+ Simple
− Most likely not a perfectly ideal solution
Integration of real-time instrumentation and risk assessment [17]+ Necessary for implementing adequate iteration processes
− Requires additional equipment
− More complex
Novel mining methods and facilitated optimization methods [18]+ Very inclusive approach not limited to mining method-related optimizations
− Considerably experimental
Big data analytics in mining geomechanics [19]+ Good potential and opportunity to benefit from big data research
− Considerable computing capacity and data needed
Machine and deep learning for stope designs [20,21]+ Potential decrease in human workload
− Experimental
Stope-sequencing optimization [22]+ Optimization potential in the execution stage
− Not grasping the full optimization potential by focusing on one small factor
Efficiency of stope optimization algorithms [23]+ Good potential for cooperation with big data and machine learning
− Considerable computing capacity and data needed
Disclaimer/Publisher’s Note: The statements, opinions and data contained in all publications are solely those of the individual author(s) and contributor(s) and not of MDPI and/or the editor(s). MDPI and/or the editor(s) disclaim responsibility for any injury to people or property resulting from any ideas, methods, instructions or products referred to in the content.

