Article

Enhancing Freeway Traffic Capacity: The Impact of Autonomous Vehicle Platooning Intensity

School of Transportation Engineering, Chang’an University, Xi’an 710064, China
*
Author to whom correspondence should be addressed.
Appl. Sci. 2024, 14(4), 1362; https://doi.org/10.3390/app14041362
Submission received: 25 December 2023 / Revised: 2 February 2024 / Accepted: 5 February 2024 / Published: 7 February 2024

Abstract

:
This paper proposes a theoretical model to discuss the capacity of heterogeneous saturated flow. A crucial indicator, platooning intensity, which represents the willingness of connected and autonomous vehicles to form platoons, is taken into consideration. The relationship between platooning intensity and the penetration rate of connected and autonomous vehicles is also evaluated. Numerical analysis is conducted based on relevant parameters, which further improves the proposed theoretical model. Finally, a microscopic simulation is used to verify the accuracy of the proposed model. The results indicate that both the speed and the market penetration rate have a significant impact on capacity; however, the impact is not linear. The slope of the speed-affected curve gradually decreases, whereas the slope of the market penetration rate-affected curve gradually increases. The impact of market penetration rate on theoretical capacity intensifies with the increase in speed. As the number of vehicles within a fleet increase, the weighted average of platooning intensity gradually tends towards the market penetration rate. The formulation offers important insights into traffic performance with heterogeneous flow.

1. Introduction

Compared to human-driven vehicles (HVs), connected and autonomous vehicles (CAVs) are considered to improve traffic capacity due to their superiority, with short headway, quick reaction time, lower error rate, etc. Rapid progress in computing, robotics, and artificial intelligence has made it possible to develop vehicles that are almost ready for road usage. As a result, significant endeavors have been made in the regulatory, legal, and insurance sectors to address the implications of integrating such vehicles into everyday life. However, accurately predicting and understanding the potential impacts of these advancements on transportation supply, mobility, and the demand for these services over time has proven to be a challenging task, making it difficult to develop precise planning tools [1]. On the other hand, the energy drive form is also important. The driving efficiency of electric-driven vehicles is indeed generally higher than that of gas or oil fuel-driven vehicles. However, it is important to note that the production efficiency of electric traction is typically lower compared to gas or oil fuels [2]. When considering the popularity of CAVs, energy consumption and environmental factors should also be taken into consideration. Advances in material and immaterial technologies, such as CAV technology, are enabling the implementation of the Mobility as a Service paradigm, which offers an opportunity to address the mobility challenges related to sustainability [3]. Microscopic simulation is widely used in most studies to investigate the impact of CAV technology on traffic capacity [4,5,6,7,8,9,10,11]. For example, Ref. [9] proposed an agent-based microscopic simulation model to estimate the impacts of AVs on the capacity of a multi-lane highway system. Ref. [12] examined the effect on highway capacity of varying AV market penetrations using microscopic simulation methods. Little theoretical research has been conducted to provide a systematic formulation in a macroscopic way. Refs. [13,14,15] propose a general methodology that combines both empirical experiments and theoretical models to construct a fundamental diagram to reflect the full spectrum of traffic flow characteristics. Investigating the extent to which the network fundamental diagram profile changes based on the control strategy is of significant importance [16]. Ref. [15] also derives the fundamental diagram for mixed HV and CAV traffic, considering the stochastic headway. A few field tests have been conducted recently, providing practical support for theoretical research [17]. The majority of the existing studies conclude that CAVs are beneficial for traffic [5,10,18,19,20,21]. According to research conducted by [5], the capacity of the pipeline undergoes a 90% increase under an all-CAVs scenario compared to an all-HVs scenario. Additionally, Ref. [10] demonstrated that increasing the market penetration rate (MPR) can lead to a reduction in both mean spacing variance and mean speed variance, resulting in decreased congestion duration and improved traffic throughput. However, it is important to note that the increase in road capacity is not always guaranteed with the rise of CAVs. Research by Ref. [22] indicates that in heterogeneous traffic flow, the impact on road capacity is not significant at low penetration rates of CAVs. Refs. [23,24] also show that the increase in delay in the network with the rise in the penetration rate of CAVs can lead to an unstable pattern. As CAVs and HVs are likely to coexist for a significant period, the problem caused by the heterogeneous traffic may be more complex compared to the all-CAVs or all-HVs situations. Therefore, understanding the complexities of this heterogeneous traffic scenario is critical.
The improvement of road traffic capacity with the maturation of CAV technology and increasing penetration rate is a key issue in autonomous vehicle discussions. How road traffic capacity will be improved with the maturity of CAV technology and the gradual increase in penetration rate represent the most important issues when discussing autonomous vehicles. The introduction of information derived or processed by emerging technologies like CAV implies new specifications and the calibration of classical transport user’s behavioral models [25]. A few analytical models and formulations have been developed to study the impacts of the rise in the penetration rate of CAVs on the performance of traffic flow [9,13,23,26,27]. For example, Ref. [13] provides a general theoretical framework to show how traffic operational capacity will change with the introduction of CAVs, where the CAV penetration rate is taken into account as a major factor. The majority of those studies believe that a growth in MPR is beneficial. The longitudinal control models for CAVs have frequently been examined by researchers [8,17,21,24,28,29,30,31,32,33]. The modeling of CAV behaviors often relies on the Intelligent Driver Model (IDM) and its variations. In a study by [8], a modeling framework was proposed that integrates three different car-following models to simulate interactions between vehicles, with the IDM specifically used for CAVs. Furthermore, Ref. [28] utilized the IDM and its modified versions to create a platform for evaluating CAV performance. Longitudinal movements of CAVs are also commonly depicted using Adaptive Cruise Control (ACC) and Cooperative Adaptive Cruise Control (CACC). However, the suitability of the IDM for accurately representing CACC capabilities has been a topic of debate, as discussed by [17]. To address this, the authors developed a CACC vehicle behavior model based on empirical data that accurately represents real-world CACC platoons. Most of the existing studies mainly focus on the influence of the headway settings, MPRs, and car-following models, which are regarded as the most crucial factors to improve road capacity when considering CAVs. Beyond these factors, how CAVs and HVs are clustered or distributed also has a significant impact on the roadway capacity [27,34,35]. Consequently, another crucial factor, platoon intensity, which is not widely discussed, should not be ignored. A few studies focus on this point; Ref. [27] defined the concept of platoon intensity and quantified it with certain calibration formulae. However, in most studies, the factor of platoon intensity is regarded as an independent variable that is not affected by other factors. This paper takes this crucial factor together with the MPR into consideration when modeling heterogeneous traffic. Not only the influence of platoon intensity, but also the relationship between platooning intensity and MPR, is evaluated through both numerical analysis and experimental validation. The main contribution of this study is that it reveals the intrinsic relationship between MPR and platooning intensity, which has always been ignored by other studies. On this basis, an improved formula is proposed to calculate the maximum theoretical capacity of mixed flows, taking into account the platooning intensity of CAVs.
The remaining sections of this paper are structured as follows. Section 2 presents the proposed theoretical model, providing a detailed explanation of its underlying principles and framework. In Section 3, a numerical analysis is conducted to assess the validity of the proposed theoretical model. The obtained results are compared with findings from the existing literature to evaluate the model’s accuracy. Additionally, this section explores the potential relationship between MPR and platooning intensity. Section 4 introduces a case study designed to further validate the numerical analysis results. This case study utilizes a SUMO (version1.10.0) simulation-based approach to examine the maximum theoretical capacity under various CAV penetration rates and speeds. Finally, the paper concludes in the last section (Section 5), summarizing the key findings and contributions of the study.

2. Conceptual Framework

2.1. Basic Capacity Model

The maximum throughput or capacity Q can be represented by the average of gross headway, as in Equation (1),
Q = 1 h t ¯
As there are different headways in heterogeneous flow, the average of all the gross headways h t ¯ can be represented as Equation (2), where m represents the total number of types of different time headways, h t j represents the time headway of the j set of vehicles, and P j represents the percentage of the j set of vehicles.
h t ¯ = j = 1 m P j h t j
Hence, Equation (1) can be rewritten as in Equation (3),
Q = 1 h t ¯ = 1 j = 1 m P j h t j

2.2. Headway Consideration

The time headway can be formulated as in Equation (4), where h d represents the distance headway and v represents the speed limit in an equilibrious traffic flow.
h t = h d v
In line with previous research [4], to ensure safety, the distance headway of a set of vehicles (j) can be determined using Equation (5), taking into account various factors. These factors include the speed of the leading vehicle v l e a d , the speed of the following vehicle v f o l l o w , the deceleration of the leading vehicle b l e a d , the deceleration of the following vehicle b f o l l o w , the length of the leading vehicle h l e a d , the measurement error of position h e r r o r , the safety buffer distance that the driver maintains from the leading vehicle after braking h b u f f e r , and the reaction time of the j set of vehicles τ j . When considering these parameters, Equation (5) formulates the appropriate distance headway for ensuring safety between vehicles in the j set.
h d j = v f o l l o w 2 2 b f o l l o w + v f o l l o w τ j v l e a d 2 2 b l e a d + h b u f f e r + h e r r o r + h l e a d
Equation (5) seeks to show the relative safety condition according to which the braking distance of the following vehicle does not exceed the distance from the rear of the leading vehicle after braking.

2.3. Platooning Intensity with Market Penetration Rate

Due to the presence of heterogeneous traffic flow, different car-following behaviors can occur. To simplify this problem, we consider two specific types of vehicles: CAVs and HVs. In this scenario, there are four types of potential car-following behaviors corresponding to four types of time headways, h C C , h C H , h H C , and h H H , as illustrated in Figure 1, where h C C represents a CAV following another CAV; h C H represents a CAV following an HV; h H C represents an HV following a CAV, and h H H represents an HV following another HV.
Here, N represents the total number of vehicles on the road, N C represents the total number of CAVs on the road, and N H represents the total number of HVs on the road. The MPR is represented by Equation (6),
P C = N C N
Another crucial indicator, platooning intensity, P C C , is proposed to represent the willingness of CAVs to form platoons [36], where N C C represents the number of CAVs following another CAV.
P C C = N C C N C
From all the possibilities of car-following behaviors, we derive three weights: P C P C C , P C 1 P C C , and 1 P C . These weights represent the probability of a CAV following another CAV, a CAV following another HV, and HVs following another vehicle regardless of the type, respectively. These weights can be combined into Equation (8).
P = P C + 1 P C = P C P C C + P C 1 P C C + 1 P C = 1
The term N N C C is proposed to reflect the number of all possible scenarios for each N C C that may occur, and is formulated in Equation (9). It is mainly obtained through the permutation and combination method. It should be mentioned that all the scenarios that may occur are assumed to show equal probability.
N N C C = C N H + 1 N C N C C × C N C 1 N C C
Given a certain MPR and n , we derive N C C ( N C C 0 , N C 1 ,   N C C N ) , which occurs with possibility P N C C , as formulated in Equation (10), where N C C N C N H due to the inherent relationship between P C C and P C . Here, n is the number of vehicles in the fleet.
P N C C = F P c , n = N ( N C C ) N
The weighted average of platoon intensity P C C ¯ can be formulated by the sum of each P C C times its possibility P N C C .
When N C N H ,
P C C ¯ = 0 N C 1 P C C × P ( N C C )
1 P C C ¯ = 0 N C 1 ( 1 P C C ) × P ( N C C )
when N C > N H ,
P C C ¯ = N C N h N C 1 P C C × P ( N C C )
1 P C C ¯ = N C N h N C 1 ( 1 P C C ) × P ( N C C )

2.4. Theoretical Capacity with Mixed Flow

By integrating Equations (4) and (5) into Equation (3), we derive:
Q = 1 h t ¯ = 1 j m P j h d j v j = 1 j m P j v f o l l o w 2 2 b f o l l o w + v f o l l o w τ j v f o l l o w 2 2 b f o l l o w + h b u f f e r + h e r r o r + h l e a d v j
As mentioned before, there are four types of car-following behaviors in the mixed flow, which leads to four sets of h d j and P j . Since HVs cannot receive information from the leading CAV, and in most previous studies the values selected for τ H C and τ H H are the same, we assume that h H = h H C = h H H . Considering Equation (8), Equation (15) can be rewritten as in Equation (16).
Q = 1 τ C C P c P c c ¯ + τ C H P c ( 1 P c c ) ¯ + τ H ( 1 P c ) + h b u f f e r + h e r r o r + h l e a d v
For a given P C , by integrating Equations (11)–(14) into Equation (16), we derive Equation (17),
Q = 1 τ C C P c i = 0 m P c c × P N c c + τ C H P c i = 0 m 1 P c c × P N c c + τ H ( 1 P c ) + h b u f f e r + h e r r o r + h l e a d v
Consequently, Equation (17) is used to calculate the maximum theoretical capacity of mixed flow, which takes the CAV platooning intensity into consideration.

3. Numerical Analysis

3.1. Literature Review of Reaction Time Selection

Research has emphasized the faster reaction time and shorter time headway of CAVs as a significant factor in increasing highway capacity. In accordance with [18], it is suggested that with the advancement of CAV technologies, it becomes feasible to achieve a time gap of 0.5 s between vehicles. This reduced time gap has the potential to significantly reduce network delays, as demonstrated in simulation studies. However, there are opposing opinions, with some studies suggesting that CAVs should maintain a greater distance to ensure safety [7]. The latest experiment conducted at the California PATH showed that vehicles in platoons can maintain a time gap as small as 0.6 s, compared to 1.5 s for conventional non-automated vehicles [17]. In contrast, the 0.6 s time gap is generally associated with aggressive driving behavior, as opposed to the average 1.5 s time gap observed among human drivers. This implies that human drivers tend to maintain a greater time gap between vehicles for safety purposes, whereas the smaller 0.6 s time gap is more commonly seen during aggressive driving maneuvers. Aside from value selection, headway distribution is also widely studied [20,35,37]. For example, [20] reviewed the typical headway distributions resulting from different car-following types within heterogeneous traffic. CAVs can effectively increase traffic capacity due to their shorter time headway. In summary, the method and related reaction time parameters cited in the previous studies are summarized in Table 1. It also demonstrates the most common modes of utilizing simulation methodologies when investigating mixed traffic scenarios.

3.2. Parameters for CAVs and HVs

In general, parameters need to be calibrated using real data. However, due to the current situation, it is not possible to calibrate the parameters required for experiments based on actual traffic conditions. Consequently, several parameters are derived from previous studies to simulate the real vehicle situation. The dynamic performances of CAVs and HVs are assumed to be the same in this study, and the main difference lies in the reaction time. The study assumes that the CAVs are equipped with 100% fully connected communication devices, allowing seamless communication between vehicles. This enables the CAVs to cruise with constant headways, ensuring string stability. Additionally, the study assumes ideal communication conditions, without any packet drops or communication delays. Furthermore, the analysis considers a level terrain and excludes the presence of heavy vehicles. All vehicles are assumed to maintain the same size, with a length of 4.5 m. The parameters used in the numerical analysis are listed in Table 2.

3.3. Numerical Analysis of Mixed Flow

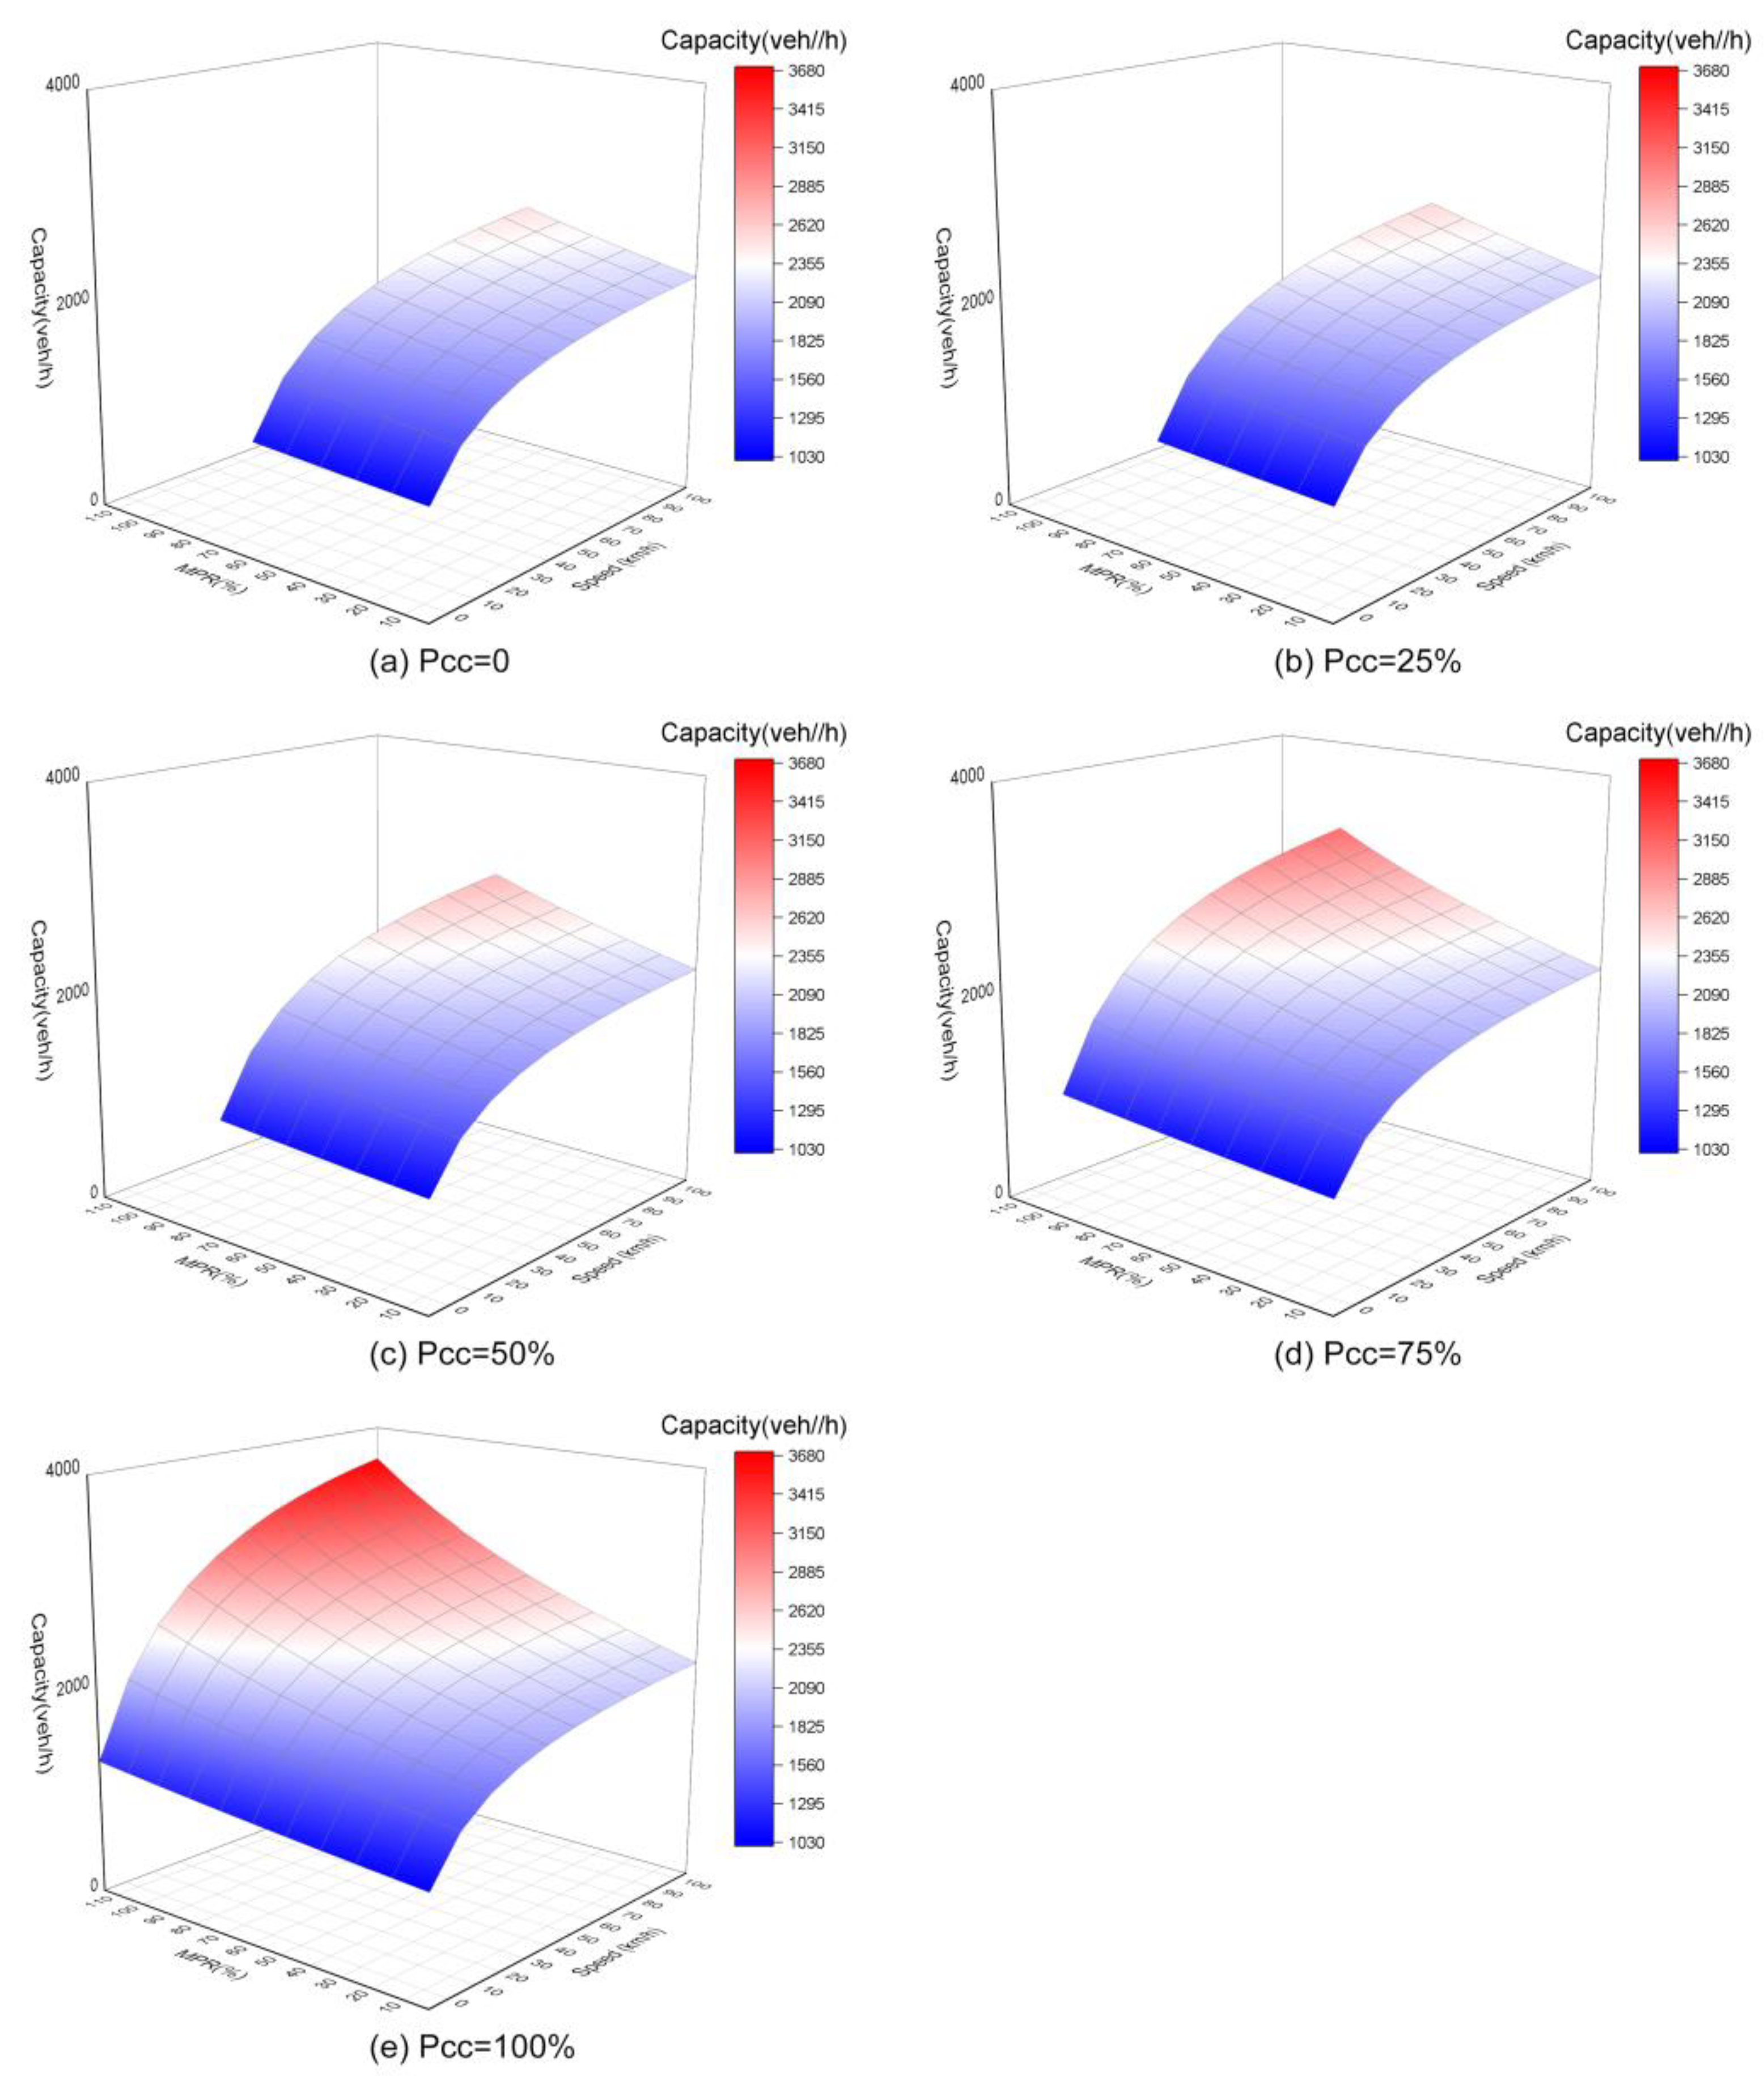
Using Equation (17) and the identified parameters, the maximum theoretical capacity of mixed flow with different degrees of platooning intensity can be further calculated, as shown in Figure 2a–e. It can be seen from Figure 2a that the maximum capacity is positively correlated with MPR, speed, and platooning intensity. The capacity reaches its highest value when both MPR and speed are at their maximum. This trend becomes even more pronounced in Figure 2b–e. It should be pointed out that the platooning intensity P C C is assumed to have a fixed value in each situation. The different colors of mesh surfaces represent the changes in the theoretical capacity. Under the same MPR, the higher the platooning intensity, the higher the achievable capacity. Mesh surfaces with different values of P C C shrink with the reduction in this value. This is because of the inherent relationship between P C C and P C . When the MPR is less than 50%, P C C can take any value in the range [0, 1] because any CAV can always find a CAV or HV to follow when there are fewer CAVs than HVs in a fleet. However, when the MPR exceeds 50%, the value of P C C should be larger than 2 1 / P C because there are not enough HVs for all the CAVs to choose to follow in this condition, indicating a minimum threshold for P C C . In Figure 2e, it can be observed that the theoretical capacity of mixed flow can reach 3673 veh/h when the market penetration rate reaches 100% and the speed reaches 110 km/h. This condition is considered the most favorable.
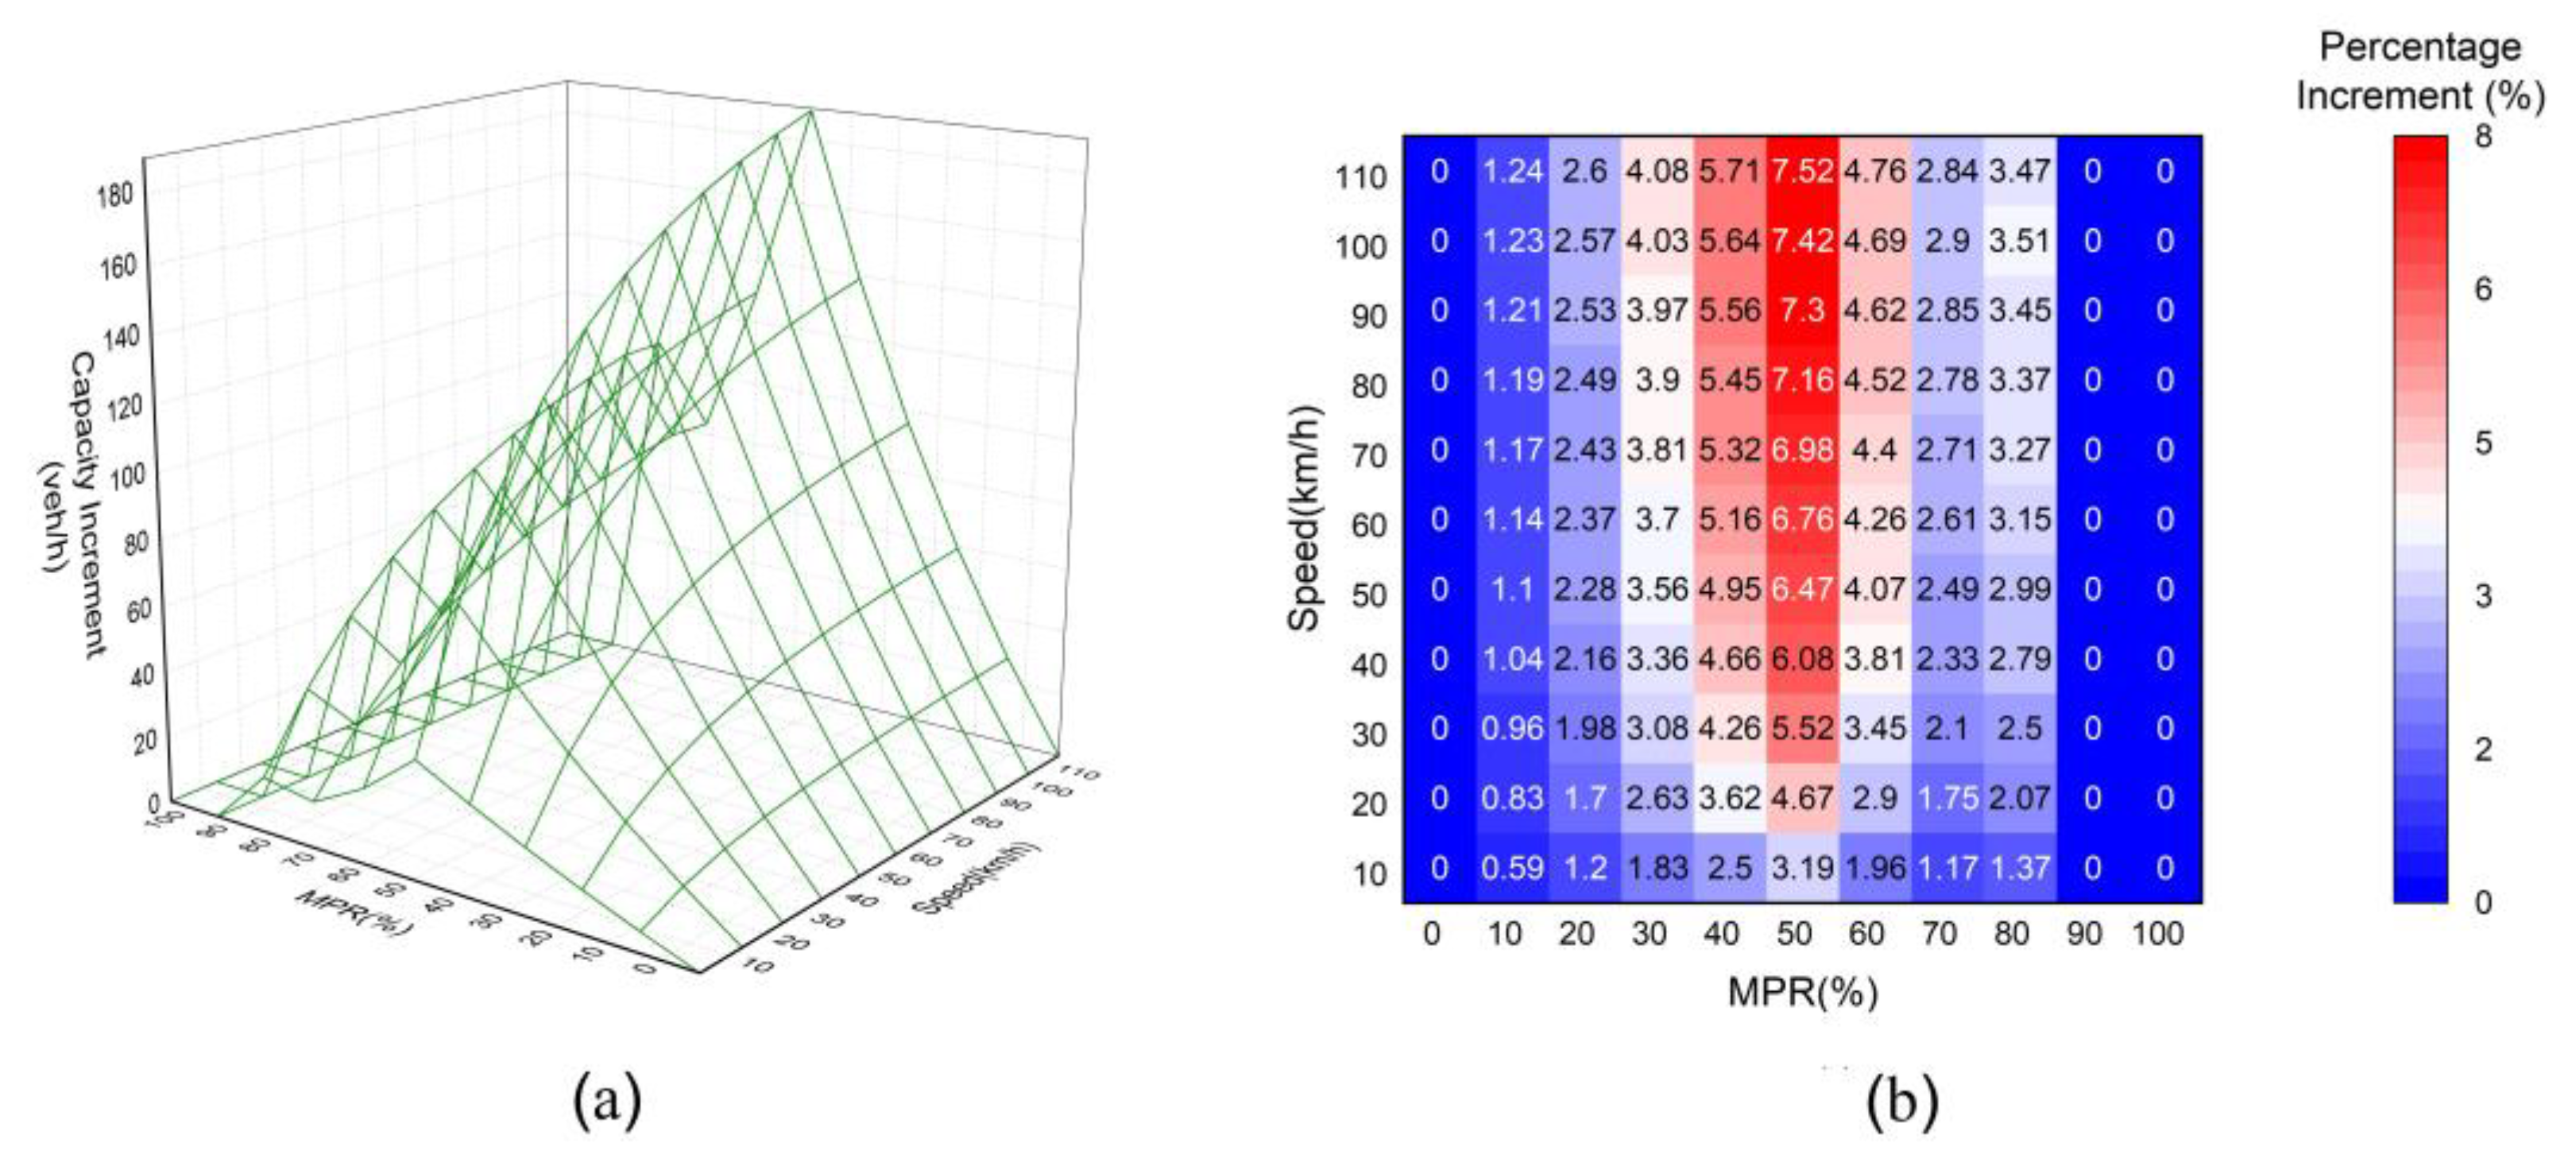
The increase in capacity between the maximum P C C and minimum P C C is shown in Figure 3a; the percentage increment is also shown in Figure 3b. It can be seen that P C C has a significant impact on capacity, especially when the MPR is approximately 50%. When the speed reaches its maximum value and the MPR is around 50%, the increment percentage reaches its peak at 7.52%. Consequently, the capacity reaches its theoretical maximum value when MPR approaches 100%. However, the capacity increment reaches its maximum value when the MPR approaches 50%. It should be mentioned that the numerical variation is not linear in Figure 3a, which is also reflected in Figure 3b. This is because of the insufficient precision of the selection of values. However, this error can be corrected by applying finer precision.
As proven above, for a given P C , the desired value of P C C can be calculated using Equation (10), and P N C C is a function of P C and n . We try to determine the relationship between P C , P C C , and n through numerical analysis.
Table 3 shows the value of the weighted average of platoon intensity P C C × P ( N C C ) with different values of MPR and n . It can be seen that as n increases, the weighted average of platoon intensity P C C × P ( N C C ) gradually approaches P C and the term ( 1 P C C ) × P ( N C C ) gradually approaches 1 P C . Consequently, Equation (17) can be reformulated as Equation (18) when n is relatively large. Equation (18) can also be rewritten as Equation (19). It should be pointed out that n , which represents the total number of vehicles in the fleet, is only analyzed here as a theoretical value. Due to the complexity of the calculation, n is only calculated up to a value of 150. The value of n cannot be too large in real scenarios due to technical and personnel reasons.
Q = 1 P c P c h C C + P c ( 1 P c ) h C H + ( 1 P c ) h H
Q = 1 τ C C P C P C + τ C H P C ( 1 P C ) + τ H ( 1 P C ) + h b u f f e r + h e r r o r + h l e a d v
Consequently, the theoretical capacity achieved with different MPR values and speeds can be calculated and is shown in Figure 4. It can be seen that both speed and MPR have a significant impact on capacity. The impact of MPR on theoretical capacity intensifies with increasing speed. For example, when the speed limit is 110 km/h, the incremental percentage of capacity from 0%MPR to 100%MPR is 71.4%, while when the speed limit is 10, the incremental percentage of capacity reduces to only 25.2%. Similarly, the impact of speed on theoretical capacity also intensifies with the increasing MPR. When the MPR is 100%, the incremental percentage of capacity from 10 km/h to 110 km/h is 184%, while when the MPR is 0, the incremental percentage of capacity reduces to 107%. However, both the impacts are not linear. Similar to the results shown in Section 3.3, the slope of the speed-affected curve gradually decreases, whereas the slope of the MPR-affected curve gradually increases, revealing the different effects of speed and MPR on capacity. Compared with speed, MPR has a more profound impact on capacity in the manner theorized.

4. Case Study

SUMO simulation is used to verify the accuracy of the model proposed in Section 3.

4.1. Overview of Simulation

A simulation scenario has been developed for a single-lane road, which consists of a warm section, main body, and a finishing section as shown in Figure 5. The simulated road section is an idealized single-lane straight section with a length of 2000 m, including a warm section of 200 m and a finishing section of 100 m. The simulated vehicles will be generated at the very beginning of the warm section, go through the main body, and finally leave the road at the end of the finishing section. When the flow is saturated, the demand is equal or slightly larger than the supply. In this research, demand is set as 4000, which is slightly higher than the maximum theoretical capacity under beat condition, 3673 veh/h. As previously discussed, the theoretical capacity of the road significantly increases with changes in the MPR, while the free-flow speed also plays a crucial role in determining the theoretical capacity. Therefore, in order to verify the rationality of the proposed theoretical model, both the MPR and the free-flow speed are considered in this evaluation. The MPR ranges from 0% to 100% with a 10% interval, while the speed ranges from 10 km/h to 110 km/h with a 10 km/h interval. The variable speed is set as the limit speed in this model and each vehicle is allowed to travel at the expected maximum speed. By combining these two variables, the capacity of the single-lane road will be assessed.

4.2. Simulation Framework and the Selection of Parameters

“Simulation of Urban Mobility” (SUMO) is an open-source, portable, and comprehensive traffic simulation package specifically designed for handling large-scale networks. It operates at a microscopic level, meaning it considers individual vehicles and their interactions in great detail. SUMO is capable of simulating various modes of transportation, including pedestrians, and provides a wide range of tools for creating complex scenarios. Its flexibility and extensive feature set make it an invaluable tool for researchers and practitioners involved in urban mobility simulations. SUMO has been used in this study because it runs fast and it is portable. The software can be run from the command line, which increases the execution speed by leaving out slow visualization. Also, it allows the use of faster data structures, each adjusted to the current purpose, instead of using complicated and ballast-loaded ones.
In this simulation framework, the choice of proper vehicle-following models for CAVs and HVs is one of the most important elements. The variations in car-following models play a significant role in the diverse outcomes predicted in previous studies regarding the impact of CAVs on traffic flow. The behavior of CAVs in car-following models is an area that is still undergoing development and refinement, and as a result, these models are not yet fully mature. The ongoing advancements and research in this field aim to improve the accuracy and reliability of car-following models for CAVs, which will ultimately lead to a better understanding of their effects on traffic flow. Most studies only simulate CAV by reducing the reaction time of the car-following models, regardless of the other properties of CAVs. Accurate models of the dynamic responses of these systems are needed to produce realistic predictions of their effects on capacity and traffic flow dynamics. Cooperative Adaptive Cruise Control (CACC) car-following models are always used to model the longitudinal control systems of CAV. A state-of-the-art model that has been calibrated on real experimental data was chosen to simulate CAVs in this study [14], and the default Krauss model is used as the car-following model of HVs.

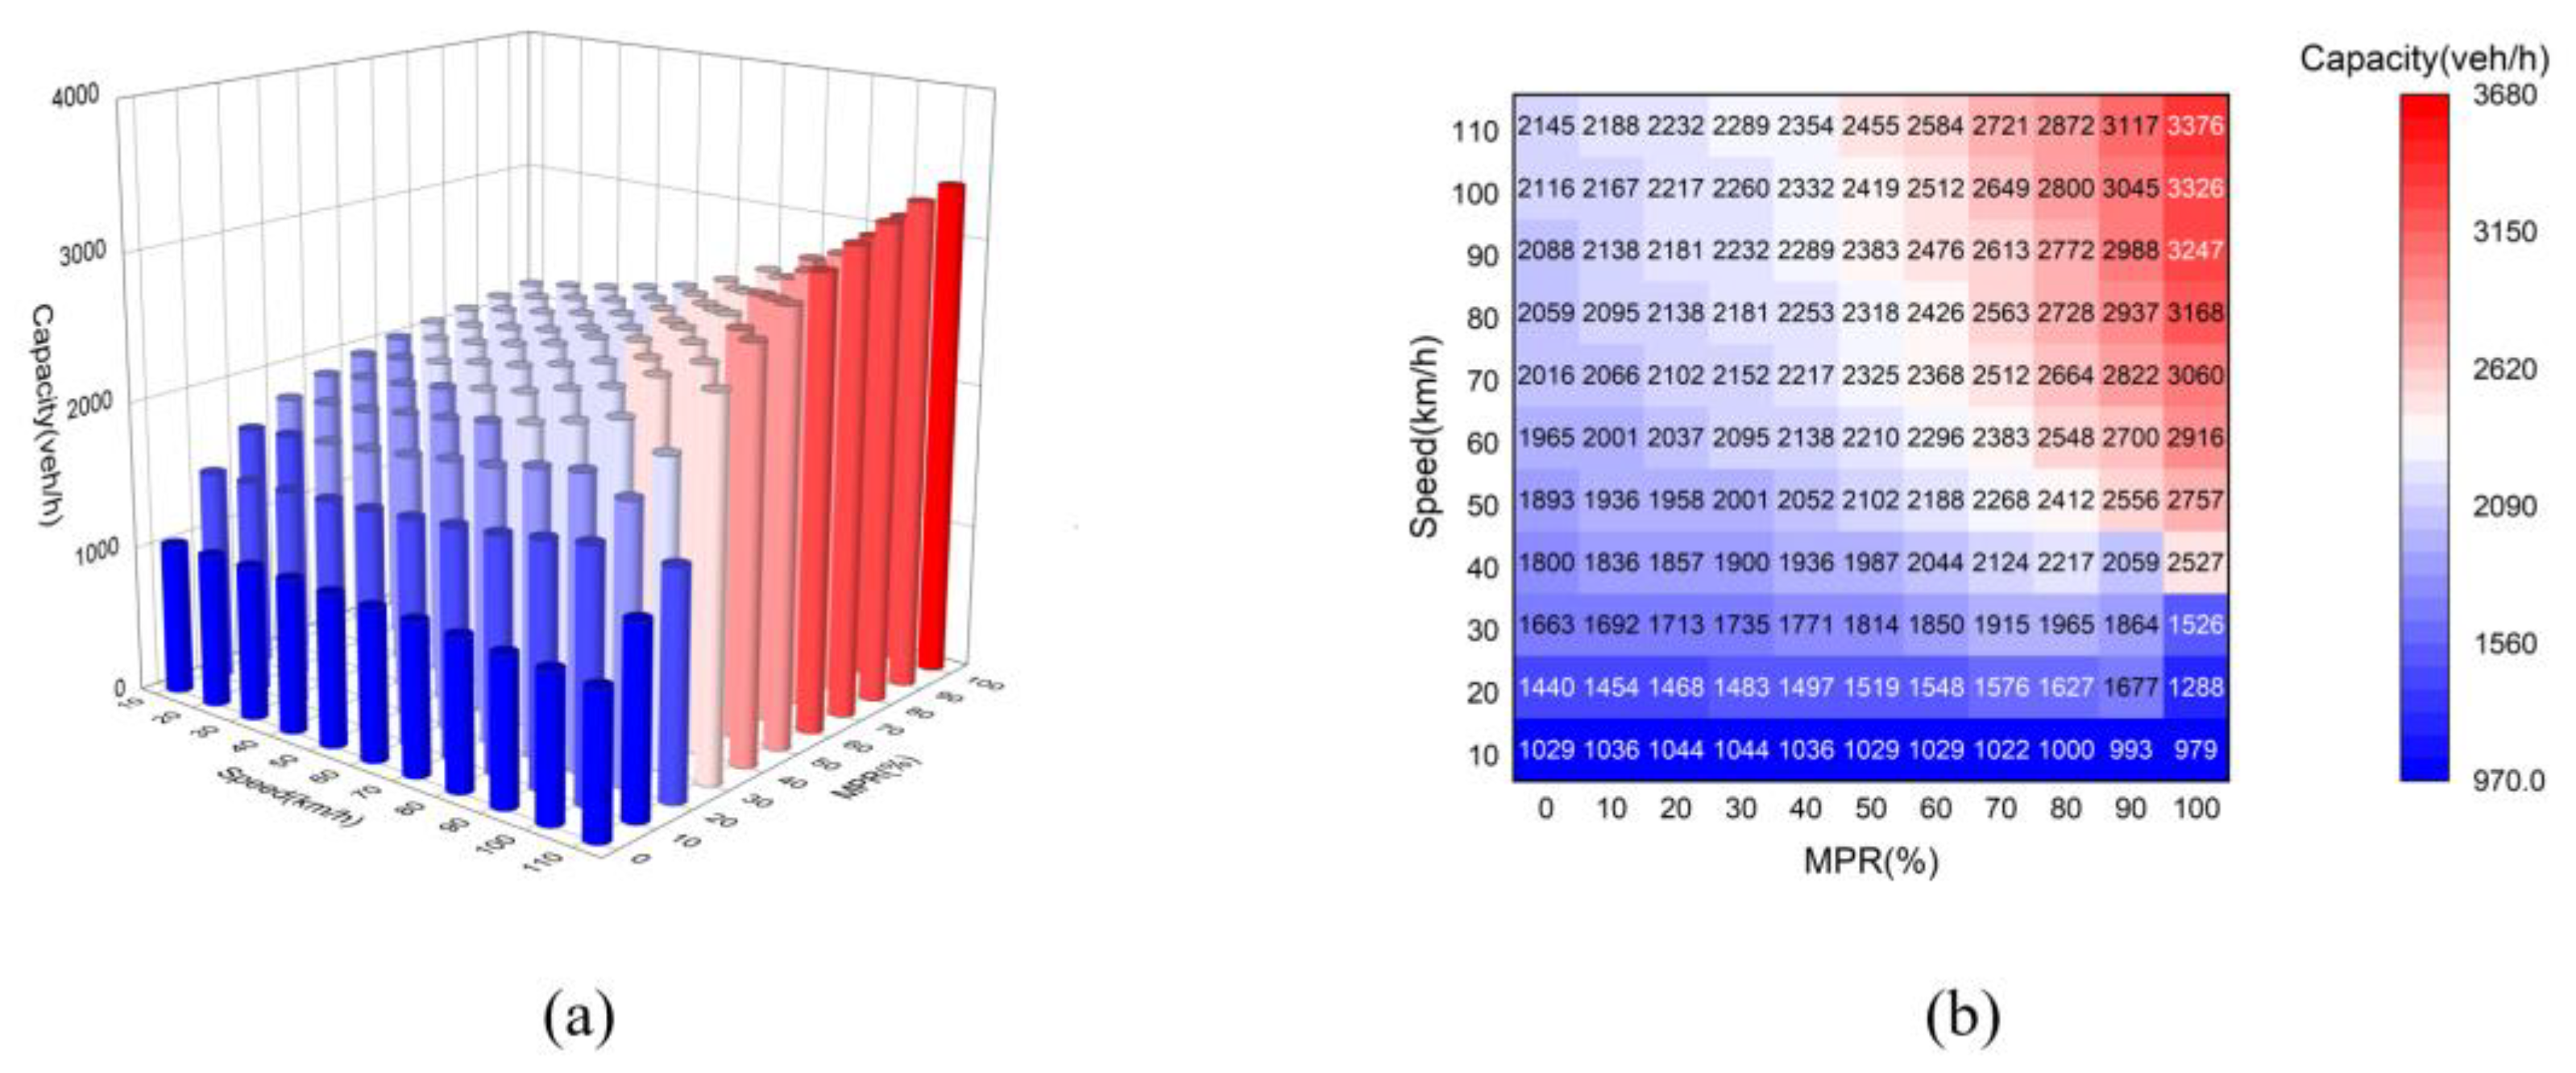
4.3. Simulation Result

The simulation result is shown in Figure 6. The capacity of mixed flow reaches the highest value, 3376 veh/h, when both MPR and speed reach their maximum. The impact of MPR on capacity intensifies with the increase in speed. When the speed limit is 110 km/h, the incremental percentage of capacity from 0%MPR to 100%MPR is 57.4%, while when the speed limit is 10, the capacity is slightly decreased. This is mostly because of the vehicle parameter settings of the simulation and the random uncertainties. For example, some vehicles are not always configured with minimum following distances and may undergo randomized slowdowns to improve the authenticity of the simulation. Another possible reason is the influence of the car-following model, which will be verified in the next section. Similarly, the impact of speed on capacity also intensifies with the increase in MPR. When the MPR is 100%, the incremental percentage of capacity from 10 km/h to 110 km/h is 245%, while when the MPR is 0, the incremental percentage of capacity reduces to 108%. Similar to the result of the numerical analysis, both the impacts are not linear. The slope of the speed-affected curve gradually decreases, whereas the slope of the MPR-affected curve gradually increases, revealing the different effects of speed and MPR on capacity. This can also be observed from the capacity in Equation (19). By deriving the derivatives of velocity and MPR separately, it can be seen that capacity is a concave function with respect to velocity and a convex function with respect to MPR. Consequently, MPR has the dominant impact on capacity compared to speed.
The capacity simulation results, together with the formulated theoretical results, are shown in Figure 7. The red mesh represents the formulated theoretical capacity, whereas the green mesh represents the simulated results for capacity. The simulated result basically reflects the changes in the formulated theoretical capacity, although there are some discrepancies. The percentage of differences are also shown in Figure 7b. Except for very few spots, the majority of the grid has percentage differences below 10%. Samples with errors of less than 10% account for over 89.2% of the data, while samples with errors between 10% and 25% account for 8.3%. There are only three special values with larger errors, namely 24.4%, 35.56%, and 38.11%. The likely reason for the spots with larger errors is the influence of the selected car-following models. The simple car-following model used in this study was derived from a previous experiment conducted to represent the production ACC and the new CACC in microscopic simulations of their impacts on traffic flow dynamics. Its calculated value at low speed with a high penetration rate may have errors. Regarding small errors over large areas, the main reason for the error lies in the vehicle parameter settings of the simulation and the random uncertainties mentioned earlier. The theoretical model assumes perfect conditions, while the simulator considers the errors present in real situations, resulting in slightly lower values compared to the theoretical predictions. Considering the factors mentioned before, the simulated results are basically consistent with the theoretical values, which proves the rationality of the proposed theoretical model.

4.4. Simulation Validation

In order to validate the simulation result, the traffic data generated by the simulation were compared to the data taken from previous research and the latest version of the Highway Capacity Manual as shown in Table 4.
Most studies have implemented speed limit conditions, except for Ref. [36], which solely focuses on analyzing theoretical capacity based on headway without setting speed limits. Furthermore, this particular study solely conducted numerical analyses without incorporating any simulations. As for the scenarios, one lane is designated as a regular lane, while the other lane is exclusively dedicated to CAVs, which may result in significant differences in traffic under different MPRs. Consequently, when MPR is relatively large or small, the errors in the results are relatively significant.
In the simulation scenario of Ref. [19], two out of four lanes are closed due to an incident at the downstream section, resulting in a large number of lane changes. Consequently, their flow calculation result is much smaller than our result.
According to the HCM, at a speed limit of 80 km/h, 90 km/h, and 100 km/h, the average flow rate for a single lane is around 1994 veh/h, 2119 veh/h, and 2200 veh/h, respectively. The results align closely with our simulated values, with an error margin of less than 6%.
In general, the scenarios in previous studies differ from each other and may not be directly comparable to our research. However, regardless of the involvement of CAVs, the disparity between our simulated values and the results obtained in other studies is minimal and falls within a reasonable range. This observation further substantiates the validity of our data.

5. Conclusions

This paper proposes a theoretical model to discuss the capacity of heterogeneous saturated flow. The platooning intensity, which represents the willingness of connected and autonomous vehicles to form platoons, has been taken into consideration. The relationship between platooning intensity and CAVs penetration rate was evaluated by considering the number of vehicles in the fleet. Numerical analysis was conducted, which further improved the proposed theoretical model. Finally, microscopic simulation has been used to verify the accuracy of the proposed model. The simulated outcomes closely align with the theoretical predictions, providing compelling evidence for the soundness of the proposed theoretical model.
The primary contribution of this study is that it reveals the intrinsic relationship between MPR and platooning intensity. On this basis, an improved formula has been given that enables the calculation of the maximum theoretical capacity of mixed flow, accounting for the platooning intensity of CAVs. An additional interesting finding has emerged, showing that as the number of vehicles within a fleet increased, the weighted average of the platoon intensity gradually converged towards the market penetration rate (MPR). The formulation has provided valuable insights into traffic performance within a heterogeneous flow context. Both speed and MPR have exhibited significant impacts on capacity; however, these impacts were non-linear. Specifically, the slope of the speed-affected curve gradually decreased, while the slope of the MPR-affected curve gradually increased. Moreover, the influence of MPR on theoretical capacity intensified with increasing speed.
In our study, we primarily focus on the impact of connected and autonomous vehicles (CAVs) on platooning behavior and capacity. However, we acknowledge that user behavior, including drivers of traditional vehicles, plays a significant role in maintaining appropriate headway. Respecting the desired headway for users driving traditional vehicles relies on a combination of factors, including traffic regulations, driver awareness, and individual driving habits. While our methodology assumes a certain level of compliance with headway requirements, it is important to note that actual user behavior may vary. To address this aspect, it is better to emphasize the need to consider user behavior and its potential influence on headway compliance. Furthermore, it would be useful to discuss the importance of traffic education, enforcement of traffic regulations, and public awareness campaigns to encourage responsible driving practices that promote safe and efficient headway management.
Policy implications derived from this study provide valuable guidance to decision makers and transport providers. These include incorporating infrastructure elements for CAVs, implementing adaptive traffic management systems, establishing comprehensive regulatory frameworks, prioritizing public engagement and education, fostering collaboration among stakeholders, and developing robust data management practices. Decision makers should consider these implications to create efficient, sustainable, and safe transportation systems that leverage the potential of CAV technology. This involves integrating dedicated lanes and communication infrastructure, optimizing signal timings and lane assignments, addressing safety and privacy through regulations, raising public awareness and trust, promoting collaboration, and implementing responsible data collection and usage practices. By considering these policy implications, decision makers can drive innovation and make informed choices to enhance transportation networks.
Traffic capacity has been analyzed from both macroscopic and microscopic perspectives in this study. The findings presented in this paper significantly contribute to the comprehension of the effects of CAV maneuvers on traffic flow. However, there are several areas of potential expansion that should be considered in future research. Firstly, the evaluation of the relationship between the platooning intensity and CAV market penetration rate does not take into account the maximum platoon size. Although this theoretical analysis allows for a potentially large platoon size, it is crucial to consider the upper platoon size limitation under real-world conditions. Secondly, the research focuses on examining the impact of CAV technology on traffic flow and capacity under stable flow conditions, while ignoring the situation under unstable flow conditions. The methodology used in the study did not explicitly analyze stable and unstable traffic flow conditions separately, which should be improved in the future. Additionally, this study primarily focuses on the longitudinal behaviors of heterogeneous traffic and examines CAV operations on a one-lane freeway, neglecting lateral interactions between vehicles. Moreover, specific details of the platooning process, such as merging or splitting, which may necessitate additional spacing, are not incorporated. Therefore, it is worth further investigating the inclusion of a lane-change model, alongside the merging and splitting processes. Furthermore, the model employed for the two types of vehicles in this research has been used without calibration due to limitations in terms of both capability and qualification under current conditions. Another crucial point is to consider other power sources for CAV or transport vehicle configurations and alternative configurations of transport vehicles. This will open up opportunities for exploring the performance, efficiency, and environmental impact of these alternative options. Addressing these limitations in future research is essential to draw more accurate conclusions.

Author Contributions

Conceptualization, Q.C. and H.C.; methodology, Q.C.; software, Q.C.; validation, Q.C. and H.C.; formal analysis, H.C.; investigation, H.C.; resources, Q.C.; data curation, Q.C.; writing—original draft preparation, Q.C.; writing—review and editing, Q.C.; visualization, Q.C.; supervision, H.C.; project administration, H.C. All authors have read and agreed to the published version of the manuscript.

Funding

This research received no external funding.

Institutional Review Board Statement

Not applicable.

Informed Consent Statement

Not applicable.

Data Availability Statement

The data used to support the findings of this study are available from the corresponding author upon request.

Conflicts of Interest

The authors declare that they have no conflicts of interest.

References

  1. Mahmassani, H.S. 50th Anniversary Invited Article—Autonomous Vehicles and Connected Vehicle Systems: Flow and Operations Considerations. Transp. Sci. 2016, 50, 1140–1162. [Google Scholar] [CrossRef]
  2. Skrúcaný, T.; Milojević, S.; Semanová, Š.; Čechovič, T.; Figlus, T.; Synák, F. The Energy Efficiency of Electric Energy as a Traction Used in Transport. Transp. Tech. Technol. 2018, 14, 9–14. [Google Scholar] [CrossRef]
  3. Rindone, C. Sustainable Mobility as a Service: Supply Analysis and Test Cases. Information 2022, 13, 351. [Google Scholar] [CrossRef]
  4. Li, T.; Guo, F.; Krishnan, R.; Sivakumar, A.; Polak, J. Right-of-way reallocation for mixed flow of autonomous vehicles and human driven vehicles. Transp. Res. Part C Emerg. Technol. 2020, 115, 102630. [Google Scholar] [CrossRef]
  5. Liu, H.; Kan, X.; Shladover, S.E.; Lu, X.-Y.; Ferlis, R.E. Modeling impacts of Cooperative Adaptive Cruise Control on mixed traffic flow in multi-lane freeway facilities. Transp. Res. Part C Emerg. Technol. 2018, 95, 261–279. [Google Scholar] [CrossRef]
  6. Roncoli, C.; Papamichail, I.; Papageorgiou, M. Model Predictive Control for Motorway Traffic with Mixed Manual and VACS-equipped Vehicles. Transp. Res. Procedia 2015, 10, 452–461. [Google Scholar] [CrossRef]
  7. Martin-Gasulla, M.; Sukennik, P.; Lohmiller, J. Investigation of the Impact on Throughput of Connected Autonomous Vehicles with Headway Based on the Leading Vehicle Type. Transp. Res. Rec. J. Transp. Res. Board 2019, 2673, 617–626. [Google Scholar] [CrossRef]
  8. Talebpour, A.; Mahmassani, H.S. Influence of connected and autonomous vehicles on traffic flow stability and throughput. Transp. Res. Part C Emerg. Technol. 2016, 71, 143–163. [Google Scholar] [CrossRef]
  9. Arnaout, G.M.; Arnaout, J.-P. Exploring the effects of cooperative adaptive cruise control on highway traffic flow using microscopic traffic simulation. Transp. Plan. Technol. 2014, 37, 186–199. [Google Scholar] [CrossRef]
  10. Zheng, F.; Liu, C.; Liu, X.; Jabari, S.E.; Lu, L. Analyzing the impact of automated vehicles on uncertainty and stability of the mixed traffic flow. Transp. Res. Part C Emerg. Technol. 2020, 112, 203–219. [Google Scholar] [CrossRef]
  11. Jerath, K.; Brennan, S.N. Analytical Prediction of Self-Organized Traffic Jams as a Function of Increasing ACC Penetration. IEEE Trans. Intell. Transp. Syst. 2012, 13, 1782–1791. [Google Scholar] [CrossRef]
  12. Shladover, S.E.; Su, D.Y.; Lu, X.Y. Impacts of Cooperative Adaptive Cruise Control on Freeway Traffic Flow. Transp. Res. Rec. 2012, 2324, 63–70. [Google Scholar] [CrossRef]
  13. Chen, D.; Ahn, S.; Chitturi, M.; Noyce, D.A. Towards vehicle automation: Roadway capacity formulation for traffic mixed with regular and automated vehicles. Transp. Res. Part B Methodol. 2017, 100, 196–221. [Google Scholar] [CrossRef]
  14. Shi, X.; Li, X. Constructing a fundamental diagram for traffic flow with automated vehicles: Methodology and demonstration. Transp. Res. Part B Methodol. 2021, 150, 279–292. [Google Scholar] [CrossRef]
  15. Zhou, J.; Zhu, F. Modeling the fundamental diagram of mixed human-driven and connected automated vehicles. Transp. Res. Part C Emerg. Technol. 2020, 115, 102614. [Google Scholar] [CrossRef]
  16. Alonso, B.; Pòrtilla, Á.I.; Musolino, G.; Rindone, C.; Vitetta, A. Network Fundamental Diagram (NFD) and traffic signal control: First empirical evidences from the city of Santander. Transp. Res. Procedia 2017, 27, 27–34. [Google Scholar] [CrossRef]
  17. Milanés, V.; Shladover, S.E. Modeling cooperative and autonomous adaptive cruise control dynamic responses using experimental data. Transp. Res. Part C Emerg. Technol. 2014, 48, 285–300. [Google Scholar] [CrossRef]
  18. Wagner, P. Traffic Control and Traffic Management in a Transportation System with Autonomous Vehicles. In Autonomous Driving; Springer: Berlin/Heidelberg, Germany, 2016; pp. 301–316. [Google Scholar] [CrossRef]
  19. Khattak, Z.H.; Smith, B.L.; Park, H.; Fontaine, M.D. Cooperative lane control application for fully connected and automated vehicles at multilane freeways. Transp. Res. Part C Emerg. Technol. 2020, 111, 294–317. [Google Scholar] [CrossRef]
  20. Ghiasi, A.; Li, X.; Ma, J. A mixed traffic speed harmonization model with connected autonomous vehicles. Transp. Res. Part C Emerg. Technol. 2019, 104, 210–233. [Google Scholar] [CrossRef]
  21. van Arem, B.; van Driel, C.J.G.; Visser, R. The Impact of Cooperative Adaptive Cruise Control on Traffic-Flow Characteristics. IEEE Trans. Intell. Transp. Syst. 2006, 7, 429–436. [Google Scholar] [CrossRef]
  22. Ye, L.; Yamamoto, T. Modeling connected and autonomous vehicles in heterogeneous traffic flow. Phys. A Stat. Mech. Its Appl. 2018, 490, 269–277. [Google Scholar] [CrossRef]
  23. Amirgholy, M.; Shahabi, M.; Oliver Gao, H. Traffic automation and lane management for communicant, autonomous, and human-driven vehicles. Transp. Res. Part C Emerg. Technol. 2020, 111, 477–495. [Google Scholar] [CrossRef]
  24. Xiao, L.; Gao, F. Practical String Stability of Platoon of Adaptive Cruise Control Vehicles. IEEE Trans. Intell. Transp. Syst. 2011, 12, 1184–1194. [Google Scholar] [CrossRef]
  25. Russo, F.; Rindone, C. Smart City for Sustainable Development: Applied Processes from SUMP to MaaS at European Level. Appl. Sci. 2023, 13, 1773. [Google Scholar] [CrossRef]
  26. Kesting, A.; Treiber, M.; Schönhof, M.; Helbing, D. Adaptive cruise control design for active congestion avoidance. Transp. Res. Part C Emerg. Technol. 2008, 16, 668–683. [Google Scholar] [CrossRef]
  27. Ghiasi, A.; Hussain, O.; Qian, Z.; Li, X. A mixed traffic capacity analysis and lane management model for connected automated vehicles: A Markov chain method. Transp. Res. Part B Methodol. 2017, 106, 266–292. [Google Scholar] [CrossRef]
  28. Guériau, M.; Billot, R.; El Faouzi, N.-E.; Monteil, J.; Armetta, F.; Hassas, S. How to assess the benefits of connected vehicles? A simulation framework for the design of cooperative traffic management strategies. Transp. Res. Part C Emerg. Technol. 2016, 67, 266–279. [Google Scholar] [CrossRef]
  29. Fountoulakis, M.; Bekiaris-Liberis, N.; Roncoli, C.; Papamichail, I.; Papageorgiou, M. Highway traffic state estimation with mixed connected and conventional vehicles: Microscopic simulation-based testing. Transp. Res. Part C Emerg. Technol. 2017, 78, 13–33. [Google Scholar] [CrossRef]
  30. Xin, Q.; Yang, N.; Fu, R.; Yu, S.; Shi, Z. Impacts analysis of car following models considering variable vehicular gap policies. Phys. A Stat. Mech. Its Appl. 2018, 501, 338–355. [Google Scholar] [CrossRef]
  31. Bifulco, G.N.; Pariota, L.; Simonelli, F.; Di Pace, R. Development and testing of a fully Adaptive Cruise Control system. Transp. Res. Part C Emerg. Technol. 2013, 29, 156–170. [Google Scholar] [CrossRef]
  32. Ntousakis, I.A.; Nikolos, I.K.; Papageorgiou, M. On Microscopic Modelling of Adaptive Cruise Control Systems. Transp. Res. Procedia 2015, 6, 111–127. [Google Scholar] [CrossRef]
  33. Zhu, W.-X.; Zhang, H.M. Analysis of mixed traffic flow with human-driving and autonomous cars based on car-following model. Phys. A Stat. Mech. Its Appl. 2018, 496, 274–285. [Google Scholar] [CrossRef]
  34. Seraj, M.; Li, J.; Qiu, Z. Modeling Microscopic Car-Following Strategy of Mixed Traffic to Identify Optimal Platoon Configurations for Multiobjective Decision-Making. J. Adv. Transp. 2018, 2018, 7835010. [Google Scholar] [CrossRef]
  35. Zhao, L.; Sun, J. Simulation Framework for Vehicle Platooning and Car-following Behaviors Under Connected-vehicle Environment. Procedia-Soc. Behav. Sci. 2013, 96, 914–924. [Google Scholar] [CrossRef]
  36. He, S.; Ding, F.; Lu, C.; Qi, Y. Impact of connected and autonomous vehicle dedicated lane on the freeway traffic efficiency. Eur. Transp. Res. Rev. 2022, 14, 12. [Google Scholar] [CrossRef]
  37. Lioris, J.; Pedarsani, R.; Tascikaraoglu, F.Y.; Varaiya, P. Platoons of connected vehicles can double throughput in urban roads. Transp. Res. Part C Emerg. Technol. 2017, 77, 292–305. [Google Scholar] [CrossRef]
  38. Nikolos, I.K.; Delis, A.I.; Papageorgiou, M. Macroscopic Modelling and Simulation of ACC and CACC Traffic. In Proceedings of the 2015 IEEE 18th International Conference on Intelligent Transportation Systems, Gran Canaria, Spain, 5–18 September 2015; pp. 2129–2134. [Google Scholar]
  39. Mohajerpoor, R.; Ramezani, M. Mixed flow of autonomous and human-driven vehicles: Analytical headway modeling and optimal lane management. Transp. Res. Part C Emerg. Technol. 2019, 109, 194–210. [Google Scholar] [CrossRef]
  40. Lu, Q.; Tettamanti, T.; Hörcher, D.; Varga, I. The impact of autonomous vehicles on urban traffic network capacity: An experimental analysis by microscopic traffic simulation. Transp. Lett. 2019, 12, 540–549. [Google Scholar] [CrossRef]
  41. Nishimura, Y.; Fujita, A.; Hiromori, A.; Yamaguchi, H.; Higashino, T.; Suwa, A.; Urayama, H.; Takeshima, S.; Takai, M.; IEEE. A Study on Behavior of Autonomous Vehicles Cooperating with Manually-Driven Vehicles. In Proceedings of the IEEE International Conference on Pervasive Computing and Communications (PerCom), Kyoto, Japan, 11–15 March 2019. [Google Scholar]
  42. Zhao, L.H.; Malikopoulos, A.A.; Rios-Torres, J.; IEEE. On the Traffic Impacts of Optimally Controlled Connected and Automated Vehicles. In Proceedings of the 3rd IEEE Conference on Control Technology and Applications (IEEE CCTA), Hong Kong, China, 19–21 August 2019; pp. 935–940. [Google Scholar]
  43. Schakel, W.J.; Arem, B.v.; Netten, B.D. Effects of Cooperative Adaptive Cruise Control on traffic flow stability. In Proceedings of the 13th International IEEE Conference on Intelligent Transportation Systems, Funchal, Portugal, 19–22 September 2010; pp. 759–764. [Google Scholar]
  44. Calvert, S.C.; van den Broek, T.H.A.; van Noort, M.; IEEE. Cooperative Driving in Mixed Traffic Networks-Optimizing for Performance. In Proceedings of the IEEE Intelligent Vehicles Symposium (IV), Alcala de Henares, Spain, 3–7 June 2012; pp. 861–866. [Google Scholar]
  45. Larsson, A.F. Driver usage and understanding of adaptive cruise control. Appl. Ergon. 2012, 43, 501–506. [Google Scholar] [CrossRef]
  46. Altay, İ.; Aksun Güvenç, B.; Güvenç, L. Lidar Data Analysis for Time to Headway Determination in the DriveSafe Project Field Tests. Int. J. Veh. Technol. 2013, 2013, 749896. [Google Scholar] [CrossRef]
  47. Wang, Z.; Chen, X.; Ouyang, Y.; Li, M. Emission Mitigation via Longitudinal Control of Intelligent Vehicles in a Congested Platoon. Comput.-Aided Civ. Infrastruct. Eng. 2015, 30, 490–506. [Google Scholar] [CrossRef]
  48. Board, T.R.; National Academies of Sciences, Engineering, and Medicine. Highway Capacity Manual 7th Edition: A Guide for Multimodal Mobility Analysis; The National Academies Press: Washington, DC, USA, 2022; p. 1286. [Google Scholar] [CrossRef]
Figure 1. Vehicle arrangement and time headway diagram.
Applsci 14 01362 g001
Figure 2. Maximum theoretical capacity of mixed flow with different degrees of platooning intensity: (a) 0% platooning intensity, (b) 25% platooning intensity, (c) 50% platooning intensity, (d) 75% platooning intensity, (e) 100% platooning intensity.
Applsci 14 01362 g002
Figure 3. (a) Capacity increment between maximum P_CC and minimum P_CC, (b) percentage of increment between the maximum theoretical capacity and minimum theoretical capacity.
Applsci 14 01362 g003
Figure 4. (a) Changing trends of theoretical capacity with different MPR and speed values. (b) Exact value of theoretical capacity with different MPR and speed values.
Applsci 14 01362 g004
Figure 5. Model outline.
Applsci 14 01362 g005
Figure 6. (a) Change trends of capacity simulation results with different MPR and speed values. (b) Exact values of capacity simulation results with different MPR and speed values.
Applsci 14 01362 g006
Figure 7. (a) Comparison of the capacity between simulation results and theoretical results. (b) The percentage of capacity difference between simulation results and theoretical results.
Applsci 14 01362 g007
Table 1. Reaction time selection of different studies.
ReferencesType of VehicleMethod τ H H (s) τ H C (s) τ C H (s) τ C C (s)
[7]CAVSimulation with PTV Vissim 110.90.92.0/2.50.6
[21]CACCSimulation with simulation model MIXIC 1.31.41.41.40.5
[35]CACC/ACCSimulation with PTV Vissim 5.3//1.40.5
[27]CAVNumerical analysis 0.8–2.20.8–2.20.7–1.50.6–1.1
[38]CACC/ACCNumerical simulations//0.8–2.2/
[39]AVSimulations with Aimsun 20.0.11.81.81.20.9
[40]AVSimulations with SUMO 1.0.00.90.90.60.6
[41]AVSimulations with self-developed simulator1.691.690.1–3.00.1–3.0
[42]CAVSimulations with PTV Vissim 111.21.20.90.9
[43]CACCSimulations//0.9–1.50.9–1.5
[44]CACCSimulations with ITS Modeler///0.3–1.4
[45]ACCQualitative questionnaire//1.0–2.6/
[46]CACC/ACCField test//0.6–2.00.6–2.0
[47]CAVSimulations with MATLAB R2014a//0.5–2.0/
Table 2. Parameters used in the study.
ParametersValue
h b u f f e r 0.9 m
h e r r o r 0.1 m
h l e a d 4.5 m
τ C C 0.8 s
τ C H 1.2 s
τ H C 1.5 s
length4.5 m
Table 3. Value of the weighted average of platoon intensity with different MPR and n values.
n P C = 25% P C = 50% P C = 75%
P C C P ( N C C ) ( 1 P C C ) P ( N C C ) P C C P ( N C C ) ( 1 P C C ) P ( N C C ) P C C P ( N C C ) ( 1 P C C ) P ( N C C )
2020.00%80.00%45.00%55.00%71.48%28.52%
3221.88%78.13%46.67%53.33%72.33%27.67%
4022.50%77.50%47.50%52.50%72.72%27.28%
5223.08%76.92%48.00%52.00%73.15%26.85%
10024.00%76.00%49.00%51.00%74.00%26.00%
15024.67%75.33%49.33%50.67%74.34%25.66%
Table 4. Summary and comparison with other research data.
ReferencesSpeed Limit (km/h)MPRCapacity in
Reference (veh/h)
Capacity in
This Study (veh/h)
[14]45020001847
[19]104016212125
[9]96021062100
[44]108020902140
10810032003376
[12]105020182130
1056025002548
10510039703351
[36]/018052145
/6727002660
/10036003376
[4]50016201893
505017342102
5010020442757
[48]60017461965
80019942059
100022002116
[5]110021332145
1102022302232
1104023662354
1106026432584
1108031702872
11010038733376
Disclaimer/Publisher’s Note: The statements, opinions and data contained in all publications are solely those of the individual author(s) and contributor(s) and not of MDPI and/or the editor(s). MDPI and/or the editor(s) disclaim responsibility for any injury to people or property resulting from any ideas, methods, instructions or products referred to in the content.