
Influence of the Slope and Gate Offset on Movement Variability and Performance in Slalom Skiing

 , ,
, ,  and
and 
Abstract
1. Introduction
2. Materials and Methods
2.1. Participants
2.2. Procedures
2.2.1. IMU Device and Location
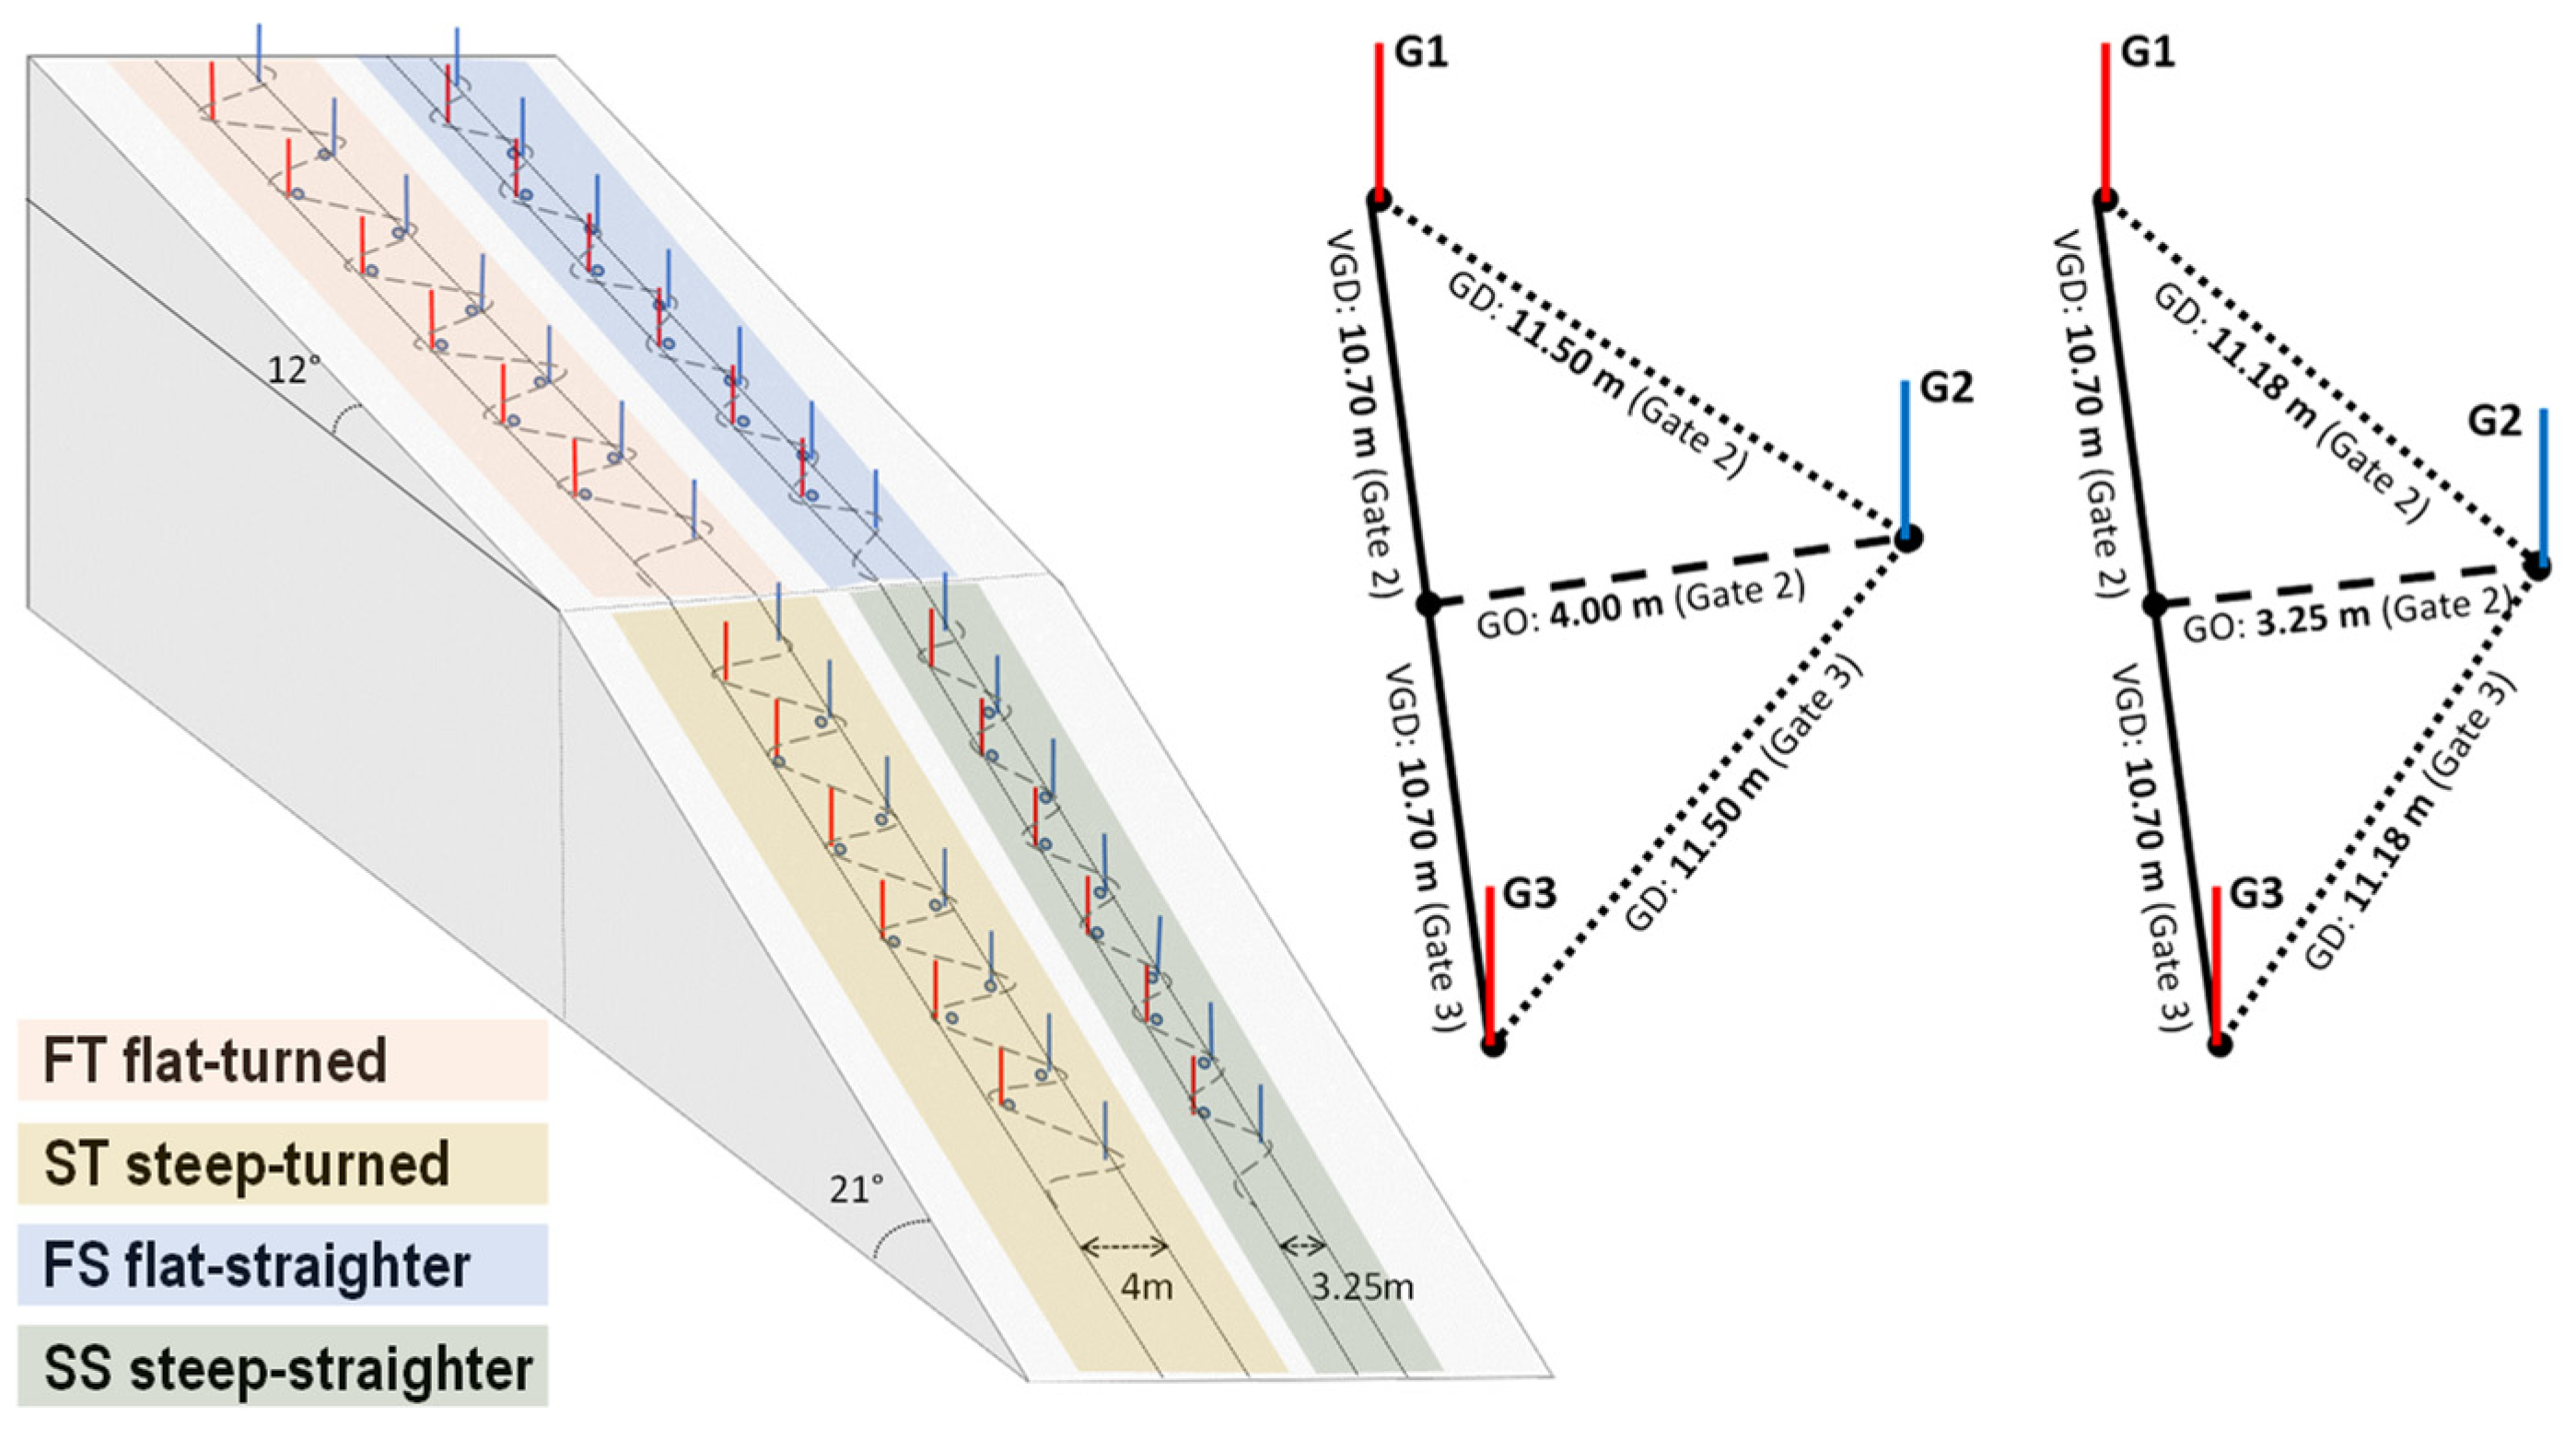
2.2.2. Course Setting
2.3. Data Analysis
2.3.1. Skiers’ Performance
2.3.2. Skier’s MV
2.3.3. Statistical Analysis
3. Results
4. Discussion and Conclusions
5. Practical Application
Author Contributions
Funding
Institutional Review Board Statement
Informed Consent Statement
Data Availability Statement
Acknowledgments
Conflicts of Interest
References
- Raschner, C.; Hildebrandt, C.; Mohr, J.; Müller, L. Sex Differences in Balance among Alpine Ski Racers: Cross-Sectional Age Comparisons. Percept. Mot. Skills 2017, 124, 1134–1150. [Google Scholar] [CrossRef]
- Gilgien, M.; Reid, R.; Raschner, C.; Supej, M.; Holmberg, H.-C. The Training of Olympic Alpine Ski Racers. Front. Physiol. 2018, 9, 1772. [Google Scholar] [CrossRef]
- Supej, M.; Hébert-losier, K.; Holmberg, H. Impact of the Steepness of the Slope on the Biomechanics of World Cup Slalom Skiers. Int. J. Sports Physiol. Perform. 2015, 10, 361–368. [Google Scholar] [CrossRef] [PubMed]
- Bruhin, B.; Janssen, R.J.F.; Guillaume, S.; Gander, M.; Oberle, F.; Lorenzetti, S.; Romann, M. Giant Slalom: Analysis of Course Setting, Steepness and Performance of Different Age Groups—A Pilot Study. Front. Sport. Act. Living 2020, 2, 107. [Google Scholar] [CrossRef] [PubMed]
- Falda-Buscaiot, T.; Hintzy, F.; Rougier, P.; Lacouture, P.; Coulmy, N. Influence of Slope Steepness, Foot Position and Turn Phase on Plantar Pressure Distribution during Giant Slalom Alpine Ski Racing. PLoS ONE 2017, 12, e0176975. [Google Scholar] [CrossRef]
- Spörri, J.; Kröll, J.; Gilgien, M.; Müller, E. How to Prevent Injuries in Alpine Ski Racing: What Do We Know and Where Do We Go from Here? Sport. Med. 2017, 47, 599–614. [Google Scholar] [CrossRef] [PubMed]
- Gilgien, M.; Crivelli, P.; Kröll, J.; Luteberget, L.S.; Müller, E.; Spörri, J. Preventing Injuries in Alpine Skiing Giant Slalom by Shortening the Vertical Distance between the Gates Rather than Increasing the Horizontal Gate Offset to Control Speed. Br. J. Sports Med. 2020, 54, 1042–1046. [Google Scholar] [CrossRef]
- Reid, R.C. A Kinematic and Kinetic Study of Alpine Skiing Technique in Slalom. Ph.D. Thesis, Norwegian School of Sport Sciences, Oslo, Norway, 2010. [Google Scholar]
- Moras, G.; Fernández-valdés, B.; Vázquez-guerrero, J.; Tous-fajardo, J.; Exel, J.; Sampaio, J. Entropy Measures Detect Increased Movement Variability in Resistance Training When Elite Rugby Players Use the Ball. J. Sci. Med. Sport 2018, 21, 1286–1292. [Google Scholar] [CrossRef]
- Fernández-Valdés, B.; Sampaio, J.; Exel, J.; González, J.; Tous-Fajardo, J.; Jones, B.; Moras, G. The Influence of Functional Flywheel Resistance Training on Movement Variability and Movement Velocity in Elite Rugby Players. Front. Psychol. 2020, 11, 1205. [Google Scholar] [CrossRef]
- Fernández-valdés, A.B.; Jones, B.; Hendricks, S.; Weaving, D. A Novel Application of Entropy Analysis for Assessing Changes in Movement Variability during Cumulative Tackles in Young Elite Rugby League Players. Biol. Sport 2022, 39, 3–12. [Google Scholar] [CrossRef]
- Tuyà Viñas, S.; Fernández-Valdés, B.; Pérez-Chirinos Buxadé, C.; Morral-Yepes, M.; Del Campo Montoliu, L.; Moras Feliu, G. Adding Mechanical Vibration to a Half Squat with Different Ballasts and Rhythms Increases Movement Variability. PLoS ONE 2023, 18, e0284863. [Google Scholar] [CrossRef]
- Morral Yepes, M.; Gonzalo-Skok, O.; Fernández-Valdés, B.; Bishop, C.; Tuyà, S.; Moras Feliu, G. Assessment of Movement Variability and Time in a Football Reactive Agility Task Depending on Constraints. Sport. Biomech. 2023. [Google Scholar] [CrossRef]
- Dias, G.; Couceiro, M.S.; Barreiros, J.; Clemente, F.M.; Mendes, R.; Martins, F.M.L. Distance and Slope Constraints: Adaptation and Variability in Golf Putting. Mot. Control. 2014, 18, 221–243. [Google Scholar] [CrossRef] [PubMed]
- Stergiou, N.; Yu, Y.; Kyvelidou, A. A Perspective on Human Movement Variability with Applications in Infancy Motor Development. Kinesiol. Rev. 2016, 2, 93–102. [Google Scholar] [CrossRef]
- Stergiou, N.; Harbourne, R.T.; Cavanaugh, J.T. Optimal Movement Variability: A New Theoretical Perspective for Neurologic Physical Therapy. J. Neurol. Phys. Ther. 2006, 30, 120–129. [Google Scholar] [CrossRef] [PubMed]
- Davids, K.; Glazier, P.; Araújo, D.; Bartlett, R. Movement Systems as Dynamical Systems: The Functional Role of Variability and Its Implications for Sports Medicine. Sport. Med. 2003, 33, 245–260. [Google Scholar] [CrossRef] [PubMed]
- Preatoni, E.; Hamill, J.; Harrison, A.J.; Hayes, K.; van Emmerik, R.E.A.; Wilson, C.; Rodano, R. Movement Variability and Skills Monitoring in Sports. Sport. Biomech. 2013, 12, 69–92. [Google Scholar] [CrossRef] [PubMed]
- Cowin, J.; Nimphius, S.; Fell, J.; Culhane, P.; Schmidt, M. A Proposed Framework to Describe Movement Variability within Sporting Tasks: A Scoping Review. Sport. Med. Open 2022, 8, 85. [Google Scholar] [CrossRef]
- Newell, K.M.; Vaillancourt, D.E. Dimensional Change in Motor Learning. Hum. Mov. Sci. 2001, 20, 695–715. [Google Scholar] [CrossRef]
- Wu, H.G.; Miyamoto, Y.R.; Castro, L.N.G.; Ölveczky, B.P.; Smith, M.A. Temporal Structure of Motor Variability Is Dynamically Regulated and Predicts Motor Learning Ability. Nat. Neurosci. 2014, 17, 312–321. [Google Scholar] [CrossRef]
- Ko, J.-H.; Newell, K.M. Organization of Postural Coordination Patterns as a Function of Scaling the Surface of Support Dynamics. J. Mot. Behav. 2015, 47, 415–426. [Google Scholar] [CrossRef]
- Williams, G.K.R.; Irwin, G.; Kerwin, D.G.; Hamill, J.; Van Emmerik, R.E.A.; Newell, K.M. Coordination as a Function of Skill Level in the Gymnastics Longswing. J. Sports Sci. 2016, 34, 429–439. [Google Scholar] [CrossRef]
- Bernstein, N.A. The Coordination and Regulation of Movements; Pergamon Press: Oxford, UK, 1967. [Google Scholar]
- Davids, K.W.; Button, C.; Bennett, S.J. Dynamics of Skill Acquisition: A Constraints-Led; Human kinetics: Champaign, IL, USA, 2008; pp. 1–27. [Google Scholar]
- Schoellhorn, W.I. Applications of Systems Dynamic Principles to Technique and Strength Training. Acta Acad. Olymp. Est. 2000, 8, 67–85. [Google Scholar]
- Dhawale, A.K.; Smith, M.A.; Ölveczky, B.P. The Role of Variability in Motor Learning. Annu. Rev. Neurosci. 2017, 40, 479–498. [Google Scholar] [CrossRef]
- Moreno, F.J.; Caballero, C.; Barbado, D. Editorial: The Role of Movement Variability in Motor Control and Learning, Analysis Methods and Practical Applications. Front. Physiol. 2023, 14, 1260878. [Google Scholar] [CrossRef] [PubMed]
- Caballero, C.; Moreno, F.J.; Reina, R.; Roldán, A.; Coves, Á.; Barbado, D. The Role of Motor Variability in Motor Control and Learning Depends on the Nature of the Task and the Individual’ s Capabilities. Eur. J. Hum. Mov. 2017, 38, 12–26. [Google Scholar]
- Hristovski, R. Sport Performance as a Domain of Creative Problem Solving for Self-Organizing Performer-Environment Systems. Open Sports Sci. J. 2012, 5, 26–35. [Google Scholar] [CrossRef]
- Araújo, D.; Davids, K.; Hristovski, R. The Ecological Dynamics of Decision Making in Sport. Psychol. Sport Exerc. 2006, 7, 653–676. [Google Scholar] [CrossRef]
- Bashford, L.; Kobak, D.; Diedrichsen, J.; Mehring, C. Motor Skill Learning Decreases Movement Variability and Increases Planning Horizon. J. Neurophysiol. 2022, 127, 995–1006. [Google Scholar] [CrossRef] [PubMed]
- Caballero, C.; Barbado, F.; Moreno, F.J. Non-Linear Tools and Methodological Concerns Measuring Human Movement Variability: An Overview. Eur. J. Hum. Mov. 2014, 32, 61–81. [Google Scholar]
- Harbourne, R.T.; Stergiou, N. Movement Variability and the Use of Nonlinear Tools: Principles to Guide Physical Therapist Practice. Phys. Ther. 2009, 89, 267–282. [Google Scholar] [CrossRef] [PubMed]
- Richman, J.S.; Moorman, J.R. Physiological Time-Series Analysis Using Approximate Entropy and Sample Entropy. Am. J. Physiol. Heart Circ. Physiol. 2000, 278, H2039–H2049. [Google Scholar] [CrossRef] [PubMed]
- Stergiou, N. Nonlinear Analysis for Human Movement Variability; CRC Press; Taylor & Francis Group: Boca Raton, FL, USA, 2016; ISBN 9781498703383. [Google Scholar]
- García-Aguilar, F.; Caballero, C.; Sabido, R.; Moreno, F.J. The Use of Non-Linear Tools to Analyze the Variability of Force Production as an Index of Fatigue: A Systematic Review. Front. Physiol. 2022, 13, 1074652. [Google Scholar] [CrossRef] [PubMed]
- Busa, M.A.; van Emmerik, R.E.A. Multiscale Entropy: A Tool for Understanding the Complexity of Postural Control. J. Sport Heal. Sci. 2016, 5, 44–51. [Google Scholar] [CrossRef] [PubMed]
- Costa, M.; Goldberger, A.L.; Peng, C.K. Multiscale Entropy Analysis of Complex Physiologic Time Series. Phys. Rev. Lett. 2002, 89, 6–9. [Google Scholar] [CrossRef]
- Pincus, S.M. Approximate Entropy as a Measure of System Complexity. Proc. Natl. Acad. Sci. USA 1991, 88, 2297–2301. [Google Scholar] [CrossRef]
- Murray, A.M.; Ryu, J.H.; Sproule, J.; Turner, A.P.; Graham-Smith, P.; Cardinale, M. A Pilot Study Using Entropy as a Noninvasive Assessment of Running. Int. J. Sports Physiol. Perform. 2017, 12, 1119–1122. [Google Scholar] [CrossRef]
- González-Millán, S.; Caparrós, T.; Toro-Román, V.; Illera-Domínguez, V.; Albesa-Albiol, L.; Moras, G.; Pérez-Chirinos Buxadé, C.; Fernández-Valdés, B. Effect of Ball Inclusion in Drop Vertical Jump Test on Performance and Movement Variability in Basketball Players. Appl. Sci. 2024, 14, 505. [Google Scholar] [CrossRef]
- Supej, M.; Holmberg, H.-C. Monitoring the Performance of Alpine Skiers with Inertial Motion Units: Practical and Methodological Considerations. J. Sci. Sport Exerc. 2021, 3, 249–256. [Google Scholar] [CrossRef]
- Snyder, C.; Martínez, A.; Jahnel, R.; Roe, J.; Stöggl, T. Connected Skiing: Motion Quality Quantification in Alpine Skiing. Sensors 2021, 21, 3779. [Google Scholar] [CrossRef] [PubMed]
- Fasel, B.; Gilgien, M.; Spörri, J.; Aminian, K. A New Training Assessment Method for Alpine Ski Racing: Estimating Center of Mass Trajectory by Fusing Inertial Sensors with Periodically Available Position Anchor Points. Front. Physiol. 2018, 9, 1203. [Google Scholar] [CrossRef] [PubMed]
- Yu, G.; Jae Jang, Y.; Kim, J.; Kim, J.H.; Kim, H.Y.; Kim, K.; Panday, S.B. Potential of IMU Sensors in Performance Analysis of Professional Alpine Skiers. Sensors 2016, 16, 463. [Google Scholar] [CrossRef] [PubMed]
- Pérez-Chirinos Buxadé, C.; Padullés Riu, J.M.; Gavaldà Castet, D.; Trabucchi, M.; Fernández-Valdés, B.; Tuyà Viñas, S.; Moras Feliu, G. Influence of Turn Cycle Structure on Performance of Elite Alpine Skiers Assessed through an IMU in Different Slalom Course Settings. Sensors 2022, 22, 902. [Google Scholar] [CrossRef] [PubMed]
- Yamagiwa, S.; Ohshima, H.; Shirakawa, K. Skill Scoring System for Ski’s Parallel Turns. In Proceedings of the icSPORTS 2014—Proceedings of the 2nd International Congress on Sports Sciences Research and Technology Support, Rome, Italy, 24–26 October 2014; pp. 121–128. [Google Scholar]
- Martínez, A.; Jahnel, R.; Buchecker, M.; Snyder, C.; Brunauer, R.; Stöggl, T. Development of an Automatic Alpine Skiing Turn Detection Algorithm Based on a Simple Sensor Setup. Sensors 2019, 19, 902. [Google Scholar] [CrossRef] [PubMed]
- Pérez-Chirinos Buxadé, C.; Fernández-Valdés, B.; Morral-Yepes, M.; Tuyà Viñas, S.; Padullés Riu, J.M.; Moras Feliu, G. Validity of a Magnet-Based Timing System Using the Magnetometer Built into an IMU. Sensors 2021, 21, 5773. [Google Scholar] [CrossRef] [PubMed]
- International Ski Federation. The International Ski Competition Rules (ICR) Book IV Joint Regulations for Alpine Skiing; International Ski Federation FIS: Oberhofen, Switzerland, 2019. [Google Scholar]
- Goldberger, A.L.; Amaral, L.A.N.; Glass, L.; Hausdorff, J.M.; Ivanov, P.C.; Mark, R.G.; Mietus, J.E.; Moody, G.B.; Peng, C.-K.; Stanley, H.E. PhysioBank, PhysioToolkit, and PhysioNet: Components of a New Research Resource for Complex Physiologic Signals. Circulation 2000, 101, 215–220. [Google Scholar] [CrossRef] [PubMed]
- Cohen, J. Statistical Power Analysis for the Behavioral Sciences, 2nd ed.; Routledge Academic: New York, NY, USA, 1988; ISBN 0805802835. [Google Scholar]
- R Core Team. R: A Language and Environment for Statistical Computing. R Foundation for Statistical Computing. Available online: https://www.r-project.org/ (accessed on 20 May 2022).
- Thiese, M.S.; Ronna, B.; Ott, U. P Value Interpretations and Considerations. J. Thorac. Dis. 2016, 8, E928–E931. [Google Scholar] [CrossRef]
- Newell, K.M. Constraints on the Development of Coordination. In Motor Development in Children: Aspects of Coordination and Control; Wade, M.G., Whiting, H.T.A., Eds.; Martinus Nijhoff: Leiden, The Netherlands, 1986; pp. 341–360. [Google Scholar]
- Supej, M. Differential Specific Mechanical Energy as a Quality Parameter in Racing Alpine Skiing. J. Appl. Biomech. 2008, 24, 121–129. [Google Scholar] [CrossRef]
- Clarys, J.P.; Alewaeters, K.; Zinzen, E. The Influence of Geographic Variations on the Muscular Activity in Selected Sports Movements. J. Electromyogr. Kinesiol. 2001, 11, 451–457. [Google Scholar] [CrossRef]
- Spörri, J.; Kröll, J.; Schwameder, H.; Schiefermüller, C.; Müller, E. Course Setting and Selected Biomechanical Variables Related to Injury Risk in Alpine Ski Racing: An Explorative Case Study. Br. J. Sports Med. 2012, 46, 1072–1077. [Google Scholar] [CrossRef]
- Gilgien, M.; Crivelli, P.; Kröll, J.; Luteberget, L.S.; Müller, E.; Spörri, J. Injury Prevention in Super-G Alpine Ski Racing through Course Design. Sci. Rep. 2021, 11, 3637. [Google Scholar] [CrossRef] [PubMed]
- Gilgien, M.; Spörri, J.; Kröll, J.; Crivelli, P.; Müller, E. Mechanics of Turning and Jumping and Skier Speed Are Associated with Injury Risk in Men’s World Cup Alpine Skiing: A Comparison between the Competition Disciplines. Br. J. Sports Med. 2014, 48, 742–747. [Google Scholar] [CrossRef] [PubMed]
- Gilgien, M.; Kröll, J.; Spörri, J.; Crivelli, P.; Müller, E. Application of DGNSS in Alpine Ski Racing: Basis for Evaluating Physical Demands and Safety. Front. Physiol. 2018, 9, 145. [Google Scholar] [CrossRef]
- Spörri, J.; Kröll, J.; Schwameder, H.; Müller, E. Turn Characteristics of a Top World Class Athlete in Giant Slalom: A Case Study Assessing Current Performance Prediction Concepts. Int. J. Sport. Sci. Coach. 2012, 7, 647–659. [Google Scholar] [CrossRef]
- Gilgien, M.; Crivelli, P.; Spörri, J.; Kröll, J.; Müller, E. Characterization of Course and Terrain and Their Effect on Skier Speed in World Cup Alpine Ski Racing. PLoS ONE 2015, 10, e0118119. [Google Scholar] [CrossRef]
- Català Antúnez, J. La Variabilidad de Movimiento En La Carrera Batida de Remate En Jugadoras de Voleibol de Distintas Categorías; University of Barcelona: Barcelona, Spain, 2021. [Google Scholar]
- Newell, K.M.; Broderick, M.P.; Deutsch, K.M.; Slifkin, A.B. Task Goals and Change in Dynamical Degrees of Freedom with Motor Learning. J. Exp. Psychol. Hum. Percept. Perform. 2003, 29, 379–387. [Google Scholar] [CrossRef]
- Müller, E.; Bartlett, R.; Raschner, C.; Schwameder, H.; Benko-Bernwick, U.; Lindinger, S. Comparisons of the Ski Turn Techniques of Experienced and Intermediate Skiers. J. Sports Sci. 1998, 16, 545–559. [Google Scholar] [CrossRef]
- Couceiro, M.; Clemente, F.; Dias, G.; Mendes, P.; Martins, F.; Mendes, R. On an Entropy-Based Performance Analysis in Sports. In Proceedings of the 1st International Electronic Conference on Entropy and Its Applications, Internet, 3–21 November 2014. [Google Scholar] [CrossRef]


| Conditions | Mean Differences | p | 95% CI | |||
|---|---|---|---|---|---|---|
| Lower | Upper | |||||
| SampEn (a.u.) | FT | FS | 0.008 | 0.339 | −0.006 | 0.022 |
| ST | −0.012 | 0.078 * | −0.025 | 0.001 | ||
| SS | −0.006 | 0.598 | −0.020 | 0.008 | ||
| FS | ST | −0.020 | 0.004 ** | −0.034 | −0.006 | |
| SS | −0.014 | 0.055 * | −0.029 | 0.000 | ||
| ST | SS | 0.006 | 0.611 | −0.008 | 0.020 | |
| Time (s) | FT | FS | 0.778 | 0.0001 ** | 0.419 | 1.136 |
| ST | −0.146 | 0.605 | −0.484 | 0.192 | ||
| SS | 0.377 | 0.038 ** | 0.018 | 0.735 | ||
| FS | ST | −0.923 | <0.0001 ** | −1.282 | −0.565 | |
| SS | −0.401 | 0.036 ** | −0.779 | −0.023 | ||
| ST | SS | 0.522 | 0.004 ** | 0.164 | 0.880 | |
| Steepness of the Slope (12°) | Steepness of the Slope (21°) | Steepness Effect | η2p | Gate Offset Effect | η2p | Steepness x Gate Offset | η2p | |||
|---|---|---|---|---|---|---|---|---|---|---|
| Gate Offset (4 m) | Gate Offset (3.25 m) | Gate Offset (4 m) | Gate Offset (3.25 m) | |||||||
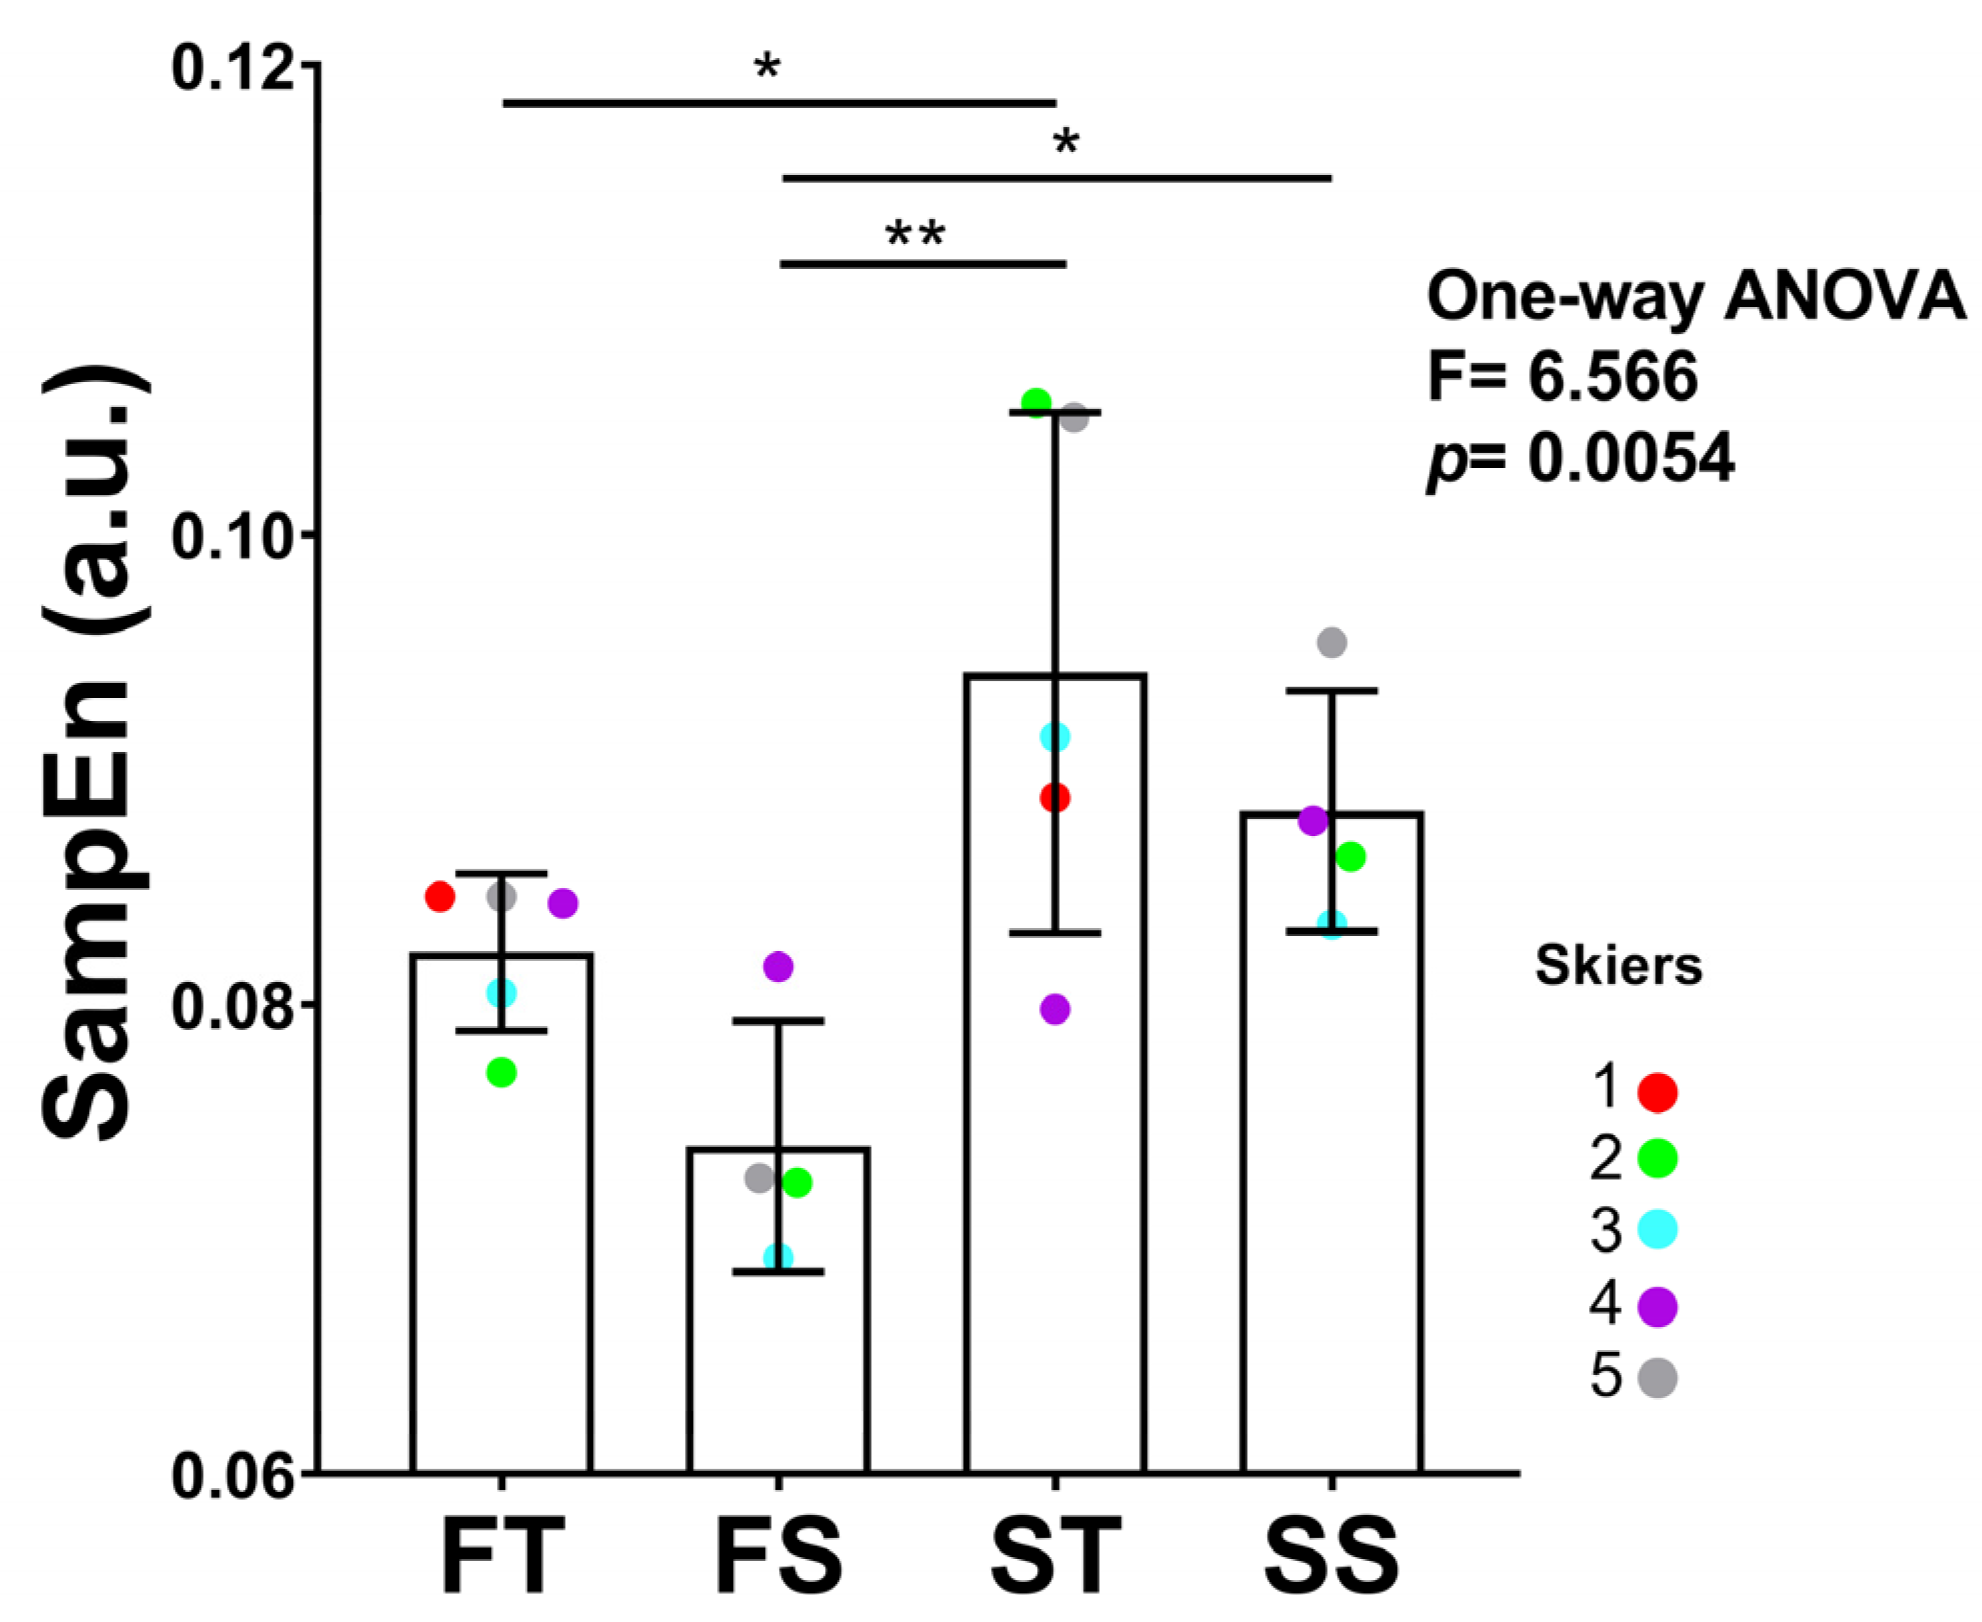
| SampEn (a.u.) | 0.082 ± 0.003 | 0.074 ± 0.005 | 0.094 ± 0.011 | 0.088 ± 0.005 | 0.002 ** | 0.521 | 0.053 ** | 0.242 | 0.729 | 0.009 |
| Time (s) | 7.712 ± 0.245 | 6.934 ± 0.168 | 7.857 ± 0.146 | 7.335 ± 0.145 | 0.007 ** | 0.413 | <0.0001 ** | 0.799 | 0.165 | 0.133 |
Disclaimer/Publisher’s Note: The statements, opinions and data contained in all publications are solely those of the individual author(s) and contributor(s) and not of MDPI and/or the editor(s). MDPI and/or the editor(s) disclaim responsibility for any injury to people or property resulting from any ideas, methods, instructions or products referred to in the content. |
© 2024 by the authors. Licensee MDPI, Basel, Switzerland. This article is an open access article distributed under the terms and conditions of the Creative Commons Attribution (CC BY) license (https://creativecommons.org/licenses/by/4.0/).
Share and Cite
Pérez-Chirinos Buxadé, C.; Moras Feliu, G.; Tuyà Viñas, S.; Trabucchi, M.; Gavaldà Castet, D.; Padullés Riu, J.M.; Fernández-Valdés Villa, B. Influence of the Slope and Gate Offset on Movement Variability and Performance in Slalom Skiing. Appl. Sci. 2024, 14, 1427. https://doi.org/10.3390/app14041427
Pérez-Chirinos Buxadé C, Moras Feliu G, Tuyà Viñas S, Trabucchi M, Gavaldà Castet D, Padullés Riu JM, Fernández-Valdés Villa B. Influence of the Slope and Gate Offset on Movement Variability and Performance in Slalom Skiing. Applied Sciences. 2024; 14(4):1427. https://doi.org/10.3390/app14041427
Chicago/Turabian StylePérez-Chirinos Buxadé, Carla, Gerard Moras Feliu, Sílvia Tuyà Viñas, Michela Trabucchi, Dani Gavaldà Castet, Josep Maria Padullés Riu, and Bruno Fernández-Valdés Villa. 2024. "Influence of the Slope and Gate Offset on Movement Variability and Performance in Slalom Skiing" Applied Sciences 14, no. 4: 1427. https://doi.org/10.3390/app14041427
APA StylePérez-Chirinos Buxadé, C., Moras Feliu, G., Tuyà Viñas, S., Trabucchi, M., Gavaldà Castet, D., Padullés Riu, J. M., & Fernández-Valdés Villa, B. (2024). Influence of the Slope and Gate Offset on Movement Variability and Performance in Slalom Skiing. Applied Sciences, 14(4), 1427. https://doi.org/10.3390/app14041427