Article

Research on Energy Absorption Characteristics of Polypropylene Foam Concrete Buffer Layer in High Ground Stress Soft Rock Tunnel

1
College of Environment and Civil Engineering, Chengdu University of Technology, Chengdu 610059, China
2
College of Engineering and Technology, The Open University of Sichuan, Chengdu 610073, China
*
Author to whom correspondence should be addressed.
Appl. Sci. 2024, 14(4), 1544; https://doi.org/10.3390/app14041544
Submission received: 20 November 2023 / Revised: 25 January 2024 / Accepted: 25 January 2024 / Published: 15 February 2024

Abstract

:
Creep stress is a detrimental stress generated by the surrounding rock during the operation of the secondary lining of the supporting structure used for high-stress soft rock tunnels in railways, highways and other projects. Therefore, the present study aims to investigate and provide solutions for damages such as cracking and deformation caused by creep stress. For this purpose, research methods used in the literature and experimental studies, as well as the theoretical, data and numerical simulation analyses, were used. Accordingly, the mix proportion design, specimen production and the tests of physical and mechanical properties of EPP foam concrete were carried out. Moreover, the EPP(polypropylene foam) concrete was used as the buffer layer of the supporting structure, the practical application of which was verified through numerical analyses. The findings of the study revealed the effective compression performance of the mix proportion design method. Furthermore, the EPP foam concrete was found to be able to absorb the energy generated by the creep of the surrounding rock, consequently reducing the surrounding rock pressure acting on the secondary lining structure, which, in turn, ensures the safety of the operation. The findings of the study can be used as a reference for designing similar projects.

1. Introduction

Recent developments in China’s economy have remarkably expanded the construction scale of railways and highway networks in the western region of the country. However, several engineering disasters were also caused by extremely complex geological conditions and continuously deepening excavating tunnels. The main problems are the large deformation of the surrounding rock caused by the high ground stress and the weak rock layers. To these, creep compression deformation during operation can also be added. These factors have been discussed as seriously affecting the safety of tunnel construction and operation. This is while, under a high-stress and weak rock environment, the traditional ‘strong support and hard roof’ method fails to be applied as a support. As a consequence, numerous theoretical and practical studies have been conducted internally and internationally to tackle the problem. For example, Zheng Z.M. et al. [1] developed an improved creep model that considers the effects of stress state and time on the creep parameters.
Liu W.B. et al. [2], based on the kinetic energy theorem, Perzyna viscoplastic theory and the Nishihara model, established a unified creep constitutive model that can describe the whole process of decaying creep, stable creep and accelerated creep. Like Dong Z.K. et al. [3], in this paper, triaxial creep tests of rock salt under multi-stage temperatures were carried out to study the influence of temperature on the creep behaviors of rock salt. Based on viscoelastic mechanics, Fahimifar A. et al. [4] proposed an analytical solution for tunnel support systems. In another study, performance indicators were suggested by Dipl et al. [5] to be utilized for high-stress soft-rock tunnel lining. A multiple regression function superposition method was applied by Ren Hong-Gang et al. [6] to analyze the in situ stress and support of surrounding tunnel rocks under complex geological conditions. Han C.L. et al. [7] and Yang Y. et al. [8] analyzed the deformation mechanism and control methods of high ground stress and weak surrounding rock. The deformation mechanism of high ground stress soft rock tunnels was also studied by Liu D.J. et al. [9] and Liu Y. et al. [10]. Accordingly, they proposed using compressible materials to absorb the deformation energy of the surrounding rock. So, as a result, a reduction in the effect of high ground stress on the secondary lining structure was discussed, which could ultimately prevent the large deformation caused by tunnel compression.
However, while the above studies mainly resolved the problem of controlling large deformations during construction, no systematic theory or method has been set forth for controlling creep deformation caused by the high ground stress, i.e., the stress that is produced during and after completing tunnel lining construction. In this regard, numerous research studies have utilized foam concrete as the buffer layer of the supporting structure. For example, Castinglioni A. et al. [11] investigated the parameters influencing the cushioning performance of EPSF foam. In another study, Sritam Swapnadarshi Sahu et al. [12] examined the surface activity and the characteristics of foam concrete. The dynamic mechanical properties of porous concrete were also studied by Li H.N. et al. [13]. In addition, an innovative lightweight concrete and the dynamic impact characteristics of lightweight aggregate concrete were investigated by Karl-Christian et al. [14] and Ma W. et al. [15], respectively. Also, using foamed polystyrene beads as the coarse aggregate, Ammar Hamid Medher et al. [16] proposed the possibility of producing self-compacting lightweight concrete. Jose Sajan K. et al. [17] also studied the influence of mixture composition on the performance of foam materials.
Nevertheless, the above research works all adopted theoretical or experimental approaches to the composition and performance of lightweight concrete foam. This is to say that such studies overlooked the specific environment required for the application of an energy-absorbing buffer layer in tunnel-supporting structures with high ground stress soft rocks. In line with this, a number of studies attempted to apply better compressible lightweight concrete materials to the supporting structure of such tunnels. In one study, Sri Datta Rapaka et al. [18] investigated the dynamic compression principles of solid materials with pores. In another study, the seismic reduction in foam concrete was experimentally analyzed by Tian X.B. et al. [19], and Hu X.Y. et al. [20] also researched the interaction between extrusion deformation and yield support under different yield materials; the obtained results of which corroborated the effect of setting a buffer layer on energy absorption and pressure relief. Despite these findings, the coordination between the surrounding rock stress, the initial support and the secondary lining support of high- and low-stress soft rock tunnels is not fully understood. To this, we can also add the design and production of the mix ratio of the buffer layer material, as well as the way the physical, mechanical and compressive properties of the buffer layer material might be better adapted for controlling the deformation effect of high-stress soft rock tunnels.
To summarize, despite the development of the traditional ‘strong support hard roof’ method by numerous studies, current research studies on the buffer layer of the supporting structure of high-stress soft rock tunnels mainly focus on controlling the large deformation of the surrounding rock during construction. Moreover, research on buffer layer materials also primarily investigates the large deformation caused by compression during construction and the experimental research stage. Consequently, the study of important issues such as the mix ratio, physical and mechanical properties, energy absorption and pressure relief performance of the buffer layer materials is of high significance, which can help to resolve the problem of long-term deformation (creep) caused by the completion of the secondary lining construction of high-stress soft rock tunnels. This is a factor that can seriously affect the safety of tunnel operation by causing cracking or damage to large cross-section tunnels such as highways and railways. Hence, the findings from the literature, theoretical analysis, experimental research, data analysis, numerical simulation analysis and other research methods were used in the present study. Accordingly, mix ratio design, specimen production and physical and mechanical performance tests of EPP foam concrete were utilized. Moreover, numerical analyses were also applied to verify the practical application of EPP foam concrete in engineering areas. It also needs to be noted that the compression performance and the energy absorption performance are important factors in solving the major problems of cracking or failure in the supporting structure, and these are caused by creep deformation during operation. The findings are also expected to provide a reference for designing similar projects.

2. Development of EPP Concrete

As a kind of foam material, EPP particles present extremely low strength and excellent resilience. Accordingly, the relatively low density of the concrete prepared by EPP makes it an ideal lightweight material. However, despite such advantages, EPP particles can be easily absorbed and floated, which leads to the agglomeration of EPP particles, as well as their uneven distribution in the concrete. To overcome these problems in making EPP concrete specimens, the EPP particles are first modified and mixed with the concrete mixture. Various physical and mechanical tests are also conducted to study their physical and mechanical properties.

2.1. EPP Particle Modification Test

As foamed porous materials, EPP particles have a bulk density of 20 kg/m3, i.e., far less than that of water and cement slurry. In addition, the particles are organic, enjoy strong hydrophobicity and have a relatively flat surface, which causes a poor bonding effect with the cement slurry. If directly added to and mixed with concrete, they also demonstrate a significant upward floating phenomenon. This phenomenon not only leads to an uneven upper surface during sample molding but it causes an uneven distribution of the EPP particles, affecting the physical and mechanical properties of the EPP concrete. Therefore, in order to uniformly distribute the EPP particles in the concrete, they need to be modified. The modified EPP concrete is shown in Figure 1.
Considering the general design strength of the concrete for the secondary lining of the soft rock tunnel supporting structure, the mix ratio of EPP concrete was calculated based on the mix ratio of C50 concrete (Table 1).
Using the stone replacement method, the EPP particles were replaced for the coarse and fine aggregates in the concrete matrix. Moreover, due to the EPP concrete requiring large porosity of the buffer layer, six groups of mix proportion were set in the experiment. With equal volumes, while the first group was replaced with the coarse aggregate by 100%, the second to the sixth groups were replaced by 20%, 40%, 60%, 80% and 100% of the first group, respectively. The calculated concrete mix with different EPP contents is shown in Table 2.

2.2. Specimen Development

(1)
Development of EPP concrete specimens with different EPP particle contents
As can be seen in Figure 2, after 28 days of curing, the EPP concrete specimens were made based on the mixture ratio in Table 2.
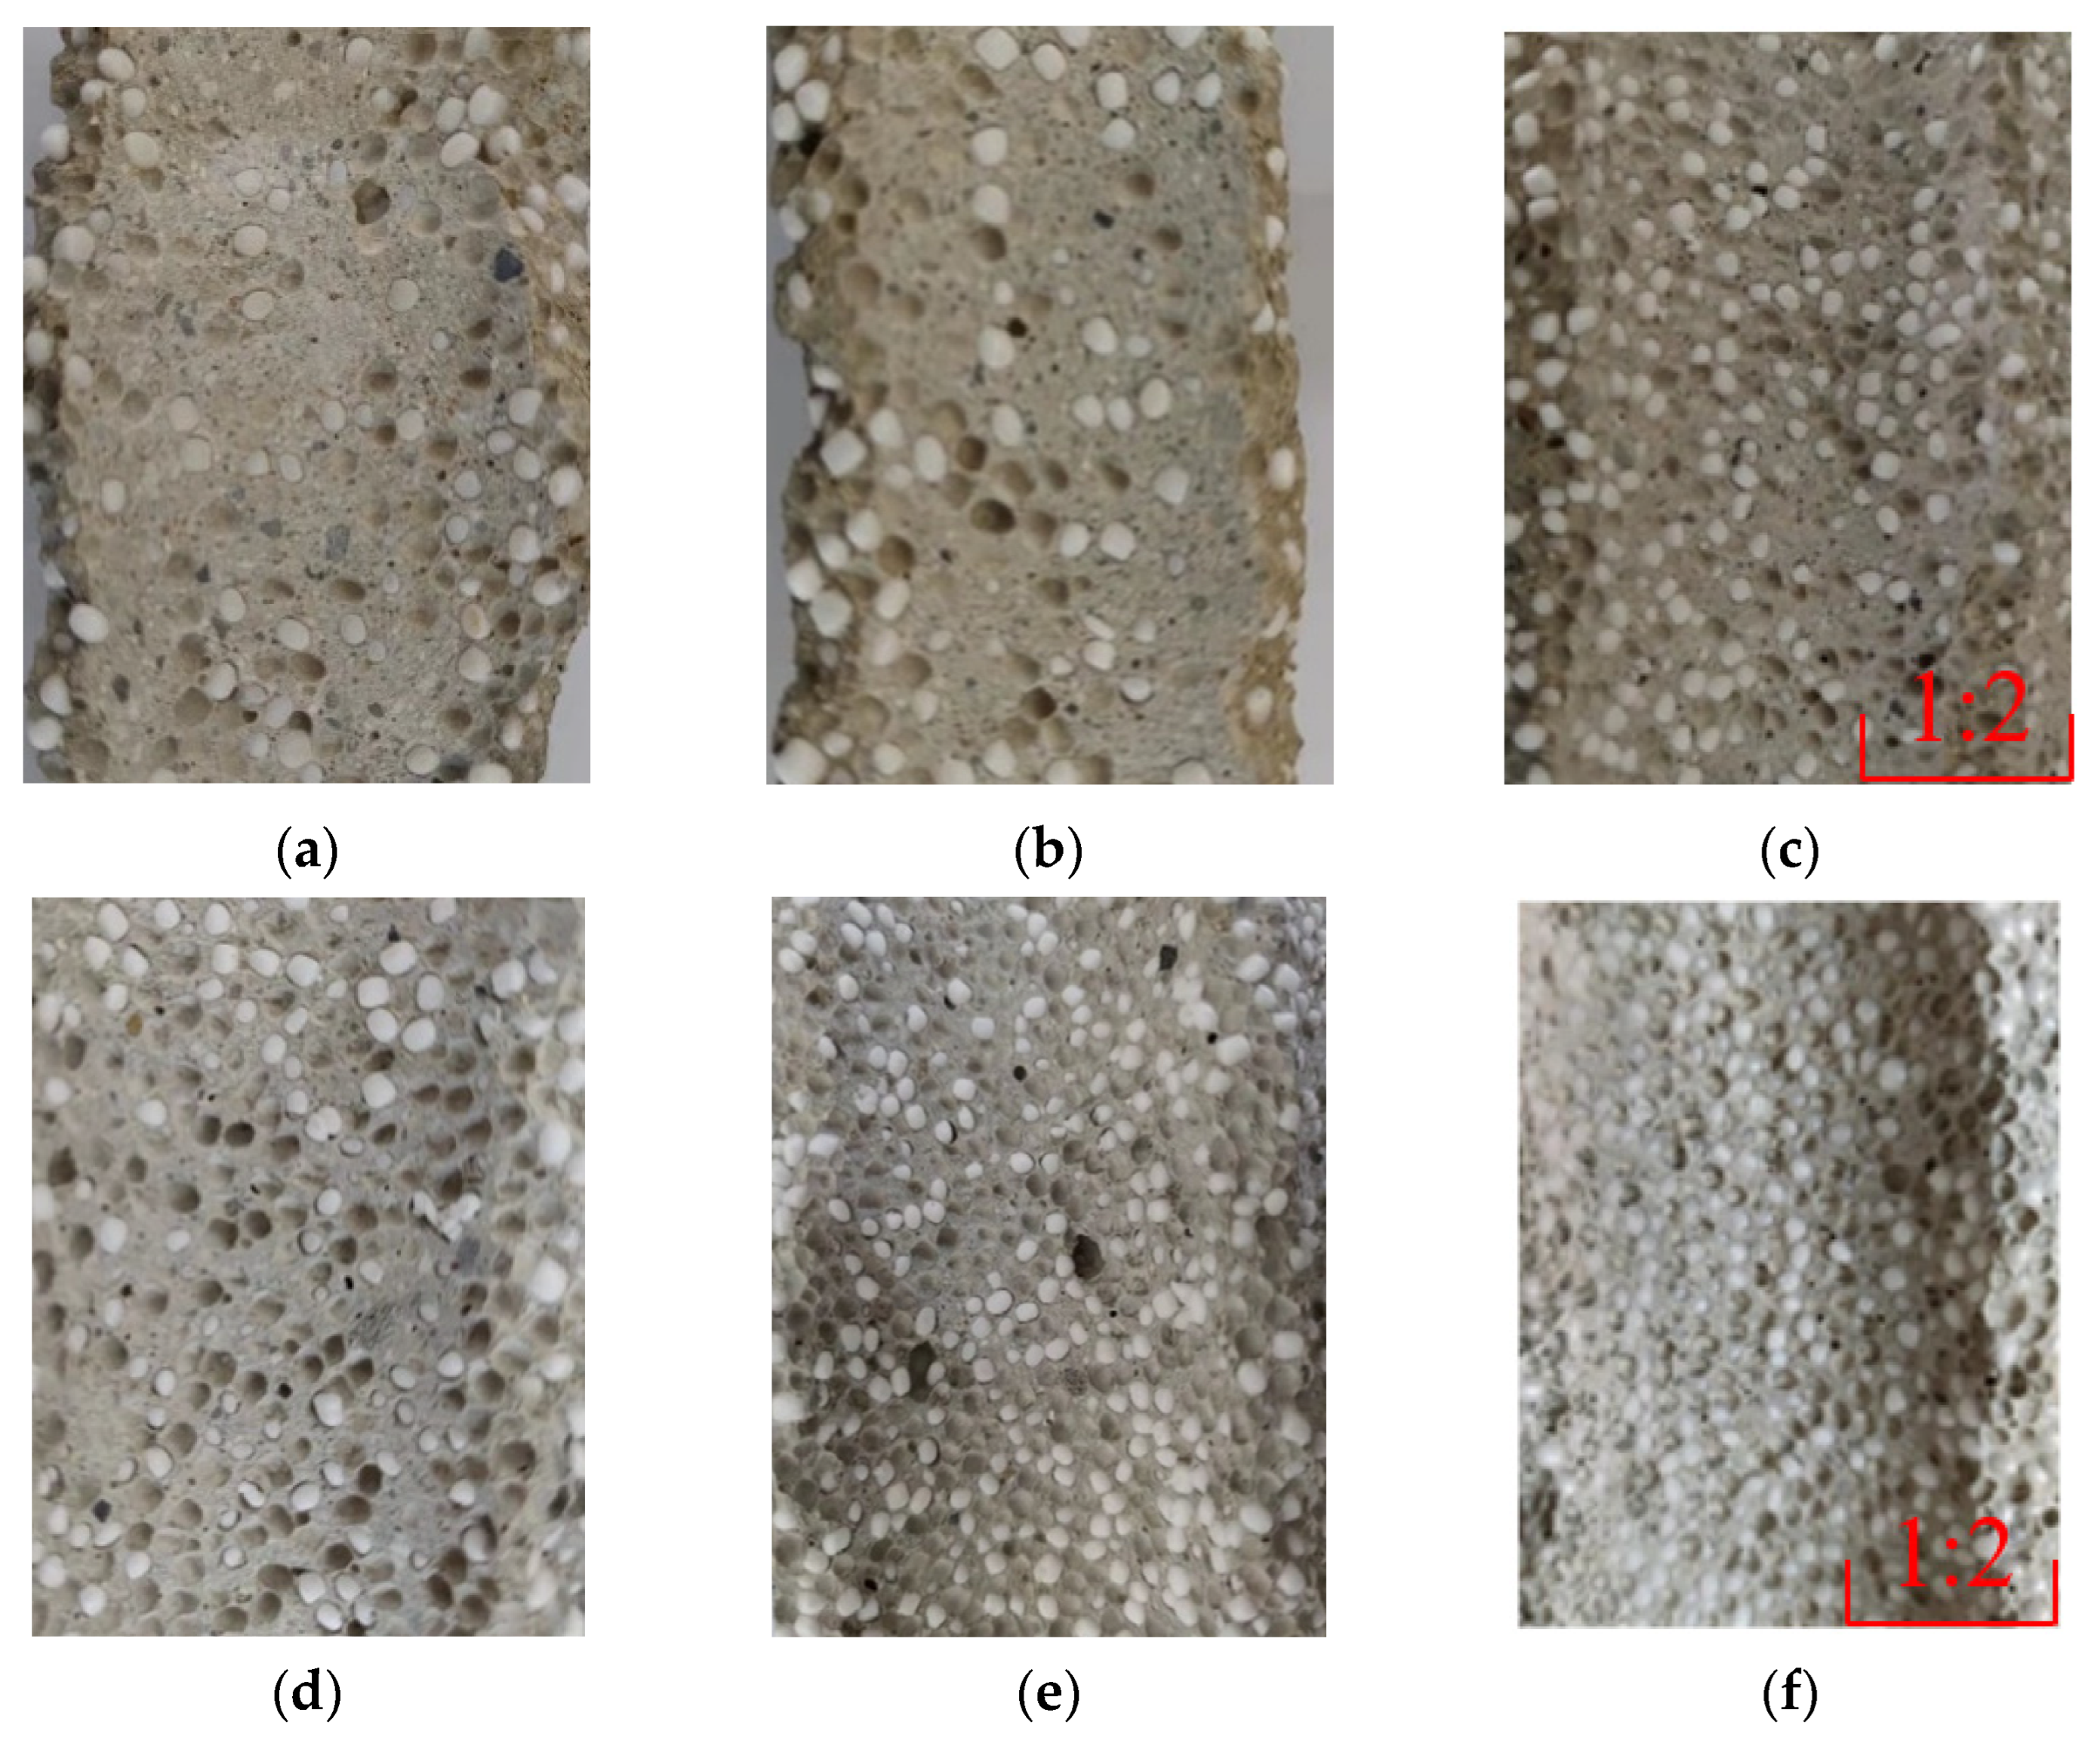
After completing the preparation, the A1–A6 specimens were drilled and sampled. Subsequently, to verify the modification effect of the EPP particles and its influence on the concrete mixing, the distribution of EPP particles was observed in each group of the specimens. The cross sections of the specimens are shown in Figure 3. In order to distinguish them from the confined compression specimens A1–A6, the superimposed specimens for the uniaxial compression and splitting tests were numbered B1–B6.
As can be seen in Figure 3, the EPP particles are evenly distributed in the concrete matrix material. Moreover, the higher volume content of the EPP particles can be observed to result in better uniformity and a weaker pore wall.
(2)
Development of laminated specimens
Considering the design strength of the second lining of the tunnel’s supporting structure under the general surrounding rock condition, with the specification of 50 mm × 100 mm × 100 mm, the concrete strength of the laminated specimen adopted the standard C35 concrete mixture ratio. After demolding and curing for 7 days, it was put into a 100 mm × 100 mm mold. Subsequently, the EPP concrete of the A1–A6 groups was poured in the remaining space of the mold. Next, it was vibrated and left standing for 72 h and then demolded. Then, it was cured in an immobile saturated solution of calcium hydroxide at a temperature of 20 °C ± 2 °C. To distinguish them from the confined compression specimens of A1–A6, the laminated specimens were numbered B1–B6.

3. Physical and Mechanical Properties Test of EPP Concrete Specimens

3.1. Uniaxial Compression Test

Three uniaxial compressive specimens were taken from the six groups of EPP concrete A1–A6. The loading test was performed using a microcomputer hydraulic pressure testing machine. The loading mode was stress control. The loading was also carried out at a rate of 0.3 MPa/s. The values of the load force and deformation of the specimens were recorded during the loading process. Moreover, the failure mode of the whole process of the field specimen test was recorded by taking photos or videos.

3.2. Axial Compression Deformation Test

After preparing and molding, the high content of the EPP particles was observed to lead to several honeycomb pits on the side of the specimen. However, this is detrimental for sticking strain gauges to measure its strain. Therefore, using a computer, the MTS815 testing machine and its supporting circumferential extensometer were used to carry out the axial compression test, as well as to measure the load and deformation of the specimen, which led to the high accuracy of the test.

3.3. Splitting Compressive Test

Each of the A1–A6 groups of the EPP concrete took three specimens. Moreover, to determine the position of the splitting surface, parallel straight lines were also drawn in the middle of the top surface and bottom surface of the specimens. The loading method was stress control, with the loading being carried out at a rate of 0.02 MPa/s. The load force value was recorded during the loading process, as well.

3.4. Confined Uniaxial Compression Test

Three specimens of the six groups of EPP concrete (A1 to A6) were taken. In order to limit the large deformation of the four sides of the specimens, the cubic specimens were placed in steel sleeves. With the loading mode and the loading rate of stress control and 0.05 MPa/s, respectively, the top surface of the specimens was loaded with a microcomputer hydraulic pressure testing machine. The values of the load force and the specimen deformation were also recorded during the loading process.

3.5. Confined Uniaxial Compression Test of Laminated Specimens

The C35 laminated specimens were prepared and subjected to a confined uniaxial compression test after 28 days of curing. In order to distinguish them from the confined compression specimens A1–A6, they were numbered B1–B6. With the mode of stress control, the loading was carried out at the rate of 0.05 MPa/s. The values of the load force and the overall deformation of the specimen were also recorded using the testing machine during the loading process. The strain collector was also used to record the vertical strain value of the C35 concrete layer. Figure 4 displays the stress and the loading diagram of the laminated specimen under the confined compression.

4. Analysis of Mechanical Properties and Energy Absorption Performance of Confined Compression

The results obtained from the uniaxial compressive test revealed the EPP concrete to be still a brittle material. Although the hole wall collapse and the pore compaction were obviously observed in the A4–A6 groups of the specimens, the failure was still a brittle one caused by the development of cracks. As the specimens were broken into pieces along the failed surface, their bearing capacity was lost. Moreover, it was essential to treat the EPP concrete specimens as only a very small part of the pores formed by the EPP particles was compacted.

4.1. Confined Compressive Strength Analysis

In the actual test, the ultimate strength of the specimen is generally assessed by calculating the maximum load during the whole loading process. However, in the confined compression test, the structural reorganization of the specimen is caused by the steel sleeve limiting the collapse of the specimen. Moreover, the bearing capacity of the specimen increases during the compression process. Therefore, it is unreasonable to define the ultimate strength by the maximum stress in the whole compression process. Therefore, in order to evaluate the ultimate strength in the confined compression test, this study uses the peak point of the stress-volume strain curve to decrease first, taking the EPP content 35 % curve as an example, as shown in point a (the peak point of decline) in Figure 5.
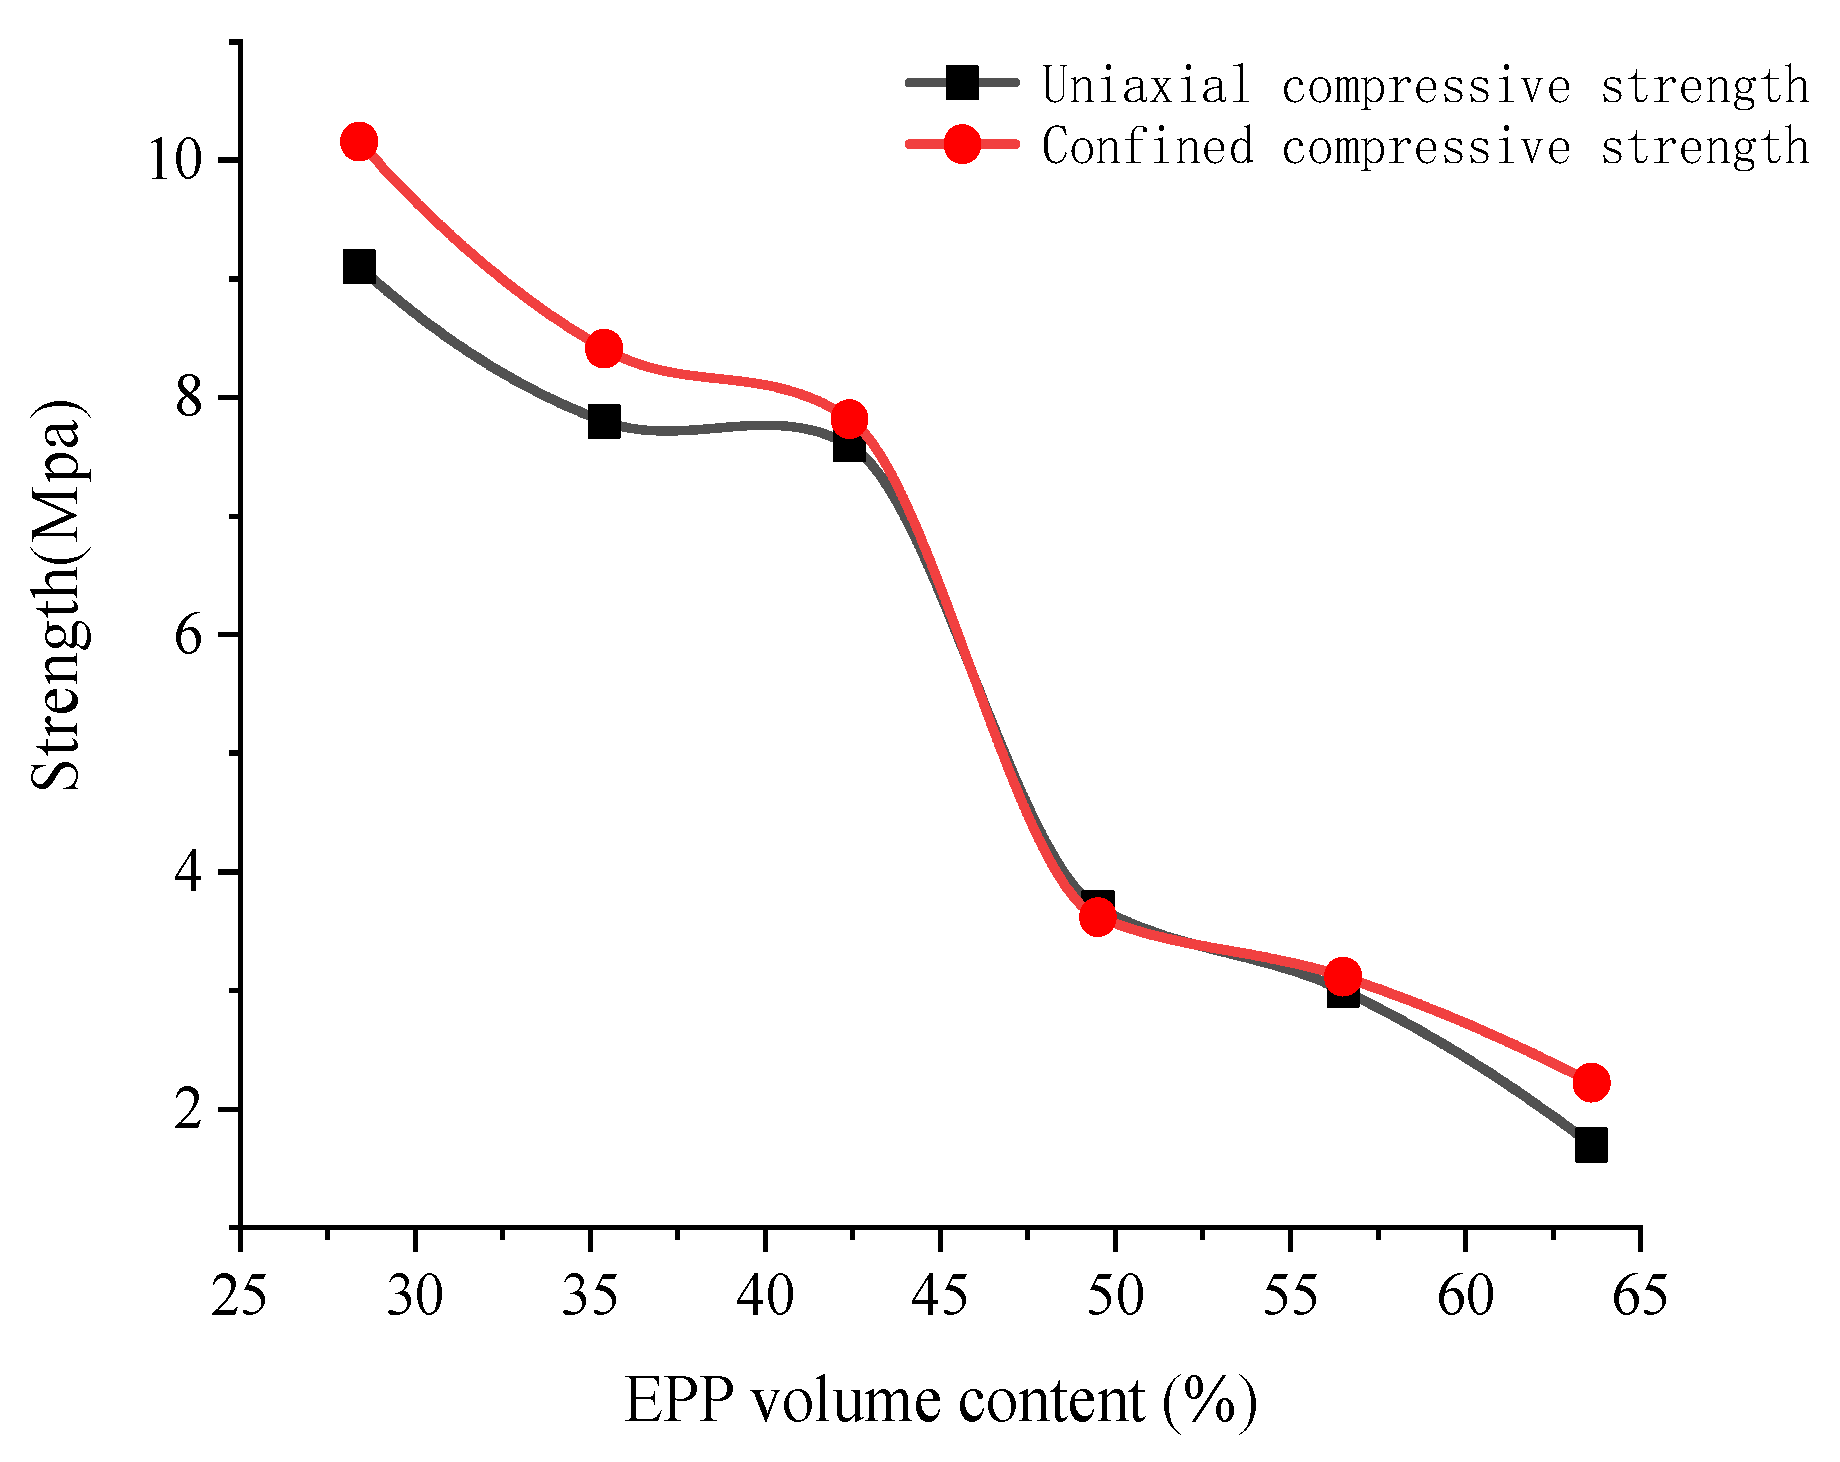
As can be seen in Figure 6, an increase in the EPP particle content led to a decrease in the uniaxial compressive strength of the EPP concrete. Moreover, the strength of each group was 10.2 MPa, 8.4 MPa, 7.8 MPa, 3.6 MPa, 3.1 MPa and 2.2 MPa, respectively. Referring to the A1 group with 28% of EPP particle volume content, the compressive strength of the A2-A6 groups decreased by 17.2%, 23.0%, 64.4%, 69.3% and 78.1% under the condition of lateral restraint, respectively. Also, the decreasing trend and amplitude were also observed to be very close to the uniaxial compressive strength, which corroborates the EPP concrete still being a brittle material. Additionally, the lateral strain of concrete before the whole structure was destroyed under uniaxial stress was micro-strain, which could not be limited by the steel sleeve. Hence, the lateral restraint condition can be concluded to be right.

4.2. Stress–Strain Curve Analysis

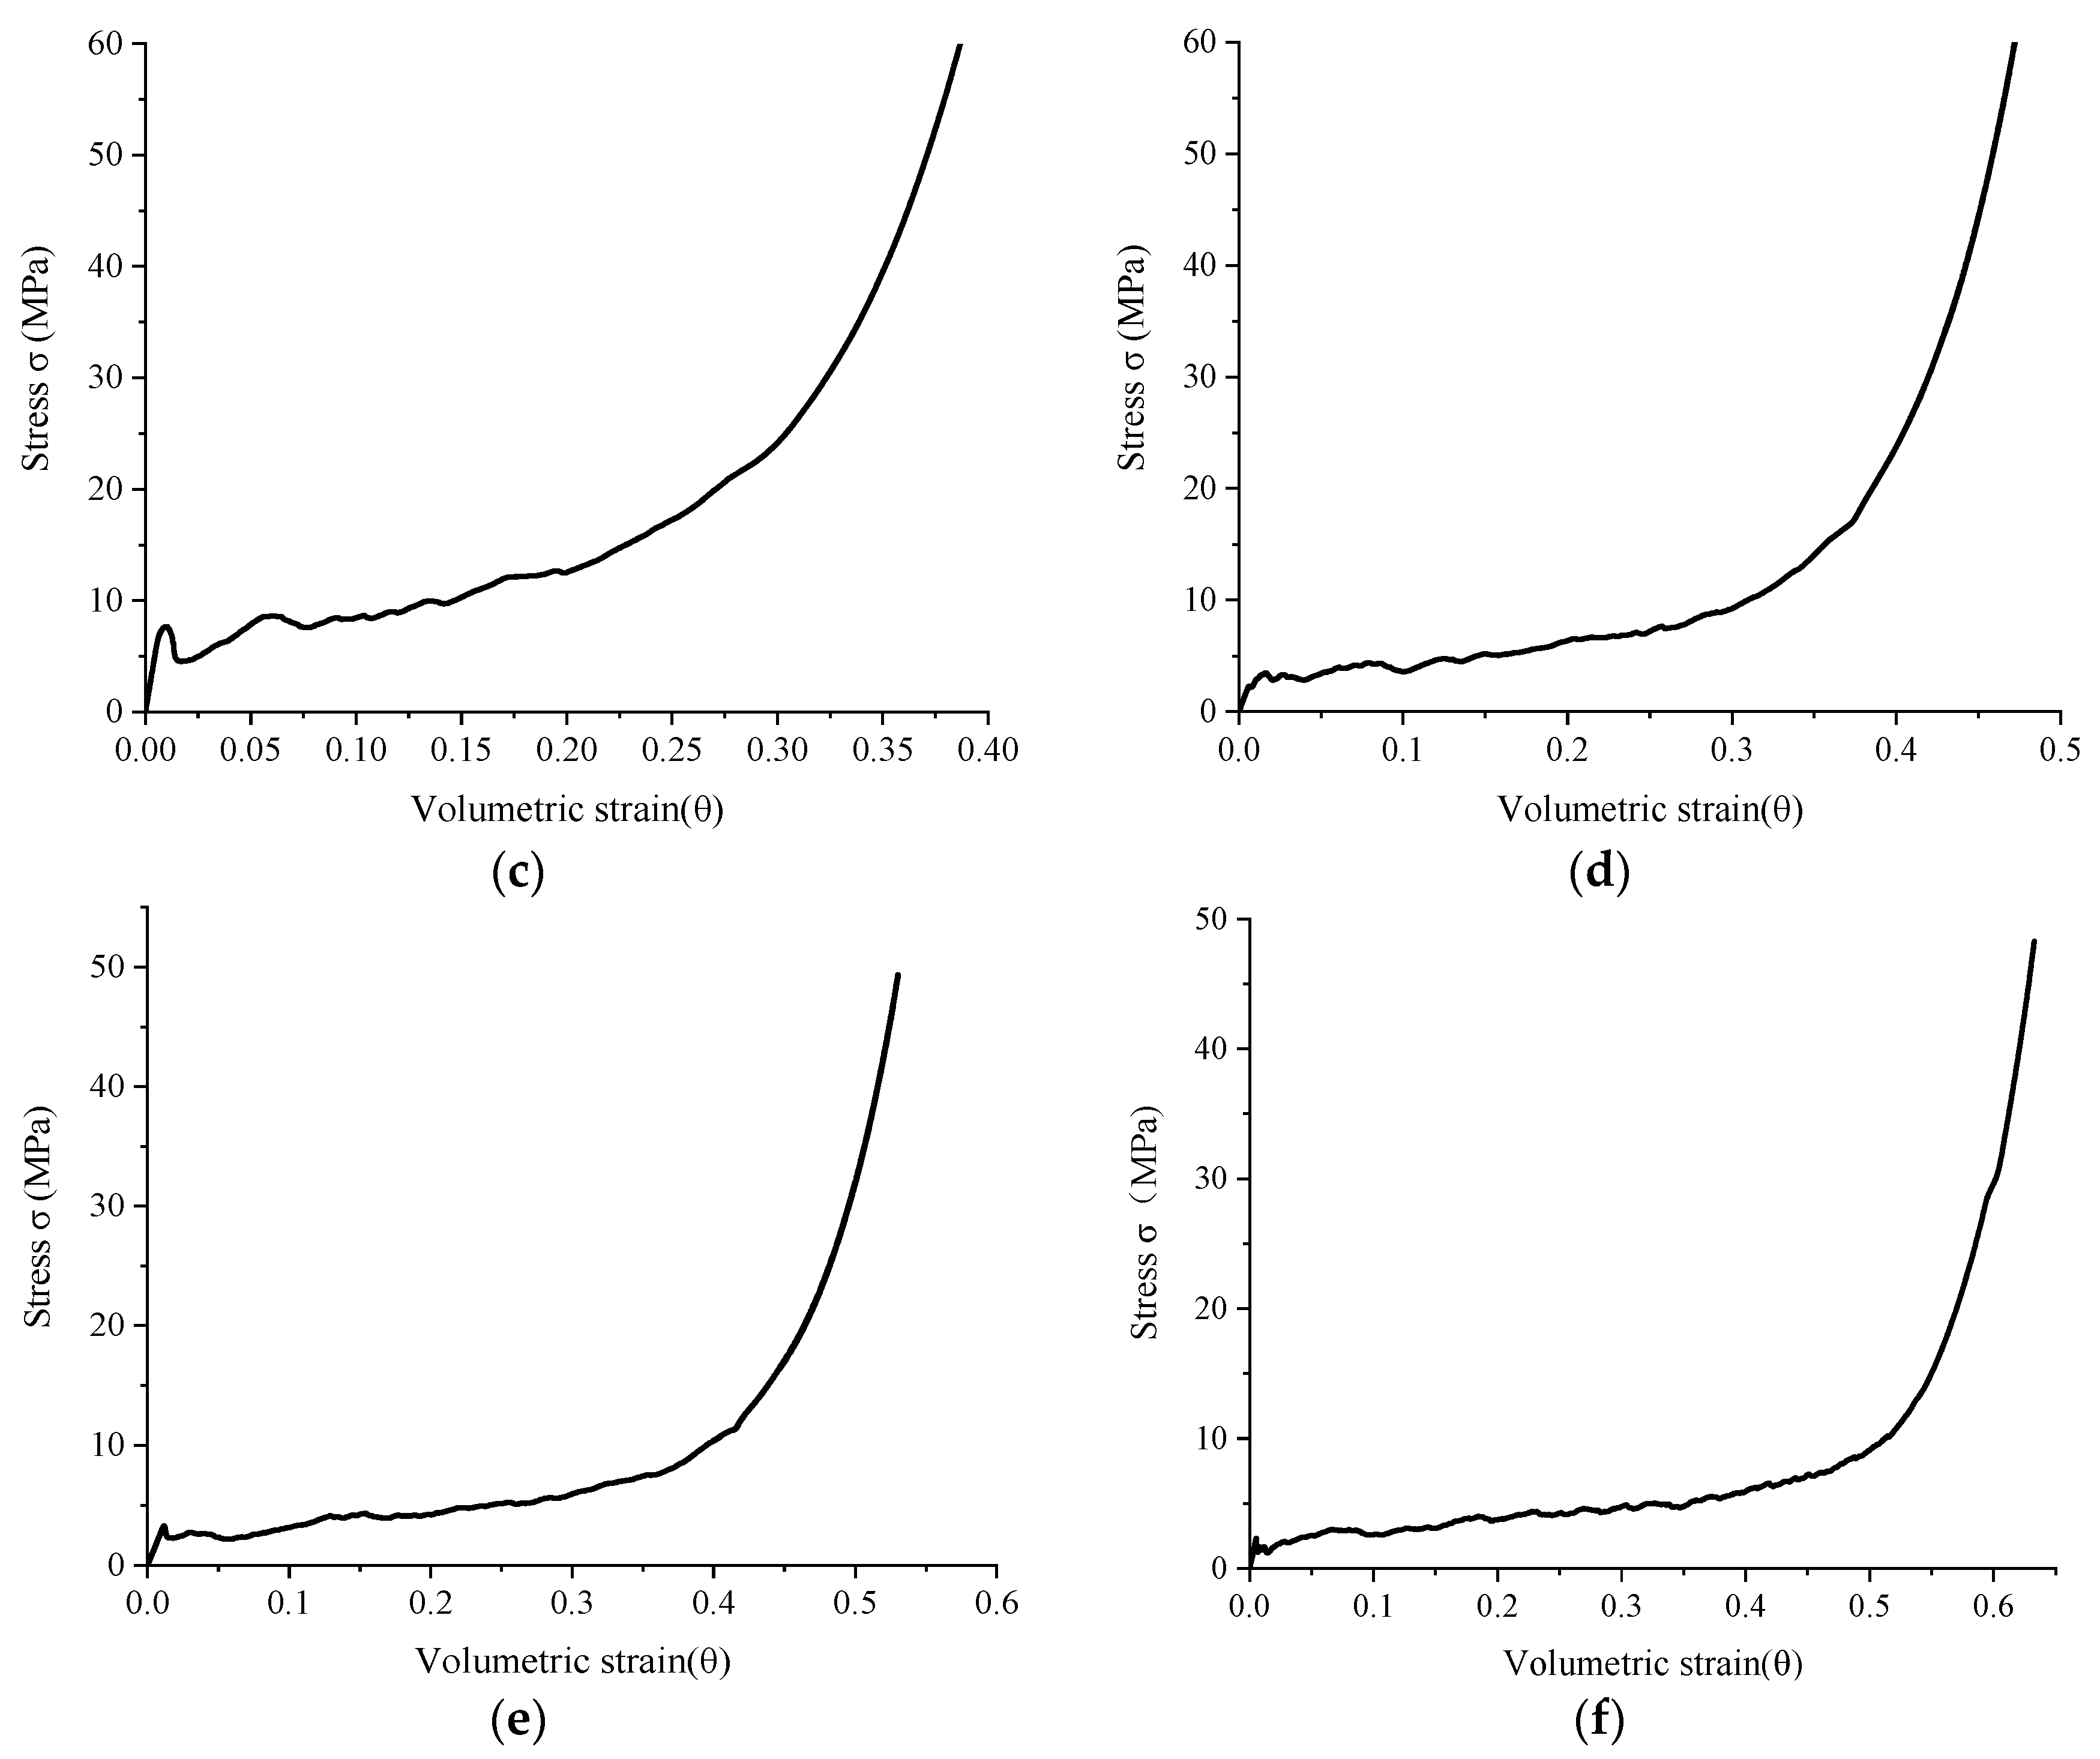
Based on the results obtained from the analysis of the stress–strain curve, the deformation of the specimen was observed to be caused by the compression of the pores in the EPP concrete. Accordingly, the deformation parameters were expressed by the volume strain. Moreover, as the compression specimen was laterally restrained by the steel sleeve, as well as the fact that the cross-sectional area of the specimen was basically unchanged, the volume strain can be simplified as the vertical strain of the specimen (Formula (1)).
θ = Δ V V = Δ a a
where θ stands for the volume strain value, ΔV denotes the volume compression (mm3), V represents the volume of the EPP concrete cube specimen (106 mm3), Δα is the vertical compression deformation value and α is the side length of the EPP concrete cube specimen (100 mm). The stress–volume strain curve obtained from the test is shown in Figure 7.
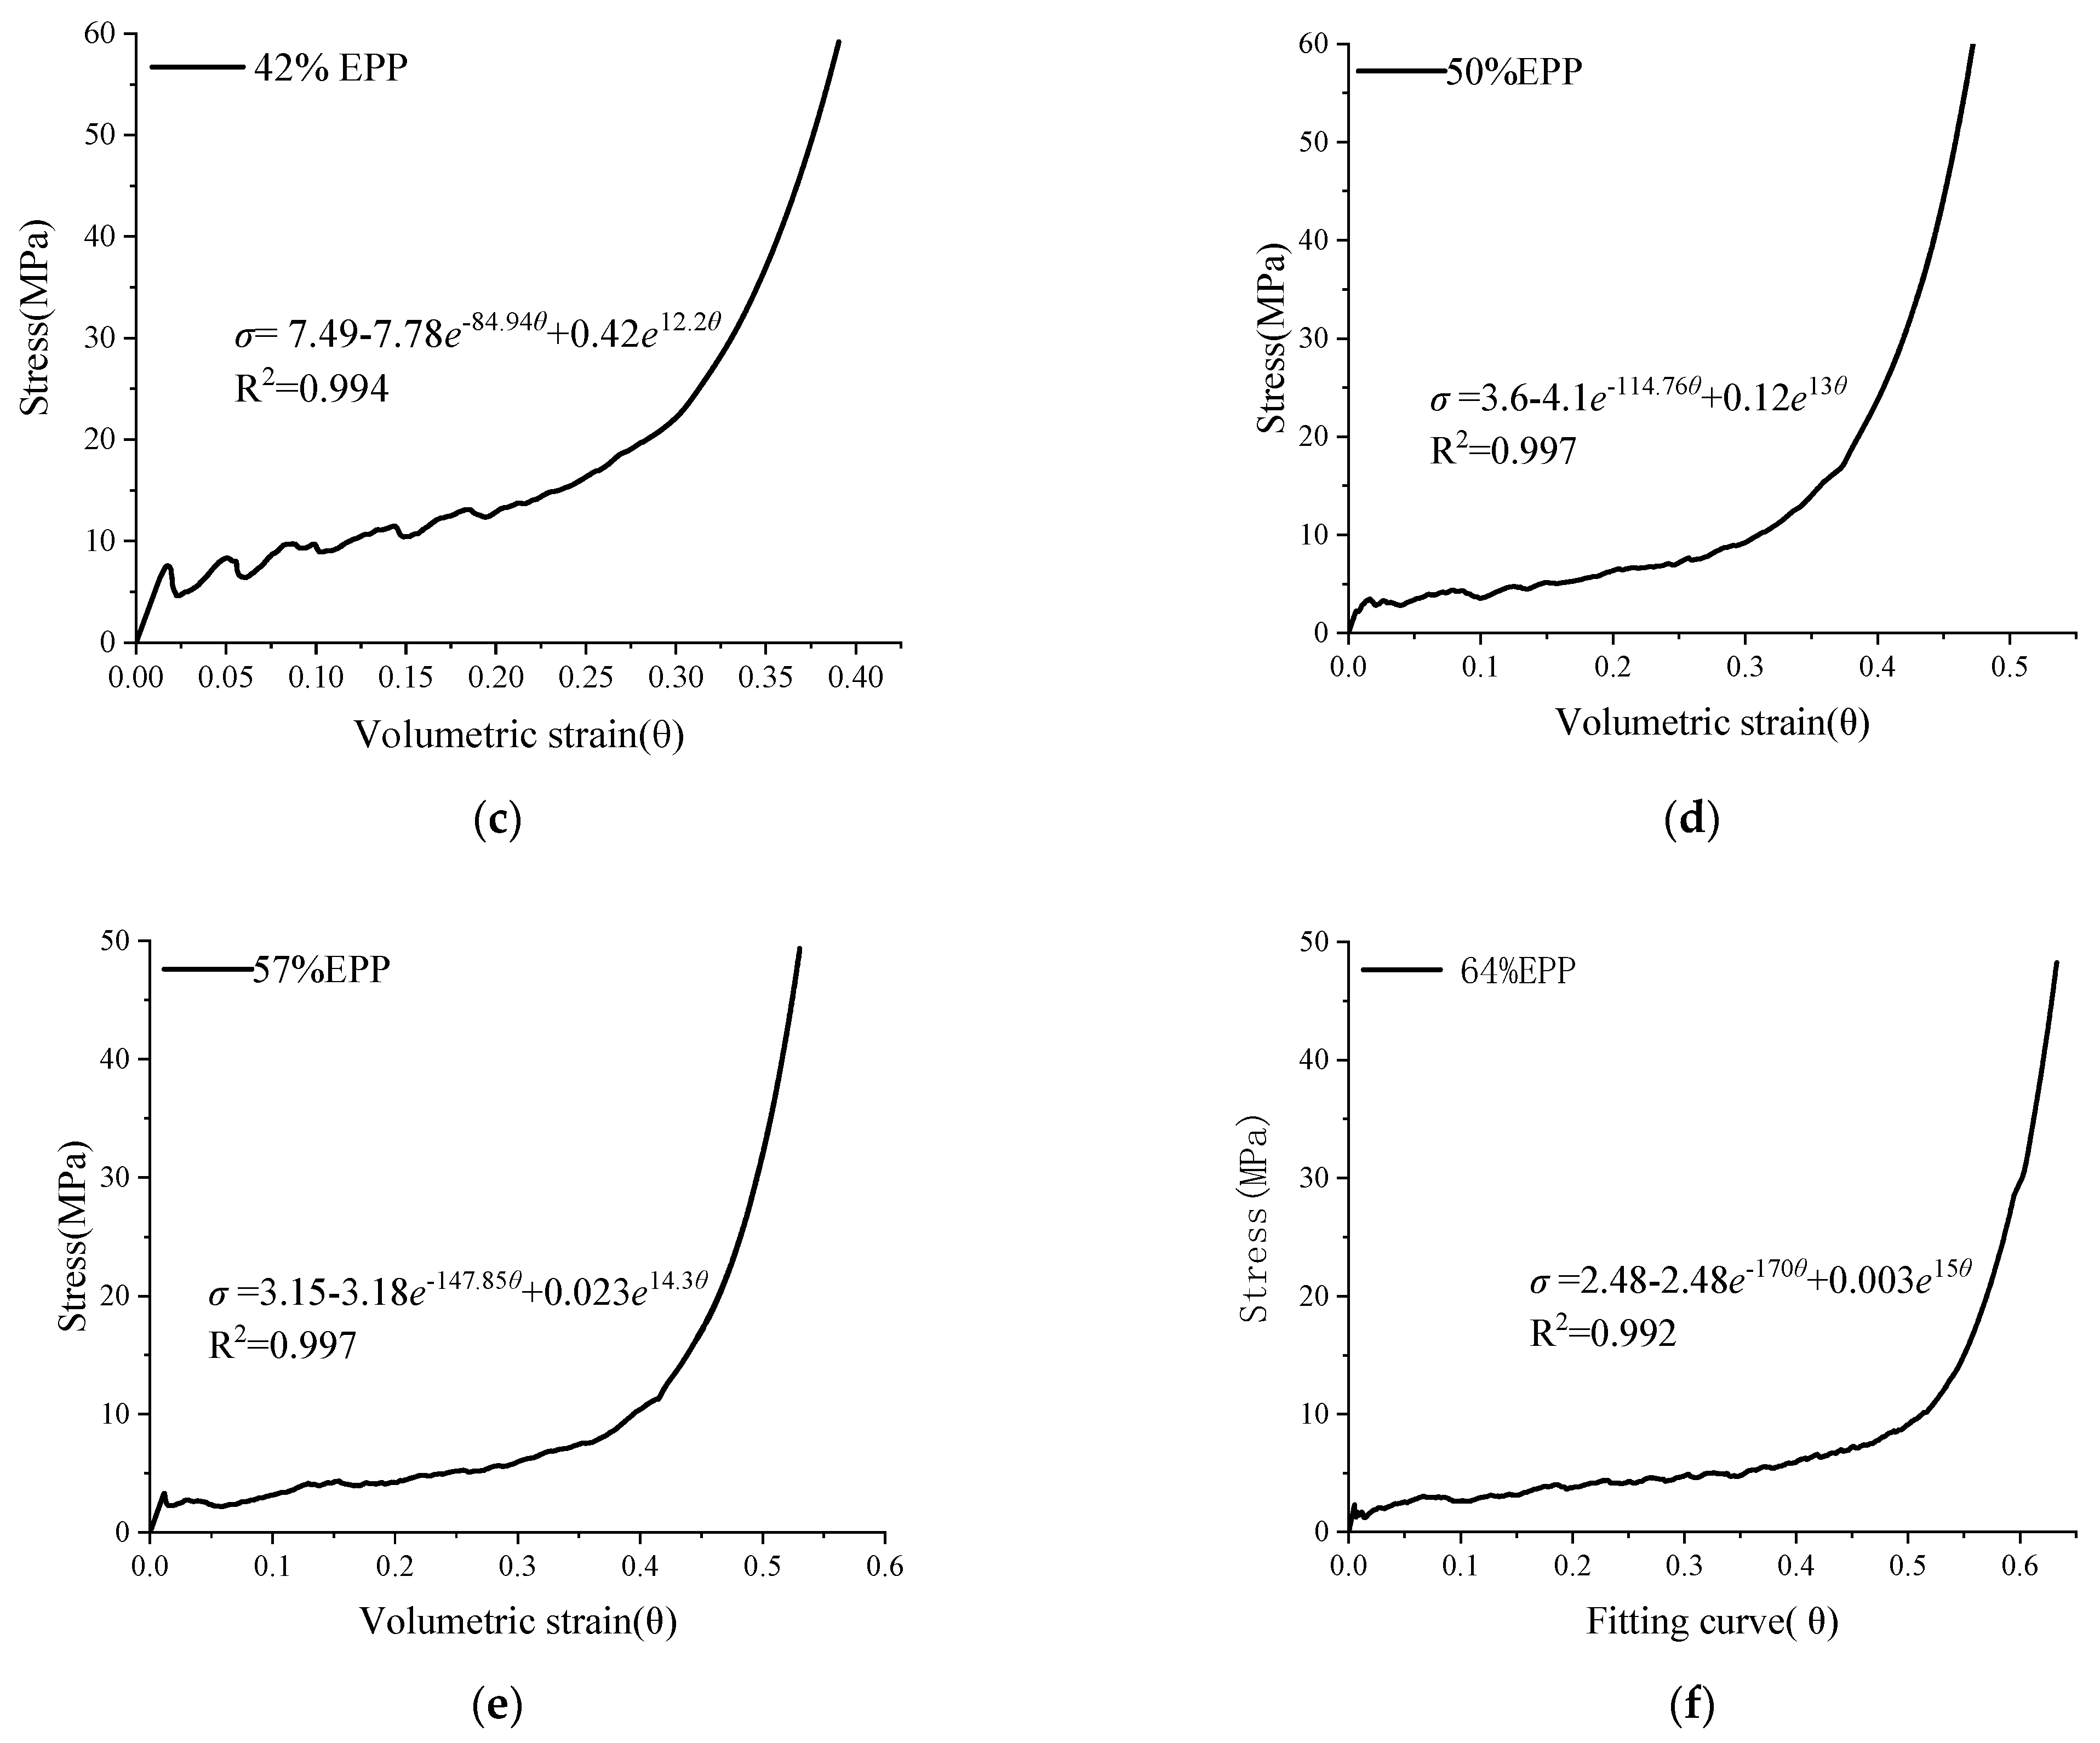
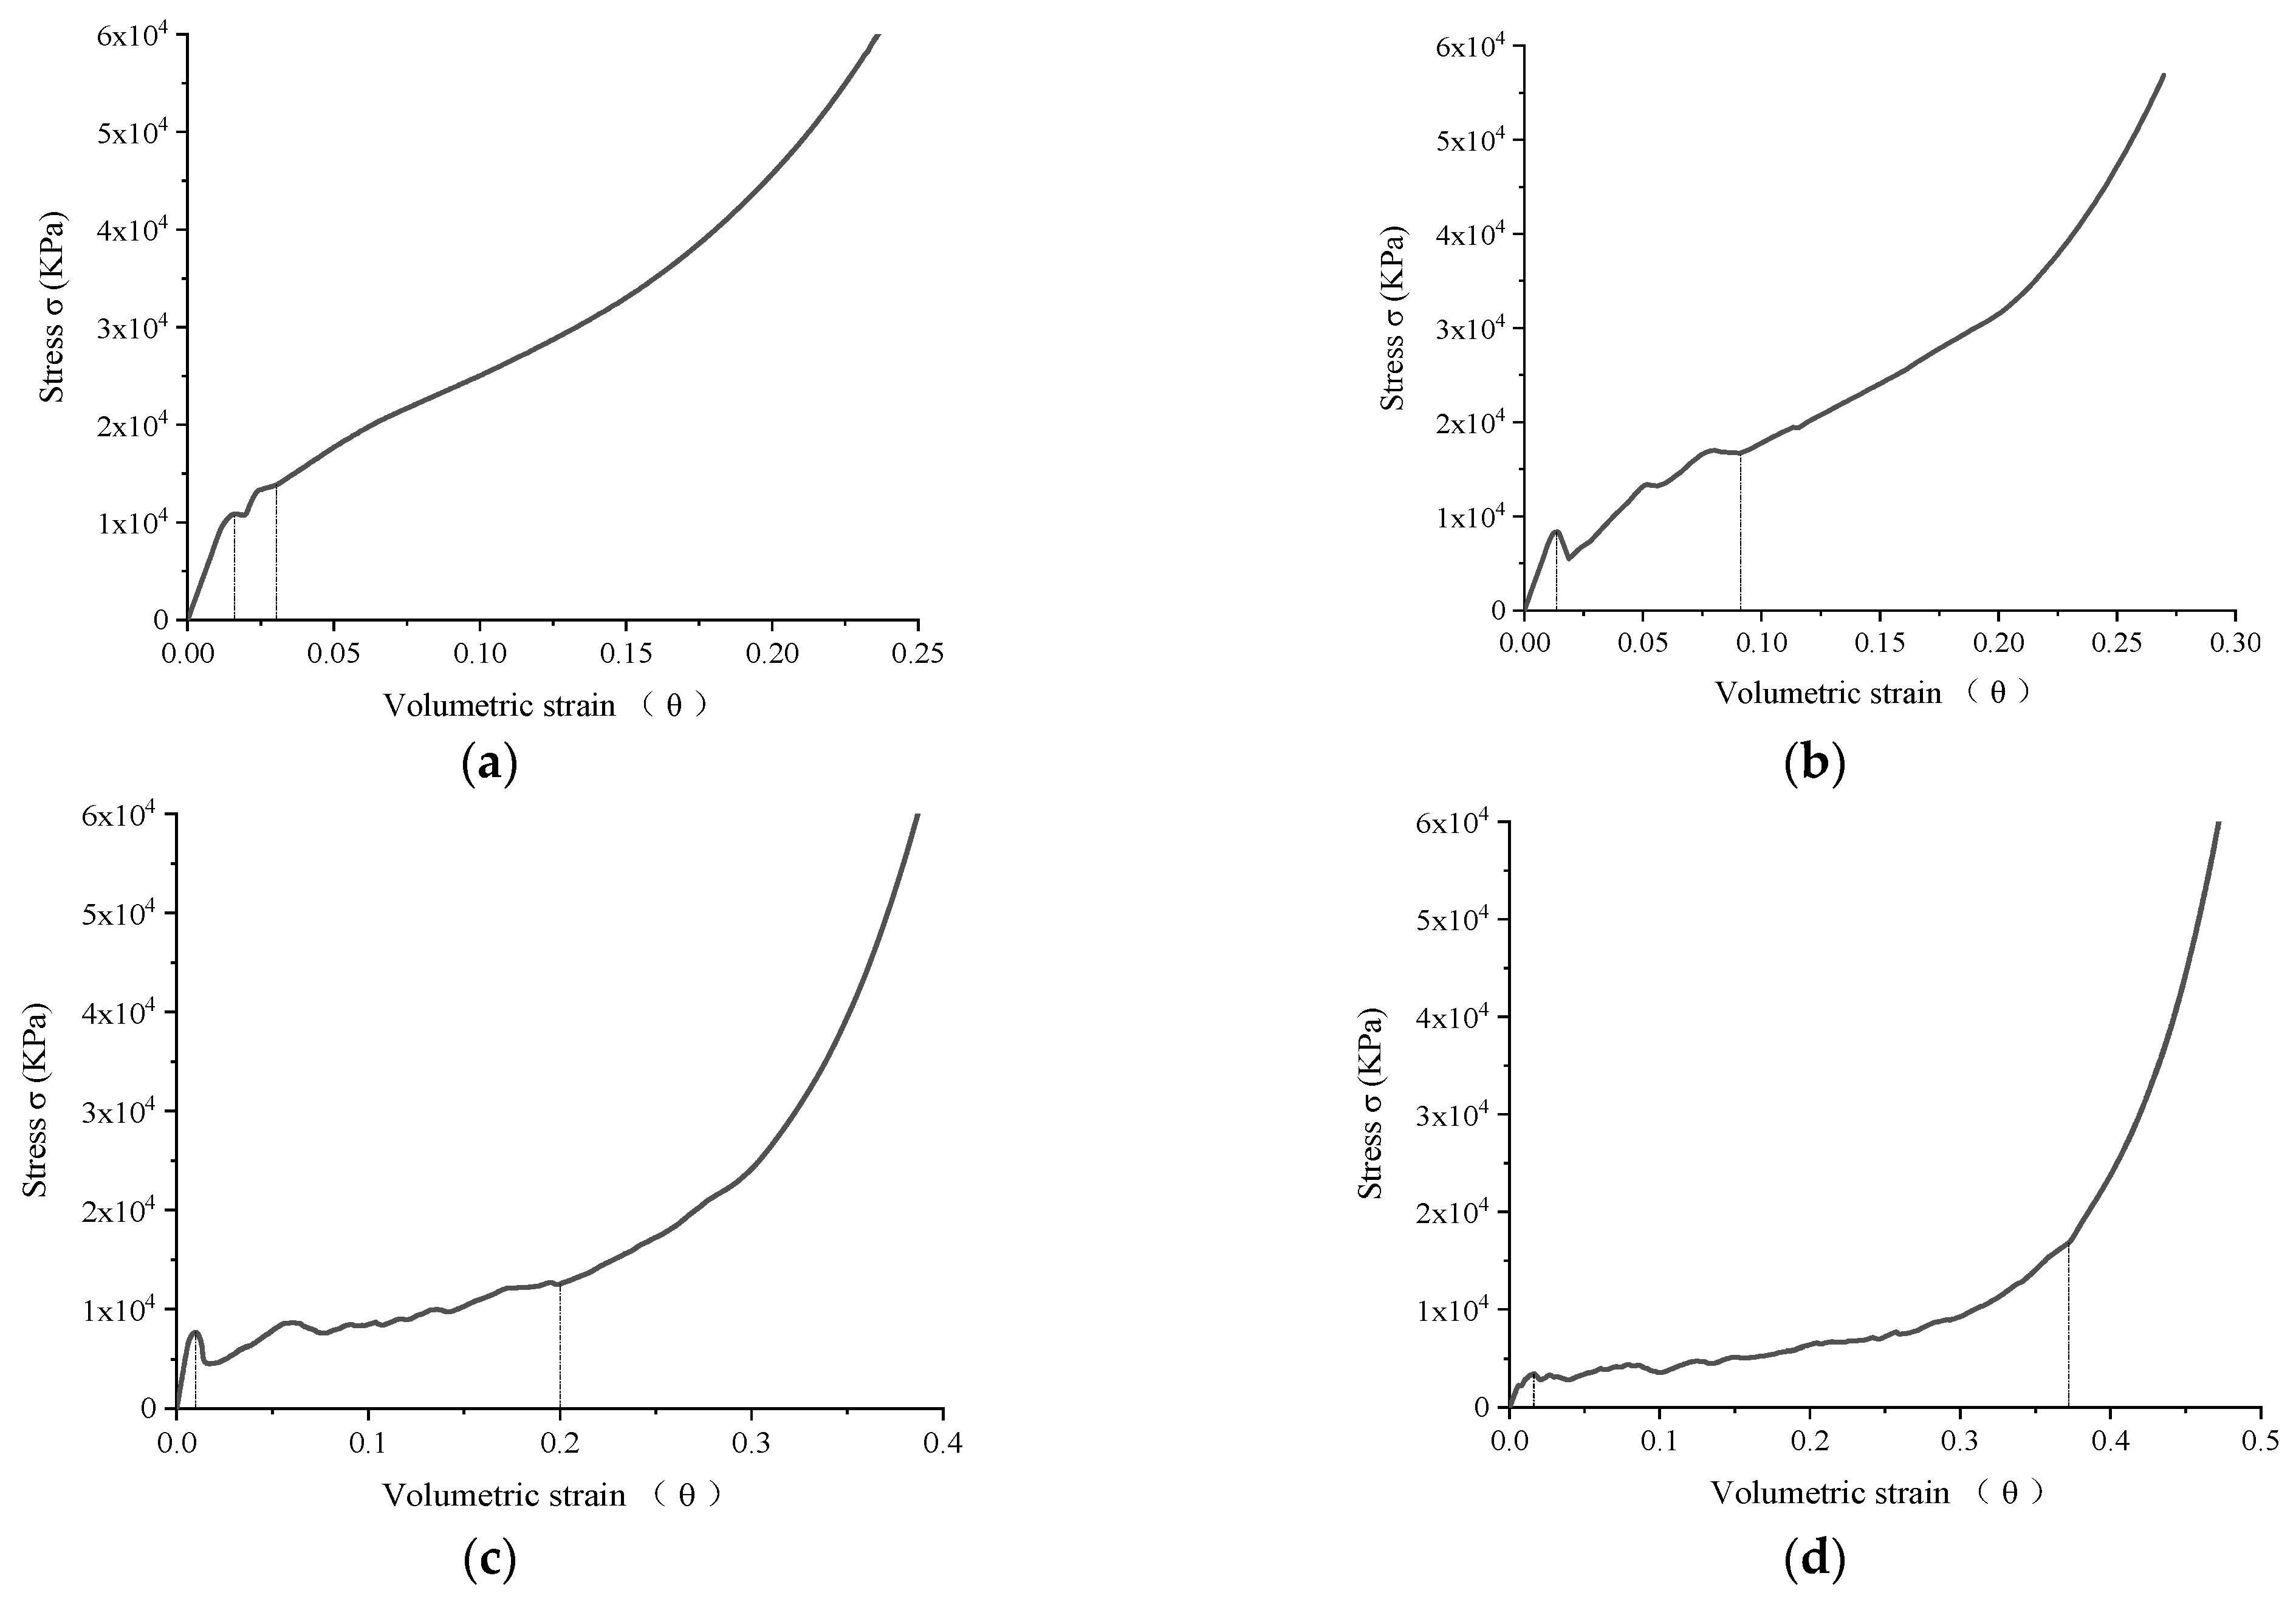
As can be seen in Figure 7, the compressive stress–volume strain curves of the six groups of EPP concrete specimens (A1–A6) display the characteristics shown in Figure 8. Moreover, the curves can also be divided into three stages, namely, the elastic-plastic stage, the compression platform stage and the strain hardening stage. Furthermore, the higher EPP particle content was found to result in the more obvious boundary points of the compression platform stage and the dense compression stage.
Elasto-plastic stage: From the beginning of the loading to the first peak stress, the EPP concrete specimen was compressed. As a consequence, the increase in the volume strain was observed to lead to a rapid increase in the stress. Moreover, the relationship between the stress and the volume strain first increased linearly on the curve. Later, as a typical structural failure phenomenon of brittle materials, the curve increased with a decreasing slope until the compressive stress reached its peak strength. Compression platform stage: An obvious unloading phenomenon was observed when the structure of the concrete specimen was entirely destroyed. Moreover, an obvious stress drop phenomenon was also noticed on the stress–strain curve, on which the strain and the stress rapidly increased and decreased, respectively. Contrary to the results obtained from the ordinary uniaxial compression test, as the EPP concrete specimen was placed in the steel sleeve, the concrete fragments after the failure surface were confined to the steel sleeve. Consequently, the stress–strain curve began to increase after falling to a certain extent. This is when the pores inside the specimen began to collapse. Subsequently, the stress increased and fell several times, which resulted in the stress–strain curve displaying a long plateau stage. The curve was not horizontal at this stage. However, as the whole concrete structure was gradually broken and the internal pores of the specimen were compressed and collapsed layer by layer, the curve slowly rose in the shock. This can be also seen in the multiple fluctuation points of the curve until most of the pores were compressed and compacted. At the same time, the higher the EPP particle content, the longer the compression platform section and the more fluctuation points. Strain hardening stage: After most of the pores in the EPP concrete specimens were compressed and compacted, the slope of the stress–strain curve simultaneously began to increase rapidly. At this point, being under pressure, the crushed cement mortar fragments in the compression platform stage became dense. Moreover, the gap between the fragments was observed to be much smaller than the pores which were formed by the EPP particles. So, the slope of the curve increased rapidly until the fragments were completely compacted. This suggests the volume of the specimen to be completely compressed, similar to the load after the complete compression.

4.3. Constitutive Relation of EPP Concrete under Confined Compression

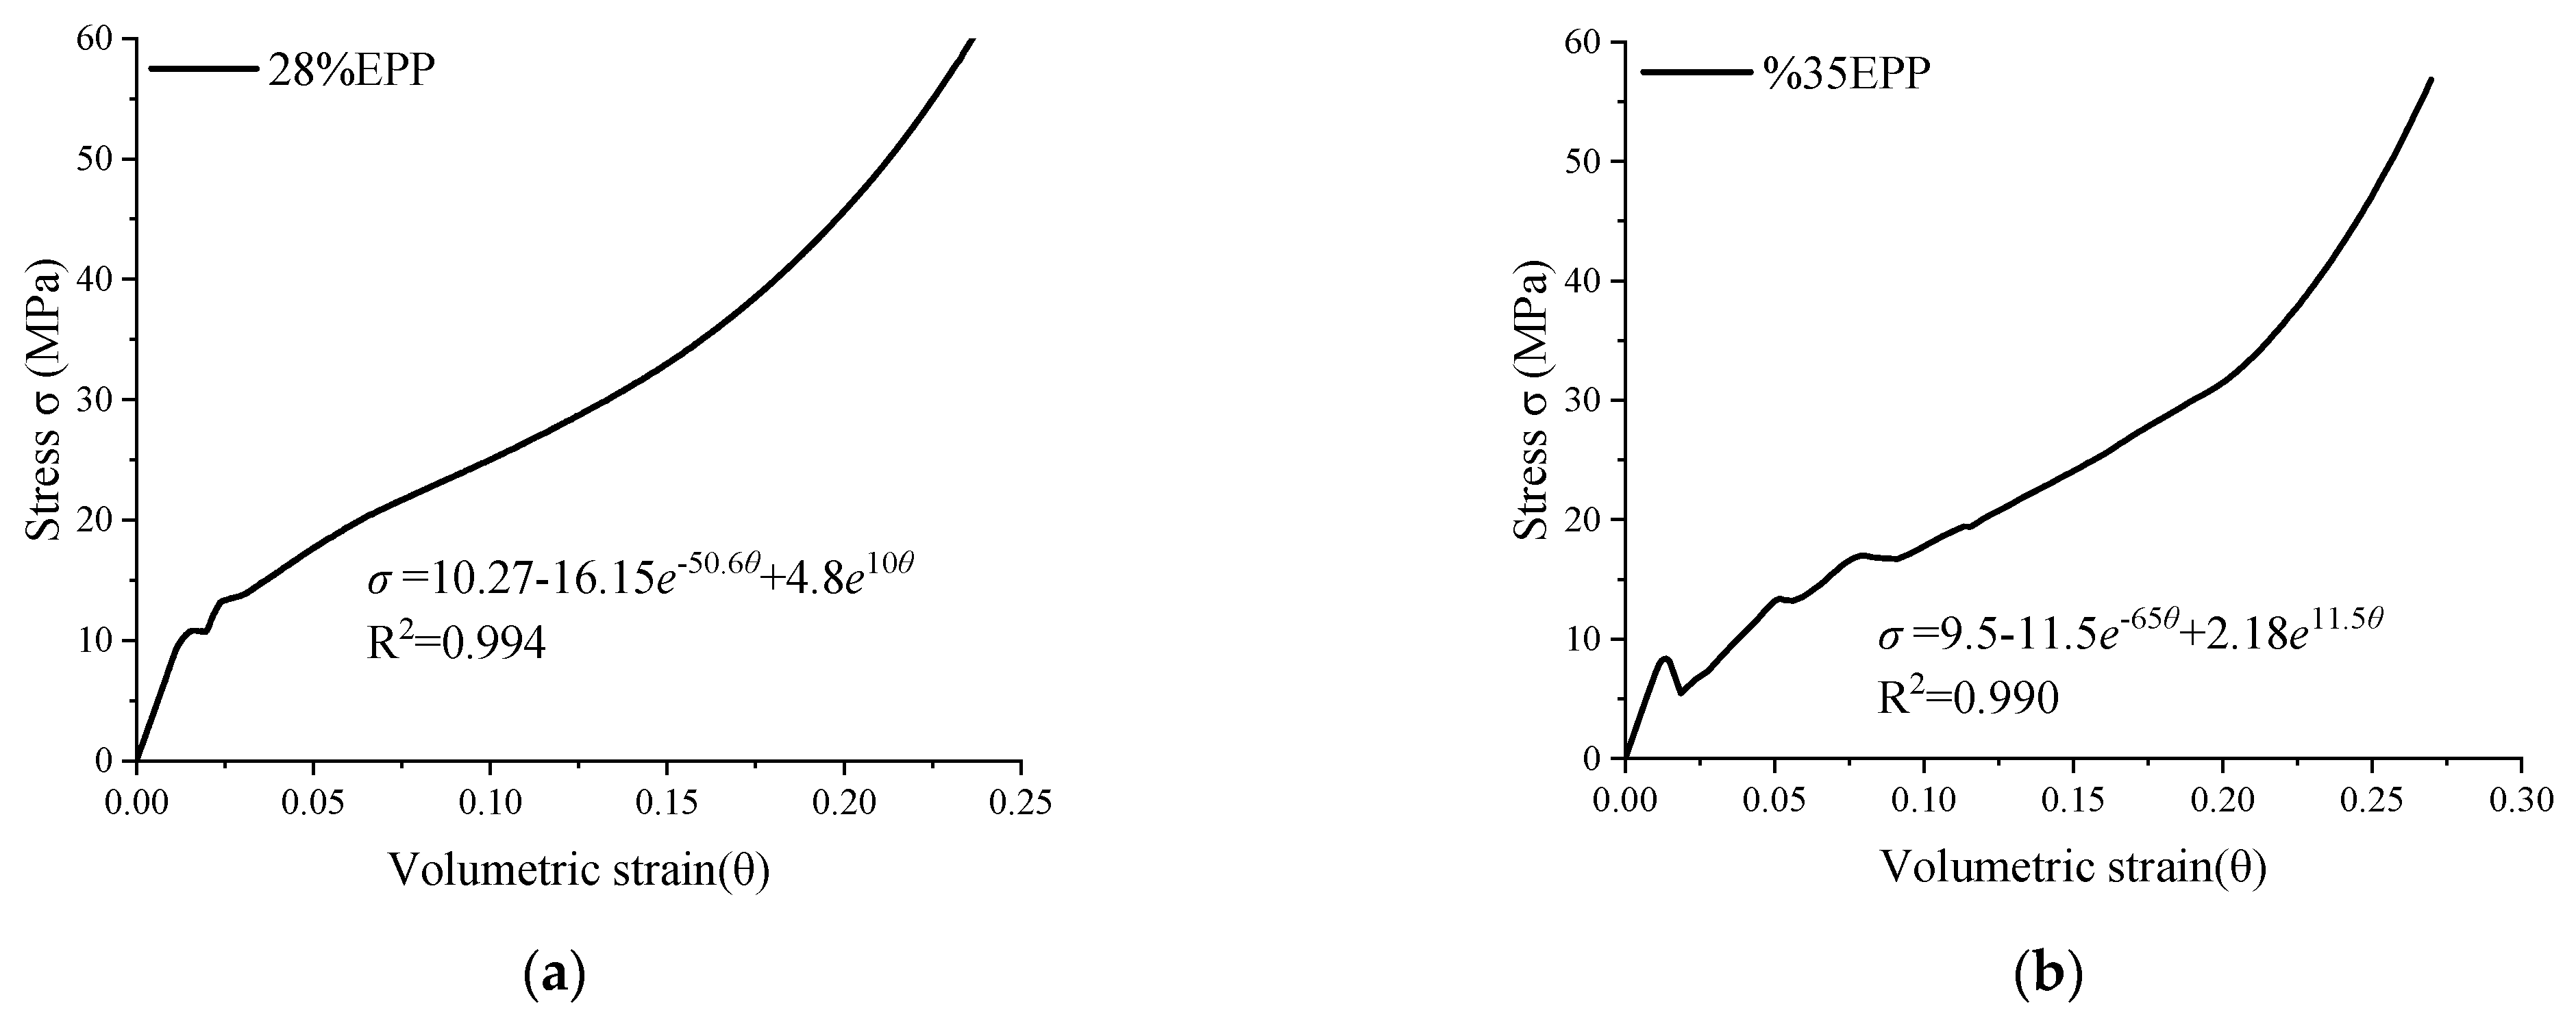
Considering the differences between the EPP concrete preparation and the various physical and mechanical tests, a few data points in the measured data were found to be abnormal. Moreover, to examine the similarities in the mechanical characteristics of the same material, the measured stress–volume strain curve (Figure 9) was used to establish the functional relationship between the stress and the volume strain based on Formula (2) (Table 3 and Figure 8).
σ = K 1 + K 2 e α · θ + K 3 e β · θ
where, K1, K2, K3, α and β stand for the fitting formula coefficient, σ represents the compressive stress value of the EPP concrete section and θ denotes the volume strain value of EPP concrete under compression.
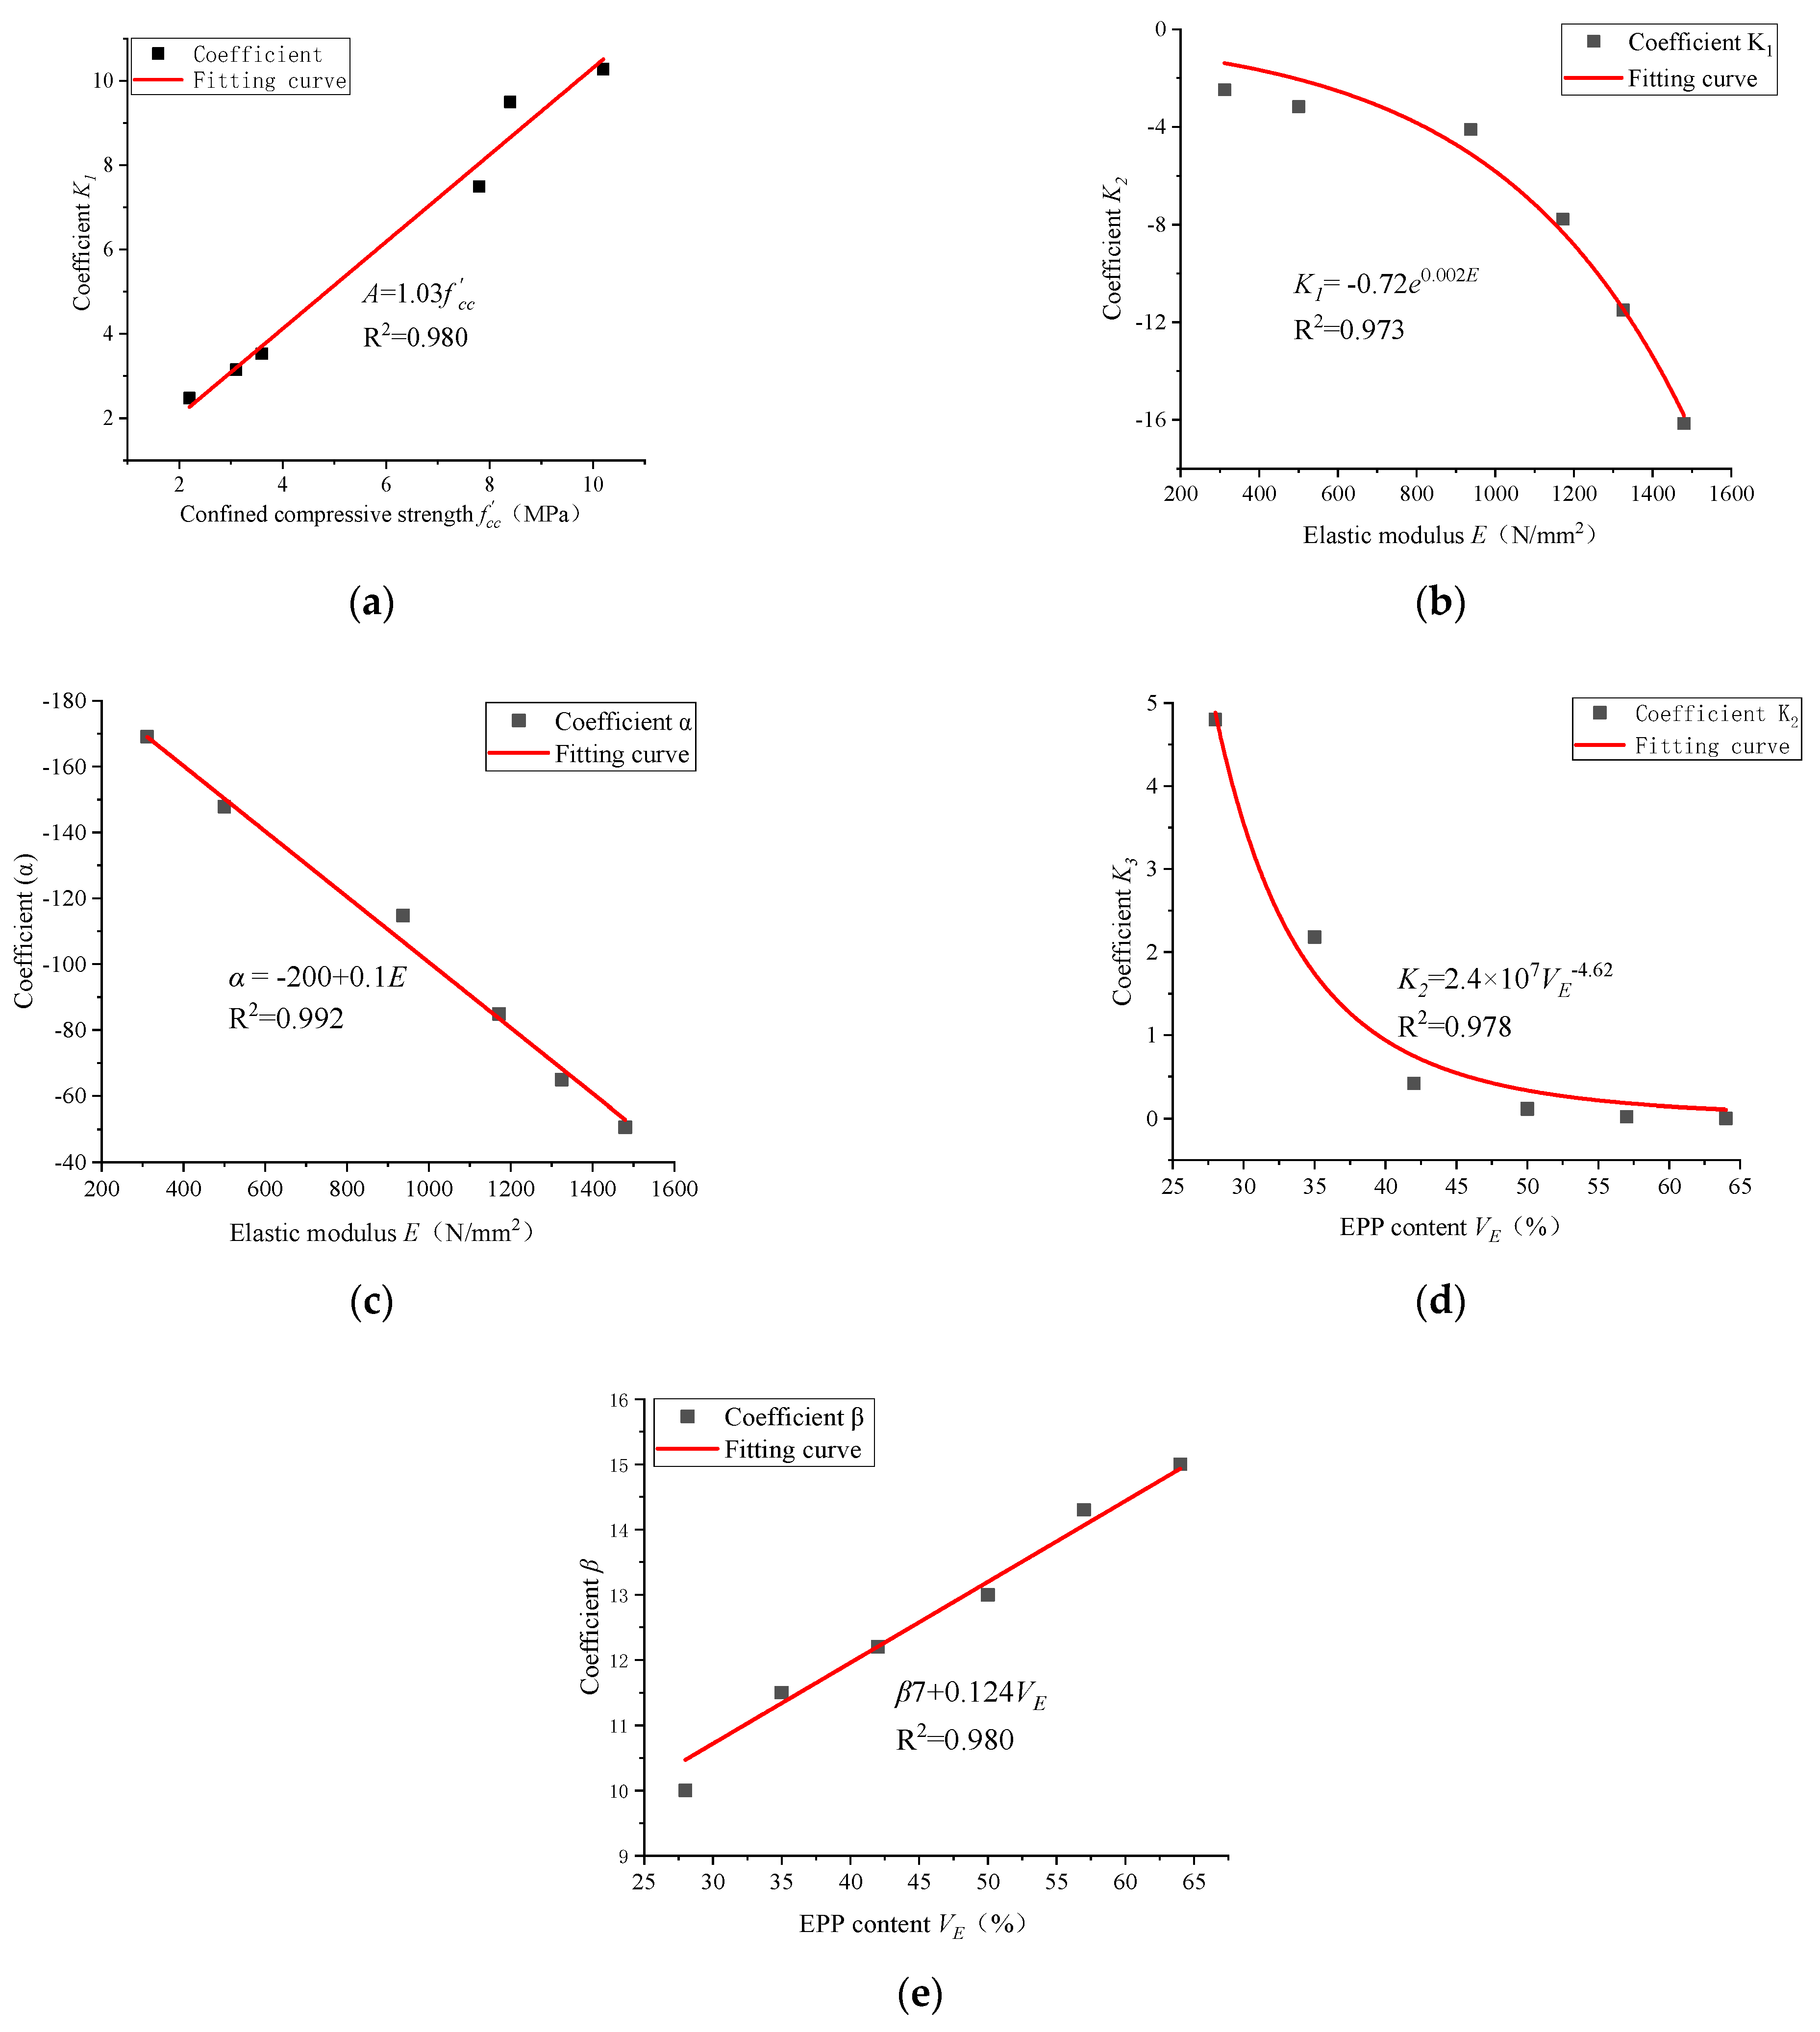
As can be seen in Figure 8, according to the function characteristics and the changing trend of various coefficients, the fitting relationship between the confined compressive strength, elastic modulus, EPP particle volume content and various coefficients in Table 3 is established by comparing it with various physical and mechanical parameters of EPP concrete, as shown in Figure 10.
As can be seen in Figure 10, physical and mechanical parameters such as the confined compression VE, the strength f′cc, the elastic modulus e and the EPP particle volume content ve were introduced into Formula (2). Moreover, the constitutive relation of the EPP concrete was established through Formula (3).
σ = 1.03 f c c 0.72 e 0.002 Ε ( 1 + 50 θ ) - 200 θ + 2.4 × 1 0 7 V E 4.62 e ( 0.124 V E + 7 ) θ
where, f′cc represents the confined compressive strength (MPa), E denotes the elastic modulus (N/mm2) and VE stands for the EPP particle volume content (%).

4.4. Analysis of Volume Strain and Compressibility

The energy absorption characteristics of the EPP concrete under external load are reflected in various forms such as deformation, crushing, collapse of internal porous structure and mutual friction of concrete fragments at the micro level. At the macro level, it is reflected in the compression of the overall volume of the specimen. According to the compression characteristics of confined compression of EPP concrete, a reasonable index dense strain θm is proposed to evaluate the compression performance of the concrete according to the stress–volume strain relationship diagram of the confined compression of concrete.
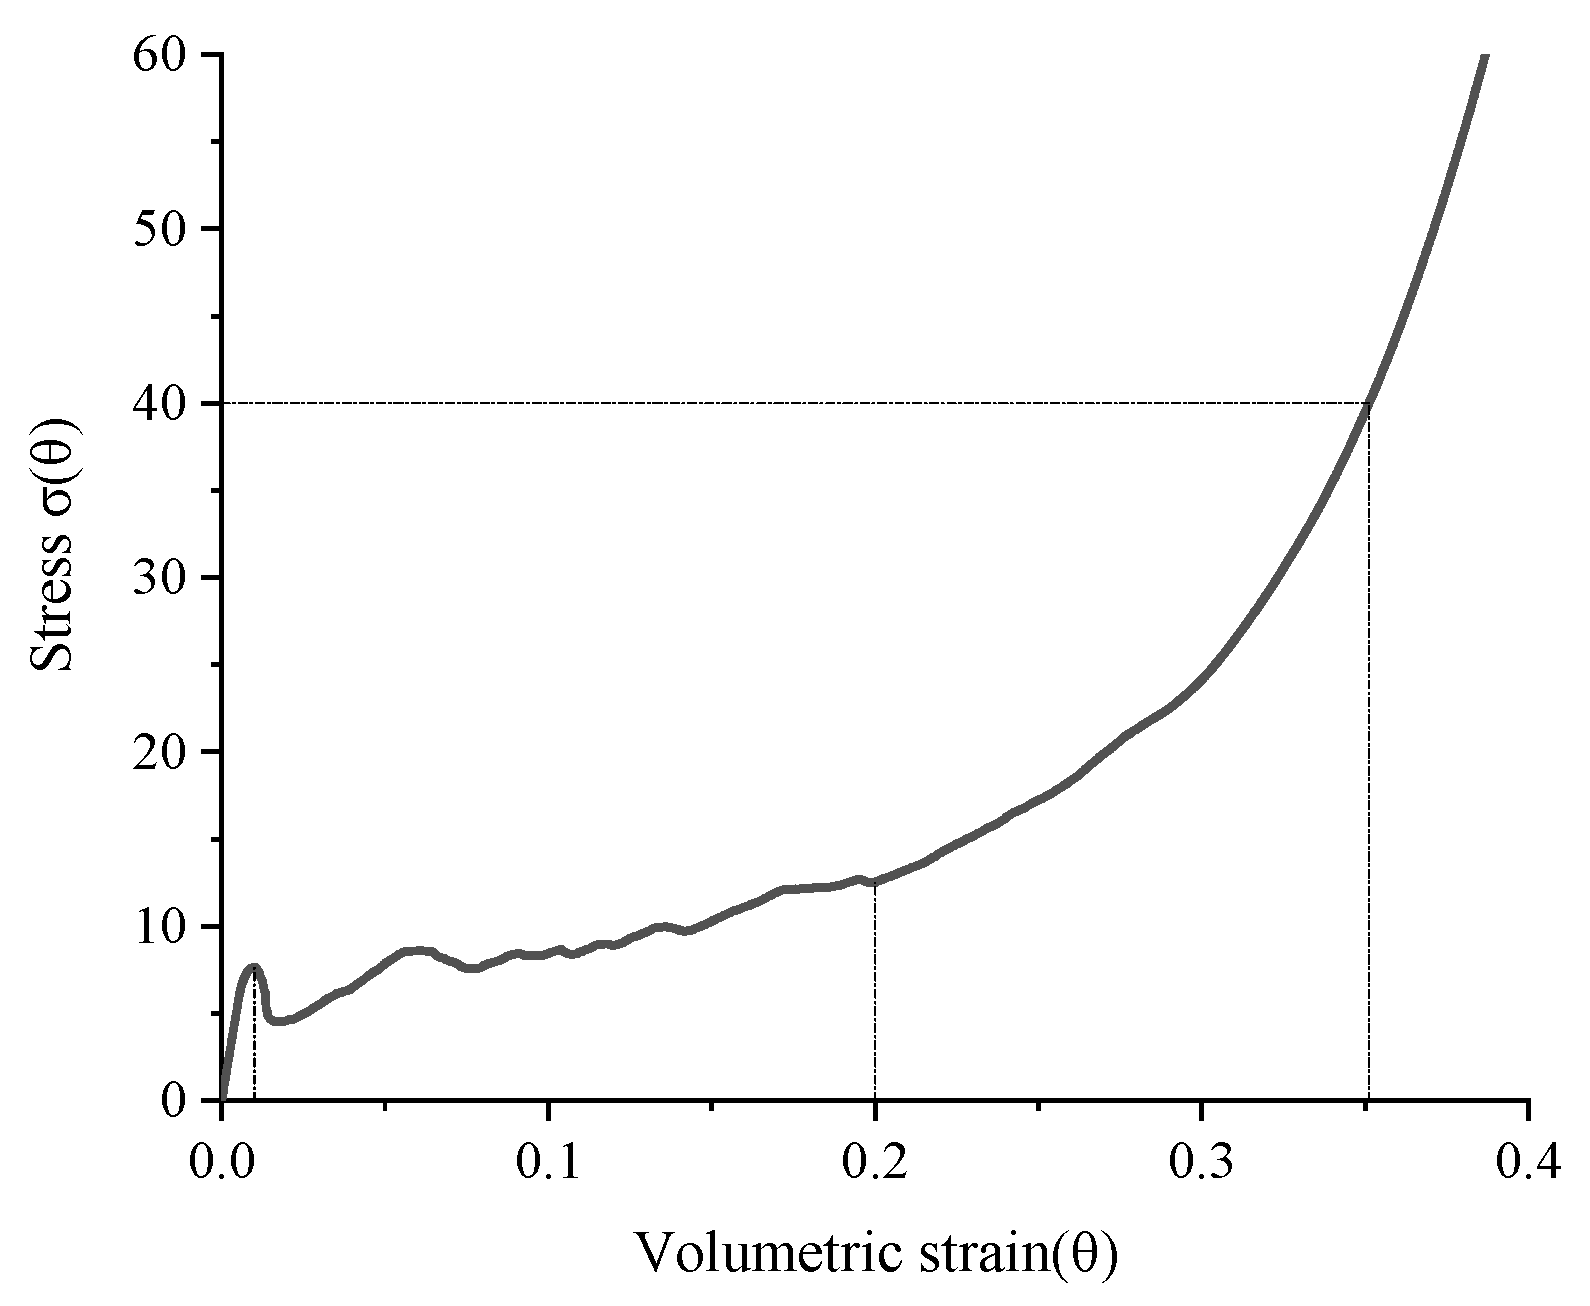
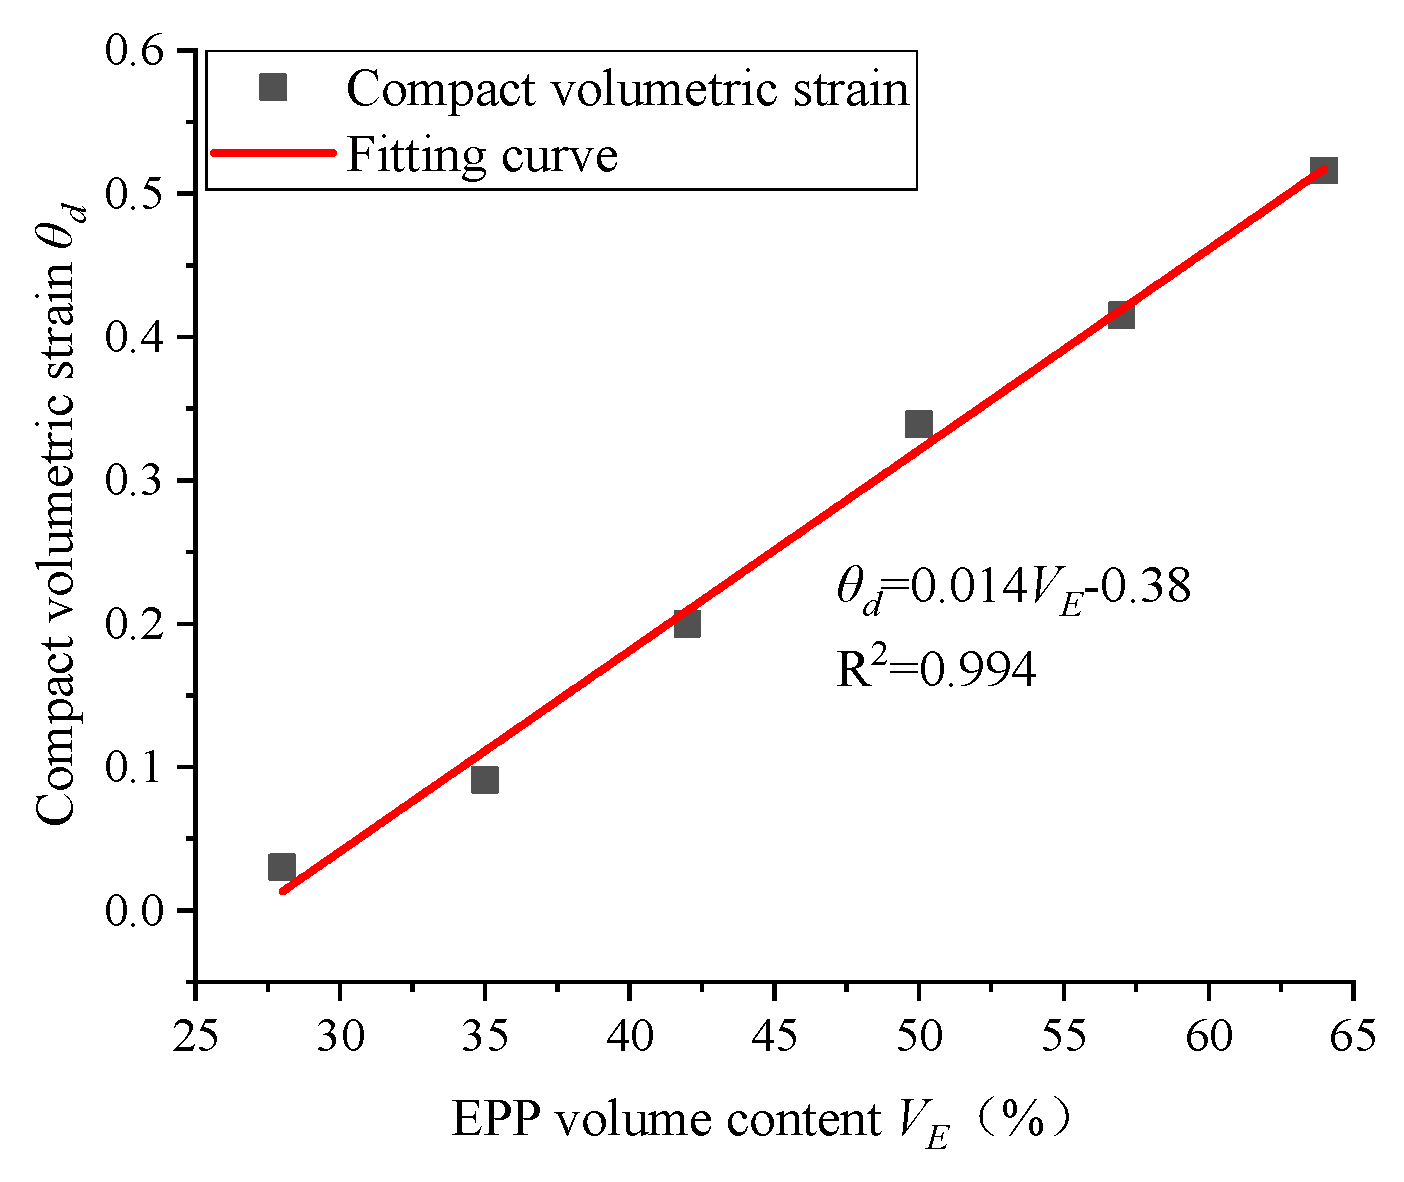
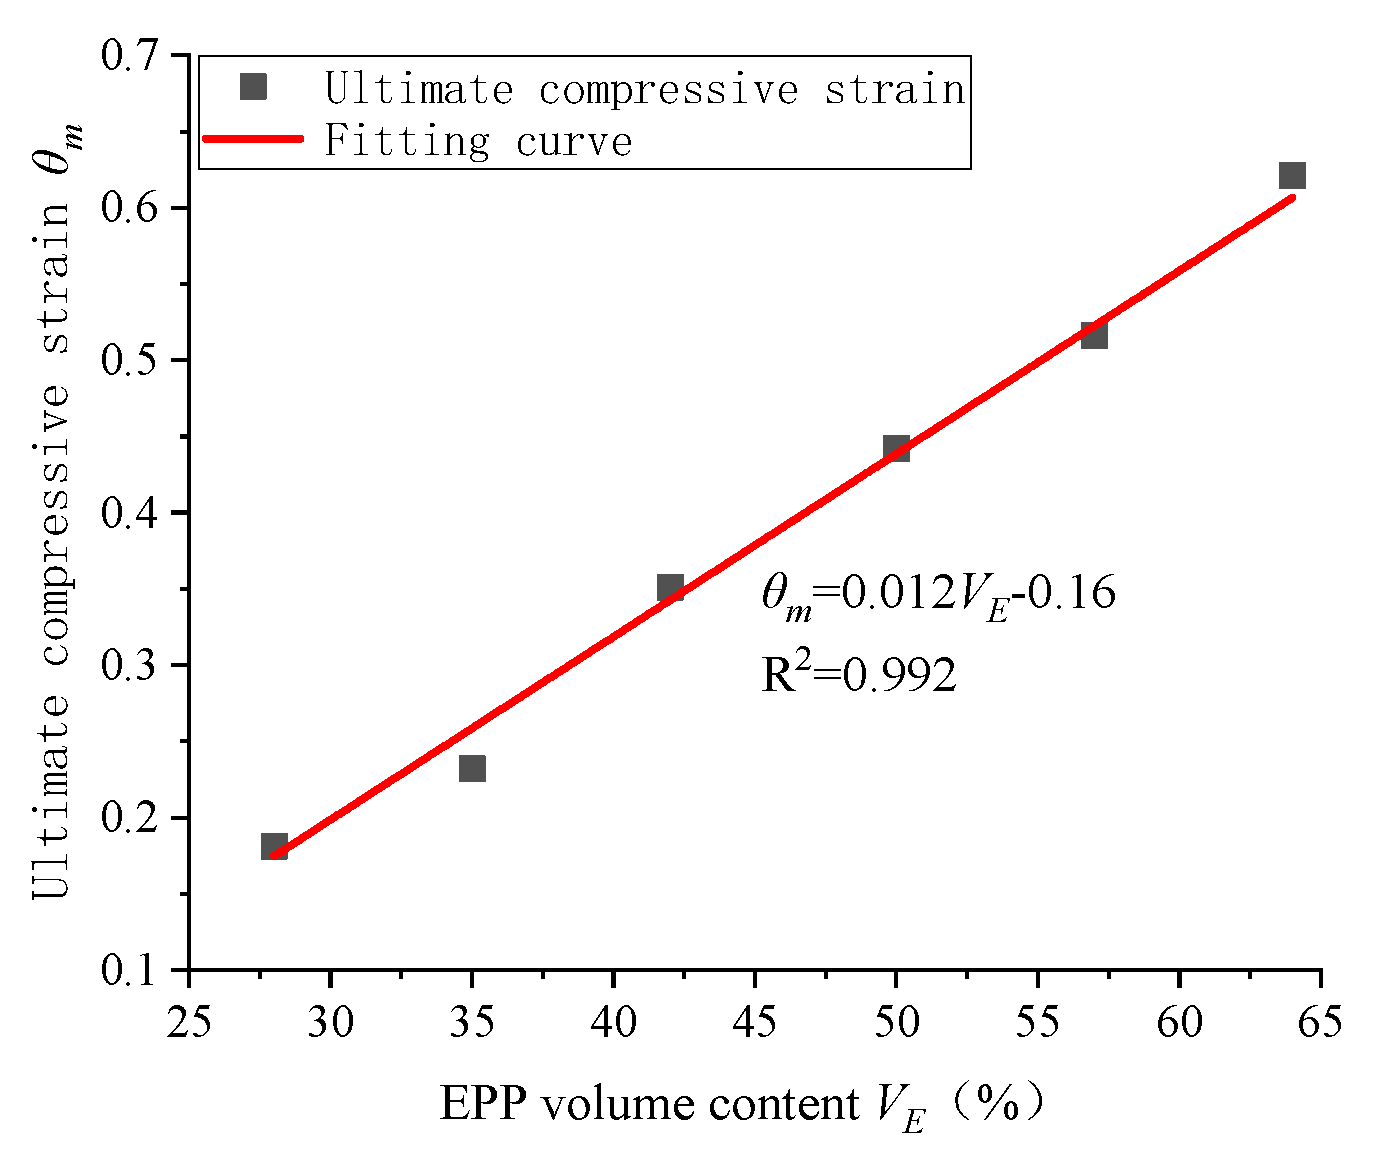
According to Figure 11, the lateral compression stress–volume strain relationship curves of each group of concrete specimens are segmented. The final value of compressive strain in the linear elastic stage is defined as θcc, the final value of compressive strain in the ultimate failure stage is defined as θd and the final value of compressive strain (dense strain) in the confined compression platform stage is defined as θm. Therefore, during the compression process, the EPP concrete first enters the linear elastic stage (0 < θcc). At this stage, the EPP concrete does not change significantly. After reaching the end point, it enters the ultimate failure stage (θcc < θd). The test block cracks and structural damage occurs, with an obvious stress drop phenomenon, and then enters the compression platform stage (θd < θm). At this stage, pore wall collapse and pore filling occur continuously in the EPP concrete. On the curve, it shows that with the increase in strain, the stress increases slowly. After the internal pores of the EPP concrete are filled, it enters the dense hardening stage (θ > θm). At this stage, minimal strain growth occurs and the stress increases sharply. The result shown in the actual test is that after the strain reaches a certain θm value, the stress σ value is close to the vertical rise and the strain θ is almost unchanged. In the test instrument, the abscissa points of the value corresponding to the instantaneous change point are read as the compression performance characteristic value of the EPP concrete material and the ordinate point is read as the ultimate stress value of the EPP concrete material. Therefore, it is reasonable to use θm as the compression limit value of EPP concrete materials with different mix ratios to calculate the limit value of the EPP concrete’s energy absorption. As shown in Figure 12, when the ultimate strain is reached, for the A3 group of the EPP concrete materials, the corresponding stress is 40 MPa and the strain is 0.35. The specific absorption energy calculation is shown in Section 4.3. Therefore, it can be considered that at this point, the EPP concrete (A3) specimen becomes completely dense under pressure, and the cement mortar fragments that become dense after recombination bear the load. Therefore, the volumetric strain value corresponding to a stress value of 40 MPa is defined as the “ultimate compressive strain” θm. The curves of each group from A1 to A6 θd and θm are extracted. See Table 4.
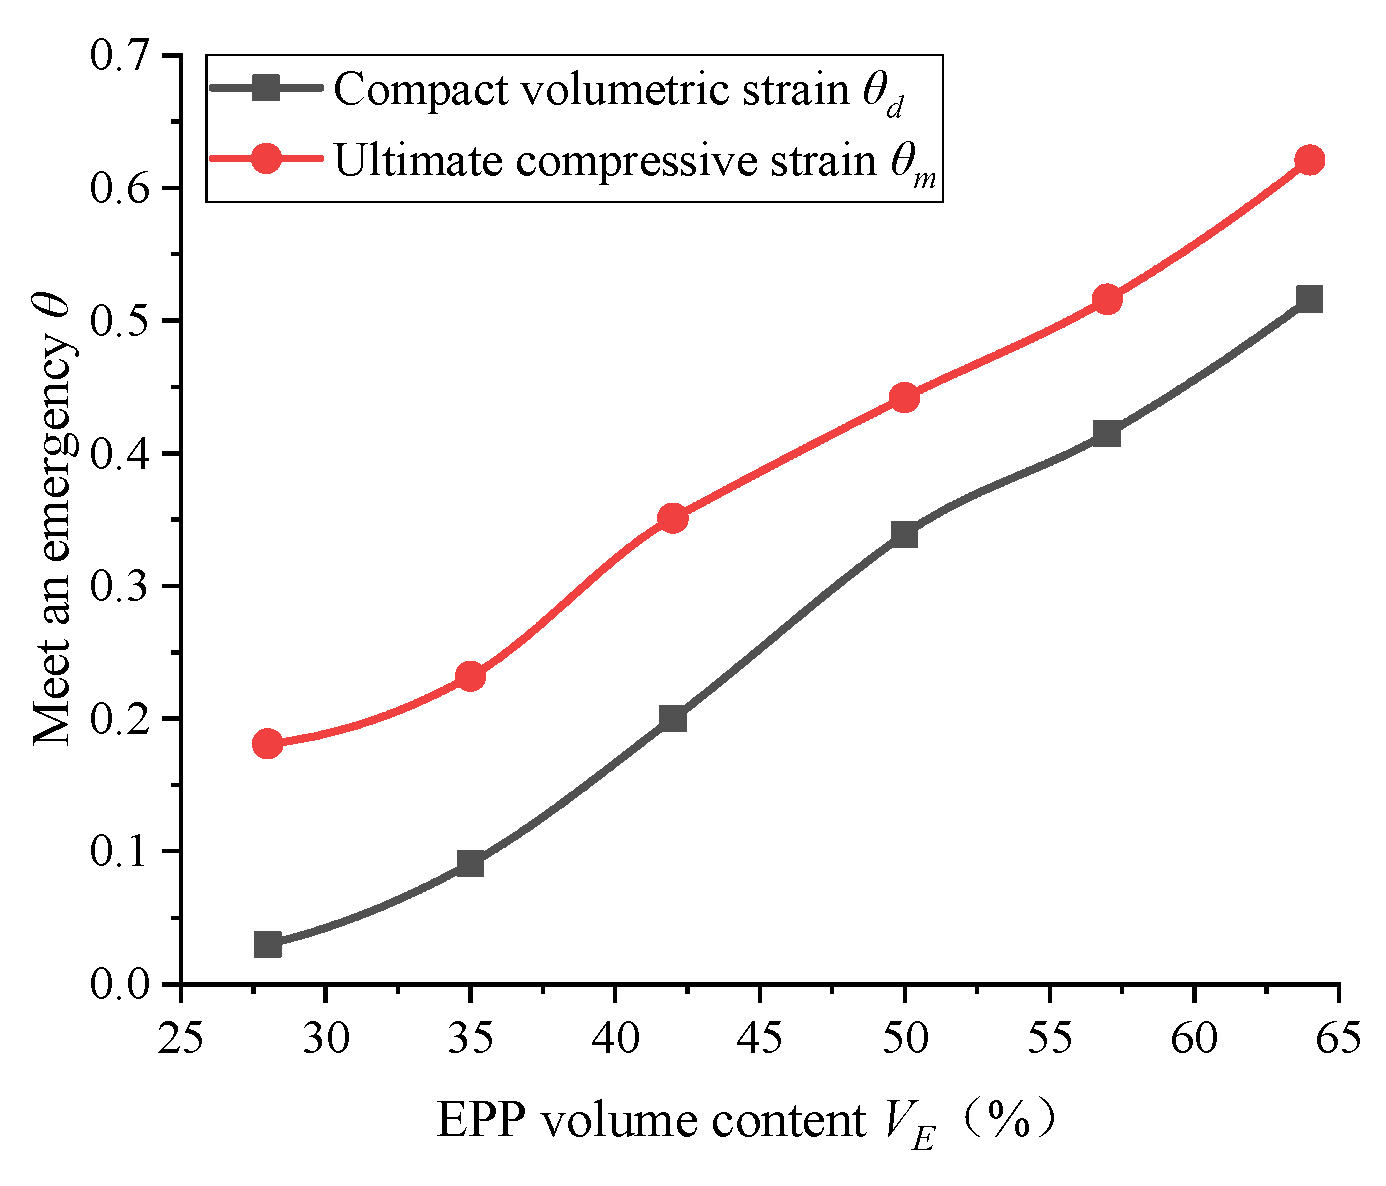
In this section, we only analyze the dense volume strain θd and the ultimate compressive strain θm. This is because the compressive failure strain of the EPP concrete specimen is influenced by both the elastic modulus and the uniaxial compressive strength, which mainly reflect the deformation performance of the specimen before failure. Moreover, the relationship between θd and θm and the EPP volume content is shown in Figure 13. At the same time, as can be observed in Figure 14 and Figure 15, as well as Formulas (4) and (5), the relationships between them and the EPP particle content are established, respectively.
θ d = 0.014 V E 0.38
θ m = 0.012 V E 0.16
where θd represents the dense volume strain, θm stands for the ultimate compressive strain and VE suggests the EPP particle volume content (%).
As shown in Figure 13, the dense volume strains of the EPP concrete under lateral confinement compression θd and ultimate compressive strain θm both increase with the increase in EPP particle content and θd related to θm The ratio gradually increases, indicating that the higher the EPP content, the greater the volume compression of the concrete and the better the compression performance. In summary, within a reasonable mix ratio range, the larger the volume ratio of EPP particles, the greater the compressibility of the material and the better the compression performance.

4.5. Analysis of Energy Absorption Performance

Solid materials will undergo deformation when subjected to external loads, and this deformation process is the process of external forces doing work. Due to energy conservation, the energy is absorbed by the object under load, and the energy absorbed due to deformation caused by external forces is called deformation energy or strain energy.
In the lateral compression test of this experiment, the stress–strain curve of the EPP concrete reflects its obvious energy absorption characteristics. From the elastic-plastic section and compression platform section of the curve, the EPP concrete specimen is compressed under external force (load), and the external force (load) does work on the specimen, absorbing energy and dissipating it in various forms such as pore deformation, fragmentation, collapse and friction of concrete fragments.
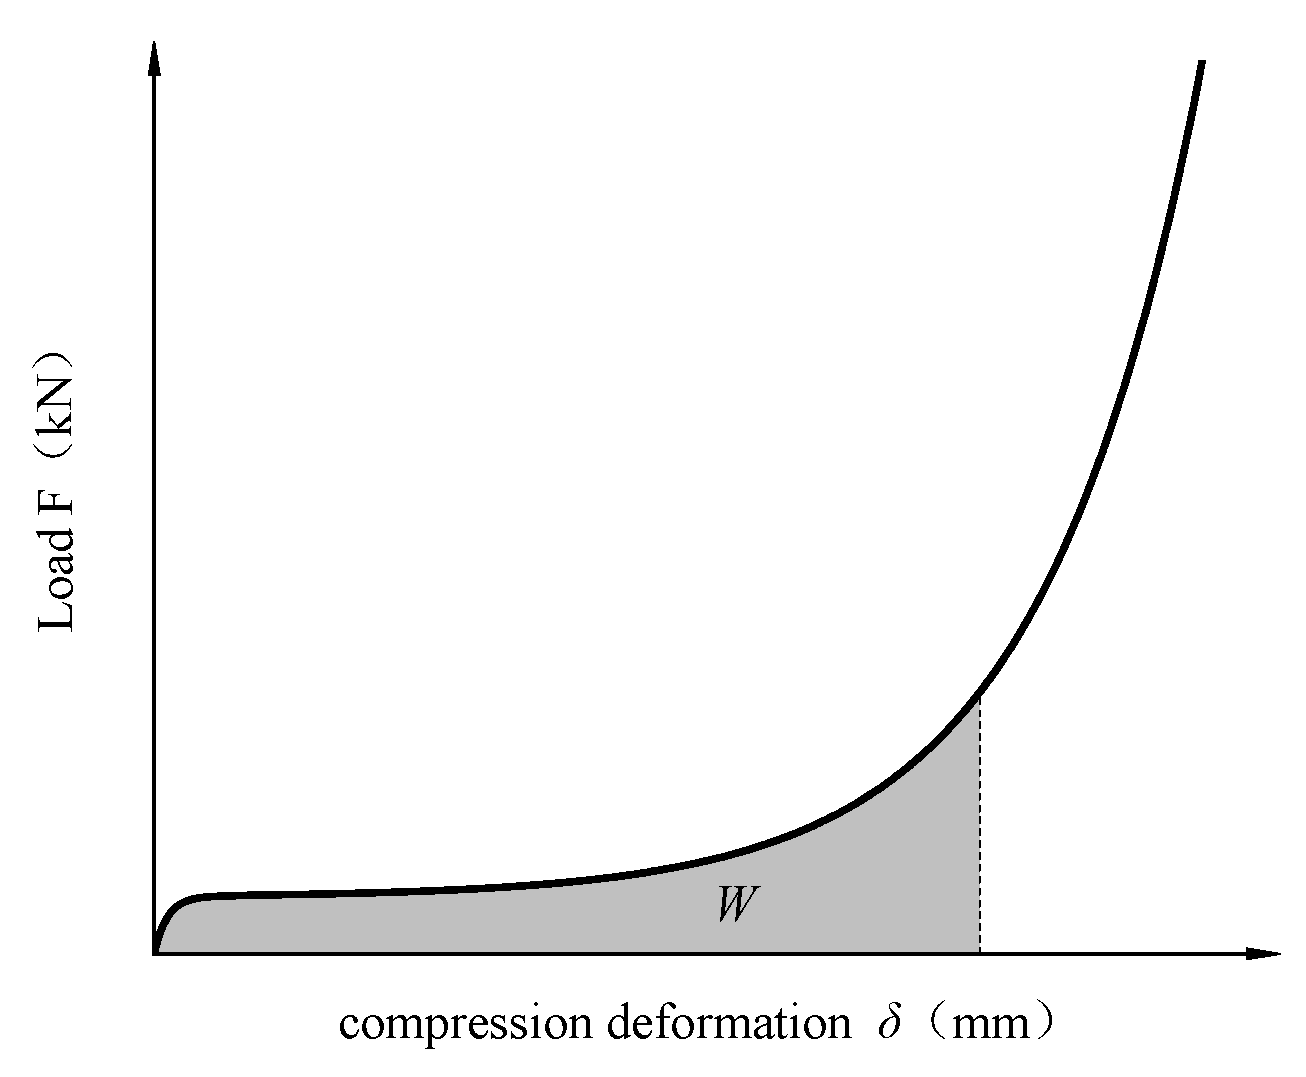
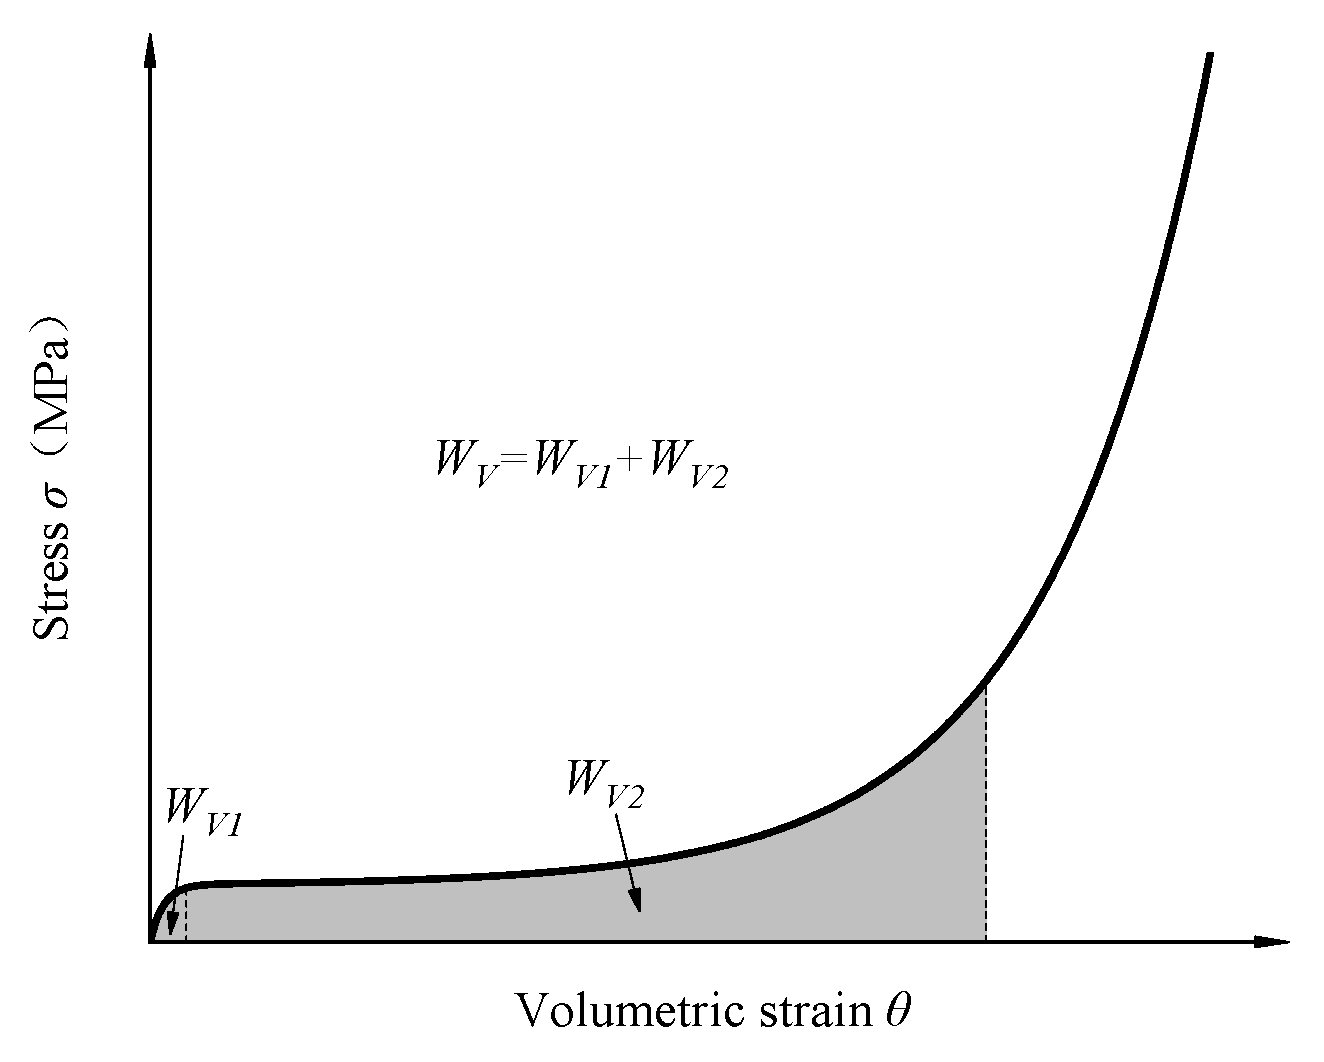
The strain energy of the EPP concrete during compression and the related calculation formula are demonstrated by the shaded area in Figure 16 and Formula (6), respectively. The energy absorption per unit volume and the related calculation formula are also shown in Figure 17 and Formula (7), respectively.
W = 0 δ d F ( δ ) d δ
W V = 0 θ d σ ( θ ) d θ
where W stands for the strain energy (j), WV denotes the deformation energy per unit volume, i.e., strain energy density (KJ/m3), F signifies the pressure force test value (kN), δ is the compressive deformation value of the EPP concrete specimen (mm), σ represents the stress value (kPa), θ is the volume strain value of the EPP concrete specimen and δd refers to the vertical deformation value corresponding to the dense volume strain.
The energy absorption of the EPP concrete occurs in two stages, namely, the elastic-plastic deformation and the pore collapse compaction. Accordingly, the energy WV absorbed per unit volume can be argued to consist of two parts: (1) the energy WV1 which is absorbed by the elastic-plastic section and (2) the compressed energy WV2 absorbed by the platform segment, the mathematical relationship and the calculation formulae, of which are shown in Formulas (8)–(10).
W V = W V 1 + W V 2
W V 1 = 0 θ cc σ ( θ ) d θ
W V 2 = θ cc θ d σ ( θ ) d θ
where θcc stands for the volume strain value corresponding to the confined compressive strength f′cc, and θd denotes the dense volume strain.
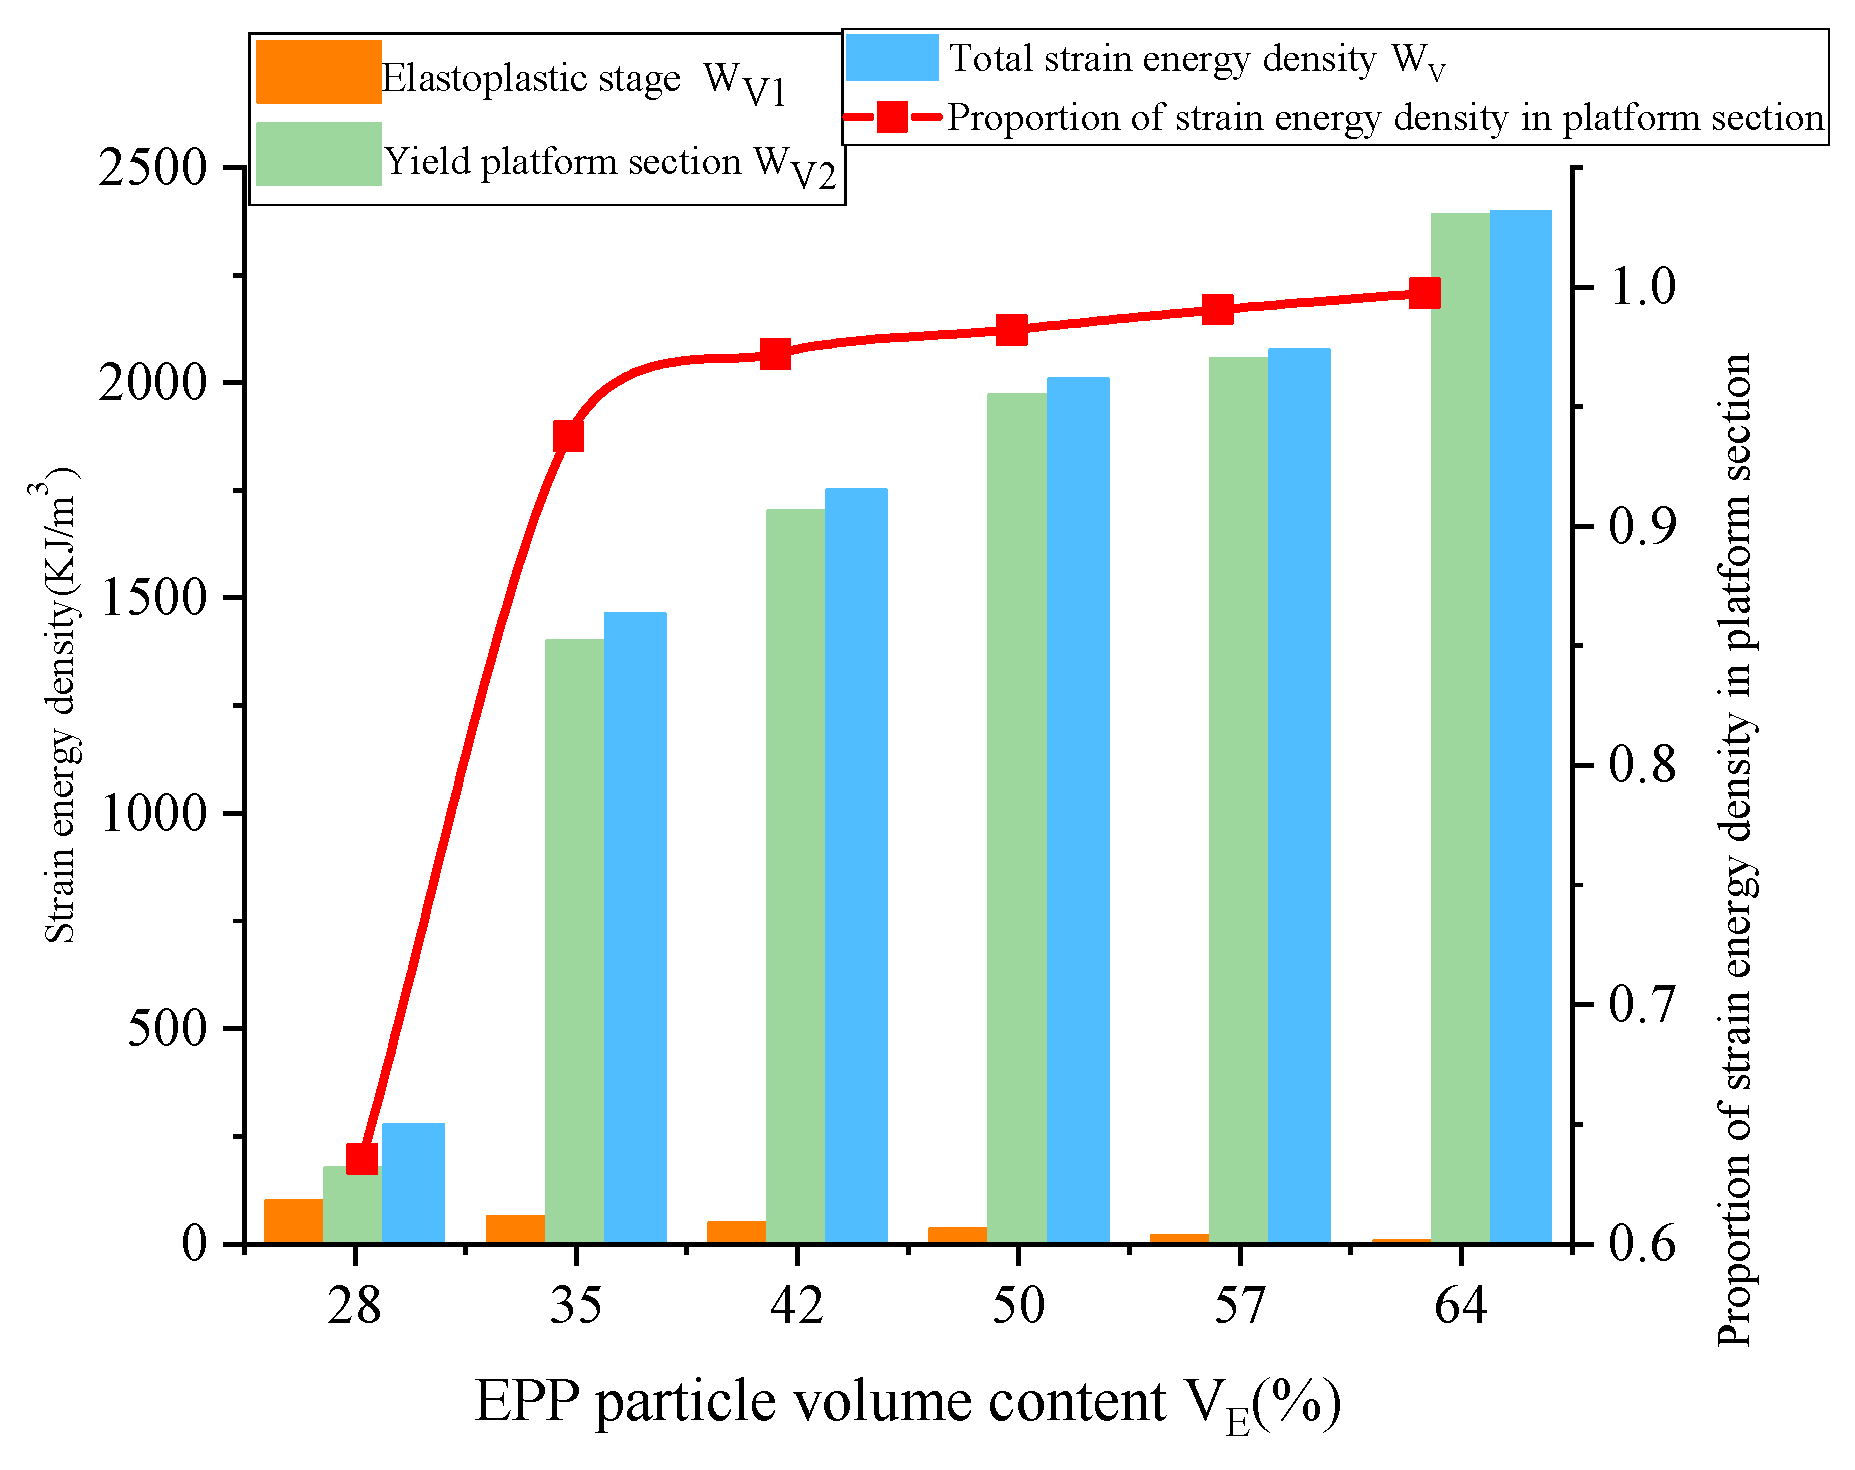
The energy absorption indexes WV1 and WV2 were obtained by piecewise integrating the stress–volume strain curves of A1–A6, the schematic diagram of which is shown in Figure 18. The results obtained from the calculation of the strain energy density are also provided in Table 5.
As can be seen in Figure 18, an increase in the EPP particle content resulted in a gradual increase in the total strain energy density, which is an indication of the higher EPP content, the more obvious energy absorption characteristics and the better energy absorption performance of the EPP concrete.
According to the data in Table 5, the schematic diagram of the relationship between the strain energy density of the elastic-plastic section, the compression platform section and the total strain energy density and the volume content of the EPP particles is provided in Figure 19.
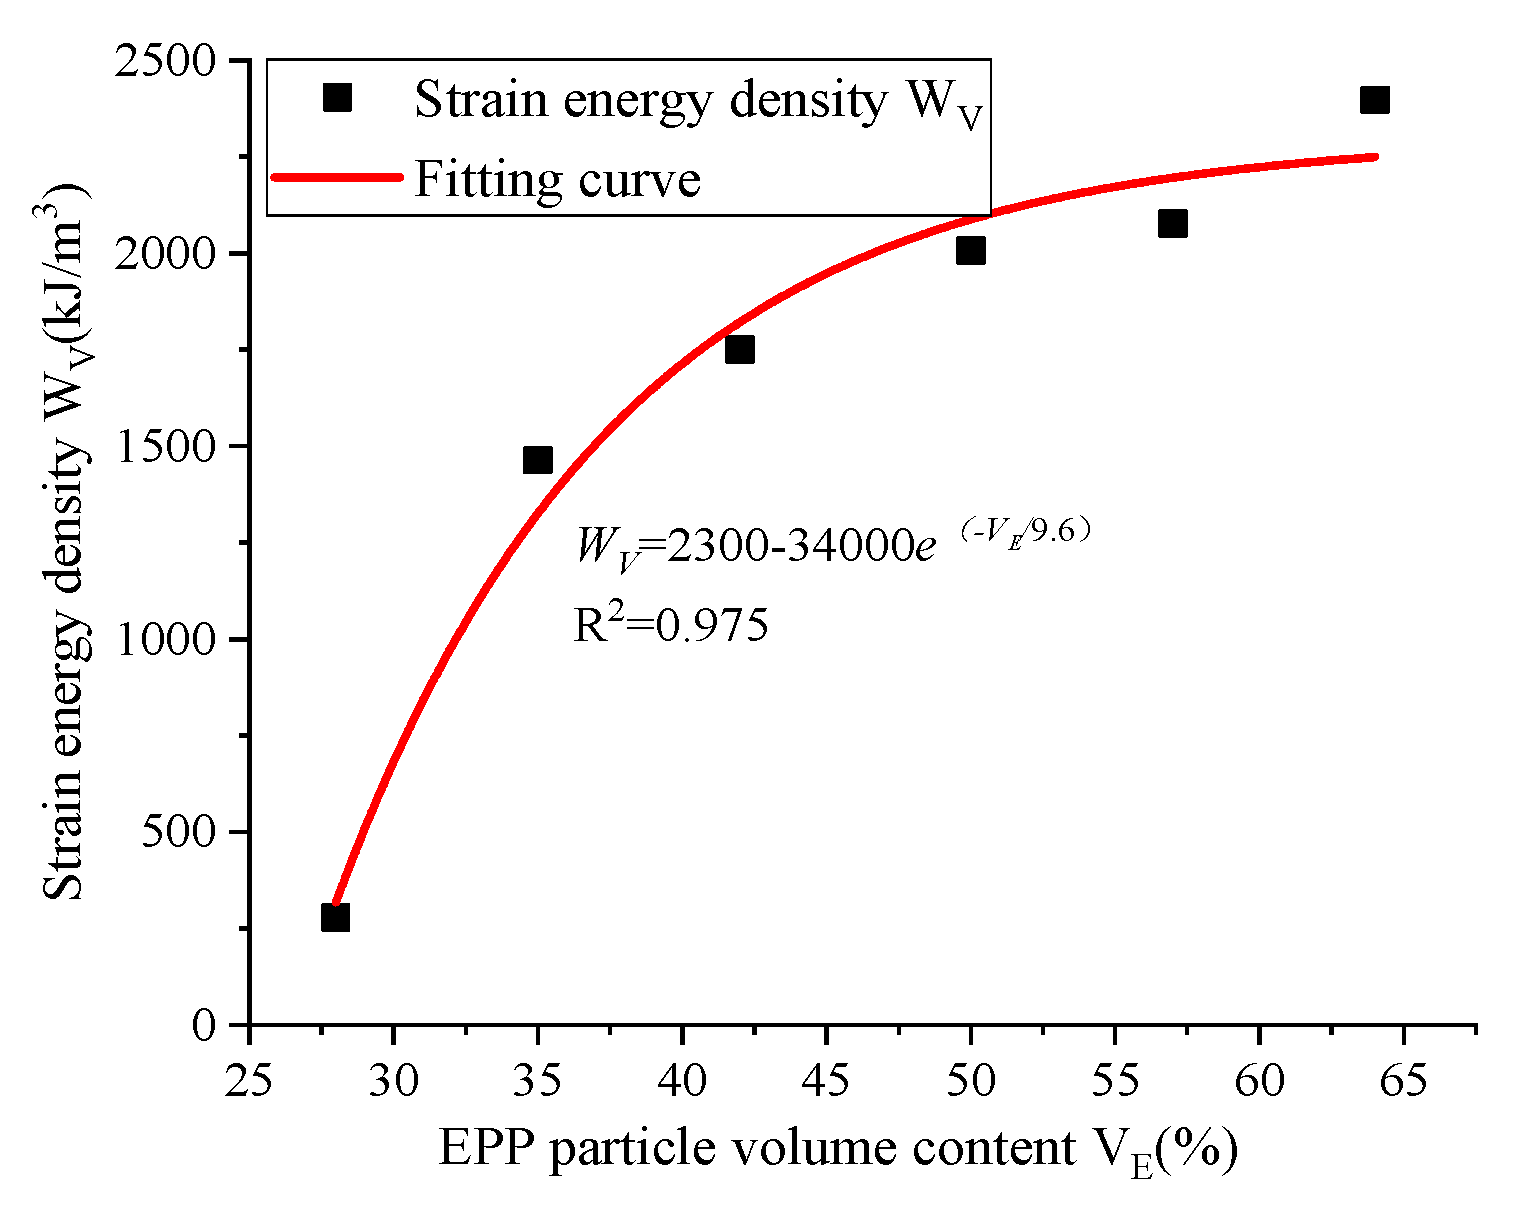
Moreover, the strain energy density of the platform sections in the A2~A6 groups was found to account for more than 90% of the total strain energy density, i.e., 93.8% and 93.8%, respectively. As can be seen in Figure 20 and Figure 21, the relationship between the energy absorption performance of the EPP concrete and the EPP particle content is also established through Formulas (11) and (12).
W V = 2300 34 , 000 e ( - V E / 9.6 )
W V = 2300 1.51 e ( ρ / 230 )
where WV stands for the strain energy density (kJ/m3), VE denotes the EPP particle volume content (%) and ρ represents the density of concrete (kg/m3).
As can be observed in Figure 20 and Figure 21, although the strain energy density of the EPP concrete increased with the increase in the EPP particle content, the growth rate gradually decreased. Moreover, the calculation of the strain energy density and the changing trend of the axial compressive strength of the EPP concrete indicates that the continuous increase in the EPP content inevitably leads to a maximum strain energy density.

5. Energy Absorption Performance of Laminated Specimens under Confined Compression

As mentioned, the present study aims to introduce EPP concrete into the field of tunnel engineering and examine the cushioning effect of the EPP concrete and ordinary concrete under cooperative loading. Accordingly, based on the experimental conditions and the analyzed physical properties of the EPP concrete, six groups of laminated specimens (B1–B6) were prepared using the layered pouring method. The confined compression test was also carried out to investigate the cushioning and energy absorption performance of the EPP as well as the ordinary concretes under cooperative loading.

5.1. Confined Compressive Strength Analysis

The used specimen was laminated by pouring the EPP concrete and ordinary C35 concrete in layers. As the two types of concrete present quite different strengths, the strength of the laminated specimen depended on that of the EPP concrete layer. The size of the EPP concrete layer was 50 mm × 100 mm × 100 mm at this point, which was different from the cube compression specimen in the previous article. Accordingly, the confined compressive strength of each group B1–B6 is shown in Table 6 and Figure 22.
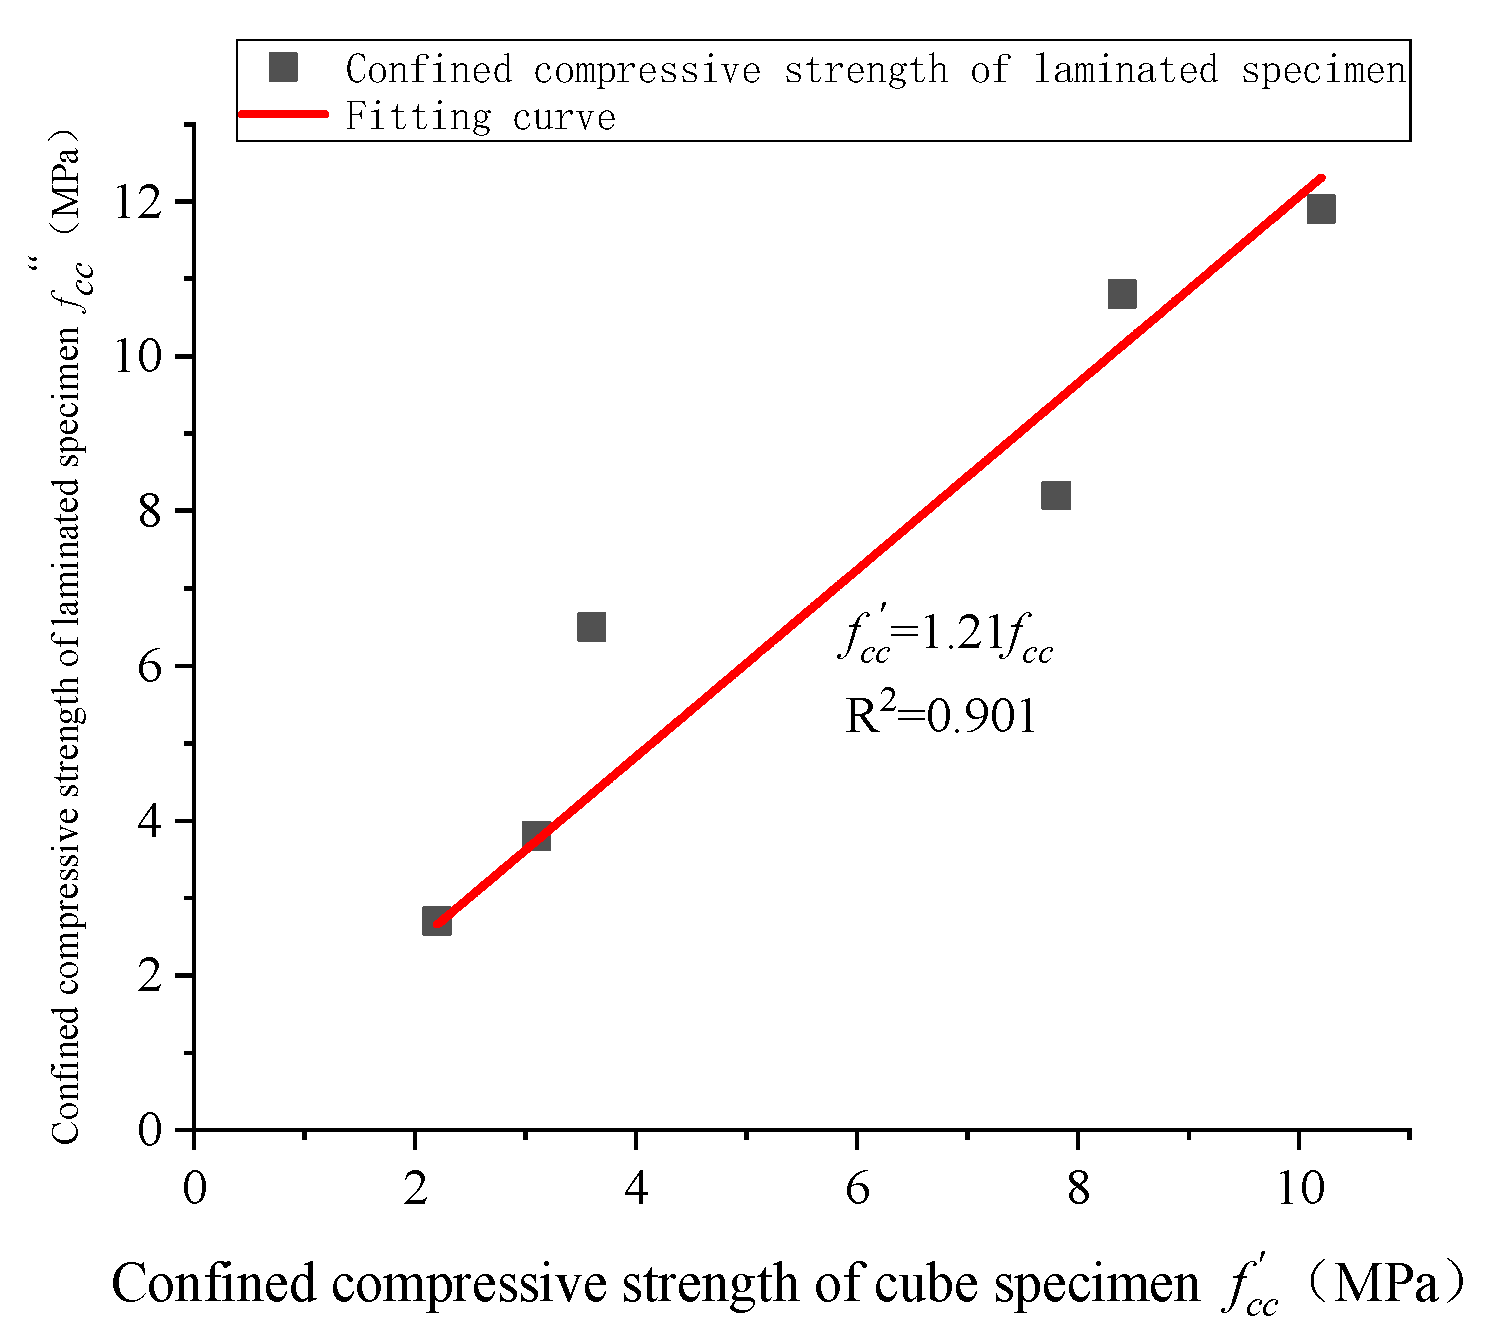
As can be seen in Figure 22, an increase in the EPP particle volume content resulted in a gradual increase in the confined compressive strength of the composite specimen, which was obviously higher than that of the cubic specimen. At this point, the size of the EPP concrete in the composite specimen was 50 mm × 100 mm × 100 mm, which was an indication of the higher confined compressive strength of the composite specimen than that of the cubic specimen. This can be argued to be due to the reduction in the aspect ratio of the EPP concrete. Therefore, considering the relationship between the axial and the uniaxial compressive strengths, the linear relationship of the lateral compressive strength of the composite and cubic specimens is established (Figure 23 and Formula (13)).
f cc = 1.21 f c c
where fcc represents the uniaxial compressive strength of composite specimens (MPa), and fcc is the standard value of the compressive strength of the concrete cube (MPa).

5.2. Energy Absorption Performance of Composite Specimen

The confined uniaxial compression test was carried out on the laminated specimen. While obtaining the compressive strength of the specimen, the vertical strain of ordinary C35 concrete was collected using the strain gauge and the static collector stuck on the ordinary concrete part of the laminated specimen. Moreover, it was converted into vertical stress so as to study the energy absorption performance of the EPP and the C35 concretes under cooperative stress. The comparison diagrams of the compressive stress of the specimen’s top surface, as well as the compressive stress of the C35 concrete part, are shown in Figure 24.
As can be seen in Figure 24, the vertical deformation of the C35 concrete is micro-strain. Accordingly, the curve showing the relationship between the compressive stress on the top surface of the laminated specimen and the volume strain of the EPP concrete layer can be regarded as the compressive stress–volume strain curve of the EPP concrete layer. Consequently, it is in a three-stage form of ‘elastic-plastic stage, compression platform stage, strain hardening stage’. The laminated specimen was observed to show good compression performance. The curve showing the relationship between the compressive stress measured by the C35 concrete layer and the volume strain of EPP concrete layer is also in a three-stage form, i.e., the uniform rising section, oscillating platform section, and accelerating rising section. The curve can generally be seen to be similar to the compression curve of the EPP concrete layer. In addition, the EPP concrete and the C35 concrete layer were observed to be basically stressed synchronously. Also, when the EPP concrete layer was in the compression platform stage, the compressive stress of the C35 concrete was at a low level, indicating the low level of the EPP concrete. However, the compressive stress of the C35 concrete was obviously less than the top pressure of the specimen. This is because a considerable part of the energy exerted by the external load was dissipated in the process of pore deformation and crushing volume compression in the EPP concrete layer, which could not be transmitted to the C35 concrete layer. In addition, the slopes, the starting points and the ending points of the two sections in the stress curve of the C35 concrete were found to be similar to those of the elastic-plastic and the compression platform sections of the stress curve of the EPP concrete layer. This is an indication of the elastic stress state, as well as the low level of compressive stress of the C35 concrete when the compression state of the EPP concrete was in the two stages. At this point, it is more reasonable to convert the stress value from the measured strain value. However, when the pores of the EPP concrete layer were compressed, compacted and reached the strain hardening stage, the buffering effect was essentially lost. Accordingly, the stress in the C35 concrete increased rapidly, which caused it to enter the plastic stage or even to break down. At this point, as can be observed by the accelerated rising in the third section of the curve, the converted compressive stress increased rapidly. As can be seen, it is quite different from the strain hardening stage of the EPP concrete layer, suggesting that the stress curve of this part does not correctly reflect the actual stress state of the C35 concrete. Moreover, the strain energy density of the EPP concrete can be obtained through the analysis of the elastic-plastic and the compression platform sections of the stress–volume strain curve of the EPP concrete cube. This, in turn, is an indication of the energy absorption performance. Accordingly, from further research, the two curves obtained from the confined compression of the superimposed specimens were found to reflect the strain energy absorption and the strain energy output of the EPP concrete, respectively.
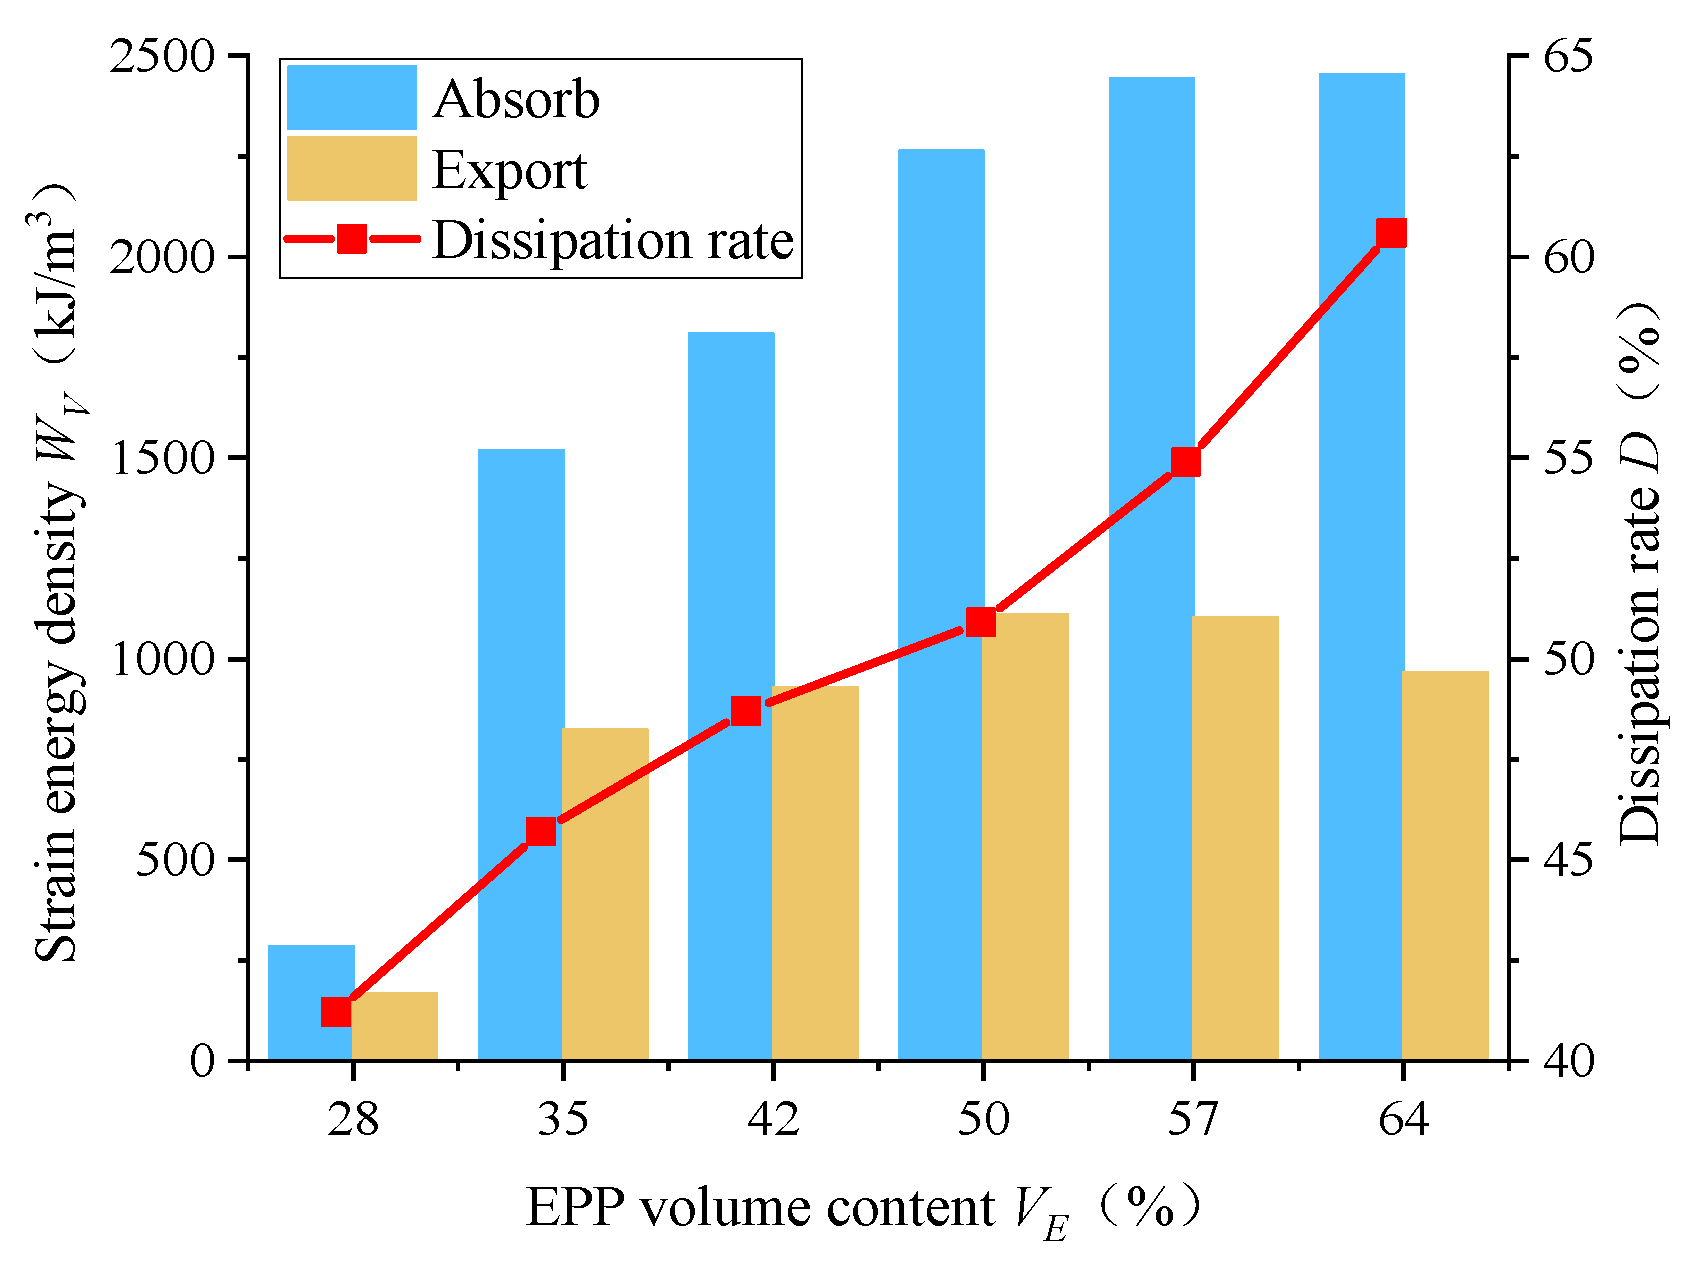
Hence, the absorbed and the output strain energy density (WV and WO) were obtained by calculating the uniform rising section and the oscillating platform section of the two curves, respectively. Moreover, the difference between the two can be considered as the energy dissipated during the compression of the EPP concrete, the rate of which was calculated using Formula (14).
D = W V W O W V
where D represents the energy dissipation rate (%), WV stands for the strain energy density absorbed (kJ/m3) and Wo denotes the output strain energy density (kJ/m3). Table 7 shows the obtained results.
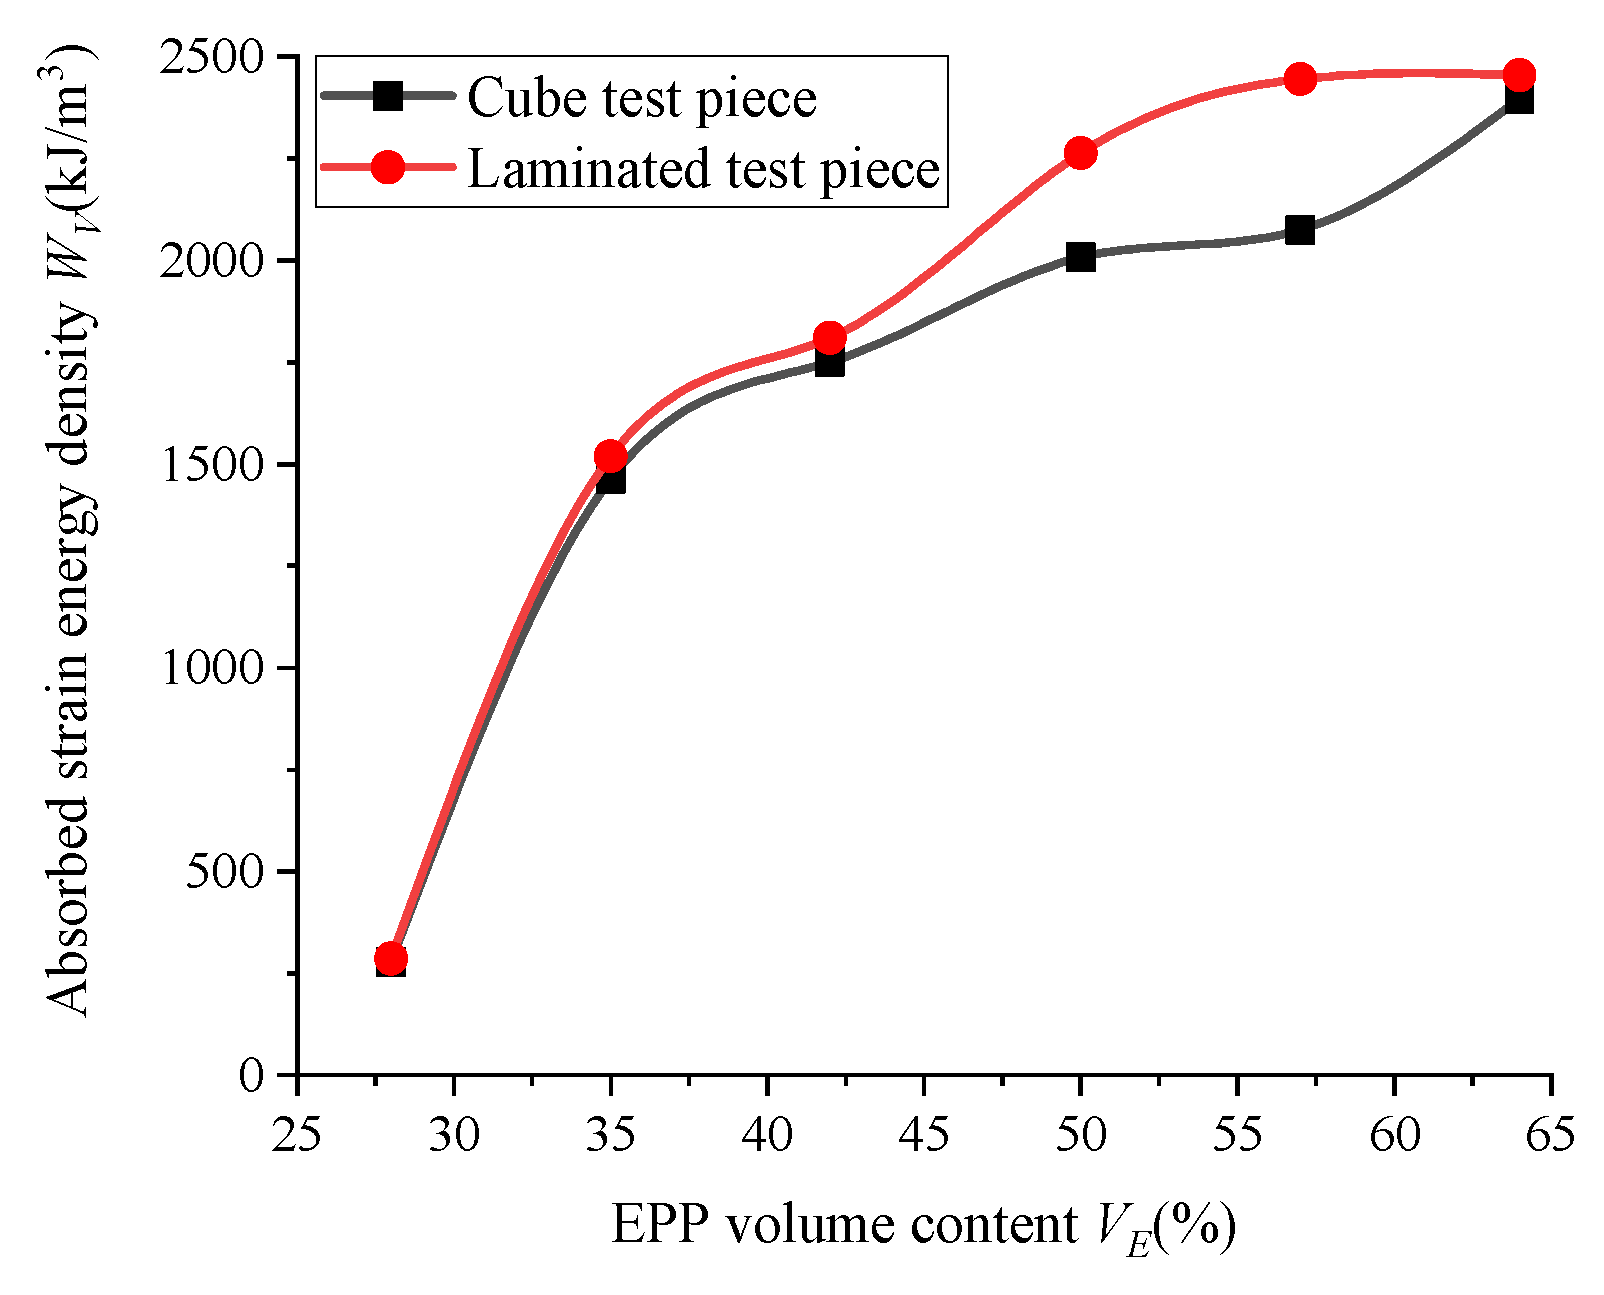
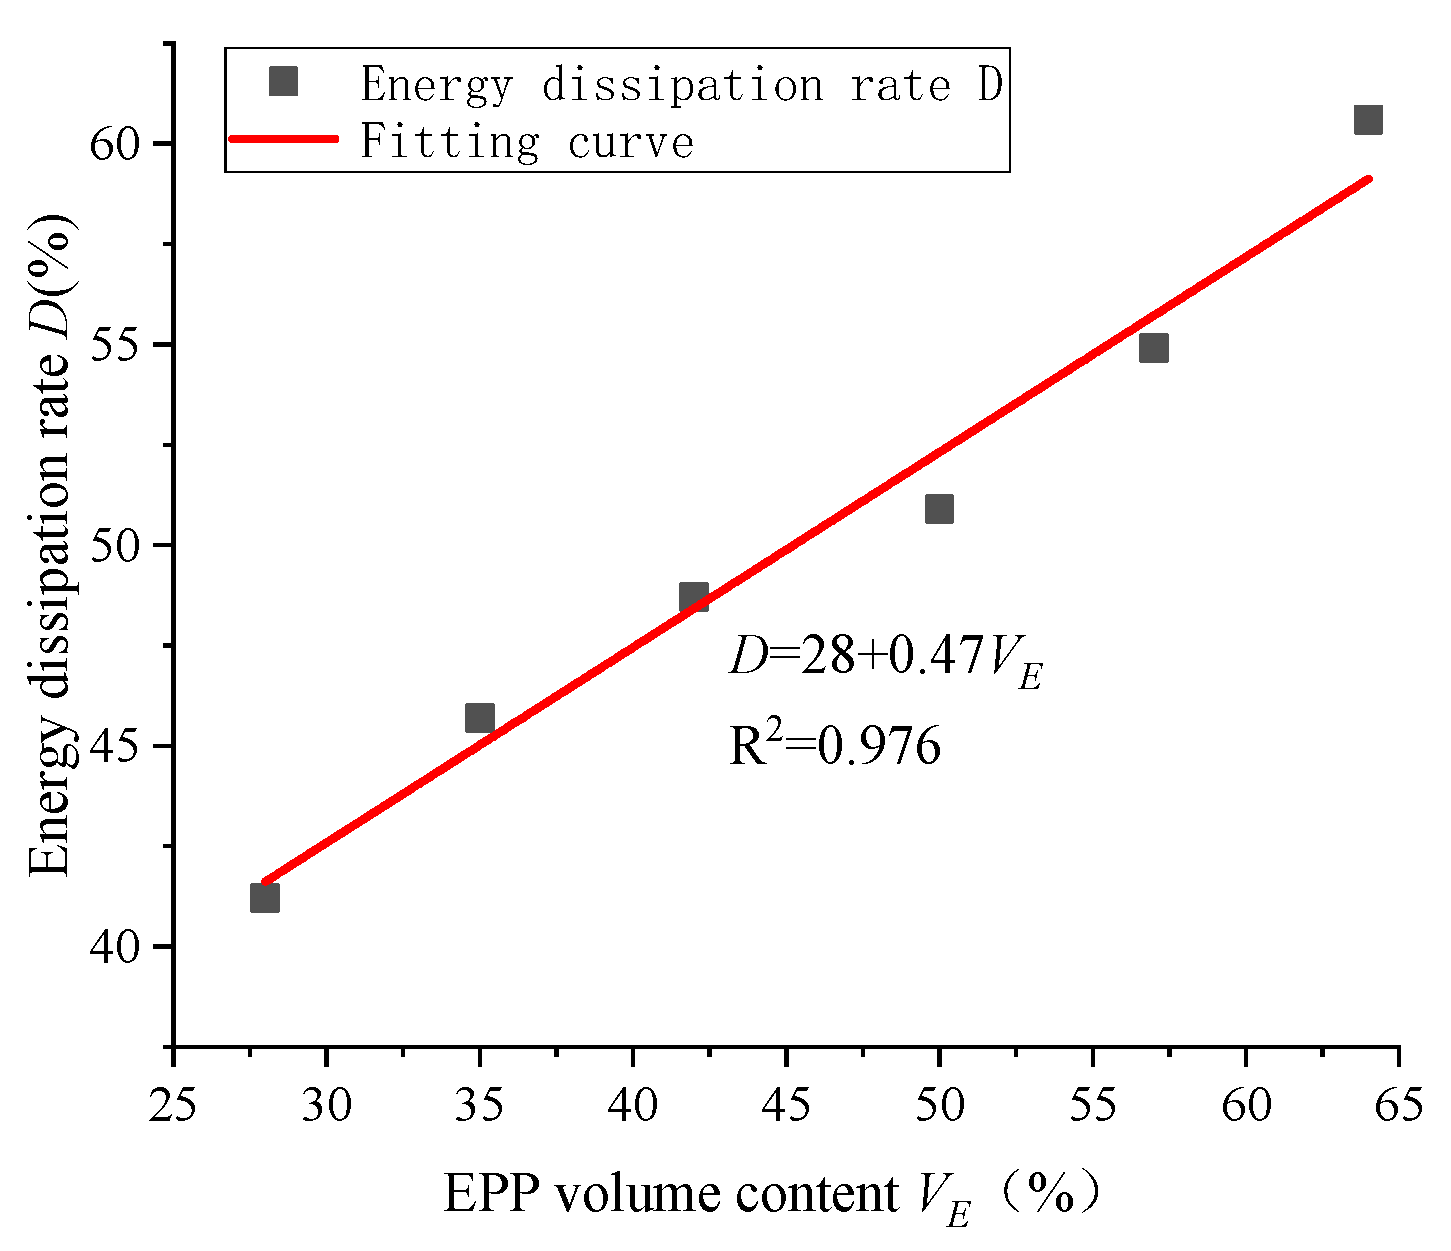
As can be seen in Figure 25, the strain energy density of the laminated specimen is slightly larger than that of the cubic one. The application of the strain energy density formula and the analysis of the confined compressive strength of the two specimens show that this is caused by the larger confined compressive strength of the laminated specimen. Moreover, the changing trend of the strain energy density of B1–B6 containing the EPP particle content can be observed to be completely consistent with that of A1–A6, i.e., an increase in the EPP particle content led them both to increase as well, which is an indication of the energy absorption characteristics of the laminated specimen. As can also be observed in Figure 26, the higher content of the EPP particles resulted in a greater energy dissipation rate of the laminated specimen, which can be argued to be due to the increase in the pores of the specimen. Accordingly, it can be discussed that a larger amount of total energy is required to break the pores. Moreover, as can be seen, the energy dissipation rate increased in an approximately linear relationship with an increase in the EPP content, i.e., the linear relationship is established (see Figure 27 and Formula (15)).
D = 28 + 0.47 V E
where D stands for the energy dissipation rate (%), and VE represents the EPP particle volume content (%).
By analyzing the results of lateral compression tests on six sets of composite specimens, including B1–B6, the buffering and energy absorption performance of the EPP concrete and C35 ordinary concrete under synergistic loading was investigated. The lateral compression test of EPP concrete and the C35 concrete laminated specimens showed that they are generally subjected to synchronous forces during compression, and when the EPP concrete layer was in the compression platform stage, the compressive stress of C35 concrete was at a lower level, indicating that the EPP concrete had a significant buffering effect on ordinary concrete. A constitutive model for calculating the energy dissipation rate of EPP concrete was proposed, and it was found that the higher the EPP particle content, the greater the energy dissipation rate of the composite specimen.

6. Conclusions

Presenting good compressibility, the use of the EPP foam concrete as a structural material for energy absorption and as a pressure-relief buffer layer can be justified in large cross-section tunnels such as high-stress soft rock highways and railways. Therefore, based on the obtained result, the following conclusions are drawn:
(1)
The increase in the EPP particle volume content decreases the strength parameters of the EPP concrete. This is while the elastic modulus and Poisson’s ratio of the concrete decrease with an increase in the EPP particle volume content;
(2)
Good compression and energy absorption performance are exhibited by the EPP concrete under limited compression conditions;
(3)
The compressive performance of the EPP concrete can be reflected by dense volume strain index θd;
(4)
An increase in the EPP particle content results in an increase in the strain energy density. Moreover, the group with the highest EPP particle content (64%) presents the highest strain energy density (2396.5 kJ/m3). Also, the ratio of the concentration to the total strain energy in the compression platform section also increases, indicating the energy absorption characteristics of the EPP concrete to be determined by the internal pores;
(5)
Similar to the axial compressive strength, the compressive strength of the composite specimen depends on the strength of the EPP concrete layer. Furthermore, the strength of the composite specimens is not only influenced by the content of the EPP particles but is greatly related to the aspect ratio of the EPP concrete layer;
(6)
The higher content of EPP particles results in a higher rate of energy dissipation. Moreover, the energy dissipation rate of the group with the highest EPP particle content (64%) is 60.6%, which approximately varies linearly with the EPP particle content.
However, it worth mentioning that due to the lack of time, complexity of constructing engineering demonstrations of relationships and lack of practical supporting data, the findings of the present study are limited and have not been practically verified in engineering applications.
Finally, due to its good physical, mechanical and, especially, compressibility properties, the EPP foam concrete was shown to absorb the stress energy of the surrounding rock, suggesting its broad application prospects to be researched in future studies. So, future studies are recommended to focus on the practical applications, improving the relevant practical parameters and providing better references for the formation of similar projects in the future.

Author Contributions

Conceptualization, C.J. and J.L.; Methodology, C.J.; Formal analysis, C.J.; Writing—original draft, C.J.; Writing—review & editing, J.L., H.L. and Z.M.; Visualization, H.L. and Z.M.; Supervision, J.L.; Funding acquisition, J.L. All authors have read and agreed to the published version of the manuscript.

Funding

The authors acknowledge the National Natural Science Foundation of China (Grant: 51978088) and the SKLGP State Key Laboratory’s independent project of China (Grant: 2021Z007).

Institutional Review Board Statement

Not applicable.

Informed Consent Statement

Not applicable.

Data Availability Statement

The data presented in this study are available in the article.

Conflicts of Interest

The authors declare no conflicts of interests.

References

  1. Zheng, Z.; Yang, Y.; Pan, C. Determination of the parameters of rock viscoelastic creep model and analysis of parameter Degradation. Sci. Rep. 2023, 13, 5739. [Google Scholar] [CrossRef] [PubMed]
  2. Liu, W.; Zhou, H.; Zhang, S.; Jiang, S.; Yang, L. A nonlinear creep model for surrounding rocks of tunnels based on kinetic energy theorem. J. Rock Mech. Geotech. Eng. 2023, 15, 363–374. [Google Scholar] [CrossRef]
  3. Dong, Z.; Li, Y.; Li, H.; Wang, Z.; Shi, X.; Chen, X.; Lu, Q. Experimental Study on the Infuence of Temperature on Rock Salt Creep. Rock Mech. Rock Eng. 2023, 56, 3499–3518. [Google Scholar] [CrossRef]
  4. Fahimifar, A.; Tehrani, F.M.; Hedayat, A.; Vakilzadeh, A. Analytical solution for the excavation of circular tunnels in a visco-elastic Burger’s material under hydrostatic stress field. Tunn. Undergr. Space Technol. 2010, 25, 297–304. [Google Scholar] [CrossRef]
  5. Spyridis, P.; Konstantis, S.; Gakis, A. Performance indicator of tunnel linings under geotechnical uncertainty. Geomech. Tunn. 2016, 9, 158–164. [Google Scholar] [CrossRef]
  6. Ren, H.-G.; Tan, Z.-Y.; Feng, P.-X. Back Analysis of In-Situ Stress under Complicated Geological Conditions Based on Function Superposition of Multiple Regressions. In Proceedings of the 5th International Conference on Mechanics and Mechatronics (ICMM 2017), Tokyo, Japan, 20–22 January 2017. [Google Scholar] [CrossRef]
  7. Han, C.L.; Wang, F.; Li, G. Study on deformation characteristics and multi-layer initial support control of large-section soft rock tunnel. Highway 2021, 66, 335–339. [Google Scholar]
  8. Yang, Y.; Tan, Z.-S.; Xue, J.; Li, S.-T. Study on the Supporting Performance of High-strength Steel Grille Arch in Soft and Broken Surrounding Rock of Highway Tunnel. China J. Highw. Transp. 2020, 33, 125–134. [Google Scholar]
  9. Liu, D.; Zuo, J.; Wang, J.; Zhang, T.; Liu, H. Large deformation mechanism and concrete-filled steel tubular support control technology of soft rock roadway-A case study. Eng. Fail. Anal. 2020, 116, 104721. [Google Scholar] [CrossRef]
  10. Liu, Y.; Qiu, W.; Duan, D. Using Energy-Absorbing Dampers to Solve the Problem of Large Deformation in Soft-Rock Tunnels: A Case Study. Energies 2022, 15, 1916. [Google Scholar] [CrossRef]
  11. Castiglioni, A.; Castellani, L.; Cuder, G.; Comba, S. Relevant Materials Parameters in Cushioning for EPS Foams. Colloids Surf. A Physicochem. Eng. Asp. 2017, 534, 71–77. [Google Scholar] [CrossRef]
  12. Sahu, S.S.; Gandhi, I.S.R.; Khwairakpam, S. State-of-the-art review on the characteristics of surfactants and foam from foam concrete perspective. J. Inst. Eng. Ser. A 2018, 99, 391–405. [Google Scholar] [CrossRef]
  13. Li, H.-N.; Liu, P.-F.; Li, C.; Li, G.; Zhang, H. Experimental research on dynamic mechanical properties of metal tailings porous concrete. Constr. Build. Mater. 2019, 213, 20–31. [Google Scholar] [CrossRef]
  14. Thienel, K.C.; Haller, T.; Beuntner, N. Lightweight Concrete-From Basics to Innovations. Materials 2020, 13, 1120. [Google Scholar] [CrossRef] [PubMed]
  15. Ma, W. Dynamic impact properties of lightweight aggregate concrete based on different loading systems. Silic. Bull. 2019, 38, 974–982. [Google Scholar]
  16. Medher, A.H.; Al-Hadithi, A.I.; Hilal, N. The Possibility of Producing Self-Compacting Lightweight Concrete by Using Expanded Polystyrene Beads as Coarse Aggregate. Arab. J. Sci. Eng. 2020, 46, 4253–4270. [Google Scholar] [CrossRef]
  17. Jose, S.K.; Soman, M.; Evangeline, Y.S. Influence of mixture composition on the properties of foamed concrete. Mater. Today Proc. 2020, 42, 399–404. [Google Scholar] [CrossRef]
  18. Rapaka, S.D.; Pandey, M.; Annabattula, R.K. Effect of defects on the dynamic compressive behavior of cellular solids. Int. J. Mech. Sci. 2020, 170, 105365. [Google Scholar] [CrossRef]
  19. Tian, X.; Li, Q.; Lu, Z.; Wang, Z. Experimental study of blast mitigation by foamed concrete. Int. J. Prot. Struct. 2016, 8, 1–14. [Google Scholar] [CrossRef]
  20. Hu, X.-Y.; He, C.; Lai, X.-H.; Walton, G.; Xu, G.-W. Study on the interaction between squeezing ground and yielding supports with different yielding materials. Tunn. Undergr. Space Technol. 2020, 97, 103242. [Google Scholar] [CrossRef]
Figure 1. EPP particles. (a) EPP particles. (b) Axial compression test piece.
Applsci 14 01544 g001
Figure 2. EPP concrete specimen. (a) Specimens subjected to uniaxial compression. (b) Axial compression test piece. (c) Overlapping test pieces compression, splitting and confined.
Applsci 14 01544 g002
Figure 3. Distribution of EPP particles in A1–A6 groups of specimens. (a) EPP volume content 28%. (b) EPP volume content 35%. (c) EPP volume content 42%. (d) EPP volume content 50%. (e) EPP volume content 57%. (f) EPP volume content 64%.
Applsci 14 01544 g003
Figure 4. Stress and loading diagram of laminated specimen under confined compression. (a) Bonding of strain gauge of composite specimen. (b) Connecting strain gauge wire.
Applsci 14 01544 g004
Figure 5. The stress–volume strain curve of concrete specimens with EPP volume content of 35 % under lateral confinement is obtained.
Applsci 14 01544 g005
Figure 6. Relationship between uniaxial and confined compressive strengths and EPP volume replacement.
Applsci 14 01544 g006
Figure 7. Stress–volume strain curves of concrete specimens with different EPP volume contents under lateral confinement conditions. (a) A1 group: EPP volume content of 28%. (b) A2 group: EPP volume content of 35%. (c) A3 group: EPP volume content of 42%. (d) A4: EPP volume content of 50%. (e) A5 group: EPP volume content of 57%. (f) A6 group: EPP volume content of 64%.
Applsci 14 01544 g007aApplsci 14 01544 g007b
Figure 8. Relationship between confined compressive stress and volume strain of concrete specimens with different EPP volume content. (a) A1 group: EPP volume content of 28%. (b) A2 group: EPP volume content of 35%. (c) A3 group: EPP volume content of 42%. (d) A4 group: EPP volume content of 50%. (e) A5 group: EPP volume content of 57%. (f) A6 group: EPP volume content of 64%.
Applsci 14 01544 g008aApplsci 14 01544 g008b
Figure 9. Sectional schematic diagram of stress–volume strain relationship curve of EPP concrete.
Applsci 14 01544 g009
Figure 10. Relationship between physical and mechanical parameters of EPP concrete and fitting coefficient of compression curve. (a) Confined compressive strength and coefficient K1. (b) Modulus of elasticity and coefficient K2. (c) Modulus of elasticity and coefficient α. (d) EPP volume content and coefficient K3. (e) EPP volume content and coefficient β.
Applsci 14 01544 g010
Figure 11. Sectional schematic diagram of stress–volume strain relationship curve.
Applsci 14 01544 g011
Figure 12. A3 stress–volume strain curve.
Applsci 14 01544 g012
Figure 13. Relationship between dense volume strain, ultimate compressive strain and EPP volume content.
Applsci 14 01544 g013
Figure 14. Relationship between dense volume strain and EPP content.
Applsci 14 01544 g014
Figure 15. Relationship between ultimate compressive strain and EPP content.
Applsci 14 01544 g015
Figure 16. Schematic diagram of strain energy of EPP concrete.
Applsci 14 01544 g016
Figure 17. Schematic diagram of strain energy per unit volume of EPP concrete.
Applsci 14 01544 g017
Figure 18. Piecewise integral diagram of confined compressive stress–volume strain of concrete specimens with different EPP volume content. (a) A1 group: EPP volume content of 28%. (b) A2 group: EPP volume content of 35%. (c) A3 group: EPP volume content of 42%. (d) A4 group: EPP volume content of 50%. (e) A5 group: EPP volume content of 57%. (f) A6 group: EPP volume content of 64%.
Applsci 14 01544 g018aApplsci 14 01544 g018b
Figure 19. Relationship between strain energy density and EPP volume content.
Applsci 14 01544 g019
Figure 20. Relationship between total strain and energy density.
Applsci 14 01544 g020
Figure 21. Relationship between total strain and EPP volume content, energy density and specimen density.
Applsci 14 01544 g021
Figure 22. Relationship between confined compressive strength of laminated specimens, cubic specimens and EPP volume content.
Applsci 14 01544 g022
Figure 23. Relationship between confined compressive strength of laminated specimen and cubic specimen.
Applsci 14 01544 g023
Figure 24. Comparison diagram of compressive stress on top surface of specimen and laminated stress of C35 concrete. (a) Group B1: EPP volume content of 28%. (b) Group B2: EPP volume content is 35%. (c) Group B3: EPP volume content of 42%. (d) Group B4: EPP volume content of 50%. (e) Group B5: EPP volume content of 57%. (f) Group B6: EPP volume content of 64%.
Applsci 14 01544 g024aApplsci 14 01544 g024b
Figure 25. Comparison diagram of strain energy density of two specimens.
Applsci 14 01544 g025
Figure 26. Contrast diagram of strain energy and density dissipation of laminated specimens.
Applsci 14 01544 g026
Figure 27. Relationship between energy dissipation rate and EPP particle content of laminated specimens.
Applsci 14 01544 g027
Table 1. Mix proportion of concrete matrix.
Water Cement Ratio (kg/m3)Cement
(kg/m3)
Sand
(kg/m3)
Broken Stone (kg/m3)Water
(kg/m3)
Water Reducing Agent (kg/m3)
0.444579367662014.6
Table 2. Proportion of EPP concrete.
NumberCement (kg/m3)Water (kg/m3)Broken Stone (kg/m3)Sand
(kg/m3)
Sand Replacement RateEPP
(kg/m3)
Water Reducing Agent (kg/m3)Porosity
A1457201093605.674.628%
A24572010748.820%7.0784.635%
A34572010561.640%8.4864.642%
A44572010374.460%9.8944.650%
A54572010187.280%11.3024.657%
A645720100100%12.714.664%
Table 3. Coefficient of EPP concrete fitting formula for A1–A6 groups.
NumberEPP Volume ContentK1K2αK3βR2
A128%10.27−16.15−50.64.8100.994
A235%9.5−11.5−652.18 11.50.990
A342%7.49−7.78−84.940.4212.20.994
A450%3.6−4.1−114.760.12130.997
A557%3.15−3.18−147.850.02314.30.997
A664%2.48−2.48−1700.003150.992
Table 4. A1–A6 group EPP concrete compression parameters.
NumberEPP Volume Content VECompressive Failure Strain θccDense Volume Strain θdUltimate Compressive Strain θm
A128%0.0160.0300.181
A235%0.0140.0910.232
A342%0.0100.2000.351
A450%0.0160.3390.442
A557%0.0120.4150.516
A664%0.0050.5160.621
Table 5. Strain energy density of EPP concrete in A1–A6 groups.
NumberEPP Volume Content VEElastic-Plastic Segment WV1
(kJ/m3)
Compression Platform
Section WV2
(kJ/m3)
Total Strain Energy Density
WV (kJ/m3)
A128%101.1176.3277.4
A235%63.7955.31463.6
A342%49.11701.81750.9
A450%36.01971.92007.8
A557%19.82055.62075.4
A664%6.42390.12396.5
Table 6. Confined compressive strength of composite specimens B1–B6.
NumberEPP Volume Content VEConfined Compressive Strength (MPa)Confined Compressive Strength Value f″cc (MPa)
B128%11.218.911.911.9
B235%8.510.813.410.8
B342%7.88.08.78.2
B450%6.76.46.56.5
B557%3.44.23.83.8
B664%2.72.72.22.7
Table 7. Strain energy density of B1–B6 groups.
NumberEPP Volume Content VEAbsorbed Strain Energy
Density WV
(kJ/m3)
Output Strain Energy Density WO (kJ/m3)Energy Dissipation Rate D
B128%285.9167.941.3%
B235%1519.5824.545.7%
B342%1810.3929.448.7%
B450%3234.01587.650.9%
B557%2445.21102.254.9%
B664%2454.6966.260.6%
Disclaimer/Publisher’s Note: The statements, opinions and data contained in all publications are solely those of the individual author(s) and contributor(s) and not of MDPI and/or the editor(s). MDPI and/or the editor(s) disclaim responsibility for any injury to people or property resulting from any ideas, methods, instructions or products referred to in the content.