Abstract
Safety barriers (SBs) are important means of reducing failure risks of process systems. As barriers vary in type and function, their effectiveness needs to be evaluated in order to find a more reasonable configuration strategy. However, in practice, there is often a lack of accurate and complete data relating to SBs, which poses a significant challenge in quantitatively assessing their effectiveness. To address this issue, in this study, we propose a semi-quantitative approach for evaluating the effectiveness of both preventive and protective barriers in process systems by integrating expert elicitation, interval-valued intuitionistic fuzzy numbers (IVIFNs), and a bow-tie model. In this approach, the bow-tie model is first applied to describe the system failure scenarios and the action phases of the barriers, and then IVIFNs with expert judgment are introduced to obtain the failure probabilities of basic events and the effects of SBs. Subsequently, the effectiveness of each barrier is measured by comparing the relative change in failure risk due to the addition of the barrier. To verify the feasibility of this approach, a natural gas storage tank with some barriers was analyzed. The results show that the regular inspection of the deformation or damage of the storage tank has the highest effectiveness, followed by the installation and regular maintenance of safety electrical equipment. Furthermore, compared to a single barrier, multiple barriers can significantly reduce the system risk.
1. Introduction
Configuring safety measures for the process systems is a crucial means to preventing and reducing the failure risk. These safety measures are generally called safety barriers (SBs). There are a variety of SBs in process systems, like corrosion detection devices, relief valves, flammable gas detective and alarm systems, and fire extinguishing apparatus. Different SBs have different functions and effects, which raises the important question of how well these SBs protect the system from failure threats, and which SBs are more effective. If these questions can be answered well, then a more reasonable configuration strategy for SBs may be devised according to their effectiveness. Therefore, how to evaluate the effectiveness of SBs has become a significant issue for system safety management.
There are several analysis approaches for SBs in process systems at present, such as the Swiss cheese model [1], safety barrier diagram (SBD) [2], barrier and operational risk analysis (BORA) [3], layer of protection analysis (LOPA) [4], fault tree analysis (FTA), event tree analysis (ETA) [5], Petri nets [6], Bayesian networks [7], and the bow-tie (BT) model [8]. Among these approaches, the BT model has attracted great attention due to its integration of FT and ET, which can intuitively and clearly describe system failure scenarios and the roles of SBs. According to its use, the BT model can be used for qualitative and quantitative analyses. The former is primarily used to identify which basic events or combinations will lead to the final accident, as well as to help engineers understand the nature and functions of SBs. However, the qualitative analysis cannot quantify the influence degree of SBs on system failure. Fortunately, the latter can reach such a goal as long as all the data associated with the occurrence probabilities of basic events with or without SBs can be obtained.
The quantitative BT analysis cannot be separated from high-quality and sufficient data. But in practice, things often go contrary to our wishes. On the one hand, because of the insufficient knowledge of the system, the parameters used in the BT model (like failure probability data) may be inaccurate and incomplete; on the other hand, the complexity of the system and its behavior often result in the simplification of the assumptions in the analysis process [9]. All these uncertainties can negatively affect the availability and credibility of BT analysis. Therefore, in order to mitigate this issue, several approaches have been proposed to handle uncertainty data, such as fuzzy set theory (FST), evidence theory, and rough set theory [10,11]. Among these, FST has been broadly applied in the BT model for risk assessment because of its complete theoretical basis and good usability. Wang et al. [12] proposed a probability assessment method that combined FST, BT analysis, and Bayesian updating technology to assess accidents in natural gas distribution station systems. Yazdi [13] applied the Z-number to the FT to investigate the server failure consequences of hydrocarbon storage tanks. Arici et al. [14] applied a risk analysis framework of a fuzzy BT model for maritime transportation. Das [15] combined the BT model and type-2 fuzzy set for risk quantification. Elidolu [16] carried out a static electricity risk failure analysis of oil tankers using the BT model with fuzzy logic and CREAM.
To a certain extent, a fuzzy BT model can handle uncertainty effectively during analysis, but the traditional FST still has its limitations. The membership degree of the elements in a certain set is a value in the range of [0, 1] for FST. Therefore, the membership value simply indicates the degree to which the element belongs to the set, and it cannot take into account the non-membership degree originated from experts’ lack of knowledge or hesitancy. To overcome this issue, Atanassov [17] proposed the intuitionistic fuzzy set (IFS) theory. The IFS could better describe uncertain information through the concepts of membership, non-membership, and hesitation degrees. It is therefore more appropriate to address situations in which the membership value of the element in the set may be hesitant or uncertain. Given the advantages of the IFS, it has been combined with several risk assessment techniques [18]. Guo [19] applied the IFS to FMEA for risk analysis. In the IFS theory, the language variables represented by intuitionistic fuzzy numbers were used to evaluate and transform risk factors. Yazdi [20] presented a hybrid approach of intuitional fuzzy and TOPSIS for risk matrix analysis. Subsequently, Yazdi et al. [21] used IF-AHP to address uncertain data in risk-based maintenance investment optimization. Viegas et al. [22] provided an IFS-based MCDM sorting model for improving HAZOP analysis. Kaushik and Kumar [23] proposed a novel system for safety and risk assessment. This method combines the concept of BN with FTA under an intuitionistic fuzzy environment.
Whether the FS or IFS, explicit membership and/or non-membership functions are required. As commonly known, in IF-BT models, occurrence possibilities of basic events are represented by the IFS obtained through expert elicitation. However, it is often troublesome to require experts to express the membership and non-membership degrees with crisp values, since the membership and non-membership functions may not be precisely known in many cases. For this reason, the IFS is extended to interval-valued intuitionistic fuzzy sets (IVIFSs). In IVIFSs, the membership and non-membership degrees are represented by interval values in the range of [0, 1] rather than crisp values in the range of [0, 1], which bring interval freedom to the representation and treatment of uncertainty, Therefore, the IVIFS method has become increasingly popular. Wang et al. [24] incorporated an IVIFS into a hybrid MCDM model of risk analysis to handle vagueness and uncertainty. Liu et al. [25] employed an IVIFS to express the assessment values of risk factors in FMEA. Huang [26] combined an IVIFS and rough number theory to propose an IVIF rough number concept and its corresponding FMEA model. Huang and Xiao [27] also proposed an IVIF cloud theory based on FMEA for risk evaluation.
The aforementioned studies have shown that the IVIFS approach is a valuable solution to handle uncertainty in risk and safety assessment. However, to the best of our knowledge, no methods exist for evaluating SB effectiveness involving the IVIFS concept. Therefore, this paper proposes an IVIF-BT method for safety assessment and SB evaluation by introducing an IVIFS into the BT model. In this method, the failure possibilities of basic events with/without SBs in the BT model are represented as interval-valued intuitionistic fuzzy numbers (IVIFNs) to characterize the hesitation of events. Also, an IVIF-AHP is employed to analyze the importance weights of different severity types of failure consequences. Furthermore, the SB effectiveness is clearly defined and measured by comparing system failure risk with SBs to that without SBs.
In this approach, the BT model effectively links key events with the associated causes and consequences while fully and comprehensively considering the role of SBs within the model. Compared to other methods, this approach not only allows for safety assessments but also considers the failure risks and consequences of the system in the presence of various SBs, further analyzing the effectiveness of each SB. Additionally, in this method, obtaining key data through expert elicitation enhances the applicability of the model, and the use of IVIFNs helps handle the uncertainty and fuzziness of expert opinions, thereby increasing the reliability of the model. Consequently, this method can effectively address the challenges of multiple uncertainties and incomplete information in process industries, ensuring the accuracy and credibility of safety assessments. It provides decision-makers with intuitive and comprehensive safety assessment results, aiding them in devising more effective safety management measures.
The remainder of this paper is structured as follows: Section 2 introduces basic concepts of safety barriers, the BT model, and IVIFNs. Section 3 presents the method for evaluating the effectiveness of SBs in process systems, and the detailed implementation process is given. In Section 4, to verify the feasibility of this method, an illustrative example of natural gas storage tank is provided. Finally, the analysis conclusions are drawn in Section 5.
2. Preliminaries
This section introduces the key concepts and definitions associated with safety barriers, the bow-tie model, and IVIFNs. The arithmetic operations and properties of IVIFNs are also discussed in this section.
2.1. Safety Barriers
Safety barriers (SBs) have not had a universally accepted definition so far because they cover a broad range of subjects in areas like economics, management, traffic, aeronautics and astronautics, nuclear power, and the petrochemical industry. As far as process systems are concerned, Sklet [28] recommended an appropriate definition of SBs. The definition implies three fundamental elements of SBs as follows:
- Barrier systems: physical and/or non-physical means;
- Barrier functions: for prevention, control, or mitigation;
- Barrier objects: undesired events or accidents.
Furthermore, they can be categorized into several types according to different dimensions. Table 1 summarizes some typical classifications of SBs in process systems.

Table 1.
Classification of safety barriers in process systems.
There are different requirements for SB functions and implementation methods in safety management, leading to different classification methods and principles. In addition, considering the specific application scenarios, industry standards, regulatory requirements, and specific requirements of safety management, different classification systems emphasize different aspects. Therefore, although the classification principle is the same, classification results will be different.
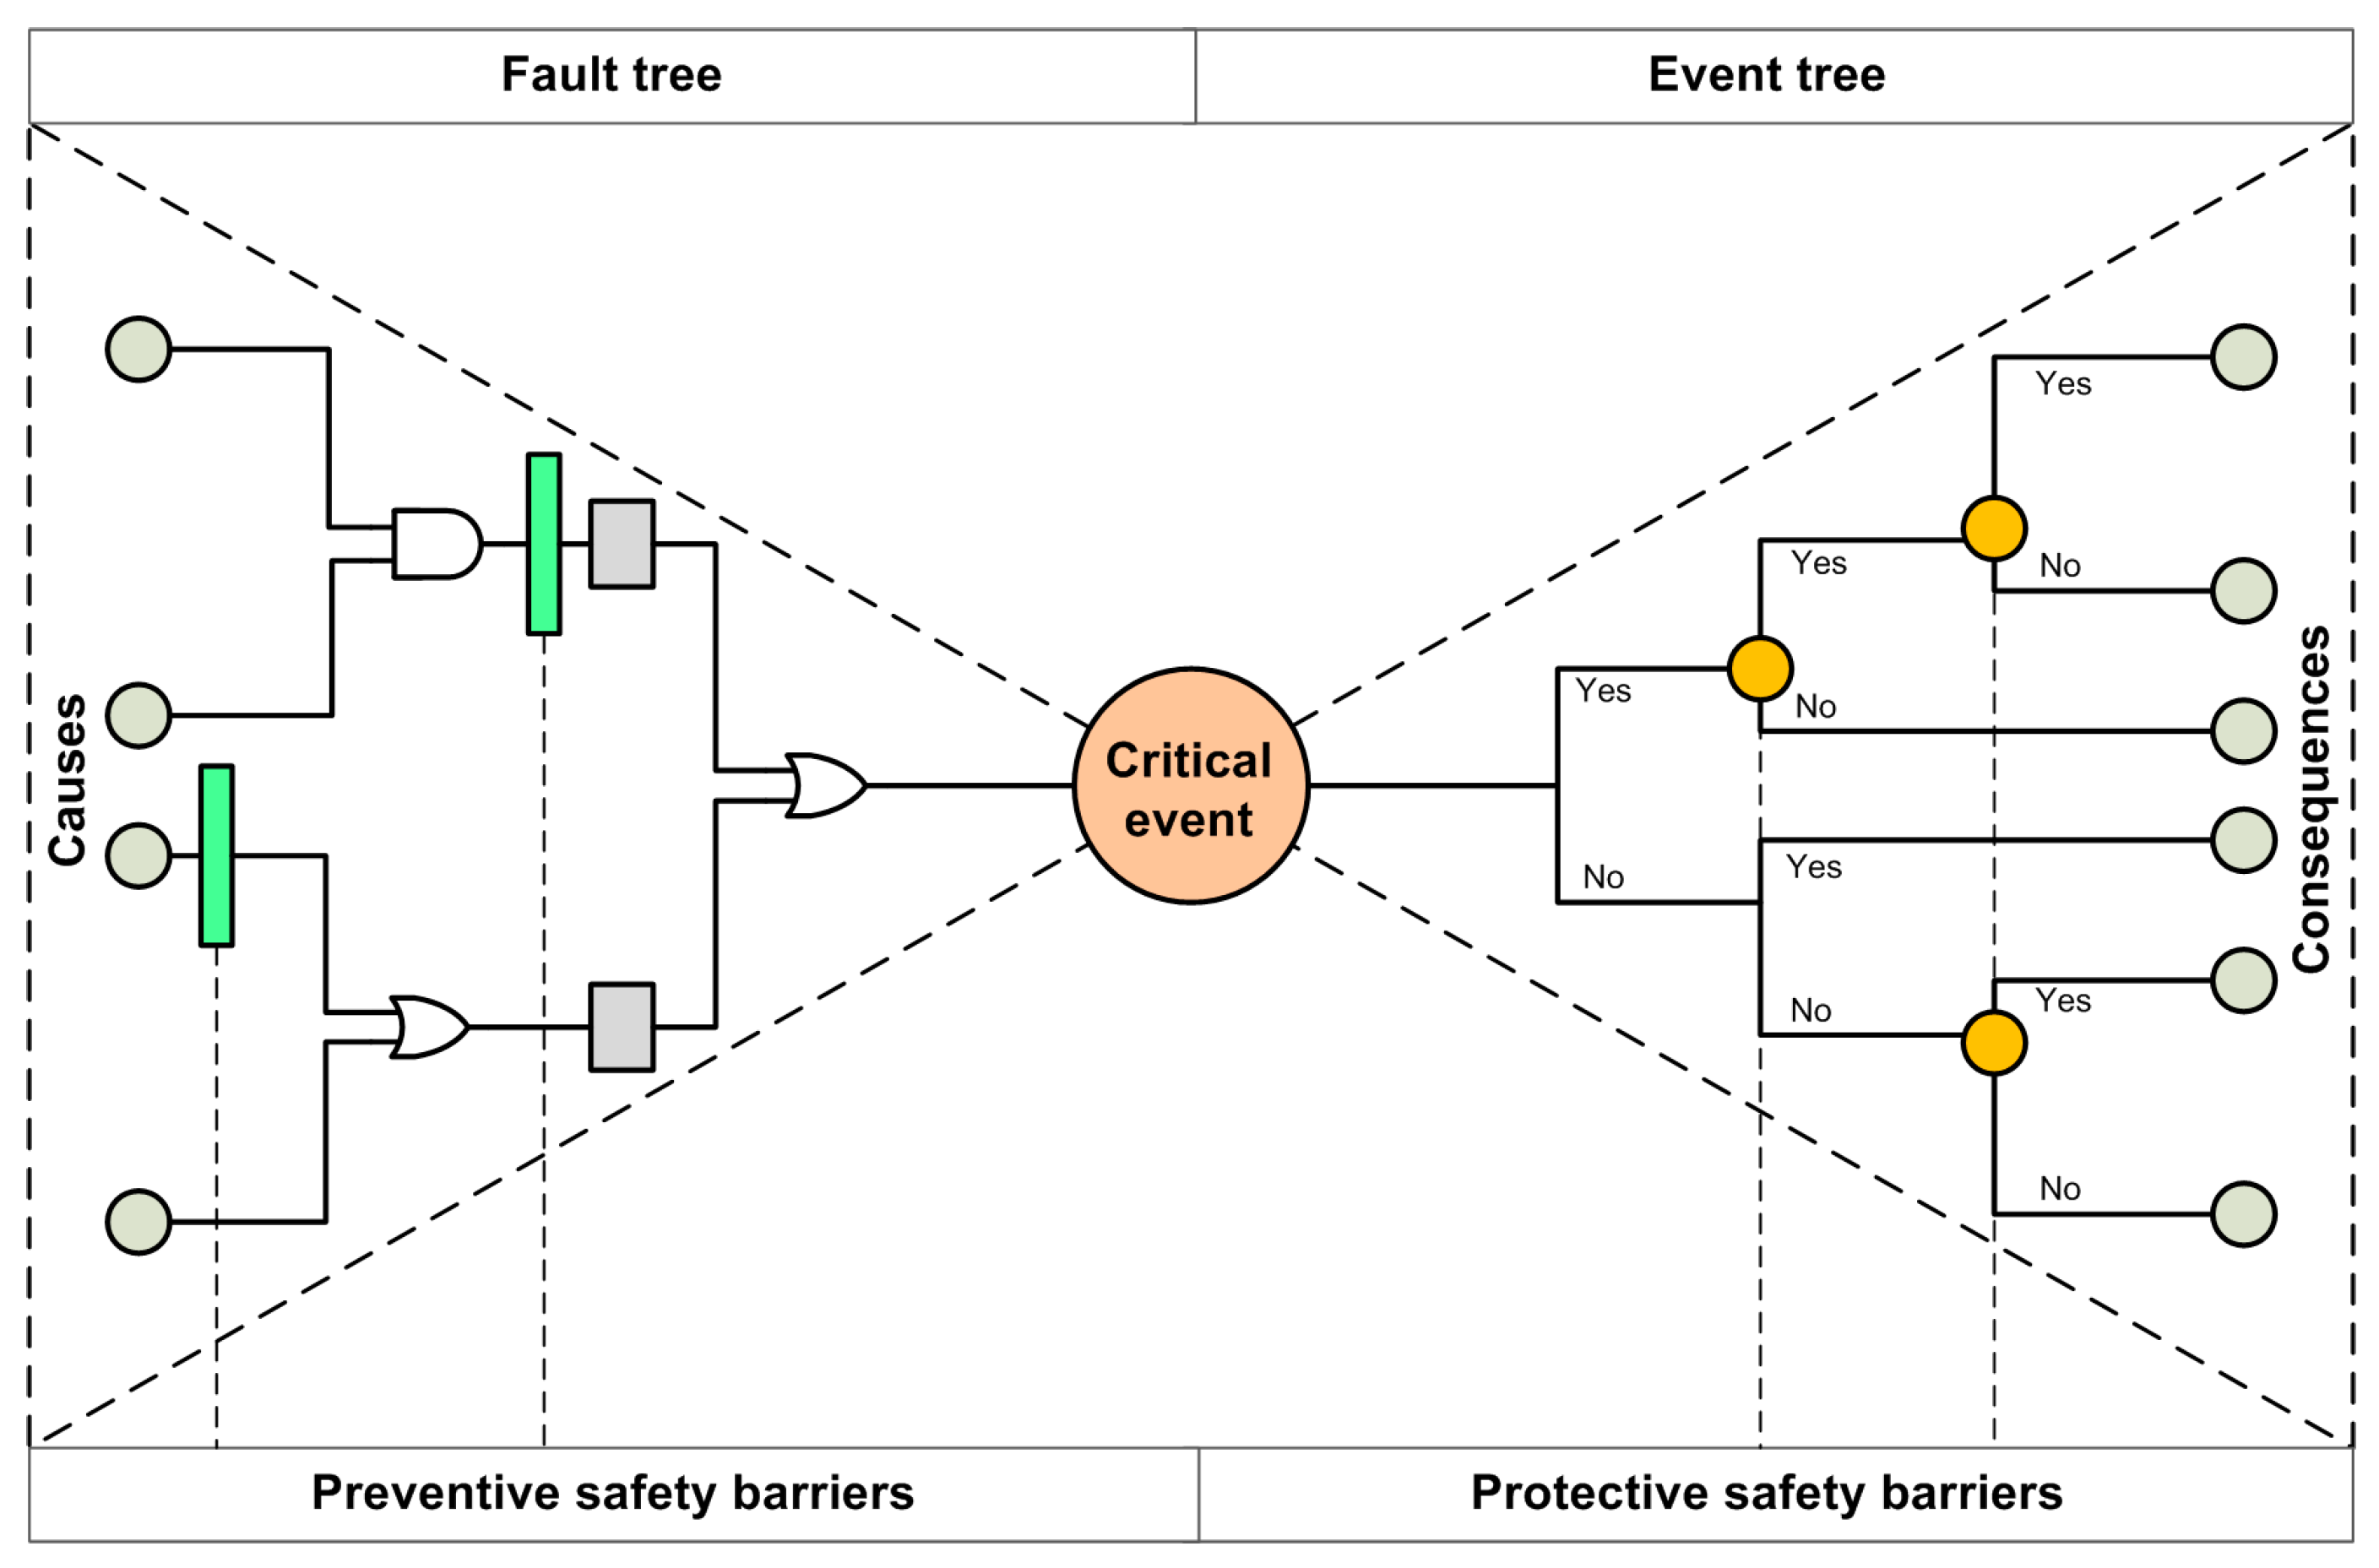
The classification adopted in this study is based on barrier functions. Hence, SBs are classified into preventive and protective barriers (see Figure 1). The former, involving barriers between causes and the critical event, can reduce the occurrence probabilities of hazard events, while the latter, encompassing the barriers between the critical event and outcomes, can mitigate the consequence severity of the hazard events.
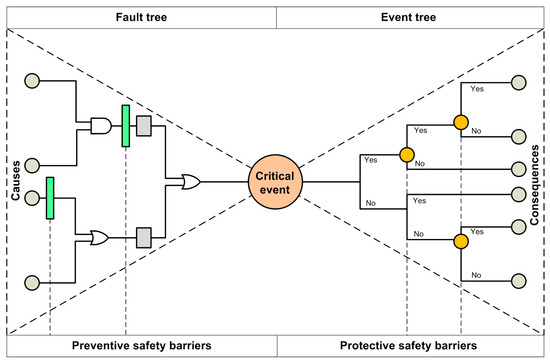
Figure 1.
General bow-tie model with safety barriers.
Generally speaking, a catastrophic accident starts with one or some initiating events, which proceed in a certain sequence of events and evolve gradually until the accident finally occurs or aborts. SBs play a crucial role in this process. If SBs are effective and reliable, they can largely mitigate and avoid hazardous events, thus giving the system a strong protective effect, and conversely, they cannot slow down the progress of the accident. Therefore, SB performance is an issue that requires more in-depth analysis.
For safety barriers, common performance indicators include effectiveness, availability, durability, independence, etc. Among them, effectiveness is the core indicator to measure whether SBs can achieve their expected function. It can measure the degree to which the SBs mitigate system damage from the accident [37]. In some cases, effectiveness is primarily considered in the measurement of preventative barriers, expressed as a reduction in the probability of system safety events. In other cases, it is indicated by the mitigation degree of the consequences of system failure, which is common in protective barriers.
2.2. Bow-Tie Model with Safety Barriers
The bow-tie (BT) model was developed by Nielsen in the 1970s. It was named as such because the shape of the model is similar to a bow tie. The BT model can display the relationship between the risk parameters of causes, hazards, and consequences in the form of a logical block diagram. As research progressed, the BT approach became a popular risk management approach in high-risk industries such as petrochemicals, aerospace, and mining. Figure 1 illustrates a schematic diagram of a bow-tie model with SBs [38].
A complete BT model can describe the whole accident scenario from accident causes to accident consequences. When SBs are considered in the BT model, the ones located on the FT are viewed as preventive SBs, and those on the ET are protective SBs. In other words, the BT model can be used to evaluate the performance of both preventive and protective SBs. From a qualitative point of view, the BT model can help researchers and engineers understand what initial event or event set will lead to the final accident, and what role SBs play. From a quantitative point of view, if the probabilities of all the basic events occurring, along with the influence of SBs on the probabilities of the events, are determined, then it becomes possible to quantify the probability of the critical event and the ensuing consequences of failure, including the performance of each SB.
2.3. Interval-Valued Intuitionistic Fuzzy Set
2.3.1. Fuzzy Set and IFS
Zadeh [39] first proposed the theory of classical fuzzy set in 1965. In the fuzzy set theory, membership represents the degree to which an element belongs to a set or the belief that it belongs to a concept. The membership degree of an element in the domain X is usually in the range of [0, 1].
Definition 1.
Fuzzy set:
Let X be a non-empty set. A fuzzy set in X is an object A given in Equation (1) as follows:
where is the membership function, and .
Definition 2.
Intuitionistic fuzzy set:
Let X be a non-empty set. An intuitionistic fuzzy set (IFS) in X is an object given in Equation (2) as follows:
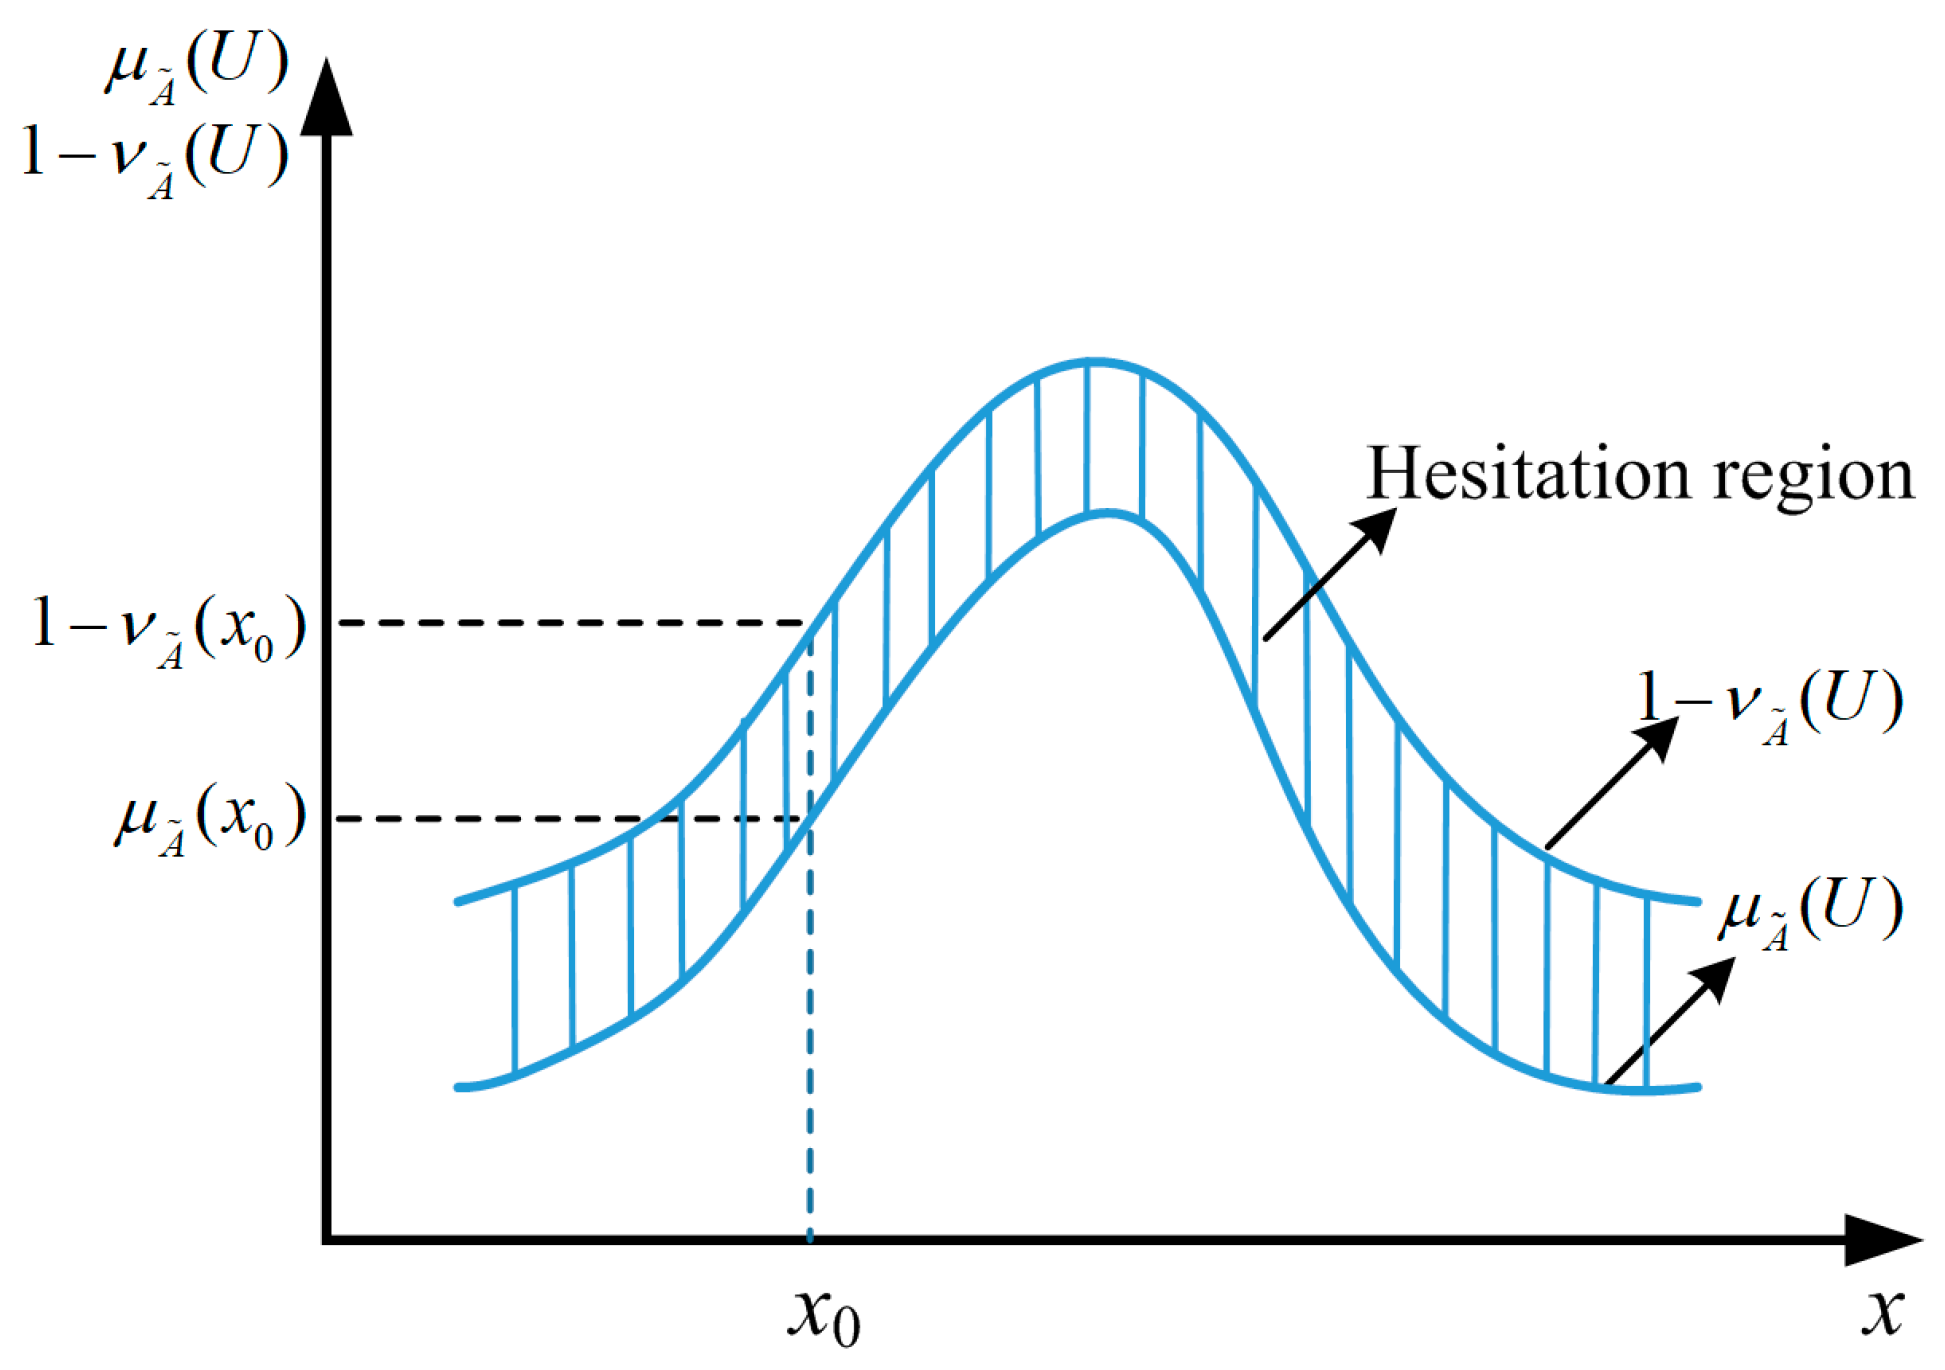
where and , while,.
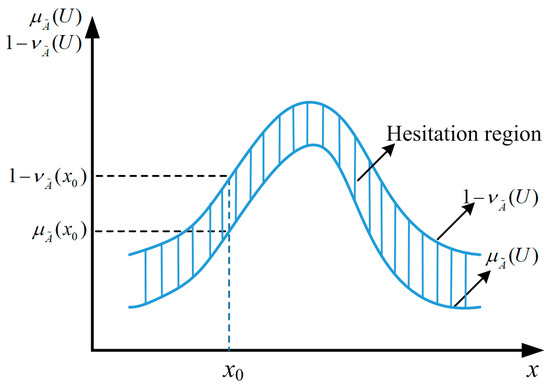
where , and are the membership, non-membership, and hesitation functions, respectively. Figure 2 illustrates a typical IFS of the real number R.
Figure 2.
IFS explanation of real number R.
2.3.2. IVIFS and IVIFNs
The interval-valued intuitionistic fuzzy set (IVIFS) was first proposed by Atanassov and Gargov [17]. In the IVIFS, the concept of interval is introduced to extend the IFS, so that the membership and non-membership functions in the IVIFS no longer function but are interval values. The concept of interval values can better address uncertain information in practice.
Definition 3.
IVIFS and IVIFNs:
Let X be a non-empty set. An IVIFS in X is given in Equation (4).
where and . Here, and are the intervals with the following conditions:
and
Additionally,
where .
The intervals , , and denote the degrees of membership, non-membership, and hesitation of the element x in the set X, respectively. Here, the interval pair is called the interval-valued intuitionistic fuzzy number (IVIFN). For convenience, it can be denoted as . If and , then the IVIFN degenerates to an intuitionistic fuzzy number (IFN).
Definition 4.
Basic arithmetic operations of IVIFNs:
Let and be two IVIFNs; λ is a positive real number. Then, some arithmetic operations can be defined using Equations (9)–(14) [40].
Let , , and be three IVIFNs. Then, we have
- (1)
- Closure Property: , , , , and are also interval-value intuitionistic fuzzy numbers;
- (2)
- Commutative law: , ;
- (3)
- Associative law: , ;
- (4)
- Distributive law: , .
Definition 5.
Aggregation operation of IVIFNs:
Let
be a collection of IVIFNs,, I be the set of IVIFN, and be the weight vector, where and . The aggregation operations commonly used in IVIFNs are the interval-valued intuitionistic fuzzy weighted arithmetic averaging (IVIFWA) operator and the weighted geometric averaging (IVIFWG) operator, which are defined using Equations (15) and (16), respectively [41,42,43].
In order to easily and quickly aggregate IVIFNs, the IVIFWA operator was used in this study.
Definition 6.
Defuzzification of IVIFN:
Let be an IVIFN. Equation (17) can be used to defuzzify [42,44] as follows:
3. Proposed Effectiveness Evaluation Method of Safety Barrier
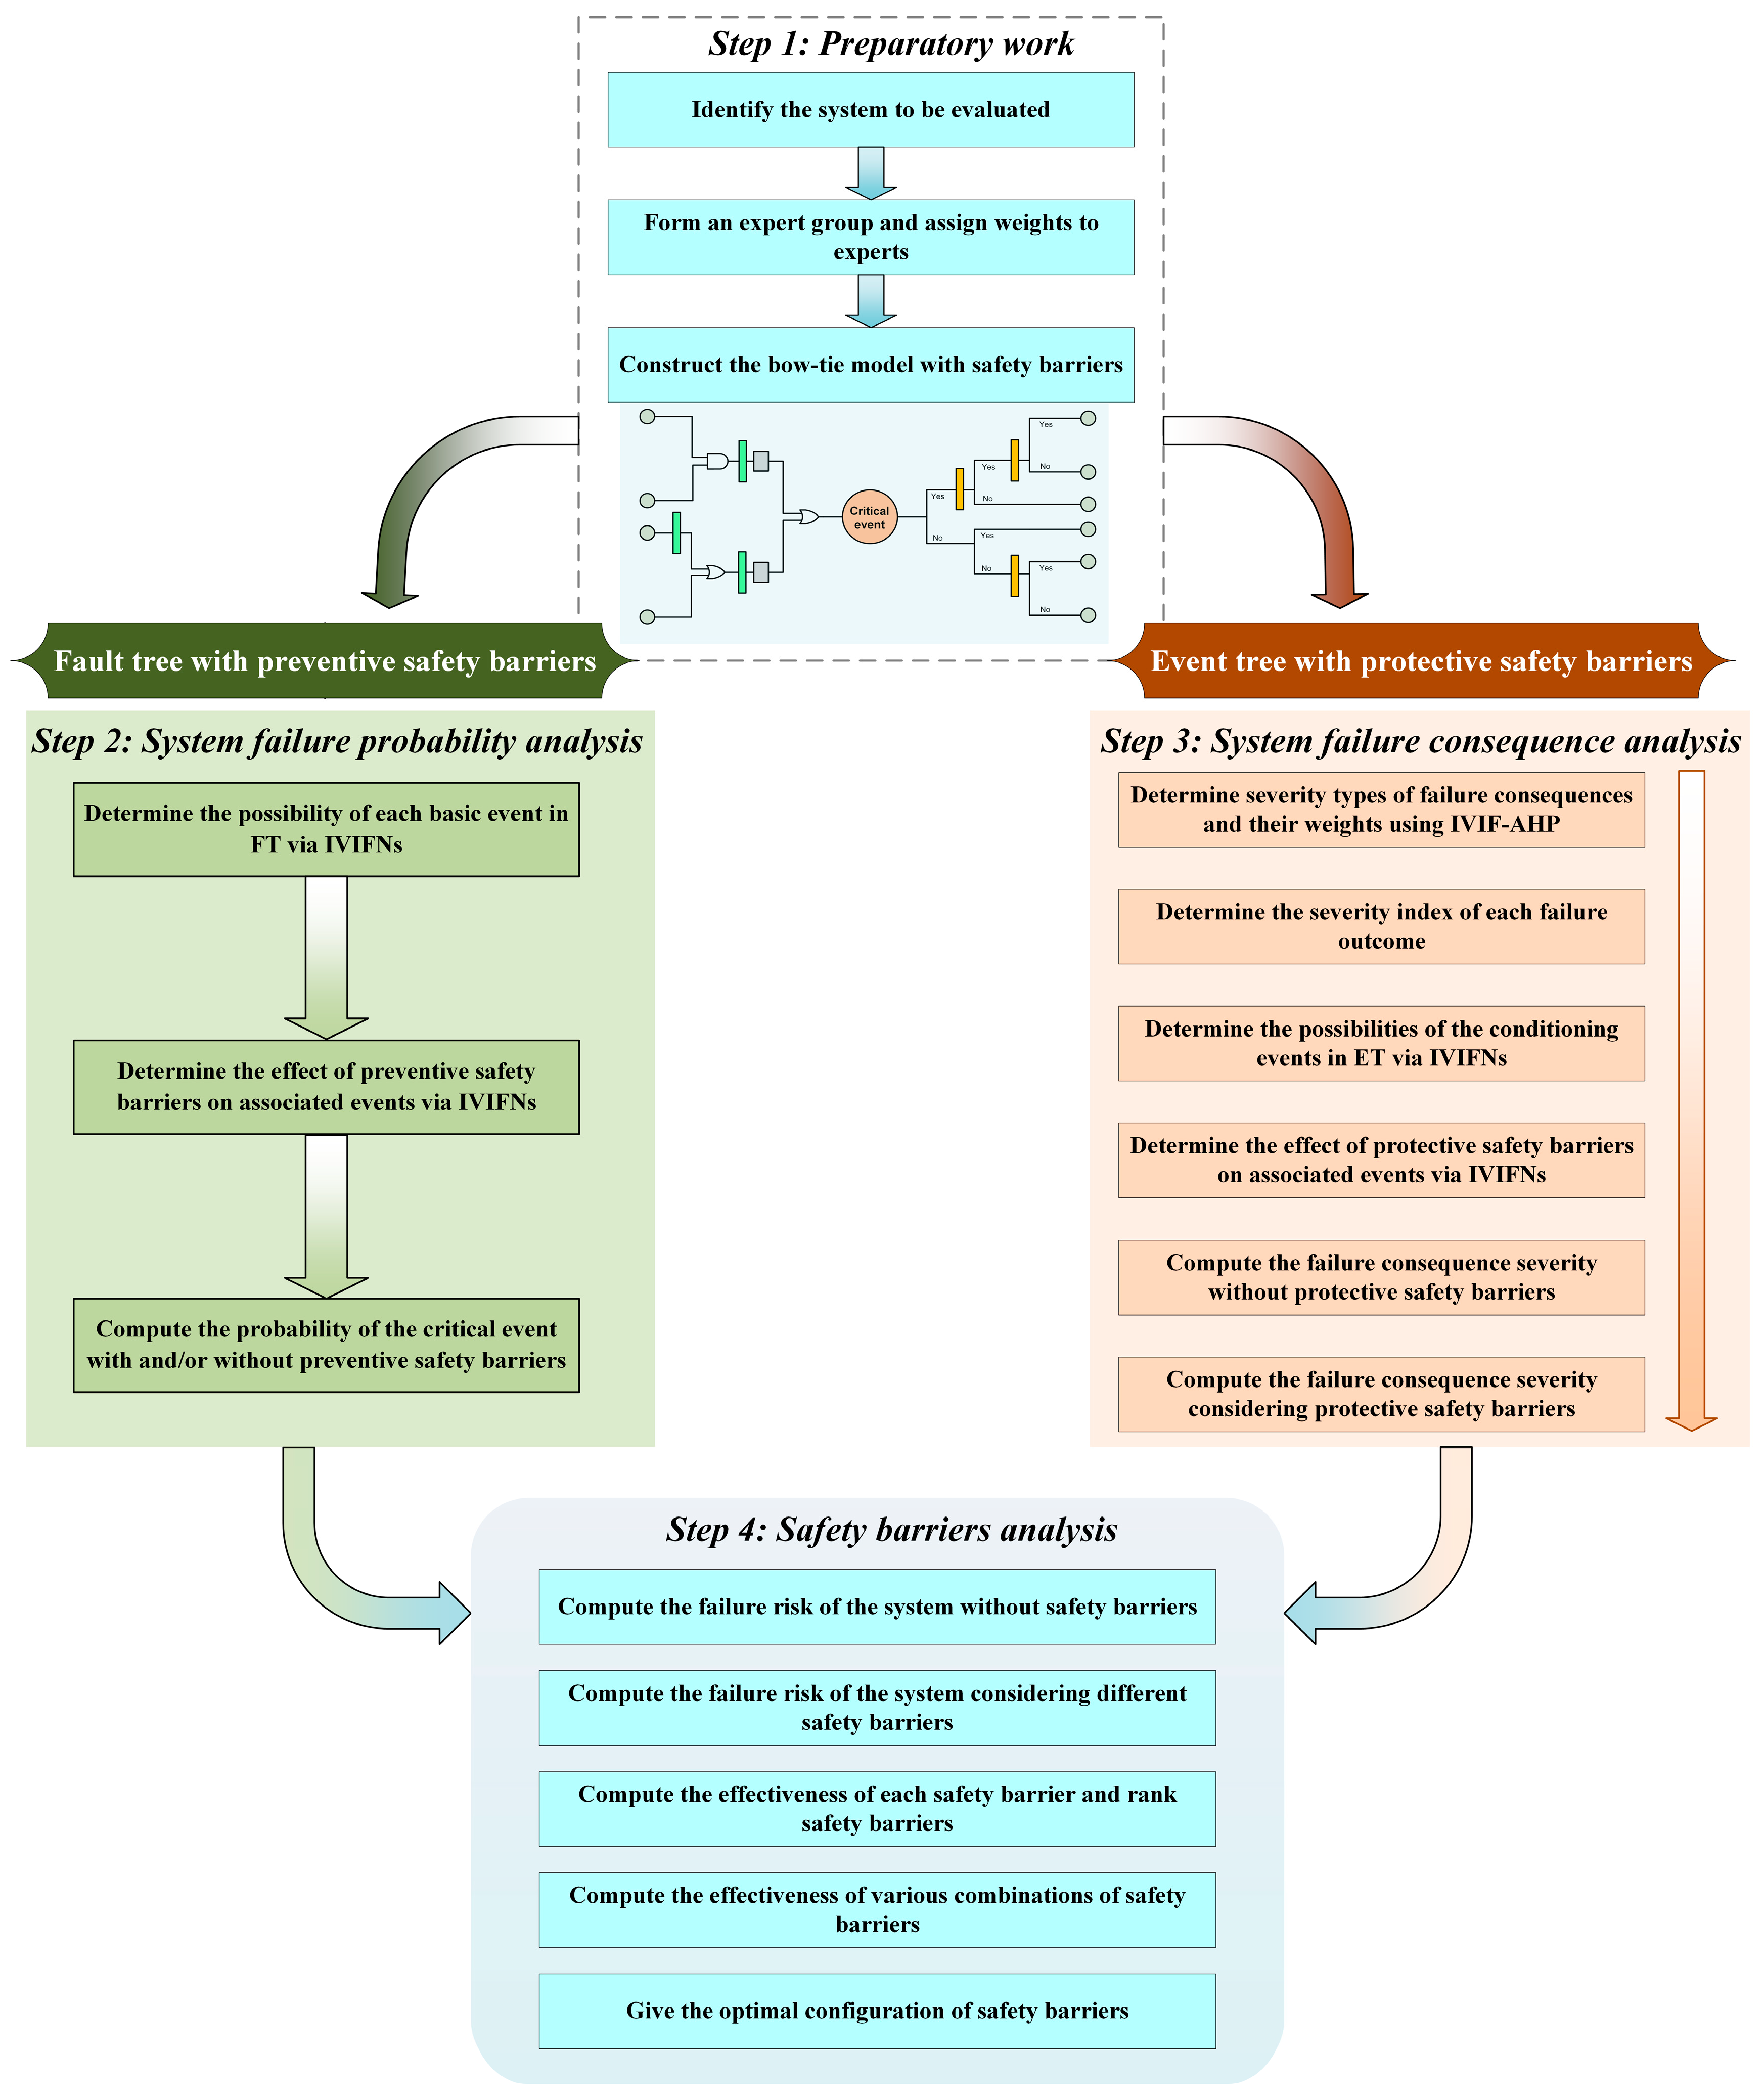
In this section, the proposed method for the effectiveness evaluation of SBs based on the integration of IVIFNs and bow-tie methodology is described in detail. The method aims to evaluate the effectiveness of SBs in improving system safety. The point-to-point guide to this method is shown in Figure 3, which mainly consists of four critical procedures, and a brief overview of each critical procedure is as follows: (1) Preparatory work: This initial step involves identifying the system under evaluation, forming an expert group, and constructing the corresponding BT model with SBs. (2) System failure probability analysis: In this procedure, the possibility of system failure events and the effectiveness of preventive SBs are assessed using IVIFNs. (3) System failure consequence analysis: The severity of failure consequences and the effectiveness of protective SBs are evaluated using the IVIF-AHP and IVIFNs, respectively. (4) Safety barrier analysis: Finally, the failure risk of the system with and without SBs is computed, and the effectiveness of various safety barrier configurations is analyzed to provide recommendations for future safety planning. In summary, this method takes the BT model with SBs as the basis of safety evaluation and optimizes the calculation process and analysis results of the model using IVIFNs. This IVIF-BT method can further improve the reliability of the evaluation results.
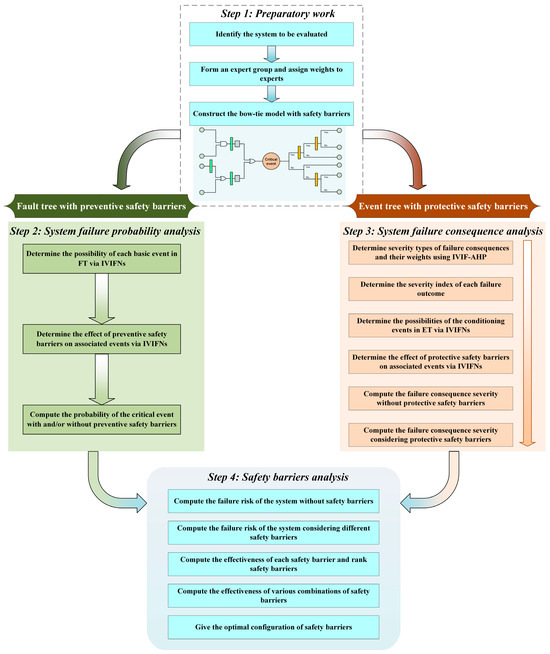
Figure 3.
Flowchart of the methodology proposed in this study for effectiveness evaluation of safety barriers of process systems.
3.1. Preparatory Work
3.1.1. Identify the System to Be Evaluated
The first step in this method is to identify the system being evaluated and gather relevant information about this system.
3.1.2. Form an Expert Group and Assign Weights to Experts
To address the lack and inaccuracy of objective data, an expert decision-making group composed of K experts and/or engineers is needed to provide the required system information. The selection of experts should follow the principle of diversity and professionalism as far as possible. In general, the opinions given by experts vary depending on their educational profile, professional types, and work experience, making the opinions more comprehensive. Therefore, experts are evaluated by considering their work experience, education level, professional relevance, and professional title, so as to obtain the expert weight coefficients to indicate the relative importance of each expert’s opinion. The criteria are shown in Table 2. The weighting factors of the experts are calculated using Equation (18).
where Q1i–Q4i are the weighting scores of the ith expert according to Table 2.
Table 2.
Weighting scores of experts.
3.1.3. Construct the Bow-Tie Model with Safety Barriers
The BT model with SBs can be constructed according to the failure scenarios of the system and the actual configuration of SBs. The first step is to determine the critical event. Bellamy et al. [45] stated that any event can be a critical event, as long as it meets the needs and actual situation. Usually, the critical event is a hazardous event or dangerous event that may lead to a serious accident when the final accident has not occurred, such as mechanical failure, equipment damage, energy escape, or human errors. It can be determined according to the system design, system operation, accident experience, etc. When the critical event is defined, the fault tree in the BT model can be constructed from the critical event to basic events. Then, the potential types of failure consequences after the critical event can be analyzed, and the event tree in the BT model can be constructed from the critical event to failure consequences according to accident scenarios. Finally, the SBs are added to the correct event paths in the model. The construction process can be carried out using HAZOP, Fishbone Diagram, FMEA, or other methods.
3.2. System Failure Probability Analysis
3.2.1. Determine the Possibility of Each Basic Event in FT via IVIFNs
The possibility of each basic event in FT is given by expert group members according to their own knowledge and experience, as well as the actual operation situation of the system. However, it is difficult for experts to determine IVIFNs directly by using a direct assignment method, so linguistic terms (see Table 3) are adopted. Experts select the linguistic terms from Table 3 to indicate the possibilities of events [46]. The selected linguistic terms are then converted into the corresponding IVIFNs to perform an aggregation operation using Equation (19).
where is the possibility of the ith basic event, and is the possibility of the ith basic event given by the jth expert. Using Equation (20), the possibility is converted to a probability [47].
where is the crisp value of after defuzzification through Equation (17), and is the probability of the ith basic event.
Table 3.
Linguistic scale and their corresponding IVIFNs [46].
3.2.2. Determine the Effect of Preventive Safety Barriers on Associated Events via IVIFNs
When preventive SBs exist, the occurrence possibilities of the events related to the SBs in FT are also given by experts, and the experts’ opinions are aggregated by the IVIFWA operator.
3.2.3. Compute the Probability of the Critical Event with and/or without Preventive Safety Barriers
After obtaining the probability of each basic event and the probabilities of related events in the presence of SBs, the probability of the critical event PT is computed using Equations (21) and (22).
3.3. System Failure Consequence Analysis
3.3.1. Determine Severity Types of Failure Outcomes and Their Weights Using IVIF-AHP
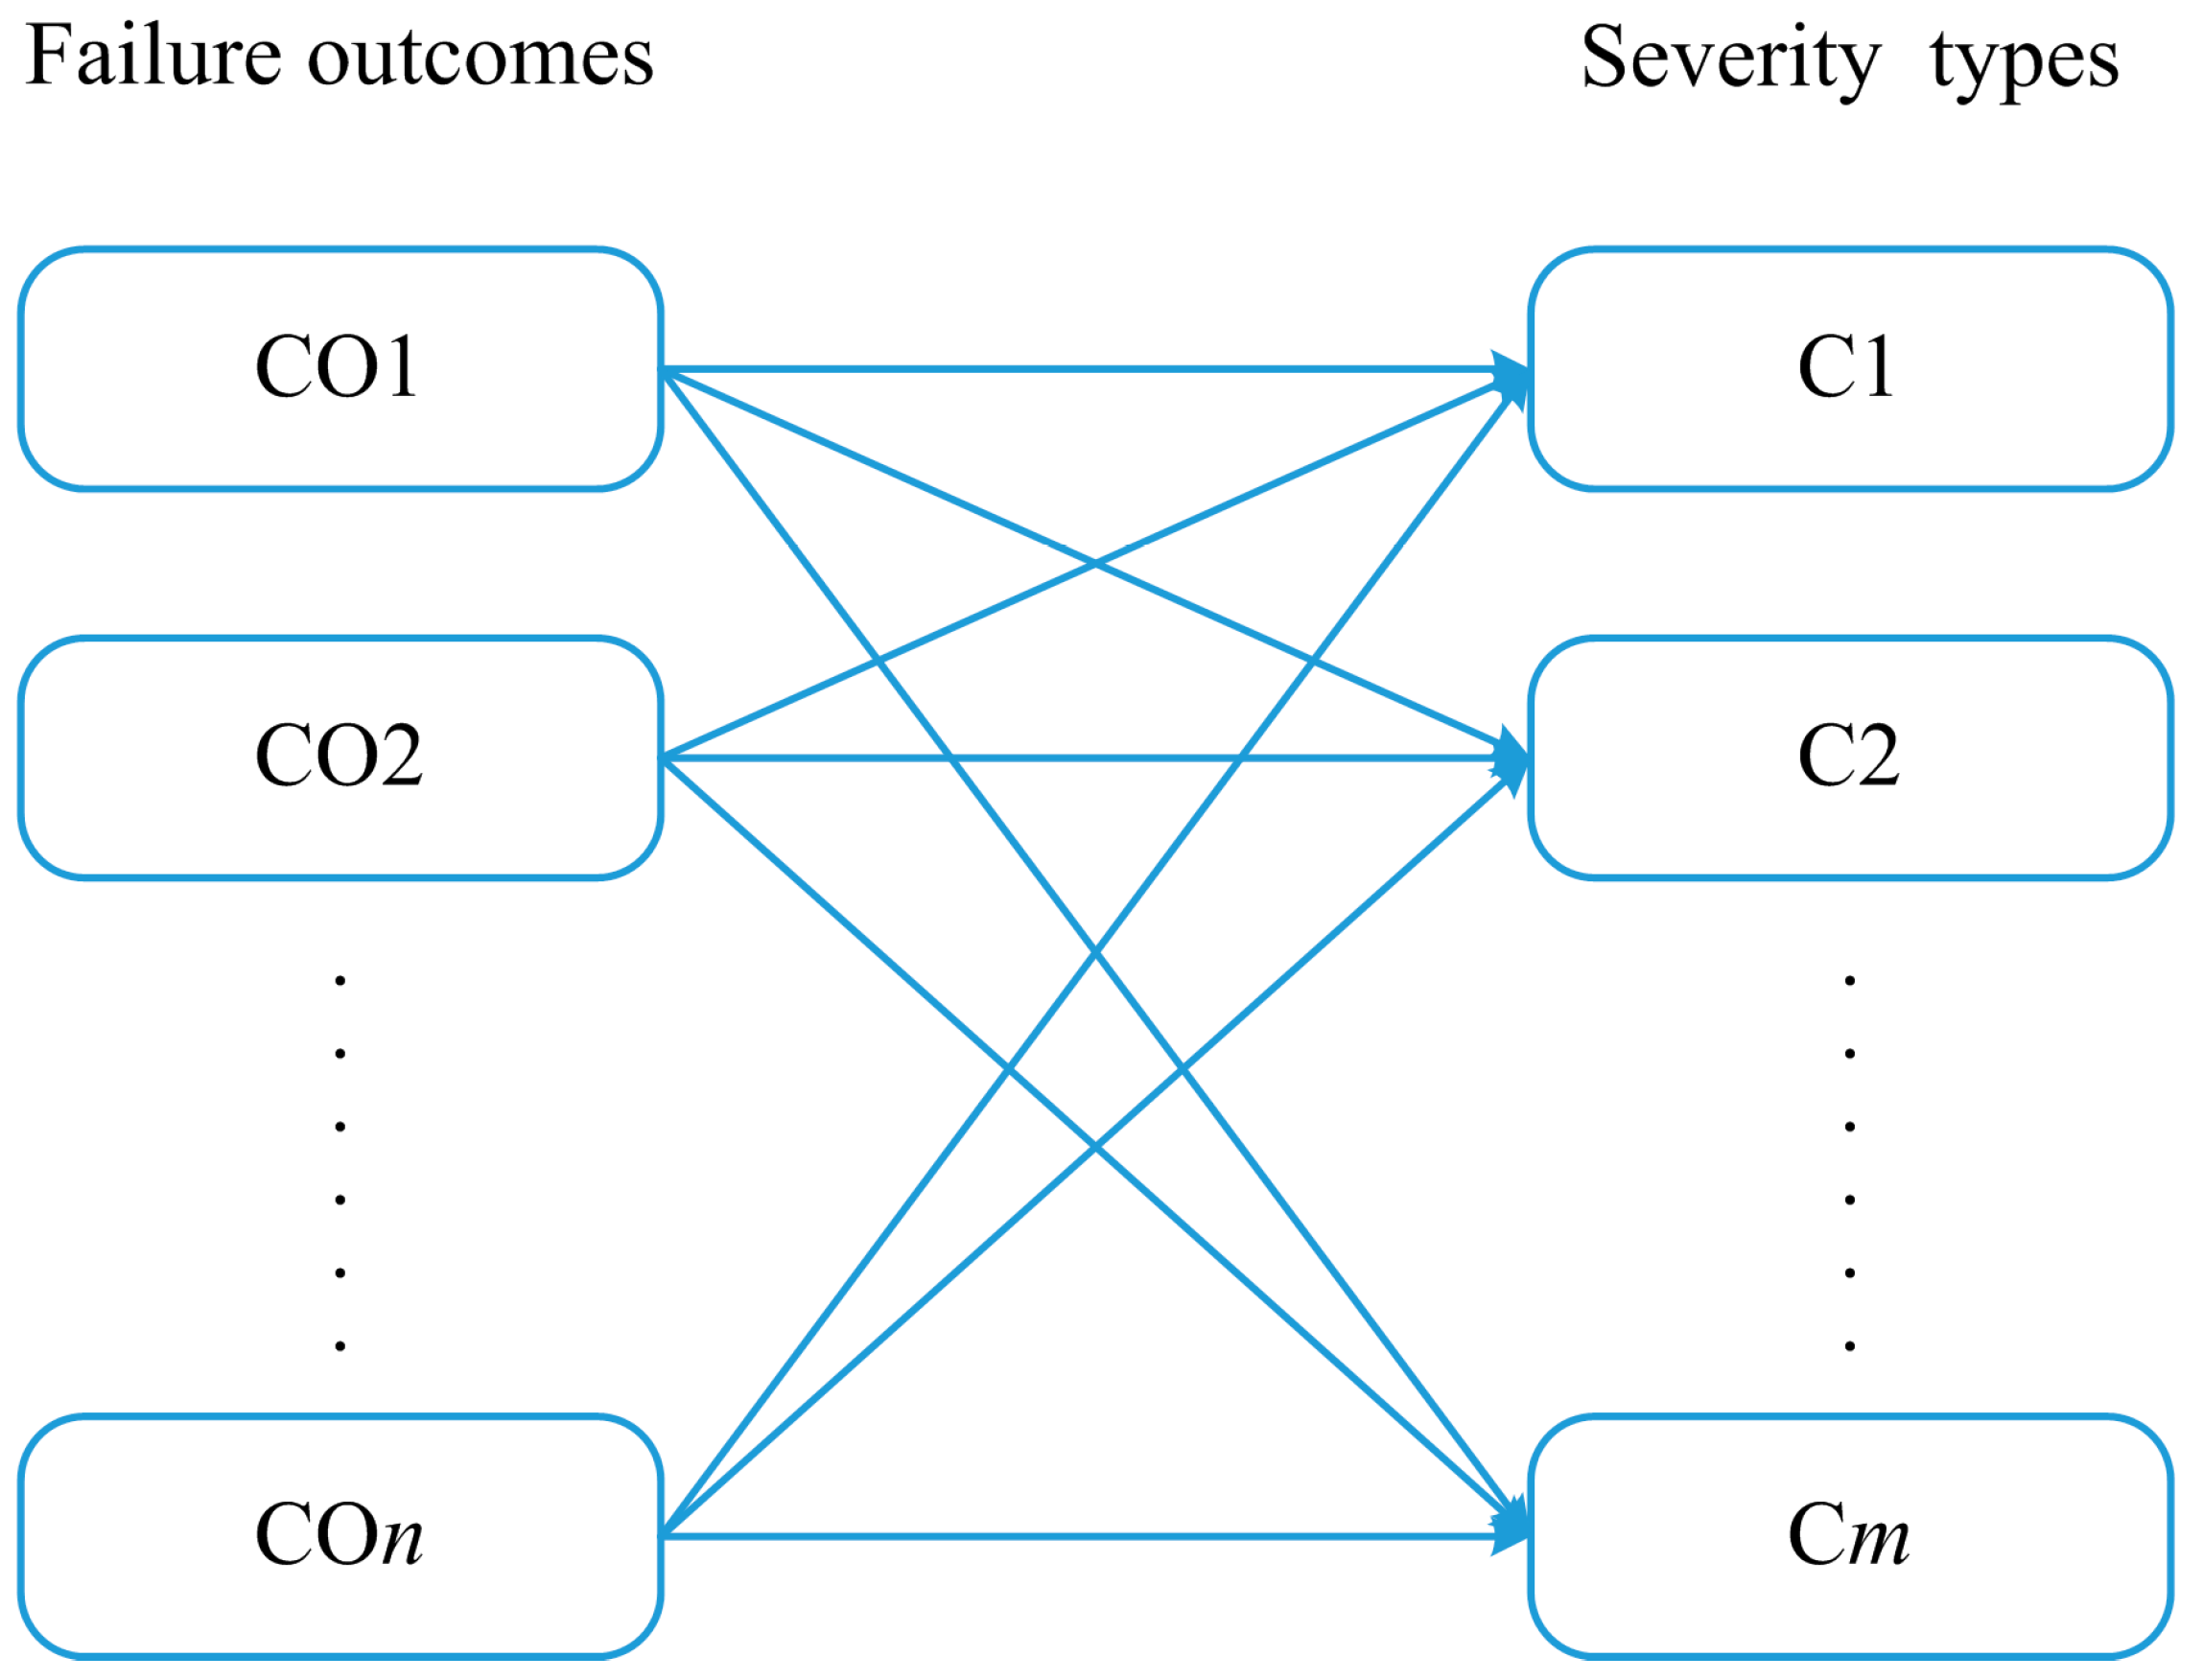
Traditional event trees are mainly used to analyze the probabilities of different failure outcomes (e.g., fire and explosion) in a system; however, they do not take into account the severity of the failure consequences caused by outcomes. This leads to the inability to effectively quantify the effect of various protective SBs on failure consequences through the event tree alone, thus limiting the estimation of the effectiveness of SBs. Therefore, in this study, a link between the outcomes in the ET and the severity of the consequences is established, as shown in Figure 4, through which the failure outcomes can be further converted into a severity index so that the effect of SBs on the failure consequences of the system can be measured. In Figure 4, COn refers to the failure outcomes in the ET, Cm refers to the consequence severity types, n indicates that there are n types of failure consequences, and m means that consequences can be divided into m severity types.
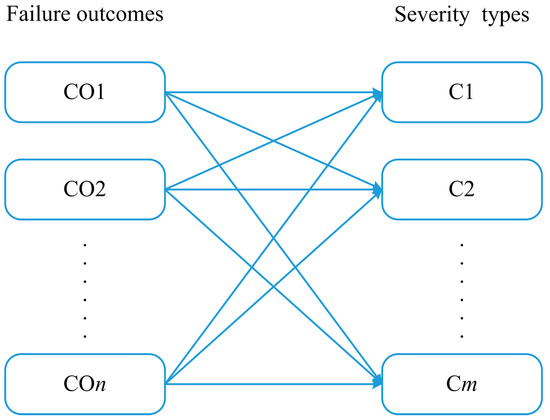
Figure 4.
The corresponding relationship between failure outcomes and severity types.
There are two main ways to evaluate the severity index of failure consequences. One is to estimate the monetary loss caused by each outcome, then multiply the money lost for each by the corresponding occurrence probability, and finally sum them up. However, the monetary measure for human casualties and environmental impacts is too complex and difficult to estimate. For this reason, the second way is adopted here, which is to categorize the severity of failure consequences into several types like production loss, safety effect, environmental effect, and equipment cost, and then assess the effect of each consequence on each severity type through expert judgment, and finally aggregate the effects.
Considering the fact that different severity types have different levels of impact on the consequences, the weight of each severity type needs to be assigned before determining the severity index of each failure outcome. The IVIF-AHP is used for this. The specific procedure for calculating the weights is described below.
Firstly, the importance of pairwise comparison of each severity type is given by experts and converted into IVIFNs according to Table 4 [48]. Secondly, the importance of each severity type judged by each expert is calculated using Equation (23), and then the importance of each severity type is obtained by aggregating experts’ opinions using Equation (24).
where is the weight of the kth expert, and .
Table 4.
IVIF-AHP preference scale.
Thirdly, the rationality of the experts’ opinions is verified according to the consistency ratio (CR) calculated with Equation (25). If CR does not exceed 0.1, the experts’ opinions are reasonable. Otherwise, they need to be re-evaluated [49].
where RI is the random index, which is indicated in Table 5 [50].
Table 5.
Random indices of different sizes of matrices.
Finally, when passing the consistency test, the crisp weights of the severity types are obtained using Equations (26) and (27) [51].
where
3.3.2. Determine the Severity Index of Each Failure Outcome
The consequence severity of each failure outcome differs, so after obtaining the relative weights of the severity types, the severity index (SI) of each potential failure outcome needs to be calculated. According to the linguistic terms in Table 3, each expert will be asked to evaluate the influence of the failure outcome COj on the severity type Ci, and thus the corresponding IVIFN can be obtained.
According to Equations (28) and (29), experts’ opinions are aggregated to obtain the severity of each failure outcome .
After normalization, the severity index of each failure outcome is calculated using Equation (30).
Lastly, through defuzzification, the crisp severity index can be obtained.
3.3.3. Determine the Possibilities of the Conditioning Events in ET via IVIFNs
The possibility of each conditioning event in the ET is obtained through the aggregation of experts’ opinions in Equation (31).
where is the possibility of the jth conditioning event converted by the linguistic term (see Table 3) given by the kth expert.
3.3.4. Determine the Effect of Protective Safety Barriers on Associated Events via IVIFNs
When protective SBs exist, the occurrence possibilities of the conditioning events in ET are also given by experts, and the experts’ opinions are aggregated by the IVIFWA operator.
3.3.5. Compute the Failure Consequence Severity without Protective Safety Barriers
The probability of each failure outcome can be calculated with the basic formula of ET (see Equation (32)).
where is the probability of the ith conditioning event. Then, the failure consequence severity CS without protective SBs can be obtained with Equation (33).
where is the probability of the jth failure outcome without protective SBs.
3.3.6. Compute the Failure Consequence Severity Considering Protective Safety Barriers
The failure consequence severity of the system with a certain protective SB can be calculated using Equation (34).
where is the probability of the jth failure outcome with the ith SB.
3.4. Safety Barrier Analysis
The risk index (RI) of the system without/with SBs can be calculated using Equations (21)–(33) when the probabilities of a critical event and the failure consequence severity (CS) are obtained. Here, the effectiveness index EffSB is defined to describe the relative effectiveness of an SB. The higher the EffSB is, the higher the effectiveness of the SB is, and the greater the risk reduction in the system is.
3.4.1. Compute the Failure Risk of the System without Safety Barriers
The failure risk index of the system without SBs can be calculated using Equation (35).
where is the occurrence probability of the critical event without SBs, and is the failure consequence severity of the system without SBs.
3.4.2. Compute the Failure Risk of the System Considering Different Safety Barriers
The failure risk index of the system with a certain SB can be calculated using Equation (36).
where is the risk index with the ith SB; is the occurrence probability of the critical event with the ith SB; and is the failure consequence severity of the system with the ith SB.
3.4.3. Compute the Effectiveness of Each Safety Barrier and Rank Safety Barriers
The EffSB of a certain SB is calculated using Equation (37) and sorted according to their values.
3.4.4. Compute the Effectiveness of Various Combinations of Safety Barriers
Combining SBs in different combinations, their EffSB values can be calculated using Equation (37) to analyze and compare their effectiveness.
3.4.5. Determine the Optimal Configuration of Safety Barriers for Future Plan
By comparing the EffSB values of different SB combinations, reasonable guidance and suggestions for the optimization of SBs in the future are put forward.
4. Case Study
4.1. Case Information
In this section, the safety barrier of a natural gas spherical storage tank in a natural gas reserve plant in western China is taken as an example. The specific analysis steps of the method are demonstrated, and its feasibility and applicability are verified. Details on the storage tank can be found in [52].
4.2. Construction of the Bow-Tie Model for Describing the Failure of Storage Tank
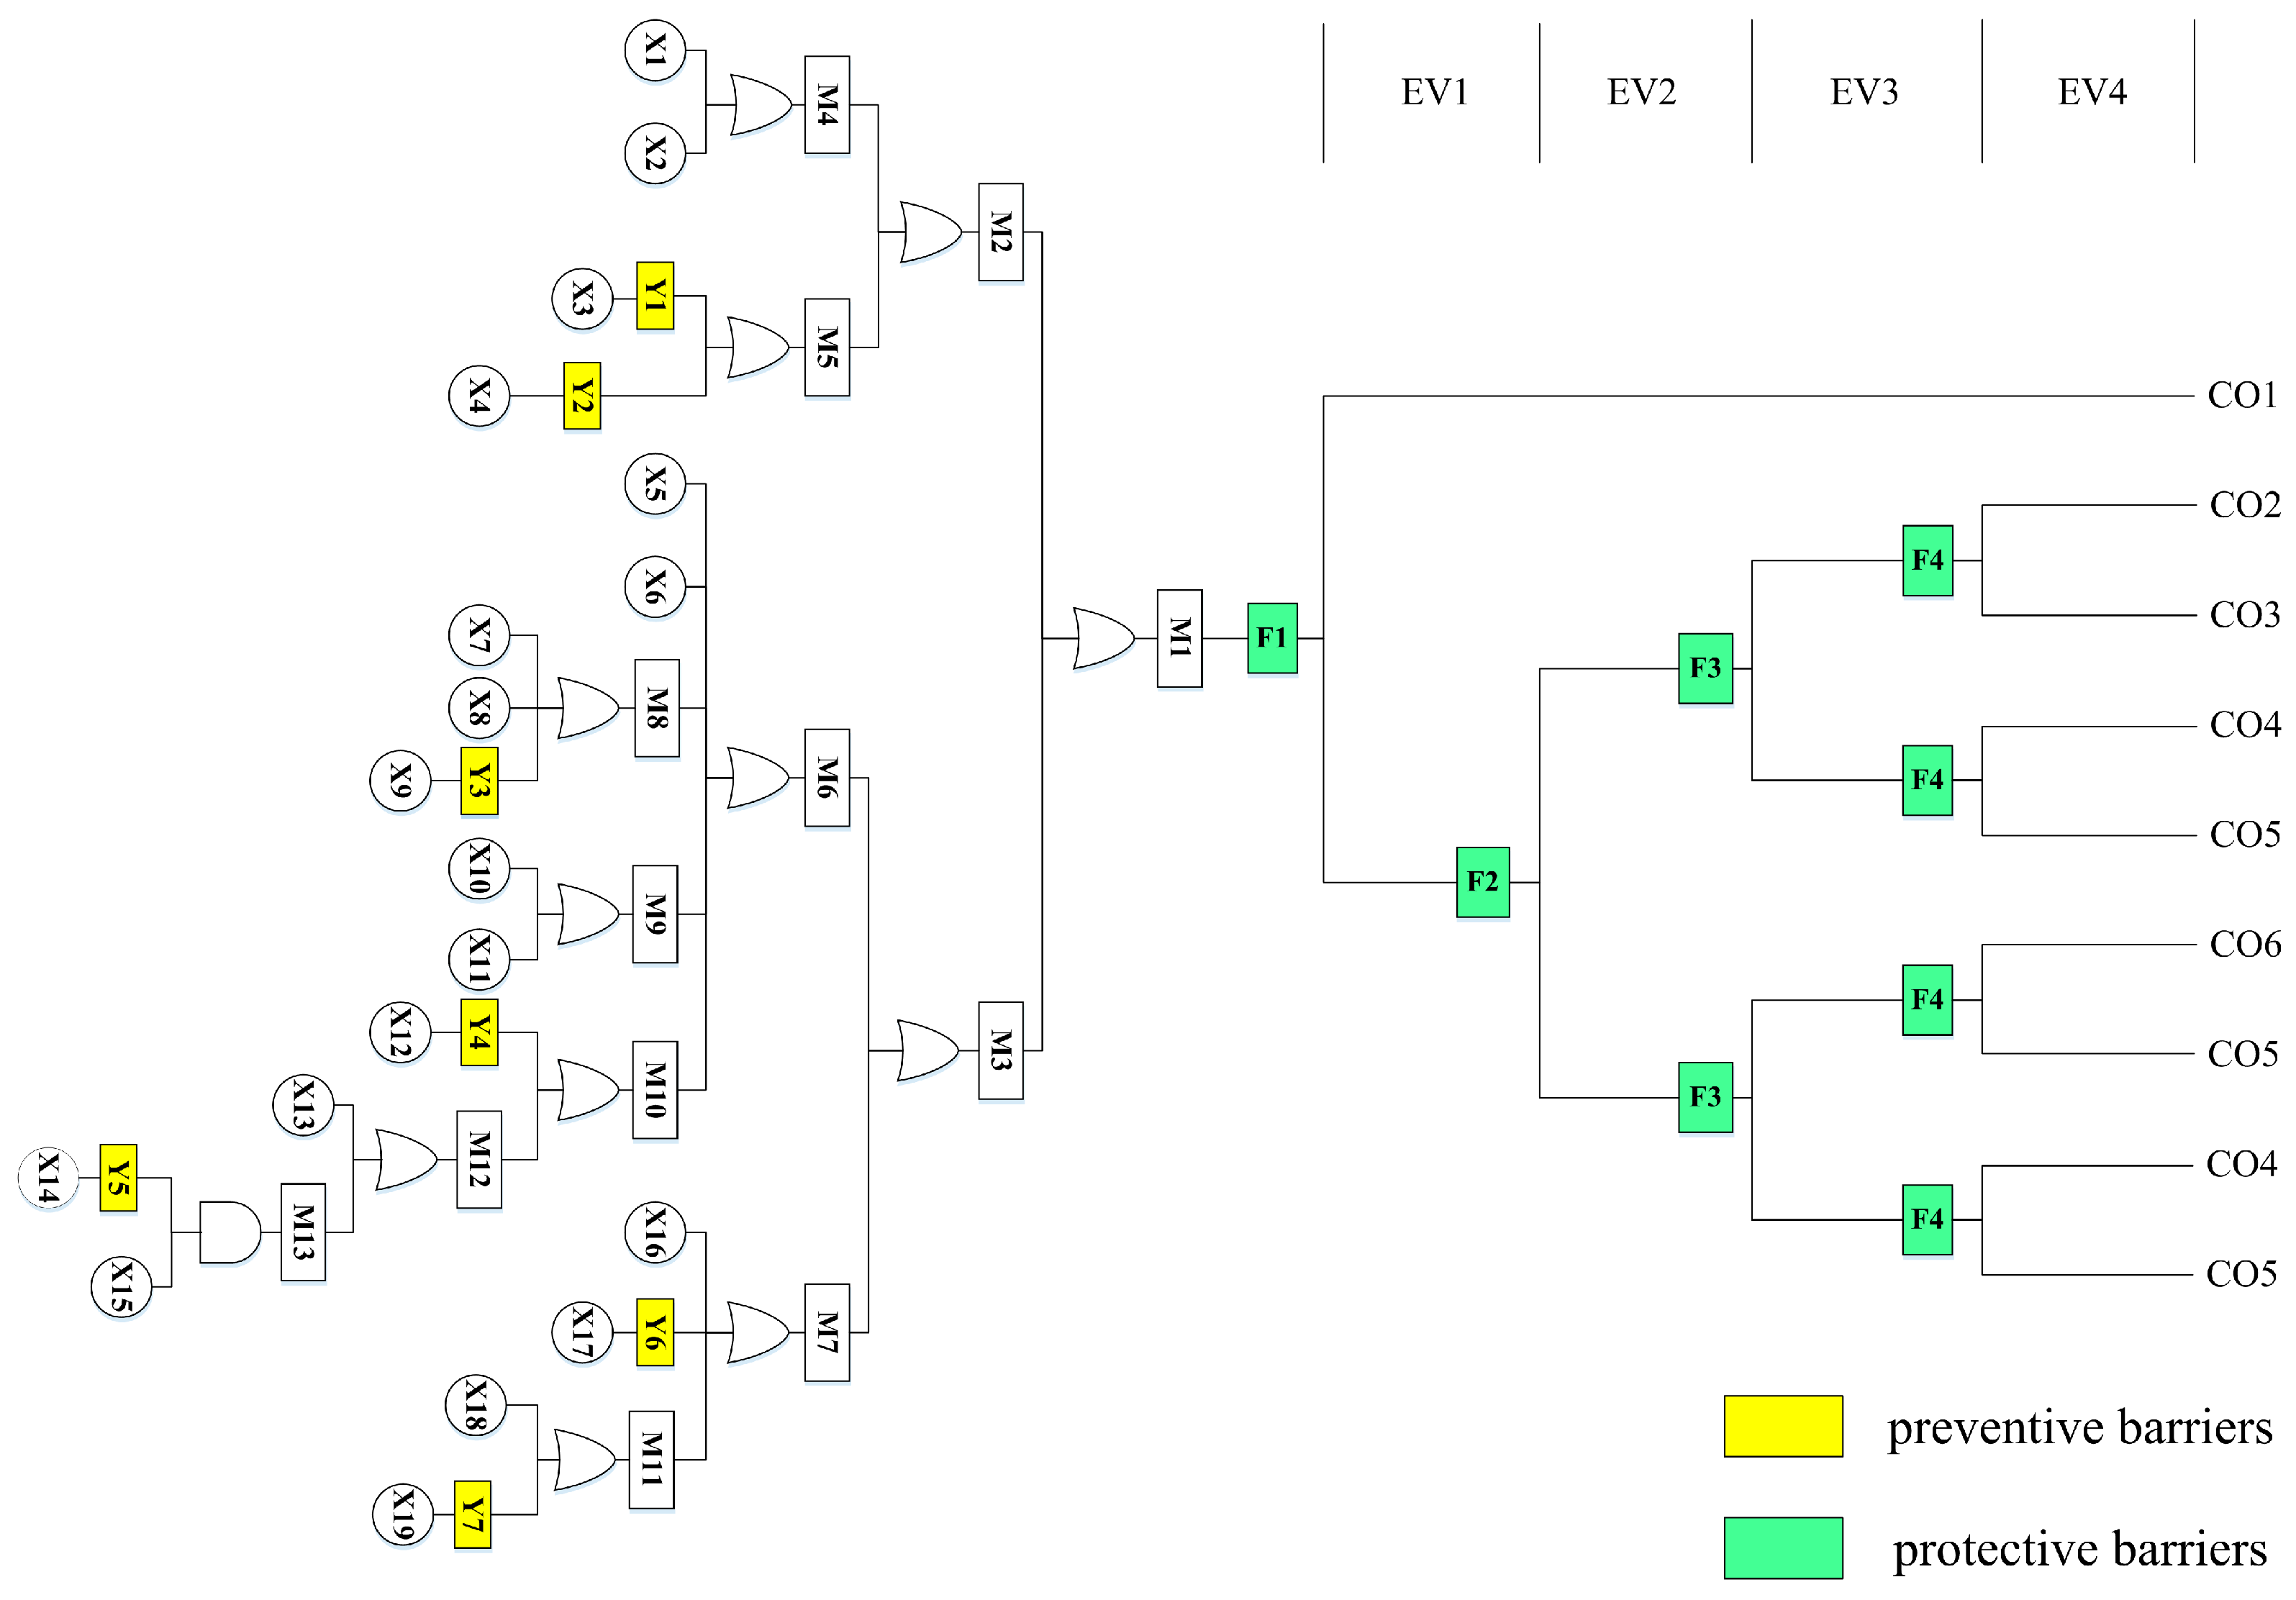
Natural gas is a highly flammable gas, so in the case of an ignition source, any large amount of natural gas leakage may lead to fire and explosion; in other words, the leakage of the natural gas in the storage tank is the direct cause and key link to serious safety accidents. Therefore, natural gas leakage was set as the critical event in the BT model. Through a field survey, it was found that fire, explosion, personnel suffocation, and safe dispersion were the main failure outcomes caused by natural gas leakage. Furthermore, thermal radiation and shock waves generated by fire and explosion can cause serious damage to equipment and personnel, and the high concentration of natural gas can lead to oxygen deprivation leading to personnel suffocation, while gas dispersion cannot cause harm to personnel but can cause gas loss. Based on this, the BT model of the natural gas storage tank with SBs was established, as shown in Figure 5 and Table 6. This model had seven preventive SBs and four protective SBs, as shown in Table 7. Y1–Y7 were designated as the preventive SBs, mainly involving personnel training, daily inspection, and equipment maintenance, while F1–F4 were considered the protective SBs, mainly involving a series of protective measures after natural gas leakage.
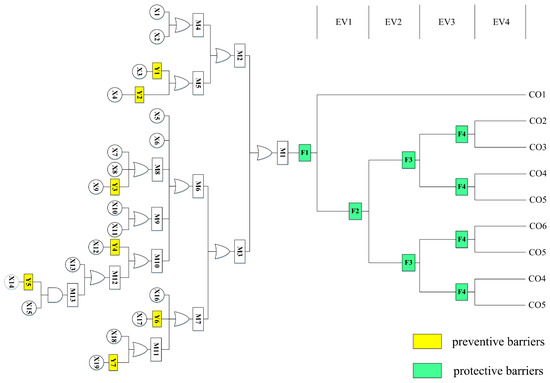
Figure 5.
Bow-tie model of the natural gas storage tank considering safety barriers.
Table 6.
The description of the events in the fault tree of the natural gas storage tank.
Table 7.
The description of safety barriers of the natural gas storage tank.
4.3. Expert Group Formation
In this case study, a decision-making group of three experts from enterprises and universities was established. The weights of the three experts were determined according to the scoring method shown in Table 2. The information and corresponding weights of the experts are shown in Table 8.
Table 8.
Experts’ information and their weights.
4.4. System Failure Probability Analysis
4.4.1. Determination of the Possibilities of Basic Events
The experts’ opinions on the possibilities of basic events in the FT were obtained (see Table 9) and then converted into the corresponding IVIFNs (see Table 10) according to Table 3. Subsequently, these IVIFNs were aggregated and defuzzified into crisp values using Equations (15) and (17).
Table 9.
Experts’ linguistic judgments for the possibilities of basic events.
Table 10.
The IVIFNs and the aggregation values for the possibilities of basic events.
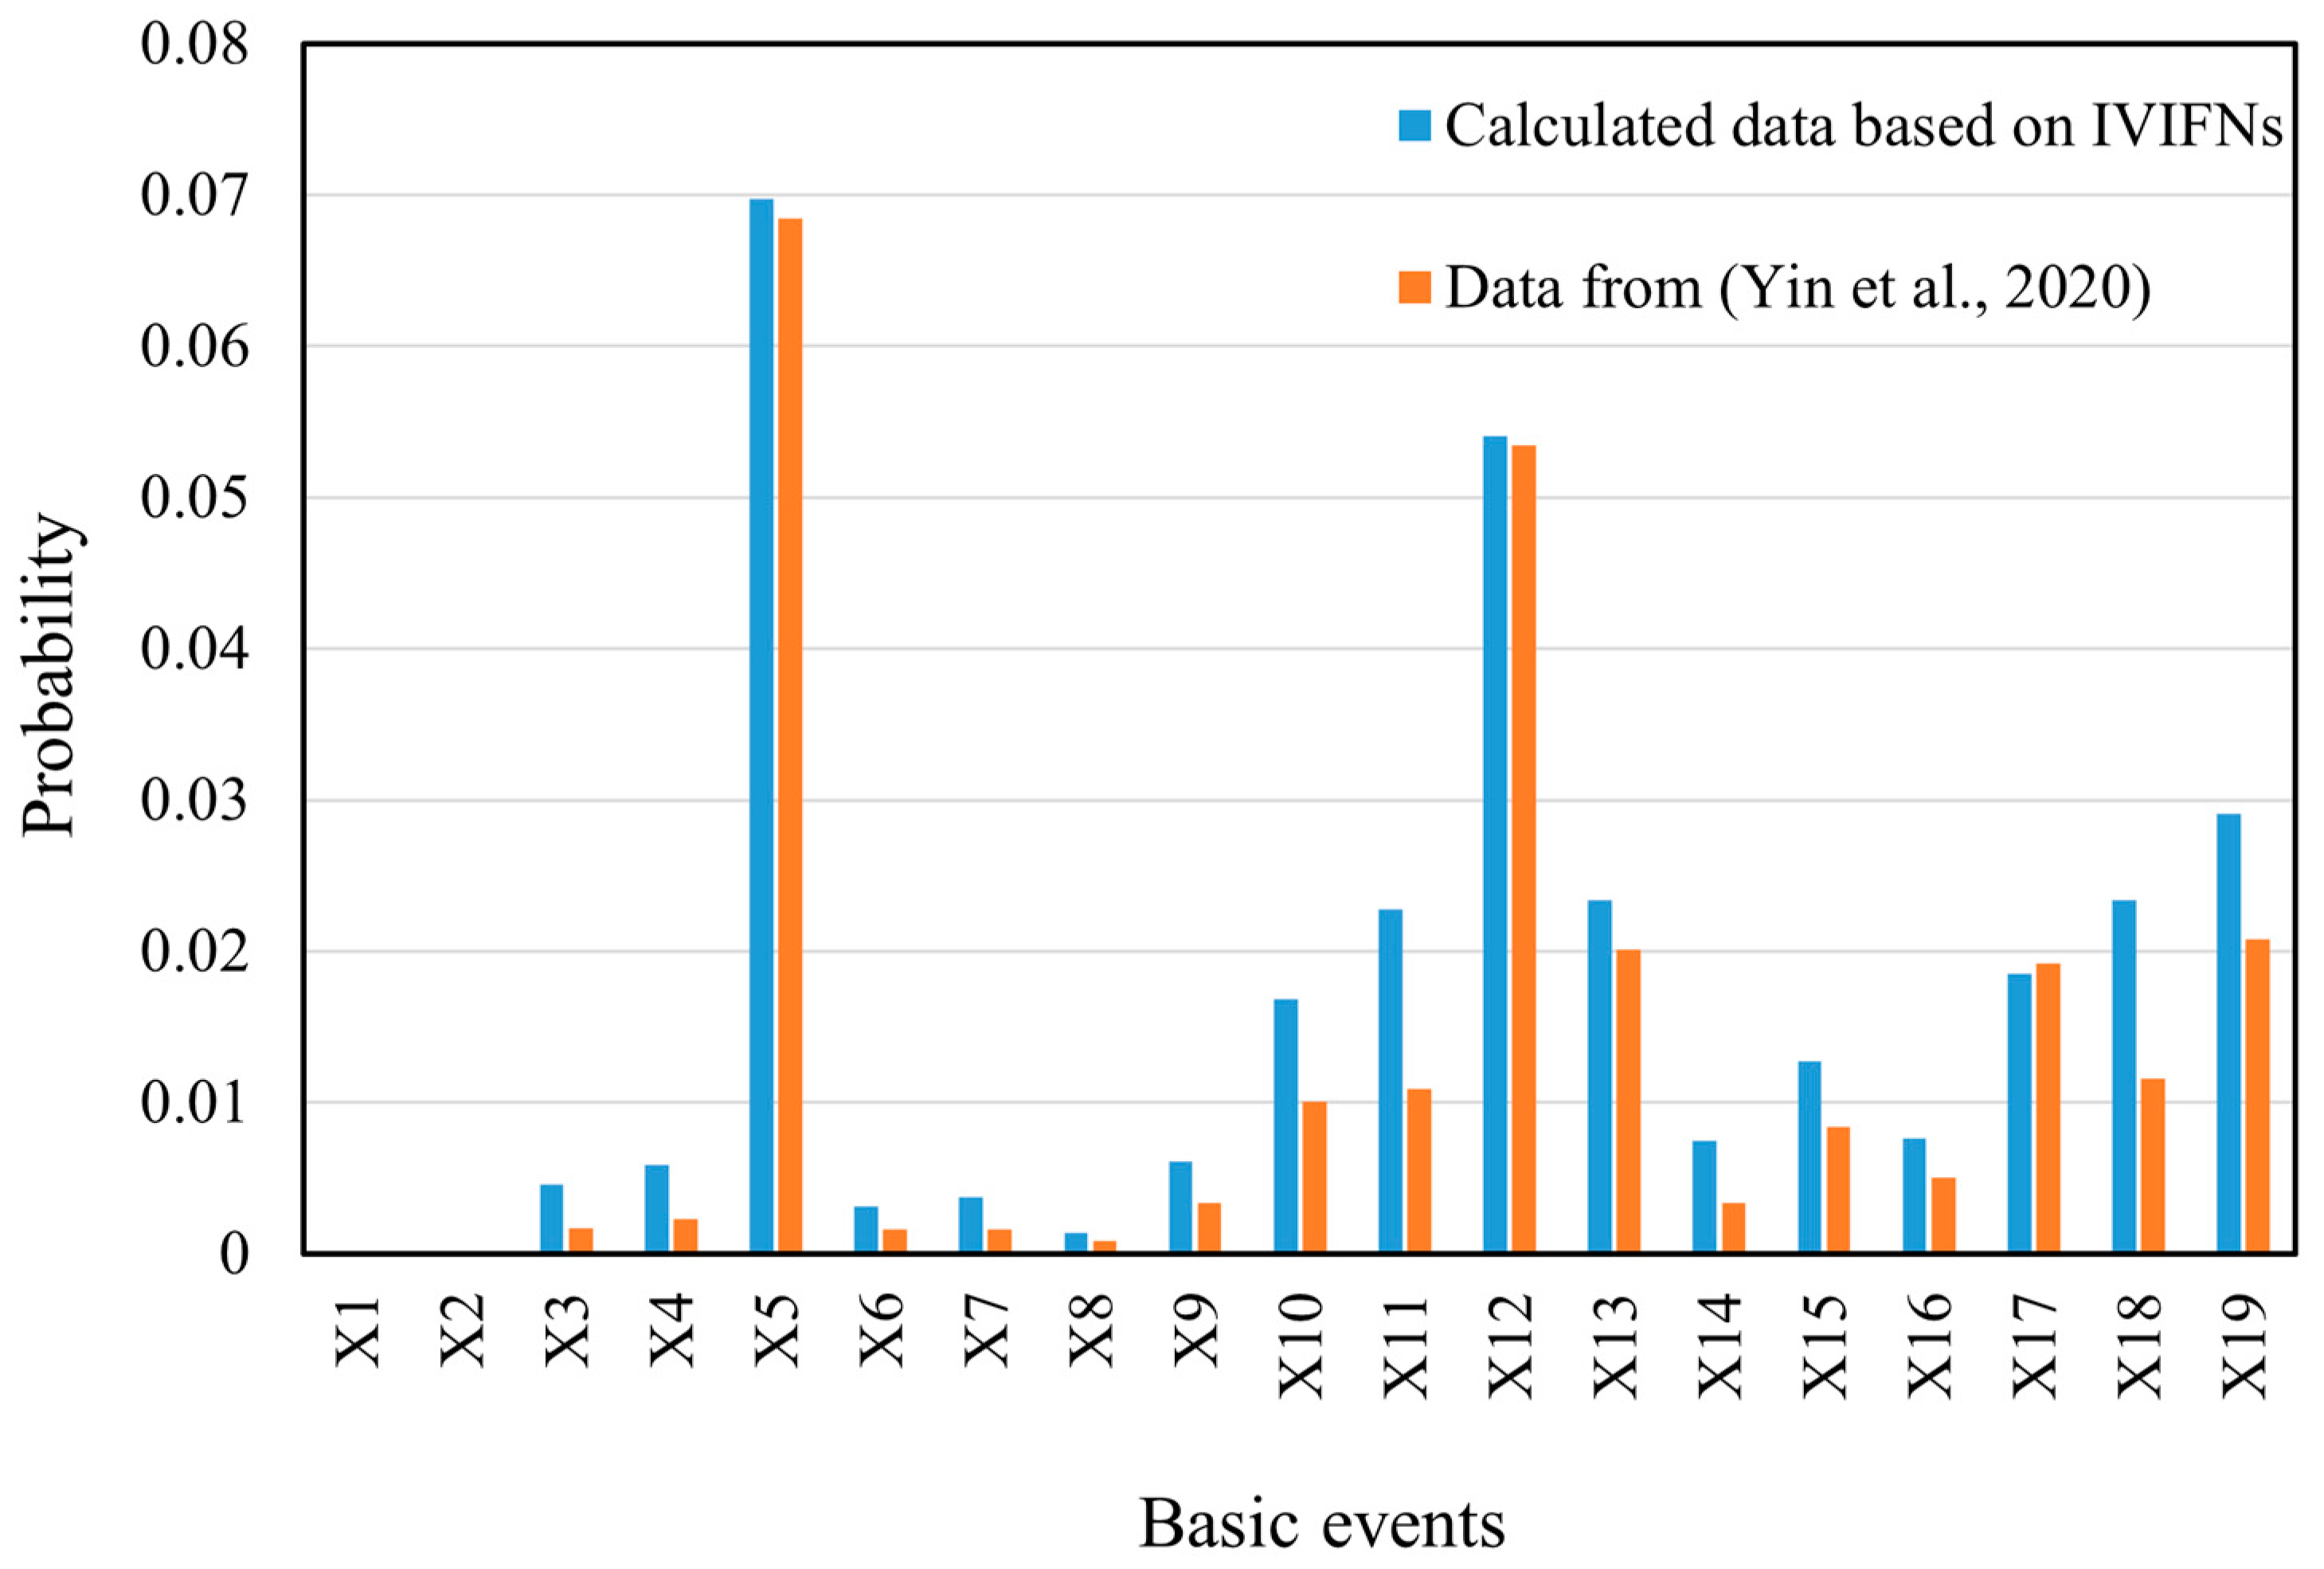
In order to verify the accuracy of the proposed model in calculating the probability of an event, the probability data obtained by IVIFNs were compared with the data from the literature [52], and the results are shown in Figure 6. It can be seen from the figure that the variability between the two sourcing data is small, which indicates that the proposed method for obtaining the probabilities of the basic events is feasible.
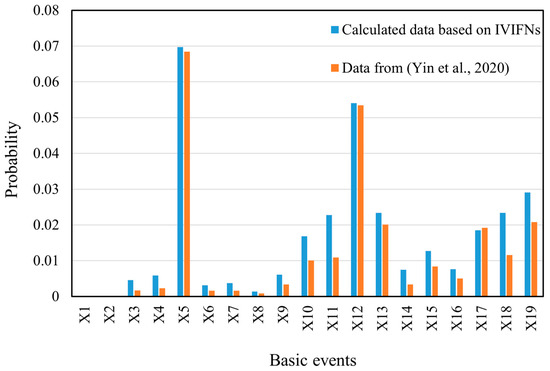
Figure 6.
Comparison of the probabilities of the basic events in the BT model converted from IVIFNs with those from the literature [52].
4.4.2. Computation of the Probability of the Critical Event with/without Preventive Safety Barriers
Using Equations (21) and (22), the calculation formulas of the occurrence probability of the critical event with/without the SBs can be written as Equations (38)–(50), and the calculation results are shown in Figure 7.
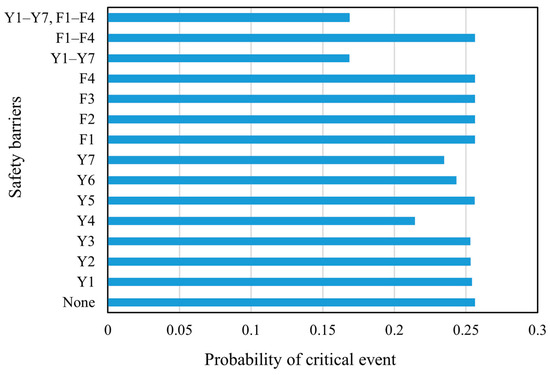
Figure 7.
The probability of the critical event under different safety barriers.
4.5. System Failure Consequence Analysis
4.5.1. Determination of the Type of Failure Consequence and Their Weights
Based on the literature, experts’ opinions, and field survey, the consequences of the natural gas storage tank failure were divided into four categories: production interruption loss (C1), safety/health effect (C2), environment/ecological effect (C3), and equipment maintenance cost (C4) [53]. The weights of these four consequence types were first determined using the IVIF-AHP mentioned in Section 3.3.1. Specifically, the experts provide the relative importance of the consequence types in pairs in the form of linguistic terms (see Table 11, Table 12 and Table 13), and then these opinions are converted into the corresponding IVIFNs (see Table 14, Table 15 and Table 16). Through aggregation, the IVIFN for each consequence severity type was obtained. The results underwent a consistency test () to ensure that the expert’s opinions were reasonable. Finally, the weight of the consequence severity type was obtained using Equations (26) and (27).
Table 11.
Criterion AHP data from Expert No.1.
Table 12.
Criterion AHP data from Expert No.2.
Table 13.
Criterion AHP data from Expert No.3.
Table 14.
IVIFNs of comparison judgment matrix for criteria from Expert No.1.
Table 15.
IVIFNs of comparison judgment matrix for criteria from Expert No.2.
Table 16.
IVIFNs of comparison judgment matrix for criteria from Expert No.3.
4.5.2. Determination of the Severity Index of Each Failure Outcome
According to the BT model, the potential failure outcomes of the natural gas storage tank were injection fire (CO1), vapor cloud explosion (CO2), poisoning (CO3), flash fire (CO4), natural gas dispersion (CO5), and deflagration (CO6). Table 17 shows the effect of each failure outcome on the different consequence severity types collected from the experts. The linguistic terms were converted into IVIFNs according to Table 3. Then, the severity index of each failure outcome expressed as IVIFN was calculated using Equations (28)–(30), and the results are shown in Table 18. After defuzzification and normalization, the severity indexes of the failure outcomes were obtained.
Table 17.
Experts’ linguistic judgments on the effect of each failure outcome on different consequence severity types.
Table 18.
The severity indexes of different failure outcomes.
4.5.3. Determination of the Possibilities of Conditioning Events with/without Safety Barriers
As shown in Table 19, the experts’ opinions on the possibilities of conditioning events in the ET were obtained. Then, they were converted into the corresponding IVIFNs (see Table 20) according to Table 3. Subsequently, these IVIFNs were aggregated and defuzzified into crisp values using Equations (15) and (17).
Table 19.
Experts’ linguistic opinions on the possibility of conditioning events in ET.
Table 20.
The IVIFNs and aggregation values for the possibility of conditioning events.
4.5.4. Computation of the Failure Consequence Severity with/without Safety Barriers
Using Equation (32), the detailed Formulas (53)–(58) for calculating the probability of each failure outcome were obtained. Using these formulas and Equation (33), the failure consequence severity with/without the SBs of the storage tank was calculated, and the calculation results are shown in Figure 8. As can be seen in Figure 7, the probability of critical events only decreases when preventive SBs are set. As shown in Figure 8, the failure consequence severity is reduced only when protective SBs are used. Thus, it is obvious that preventive SBs only have an effect on the probability of critical event occurrence, while protective SBs only affect the failure consequence severity.
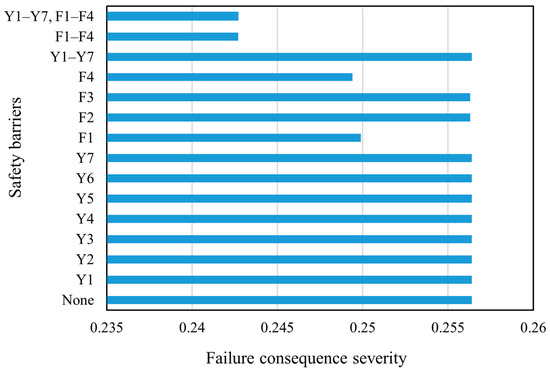
Figure 8.
The failure consequence severity under different safety barrier scenarios.
4.6. Computation of the Failure Risk and Effectiveness with/without Safety Barriers
When the failure probability of the critical event and the failure consequence severity with/without SBs were obtained, the RIs with/without SBs and the EffSBs of the SBs could be obtained using Equations (35)–(37). The results are shown in Figure 9 and Figure 10. It can be seen in Figure 9 that when SBs are set up, the risk index of the storage tank is significantly reduced. Figure 10 illustrates that different SBs have different effectiveness indexes. When all SBs work at the same time, the failure risk of the storage tank is the lowest and the effectiveness of SBs is the highest.

Figure 9.
Risk indexes of the natural gas storage tank under different safety barrier scenarios.
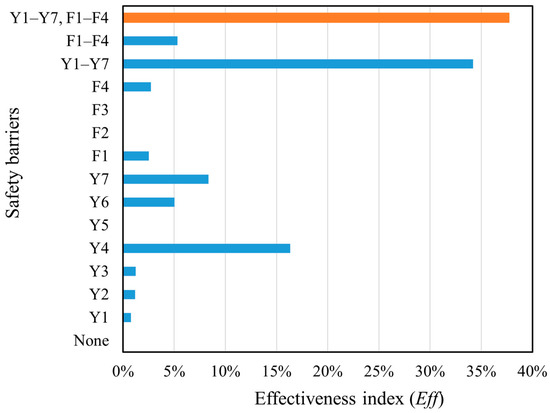
Figure 10.
Effectiveness indexes of different safety barriers.
4.7. Results and Discussion
As shown in Figure 9 and Figure 10, both the preventive and protective SBs can reduce the failure risk of the storage tank to a certain extent. In particular, Y4 (the regular detection of deformation or damage in the storage tank), Y7 (the installation and regular maintenance of safety electrical equipment), Y6 (the regular maintenance of safety alarm system equipment), F1 (fire source detection and alarm devices), and F4 (fire alarm and extinguishing systems) have high EffSB. This is because Y4, Y7, and Y6 are parts of the regular inspection and maintenance of key equipment, which play an important role in identifying gas leakage sources and can stop the incidents in their initial stages. F1 and F4 are responsible for monitoring sources of ignition and extinguishing fires, respectively, playing an obvious role in curbing fire, explosion, and other events with very high consequence severity.
Y1 (personnel operation and safety training), Y2 (using a checklist to establish complete and strict specifications and requirements for daily inspection work), Y3 (the regular detection of tank subsidence height and ground soil condition), and Y5 (the regular detection of the complete length of the surface coating) have low EffSB. The reason is that Y1 and Y2 involve personnel operation, which has a high degree of uncertainty, and these two SBs can only limit third-party damage. Furthermore, Y3 mainly controls tank subsidence, having little influence on leakage. Y5 mainly limits external corrosion, which is not prominent for tanks in the dry western region of China. The protective SBs of F2 (storage tank pressure detection) and F3 (gas concentration detection instrument) also have relatively low EffSB. This is because the F2 and F3 can only detect leakage but not locate it, and they have limited effect on mitigating the hazard of consequences on their own. As a result, they must cooperate with other protective measures to reduce the consequence severity effectively.
By comparing the corresponding RI and EffSB of Y1–Y7 (the combination of the preventive SBs) and F1–F4 (the combination of the protective SBs) in Figure 9 and Figure 10, it can be inferred that Y1–Y7 are more effective than F1–F4. Therefore, when configuring SBs, it is not advisable to rely solely on protective SBs to reduce tank risks. Instead, a thorough analysis of the causes of the critical event should be carried out to ensure that preventive SBs are set up correctly to control most risks before critical events occur.
Although some barriers have a significant effect when acting alone, most barriers have a low effect. When multiple barriers work together, the risk reduction for storage tanks is very significant. In particular, the risk reduction for storage tanks is most pronounced when all SBs are present, with an EffSB of 37.7%. The reason for this is that a single SB may only limit the probability of a single failure path, but there are often multiple failure paths for a complex system. Therefore, only when multiple SBs are in play can the risk of the system be effectively reduced and the safe operation of the storage tank be guaranteed.
Furthermore, all the SBs considered in this system were freely combined, and the effectiveness index of each combination was analyzed. The results are shown in Figure 11. Here, n is the number of SBs considered. The orange markers and labels indicate the combination of SBs with the highest effectiveness index for each combination number scenario as well as the specific effectiveness index value. It can be inferred that the EffSB gradually increases as the number of SBs increases. Moreover, by comparing different combinations in (j), it can also be deduced that with the increase in the number of combinations, the growth rate of the effectiveness index of the best SB combination decreases. It is worth noting that when the combination includes preventive SBs Y4, Y6, and Y7, as well as protective SBs F1 and F4, EffSB increases significantly. If and only if these SBs are included, the EffSB reaches 34.3%, accounting for 91% of the highest EffSB. This indicates that these five SBs play an important role in the safe operation of the storage tank. These findings provide a reference for decision-makers. For the sake of safety, when all SBs cannot be realized in actual production, at least these five SBs should be included in the system, as they are essential.
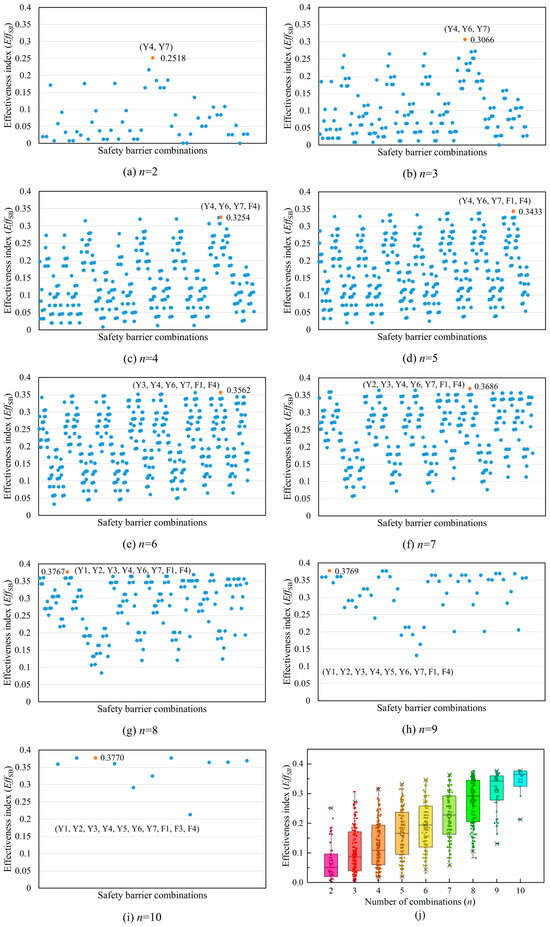
Figure 11.
The effectiveness index of an arbitrary combination of the eleven safety barriers of the natural gas storage tank. The combination mode is denoted as , where n represents the number of SBs included. (j) Box-plot of the effectiveness index for nine combination modes.
Through the above analysis, it is revealed that the storage tank failure risk can be greatly controlled and mitigated in the two stages of system maintenance detection and operation. Therefore, regular inspection and maintenance plans can be formulated to ensure the normal operation and effectiveness of the storage tank system. On the one hand, in the routine maintenance of the storage tank, the monitoring of potential risks and accidents should be strengthened, which needs to focus on checking and maintaining the deformation of the storage tank, safety electrical equipment, and the integrity of the alarm system equipment. On the other hand, it is necessary to formulate a perfect fire emergency mechanism, conduct regular simulation exercises, and strengthen the emergency response ability of fire alarms and fire suppression systems. Combining the analysis results with the design, maintenance, and operational strategies of the system can effectively improve the safety of tank systems, reduce potential accident risks, and protect people and the environment.
5. Conclusions
Assessing the effectiveness of safety barriers (SBs) holds significance in guiding their configuration and subsequently reducing the failure risks within process systems. In this study, we proposed an integrated method to evaluate the effectiveness of SBs in process systems. This method incorporated IVIFNs into the BT model. Due to the limited data availability concerning safety barriers in practical processes, this method addresses the challenge of obtaining fundamental probability data by employing expert elicitation. Furthermore, it manages uncertainties in opinions by utilizing IVIFNs. The effectiveness of safety barriers is measured by comparing the relative change in failure risk due to the addition of the barrier.
The method was applied to analyze the SBs of a natural gas storage tank. The results show that multiple SBs are more effective than a single SB, and preventive SBs have a greater effect on system risks than protective SBs. Therefore, preventive SBs should be prioritized in order to avoid a critical event. However, as it is not possible to fully control all sources of hazards, it is desirable to also have protective SBs to control and mitigate the effects of failure consequences. The combinational analysis of SBs can also provide a comprehensive understanding of the effectiveness of each SB so that the most appropriate combination of SBs can be found to meet the requirements of safe production and cost control.
The accuracy of this method still depends on the model structure and the probabilities of bottom events, which means that the selection of experts and the supplementation of data are very important. Therefore, it is necessary to consider experts’ professional background and practical experience comprehensively, giving as comprehensive information as possible to eliminate the influence of expert bias when determining the expert group. A panel of three experts was used in this study, who met the criteria for professionalism and diversity, but consulting more experts can make the model results more objective and reliable. In fact, expert elicitation is used to solve the challenge of lacking accurate and reliable objective data, and IVIFNs in further analysis are used in this method to reduce the bias and uncertainty of experts’ opinions. Moreover, if objective data exist for some events of the BT model, direct assignment can make the evaluation more reliable. Therefore, in future studies, we plan to propose more effective methods to mitigate the influence of expert biases and to obtain objective actual data as comprehensively as possible to replace experts’ opinions.
Due to the feasibility of the IVIFN-BT method, it can be extended to other process industry scenarios where SBs are required, and actual data are difficult to obtain. It can also provide support for safety management and risk assessment in other process industry environments.
In addition, in the current work, the SB effectiveness analysis based on the BT model is static. However, in practice, safety barriers evolve over time. Therefore, future research should further consider the changes in safety barrier functions during the evolution of an event, so as to conduct a more comprehensive assessment in the process industry.
Author Contributions
Conceptualization, J.L.; methodology, J.L.; software, H.Y. and X.G.; validation, H.Y.; formal analysis, H.Y.; investigation, Y.Z. and X.L.; resources, X.L.; data curation, X.G.; writing—original draft preparation, J.L.; writing—review and editing, H.Y., Y.Z., X.L., Y.L., X.G. and W.W.; visualization, Y.Z.; supervision, W.W.; project administration, Y.L.; funding acquisition, X.L. and W.W. All authors have read and agreed to the published version of the manuscript.
Funding
This work was funded by the Natural Science Basic Research Program of Shaanxi Province of China (Program No. 2023-JC-YB-447), the Science and Technology Program of the State Administration for Market Regulation (2022MK200), and the Science and Technology Program of CSEI (2022key03).
Institutional Review Board Statement
Not applicable.
Informed Consent Statement
Not applicable.
Data Availability Statement
Dataset available on request from the authors.
Conflicts of Interest
The authors declare no conflict of interest.
References
- Reason, J.; Hollnagel, E.; Pariès, J. Revisiting the “Swiss Cheese” Model of Accidents. J. Clin. Eng. 2006, 27, 110–115. [Google Scholar]
- Duijm, N.J. Safety-Barrier Diagrams as a Safety Management Tool. Reliab. Eng. Syst. Saf. 2009, 94, 332–341. [Google Scholar] [CrossRef]
- Aven, T.; Sklet, S.; Vinnem, J.E. Barrier and Operational Risk Analysis of Hydrocarbon Releases (BORA-Release): Part I. Method Description. J. Hazard. Mater. 2006, 137, 681–691. [Google Scholar] [CrossRef]
- Center of Chemical Process Safety. Layer of Protection Analysis: Simplified Process Risk Assessment; Center of Chemical Process Safety: New York, NY, USA, 2010. [Google Scholar]
- Center of Chemical Process Safety. Guidelines for Chemical Process Quantitative Risk Analysis; Center of Chemical Process Safety: New York, NY, USA, 2000. [Google Scholar]
- Leveson, N.G.; Stolzy, J.L. Safety Analysis Using Petri Nets. IEEE Trans. Softw. Eng. 1987, SE-13, 386–397. [Google Scholar] [CrossRef]
- Pearl, J. Probabilistic Reasoning in Intelligent Systems: Networks of Plausible Inference; Morgan Kaufmann: San Francisco, CA, USA, 1988. [Google Scholar]
- de Dianous, V.; Fiévez, C. ARAMIS Project: A More Explicit Demonstration of Risk Control through the Use of Bow–Tie Diagrams and the Evaluation of Safety Barrier Performance. J. Hazard. Mater. 2006, 130, 220–233. [Google Scholar] [CrossRef]
- Yazdi, M.; Kabir, S.; Walker, M. Uncertainty Handling in Fault Tree Based Risk Assessment: State of the Art and Future Perspectives. Process Saf. Environ. Prot. 2019, 131, 89–104. [Google Scholar] [CrossRef]
- Ferdous, R.; Khan, F.; Sadiq, R.; Amyotte, P.; Veitch, B. Analyzing System Safety and Risks under Uncertainty Using a Bow-Tie Diagram: An Innovative Approach. Process Saf. Environ. Prot. 2013, 91, 1–18. [Google Scholar] [CrossRef]
- Aqlan, F.; Mustafa Ali, E. Integrating Lean Principles and Fuzzy Bow-Tie Analysis for Risk Assessment in Chemical Industry. J. Loss Prev. Process Ind. 2014, 29, 39–48. [Google Scholar] [CrossRef]
- Wang, D.; Liang, P.; Yu, Y.; Fu, X.; Hu, L. An Integrated Methodology for Assessing Accident Probability of Natural Gas Distribution Station with Data Uncertainty. J. Loss Prev. Process Ind. 2019, 62, 103941. [Google Scholar] [CrossRef]
- Yazdi, M.; Hafezi, P.; Abbassi, R. A Methodology for Enhancing the Reliability of Expert System Applications in Probabilistic Risk Assessment. J. Loss Prev. Process Ind. 2019, 58, 51–59. [Google Scholar] [CrossRef]
- Arici, S.S.; Akyuz, E.; Arslan, O. Application of Fuzzy Bow-Tie Risk Analysis to Maritime Transportation: The Case of Ship Collision during the STS Operation. Ocean Eng. 2020, 217, 107960. [Google Scholar] [CrossRef]
- Das, S.; Garg, A.; Maiti, J.; Krishna, O.B.; Thakkar, J.J.; Gangwar, R.K. A Comprehensive Methodology for Quantification of Bow-Tie under Type II Fuzzy Data. Appl. Soft Comput. 2021, 103, 107148. [Google Scholar] [CrossRef]
- Elidolu, G.; Akyuz, E.; Arslan, O.; Arslanoğlu, Y. Quantitative Failure Analysis for Static Electricity-Related Explosion and Fire Accidents on Tanker Vessels under Fuzzy Bow-Tie CREAM Approach. Eng. Fail. Anal. 2022, 131, 105917. [Google Scholar] [CrossRef]
- Atanassov, K.T. Intuitionistic Fuzzy Sets. Fuzzy Sets Syst. 1986, 20, 87–96. [Google Scholar] [CrossRef]
- Liu, P.; Yang, L.; Gao, Z.; Li, S.; Gao, Y. Fault Tree Analysis Combined with Quantitative Analysis for High-Speed Railway Accidents. Saf. Sci. 2015, 79, 344–357. [Google Scholar] [CrossRef]
- Guo, J. A Risk Assessment Approach for Failure Mode and Effects Analysis Based on Intuitionistic Fuzzy Sets and Evidence Theory. J. Intell. Fuzzy Syst. 2016, 30, 869–881. [Google Scholar] [CrossRef]
- Yazdi, M. Risk Assessment Based on Novel Intuitionistic Fuzzy-Hybrid-Modified TOPSIS Approach. Saf. Sci. 2018, 110, 438–448. [Google Scholar] [CrossRef]
- Yazdi, M.; Nedjati, A.; Abbassi, R. Fuzzy Dynamic Risk-Based Maintenance Investment Optimization for Offshore Process Facilities. J. Loss Prev. Process Ind. 2019, 57, 194–207. [Google Scholar] [CrossRef]
- Viegas, R.A.; da Silva Mota, F.D.A.; Costa, A.P.C.S.; dos Santos, F.F.P. A Multi-Criteria-Based Hazard and Operability Analysis for Process Safety. Process Saf. Environ. Prot. 2020, 144, 310–321. [Google Scholar] [CrossRef]
- Kaushik, M.; Kumar, M. An Integrated Approach of Intuitionistic Fuzzy Fault Tree and Bayesian Network Analysis Applicable to Risk Analysis of Ship Mooring Operations. Ocean Eng. 2023, 269, 113411. [Google Scholar] [CrossRef]
- Wang, L.-E.; Liu, H.-C.; Quan, M.-Y. Evaluating the Risk of Failure Modes with a Hybrid MCDM Model under Interval-Valued Intuitionistic Fuzzy Environments. Comput. Ind. Eng. 2016, 102, 175–185. [Google Scholar] [CrossRef]
- Liu, H.-C.; You, J.-X.; Duan, C.-Y. An Integrated Approach for Failure Mode and Effect Analysis under Interval-Valued Intuitionistic Fuzzy Environment. Int. J. Prod. Econ. 2019, 207, 163–172. [Google Scholar] [CrossRef]
- Huang, G.; Xiao, L.; Zhang, G. Improved Failure Mode and Effect Analysis with Interval-Valued Intuitionistic Fuzzy Rough Number Theory. Eng. Appl. Artif. Intell. 2020, 95, 103856. [Google Scholar] [CrossRef]
- Huang, G.; Xiao, L. Failure Mode and Effect Analysis: An Interval-Valued Intuitionistic Fuzzy Cloud Theory-Based Method. Appl. Soft Comput. 2021, 98, 106834. [Google Scholar] [CrossRef]
- Sklet, S. Safety Barriers: Definition, Classification, and Performance. J. Loss Prev. Process Ind. 2006, 19, 494–506. [Google Scholar] [CrossRef]
- International Organization for Standardization. Petroleum and Natural Gas Industries Offshore Production Installations Major Accident Hazard Management during the Design of New Installations; International Organization for Standardization: Geneva, Switzerland, 2016. [Google Scholar]
- Landucci, G.; Argenti, F.; Spadoni, G.; Cozzani, V. Domino Effect Frequency Assessment: The Role of Safety Barriers. J. Loss Prev. Process Ind. 2016, 44, 706–717. [Google Scholar] [CrossRef]
- Guldenmund, F.; Hale, A.R.; Goossens, L.H.J.; Betten, J.; Duijm, N.J. The Development of an Audit Technique to Assess the Quality of Safety Barrier Management. J. Hazard. Mater. 2006, 130, 234–241. [Google Scholar] [CrossRef]
- Holland, P. Chapter Three—Blowout Barriers and Analyses. In Offshore Blowouts; Holland, P., Ed.; Gulf Professional Publishing: Burlington, NJ, USA, 1997; pp. 17–32. [Google Scholar]
- Petroleum Safety Authority. Guidelines to Regulations Relating to Management in the Petroleum Activities (The Management Regulations); Petroleum Safety Authority: Stavanger, Norway, 2002.
- Hollnagel, E. Barriers and Accident Prevention; Routledge: London, UK, 2004. [Google Scholar]
- Kang, J.; Zhang, J.; Gao, J. Analysis of the Safety Barrier Function: Accidents Caused by the Failure of Safety Barriers and Quantitative Evaluation of Their Performance. J. Loss Prev. Process Ind. 2016, 43, 361–371. [Google Scholar] [CrossRef]
- Lauridsen, O.; Lootz, E.; Husebo, T.; Ersdal, G. Barrier Management and the Interaction between Technical, Operational and Organisational Barrier Elements; SPE: Stavanger, Norway, 2016; p. D011S010R001. [Google Scholar]
- Khakzad, N.; Landucci, G.; Reniers, G. Application of Graph Theory to Cost-Effective Fire Protection of Chemical Plants during Domino Effects: Cost-Effective Fire Protection of Chemical Plants. Risk Anal. 2017, 37, 1652–1667. [Google Scholar] [CrossRef]
- Delvosalle, C.; Fievez, C.; Pipart, A.; Debray, B. ARAMIS Project: A Comprehensive Methodology for the Identification of Reference Accident Scenarios in Process Industries. J. Hazard. Mater. 2006, 130, 200–219. [Google Scholar] [CrossRef]
- Zadeh, L.A. Fuzzy Sets. Inf. Control 1965, 8, 338–353. [Google Scholar] [CrossRef]
- Li, D.-F. Extension Principles for Interval-Valued Intuitionistic Fuzzy Sets and Algebraic Operations. Fuzzy Optim. Decis. Mak. 2011, 10, 45–58. [Google Scholar] [CrossRef]
- Xu, Z.; Cai, X. Intuitionistic Fuzzy Information Aggregation; Springer: Berlin/Heidelberg, Germany, 2012. [Google Scholar]
- Oztaysi, B.; Onar, S.C.; Goztepe, K.; Kahraman, C. Evaluation of Research Proposals for Grant Funding Using Interval-Valued Intuitionistic Fuzzy Sets. Soft Comput. 2017, 21, 1203–1218. [Google Scholar] [CrossRef]
- Roy, J.; Das, S.; Kar, S.; Pamučar, D. An Extension of the CODAS Approach Using Interval-Valued Intuitionistic Fuzzy Set for Sustainable Material Selection in Construction Projects with Incomplete Weight Information. Symmetry 2019, 11, 393. [Google Scholar] [CrossRef]
- Karaşan, A.; Kahraman, C. A Novel Intuitionistic Fuzzy DEMATEL—ANP—TOPSIS Integrated Methodology for Freight Village Location Selection. J. Intell. Fuzzy Syst. 2019, 36, 1335–1352. [Google Scholar] [CrossRef]
- Bellamy, L.J.; Ale, B.J.M.; Geyer, T.A.W.; Goossens, L.H.J.; Hale, A.R.; Oh, J.; Mud, M.; Bloemhof, A.; Papazoglou, I.A.; Whiston, J.Y. Storybuilder—A Tool for the Analysis of Accident Reports. Reliab. Eng. Syst. Saf. 2007, 92, 735–744. [Google Scholar] [CrossRef]
- Onar, S.C.; Oztaysi, B.; Otay, İ.; Kahraman, C. Multi-Expert Wind Energy Technology Selection Using Interval-Valued Intuitionistic Fuzzy Sets. Energy 2015, 90, 274–285. [Google Scholar] [CrossRef]
- Onisawa, T. An Approach to Human Reliability in Man-Machine Systems Using Error Possibility. Fuzzy Sets Syst. 1988, 27, 87–103. [Google Scholar] [CrossRef]
- Abdullah, L.; Najib, L. A New Preference Scale Mcdm Method Based on Interval-Valued Intuitionistic Fuzzy Sets and the Analytic Hierarchy Process. Soft Comput. 2016, 20, 511–523. [Google Scholar] [CrossRef]
- Büyüközkan, G.; Feyzioğlu, O.; Havle, C.A. Intuitionistic Fuzzy AHP Based Strategic Analysis of Service Quality in Digital Hospitality Industry. IFAC Pap. 2019, 52, 1687–1692. [Google Scholar] [CrossRef]
- Saaty, T.L. A Scaling Method for Priorities in Hierarchical Structures. J. Math. Psychol. 1977, 15, 234–281. [Google Scholar] [CrossRef]
- Ye, J. Multicriteria Fuzzy Decision-Making Method Using Entropy Weights-Based Correlation Coefficients of Interval-Valued Intuitionistic Fuzzy Sets. Appl. Math. Model. 2010, 34, 3864–3870. [Google Scholar] [CrossRef]
- Yin, H.; Liu, C.; Wu, W.; Song, K.; Liu, D.; Dan, Y. Safety Assessment of Natural Gas Storage Tank Using Similarity Aggregation Method Based Fuzzy Fault Tree Analysis (SAM-FFTA) Approach. J. Loss Prev. Process Ind. 2020, 66, 104159. [Google Scholar] [CrossRef]
- Yin, H.; Liu, C.; Wu, W.; Song, K.; Dan, Y.; Cheng, G. An Integrated Framework for Criticality Evaluation of Oil & Gas Pipelines Based on Fuzzy Logic Inference and Machine Learning. J. Nat. Gas Sci. Eng. 2021, 96, 104264. [Google Scholar]

Disclaimer/Publisher’s Note: The statements, opinions and data contained in all publications are solely those of the individual author(s) and contributor(s) and not of MDPI and/or the editor(s). MDPI and/or the editor(s) disclaim responsibility for any injury to people or property resulting from any ideas, methods, instructions or products referred to in the content. |
© 2024 by the authors. Licensee MDPI, Basel, Switzerland. This article is an open access article distributed under the terms and conditions of the Creative Commons Attribution (CC BY) license (https://creativecommons.org/licenses/by/4.0/).