Article

Modelling Prefabricated Construction Safety

Department of Civil & Environmental Engineering, The University of Auckland, Auckland 1023, New Zealand
Current address: Ako Delivery—Region Four: Construction Services Team, College of Engineering, Construction and Living Sciences, Otago Polytechnic, Te Pūkenga, Dunedin 9054, New Zealand.
Appl. Sci. 2024, 14(4), 1629; https://doi.org/10.3390/app14041629
Submission received: 22 January 2024 / Revised: 7 February 2024 / Accepted: 8 February 2024 / Published: 18 February 2024

Abstract

:
Prefabricated construction is expanding and taking over traditional construction with more intervention of prefabricated building elements. Despite prefabricated construction reducing health and safety risks compared to conventional construction, there is still a risk that needs to be addressed. This article aims to investigate prefabricated construction safety through accident analysis. The accident data was retrieved through governmental resources and covered accident claims, safety costs, vulnerable occupations, and injuries (including type, cause, prior activity, and site of injury). Prefabricated construction safety is then simplistic and predictively modelled. The most common trend has been reported with graphical representation and relevant discussion. Furthermore, the trends are forecasted by using the ARIMA model (p, d, q) based on key performance parameters. The conclusion has been driven by the current status of prefabricated construction safety. This study is a pioneer in modelling prefabricated construction safety to enhance understanding of accidents and forecasting through optimization.

1. Introduction

Prefabricated construction (PC) potentially improves the safety performance of construction projects [1,2] by using several prefabricated building technologies for building elements from components, penalized to modular [3,4]. PC shifted the major work operations—i.e., manufacturing and assembly of building elements—from an onsite environment to an offsite controlled work environment, which reduced the potential safety hazards. However, there are still residual critical risks that remain [5], as safety risks still need to be quantified [6] for offsite construction. Interestingly, the safety situation in PC has not been investigated due to a lack of understanding regarding types of injuries, accidents, and operations in all stages of PC projects [7]. This is concerning, as the health and safety (H&S) regulation implementation in construction is relatively challenging in comparison to other sectors [8], primarily because of low worker participation [9]. Masood, Roy [10] reported that supply chain members in the New Zealand construction industry have varied understandings of PC definition, market share, innovation perspective, and role of prefabricated construction company (PCCs). Nevertheless, H&S is also an important area that need to be addressed for the smooth adoption of PC in New Zealand.
PCCs are supply organizations, also known as product-oriented, with structured vertically integrating design, manufacturing, and construction, presenting supply chains at several tiers to projects [11]. Masood, Lim [12] reported two performance challenges associated with PCCs covering safety aspects, in a New Zealand context. ‘On-site cranage constraints’ [13] are linked to H&S risks in lifting under the delivery domain and ‘inadequate offsite facility’ refers to the H&S issues in offsite facilities under the quality domain (i.e., factory), ranked 1st and 7th by the PCCs. Overall, H&S risks are at a high importance level from a PCC perspective. Relationships have been modelled for PCC based on performance dimensions [14]. There is a forward relation of ‘On-site cranage constraints’ with ‘increasing onsite engagement’ and ‘lack of resilience capacity’, also backwards with ‘competitive pricing’. This indicates that if there is more engagement in on-site operations, then there is the possibility of hazardous situations with extended exposures which need to be limited with integrated coordination. Nevertheless, the resilience of PCC lies in the management of delivery risk with transfer to logistics companies and onsite assembly subcontractors. PCC companies need to consider the delivery cost as a prime cost element that is shared with supply chain members. ‘Inadequate offsite facility’ has a forward relation with ‘huge capital investment’ and a backward relation with ‘skill shortage’. The prefabricated building technology defines the layout and investment requirements—for example, computer numerical control (CNC) machines for timber, and frame cut and bend machines for light gauge steel. Precast concrete is reliant on formwork and ready-mix concrete batching. Requirements and skills are different depending on PC technology. However, the lack of a skilled workforce for PC leads to potentially hazardous situations, which lead to critical accidents [15].
From an organizational perspective, addressing H&S in the workplace has the potential to improve the firm’s performance and productivity [16]. Similarly, this defines the maturity level in PCCs, portraying offsite workplaces [12]. Safety risks in PCC are unavoidable, and requires technological intervention and control [17]. A macroscopic view is needed to review the safety situation of the PC to identify the critical issues and assess the severity [18]. Hence, examining the safety records (or lagging indicators) in PC is the foremost step and is also essential to understanding the prefabricated construction safety (PCS) that potentially improves safety performance.
PCS is a serious concern with the increasing number of accidents, and unique trends [19], residual risks [20], and ambiguity in quantification [21] in comparison to associated industries such as construction and manufacturing. Nevertheless, PC is the amalgamation of these two industries. Managing PCS depends on how the PC is defined and classified; this requires macro-level investigation [18]. It is obvious that without clarity around working procedures, achieving safety is crucial. In comparison to onsite construction, PC is relatively safer [6], considering all supply chain operations away from projects. However, PCS is still critical due to the inherent diversification of the pure manufacturing process. Lu et al. [22] reported the safety-affected factors, classified for human errors, component failures, disordered management, and environmental disturbances. These were characterized as root, transmission, and direct. It was found that direct factors are dependent on root and transmission factors for PCS focusing on onsite operations. Song et al. [23] investigated the risks in PCS by developing a risk network to understand and relate the critical risks. Bayesian network simulation [24], the cloud model-entropy method [25], and AcciMap [26] were also used for PCS risk assessment. Ontology technology based on building information modelling was applied to PCS risk management for automatic risk identification and response [27]. Also, PCS is influenced by mental stressors categorized as industry-related, management, or organizational and personal [28]. Jeong et al. [29] analyzed the safety risk factors of PC to determine the accident trends. It seems that notable research was conducted in risk management of PCS.
Nonetheless, PCS research lacks empirical data to measure the safety performance of the companies involved in PC [21], as most studies focus on a qualitative approach. A multi-dimensional safety evaluation, based on lagging indicators such as accident records, is the initial step towards understanding and potential improvements in PCS [19]. PC improves safety on projects, which also depends on how well the PCC adopts H&S at offsite workplaces [30]. This means the current safety situation investigation through accident frequency is pivotal. This study is an attempt to explore the PCS for accident trends under elementary safety aspects. This helps us to understand the dynamics of PCS and identify the areas that need attention.

2. Research Method

The research study focused on the safety of PCCs. Masood, Roy [10] reported that there is confusion around the market share of PC in the mainstream construction industry. However, six types of business classification units are associated with PC by Accident Compensation Corporation (ACC) Levy in Wellington, New Zealand [31]; considering the engagement in the manufacture or manufacture and installation of prefabricated buildings/dwellings mainly in a factory (offsite) setting, refer to Table 1. Furthermore, for comparison to onsite construction, other relevant classifications such as ‘House construction (41110)’ and ‘Carpentry services (42420)’ were added, demonstrating the main quantum of work is happening onsite for house construction.
The accident data was requested, under the Official Information Act, from the ACC. Data on new claims were received, showing the occurrences of accidents from 1 January 2017 to 31 October 2022. A series of trends are potentially generated through time series accident data [32].
There are a few assumptions associated with the retrieved data:
  • The selected business classifications for PC are mainly involved in house construction with prefabricated products. However, there is possibility of involvement in non-residential construction.
  • The data demonstrate the reported accidents are within the jurisdiction of the selected PCC by business classifications; however, there are chances of non-reported accidents and incidents at offsite construction sites.
  • Business activity is presumed to be reduced for a few months under a locked down period during March–April and August–October in 2020. However, Auckland was affected more than other cities.
  • New claims are lodged to the ACC immediately after the injury occurred or at any later stage. Active claims were not considered for the data analysis, but only to determine the overall cost. The values that showed <4, as frequency, were considered equal to 3 to gain better descriptives.
This study initially reported the recent trends. The coverage of the data is not limited to the occurrences of accidents caused by injuries reported by numbers, but also other PCS elements such as occupation, primary diagnosis, primary injury site, injury cause, and prior activity. The period of accidents reported is five years from 2017 to 2022. Review of accident frequency is the lagging indicator for measuring the safety performance [33] with temporal intervention [34]. This is the most convenient way to monitor and apply strategies to the most critical aspects for improvement [35] to avoid chances of accident occurrence in future. Furthermore, comparing onsite versus offsite construction is also significant to understanding the viability [6]. Nevertheless, this is the initial step to understanding the severity of the situation in terms of H&S at the PC workplaces.

2.1. Simplisitic Modelling of Prefabricated Construciton Safety

A simplistic approach has been adopted to model several aspects of PCS based on dominant frequency measures:
(A)
Accident index (AI): The accident index has been defined to determine the annual accident frequency retrieved from new claims only. This is a simplistic measure of accident frequency and is calculated using the following formula from 2017–2022. A number of workers is not required, as this information is not available nor helpful for comparing onsite and offsite accident frequency [36]. Normal working hours in the New Zealand construction industry are more than 50 h in NZ, including overtime [37].
Accident index (year) = Number of accident reported in/50 h per 52 week
(B)
Accident frequency rate (AFR): The accident frequency rate was calculated by using following formula [38]:
AFR = Number of accident reported × 200,000/Total hours worked
where
  • Number of accidents for each specific year was sourced from ACC.
  • 200,000 = 40 h × 50 weeks × 100 employee, as developed by the Occupational Safety and Health Administration (OSHA) [39].
  • Total hours worked for onsite and offsite construction extracted from the Workforce Development Council (WDC) [40].
(C)
Elemental safety in PCS is modeled to understand the weightage of the sub-elements based on accident frequency of key aspects from the given period of 2017–2022. This provides the contribution of sub-elements in the overall element.
PCS (Element) = W1 × S1 + … WN × SN
where
  • W1 = Sum of sub-elements for all years/Sum of all sub-elements × 100
  • S1 = Sub-element 1

2.2. Predictive Modelling of Prefabricated Construciton Safety

The accident frequency was forecast using an autoregressive integrated moving average (ARIMA) for future values using past time values [41,42], calculated through a function of SPSS (https://www.ibm.com/products/spss-statistics, accessed on 21 January 2024), which helps to capture a huge range of time series patterns. This is a suitable approach for short-term forecasting. An ARIMA (p, d, q) model for non-seasonality was followed [43,44]. The general forecasting model can be expressed as in Equation (4), and as used by [45].
y′t = φ0 + φ1y′t−1 + φ2y′t−2 + … + φpy′tp + θ1εt−1 + θ2εt−2 … + θqεtq + εt
where
  • y = regressions on itself lagged by the n-th period
  • y′t = differenced series
  • p = the number of autoregressions (AR)
  • d = the number of seasonal differences
  • q = the number of the moving average (MA)
  • φi (i = 1,…, p) = Weights for AR
  • θj (j = 1,…, q) = Weights for MA
  • ε = Error term that reflects the previous state at present
  • εt = residual term with mean zero
In this study, these combinations were followed to determine the ARIMA models based on white noise existence [46], such as (0, 0, 0), (0, 1, 0), (1, 1, 0), (0, 1, 1), and (1, 1, 1) [45,47].
The performance indicators for selecting the most suitable model are minimum R-squared (coefficient of determination) near to 1, mean absolute error (MAE), mean absolute percentage error (MAPE), root mean square error (RMSE), and the Bayesian information criterion (BIC). Original data are represented by y i , the prediction data by y ^ i , and the average value of original data by y ¯ . ‘T’ is the number of samples, ‘n’ is the number of unknown parameters, and ‘M’ is the maximum likelihood of the model.
R 2 = 1 i ( y ^ i y i ) 2 i ( y i y ¯ ) 2
M A E = 1 n i n   | ( y i y ^ i ) |
M A P E = 1 n i = 1 n | ( y i y ^ i ) / y i | × 100 %
R M S E = 1 n i = 0 n ( y i y ^ i )
B I C = ln ( T ) ( n ) 2 ln ( M )
Initially, the Statistical Package for the Social Sciences (SPSS) expert modeler function was used, and then ARIMA (p, d, q) was applied. An ARIMA model with minimum MAPE was selected based on the interpretability easiness and comparison of forecast error [48]; it was also checked for lower values of MAE, RMSE and BIC, but the maximum (closer to 1) value for R2. This provides the goodness-of-fit for optimized models [42,49,50,51]. Optimized ARIMA models are provided in Supplementary Material.

3. Results and Discussion

This section covers the key findings and related discussion.

3.1. Accident index

Figure 1 shows the accident index per year for both companies offsite and onsite. The result shows there is a huge difference between offsite and onsite construction. It has been found accidents happen onsite about four times more than offsite. On average, there is a difference of 2.5. There is a 0.9-times chance for an accident to happen offsite and 3.4 times onsite in any hour during work. However, there is no information on the time of the accident available. This result indicates workplaces of PCC are much safer than traditional onsite construction workplaces. It should be noted that a higher accident index certainly increases the chances of fatal incidents in the future [52].

3.2. Accident Frequency Rate

AFR was calculated for the year 2017–2021. The data for the workforce offsite and onsite are available for this period from WDC [40]. Figure 2 shows the AFR both onsite and offsite from 2017 to 2021. For example, for the year 2021, the total cases reported both offsite and onsite in this period are 2436 and 9546, respectively. However, the core workforce offsite and onsite in the year 2021 is 18,516 and 145,978, respectively. This workforce portrays all types of construction, including residential and non-residential. Total hours worked were calculated based on 40 h per week and 50 weeks per year. AFR shows that overall, in 2021, there were 13 accidents per 100 employees offsite, and 7 accidents per 100 employees onsite. However, more accidents are reported onsite (4-times that of offsite), but the core workforce is 8 times the size of the offsite force. Hence, the AFR offsite is almost double that of onsite, which is due to a small workforce size. However, there is no information available about the business classification considered for defining the core onsite and offsite workforce by the WDC. Hence, AFR is calculated based on available data by ACC and WDC.

3.3. Accident Forecasting by Classification

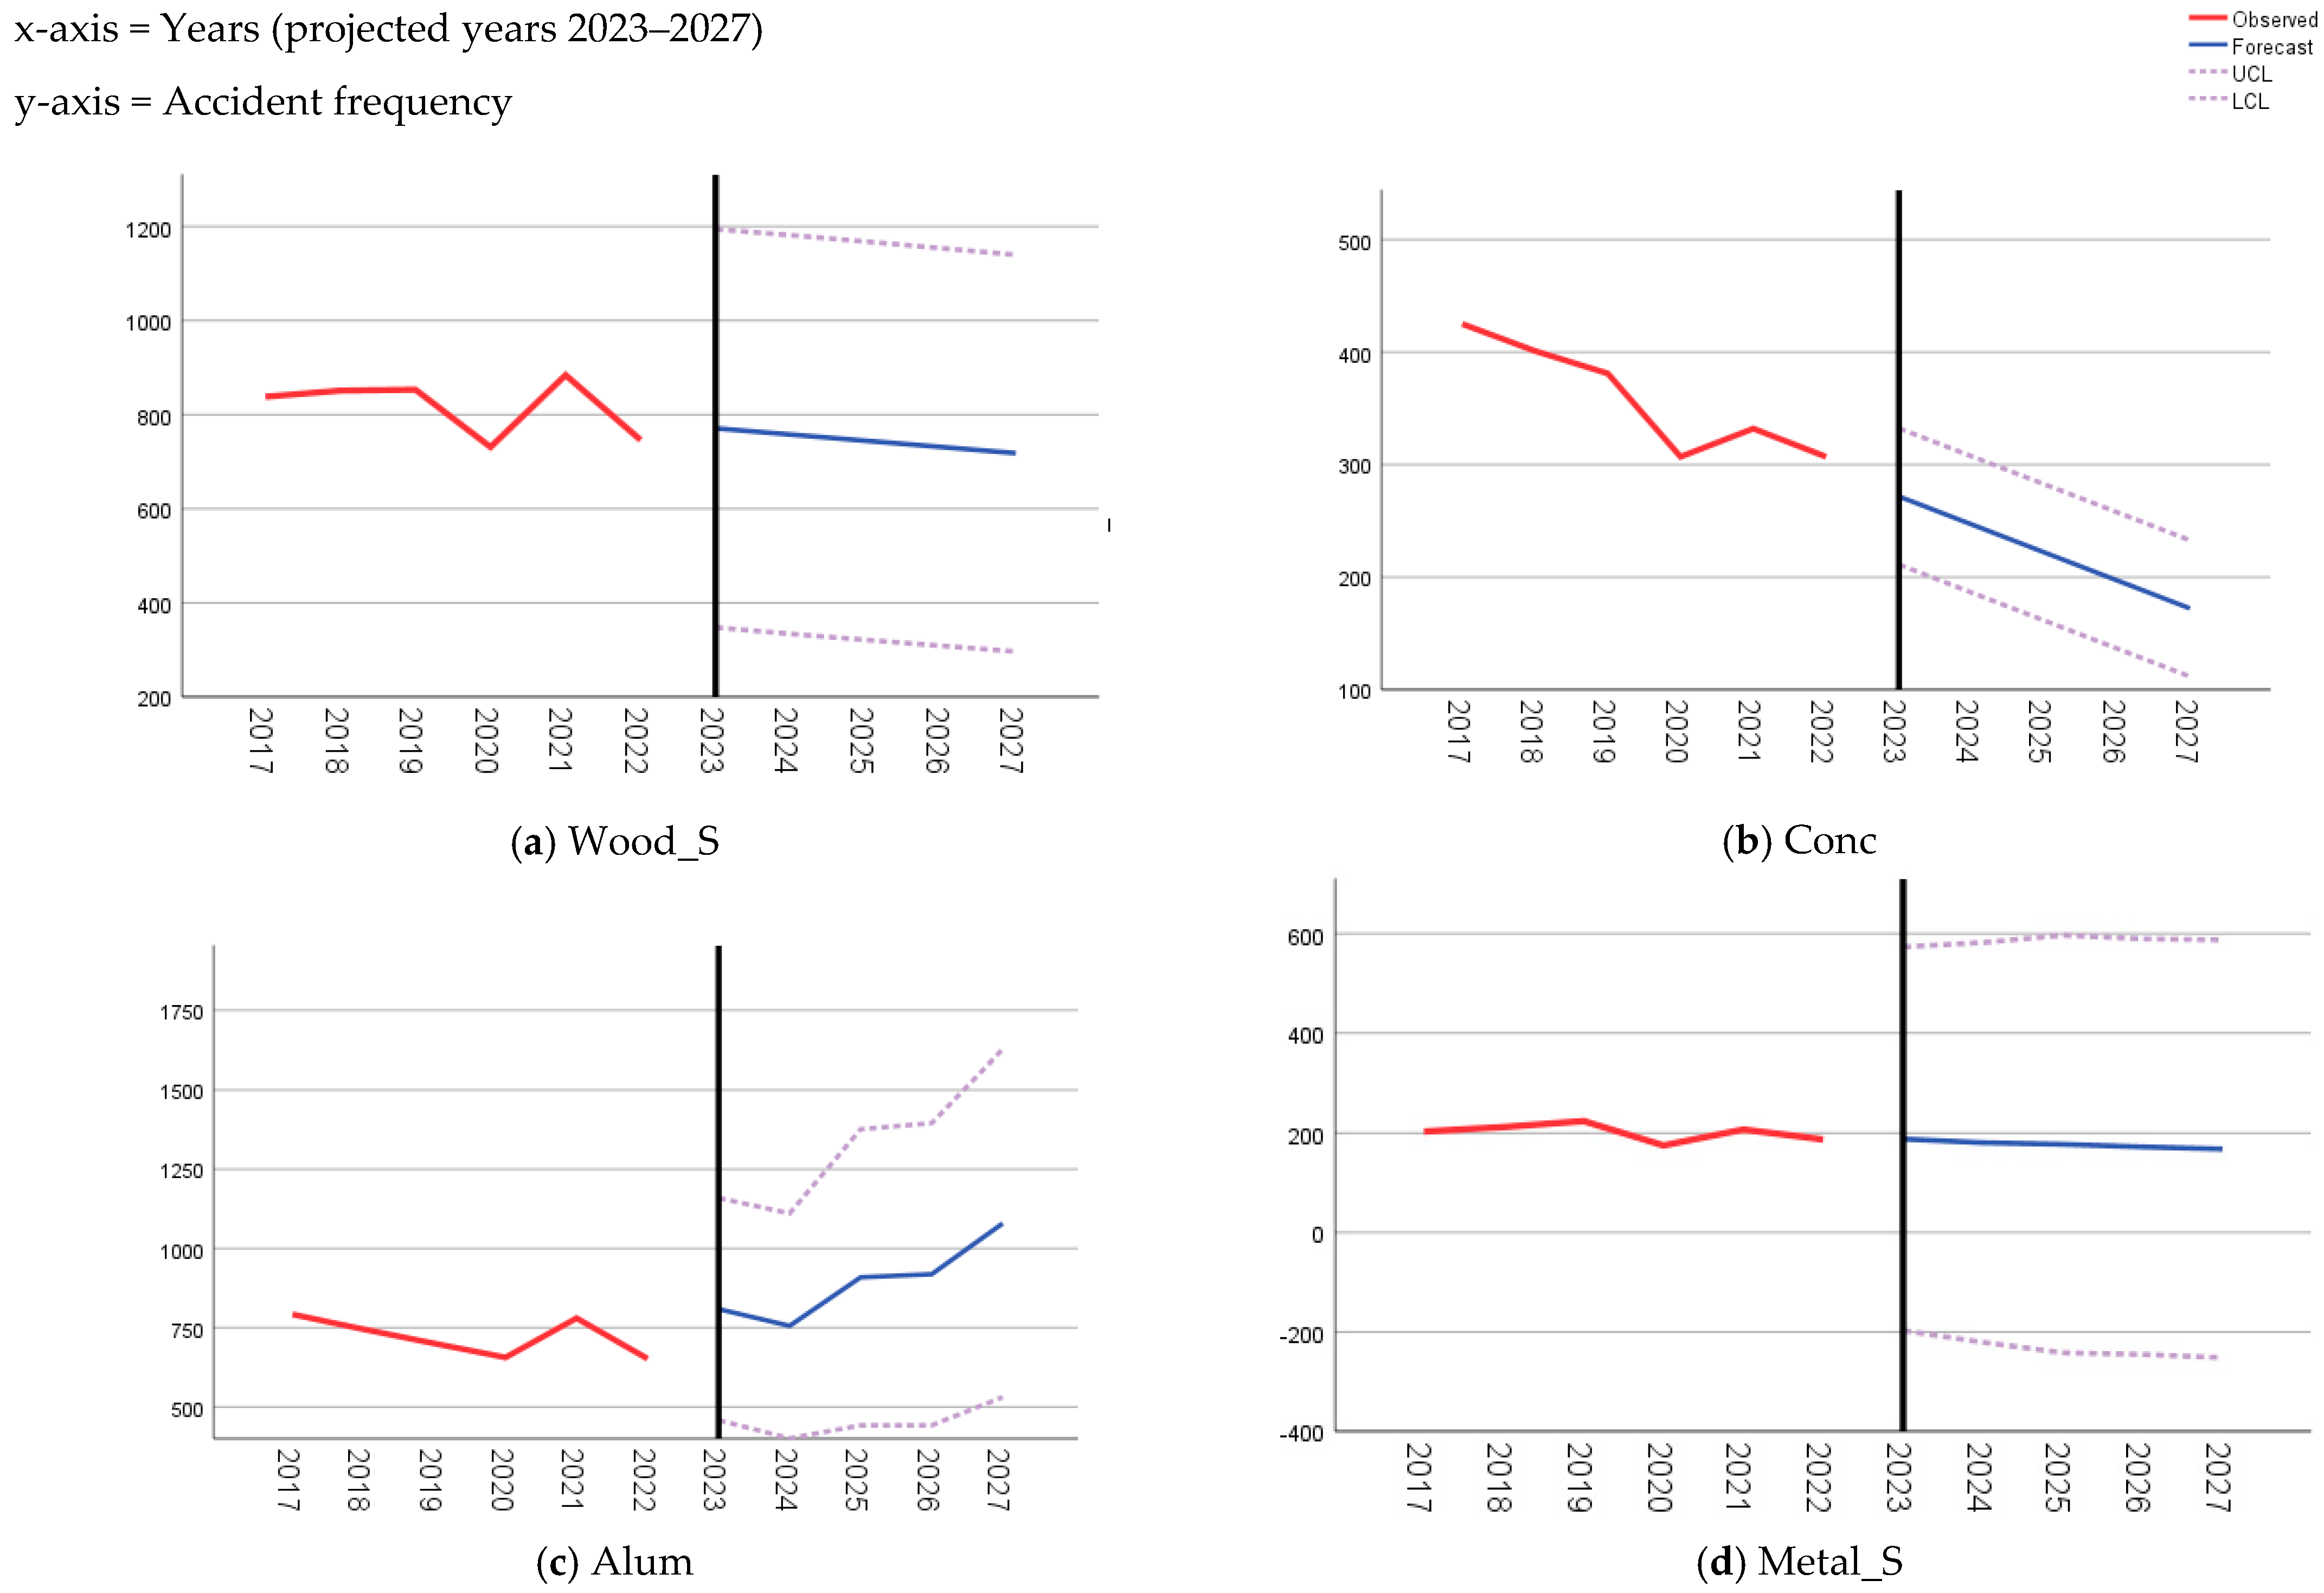
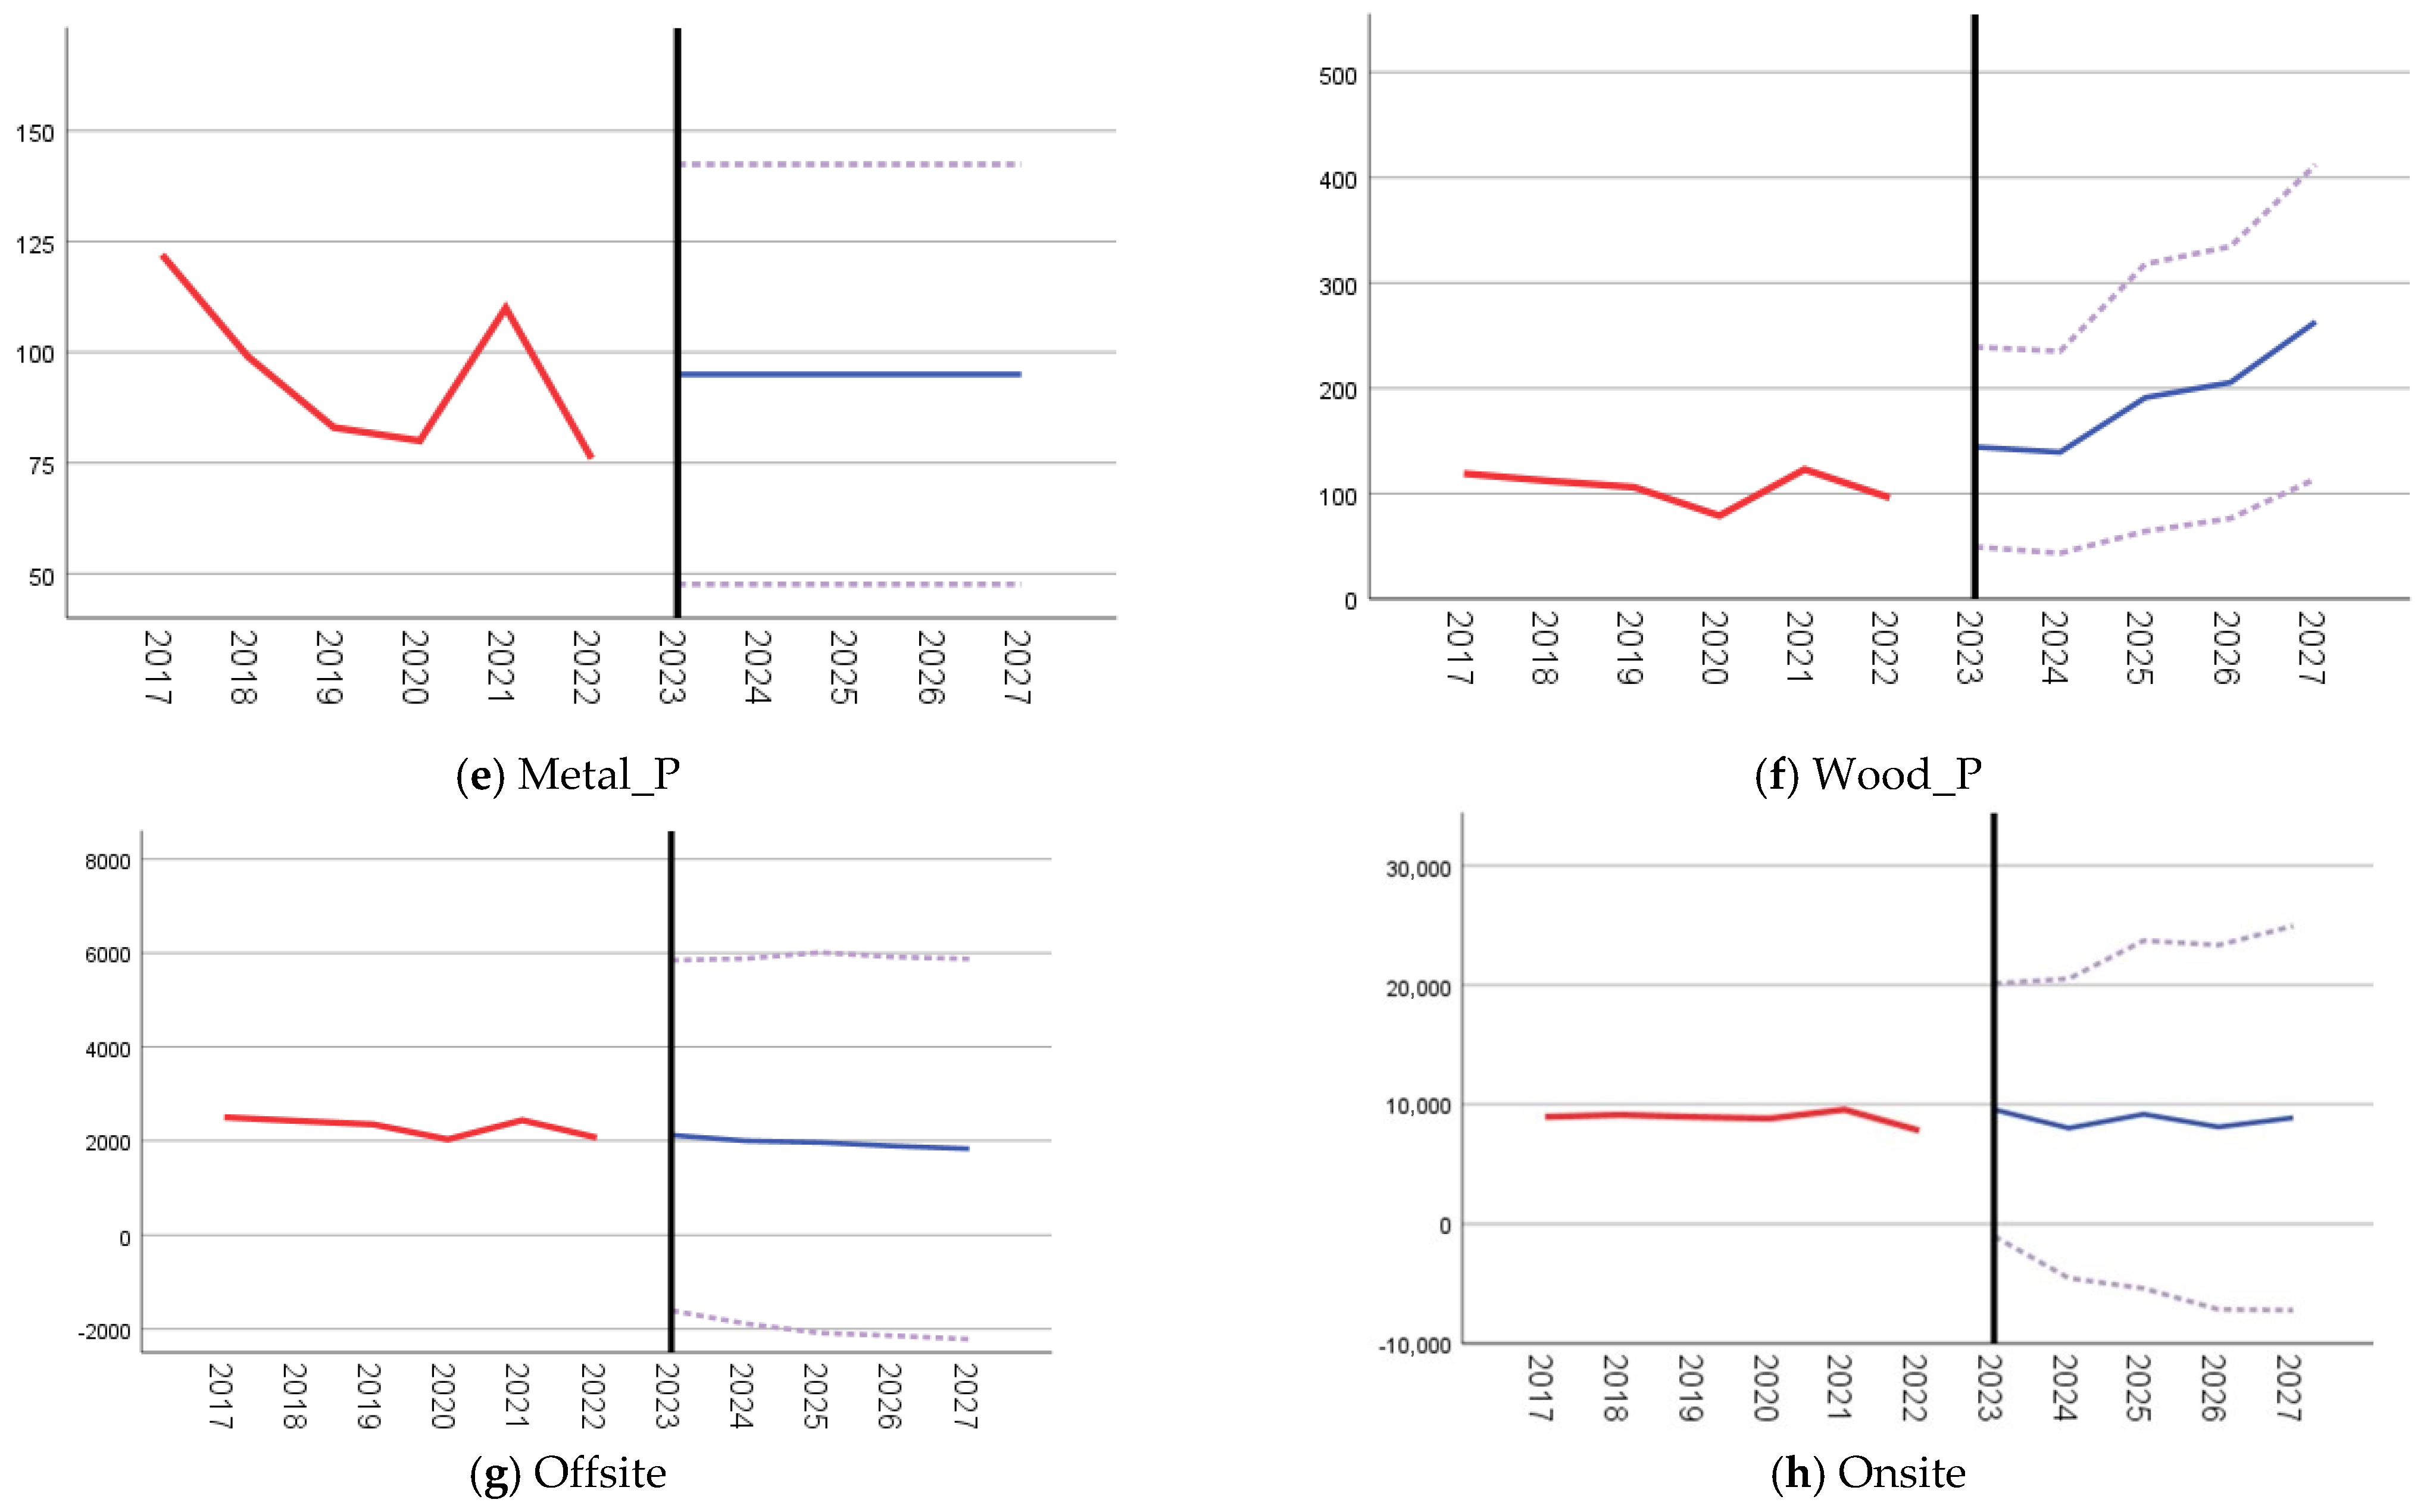
Figure 3 shows the optimized ARIMA models for each classification. The optimized forecasting model from several ARIMA models is provided in Table 2. The main trend is that Wood_S, Conc, and Metal_ will decline, but the rest will increase. Overall, offsite (PCCs) has a declining trend, but onsite has a somehow steady trend of accident frequency. However, with a shift to more offsite construction, there is the possibility of more accidents being reported where Alum, Metal_P, and Wood_P will more critical.

3.4. Cost of Prefabricated Construction Safety

Figure 4a shows the number of active claims (19,311) for which payments have been generated from 2017–2022. Wood_S is leading, followed by Conc, Alum, and Metal_S, in ascending order. However, Metal_P and Wood_P are positioned relatively lower. Interestingly, injuries reported for Wood_S are 63% that of other classifications’ units. However, there is a very low variation in the frequency of injury reporting from 2017–2022, showing the same trend over the years. Figure 4b shows the costs of active claims. Overall, the safety cost is $54.28 million, which is quarter ($191.709 million) of the onsite house construction. However, companies under Wood_S, Conc, and Alum are most expensive in terms of poor safety. The costliest year for safety claims was 2021 with $9.86 million, which is relatively higher than 2017 ($7.87 M). Cost is exclusive of GST.

3.5. Vulnerable Occupations in Prefabricated Construction

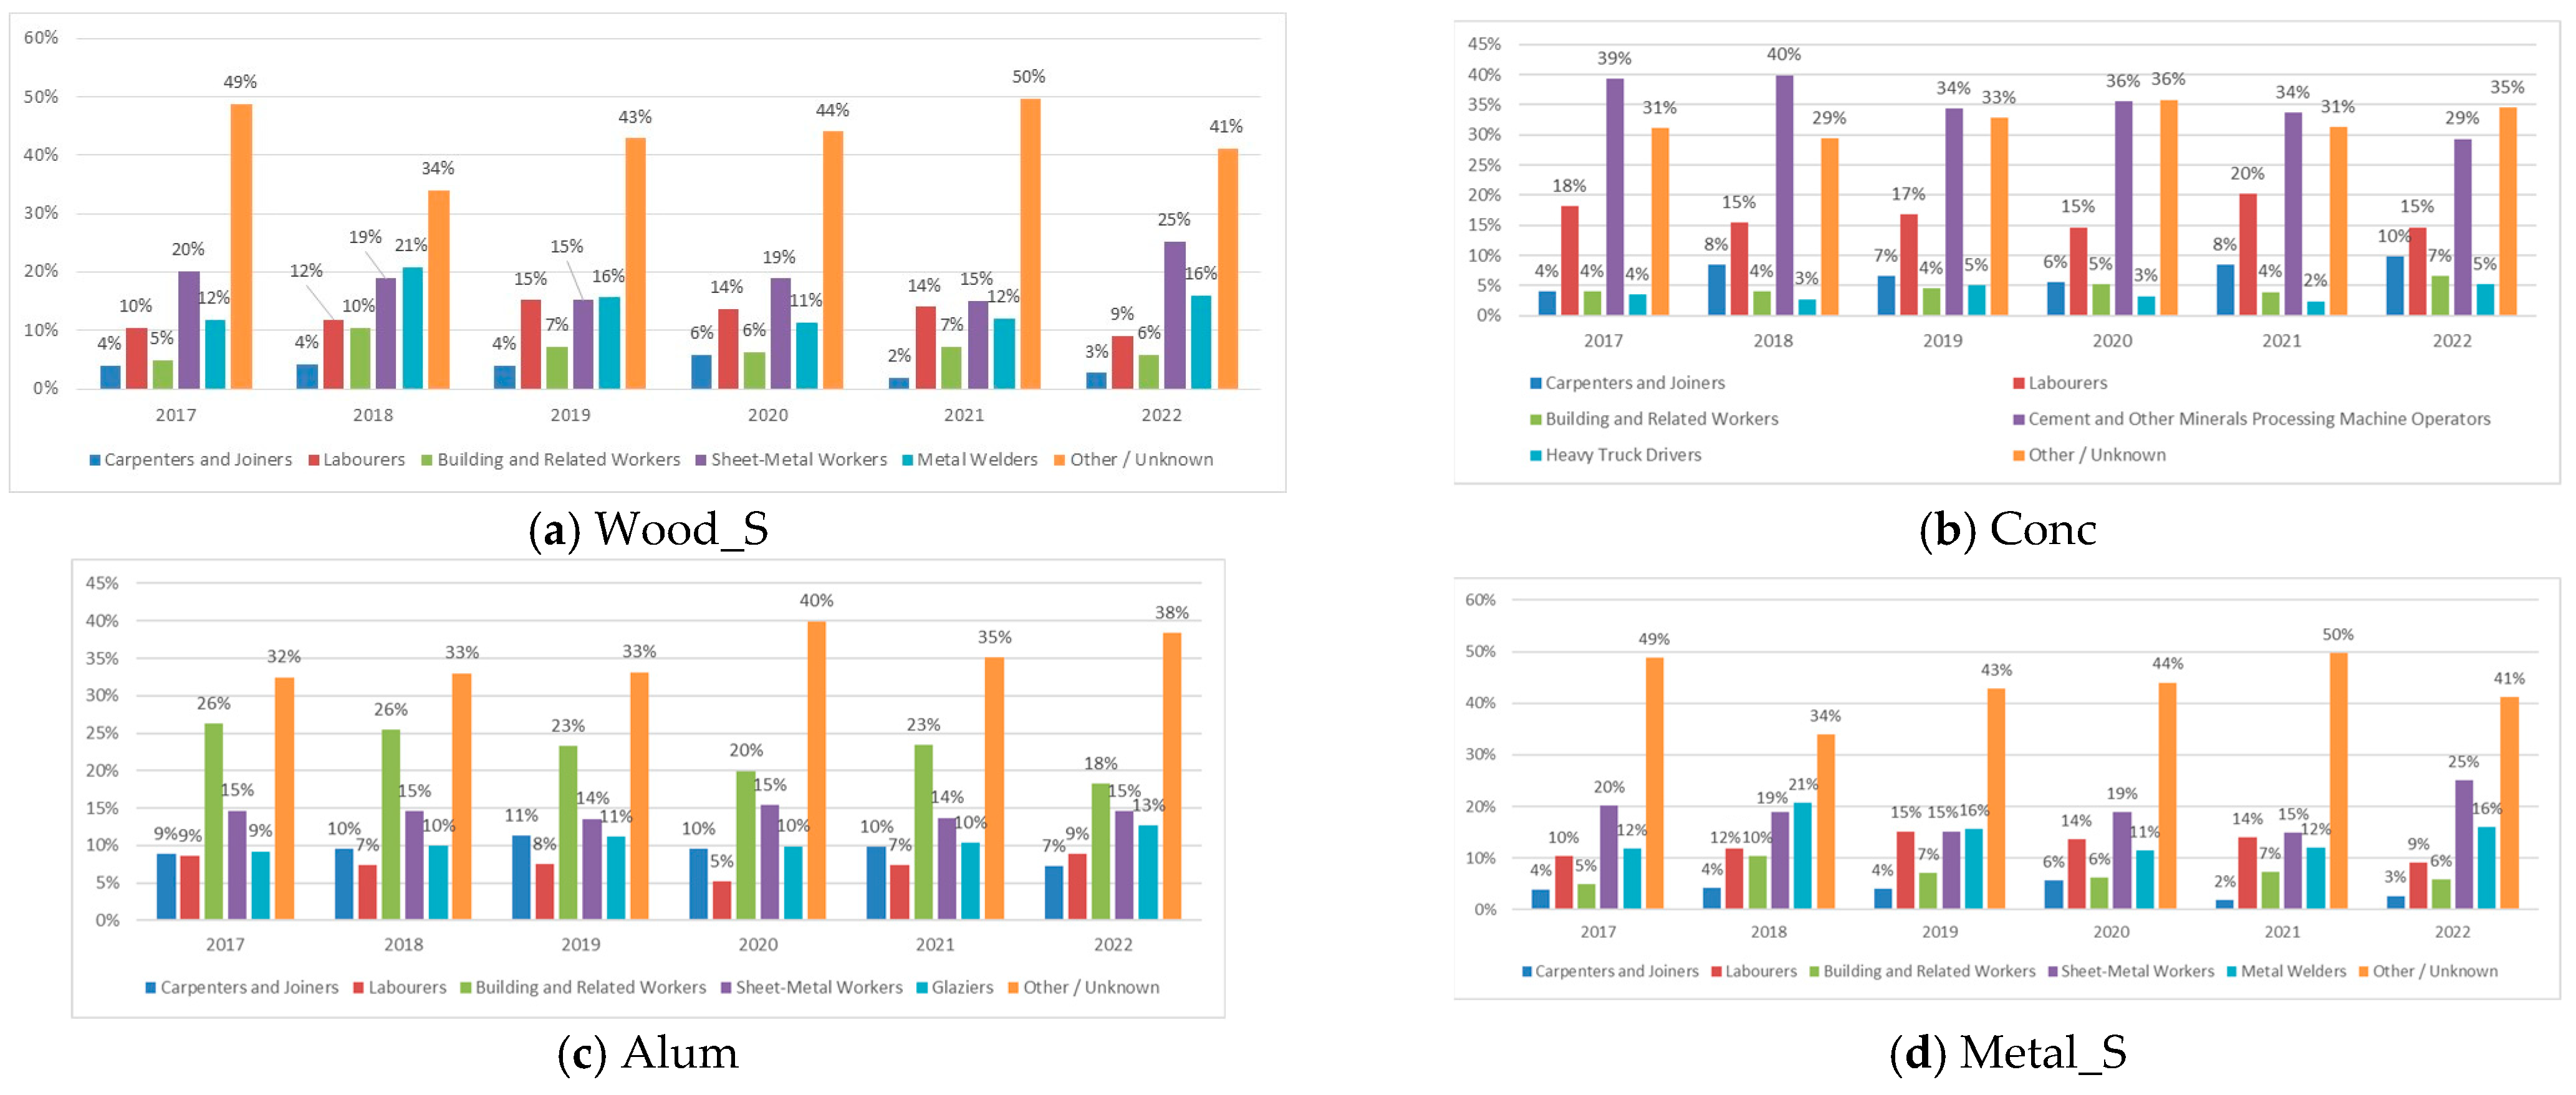
Figure 5 shows the most common vulnerable occupation for each type of PCC. The X-axis represents the years, and the y-axis represents the percentages of occurrence. It is to be noted that three occupations are similar in all types, such as ‘carpenters and joiners’, ‘labourers’, and ‘building and related workers’, but the nature of work varies for each. However, there is an occupational category called ‘other/unknown’, which has not been associated with any services. Conc has more accidents reported under this category. This demonstrates that there is less clarity around the professional engagement of employees in PCC. Employees under ‘carpenters and joiners’ and ‘labourers’ are more vulnerable for Wood_S in comparison to the rest of the types of PCC. However, it is different for ‘building and related workers’, where most accidents happened in Conc. Other top vulnerable occupations in each PCC type are ‘Cabinet Makers and Related Workers’ (Wood_S) with 37%, ‘Cement and other Minerals Processing’ (Conc) with 35%, ‘Sheet metal workers’ (Metal_S-14%, Metal_S-19%, and Metal_P-10%), and ‘Painters and paperhangers’ (Wood_P) with 4% in specific categories. Accidents reported for ‘carpenters and joiners’ in all types of PCC are behind by 833 compared to companies providing carpentry services only (42420). However, in comparison to house construction companies (41110) involved on-site, the PCC represents only 7% of accidents. Nevertheless, regardless of offsite or onsite status, ‘carpenters and joiners’ are most vulnerable. On the other hand, ‘labourers’ working in PCC face almost half the accidents in comparison to house construction companies, but employees under ‘building and related workers’, showed a similar number of accidents.
PCC is still evolving, and understanding the occupations is still a critical challenge. In Equations (10)–(15), the weightage of vulnerable occupations was determined for each PCC type. This helps to identify the most vulnerable occupations and model the overall organizational structure, considering the potential safety concern for specific occupations. Interestingly, one-third of the occupation category ‘Others’ are reported vulnerable for Metal_S, Alum, and Conc, which indicates the prefab business is still not well established. However, companies could use the developed model equations to assign risk associated with the identified occupations. The higher weightage of the ‘others’ category indicated the difficulty in the allocation of work, which hinders safety control [53].
Vulnerable occupations (Wood_S) = 37 × Carpenters and joiners + 14 × Labourers + 2 × Building and related workers + 12 × Cabinet makers and related workers + 5 × Operators + 31 × Others
Vulnerable occupations (Conc) = 7 × Carpenters and joiners + 17 × Labourers + 5 × Building and related workers + 36 × Operators + 4 × Drivers + 32 × Others
Vulnerable occupations (Alum) = 9 × Carpenters and joiners + 8 × Labourers + 23 × Building and related workers + 14 × Sheet metal workers + 10 × Glaziers + 35 × Others
Vulnerable occupations (Metal_S) = 4 × Carpenters and joiners + 12 × Labourers + 7 × Building and related workers + 19 × Sheet metal workers + 15 × Welders + 43 × Others
Vulnerable occupations (Metal_P) = 23 × Carpenters and joiners + 36 × Labourers + 7 × Building and related workers + 10 × Sheet metal workers + 8 × Welders + 17 × Others
Vulnerable occupations (Wood_P) = 51 × Carpenters and joiners + 22 × Labourers + 5 × Building and related workers + 19 × Painters and paperhangers + 4 × Admin + 15 × Others
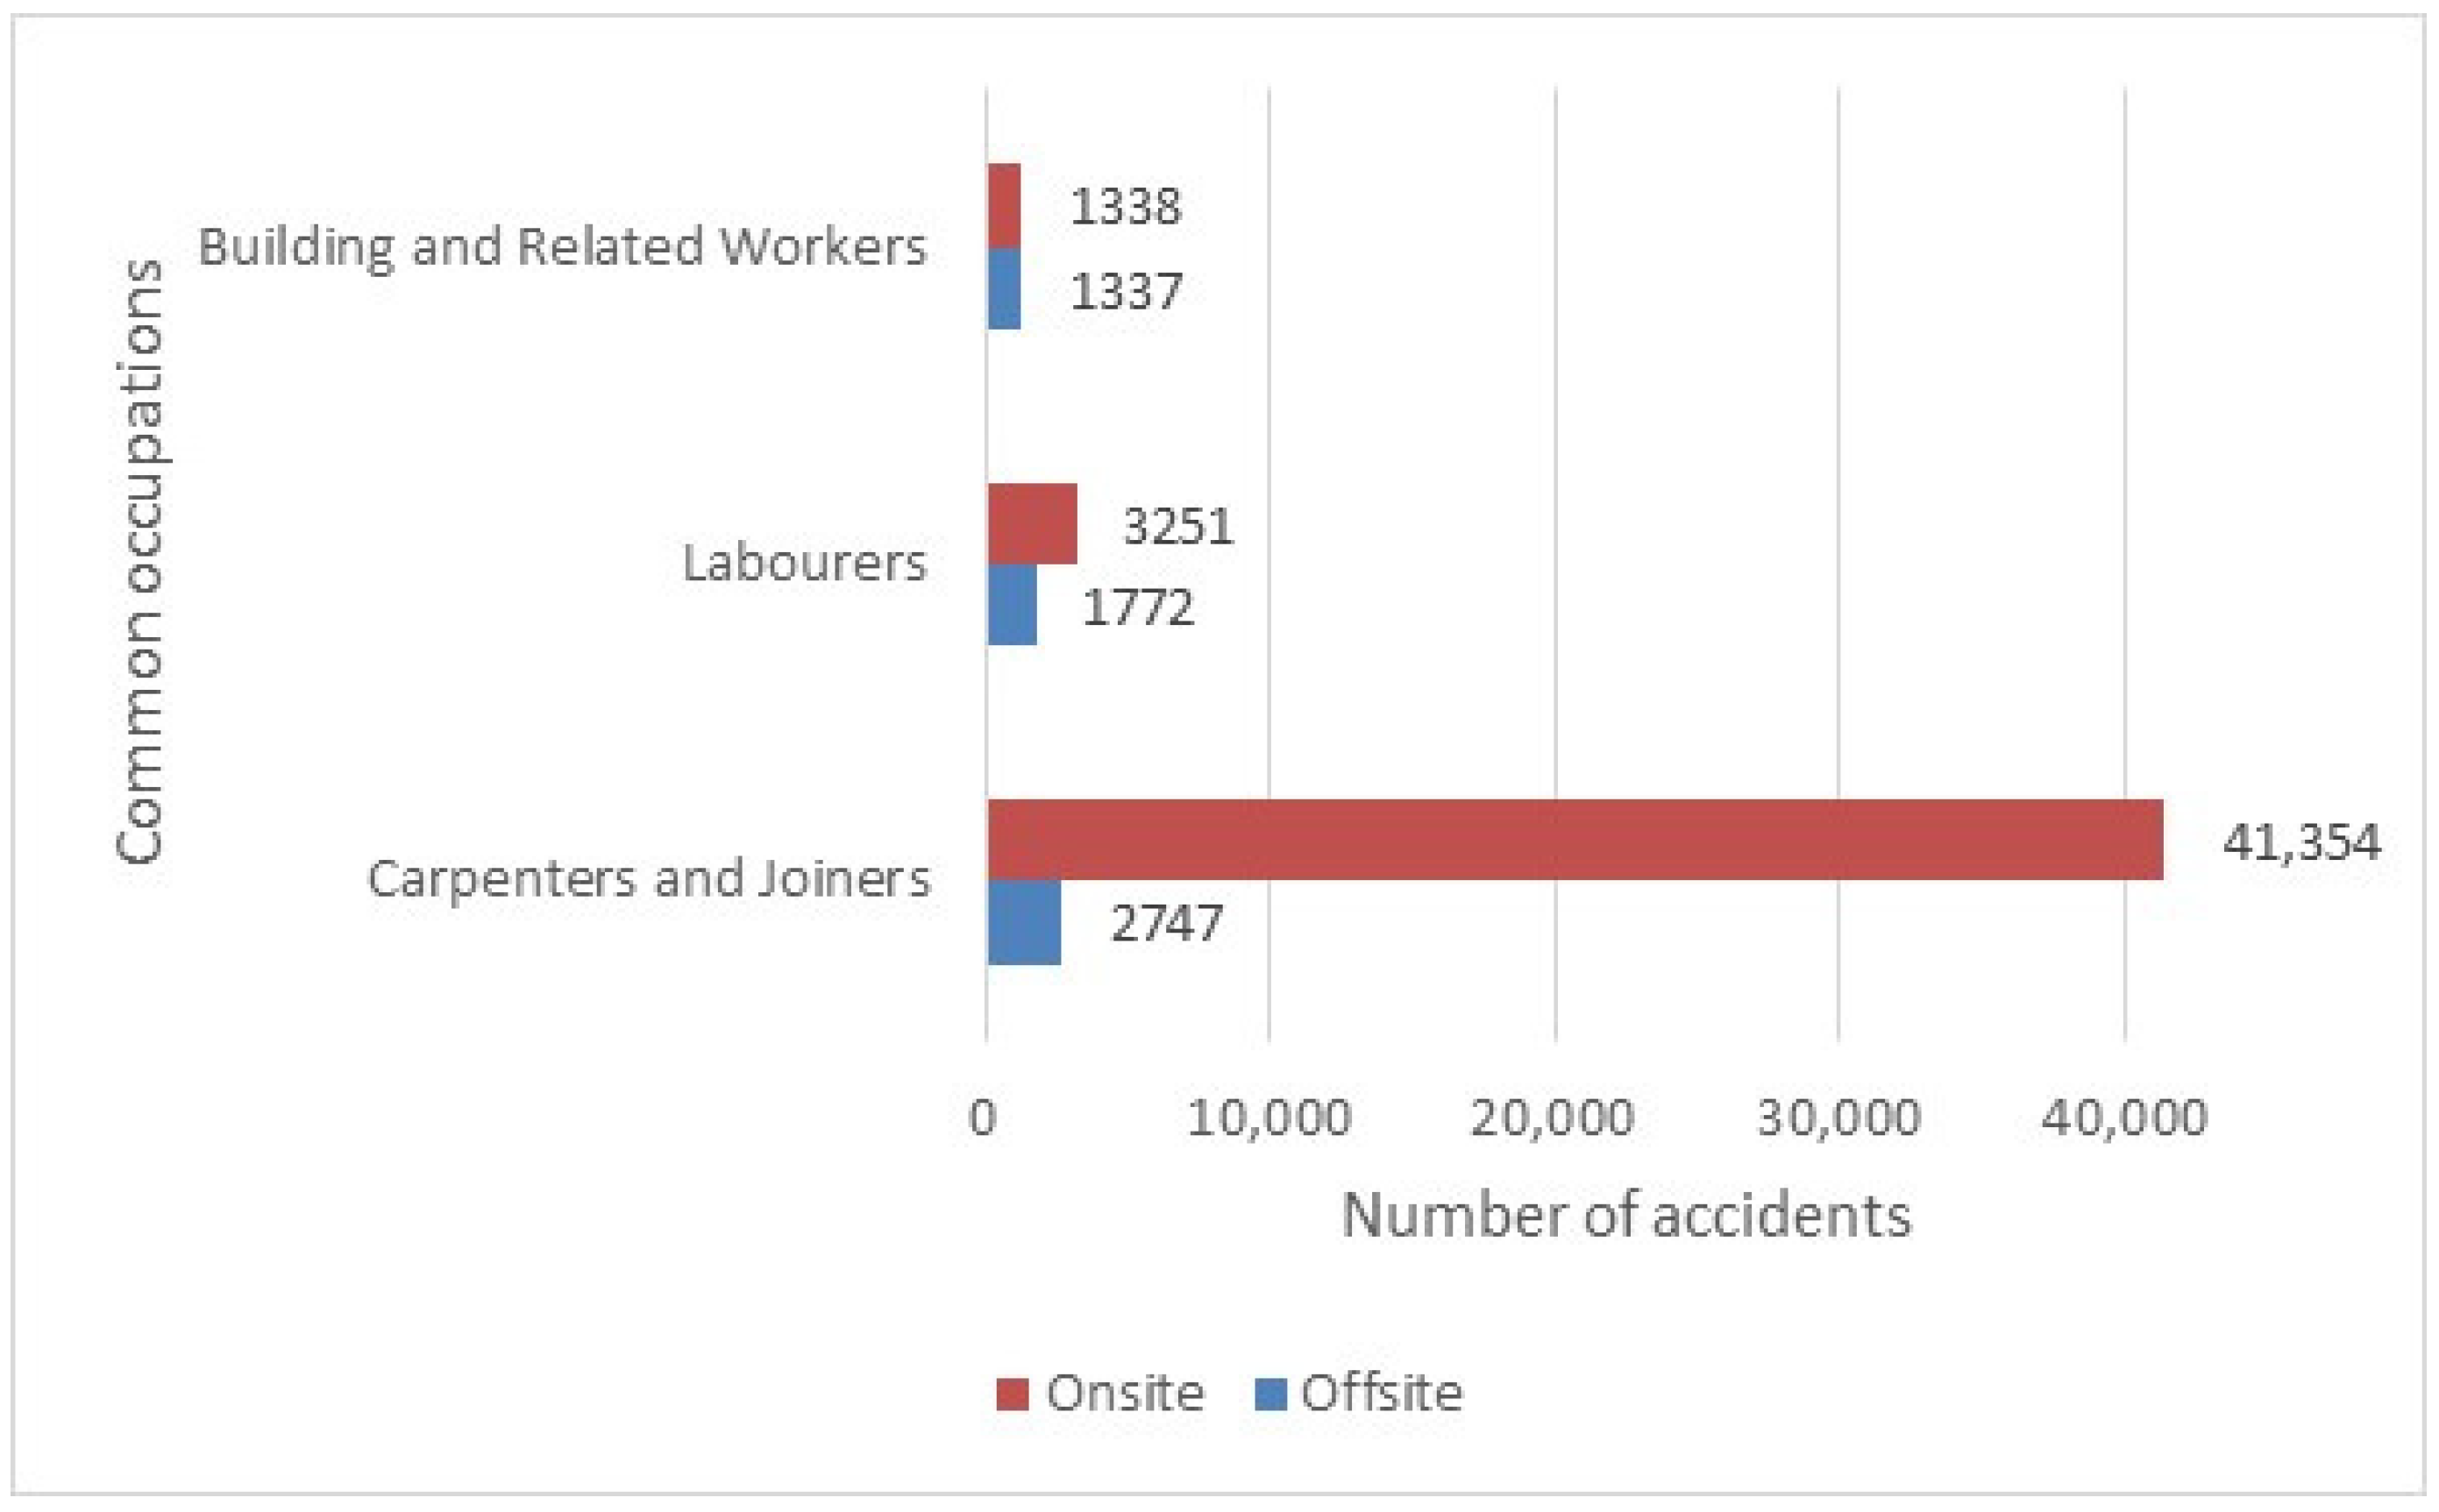
Most occupations in all PCCs are ‘Carpenters and joiners’, ‘Labourers’, and ‘Building and related workers’. Figure 6 shows in the selected period that the same number of accidents were reported under the ‘Building and related workers’ category for both offsite and onsite. However, accidents offsite reduced almost to half for ‘Labourers’, but only 7% for ‘Carpenters and joiners’. This seems the ‘Carpenters and joiners’ and also ‘Laborers’ are relatively safer in prefabricated construction.
In this section, accident frequency is forecast for the most vulnerable (having highest accidents in last five years) occupations by type of classification.
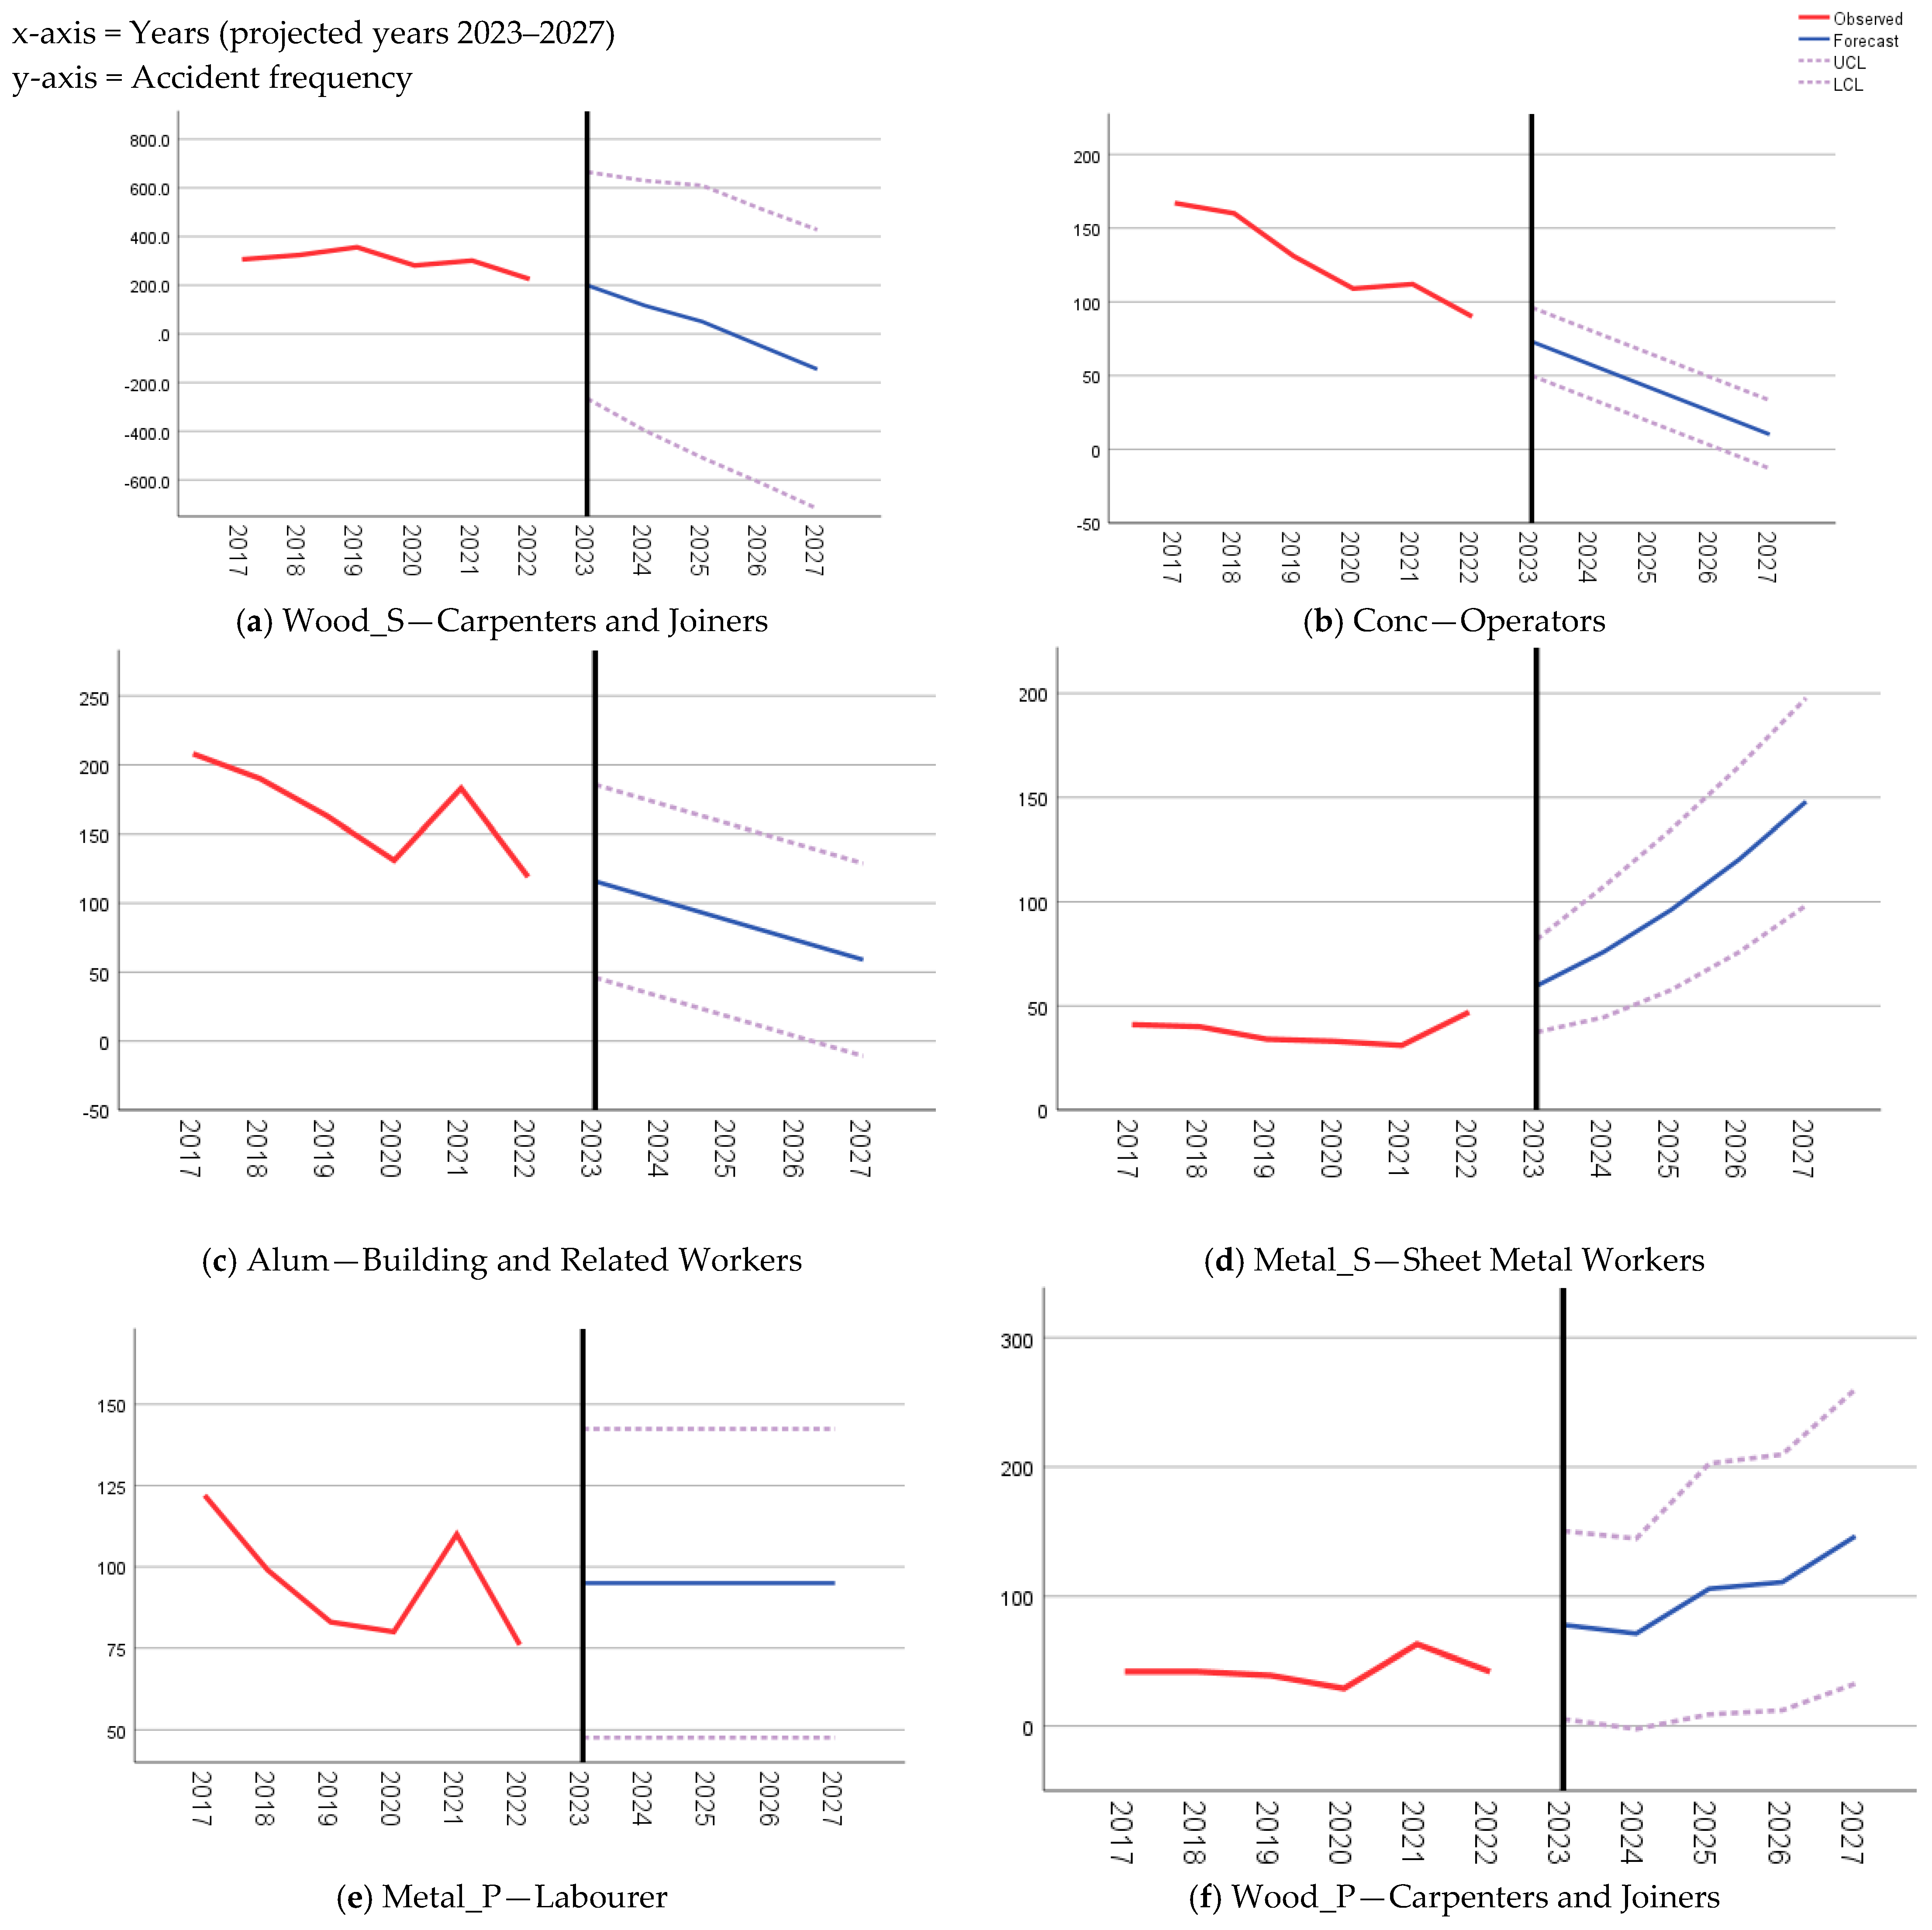
Table 3 presented the results of optimized ARIMA models by vulnerable occupations. Figure 7 shows the graphical representation of the optimized ARIMA models for each classification. The main trend is that Wood_S, Conc, and Metal_ will decline, but the rest will increase, except for Metal_P having a steady trend. In the wood sector, ‘carpenters and joiners’ are more critical in prefabricated construction than structural.

3.6. Injuries in Prefabricated Construction Accidents

3.6.1. Type of Injuries

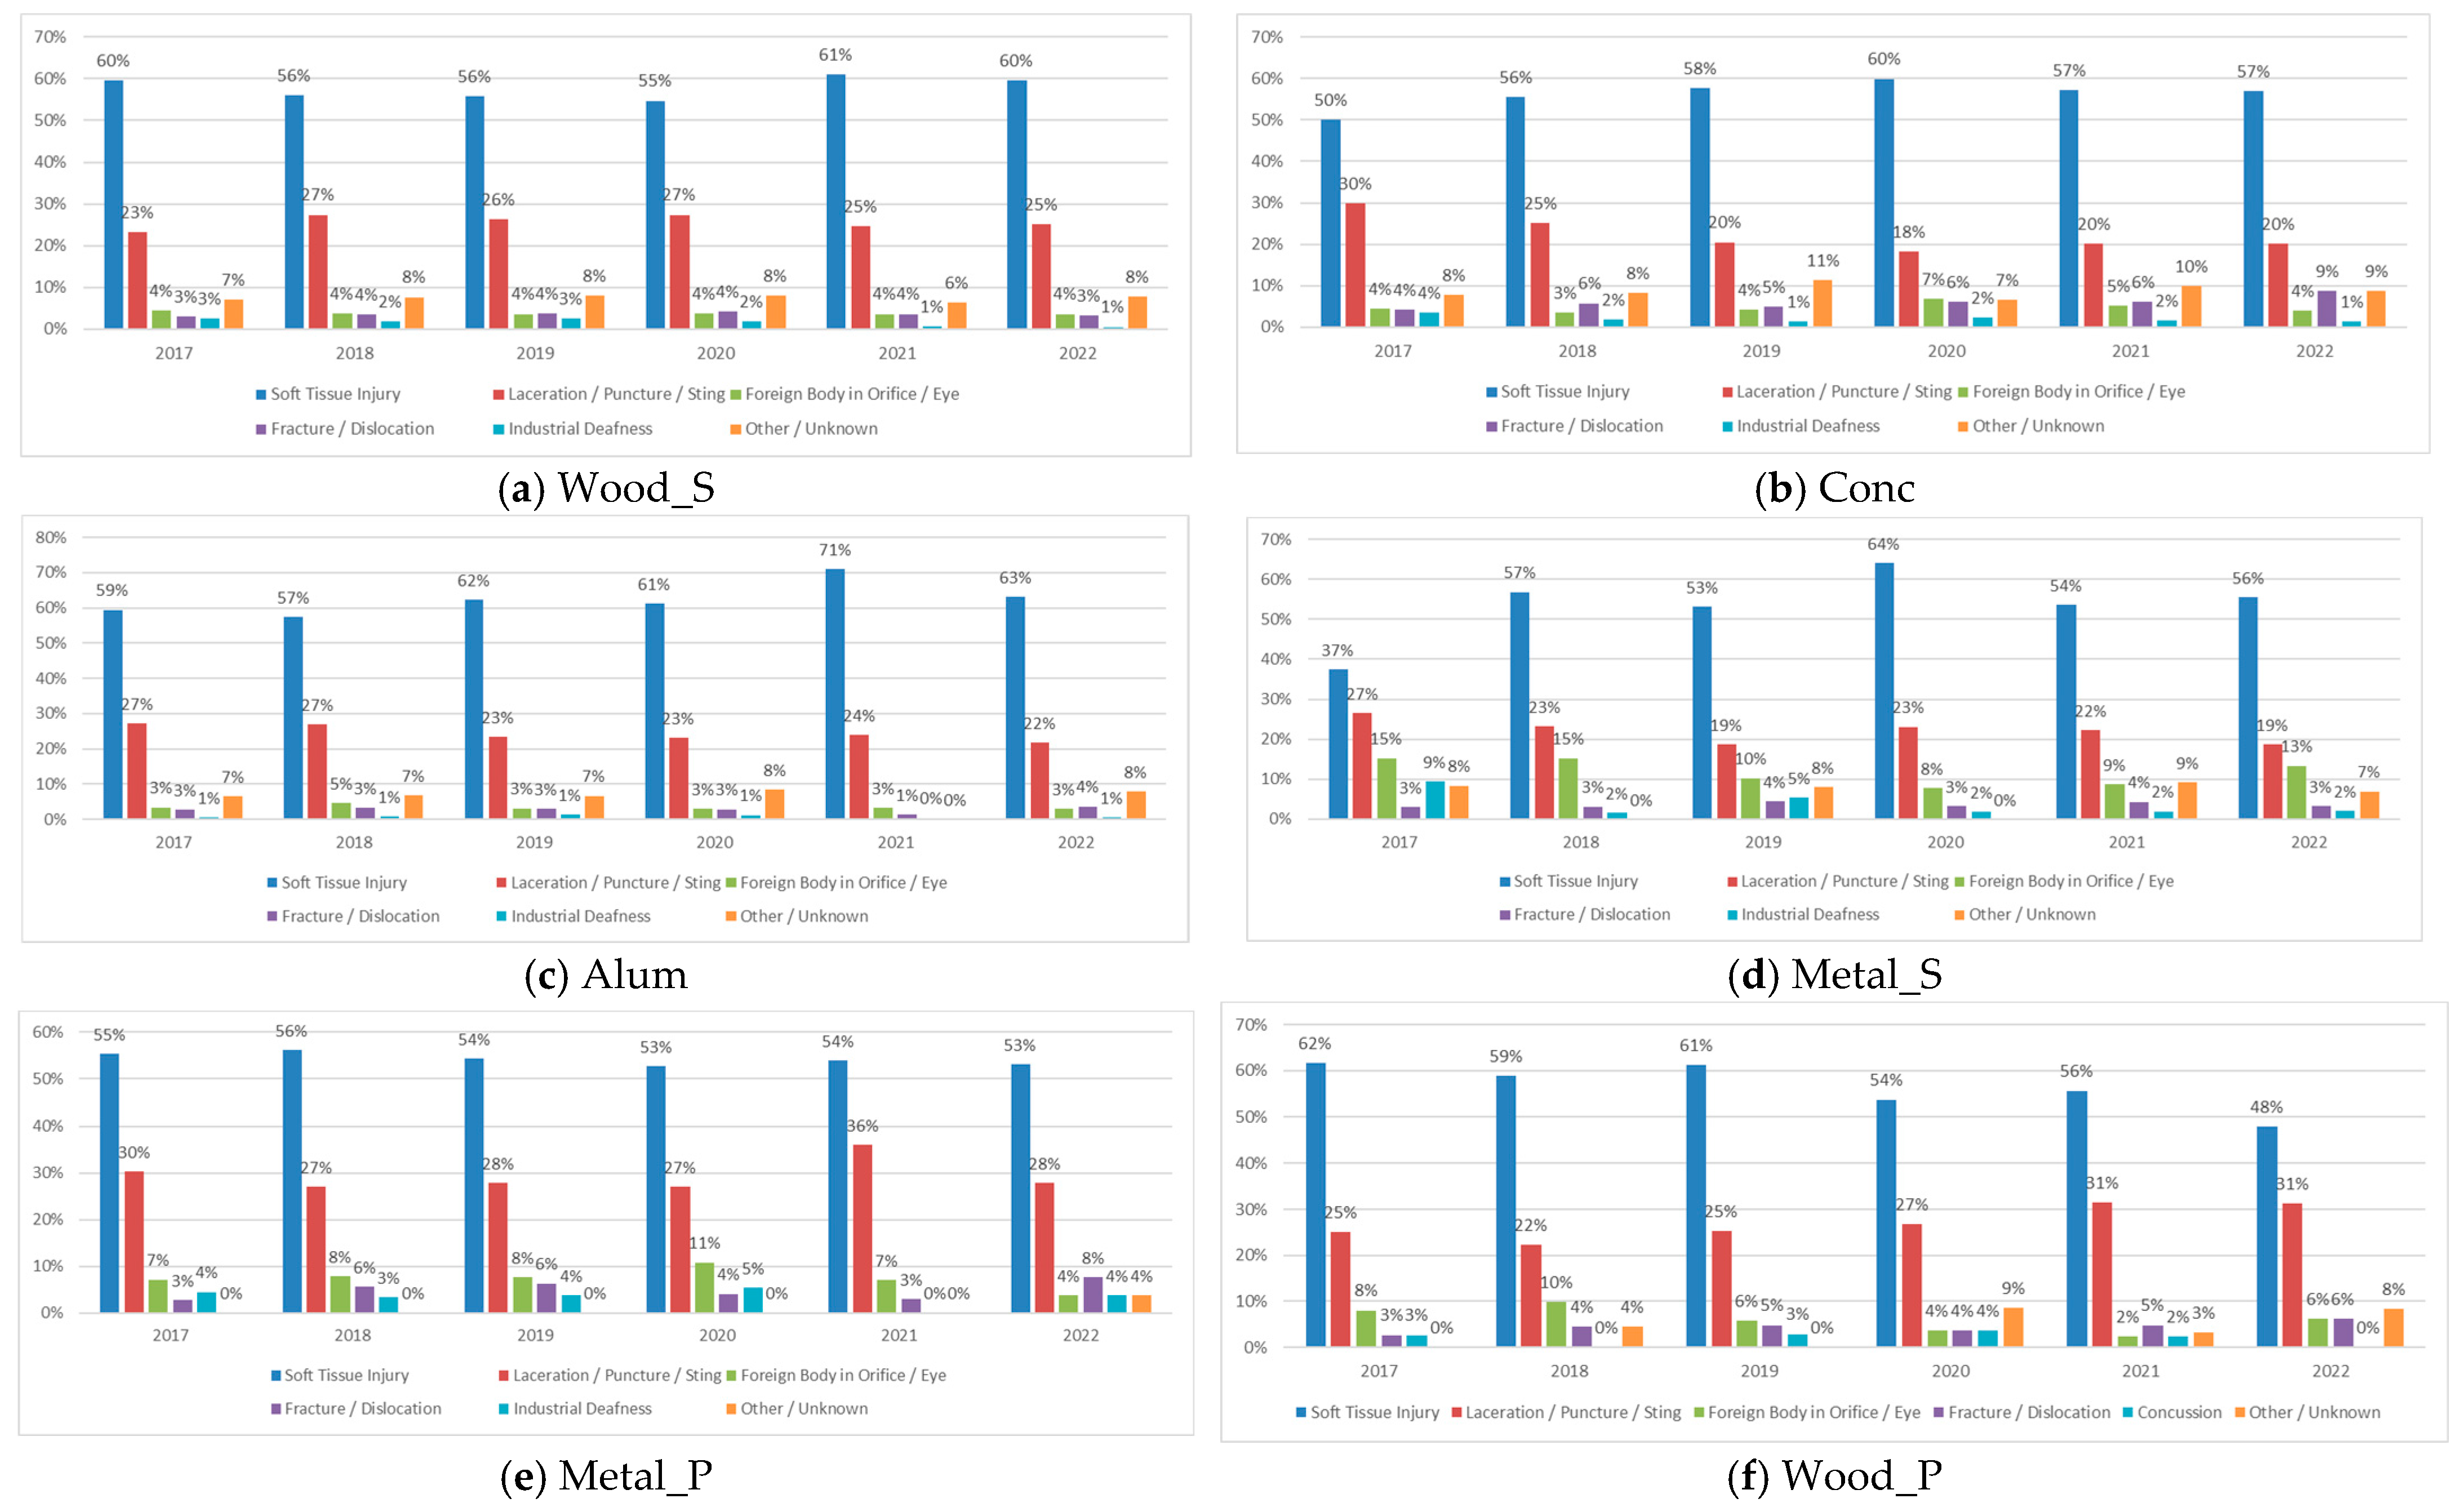
Figure 8 shows accident frequency under each type of injury for PCC. The X-axis represents the years and the y-axis represents the percentages of occurrence. ‘Soft tissue injury’ and ‘laceration/puncture/sting’ are the common, at 58% and 25%, respectively. There is a significant drop in injury frequency for ‘foreign body in orifice/eye’, ‘fracture/dislocation’, and ‘industrial deafness’, in ascending order. However, the fewest injuries were related to ‘concussion’, and there are only 7% of injuries with an unknown source. A similar trend is found in the data of onsite companies, with additions of ‘dental injury’ but without ‘concussion’. ‘Soft tissue injury’ and ‘laceration/puncture/sting’ are more critical for Wood_S (60%, 25%) and Alum (63%, 22%) in comparison to other PCC types. ‘Foreign body in orifice/eye’ injury type is more critical for Wood_S (4%), Alum (3.4%), and Metal_S (12%). ‘Fracture/dislocation’ injury type is more critical in Conc (6%), Metal_P (5%), and Wood_P (5%). ‘Industrial deafness’ is more critical for Metal_S (4%) and Metal_P (4%). In Wood_S (8%) and Conc (9%), there are sufficient accidents reported for which injuries are categorized as ‘unknown’. Overall, a similar trend of occurrence was observed for each type of injury in the last five years. More variation was observed in ‘Soft tissue injury’ and ‘laceration/puncture/sting’, but a significant drop was observed in ‘concussion’.
Injury types were modelled with simplistic equations to determine the weightage of each type under each classification. This helps to establish the need for the amount of attention required by the PCC companies to take proactive measures through safety management and administration at the workplaces.
Injury types (Wood_S) = 58 × Soft tissue injury + 26 Laceration/puncture/sting + 4 × Foreign body in orifice/eye + 4 × Fracture/dislocation + 2 × Industrial deafness + 7 × Others
Injury types (Conc) = 56 × Soft tissue injury + 23 Laceration/puncture/sting + 5 × Foreign body in orifice/eye + 6 × Fracture/dislocation + 2 × Industrial deafness + 9 × Others
Injury types (Alum) = 62 × Soft tissue injury + 25 Laceration/puncture/sting + 3 × Foreign body in orifice/eye + 3 × Fracture/dislocation + 1 × Industrial deafness + 6 × Others
Injury types (Metal_S) = 53 × Soft tissue injury + 22 Laceration/puncture/sting + 12 × Foreign body in orifice/eye + 4 × Fracture/dislocation + 4 × Industrial deafness + 6 × Others
Injury types (Metal_P) = 54 × Soft tissue injury + 30 Laceration/puncture/sting + 7 × Foreign body in orifice/eye + 5 × Fracture/dislocation + 3 × Industrial deafness + 1 × Others
Injury types (Wood_P) = 57 × Soft tissue injury + 27 Laceration/puncture/sting + 6 × Foreign body in orifice/eye + 4 × Fracture/dislocation + 2 × Industrial deafness + 4 × Others
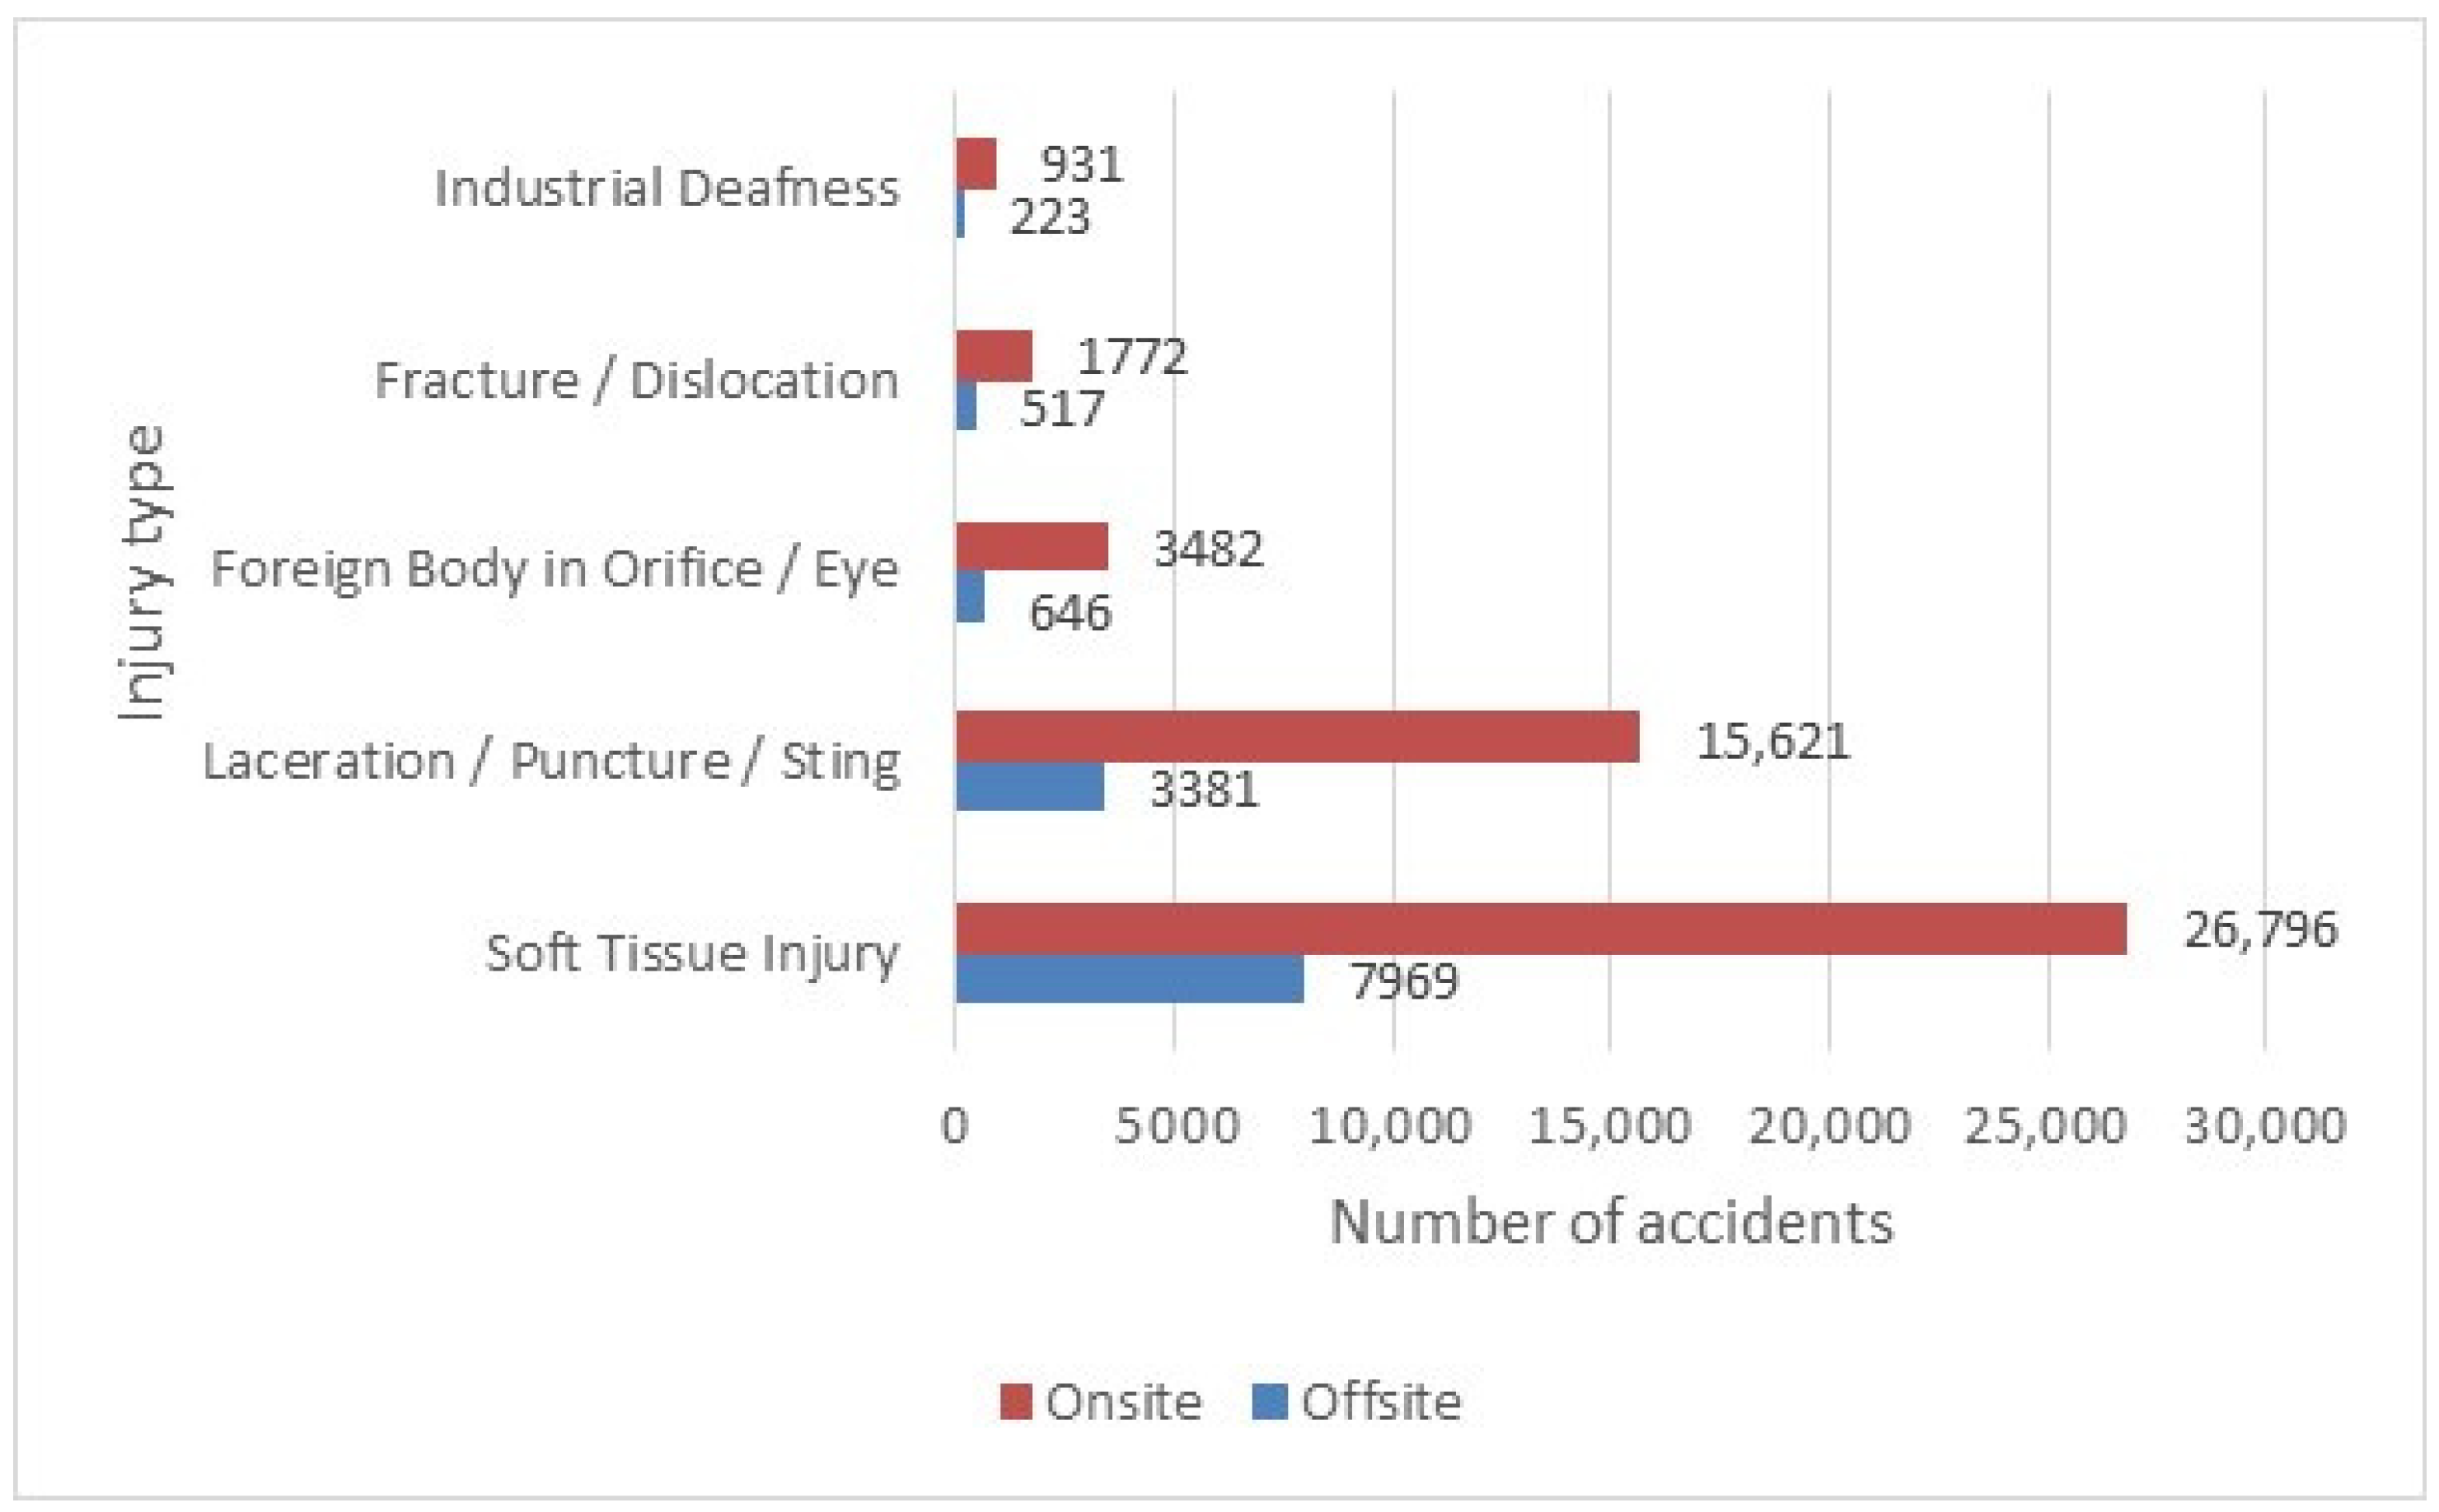
According to Figure 9, injury types of PC in comparison to onsite are three times lower for soft tissue injury, five times for laceration/puncture/sting, five times for foreign body in orifice/eye, three times for fracture/dislocation, and four times for industrial deafness.
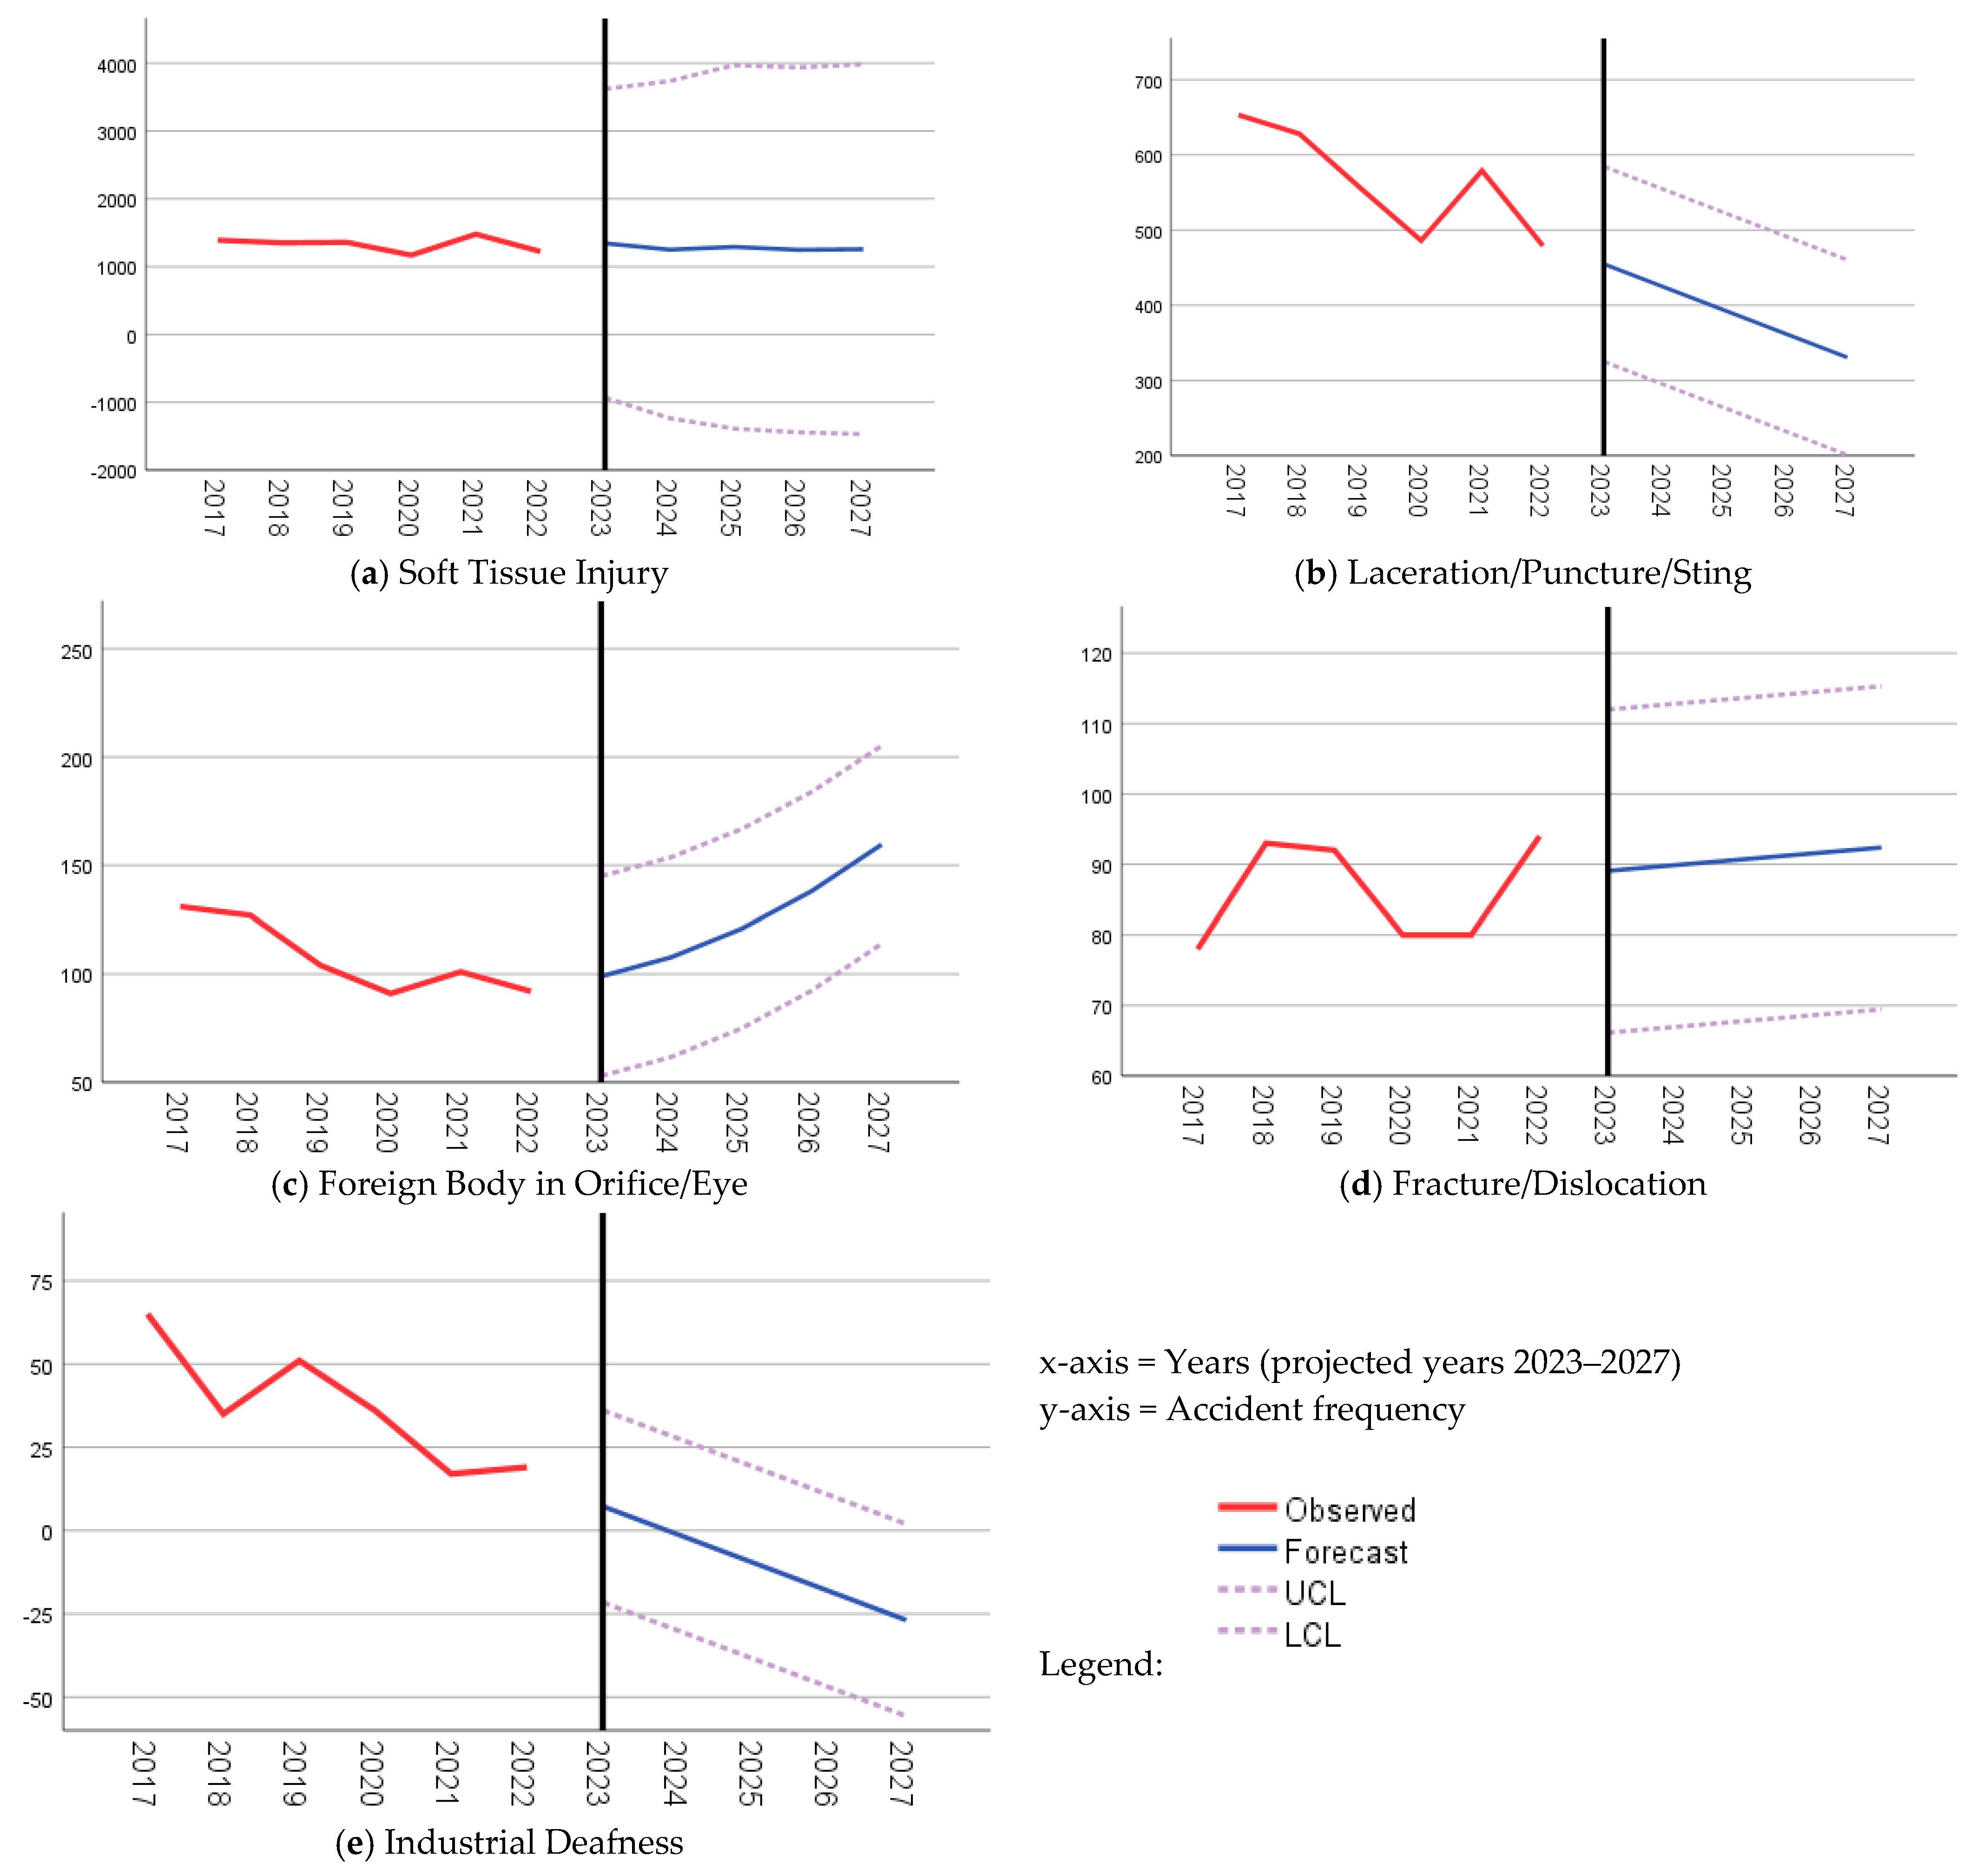
In this section, accident frequency is forecast for the most critical injury types. Table 4 and Figure 10 show the optimized ARIMA models for each classification.
The main trend for injuries are as follows: Soft tissue is somehow steady, but ‘laceration/puncture/sting’ and ‘industrial deafness’ injuries decline. Interestingly, ‘foreign body orifice or eye’ and ‘fracture or dislocation’ most likely increase in the next five years. This indicates the most accidents that happen offsite cause these two types of injuries; this needs serious attention by safety personnel to perform proactive measures.

3.6.2. Causes of Injuries

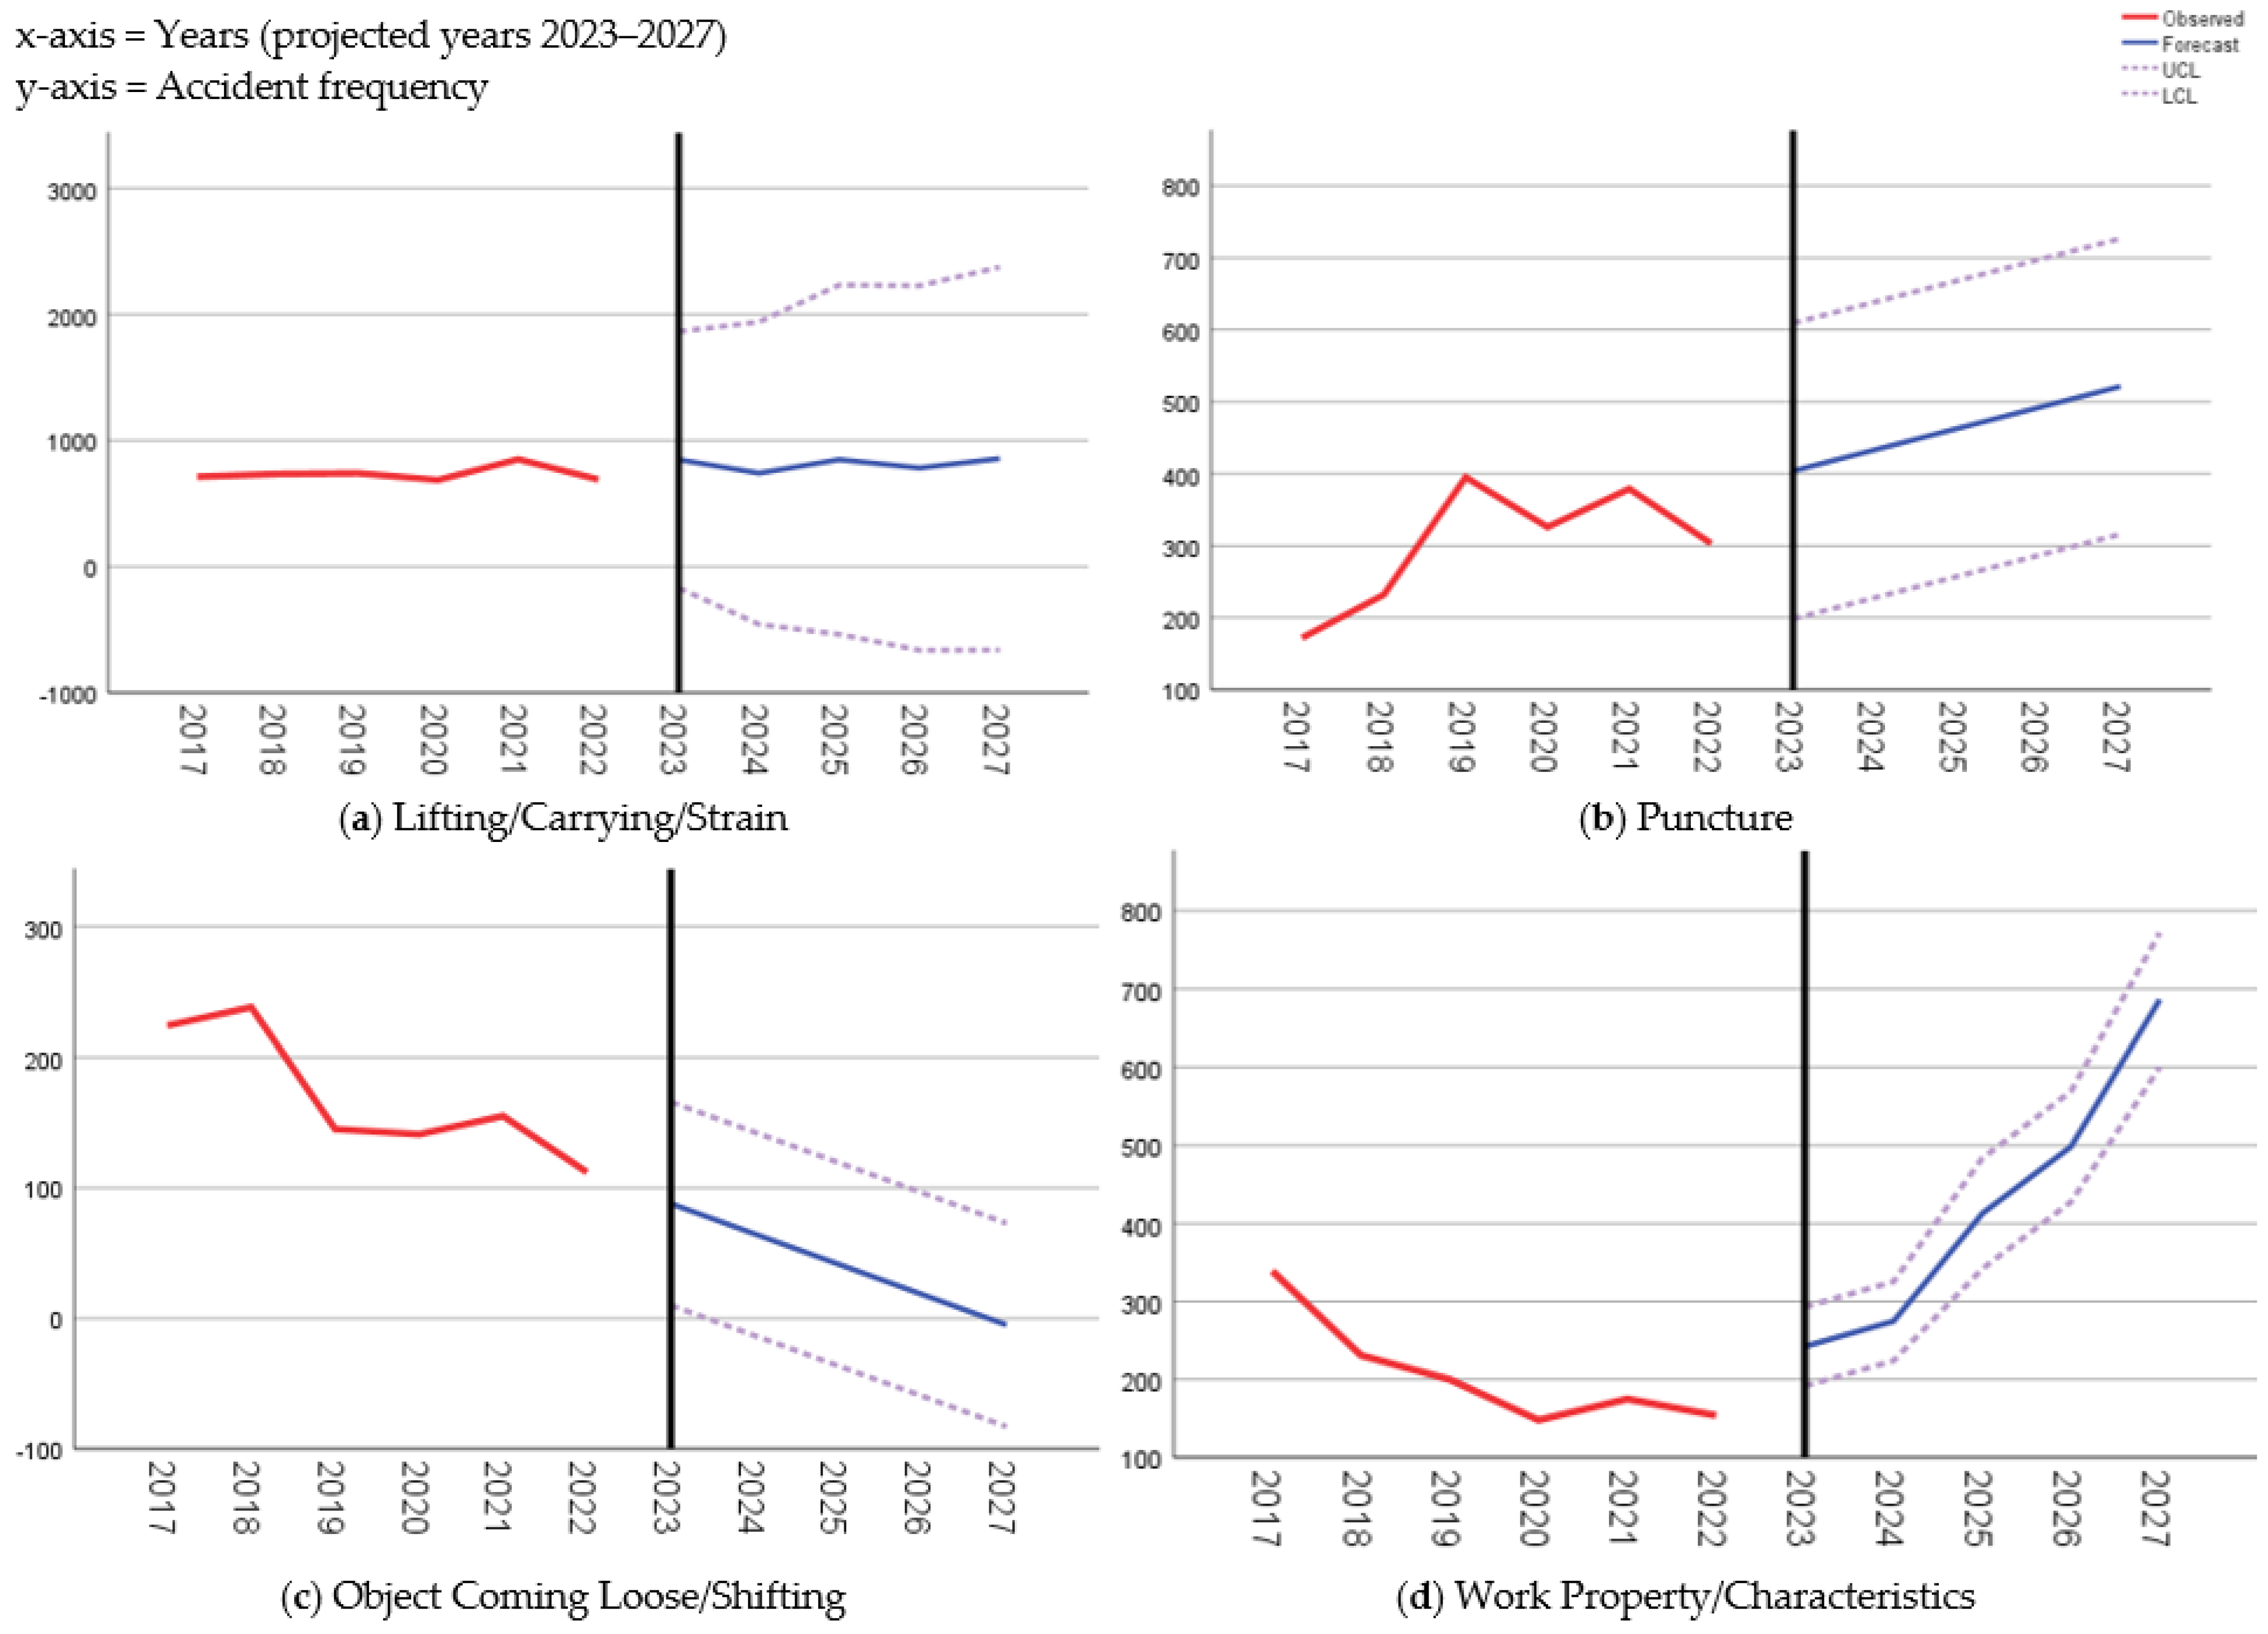
As shown in Figure 11, overall, the most common cause for injury was ‘lifting/carrying/strain’ with 33%, followed by ‘unknown source’ (26%), with the rest in ascending order as ‘puncture’ (13%), ‘loss balance/personal control’ (11%), ‘work property/characteristics’ (9%), and ‘object coming loose/shifting’ (7%). However, in comparison of the weightage of the most common cause of injury from onsite to offsite—referring to Figure 11—it is four times higher for ‘unknown source’ (27%), three times for ‘lifting/carrying/strain’ (24%), five times for ‘puncture’ (16%), four times for ‘loss balance/personal control’ (12%), five times for ‘object coming loose/shifting’ (11%), and four times ‘work property/characteristics’ (10%).
Figure 12 shows the number of accidents under each cause of injury for PCC. The X-axis represents the years, and the y-axis represents the percentages of occurrence. It seems that the top two known causes are similar in both offsite and onsite construction environments. ‘Lifting/carrying/strain’ is relatively more significant for Wood_S, Alum, Metal_S, and Wood_P. Most injuries have no clarity around cause for Conc and Metal_P. The least common cause of injury is ‘object coming loose/shifting’ for Wood_S, Conc, and Alum. However, it is different for Metal_S, with ‘loss balance/personal control’, and Metal_P, with ‘work property/characteristics’. In the last five years, there is a higher fluctuation in accident frequency observed for ‘lifting/carrying/strain’ and ‘puncture’. However, there is a relative decline for ‘work property/characteristics’ and ‘object coming loose/shifting’. Furthermore, there is a slight increasing trend for ‘loss balance/personal control’ for all types of PCC.
Injury causes were modelled with simplistic equations to determine the weightage of each cause under each classification. This helps to determine the recurring causes that lead to accidents, and is also helpful for risk assessment for prefab operations.
Injury cause (Wood_S) = 33 × Lifting/carrying/strain + 15 × Puncture + 10 × Loss balance/personal control + 9 × Work property/characteristics + 8 × Object coming loose/shifting + 25 × Others
Injury cause (Conc) = 22 × Lifting/carrying/strain + 10 × Puncture + 13 × Loss balance/personal control + 11 × Work property/characteristics + 10 × Object coming loose/shifting + 33 × Others
Injury cause (Alum) = 38 × Lifting/carrying/strain + 13 × Puncture + 10 × Loss balance/personal control + 8 × Work property/characteristics + 7 × Object coming loose/shifting + 24 × Others
Injury cause (Metal_S) = 29 × Lifting/Carrying/Strain + 10 × Puncture + 9 × Loss Balance/personal control + 12 × Work property/chararteristics + 17 × Object coming loose/shifting + 25 × Others
Injury cause (Metal_P) = 24 × Lifting/carrying/strain + 14 × Puncture + 12 × Loss balance/personal control + 8 × Work property/characteristics + 13 × Object coming loose/shifting + 30 × Others
Injury cause (Wood_P) = 30 × Lifting/carrying/strain + 15 × Puncture + 13 × Loss balance/personal control + 7 × Work property/characteristics + 22 × Object coming loose/shifting + 30 × Others
In this section, accident frequency is forecast for the injury causes. Table 5 and Figure 13 show the optimized ARIMA models for each injury cause.
The main trend is that ‘object coming loose/shifting’ is declining, but the rest are somehow increasing. Understanding of causes of accidents helps in the identification of safety risks associated to activities involved in PC [24]. Furthermore, workforce awareness of potential causes leading to the accidents can help avoid hazardous situations.

3.6.3. Injury Prior Activity

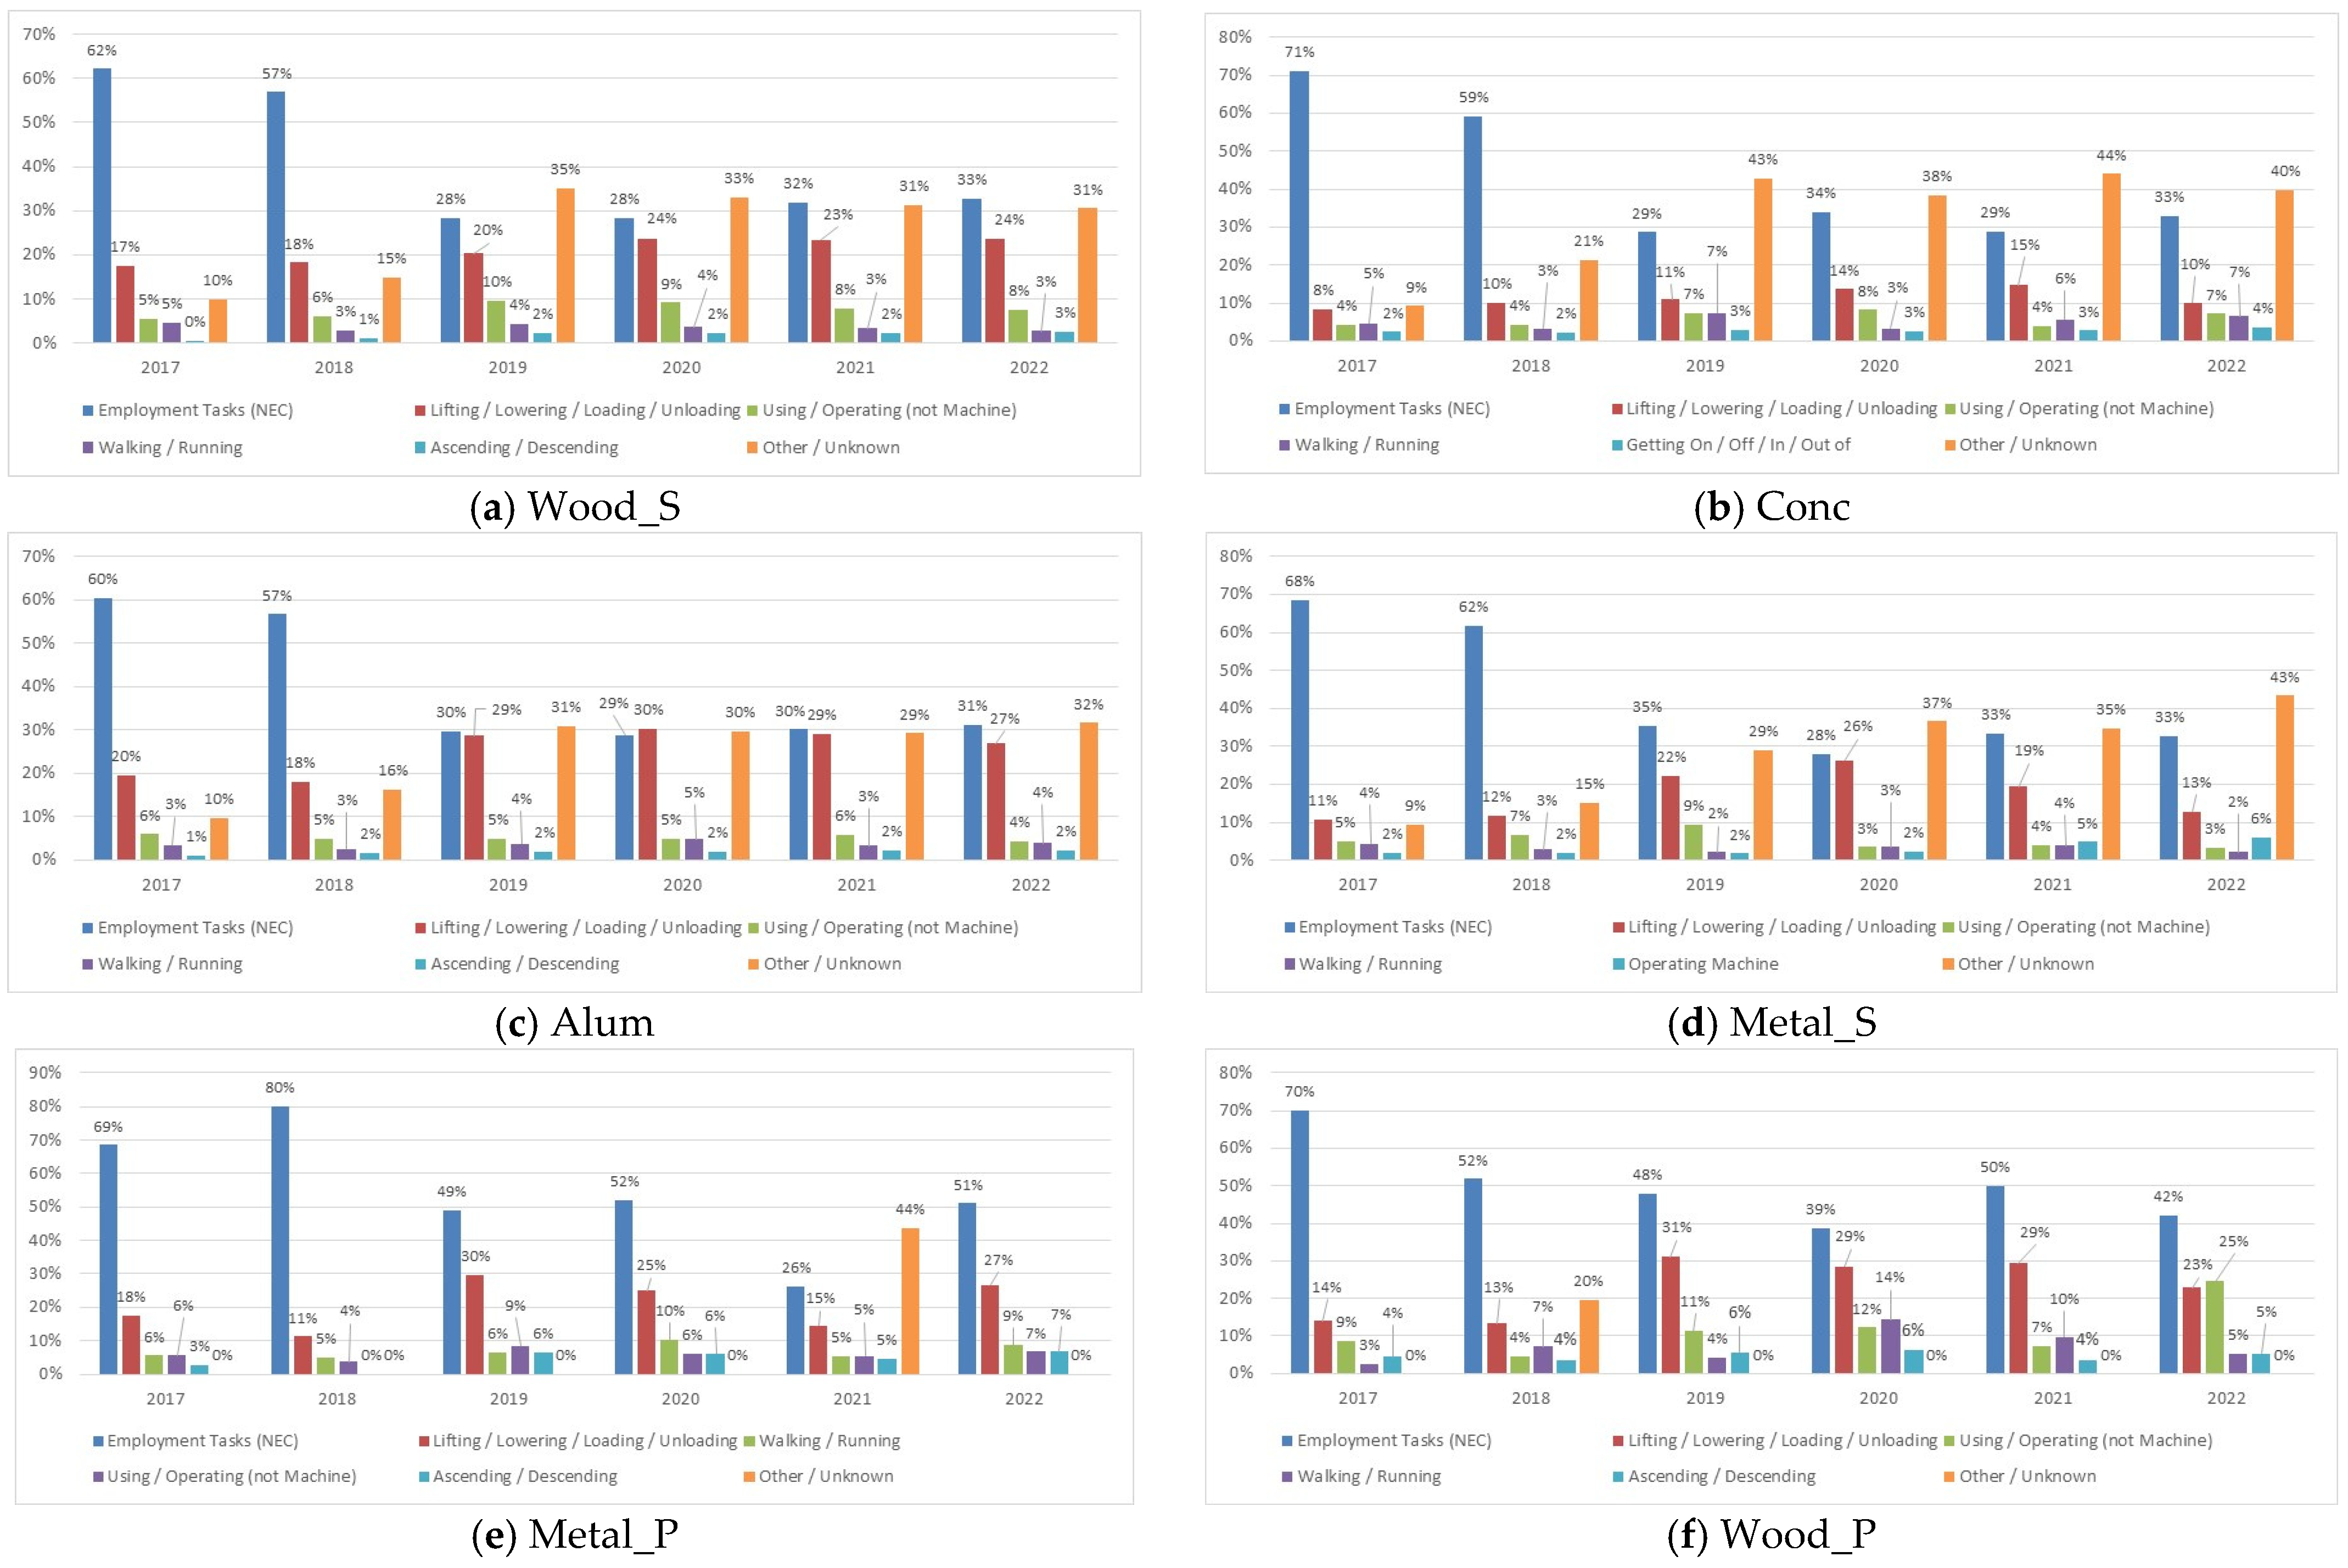
Figure 14 shows the number of accidents under prior activity to cause injury in PCC. The X-axis represents the years and the y-axis represents the percentages of occurrence. Overall, the most common prior activities to cause injury is ‘employment tasks’ (44%), followed by ‘lifting/lowering/loading/unloading’ (21%) and ‘unknown’ (21%). Interestingly, the remaining are less than 11%. Overall, ‘employment tasks’ is the most common prior activity in all type of PCC (business classification). However, ‘unknown’ surpasses the rest, indicating the lack of clarity around reporting the injury. Only the prior activity of ‘getting on/off/in/out of’ is associated with Conc. A huge gap has been observed in ‘employment tasks’ (54%) in comparison to the other prior activities for Metal_P. In the last five years, declines have been observed for ‘employment tasks’ and ‘walking/running’, but a slight increase was observed in ‘lifting/lowering/loading/unloading’ and ‘ascending/descending’. There is more variation in ‘using/operating (no machine)’ as a prior activity. Understanding of injury through prior activity and associated risks determination is essential for safety assessment [21].
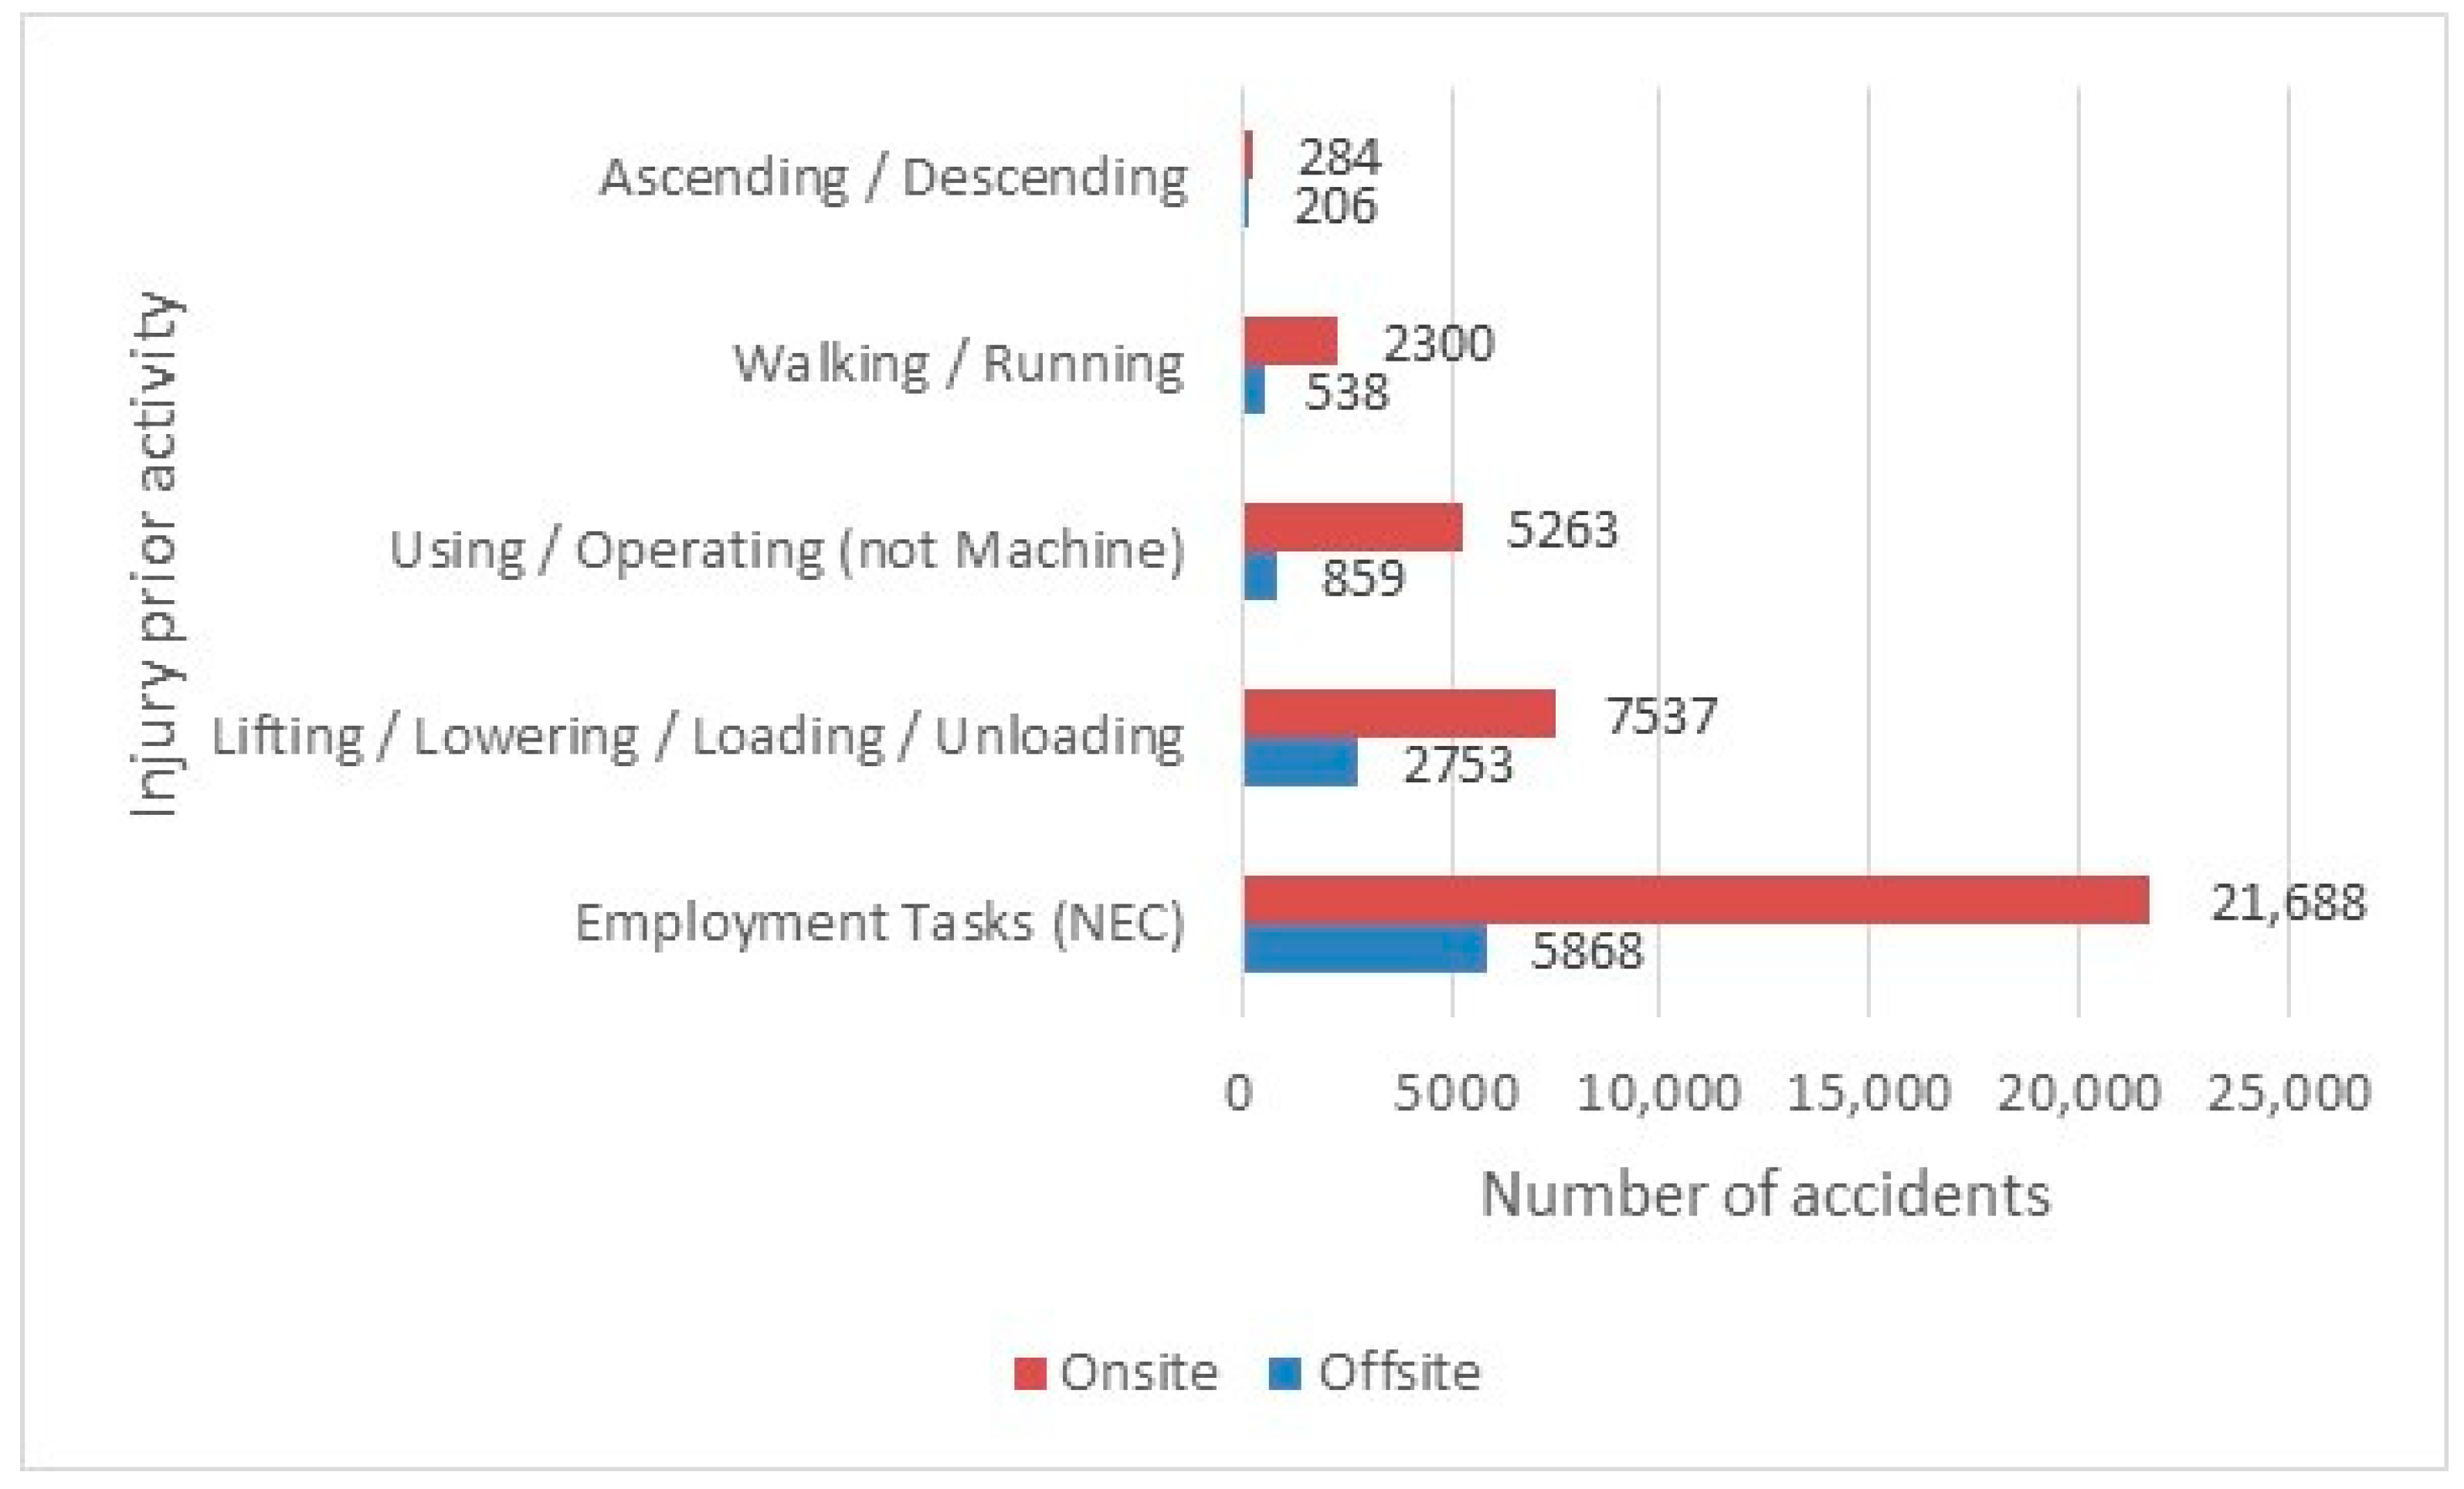
According to Figure 15, in comparison to onsite construction, ‘employment tasks’ (39%) are relatively lower, as well as workers involved in ‘lifting/lowering/loading/unloading’ (14%) and ‘using/operating (no machine)’ (10%). This indicates using tools and plants are relatively safer in an offsite construction environment. However, for the ‘unknown’ (21%) category, prior activities are more frequent. Offsite, four times fewer accidents were reported for ‘employment task’, three times for ‘lifting/lowering/loading/unloading’, six times for ‘using/operating (not machine)’, four times for ‘walking/running’, but were almost similar for ‘ascending/descending’.
Injury prior activities were modelled with simplistic equations to determine the weightage of each prior activity under each classification. This helps to determine the critical prior activities to accidents, and is useful to design work methods, manage, and schedule activities.
Injury prior activity (Wood_S) = 40 × Employment tasks + 21 × Lifting/lowering/loading/unloading + 8 × Using/operating + 4 × Walking/running + 4 × Ascending/descending + 26 × Other
Injury prior activity (Conc) = 44 × Employment tasks + 11 × Lifting/lowering/loading/unloading + 6 × Using/operating + 5 × Walking/running + 3 × Getting on/off/in/out of + 31 × Other
Injury prior activity (Alum) = 40 × Employment tasks + 25 × Lifting/lowering/loading/unloading + 5 × Using/operating + 4 × Walking/running + 2 × Ascending/descending + 24 × Other
Injury prior activity (Metal_S) = 44 × Employment tasks + 17 × Lifting/lowering/loading/unloading + 5 × Using/operating + 3 × Walking/running + 3 × Operating machine + 28 × Other
Injury prior activity (Metal_P) = 54 × Employment tasks + 19 × Lifting/lowering/loading/unloading + 6 × Using/operating + 6 × Walking/running + 4 × Ascending/descending + 11 × Other
Injury prior activity (Wood_P) = 53 × Employment tasks + 21 × Lifting/lowering/loading/unloading + 10 × Using/operating + 7 × Walking/running + 5 × Ascending/descending + 5 × Other
In this section, accident frequency is forecast for the injury prior activity. Table 6 and Figure 16 show the optimized ARIMA models for each prior activity.
The main trend is that ‘using/operating (not machine)’ is declining, but the rest are somehow increasing, except for ‘lifting/lowering/loading/unloading’, which has relatively steady trend. ‘Employment task (not classified elsewhere)’ is the most critical, having a somehow gradual increase in the next five years. This highlights the need for standard operating procedures to be strictly followed. There is no model for ‘Walking/running’ and ‘Getting on/off/in/out of’, as all models have negative R2.

3.6.4. Primary Injury Site

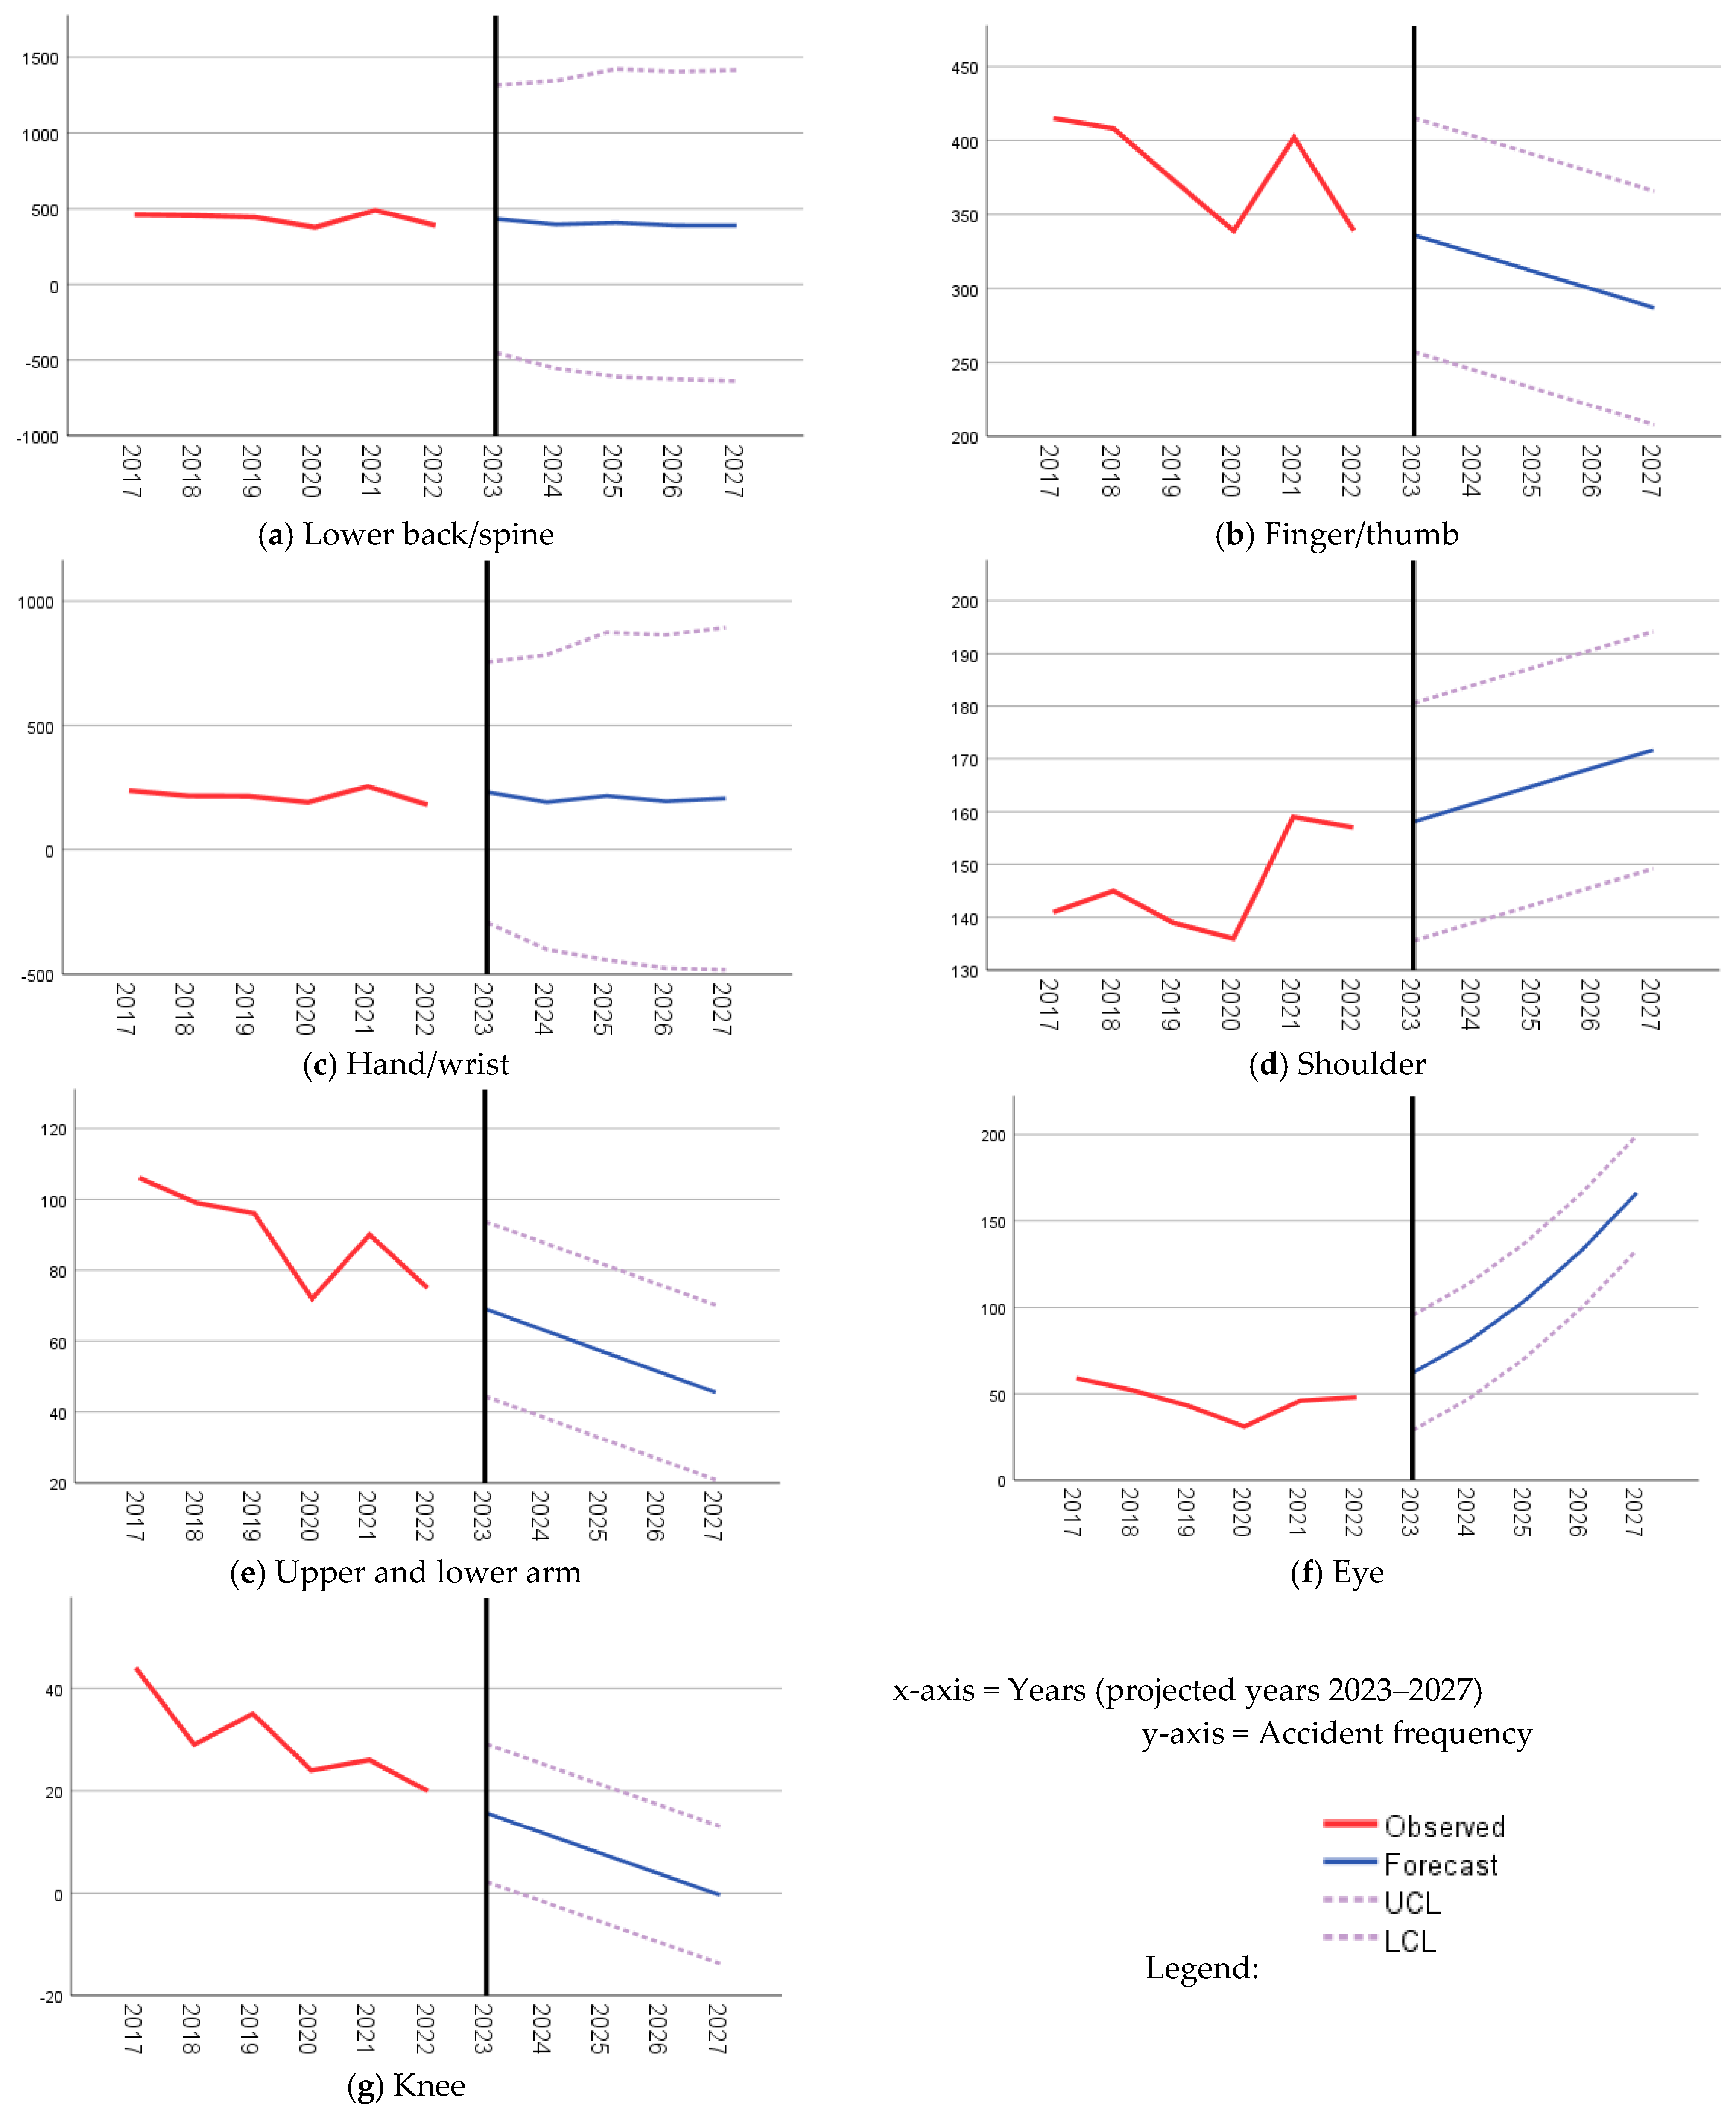
Figure 17 shows the number of accidents under injury site (location on human body) for PCC. The X-axis represents the years, and the y-axis represents the percentages of occurrence. There are around 41% unknown injury sites reported in the last five years. Otherwise, top injury sites, in ascending order, are ‘lower back/spine’ (19%), ‘finger/thumb’ (17%), ‘hand/wrist’ (10%), ‘shoulder’ (6%), ‘upper and lower arm’ (4%), ‘eye’ (2%) and ‘knee’ (1%). ‘Shoulder’ injury is only associated with Alum, Wood_S, Metal_S, and Metal_P in ascending order. ‘Eye’ injury is associated with Metal_S, Metal_P, Wood_P, and Conc in ascending order. ‘Knee’ injury is only associated with Conc and Wood_P. ‘Upper and lower arm’ injury is only associated with Wood_S and Alum in ascending order. Overall, in last five years, there is decline in ‘finger/thumb’, ‘eye’, ‘upper and lower arm’, and ‘knee’; ‘hand/wrist’ and ‘shoulder’ injuries slightly increased over this period. ‘Lower back/spine’ is relatively less fluctuating than the ‘unknown’ category.
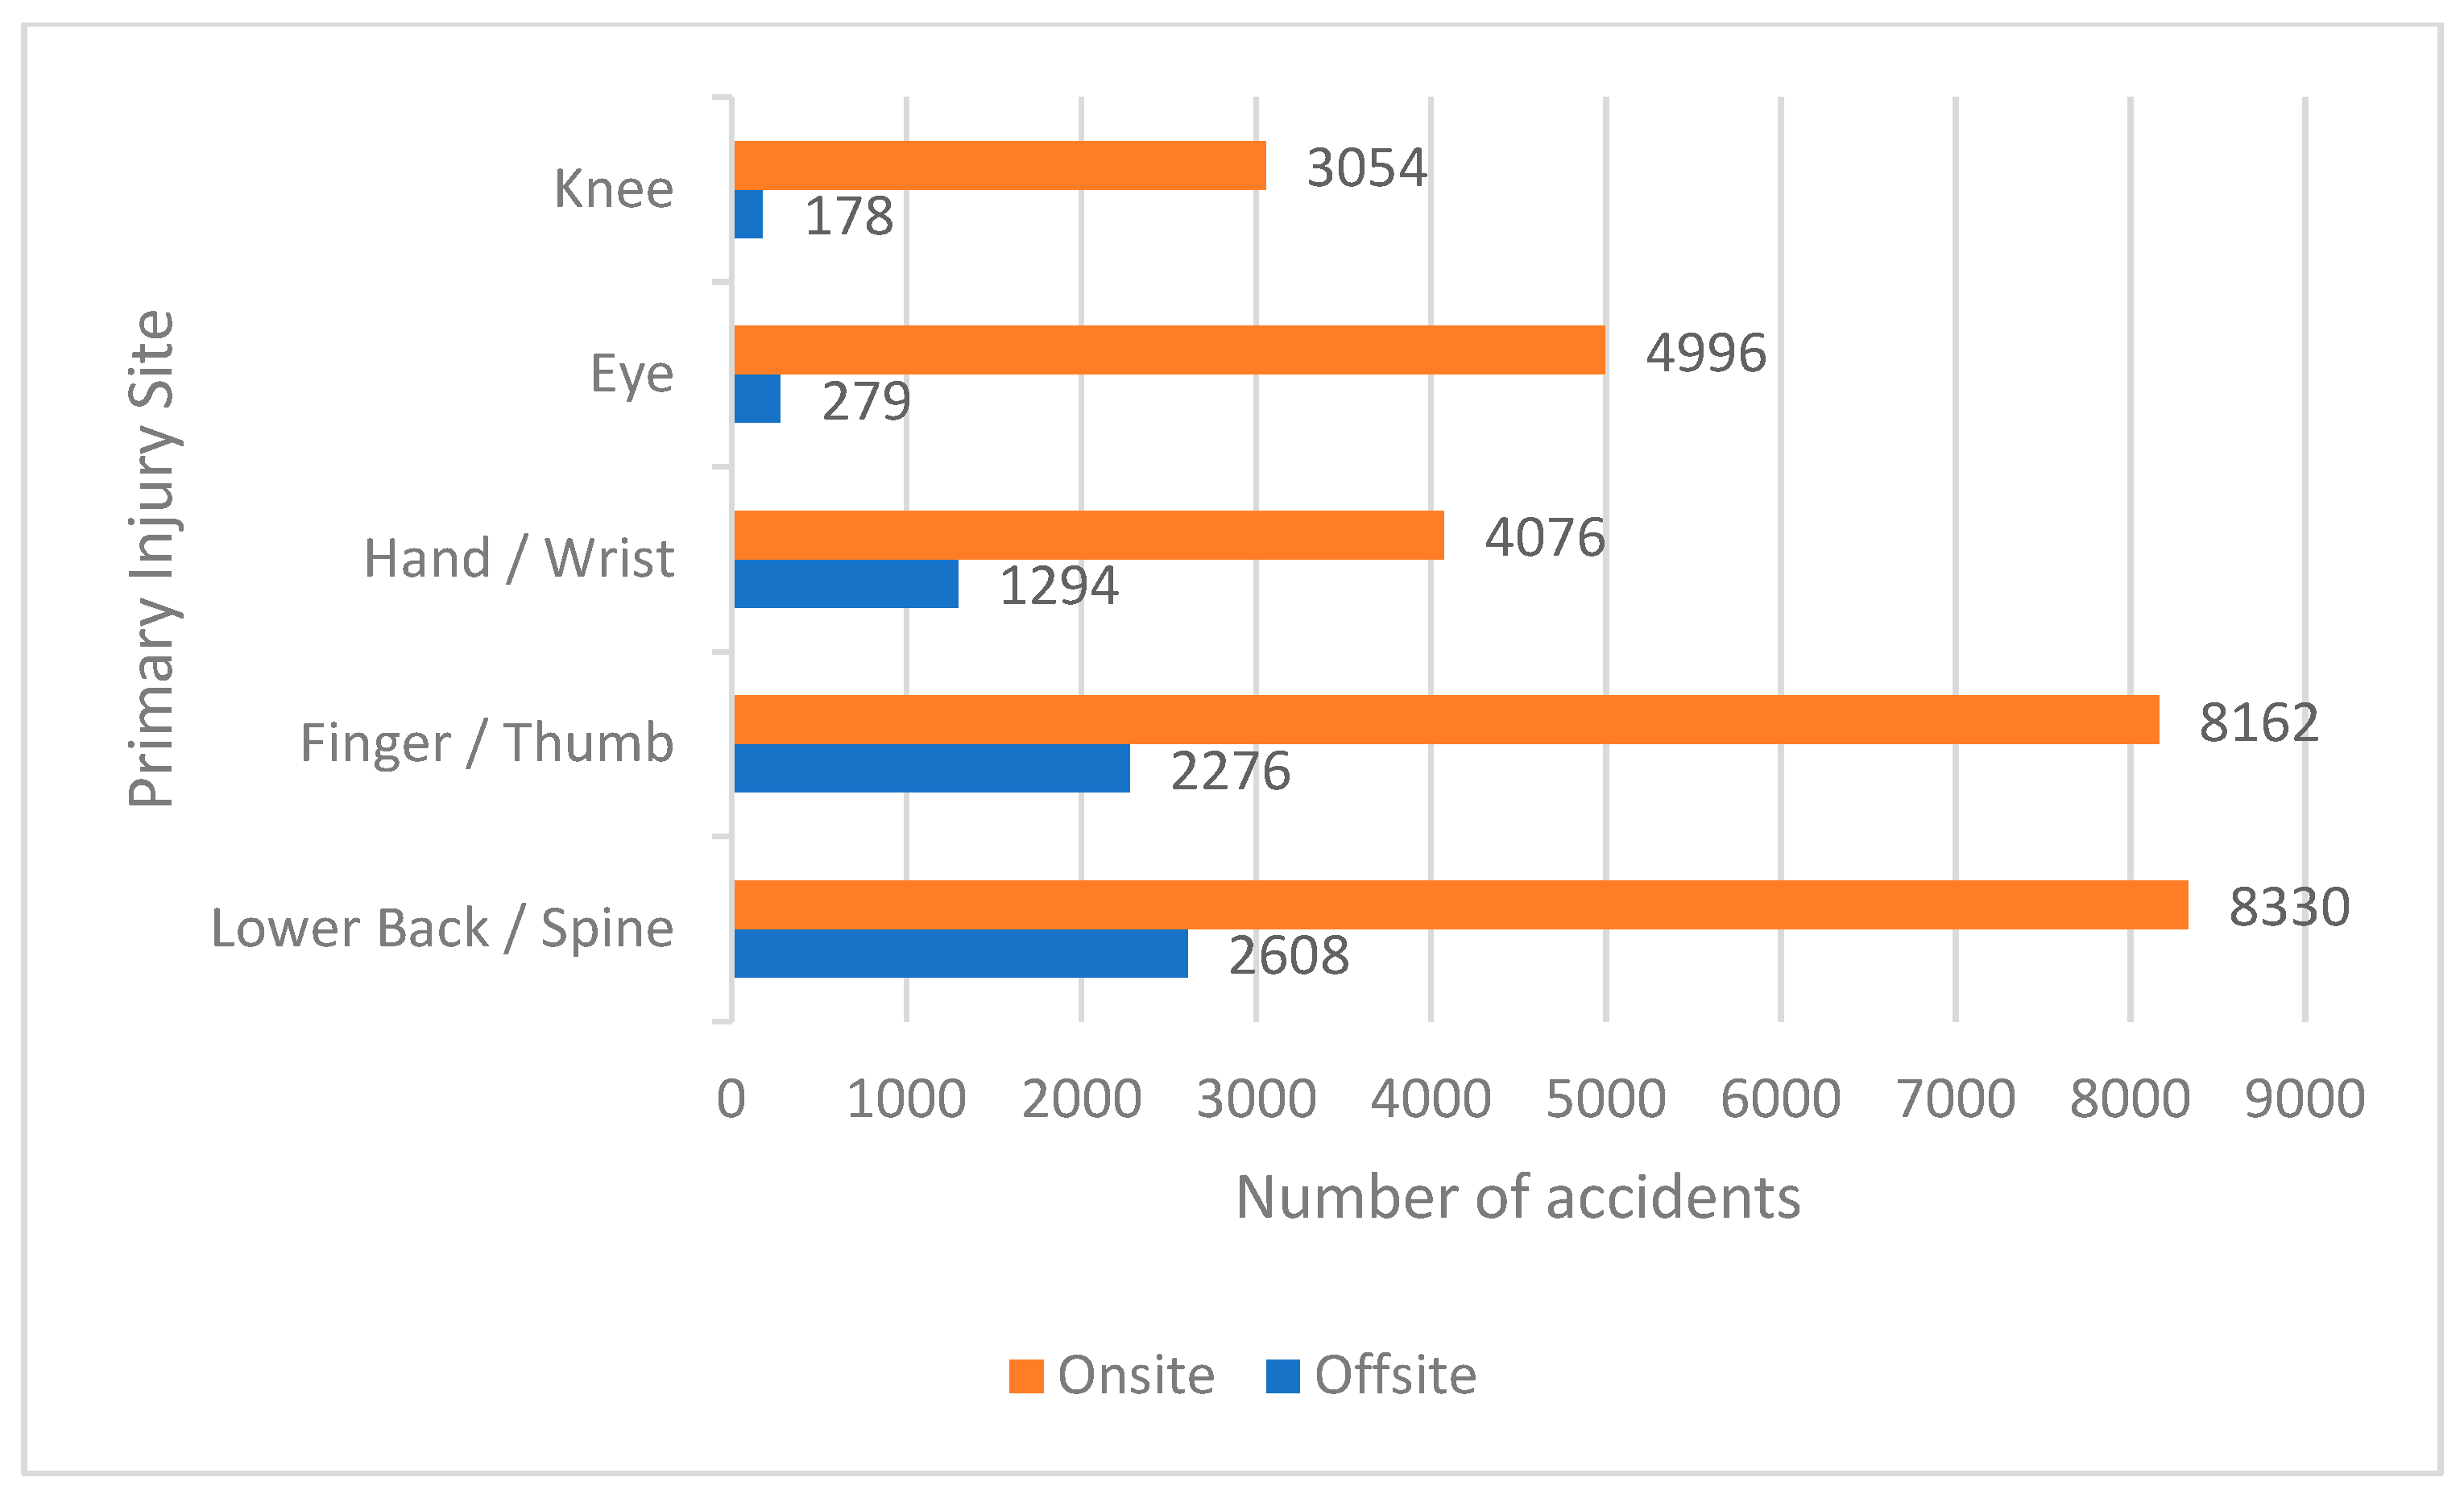
Figure 18 shows a comparison between offsite and onsite. The top two injury sites are similar, but the rest vary, such as ‘lower back/spine’ (16%), ‘finger/thumb’ (16%), ‘eye’ (10%), ‘hand/wrist’ (8%), ‘knee’ (6%), and ‘unknown’ (45%). Lower back/spine is three times, finger/thumb is five times, hand/wrist is three times, eye is eighteen times, and knee is seventeen times higher compared to onsite. It seems offsite workers are more prone to obtain injuries on ‘shoulder’ and ‘upper and lower arm’, but are less likely to obtain an ‘eye’ injury. However, they are more likely to obtain ‘lower back/spine’ injuries, which indicates poor ergonomics in an offsite working environment. Interestingly, ear location is more vulnerable offsite.
Injury sites were modelled with simplistic equations to determine the weightage of each site under each classification. This helps to determine the critical sites of accidents and is useful for ergonomics.
Injury site (Wood_S) = 20 × Lower back/spine + 19 × Finger/thumb + 10 × Hand/wrist + 7 × Shoulder + 6 × Upper and lower arm + 39 × Other
Injury site (Conc) = 17 × Lower back/spine + 14 × Finger/thumb + 9 × Hand/wrist + 7 × Eye + 6 × Knee + 47 × Other
Injury site (Alum) = 20 × Lower back/spine + 15 × Finger/thumb + 10 × Hand/wrist + 10 × Shoulder + 6 × Upper and lower arms + 40 × Other
Injury site (Metal_S) = 18 × Lower back/spine + 14 × Finger/thumb + 10 × Eye + 9 × Hand/wrist + 7 × Shoulder + 40 × Other
Injury site (Metal_P) = 16 × Lower back/spine + 16 × Finger/thumb + 9 × Eye + 9 × Hand/wrist + 7 × Shoulder + 42 × Other
Injury site (Wood_P) = 18 × Lower back/spine + 19 × Finger/thumb + 9 × Eye + 8 × Hand/wrist + 8 × Knee + 37 × Other
In this section, accident frequency is forecast for the injury sites. Table 7 and Figure 19 show the optimized ARIMA models for each injury site.
The main trend is that ‘finger/thumb’, ‘upper and lower arm’, and ‘knee’ are declining, but ‘lower back/spine’ and ‘hand/wrist’ are somehow steady. However, ‘shoulder’ and ‘eye’ have an increasing trend. The Workforce in offsite construction needs to use proper personal protective equipment such as a body harness and eye protection to avoid injuries.

4. Conclusions

This is a pioneer study to model PCS based on accident frequency from 2017–2022 in a New Zealand context. The modelling for PCS is simplistic as well predictive driven from accident frequency.
The simplistic modelling covers the accident index, accident frequency rate, and elemental safety.
  • The accident index has been relatively steady over the years for offsite in comparison to onsite. However, it was found that the workforce offsite has a 0.9 times chance while onsite has a 3.4 times chance to encounter accident situations at any hour of the day at workplaces.
  • The accident frequency rate is almost twice as high as for offsite in comparison to onsite due to a smaller workforce.
  • The ranking of the top business classifications by cost of safety, in ascending order, is Wood_S, Conc, Alum, and Metal_S. It was found the cost of safety for offsite is almost a third of the onsite cost.
  • The most vulnerable occupations across all business classifications are ‘carpenters and joiners’, ‘labourers’, and ‘building and related workers’. However, the situation somehow varies for individual business classifications. Furthermore, the weightage of accidents for each occupation was determined under each classification. Interestingly, it was found that the occupations ‘carpenters and joiners’ and ‘labourers’ are safer offsite.
  • The most common types of injuries offsite are ‘soft tissue’ and ‘laceration/puncture/sting’. However, multiple injury types are associated with business classifications. Furthermore, the weightage of injury types for each occupation was determined under each classification.
  • The most common injury cause is ‘lifting/carrying/strain’, but less than half are associated with other causes. All injury causes offsite range from three to five times lower than that of onsite. Furthermore, the weightage of injury causes was determined under each classification.
  • The most common prior activities to encountering injuries are ‘employment task’ and ‘lifting/lowering/loading/unloading’. Injury prior activities offsite range from three to six times lower that for onsite. Furthermore, the weightage of prior activity to injury for each occupation was determined under each classification.
  • Primary injury sites on the human body are ‘lower back/spine’ and ‘finger/thumb’. However, the trend varies for other business classification types. Interestingly, primary injury sites offsite range from three to eighteen times lower than that for onsite for all types. Furthermore, the weightage of primary injury sites for each occupation was determined under each classification.
Simplistic modelling is applied to understand the nature and criticality of the accidents. This knowledge is potentially used in the strategic orientation of current and new companies regarding H&S. Furthermore, accident information helps in project planning and risk management.
In predictive modelling, the current and future accident frequency trends were determined and forecasted, respectively.
  • Accidents are predicted to increase in companies for Alum, and Wood_P, but there will be a decline for Wood_S, Conc, and Metal_S. However, Metal_P will somehow remain steady. Overall, offsite will most likely see a gradual decrease, but onsite will have a fluctuating increase.
  • The most vulnerable occupations have an increasing trend for ‘sheet metal workers’ under Metal_S and ‘carpenters and joiners’ under Wood_P. However, three of the occupations will likely decline, such as ‘carpenters and joiners’ under Wood_S, ‘operators’ under Conc, and ‘building and related workers’ under Alum. Interestingly, the ‘labourer’ under Metal_P will be steady.
  • There is an increasing trend for injury types for ‘foreign body orifice or eye’ and ‘fracture or dislocation’. However, there will likely be a decline in ‘laceration/puncture/sting’ and ‘industrial deafness’, but ‘soft tissue’ will be steady.
  • Injury causes most likely to increase are ‘lifting/carrying/strain’, ‘puncture’, and ‘work property/characteristics’, but there will be a decline for ‘object coming loose or shifting’.
  • Prior activities to critical injuries likely to be more common are ‘employment task’ and ‘ascending or descending’. However, a steady trend has been observed for ‘lifting/lowering/loading/unloading’, and a decline in ‘using or operating’.
  • The trending primary injury sites for the next five years are ‘shoulder’ and ‘eye’. However, there will likely be a decline for ‘finger/thumb’, ‘upper and lower arm’ and ‘knee’, but ‘lower back/spine’ and ‘hand/wrist’ are somehow steady.
The forecasting of accidents potentially helps companies to identify the critical aspects of working conditions. Companies providing H&S consultancy take advantage of this to design their services and training. Policymakers can use this information to define the policy at the organization, industry, and national levels to make the PCC safer, which leads to innovative and smart construction to address productivity issues. There are few limitations associated with this study. The data was sourced from the ACC in New Zealand, for the period of 2017–2022, and the analysis was conducted based on the selected data. Data interpretation is contextual and related to the provided data for selected PCC classifications. However, there is the possibility to associate other classifications with PC. Similarly, in this study, onsite construction is linked with house construction and carpentry services. However, other classifications such as non-residential construction is possibly included. Available data are constrained to the last five years from 2017–2022. However, simplistic, and predictive modelling can potentially be enhanced with more data.
There is the potential to compare the accident records with other OECD countries to understand the PCS dynamics. The current study is a foundation for PCS research in New Zealand. The presented ARIMA models for forecasting could be potentially verified with extended data over the years. Researchers can utilize the findings to develop hypotheses to address research problems and improve PCS. Furthermore, this study is helpful for PCCs to develop safety policies and strategies. This study is useful for regulatory bodies to understand the criticality of the PCS and enhance the regulations, standards, and guidelines. This study is helpful for PCC companies to manage the safety risk, which is essential in managing the PC business on a long term basis.

Supplementary Materials

The following supporting information can be downloaded at: https://www.mdpi.com/article/10.3390/app14041629/s1. SPSS analysis for ARIMA Models is provided.

Funding

This research received no external funding. The APC was funded by Bożena Hoła.

Institutional Review Board Statement

Not applicable.

Data Availability Statement

Data were requested under Official Information Act 1982. Reference: GOV-020873, CRM: 0190635. Further inquiries can be directed to the corresponding author.

Acknowledgments

The author acknowledges the data provided by the Accident Compensation Corporation through an official information request.

Conflicts of Interest

The author declares no conflicts of interest.

Abbreviations

ACCAccident compensation corporation
AlumArchitectural aluminium product manufacturing
ARIMAAutoregressive integrated moving average
BICBayesian information criterion
ConcConcrete product manufacturing
H&SHealth and Safety
MAEMean absolute error.
MAPEMean absolute percentage error.
Metal_SStructural metal product manufacturing
Metal_PPrefabricated metal building manufacturing
OSHAOccupational Safety and Health Administration
PCPrefabricated Construction
PCCPrefabricated Construction Company
PCSPrefabricated construction safety
R2R-squared
RMSERoot mean square error
SPSSStatistical Package for the Social Sciences
Wood_PPrefabricated wooden building manufacturing.
Wood_SWooden structural fittings and components manufacturing.
WDCWorkforce Development Council

References

  1. Shahzad, W.M.; Reddy, S.M.; Kahandawa, R.; Rotimi, J.O.B. Benefits, constraints and enablers of modular offsite construction (MOSC) in New Zealand high-rise buildings. Eng. Constr. Archit. Manag. 2023. [Google Scholar] [CrossRef]
  2. Ahn, S.; Crouch, L.; Kim, T.W.; Rameezdeen, R. Comparison of worker safety risks between onsite and offsite construction methods: A site management perspective. J. Constr. Eng. Manag. 2020, 146, 05020010. [Google Scholar] [CrossRef]
  3. Masood, R.; Roy, K. Review on Prefabricated Building Technology. Technology 2022, 4, 24–30. [Google Scholar] [CrossRef]
  4. Simukonda, W.; Emuze, F. An offsite construction scoping study for occupational health and safety. IOP Conf. Ser. Earth Environ. Sci. 2022, 1101, 032015. [Google Scholar] [CrossRef]
  5. Shahzad, W.; Rasheed, E. H & S case for prefab. Build 2019, 170, 70. [Google Scholar]
  6. Odo, N.; Rankin, J. Quantifying Safety in Off-site Construction. IOP Conf. Ser. Earth Environ. Sci. 2022, 1101, 042018. [Google Scholar] [CrossRef]
  7. Pahuja, M.; Shahzad, W.M. Health and safety outlook of offsite construction (OSC). In Proceedings of the 7th New Zealand Built Environment Research Symposium, Auckland, New Zeland, 17–18 February 2022; p. 237. [Google Scholar]
  8. Guo, B.H.; Weston, R.; Jianphinitnan, P.; Liu, W.; Scheepbouwer, E.; van der Walt, D.; Goh, Y.M. A regulatory perspective on safety in design practices in New Zealand. Saf. Sci. 2021, 141, 105352. [Google Scholar] [CrossRef]
  9. Pashorina-Nichols, V. Occupational health and safety: Why and how should worker participation be enhanced in New Zealand? N. Z. J. Employ. Relat. 2016, 41, 71–86. [Google Scholar]
  10. Masood, R.; Roy, K.; Gozález, V.A.; Lim, J.B.P.; Nasir, A.R. A supply chain perspective of prefabricated housebuilding diffusion in New Zealand. Eng. Constr. Archit. Manag. 2023; ahead of printing. [Google Scholar] [CrossRef]
  11. Masood, R.; Lim, J.B.P.; González, V.A.; Roy, K.; Khan, K.I.A. A Systematic Review on Supply Chain Management in Prefabricated House-Building Research. Buildings 2022, 12, 40. [Google Scholar] [CrossRef]
  12. Masood, R.; Lim, J.B.P.; Gonzalez, V.A. Performance of the Supply Chains for New Zealand Prefabricated house-building. Sustain. Cities Soc. 2021, 64, 102537. [Google Scholar] [CrossRef]
  13. Mohandes, S.R.; Abdelmageed, S.; Hem, S.; Yoo, J.S.; Abhayajeewa, T.; Zayed, T. Occupational Health and Safety in Modular Integrated Construction projects: The case of crane operations. J. Clean. Prod. 2022, 342, 130950. [Google Scholar] [CrossRef]
  14. Masood, R.; Roy, K.; Gonzalez, V.A.; Lim, J.B.; Nasir, A.R. Modeling relational performance of the supply chains for prefabricated housebuilding in New Zealand. Smart Sustain. Built Environ. 2023; ahead of printing. [Google Scholar] [CrossRef]
  15. Rotimi, F.E.; Almughrabi, F.M.; Samarasinghe, D.A.S.; Silva, C. Specific skill requirements within prefabricated residential construction: Stakeholders’ perspectives. Buildings 2022, 12, 43. [Google Scholar] [CrossRef]
  16. Lamm, F.; Massey, C.; Perry, M. Is there a link between workplace health and safety and firm performance and productivity? N. Z. J. Employ. Relat. 2006, 32, 75–90. [Google Scholar]
  17. Lingard, H.; Holmes, N. Understandings of occupational health and safety risk control in small business construction firms: Barriers to implementing technological controls. Constr. Manag. Econ. 2001, 19, 217–226. [Google Scholar] [CrossRef]
  18. Franks, E. Safety and Health in Prefabricated Construction: A New Framework for Analysis, in Department of Construction Management. Master’s Thesis, University of Washington, Washington, DC, USA, 2018. [Google Scholar]
  19. Fard, M.M.; Terouhid, S.A.; Kibert, C.J.; Hakim, H. Safety concerns related to modular/prefabricated building construction. Int. J. Inj. Control. Saf. Promot. 2017, 24, 10–23. [Google Scholar] [CrossRef] [PubMed]
  20. McKay, L.J. The Effect of Offsite Construction on Occupational Health and Safety. Ph.D. Thesis, Loughborough University, Loughborough, UK, 2010. [Google Scholar]
  21. Odo, N.T.; Rankin, J.H. Process evaluation of construction methods to quantify safety. In Proceedings of the 2022 Modular and Offsite Construction (MOC) Summit, Edmonton, AB, Canada, 27–29 July 2022; pp. 185–192. [Google Scholar]
  22. Lu, C.; Wang, J. Analysis on safety-affecting factors of prefabricated construction projects with Dematel-ISM. In Proceedings of the International Conference on Construction and Real Estate Management, Stockholm, Sweden, 24–25 August 2020; American Society of Civil Engineers: Reston, VA, USA, 2020; pp. 808–814. [Google Scholar]
  23. Song, L.; Li, H.; Deng, Y.; Li, C. Understanding Safety Performance of Prefabricated Construction Based on Complex Network Theory. Appl. Sci. 2022, 12, 4308. [Google Scholar] [CrossRef]
  24. Jin, Y.; Zhang, J.; Sun, L. Safety risk assessment of prefabricated building construction based on bayesian network. IOP Conf. Ser. Earth Environ. Sci. 2019, 371, 032052. [Google Scholar] [CrossRef]
  25. Fang, C.; Zhong, C.; Zhang, Y. Risk assessment of construction safety of prefabricated building hoisting based on cloud model-entropy method. Int. J. Comput. Appl. Technol. 2022, 70, 233–243. [Google Scholar] [CrossRef]
  26. Junjia, Y.; Alias, A.H.; Haron, N.A.; Bakar, N.A. Identification and analysis of hoisting safety risk factors for IBS construction based on the AcciMap and cases study. Heliyon 2024, 10, e23587. [Google Scholar] [CrossRef]
  27. Shen, Y.; Xu, M.; Lin, Y.; Cui, C.; Shi, X.; Liu, Y. Safety Risk Management of Prefabricated Building Construction Based on Ontology Technology in the BIM Environment. Buildings 2022, 12, 765. [Google Scholar] [CrossRef]
  28. Fagbenro, R.K.; Sunindijo, R.Y.; Illankoon, C.; Frimpong, S. Influence of prefabricated construction on the mental health of workers: Systematic review. Eur. J. Investig. Health Psychol. Educ. 2023, 13, 345–363. [Google Scholar] [CrossRef] [PubMed]
  29. Jeong, G.; Kim, H.; Lee, H.-S.; Park, M.; Hyun, H. Analysis of safety risk factors of modular construction to identify accident trends. J. Asian Archit. Build. Eng. 2022, 21, 1040–1052. [Google Scholar] [CrossRef]
  30. McKay, L.J.; Gibb, A.; Haslam, R.; Pendlebury, M. Health and Safety Management of Offsite Construction—How Close Are We to Production Manufacturing? Rethinking and Revitalizing Construction Safety, Health, Environment and Quality. In Proceedings of the 4th Triennial International Conference, Gqeberha, South Africa, 17–20 May 2005; pp. 432–441. [Google Scholar]
  31. Offsite, N.Z. A Quick Guide to ACC Levy Classifications. Available online: https://www.offsitenz.com/acc-levy-5-nov-2021 (accessed on 5 July 2022).
  32. Ivascu, L.; Cioca, L.-I. Occupational Accidents Assessment by Field of Activity and Investigation Model for Prevention and Control. Safety 2019, 5, 12. [Google Scholar] [CrossRef]
  33. Masood, R.; Mujtaba, B.; Khan, M.A.; Mubin, S.; Shafique, F.; Zahoor, H. Investigation for safety performance indicators on construction projects. Sci. Int. 2014, 26, 1403–1408. [Google Scholar]
  34. Lingard, H.; Hallowell, M.; Salas, R.; Pirzadeh, P. Leading or lagging? Temporal analysis of safety indicators on a large infrastructure construction project. Saf. Sci. 2017, 91, 206–220. [Google Scholar] [CrossRef]
  35. Lingard, H.; Wakefield, R.; Blismas, N. If you cannot measure it, you cannot improve it: Measuring health and safety performance in the construction industry. In Proceedings of the 19th Triennial CIB World Building Congress, Queensland University of Technology, Brisbane, Australia, 5–9 May 2013. [Google Scholar]
  36. Hola, B. General model of accident rate growth in the construction industry. J. Civ. Eng. Manag. 2007, 13, 255–264. [Google Scholar] [CrossRef]
  37. Morrison, E.J.; Thurnell, D. Working hours in a large New Zealand construction company. In Proceedings of the 28th Annual ARCOM Conference, Edinburgh, UK, 3–5 September 2012; pp. 249–259. [Google Scholar]
  38. Kotowski, M.J. Accident trend analysis by cumulative rates calculation. Prof. Saf. 1987, 32, 15. [Google Scholar]
  39. OSHA. Clarification on how the formula is used by OSHA to calculate incident rates. In Standards Interpretations; Occupational Safety and Health Administration: Washington, DC, USA, 2016. [Google Scholar]
  40. WDC. Total Workforce Size. 2021. Available online: https://wip.org.nz/total-workforce-size?year=2021&workforce_definition=Core&industry_group=Construction&strategic_group=Onsite+Construction (accessed on 1 January 2024).
  41. Hillmer, S.C.; Tiao, G.C. An ARIMA-model-based approach to seasonal adjustment. J. Am. Stat. Assoc. 1982, 77, 63–70. [Google Scholar] [CrossRef]
  42. Li, Z.-X.; Lu, P.-S.; Wang, G.-Y.; Li, J.-H.; Yang, Z.-H.; Ma, Y.-P.; Wang, H.-H. Analysis of the Composition of Ancient Glass and Its Identification Based on the Daen-LR, ARIMA-LSTM and MLR Combined Process. Appl. Sci. 2023, 13, 6639. [Google Scholar] [CrossRef]
  43. Nelson, B.K. Time series analysis using autoregressive integrated moving average (ARIMA) models. Acad. Emerg. Med. 1998, 5, 739–744. [Google Scholar] [CrossRef]
  44. Meng, G.; Liu, J.; Feng, R. Prediction of Construction and Production Safety Accidents in China Based on Time Series Analysis Combination Model. Appl. Sci. 2022, 12, 11124. [Google Scholar] [CrossRef]
  45. Kim, K.H.; Sohn, M.-J.; Lee, S.; Koo, H.-W.; Yoon, S.-W.; Madadi, A.K. Descriptive Time Series Analysis for Downtime Prediction Using the Maintenance Data of a Medical Linear Accelerator. Appl. Sci. 2022, 12, 5431. [Google Scholar] [CrossRef]
  46. Moffat, I.U.; Akpan, E.A. White noise analysis: A measure of time series model adequacy. Appl. Math. 2019, 10, 989. [Google Scholar] [CrossRef]
  47. Jafri, Y.Z.; Sami, M.; Waseem, A.; Murtaza, G.; Akbar, S. Stochastic approaches for time series forecasting of rate of dust fall: A case study of North West of Balochistan, Pakistan. Int. J. Phys. Sci. 2012, 7, 676–686. [Google Scholar]
  48. Kozitsin, V.; Katser, I.; Lakontsev, D. Online Forecasting and Anomaly Detection Based on the ARIMA Model. Appl. Sci. 2021, 11, 3194. [Google Scholar] [CrossRef]
  49. Han, X. An Automated Time Series Modeling and Forecasting Approach based on SPSS Statistics. In Proceedings of the 2021 The 5th International Conference on Compute and Data Analysis, Sanya, China, 2–4 February 2021; pp. 73–78. [Google Scholar]
  50. Han, J.; Lin, H.; Qin, Z. Prediction and Comparison of In-Vehicle CO2 Concentration Based on ARIMA and LSTM Models. Appl. Sci. 2023, 13, 10858. [Google Scholar] [CrossRef]
  51. Escudero, P.; Alcocer, W.; Paredes, J. Recurrent Neural Networks and ARIMA Models for Euro/Dollar Exchange Rate Forecasting. Appl. Sci. 2021, 11, 5658. [Google Scholar] [CrossRef]
  52. Jeong, J.; Jeong, J. Comparative Analysis of Degree of Risk between the Frequency Aspect and Probability Aspect Using Integrated Uncertainty Method Considering Work Type and Accident Type in Construction Industry. Appl. Sci. 2022, 12, 1131. [Google Scholar] [CrossRef]
  53. Chang, C.; Zuo, Z. Optimization Model of Technical Workers Allocation for Construction Safety Control in Prefabricated Building. In Proceedings of the 2022 41st Chinese Control Conference (CCC), Hefei, China, 25–27 July 2022; pp. 2040–2045. [Google Scholar]
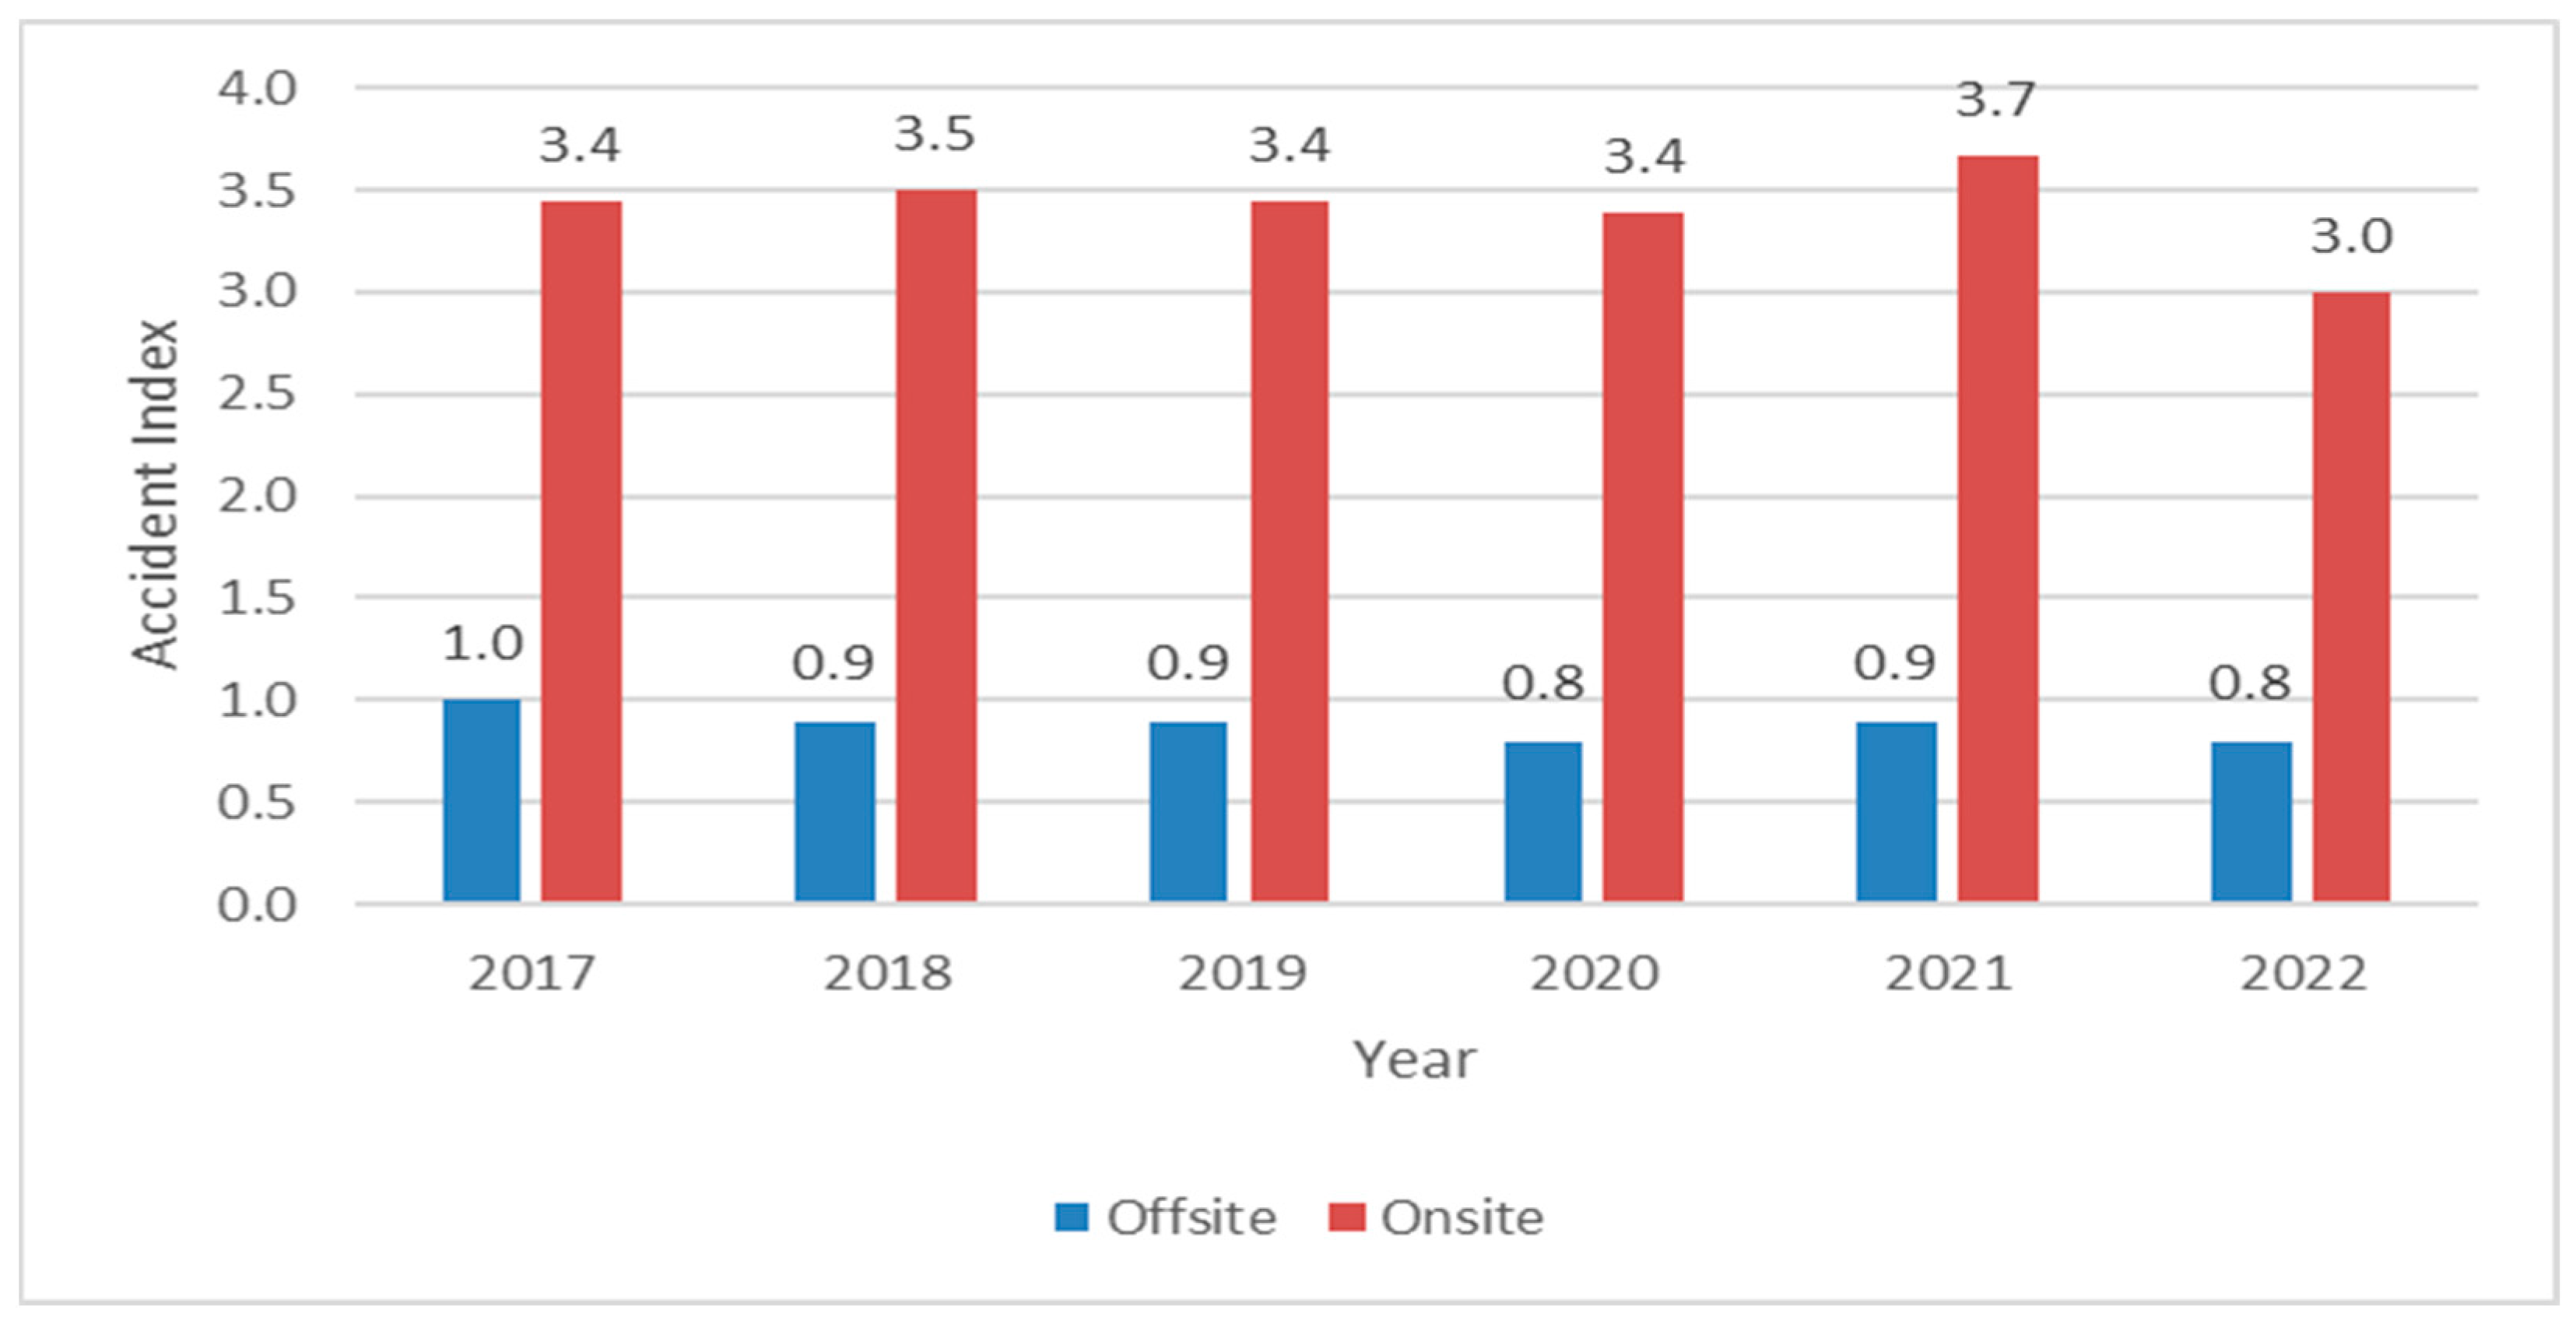
Figure 1. Accident index per year (2017–2022).
Applsci 14 01629 g001
Figure 2. Accident frequency rate 2017–2021.
Applsci 14 01629 g002
Figure 3. ARIMA models for accident forecasting by classification (2017–2027).
Applsci 14 01629 g003aApplsci 14 01629 g003b
Figure 4. Cost of prefabricated construction safety (2017–2022).
Applsci 14 01629 g004
Figure 5. Number of accidents by occupation in prefabricated construction (2017–2022).
Applsci 14 01629 g005aApplsci 14 01629 g005b
Figure 6. Number of accidents by most common occupation in prefabricated construction (2017–2022).
Applsci 14 01629 g006
Figure 7. ARIMA models for accident forecasting by vulnerable occupation (2017–2027).
Applsci 14 01629 g007
Figure 8. Number of accidents by injury type in prefabricated construction (2017–2022).
Applsci 14 01629 g008
Figure 9. Comparison of number of accidents by most common injury types (2017–2022).
Applsci 14 01629 g009
Figure 10. ARIMA models for accident forecasting by critical injuries (2017–2027).
Applsci 14 01629 g010
Figure 11. Comparison of number of accidents by most common injury causes (2017–2022).
Applsci 14 01629 g011
Figure 12. Number of accidents by injury cause in prefabricated construction (2017–2022).
Applsci 14 01629 g012
Figure 13. ARIMA models for accident forecasting by injury causes (2017–2027).
Applsci 14 01629 g013
Figure 14. Number of accidents by prior activity to injury in prefabricated construction (2017–2022).
Applsci 14 01629 g014
Figure 15. Comparison of number of accidents by most common injury prior activity (2017–2022).
Applsci 14 01629 g015
Figure 16. ARIMA models for accident forecasting by prior activities to critical injuries (2017–2027).
Applsci 14 01629 g016
Figure 17. Number of accidents by injury site in prefabricated construction (2017–2022).
Applsci 14 01629 g017
Figure 18. Comparison of number of accidents by most common injury location (2017–2022).
Applsci 14 01629 g018
Figure 19. ARIMA models for accident forecasting by injury site (2017–2027).
Applsci 14 01629 g019
Table 1. Business (Levy) classification for prefabricated construction from ACC * [31].
Abb.NameCodeIncludeExclude
Wood_SWooden structural fittings and components manufacturing23230Manufacturing, as well as manufacturing and installing; wooden cabinetry, staircases, roof trusses/pre-nail, window frames, doorsFabrication and installation of joinery on a building site
ConcConcrete product manufacturing26350Manufacturing fibre cement weatherboards and cladding, concrete roofing components, precast walls/floors/ceilings-
AlumArchitectural aluminium product manufacturing27420Manufacturing of aluminium roofing, stairs, staircases, doors/doorframes, gates, garage doors, windows/window frames, screens, shopfronts. Also includes manufacturing in conjunction with the installation of the above products.-
Metal_SStructural metal product manufacturing274090Manufacturing metal (except aluminium) balconies, balustrades, curtain walls, doors or door frames, fascias, prefabricated fire escapes, partitions, and railings. Also includes manufacturing in conjunction with installation of the above products.-
Metal_PPrefabricated metal building manufacturing29110Manufacture of metal sheds, carports, bus shelters, kitset homesManufacture of prefabricated buildings in conjunction with onsite erection/assembly of buildings.
Wood_PPrefabricated wooden building manufacturing29190Manufacturing of wooden prefab houses/kit set dwellings, garages, wooden shedsManufacture of prefabricated buildings in conjunction with onsite erection/assembly of buildings.
* Accident Compensation Corporation.
Table 2. ARIMA Models for accident forecasting by business classification.
StatsWood_SConcAlumMetal_SMetal_PWood_POffsiteOnsite
ARIMA Model1, 1, 10, 0, 01, 1, 01, 1, 10, 0, 01, 1, 01, 1, 11, 1, 1
MAPE4.6554.0105.4696.36416.33612.2974.6863.716
MAE36.85313.13039.11912.82115.33311.928101.441325.809
R20.4950.8510.0670.1360.0000.0970.3560.524
RMSE98.68621.81281.48236.68118.43922.431317.331892.148
BIC10.4716.7629.7668.4926.1287.18712.80714.875
Table 3. ARIMA models for accident forecasting by vulnerable occupations.
StatsWood_SConcAlumMetal_SMetal_PWood_P
Carpenters and JoinersCement and Other Minerals
Processing, and
Machine
Operators
Building and Related WorkersSheet Metal WorkersLabourersCarpenters and Joiners
ARIMA Model1, 1, 10, 0, 00, 0, 00, 1, 00, 0, 01, 1, 0
MAPE4.3574.60510.38613.61313.61320.060
MAE13.9925.61916.1435.0405.0408.343
R20.7890.9400.5840.1390.1390.058
RMSE892.1488.33225.1426.9866.98617.004
BIC14.8754.8377.0464.5324.5326.633
Table 4. ARIMA models for accident forecasting by injury types.
StatsSoft TissueLaceration/
Puncture/Sting
Foreign Body in
Orifice/Eye
Fracture or DislocationIndustrial Deafness
ARIMA Model1, 1, 10, 0, 00, 1, 10, 0, 00, 0, 0
MAPE5.0555.6196.7337.81823.363
MAE64.04730.6197.1176.6957.444
R20.3520.6590.6320.4200.747
RMSE196.33346.72812.4808.25910.338
BIC10.5738.2866.0144.8205.279
Table 5. ARIMA models for accident forecasting by injury causes.
StatsLifting/
Carrying/Strain
PunctureObject Coming Loose/ShiftingWork Property/
Characteristics
ARIMA Model1, 1, 10, 0, 00, 0, 01, 1, 0
MAPE3.84517.73411.0485.362
MAE18.67150.82918.52410.263
R20.5650.4080.7500.802
RMSE87.41773.96528.05521.621
BIC10.2299.2047.2667.113
Table 6. ARIMA Models for accident forecasting by prior activities to injury.
StatsEmployment Task Lifting/Lowering/Loading/
Unloading
Using/
Operation
Ascending/
Descending
ARIMA Model0, 1, 11, 1, 11, 1, 01, 1, 1
MAPE17.92210.55911.6369.802
MAE150.16447.28816.3403.961
R20.6380.1170.0360.354
RMSE268.954132.07528.46112.934
BIC12.15511.0547.6636.407
Table 7. ARIMA models for accident forecasting by injury site on human body.
StatsLower Back/SpineFinger/ThumbHand/WristShoulderUpper and Lower ArmEyeKnee
ARIMA Model1, 1, 10, 0, 01, 1, 10, 0, 00, 0, 00, 1, 10, 0, 0
MAPE5.565.0198.7004.0146.04411.51311.380
MAE22.87718.71418.8425.7784.9084.5953.444
R20.3530.4520.2770.4350.6850.4290.750
RMSE75.38828.4448.0318.1018.8768.5194.83
BIC9.9337.2939.0314.7814.9645.253.747
Disclaimer/Publisher’s Note: The statements, opinions and data contained in all publications are solely those of the individual author(s) and contributor(s) and not of MDPI and/or the editor(s). MDPI and/or the editor(s) disclaim responsibility for any injury to people or property resulting from any ideas, methods, instructions or products referred to in the content.