
Effects of Pipe Deflection and Arching on Stress Distribution and Lateral Earth Pressure Coefficient in Buried Flexible Pipes

Abstract
:1. Introduction
2. Experimental Setup
2.1. Test System
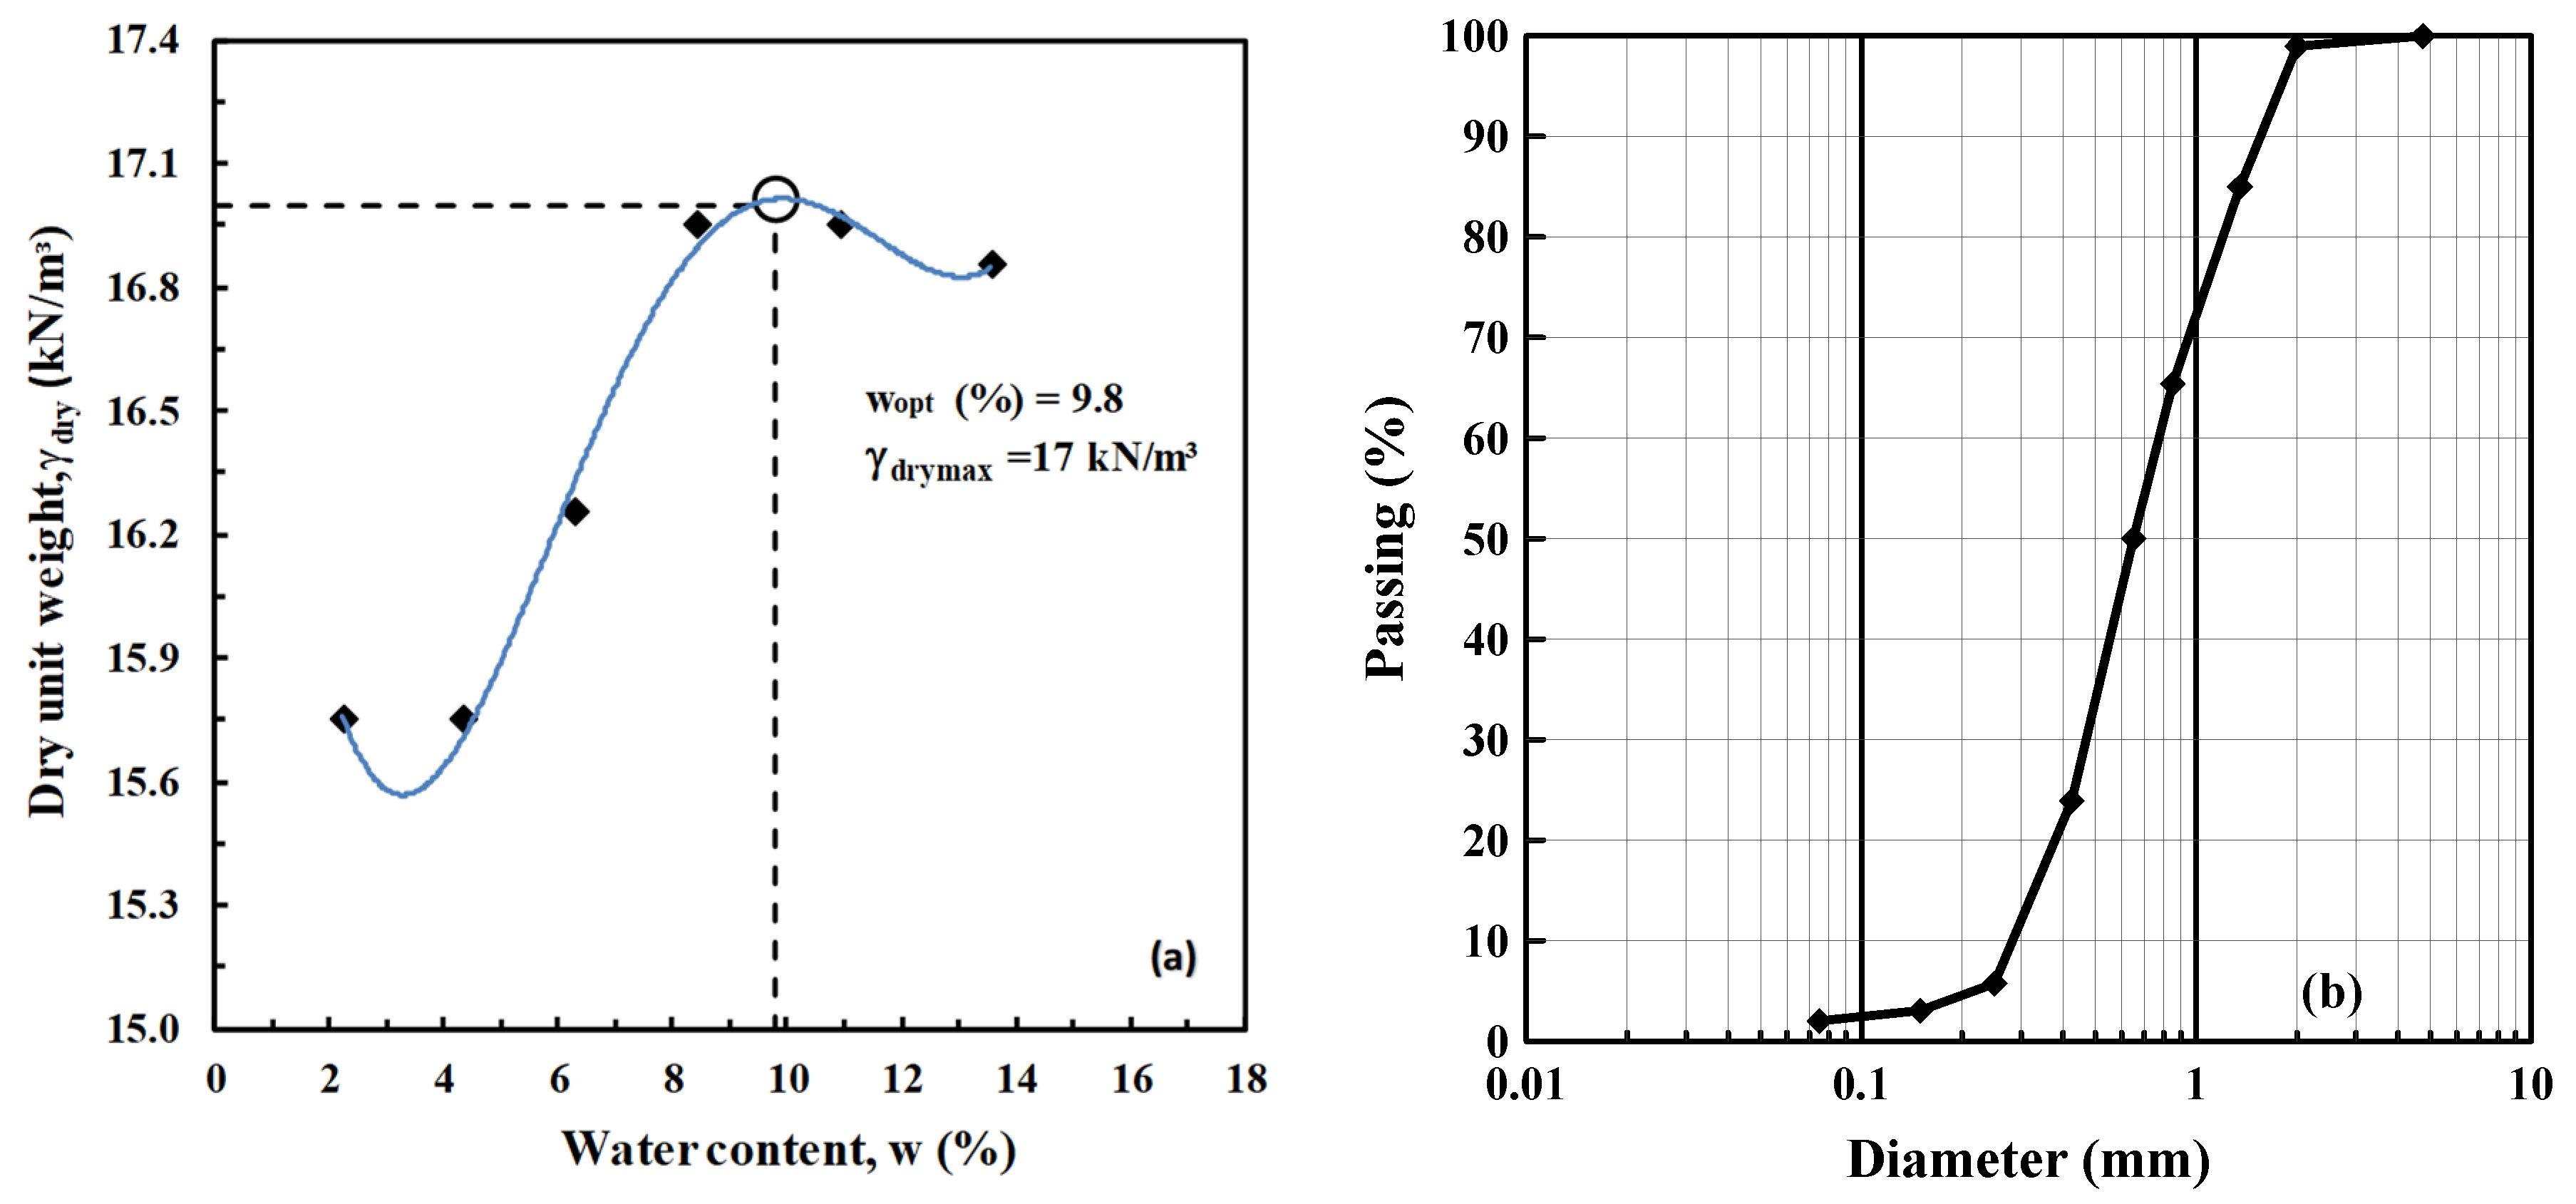
2.2. Materials
2.3. Loading
2.4. Test Procedure
3. Numerical Analysis
3.1. Mesh and Boundary Conditions
3.2. Material Properties
3.3. Consruction Stages
4. Results and Discussion
4.1. Surface Displacement
4.2. Vertical Stresses
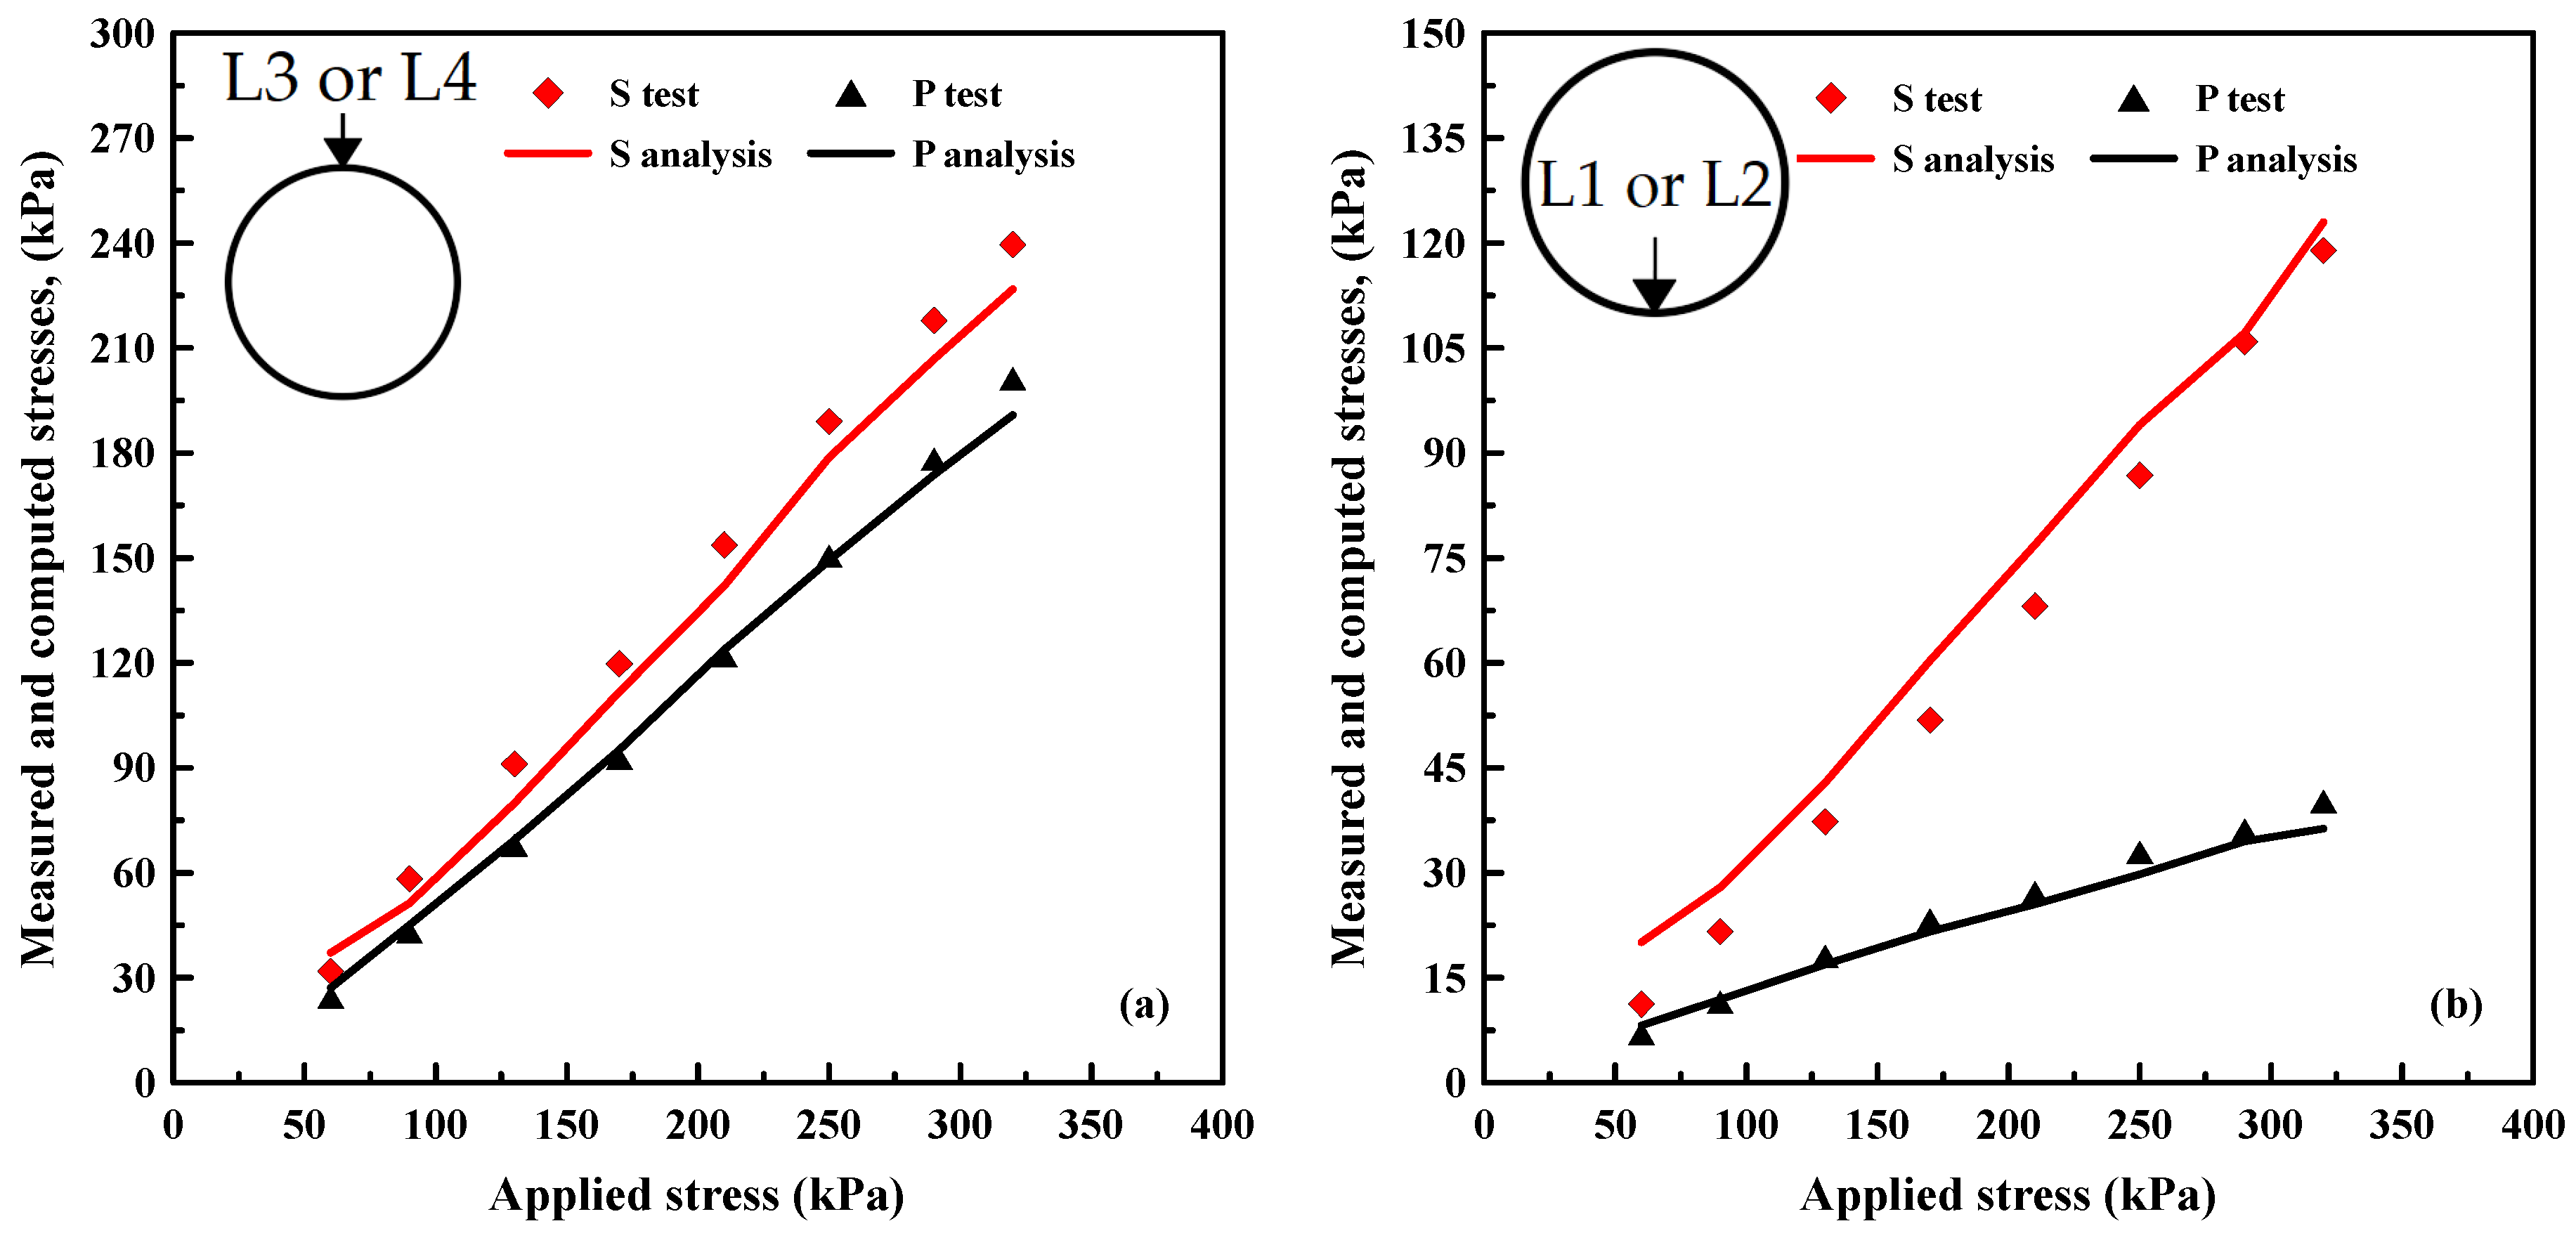
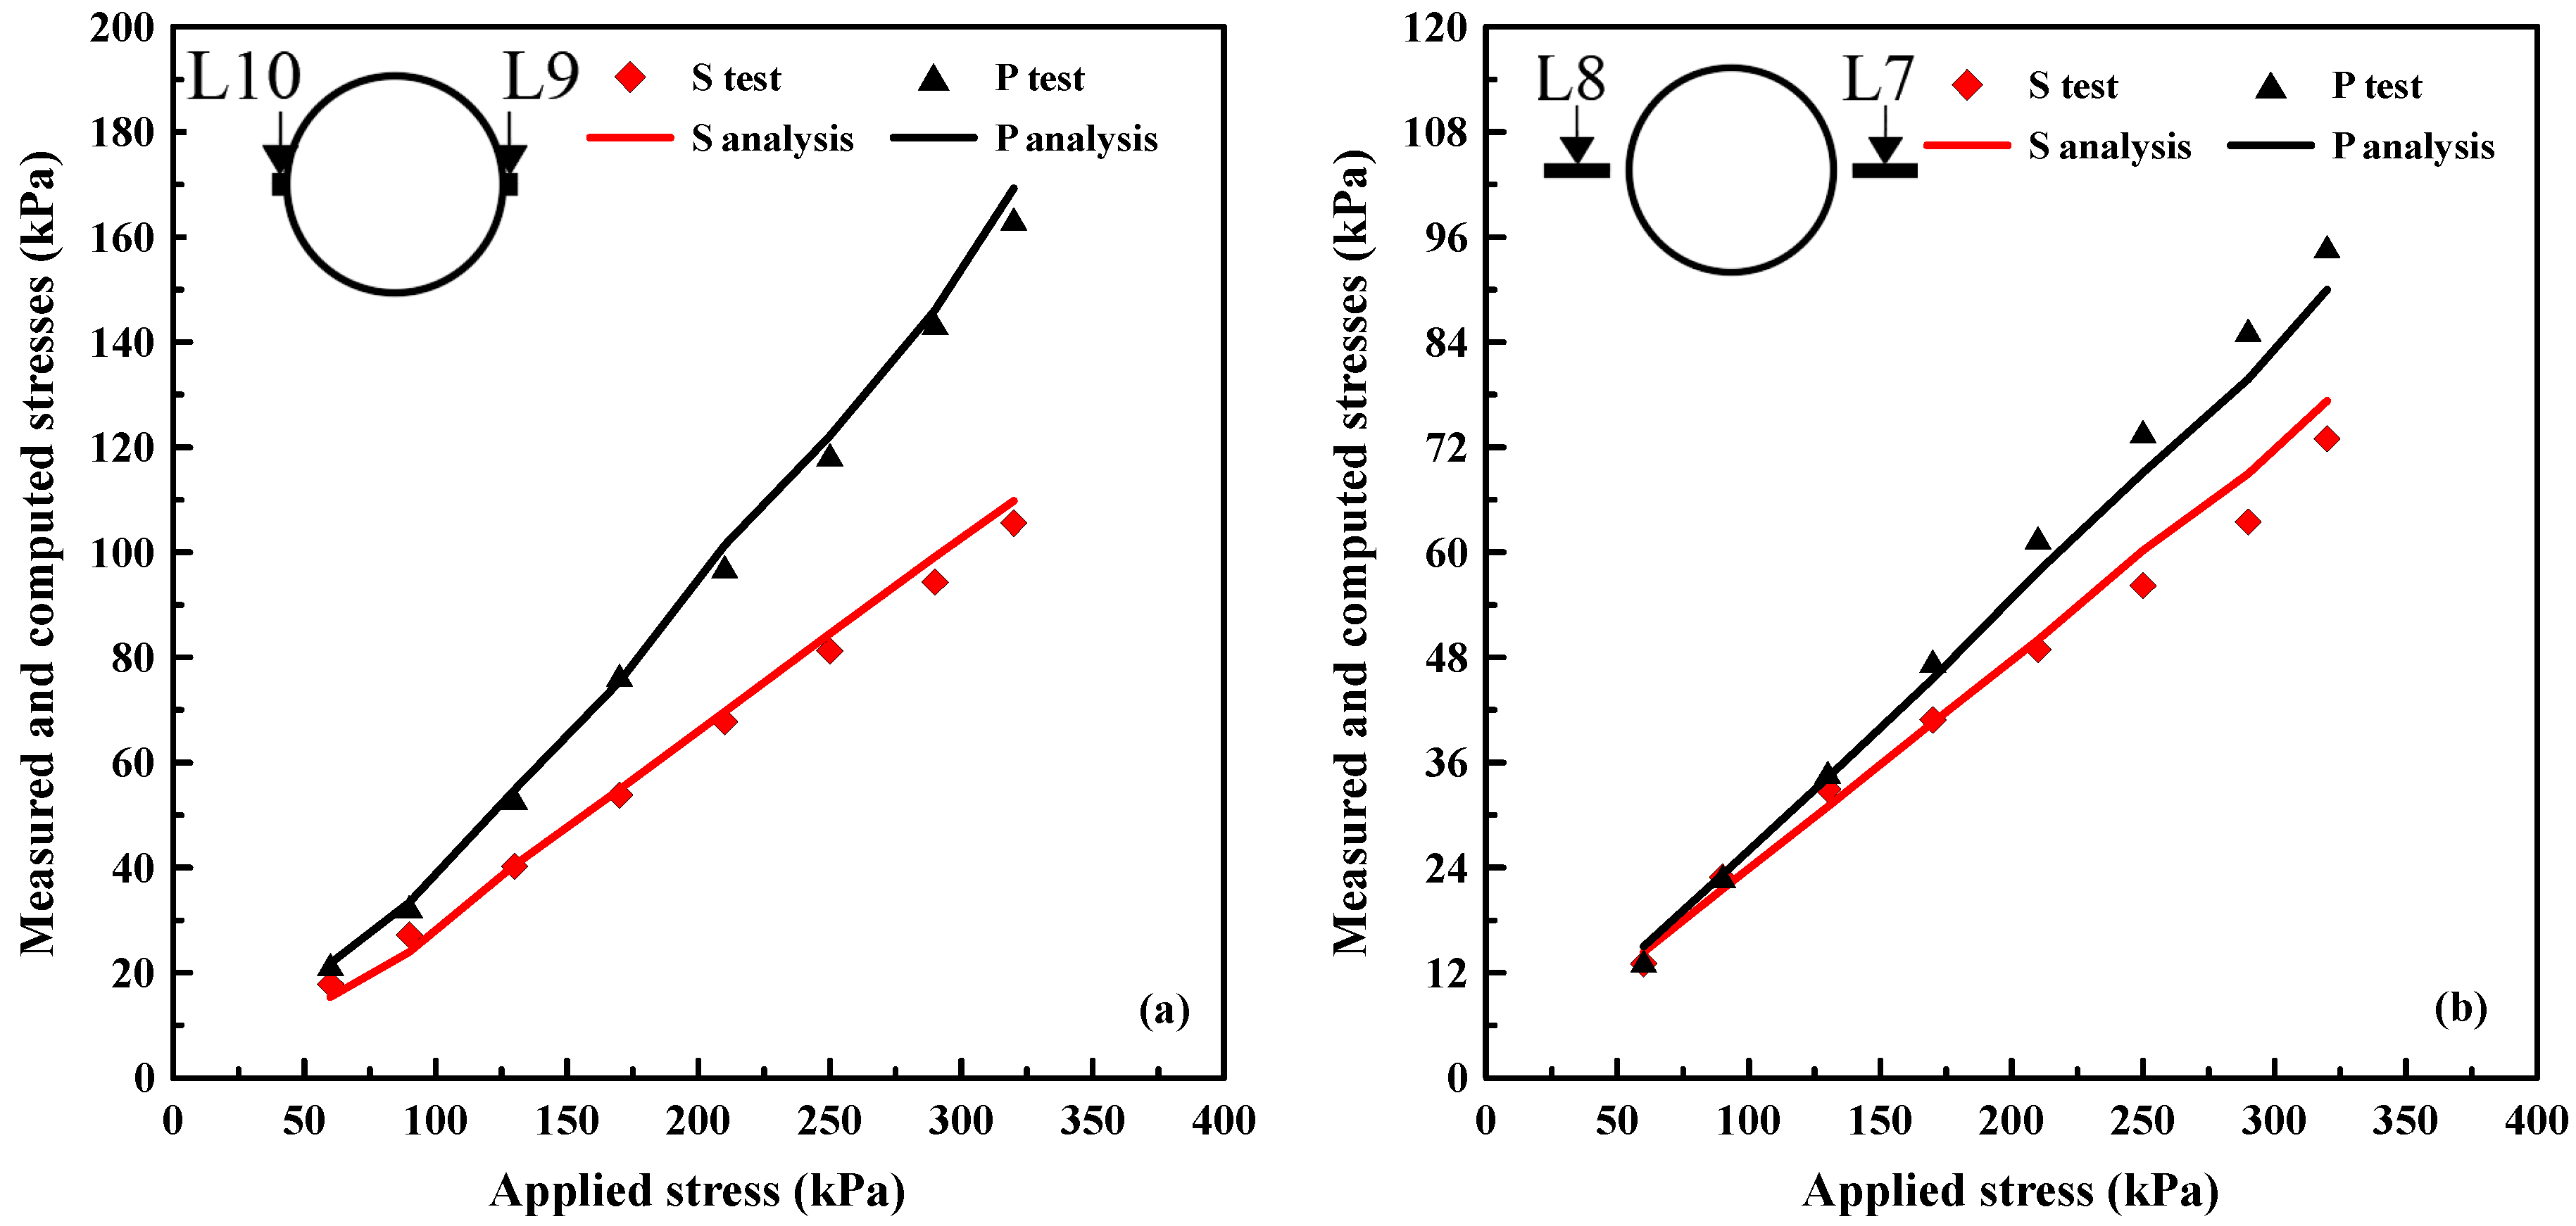
4.3. Horizontal Stresses
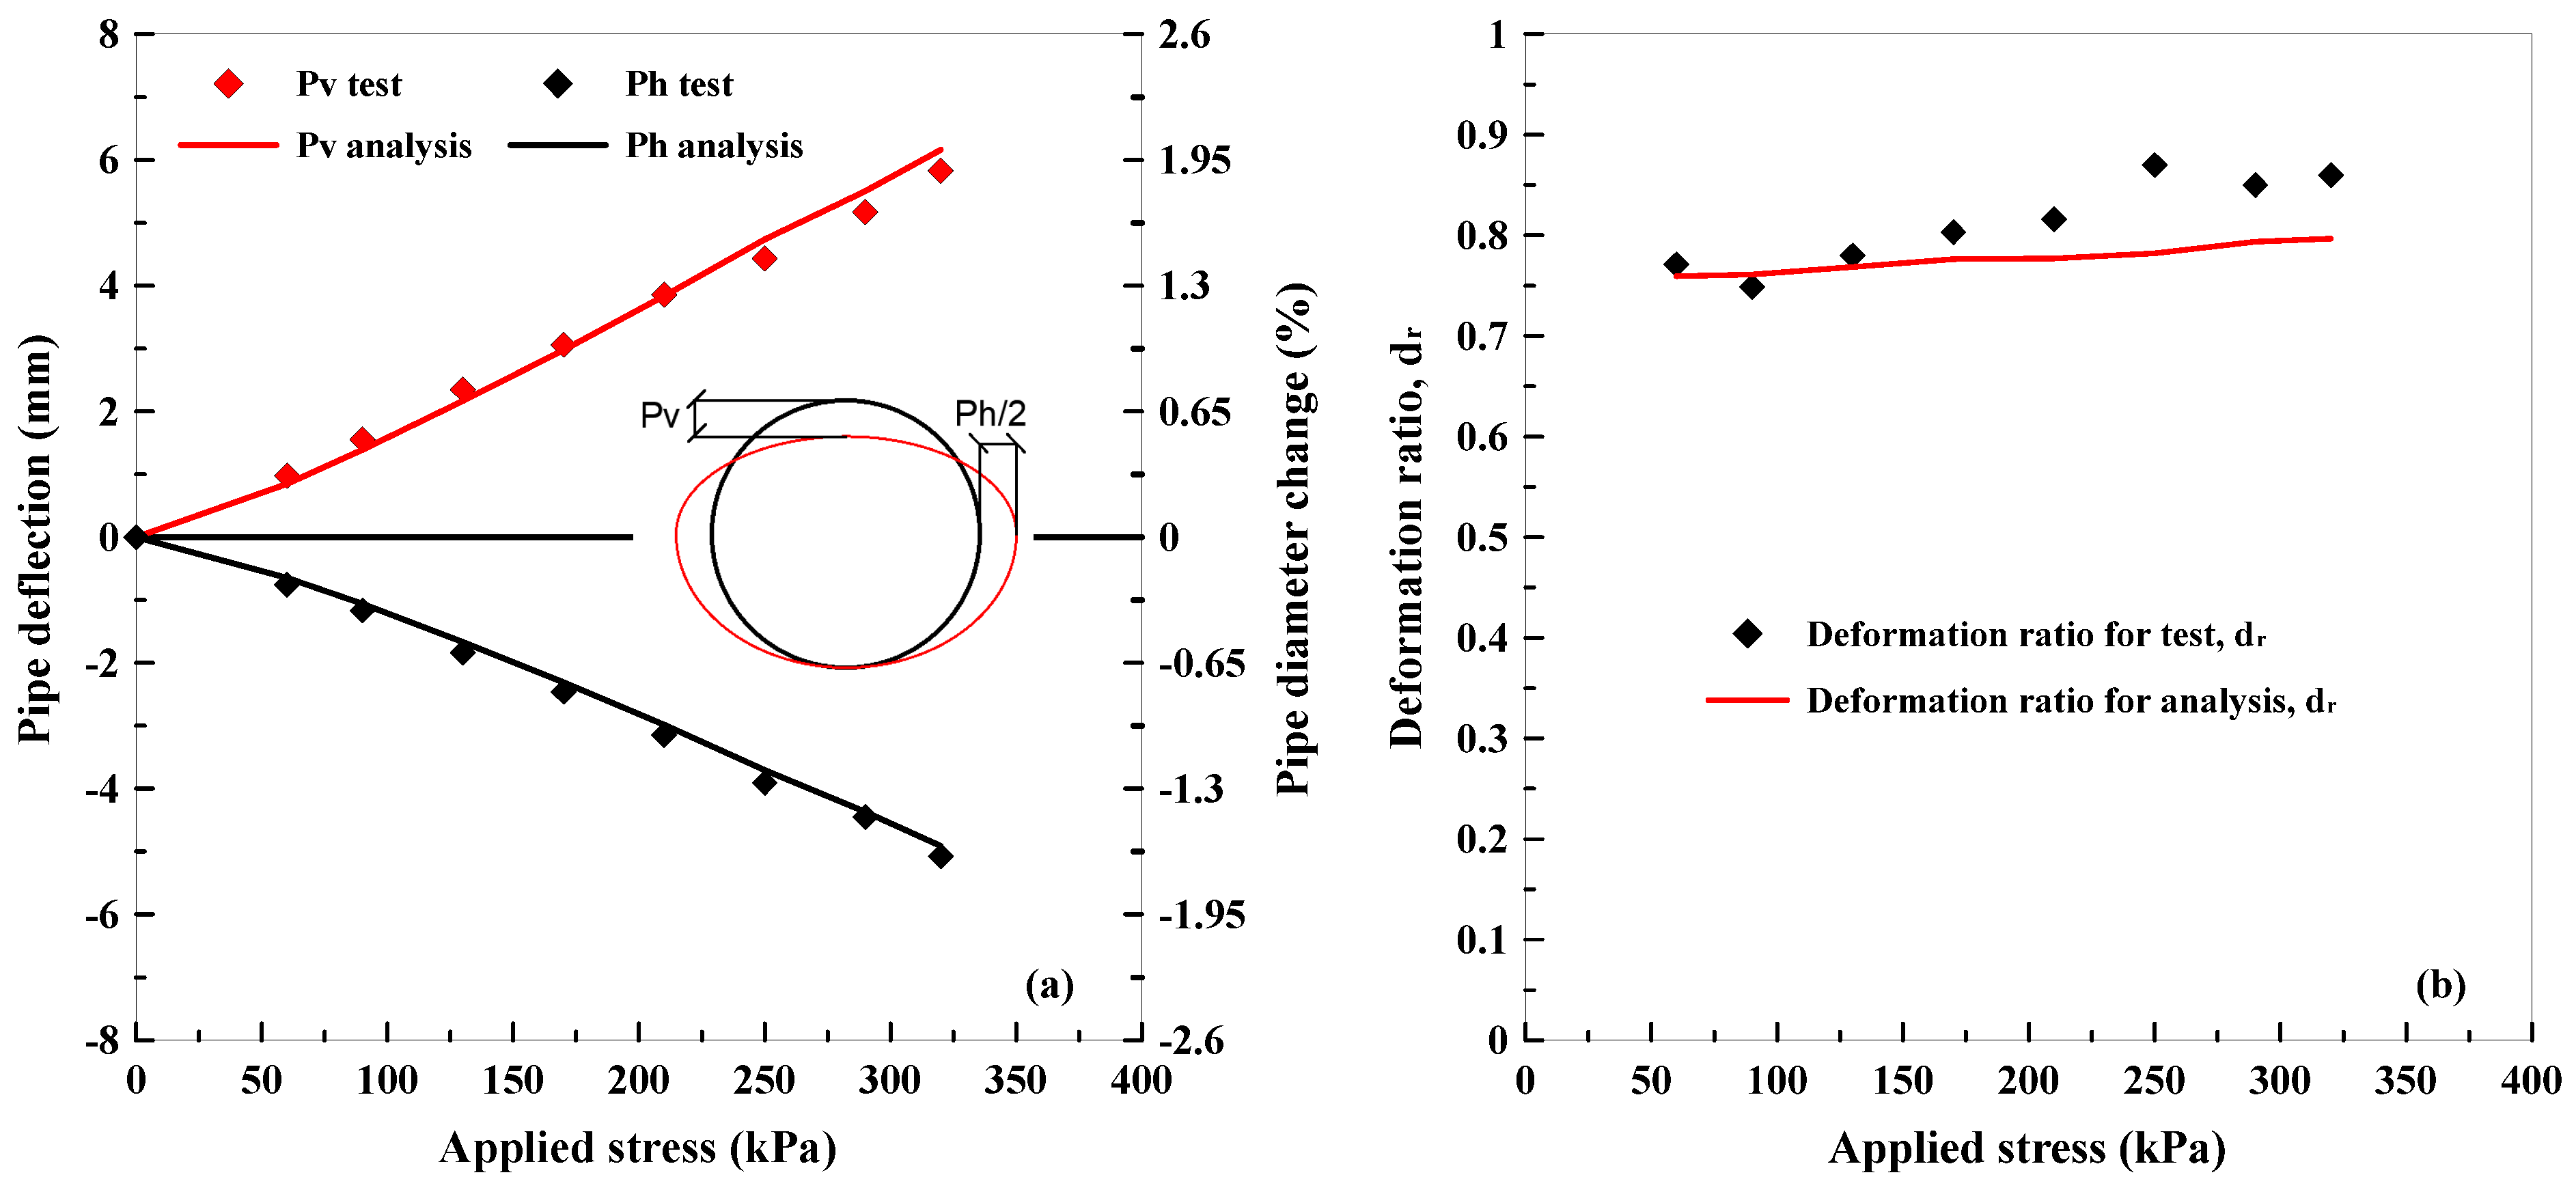
4.4. Pipe Deflection
4.5. Change of Lateral Earth Pressure Coefficient
4.6. Results of the Parametric Study
4.6.1. Effect of Rigid Pavement
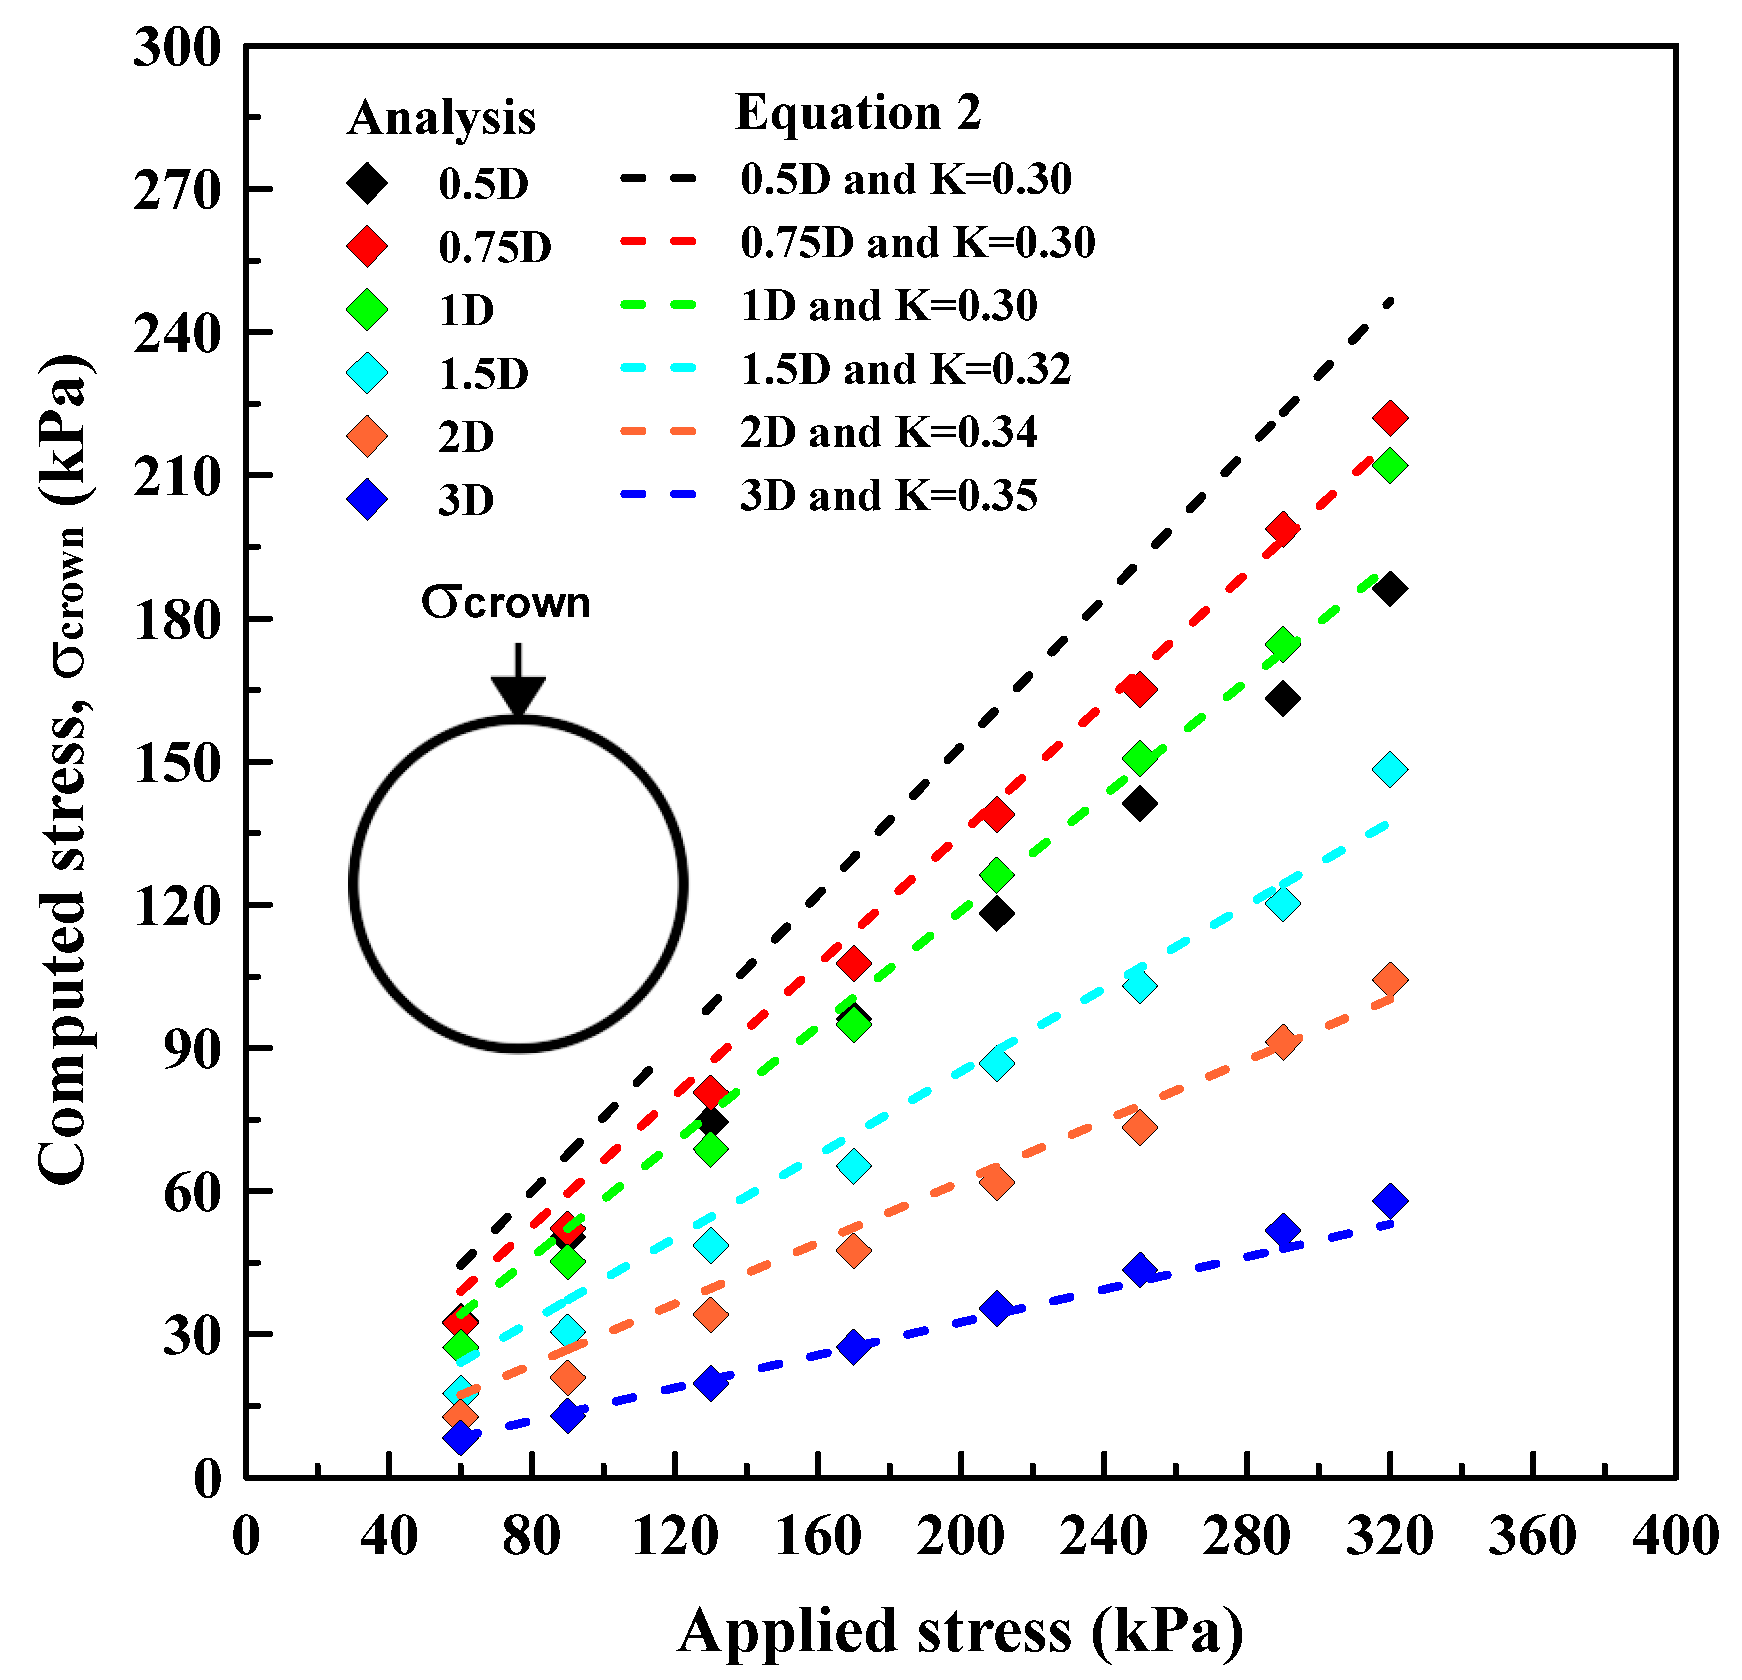
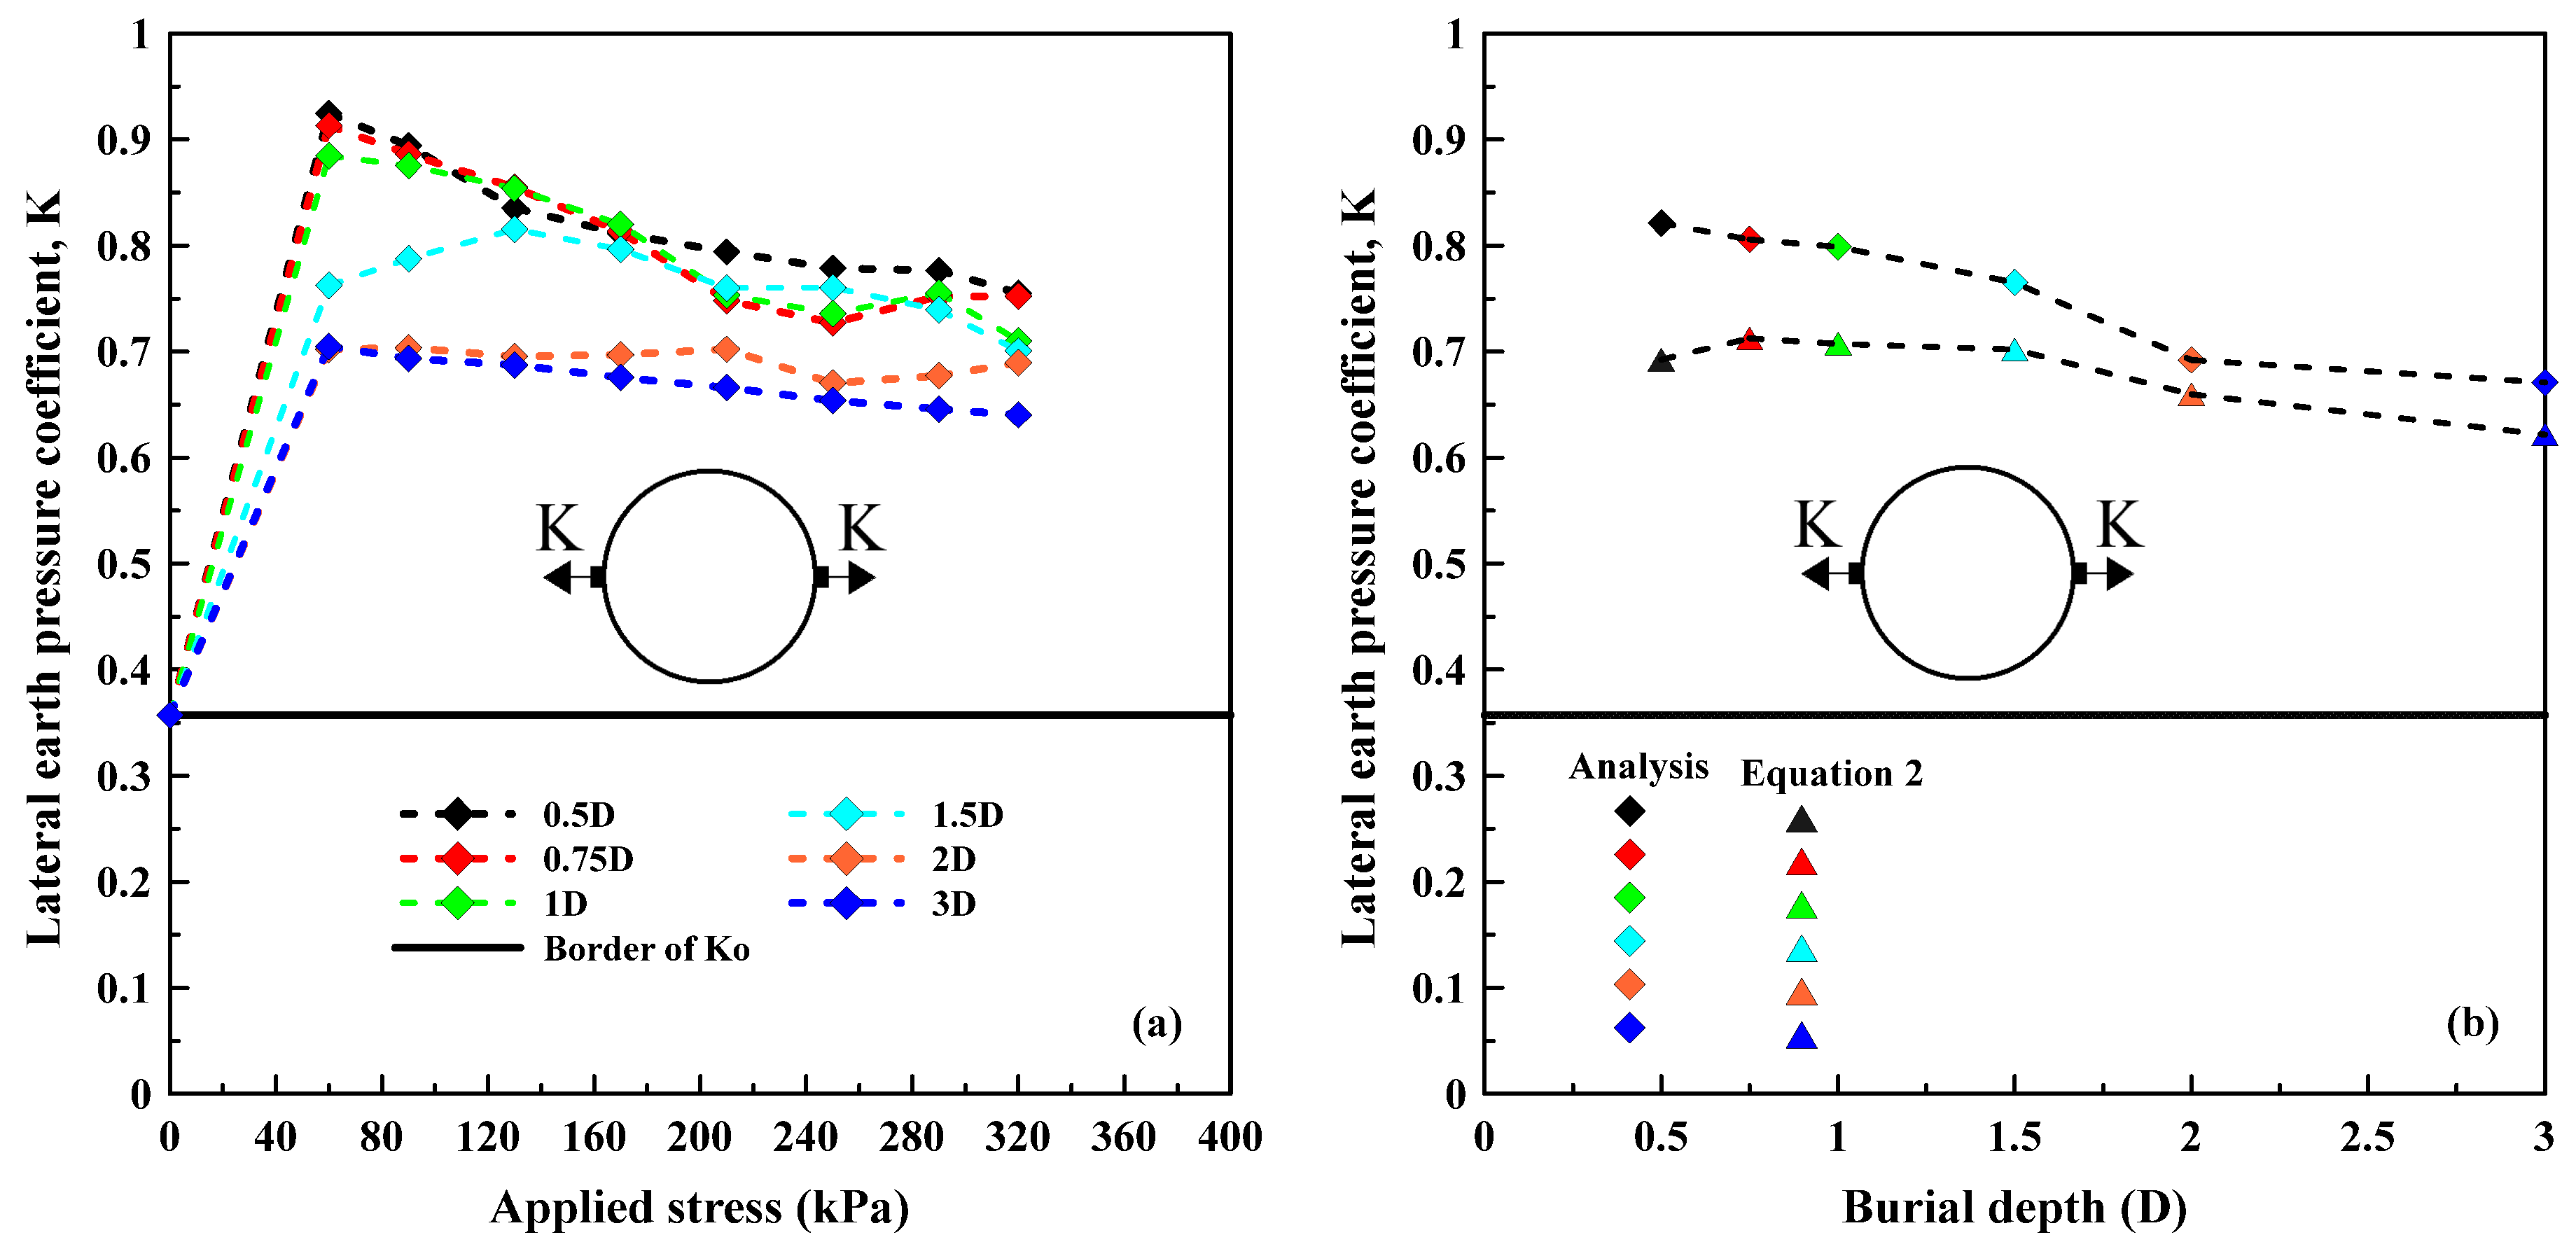
4.6.2. Effect of Burial Depth
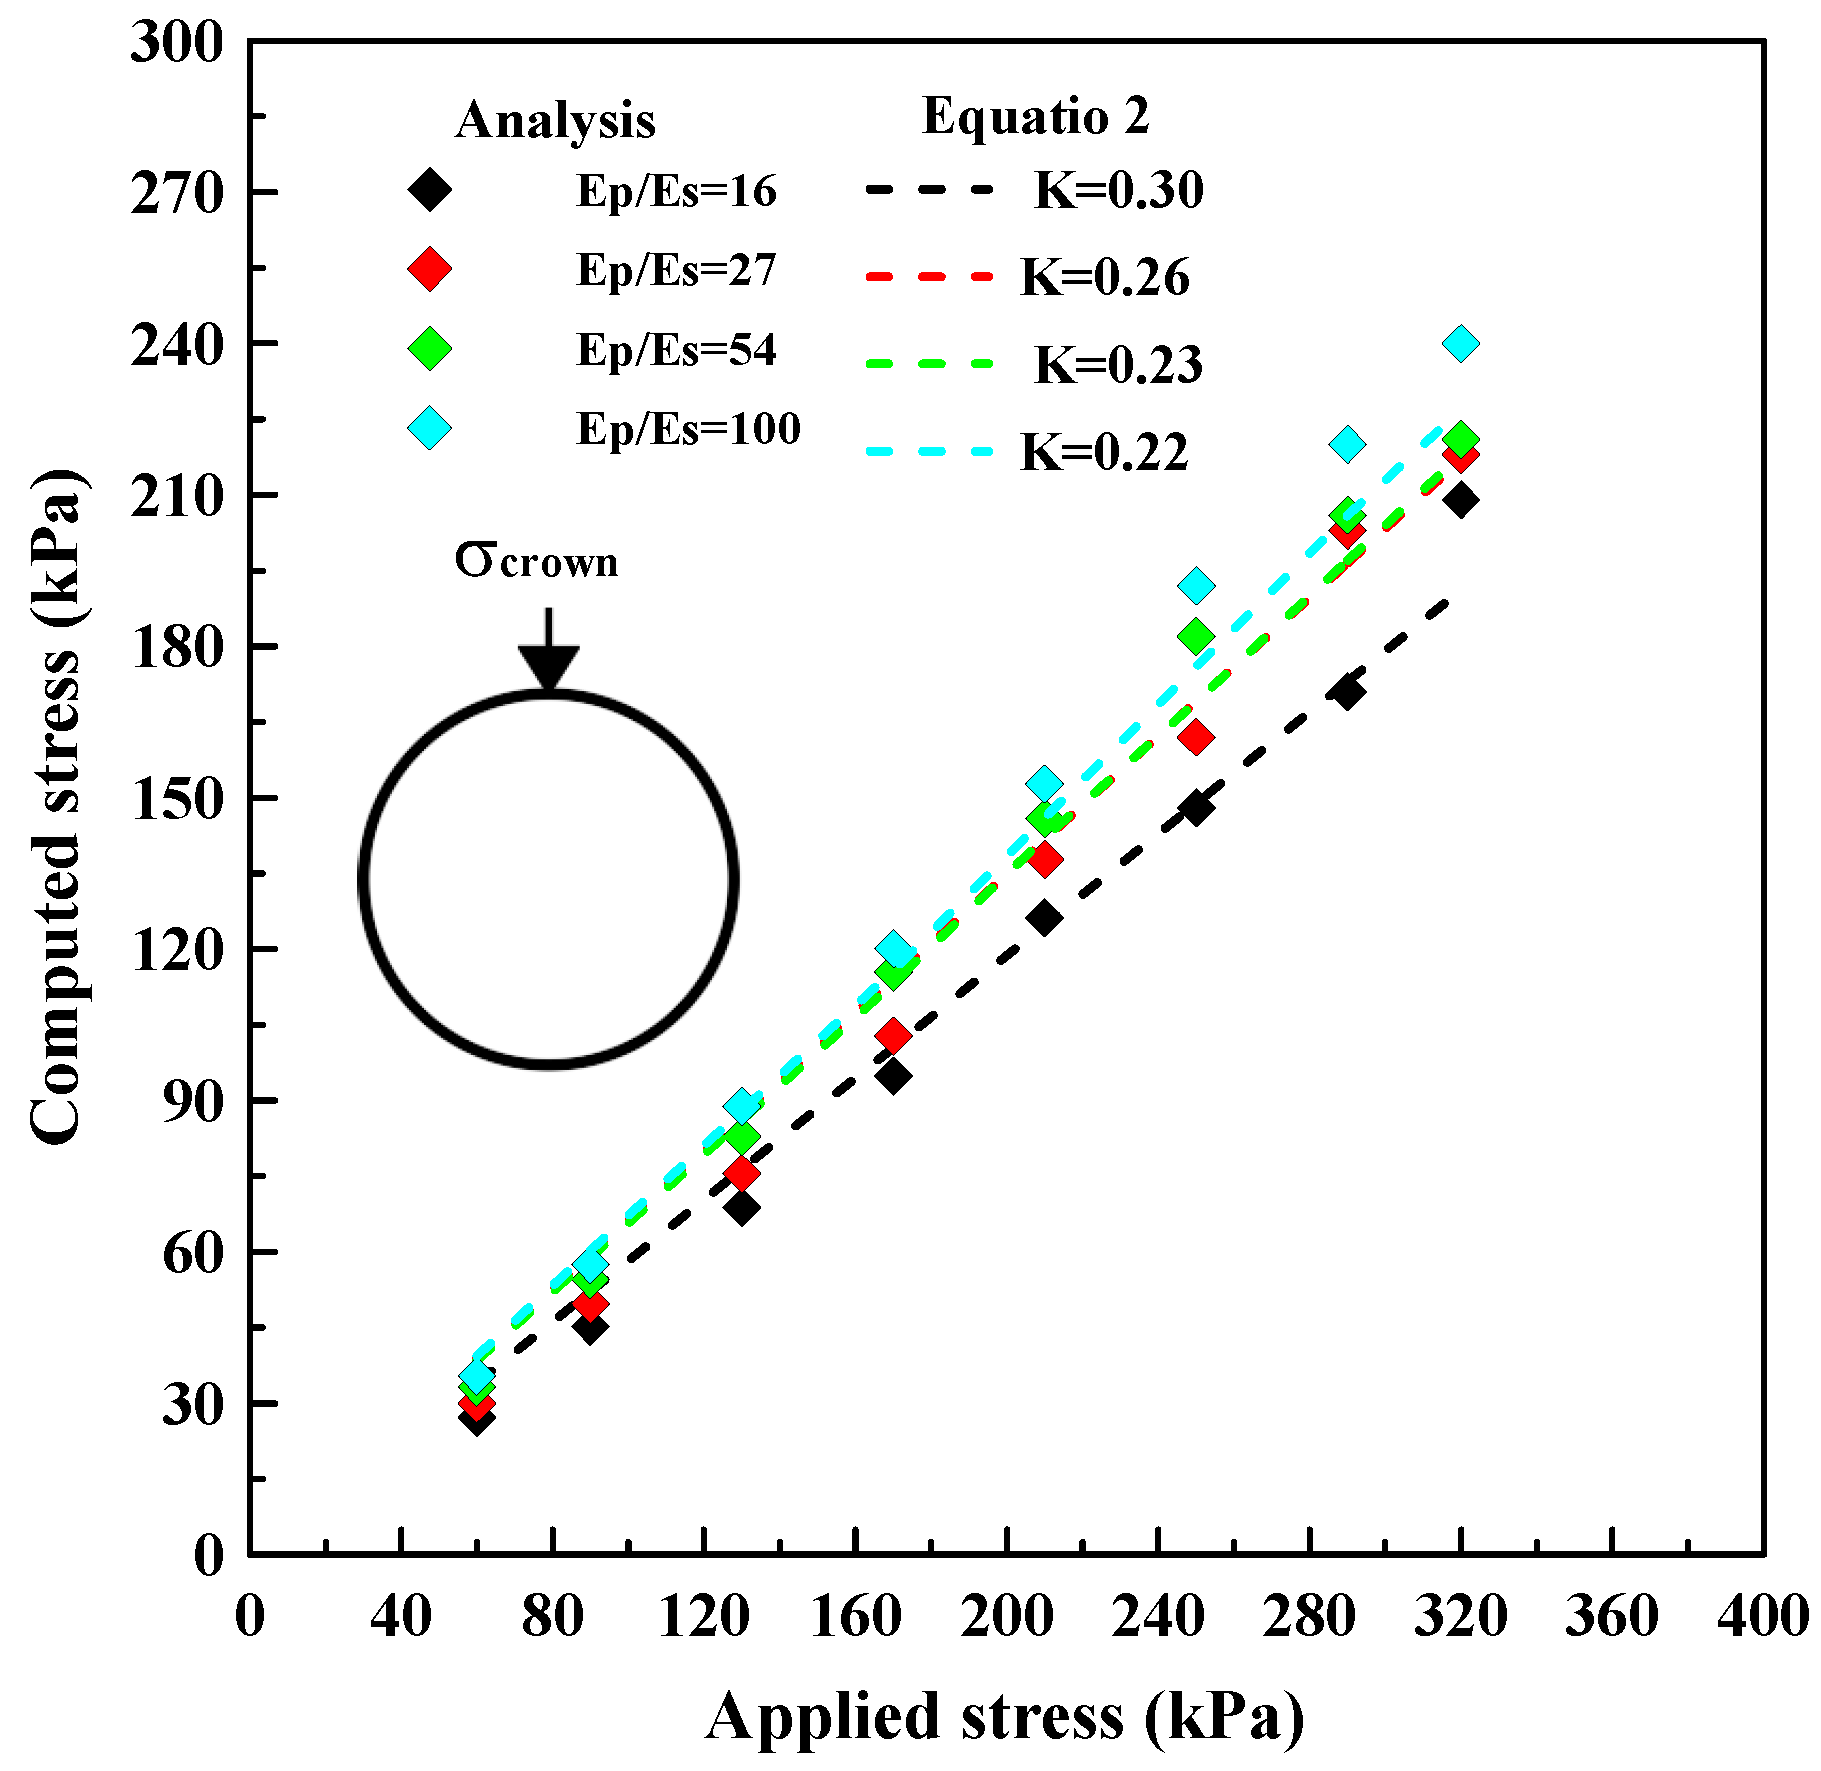
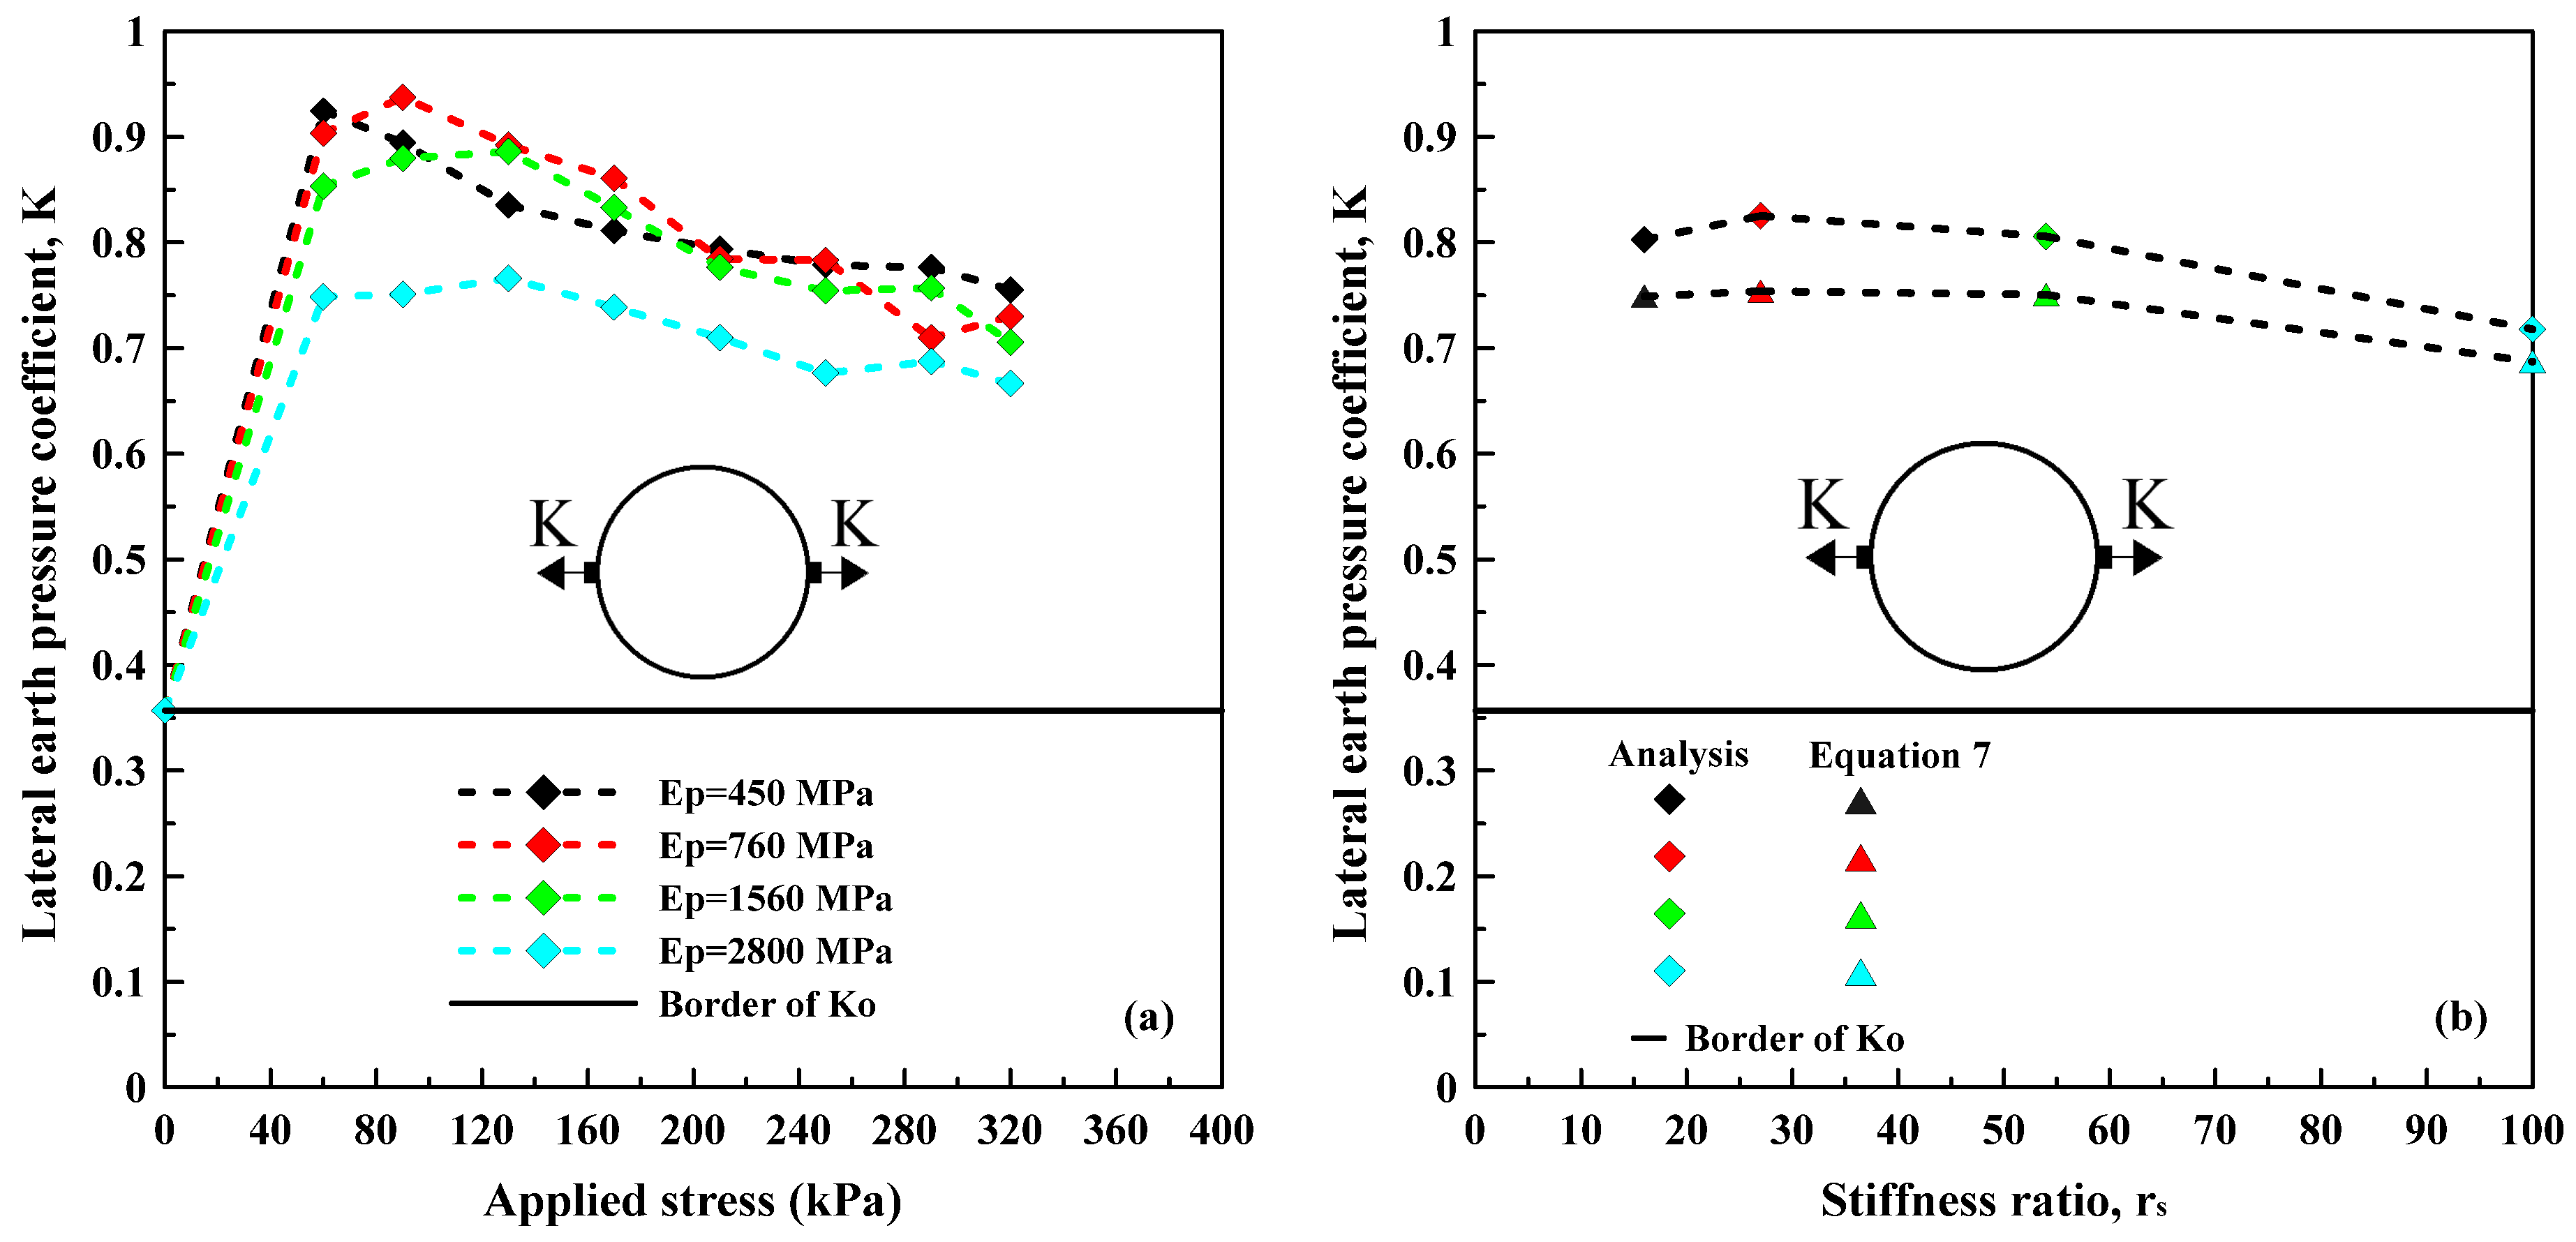
4.6.3. Effect of the Stiffness of the Pipe and Backfill
5. Conclusions
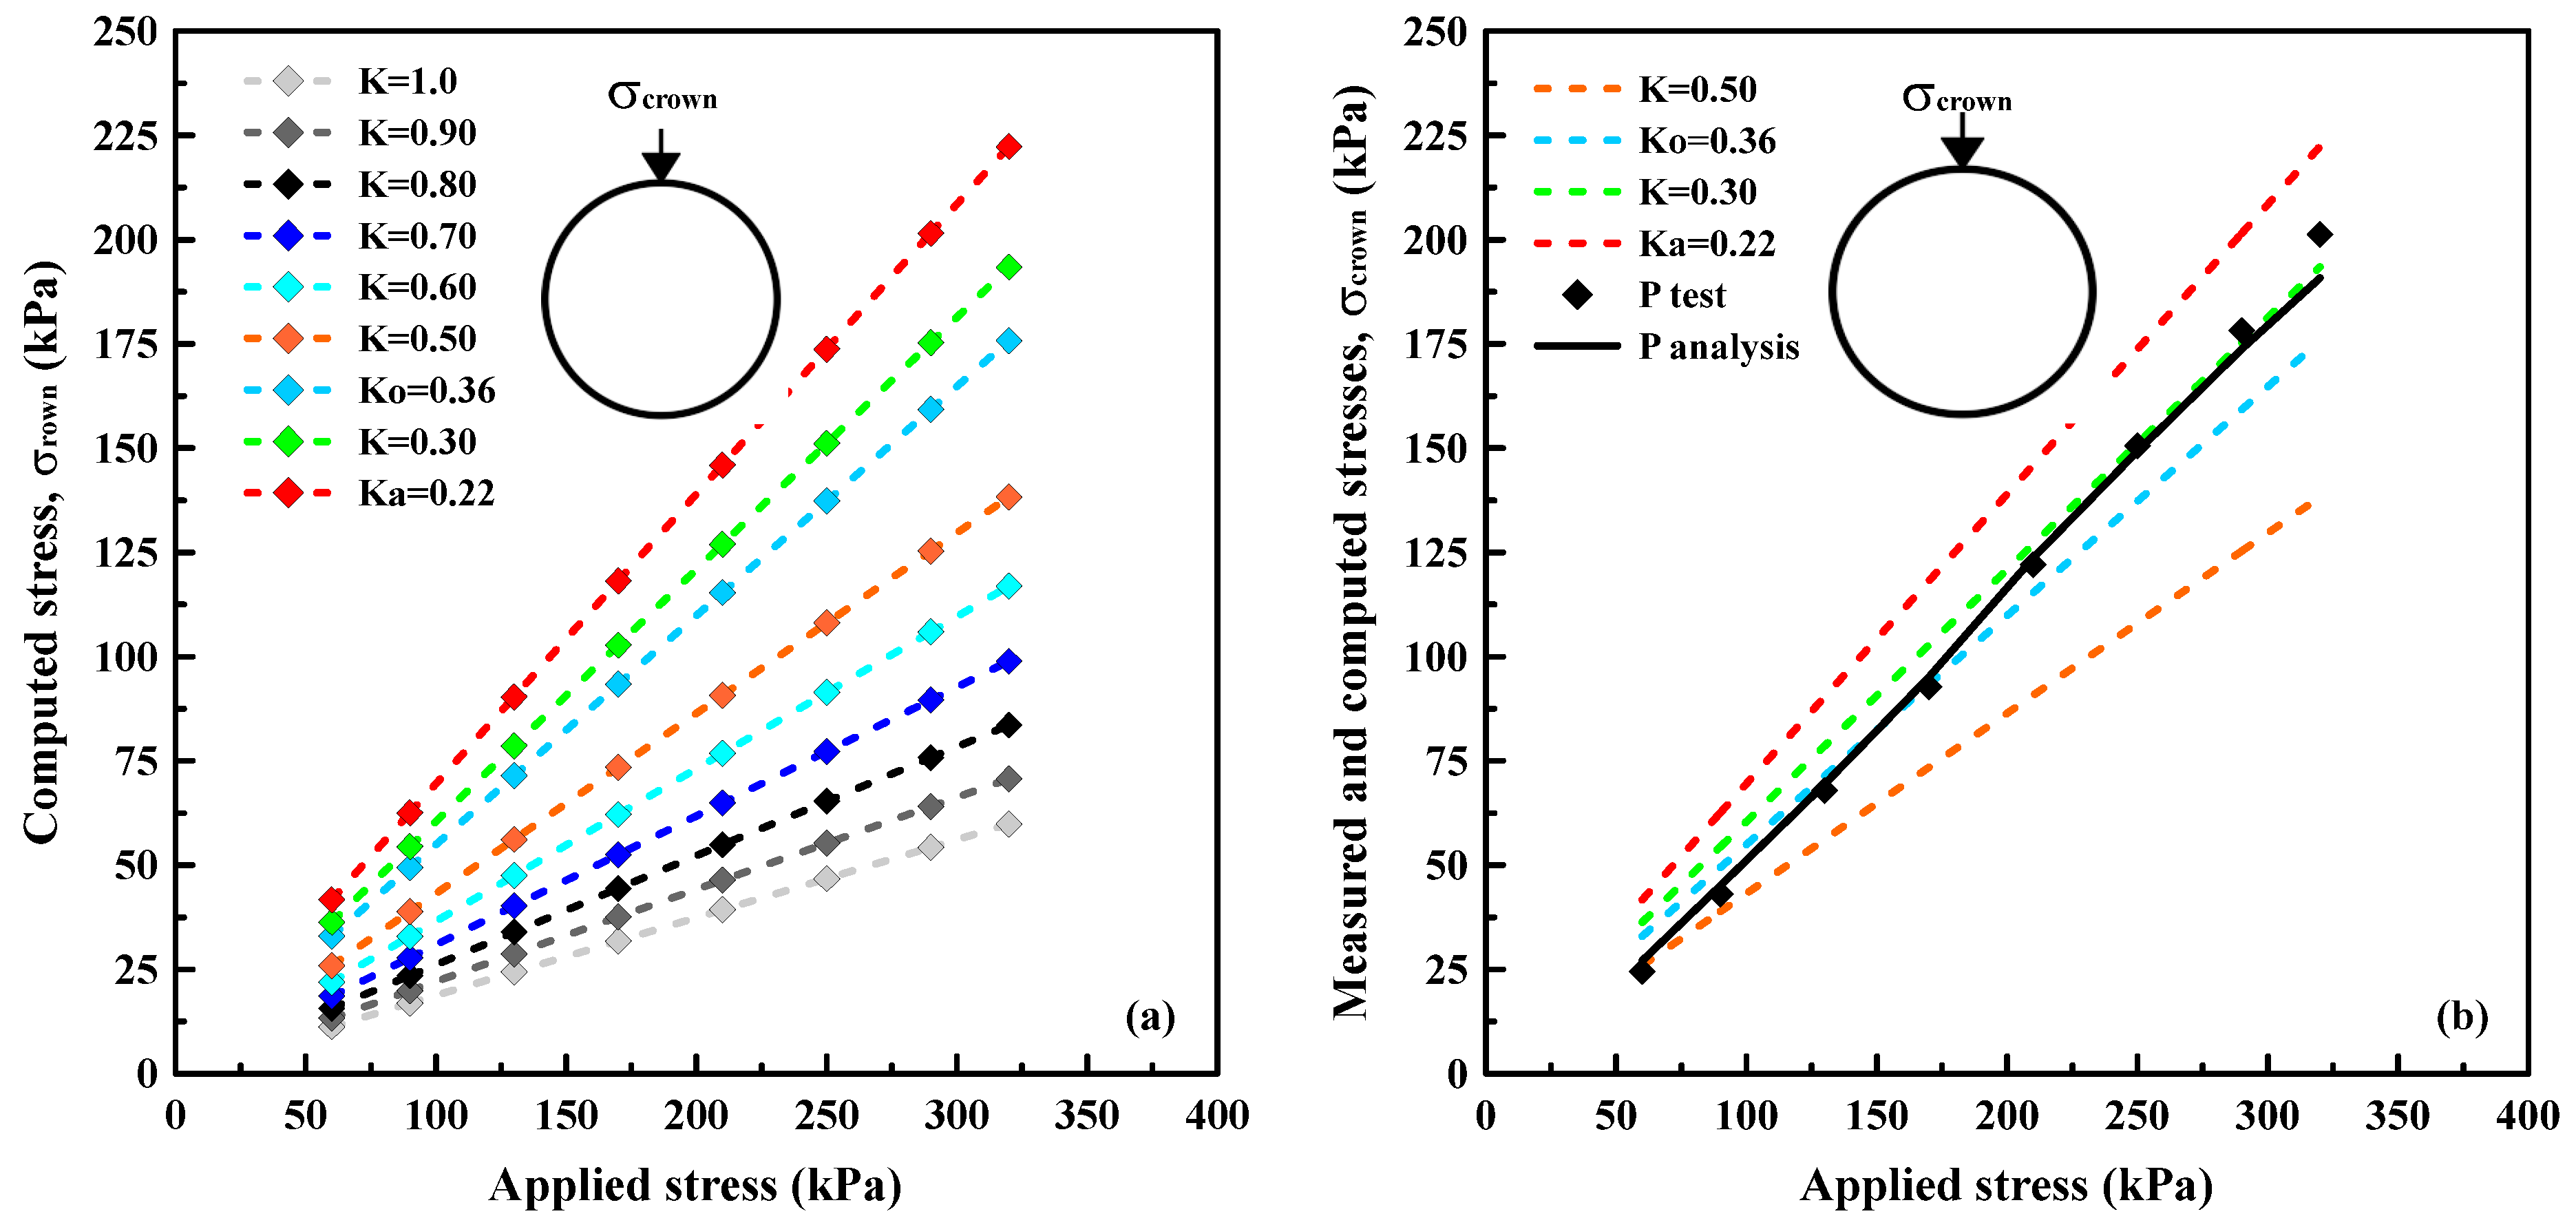
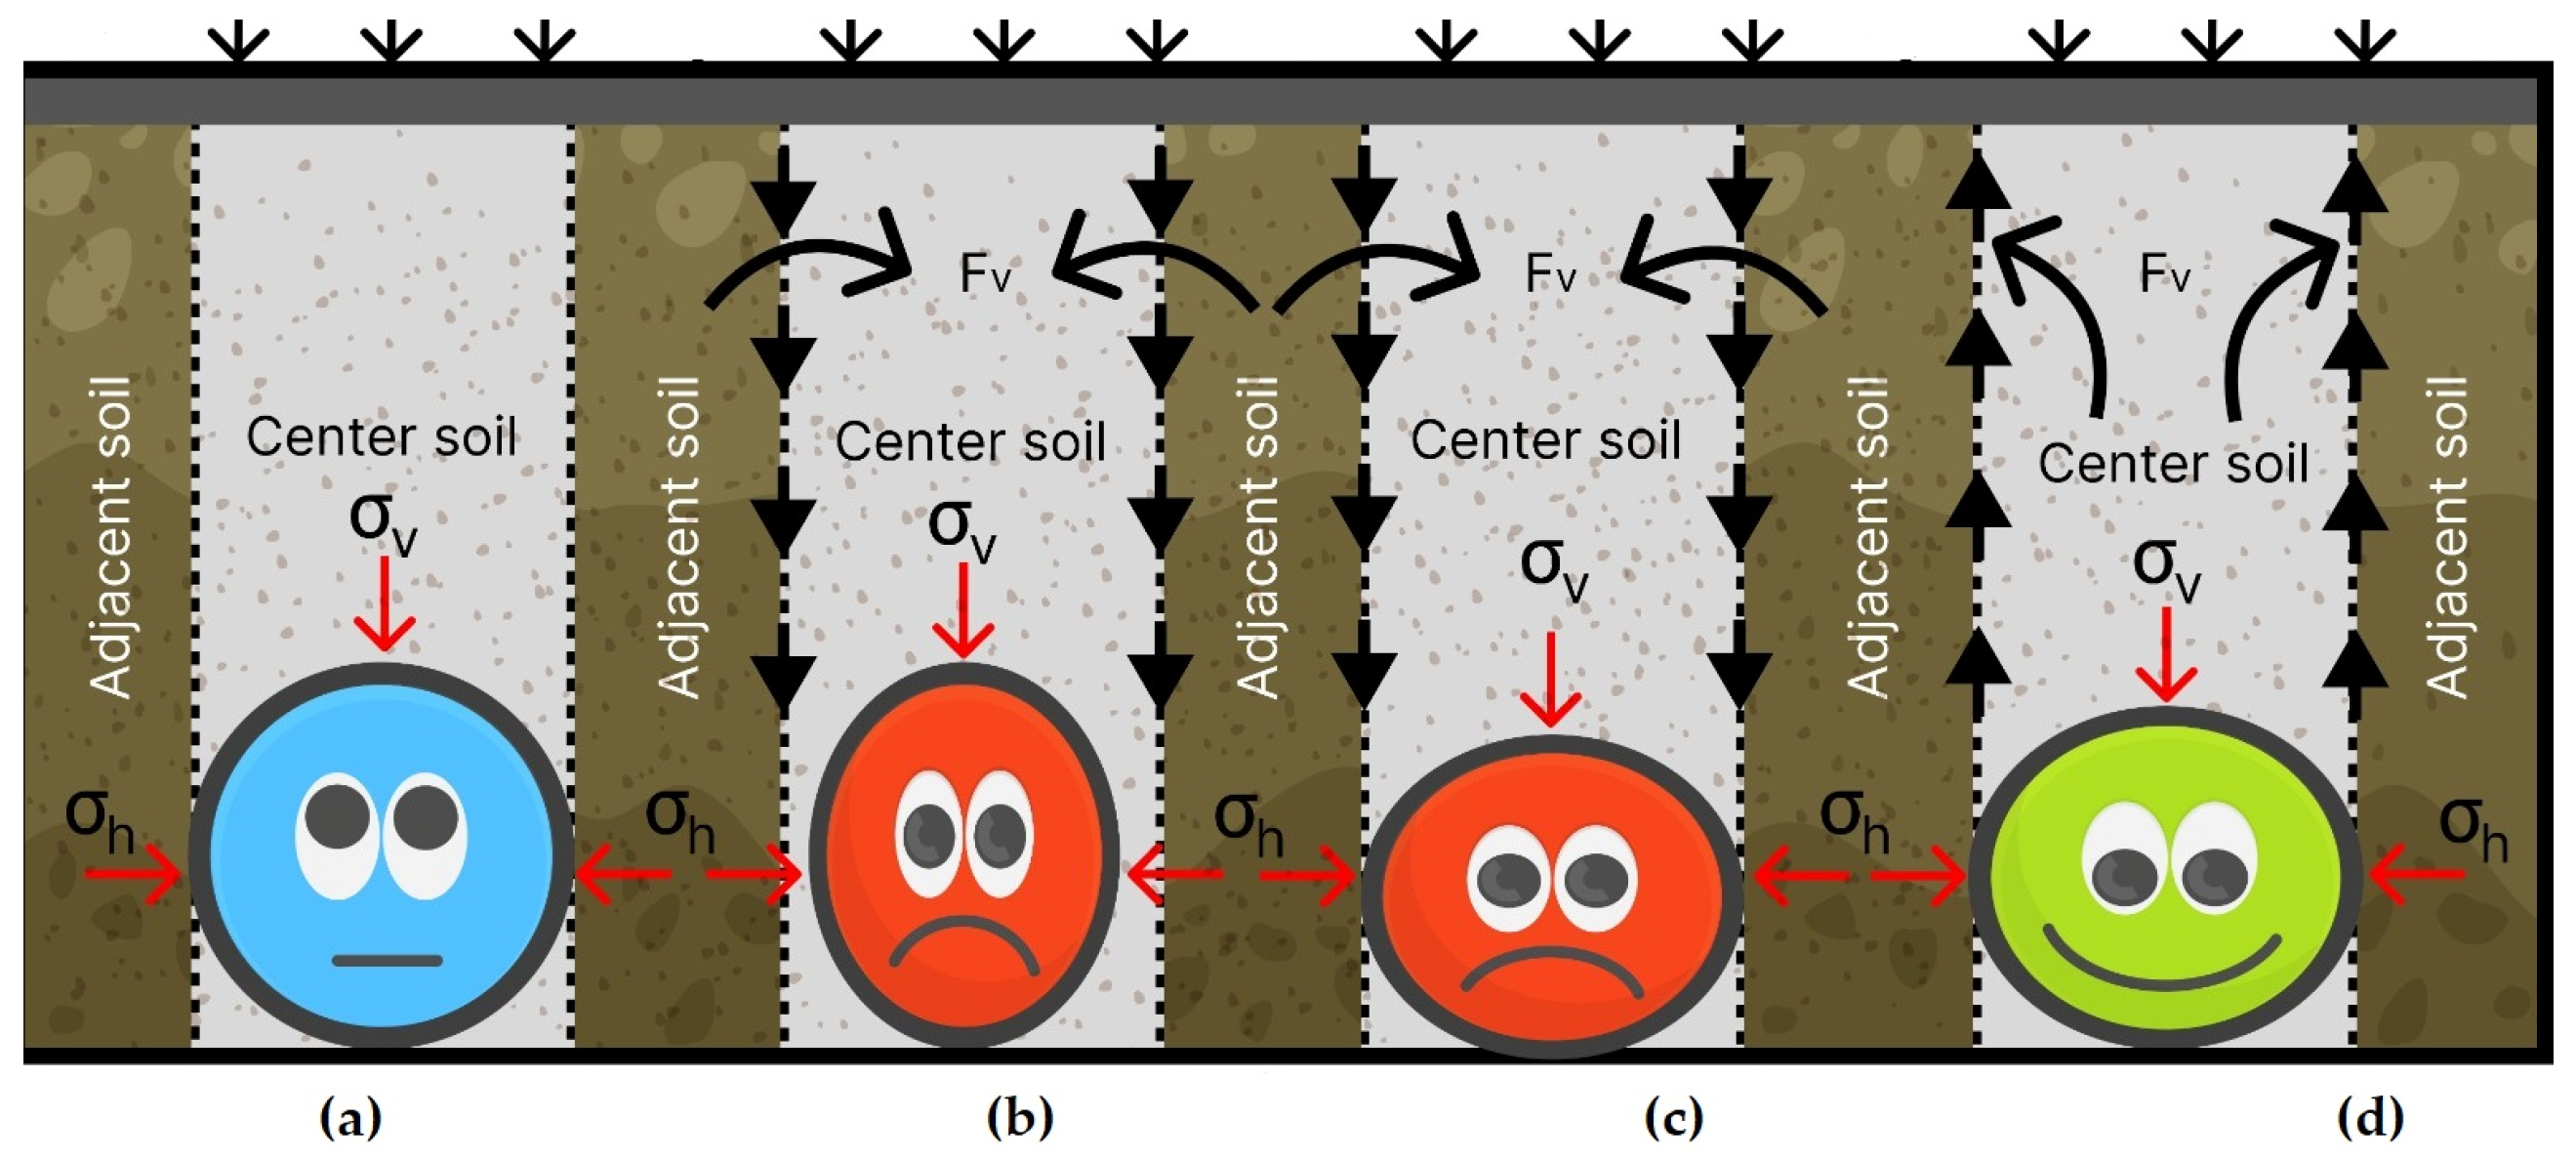
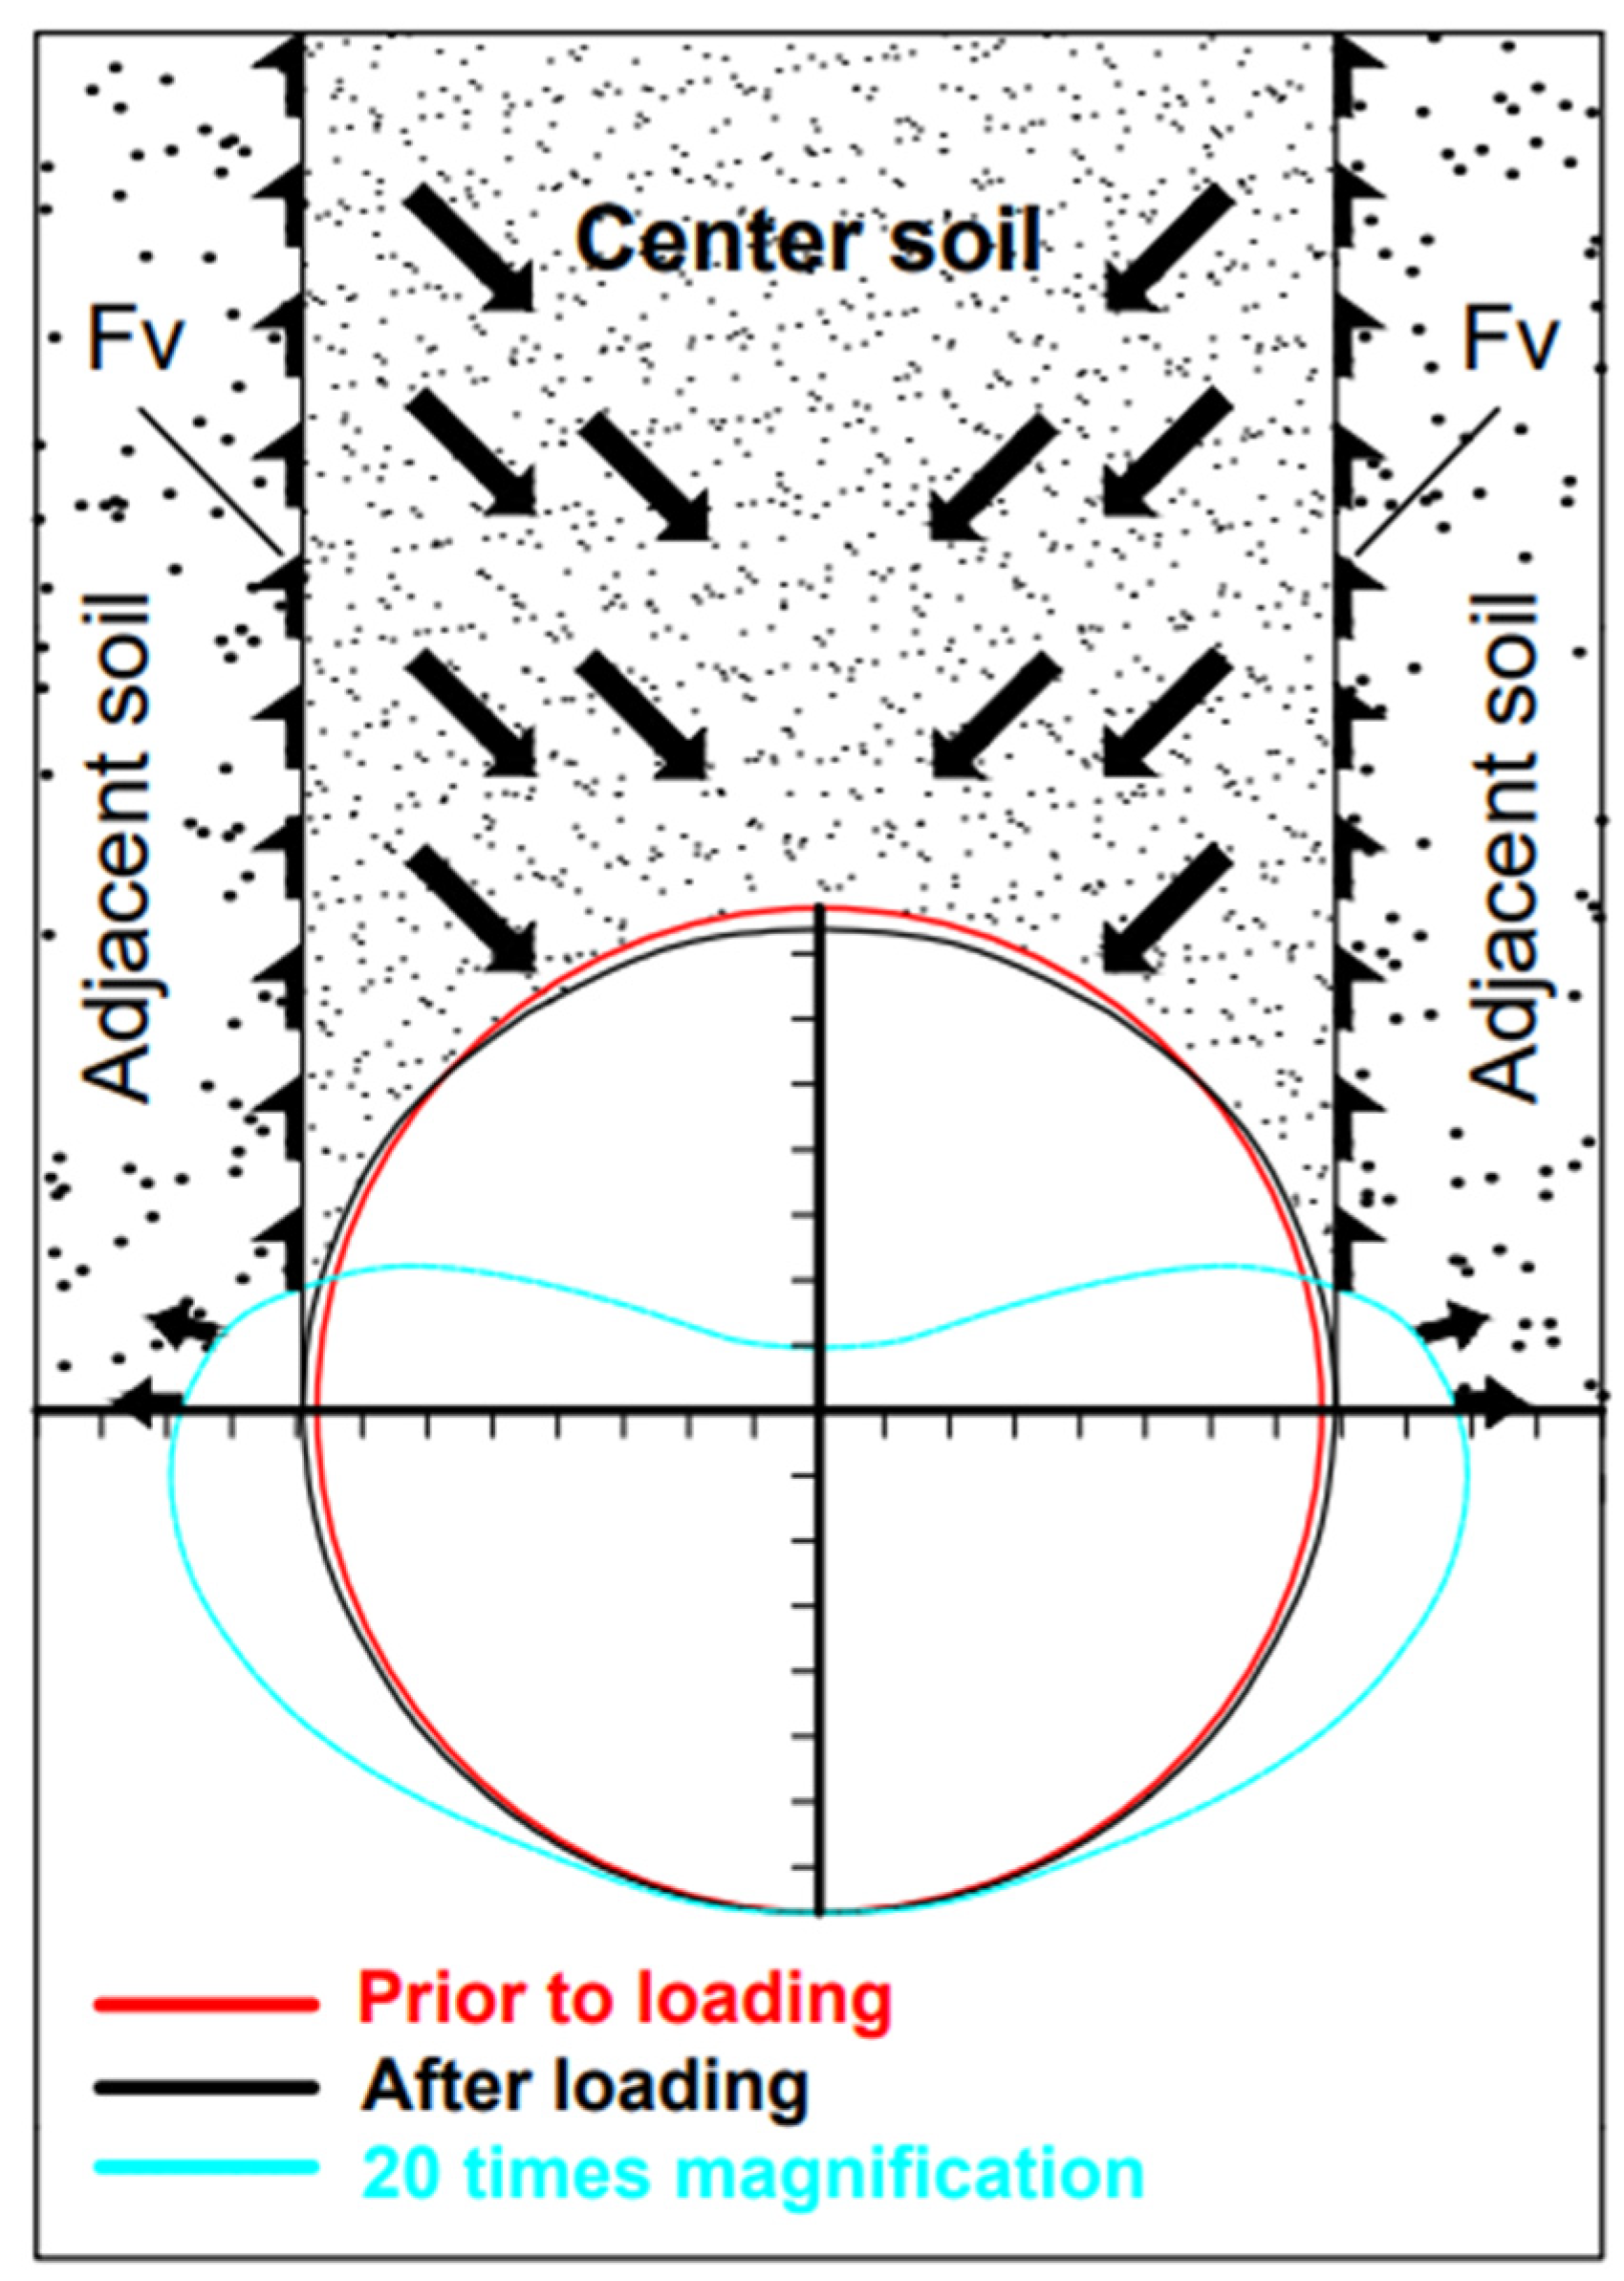
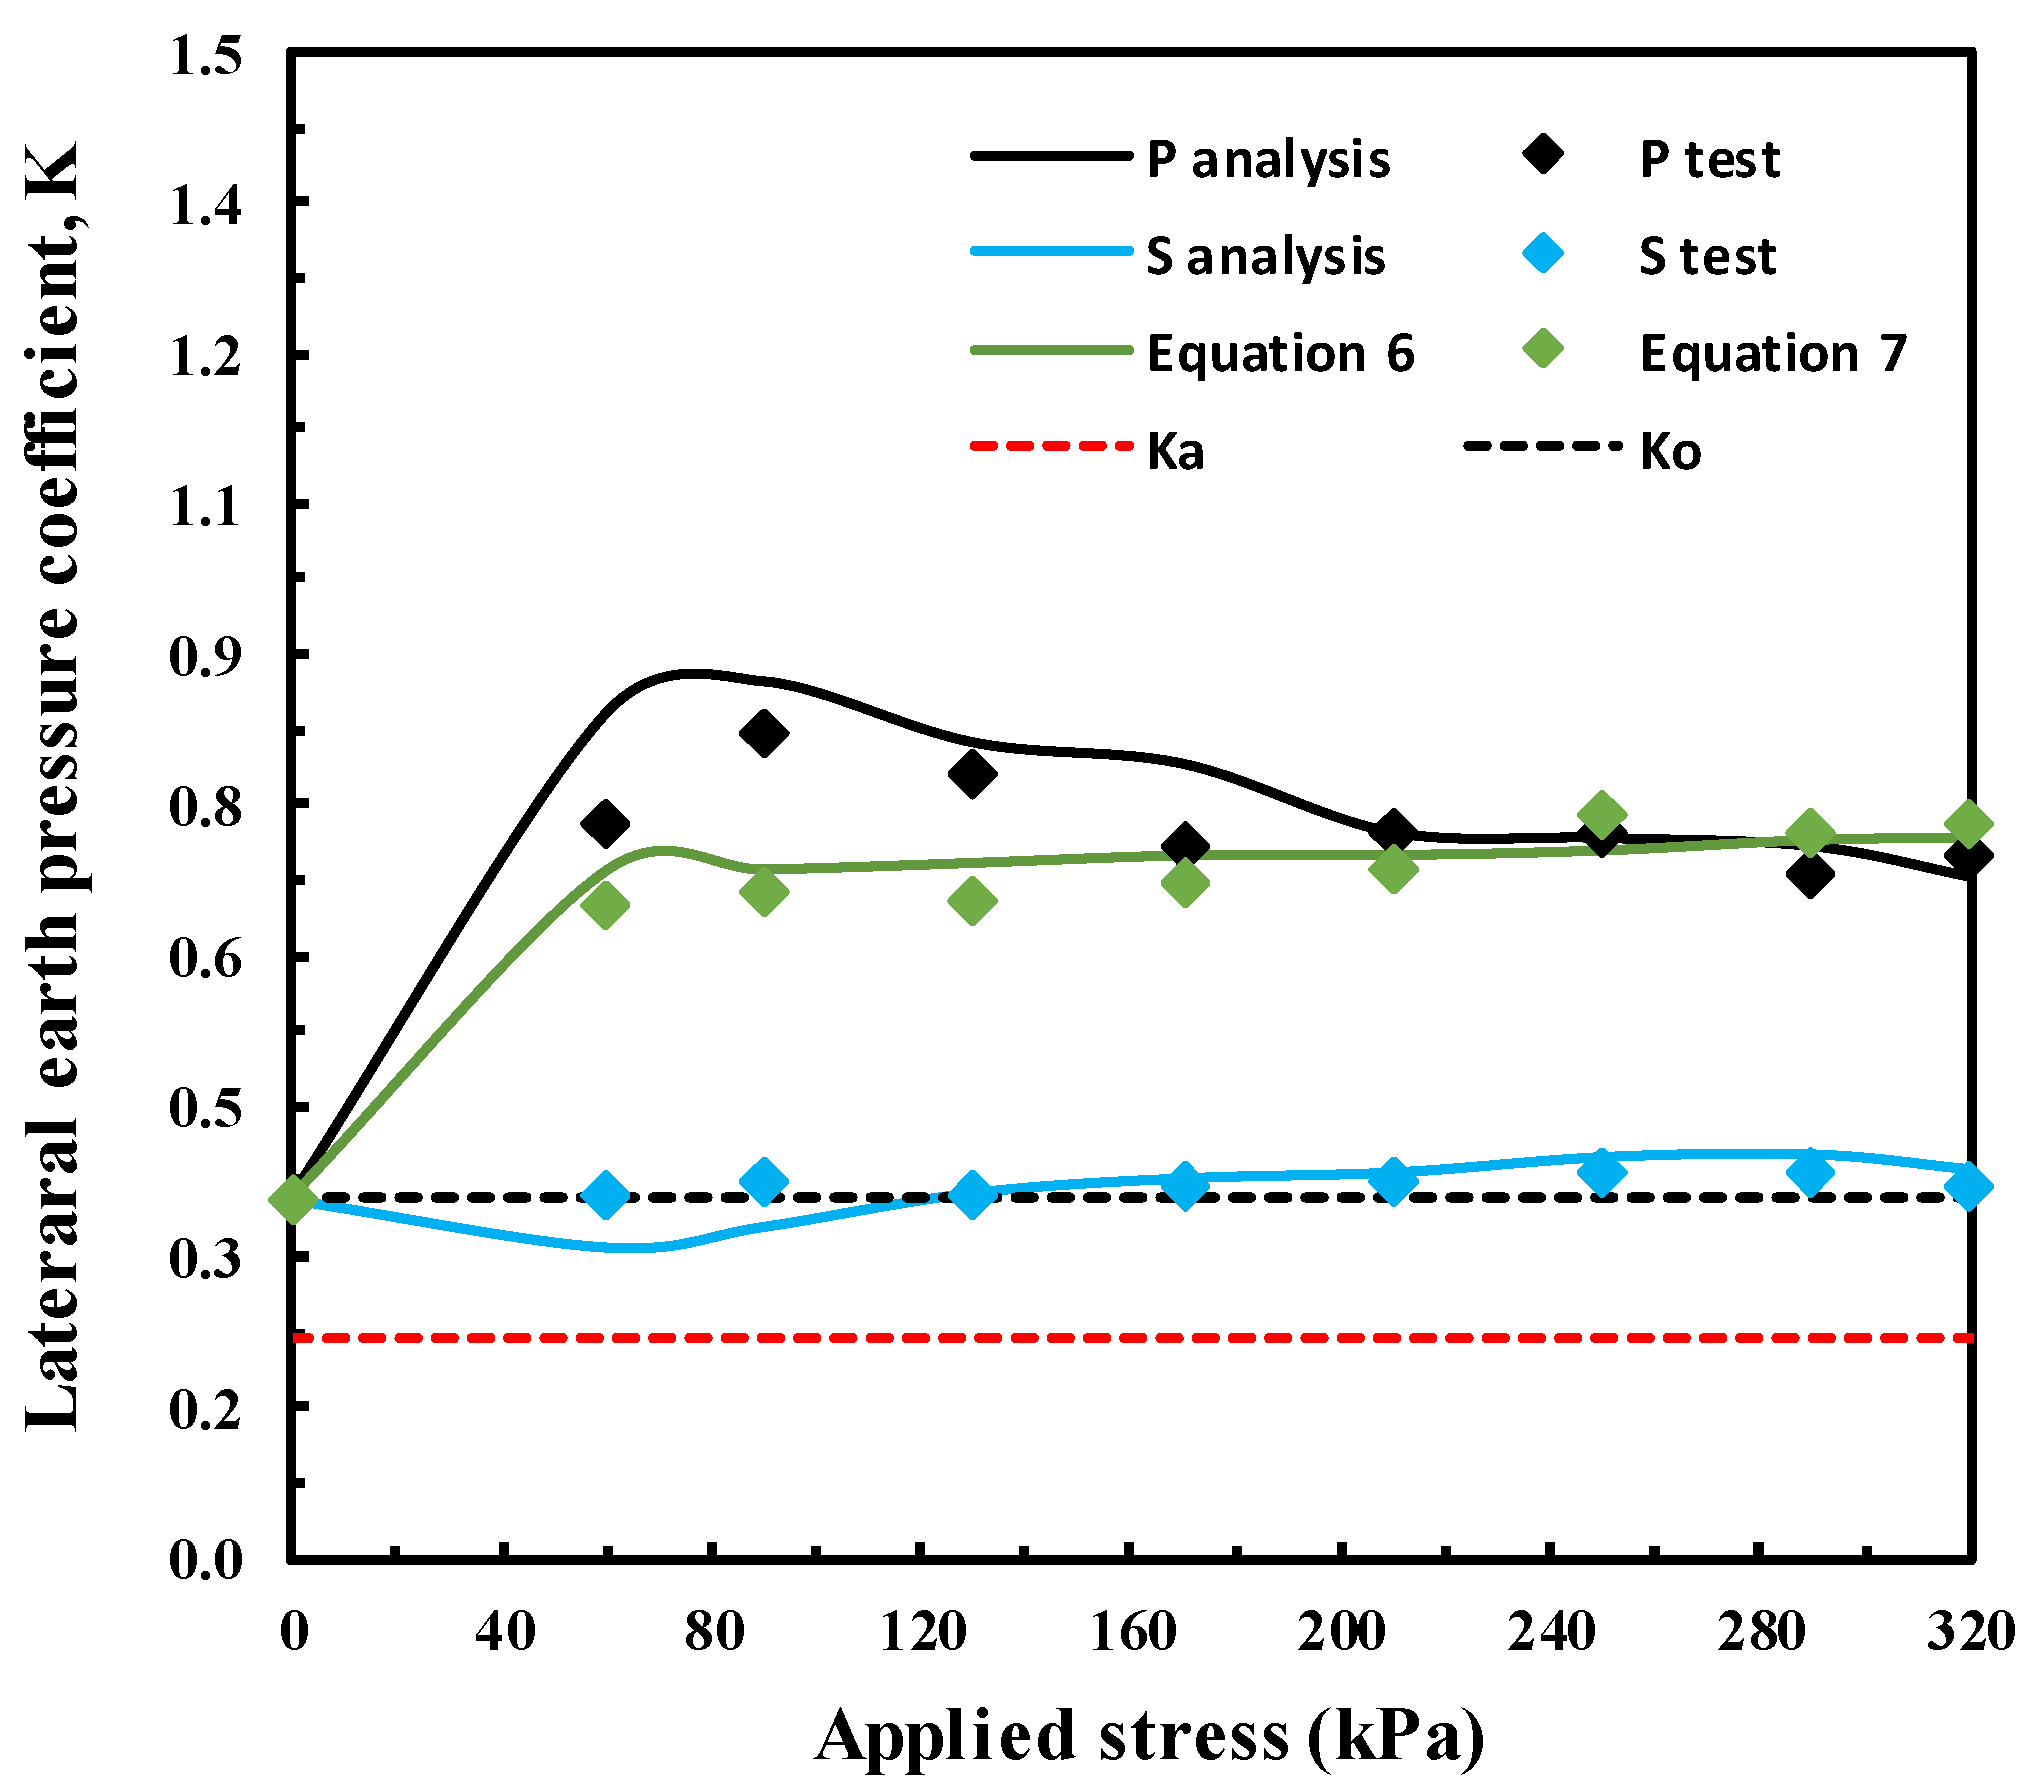
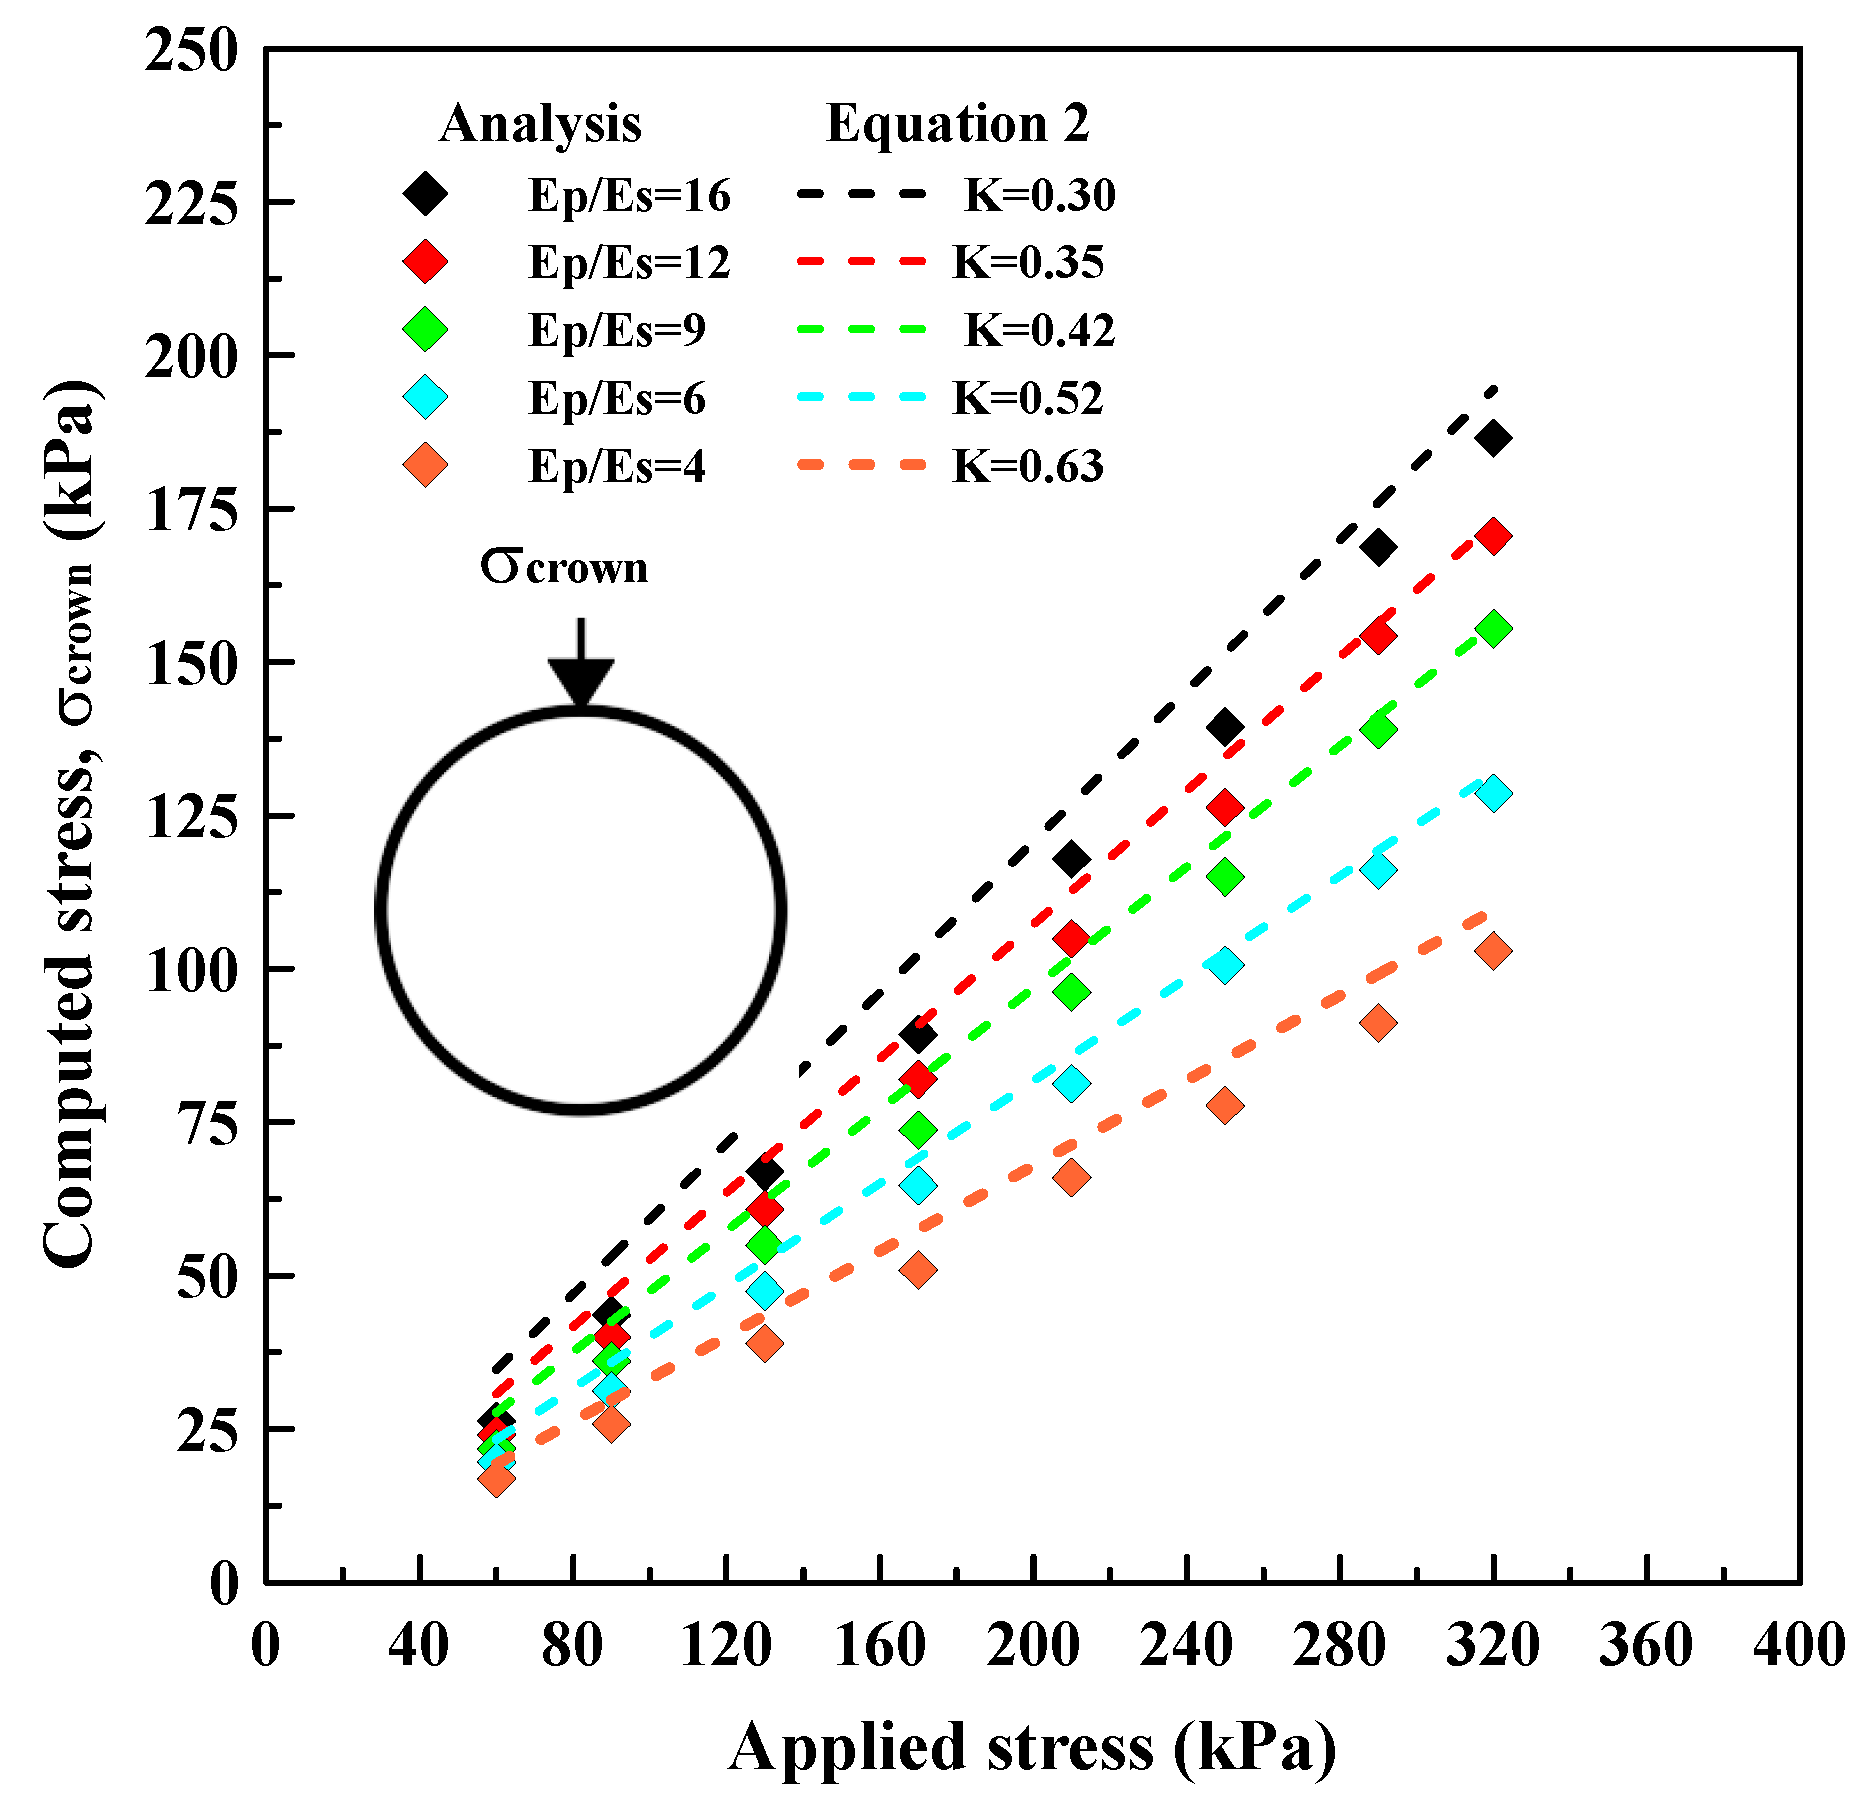
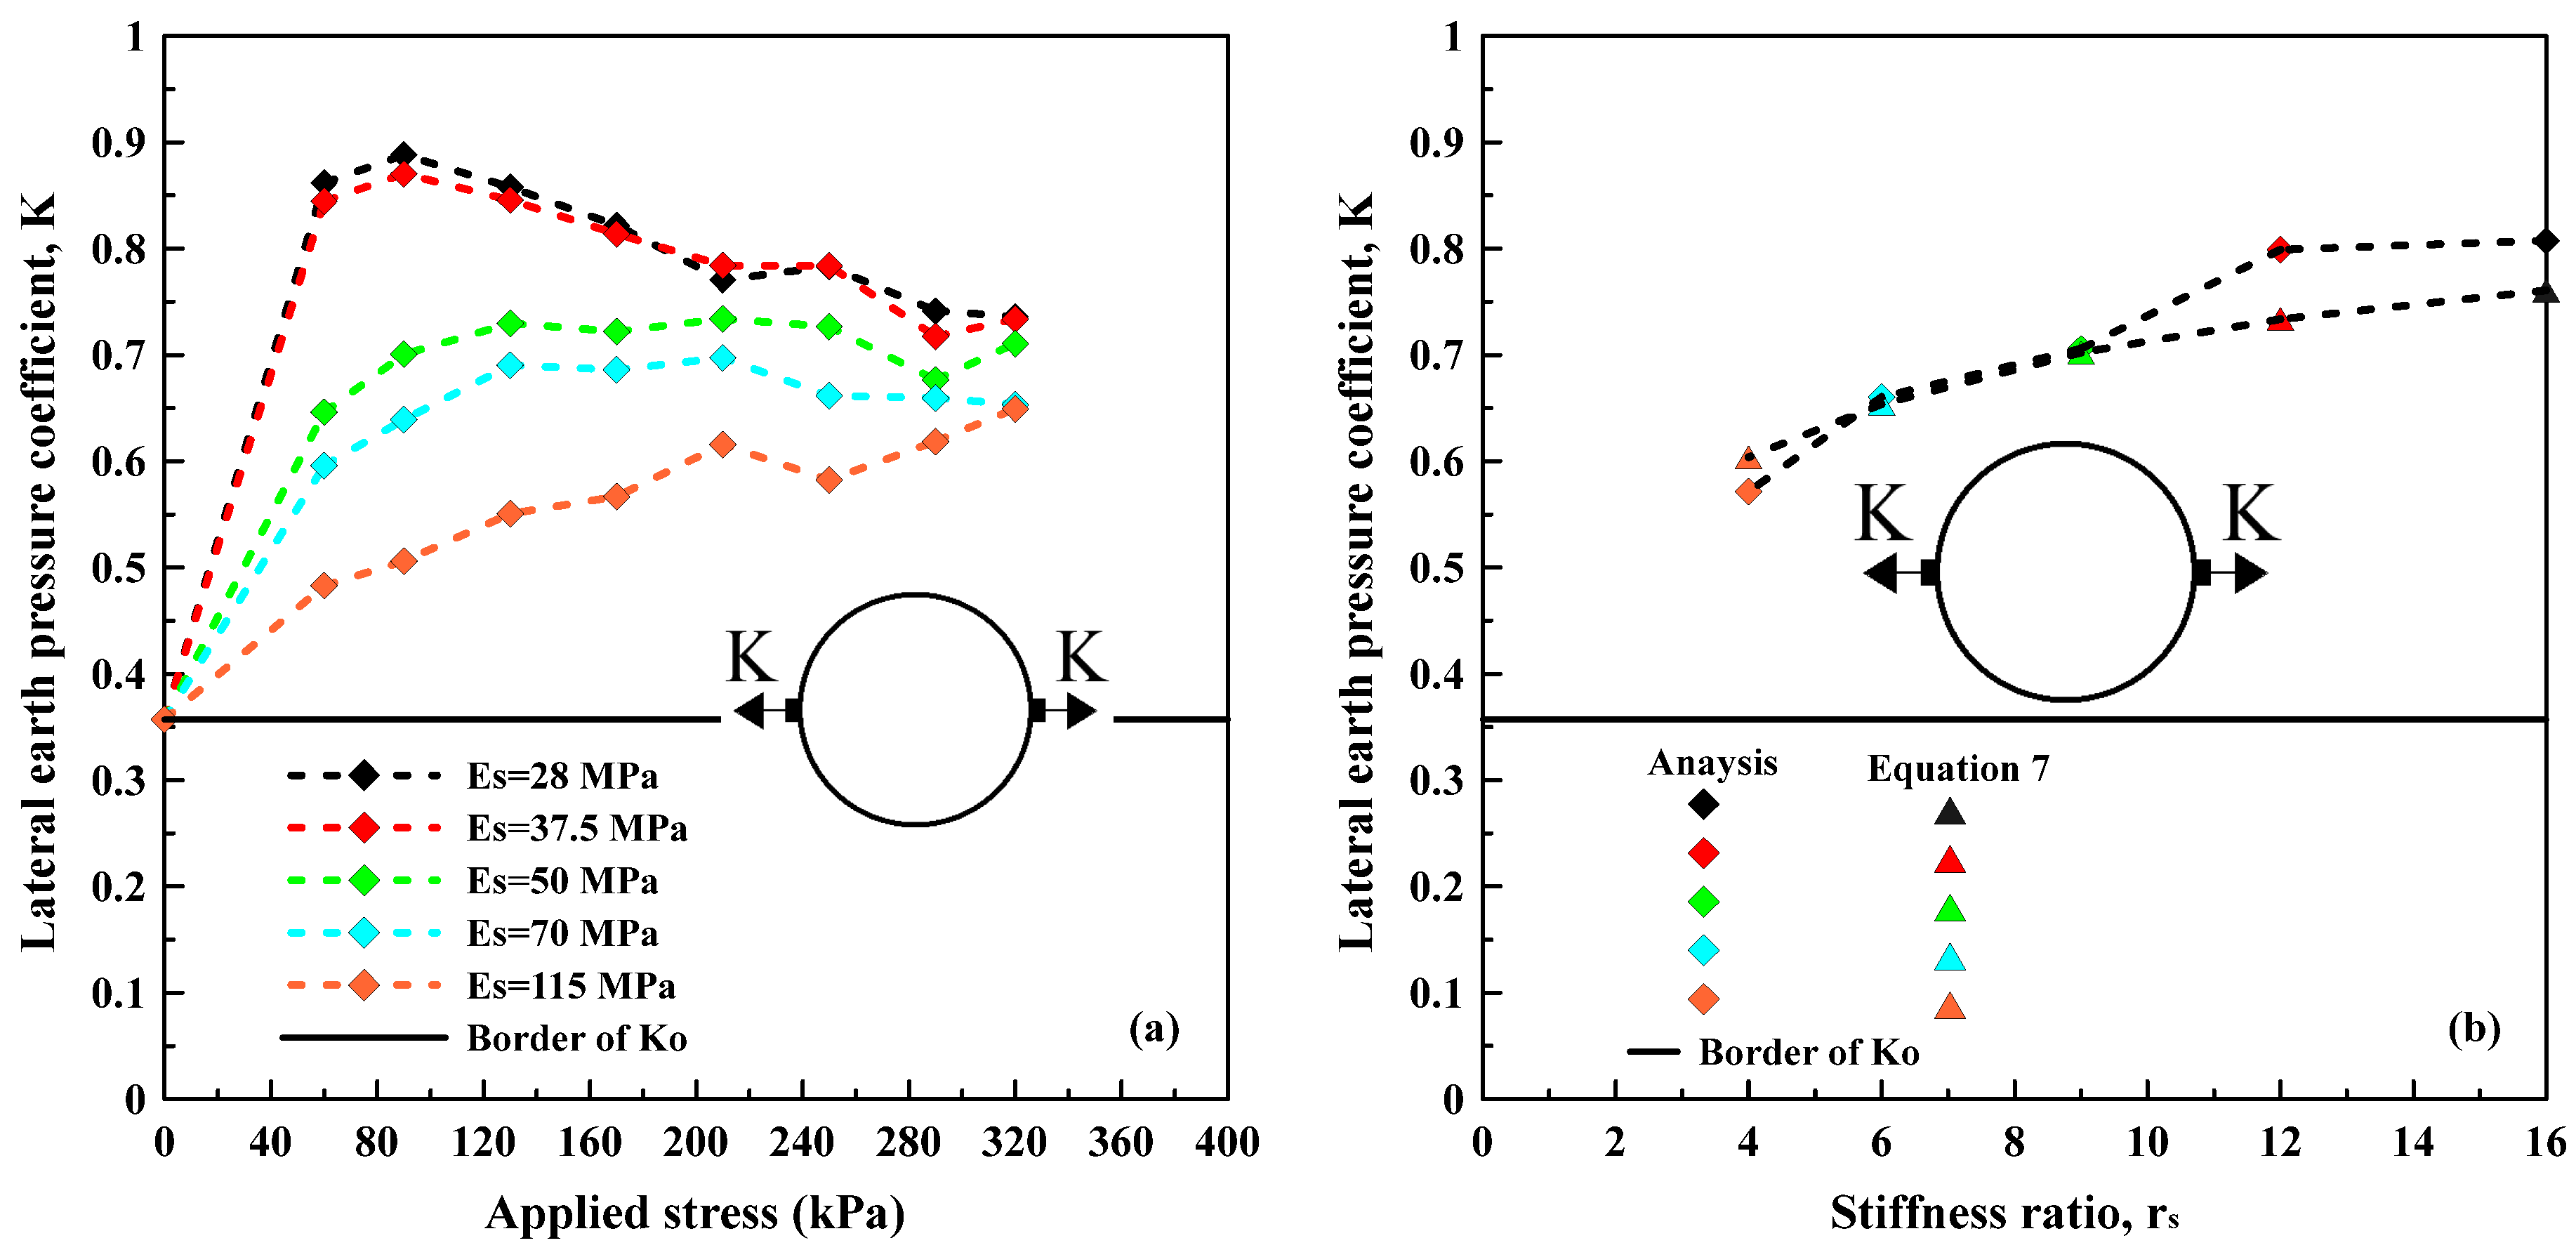
- Pipe deflections are a key parameter defining the behaviour of the system, particularly in the crown and springline regions. The lateral earth pressure in the Ko condition tends towards Kp as the arching effect increases in the central soil prism, and towards Ka as the arching effect weakens. The correct estimation of K in the central soil prism in the final situation indicates that the stresses applied to the crown can be computed using Terzaghi’s arching theory.
- The horizontal deflection of the pipe causes the backfill at the springline to move in the direction of the tank wall. As a result, the lateral earth pressure coefficient tends to convert from Ko to Kp, leading to an increase in horizontal stresses. This variation in K increases further towards the tank wall. In buried flexible pipe designs, where pipes are spaced and placed side by side, these horizontal effects will impose additional stresses on the neighbouring pipe. It is therefore essential that these effects are considered at the design stage.
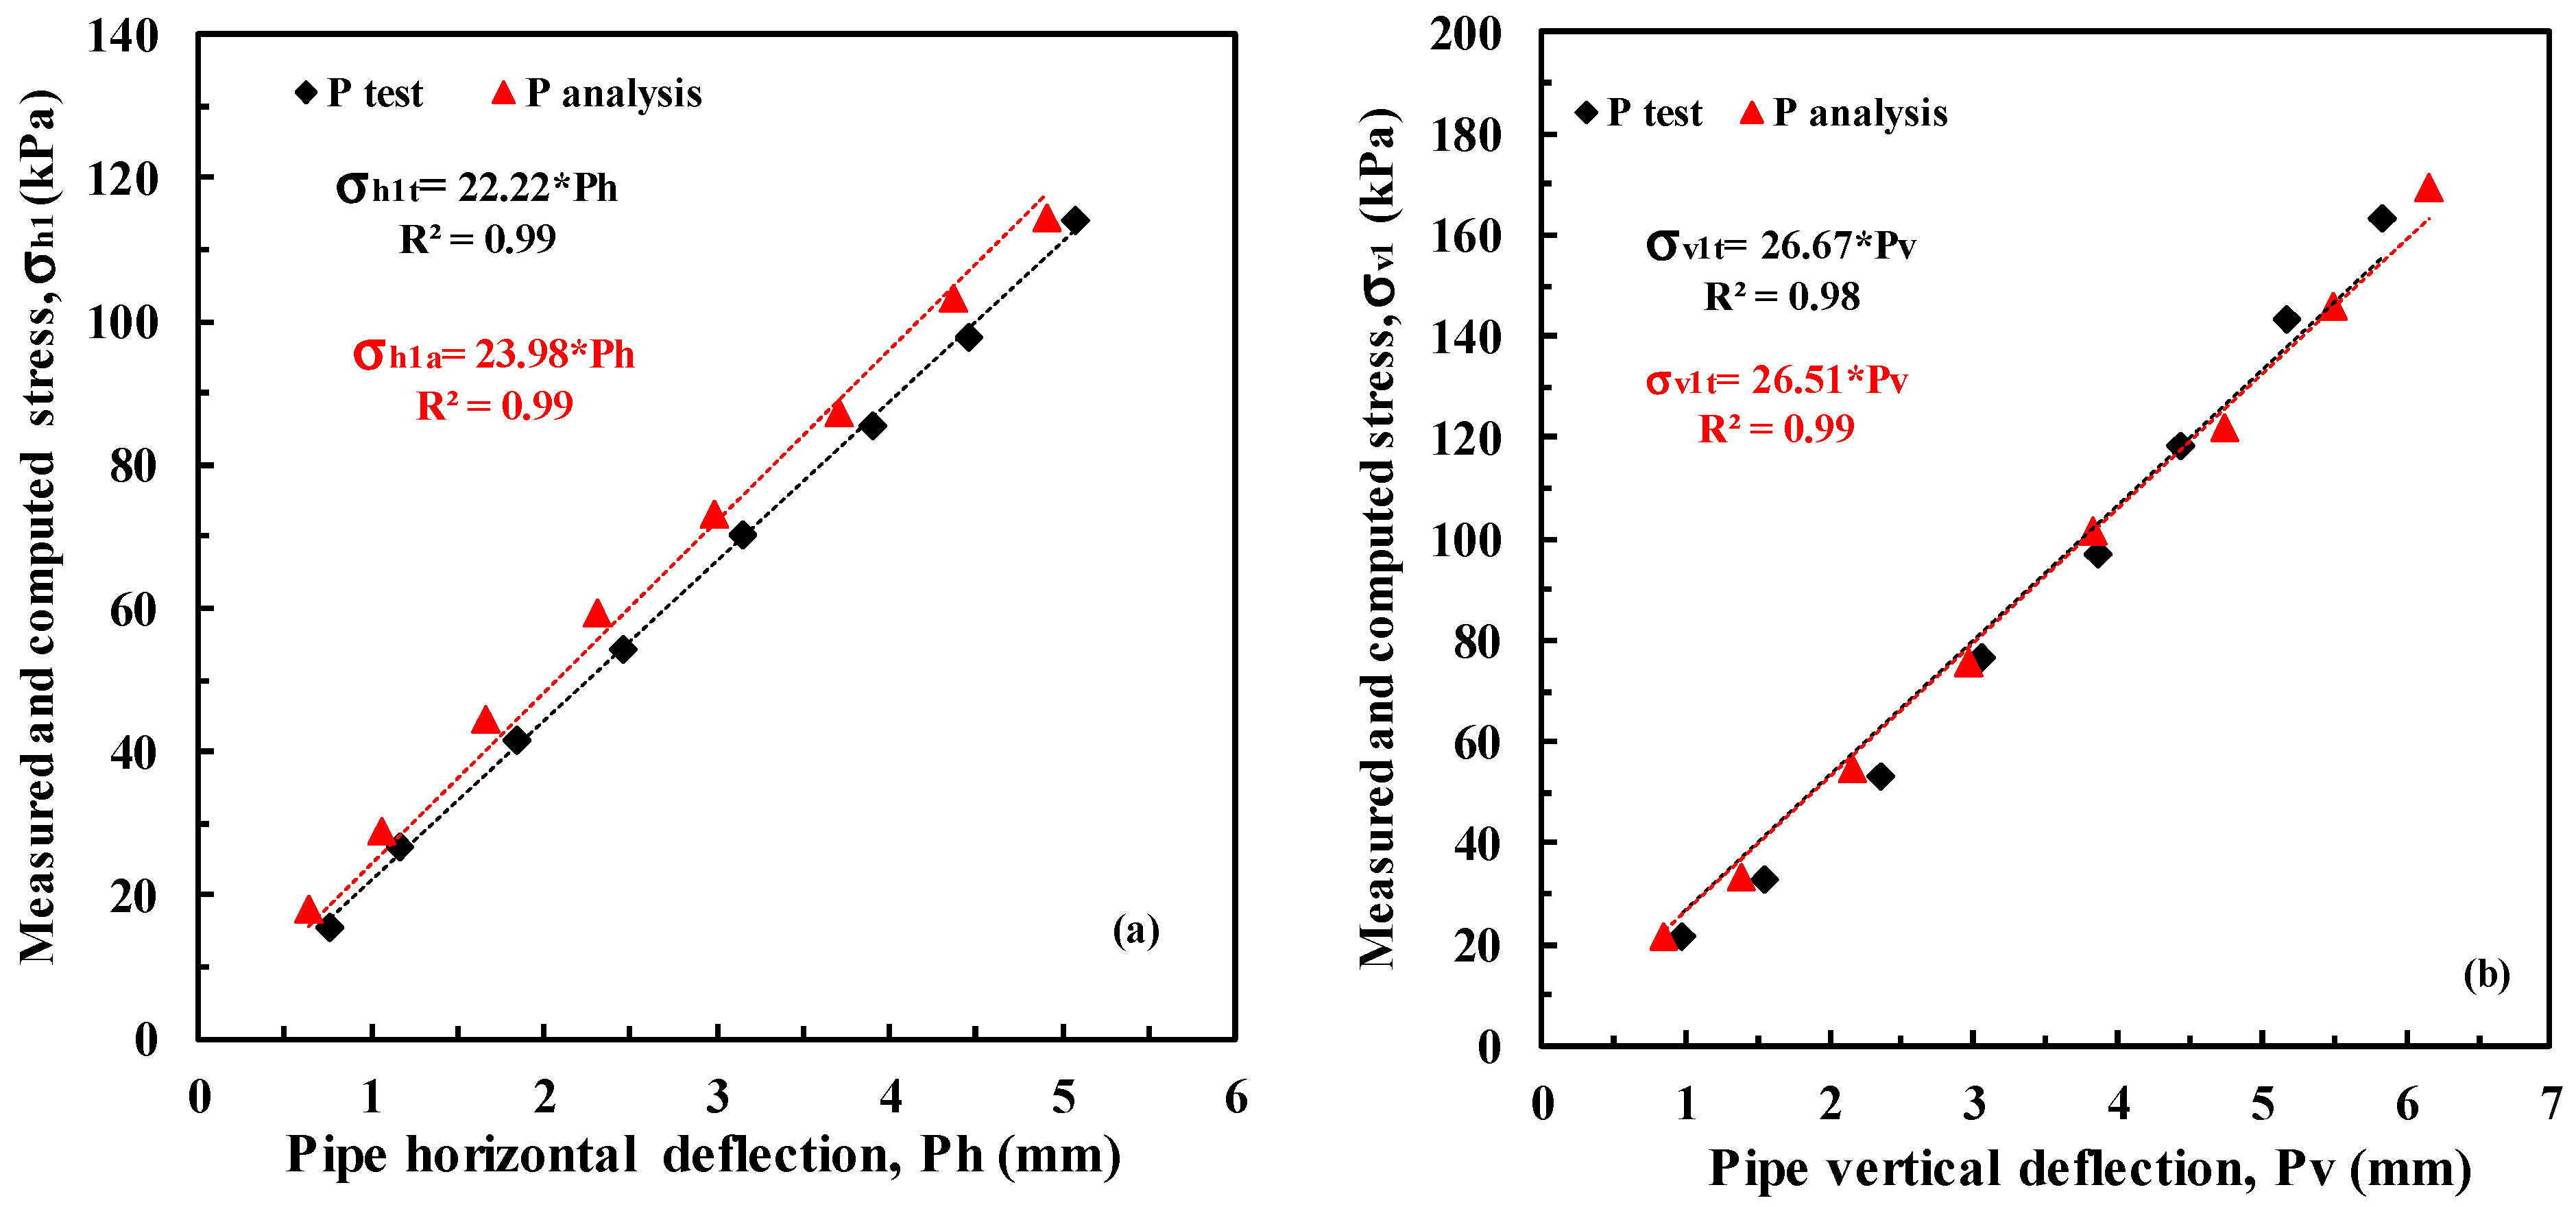
- The correlation between pipe deflections and stresses at the SP-1 was observed to be strong (R2 = 0.99). This relationship indicated that both horizontal and vertical stresses in the pipe springline can be defined by estimating pipe deflections.
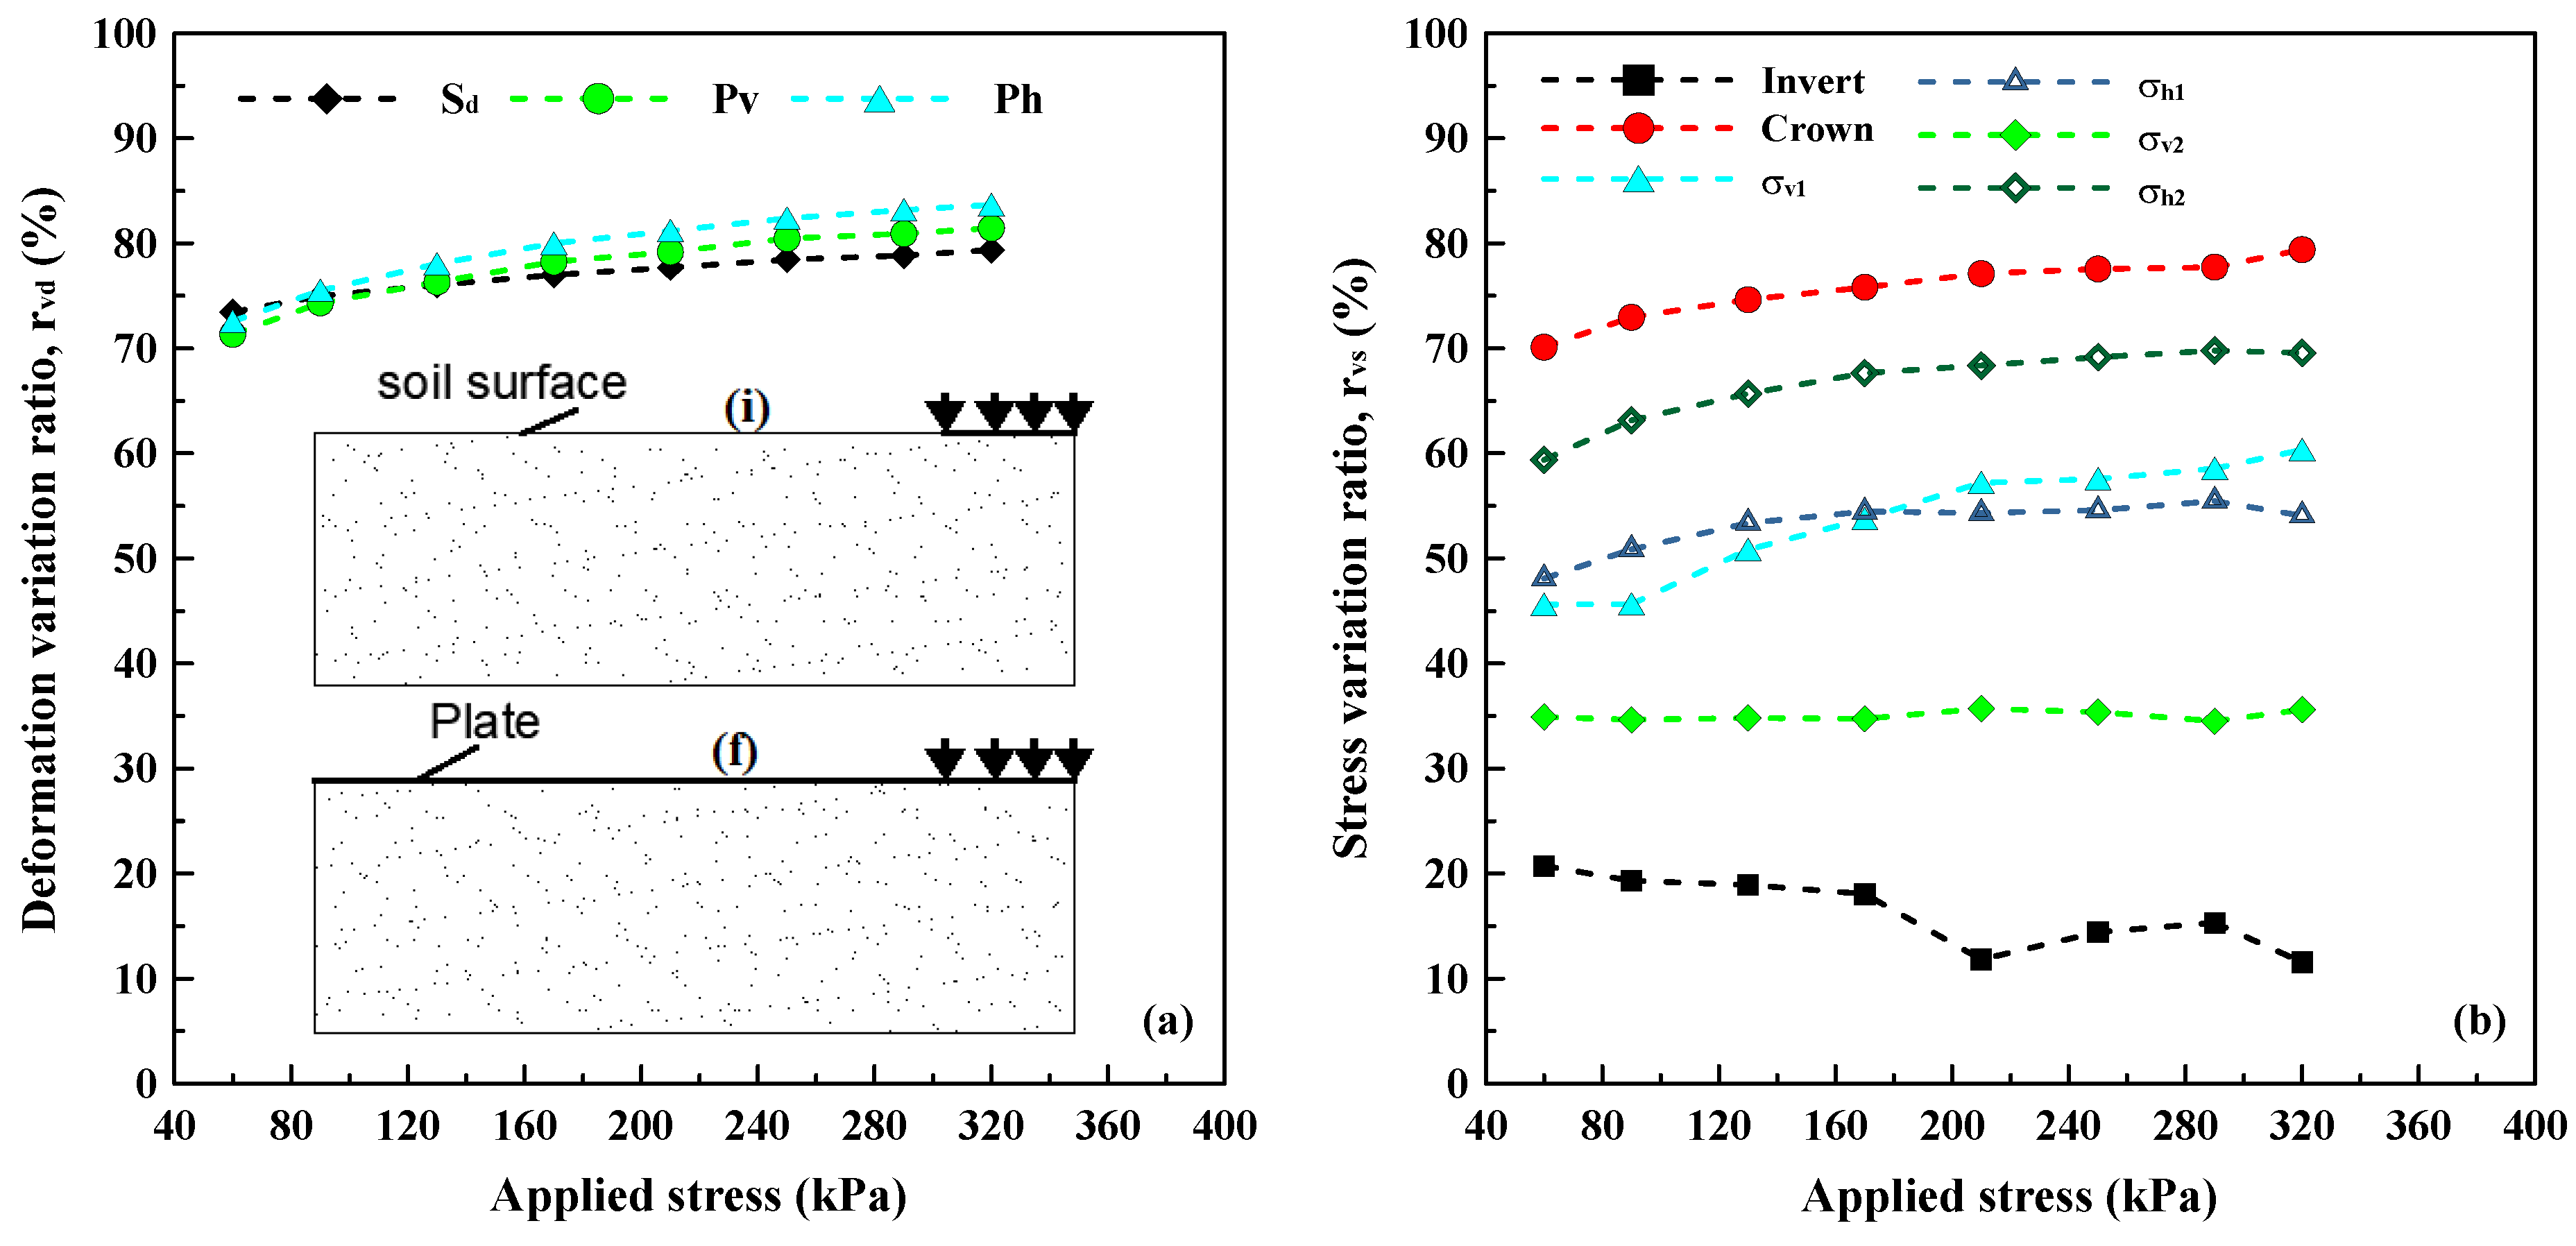
- The presence of a rigid pavement in shallow flexible buried pipes provided a more homogeneous distribution of localised stresses over a wider area. This variation in stress distribution resulted in a reduction in stress and deflection of up to 84%. Additionally, the lateral earth pressure coefficient approached Ko beyond a distance of D/3. This transition occurred due to the significant reduction in horizontal stresses from the spring line to the tank wall.
- Increasing the burial depth led to a significant reduction in stresses and pipe deflections. Specifically, the horizontal stresses at the springline decreased more than the vertical stresses, and the effect of these horizontal stresses extended to the tank wall.
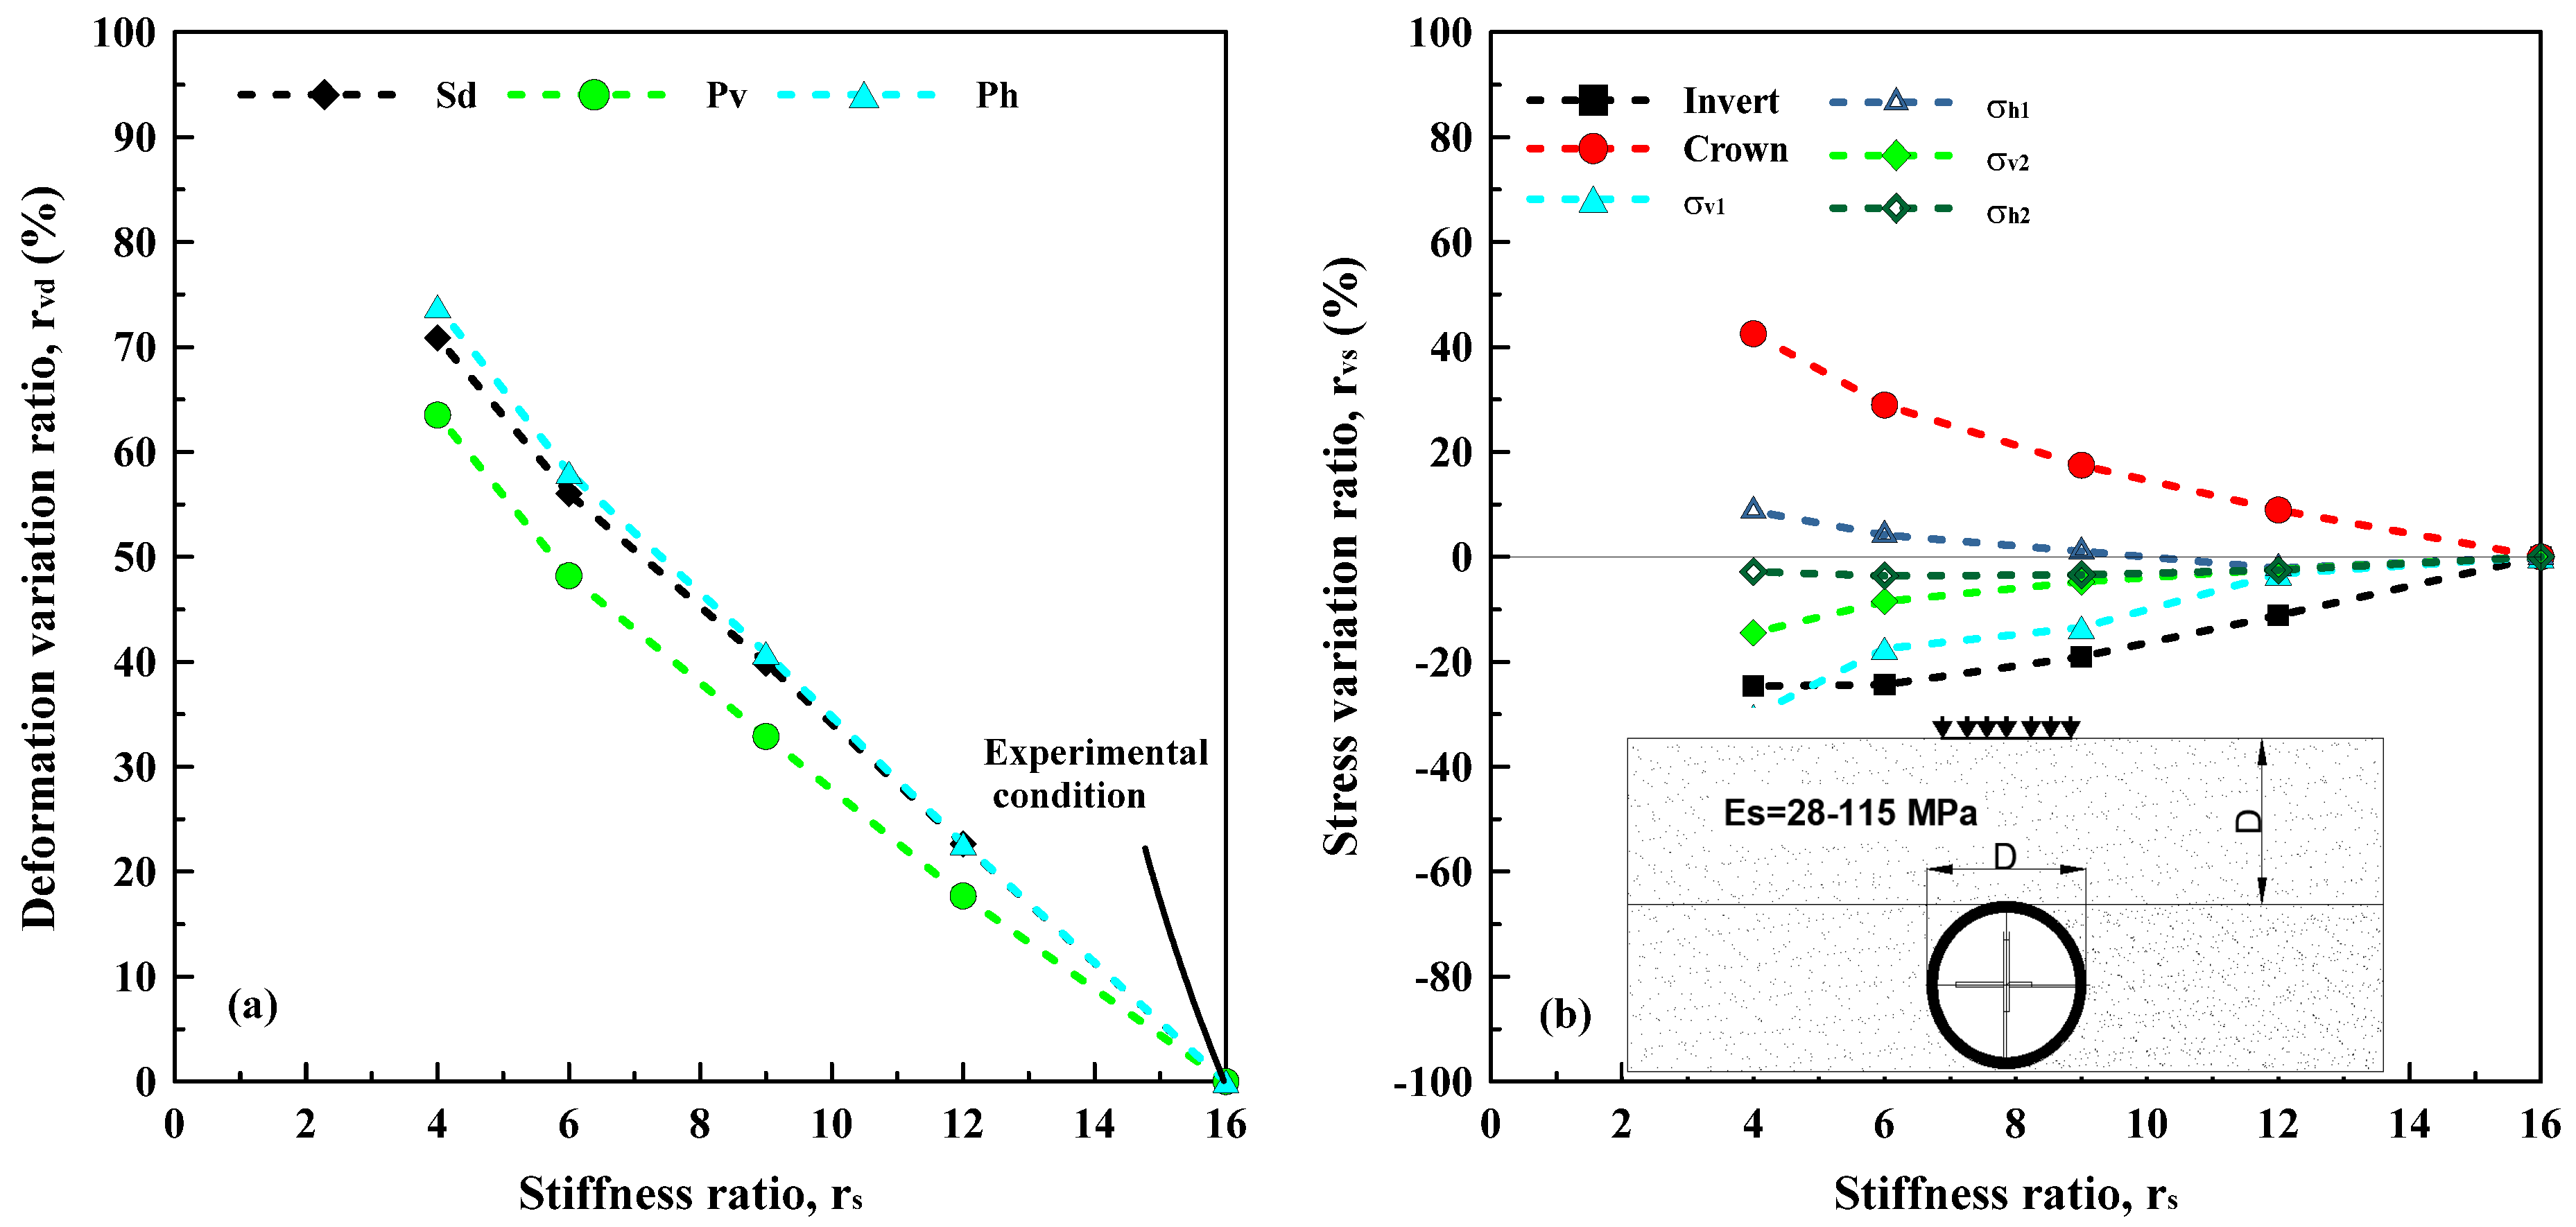
- The increase in pipe stiffness caused a noteworthy reduction in pipe deflections and horizontal stresses at the springline. In particular, the reduction in σv1 was more pronounced than the reduction in σh1 at the springline, and the gradual increase in Ep led to the establishment of the Ko condition along the sides of the pipe.
- The increment in backfill stiffness considerably reduced both Ph and Pv, enhancing soil support and arching. However, there was no considerable variation in the lateral stresses transmitted from the pipe to the backfill, and in the influence distance of these stresses, as the pipe stiffness remained constant.
Author Contributions
Funding
Data Availability Statement
Acknowledgments
Conflicts of Interest
Abbreviations and Notation
| D: Diameter | Ph: Pipe horizontal deflection |
| di: initial displacement or deflection | Pv: Pipe vertical deflection |
| df: Final displacement or deflection | rs: Stiffness ratio |
| dr: Deformation ratio | rvd: Deformation variation ratio |
| EA: Axial stiffness | rvs: Sress variation ratio |
| EI: Bending stiffness | Sd: Surface displacement |
| Es: Soil elasticity modulus | SP: Poorly graded sand |
| Ep: Pipe elasticity modulus | SP-1: Measuring location 1 in the springline |
| EPS: Expanded Polystyrene | SP-2: Measuring location 2 in the springline |
| FE: Finite element | uypv: Pipe vertical deflection |
| Fv: The frictional force in vertical planes | uys: Displacement of backfill |
| h: Burial depth | σ: Stress |
| HDPE: High Density Polyethylene | σcrown: Stress in crown |
| H.S: Hardening soil | σf: Final stress |
| K: Lateral earth pressure coefficient | σh: Horizontal stress |
| Ka: Rankine’s active lateral earth pressure coefficient | σh1: Horizontal stress in SP-1 |
| Ko: Lateral earth pressure coefficient at rest | σh2: Horizontal stress in SP-2 |
| Kp: Passive lateral earth pressure coefficient | σi: Initial stress |
| L: Loadcell | σv: Vertical stress |
| L.E: Linear elastic | σv1: Vertical stress in SP-1 |
| LVDT: linear variable differential transformer | σv2: Vertical stress in SP-1 |
| m: meter | USCS:Unified Soil Classification System |
| SP: Poorly graded sand |
References
- Moore, I.D.; Lapos, B.; Mills, C. Biaxial Testing to Investigate Soil-Pipe Interaction of Buried Fiber-Reinforced Cement Pipe. Transp. Res. Rec. J. Transp. Res. Board 2004, 1868, 169–174. [Google Scholar] [CrossRef]
- Moser, A.P.; Folkman, S. Buried Pipe Design, 3rd ed.; McGraw-Hill: New York, NY, USA, 2008. [Google Scholar]
- NCHRP (National Cooperative Highway Research Program). Report 429: Transportation Research Board National Research Council HDPE Pipe: Recommended Material Specifications and Design Requirements; National Academy Press: Washington, DC, USA, 1999. [Google Scholar]
- CPPA (Corrugated Polyethylene Pipe Association). Recommended Installation Practices for Corrugated Polyethylene Pipe and Fittings; CPPA: Washington, DC, USA, 2006; pp. 25–26. [Google Scholar]
- AASHTO. Load and Resistance Factor Design Bridge Design Specifications, 4th ed.; American Association of State Transportation Officials: Washington, DC, USA, 2007. [Google Scholar]
- Motahari, A.; Abolmaali, A. Structural deformation characteristics of installed HDPE circular pipelines. J. Transp. Eng. 2010, 136, 298–303. [Google Scholar] [CrossRef]
- Parker, B.A.; McAffee, R.P.; Valsangkar, A.J. Field performance and analysis of 3-m-diameter induced trench culvert under a 19.4-m soil cover. Transp. Res. Rec. 2008, 2045, 68–76. [Google Scholar] [CrossRef]
- Meguid, M.A.; Ahmed, M.R.; Hussein, M.G. Earth pressure distribution on a rigid box covered with u-shaped geofoam wrap. Int. J. Geosynth. Ground Eng. 2017, 3, 11. [Google Scholar] [CrossRef]
- Kang, J. Finite element analysis for deeply buried concrete pipes in proposed imperfect trench installations with expanded polystyrene (EPS) foams. Eng. Struct. 2019, 189, 286–295. [Google Scholar] [CrossRef]
- Kılıç, H.; Akınay, E. Effects of using eps geofoam as compressible inclusion on hdpe pipe behavior. J. Pipeline Syst. Eng. Pract. 2019, 10, 04019006. [Google Scholar] [CrossRef]
- Meguid, M.A.; Ahmed, M.R. Earth pressure distribution on buried pipes installed with geofoam inclusion and subjected to cyclic loading. Int. J. Geosynth. Ground Eng. 2020, 6, 2. [Google Scholar] [CrossRef]
- Al-Naddaf, M.; Rasheed, S.E.; Rahmaninezhad, S.M.; Han, J. Effects of geofoam geometry and location on vertical stresses on buried culverts during construction and under surface loading. In Proceedings of the Geosynthetics Conference 2021, Online, 22–25 February 2021; pp. 549–560. [Google Scholar]
- Mahgoub, A.; El Naggar, H. Innovative application of tire-derived aggregate around corrugated steel plate culverts. J. Pipeline Syst. Eng. Pract. 2022, 11, 04020025. [Google Scholar] [CrossRef]
- Moghaddas Tafreshi, S.N.; Joz Darabi, N.; Dawson, A.R.; Azizian, M. An experimental evaluation of geocell and eps geofoam as means of protecting pipes at the bottom of repeatedly loaded trenches. Int. J. Geomech. 2020, 20, 04020023. [Google Scholar] [CrossRef]
- Katona, M.G.; Akl, A.Y. Analysis and behaviour of buried culverts with slotted joints. Transp. Res. Rec. J. Transp. Res. Board 1985, 1008, 22–32. [Google Scholar]
- Masajedian, S. Experimental Investigation of the Behaviour of the Steel Reinforced High Density Polyethylene and Corrugated Metal Pipe. Master’s Thesis, The University of Texas at Arlington, Arlington, TX, USA, 2011. [Google Scholar]
- Watkins, R.K.; Dwiggins, J.M.; Altermatt, W.E. Structural design of buried corrugated polyethylene pipes. Transp. Res. Rec. 1987, 1129, 12–20. [Google Scholar]
- Klaiber, F.W.; Lohnes, R.A.; Wipt, T.J.; Conard, B.E.; Ng, K.W. Investigation of High Density Polyethylene Pipe for Highway Applications, Final Rep.: Phase II; Iowa DOT Project HR-373A; Iowa State University: Ames, IA, USA, 1997. [Google Scholar]
- Faragher, E.; Fleming, P.R.; Rogers, C.D. Analysis of repeated-load field testing of buried plastic pipes. J. Transp. Eng. 2000, 126, 271–277. [Google Scholar] [CrossRef]
- Sargand, S.M.; Masada, T.; White, K.E.; Altarawneh, B. Profile-Wall High-Density Polyethylene Pipes 1050 mm in Diameter under Deep Soil Cover: Comparisons of Field Performance Data and Analytical Predictions. Transp. Res. Rec. 2002, 1814, 186–196. [Google Scholar] [CrossRef]
- Chaallal, O.; Arockiasamy, M.; Godat, A. Field test performance of buried flexible pipes under live truck loads. J. Perform. Constr. Facil. 2015, 29, 04014124. [Google Scholar] [CrossRef]
- Fang, H.; Tan, P.; Li, B.; Yang, K.; Zhang, Y. Influence of Backfill Compaction on Mechanical Characteristics of High-Density Polyethylene Double-Wall Corrugated Pipelines. Math. Probl. Eng. 2019, 2019, 1–24. [Google Scholar] [CrossRef]
- Marston, A.; Anderson, A.O. The Theory of Loads on Pipes in Ditches and Tests of Cement and Clay Drain Tile and Sewer Pipes; Bulletin 3I; Iowa Engineering Station: Ames, IA, USA, 1913. [Google Scholar]
- Marston, A. The Theory of External Loads on Closed Conduits in the Light of the Latest Experiments; Bulletin 96; Iowa Engineering Experiment Station: Ames, IA, USA, 1930; pp. 138–170. [Google Scholar]
- Terzaghi, K. Stress distribution in dry and in saturated sand above a yielding trapdoor. In Proceedings of the 1st International Conference on Soil Mechanics and Foundation Engineering, Harvard, MA, USA, 22–26 June 1936; Volume 1, pp. 307–311. [Google Scholar]
- Terzaghi, K. Theoretical Soil Mechanics; Wiley: New York, NY, USA, 1943. [Google Scholar]
- Kang, J.; Jung, Y.; Ahn, Y. Cover requirements of thermoplastic pipes used under highways. Compos. Part B 2013, 55, 184–192. [Google Scholar] [CrossRef]
- Fang, H.; Tan, P.; Du, X.; Li, B.; Yang, K.; Zhang, Y. Numerical and Experimental Investigation of the Effect of Traffic Load on the Mechanical Characteristics of HDPE Double-Wall Corrugated Pipe. Appl. Sci. 2020, 10, 627. [Google Scholar] [CrossRef]
- Engesser, F. Über den Erdduck gegen innere Stützwände (Tunnelwande). Dtsch. Bauztg. 1882, 16, 91–93. (In German) [Google Scholar]
- Ladanyi, B.; Hoyaux, B. A study of the trap-door problem in a granular mass. Can. Geotech. J. 1969, 6, 1–14. [Google Scholar] [CrossRef]
- Evans, C.H. An Examination of Arching in Granular Soils. Ph.D. Thesis, Massachusetts Institute of Technology, Cambridge, MA, USA, 1983. [Google Scholar]
- Costa, Y.D.; Zornberg, J.G.; Bueno, B.S.; Costa, C.L. Failure mechanisms in sand over a deep active trapdoor. J. Geotech. Geoenviron. Eng. 2009, 135, 1741–1753. [Google Scholar] [CrossRef]
- Chevalier, B.; Combe, G.; Villard, P. Experimental and discrete element modeling studies of the trapdoor problem: Influence of the macro-mechanical frictional parameters. Acta Geotech. 2012, 7, 15–39. [Google Scholar] [CrossRef]
- Iglesia, G.R.; Einstein, H.H.; Whitman, R.V. Investigation of soil arching with centrifuge tests. J. Geotech. Geoenviron. Eng. 2014, 140, 04013005. [Google Scholar] [CrossRef]
- Chen, R.P.; Tang, L.J.; Yin, X.S. An improved 3D wedge-prism model for the face stability analysis of the shield tunnel in cohesionless soils. Acta Geotech. 2015, 10, 683–692. [Google Scholar] [CrossRef]
- Zhang, H.; Zhang, P.; Zhou, W.; Dong, S.; Ma, B. A new model to predict soil pressure acting on deep burial jacked pipes. Tunn. Undergr. Space Technol. İncorp. Trenchless Technol. Res. 2016, 60, 183–196. [Google Scholar] [CrossRef]
- Chen, R.; Yin, X.; Tang, L.; Chen, Y. Centrifugal model tests on face failure of earth pressure balance shield induced by steady state seepage in saturated sandy silt ground. Tunn. Undergr. Space Technol. 2018, 81, 315–325. [Google Scholar] [CrossRef]
- Al-Naddaf, M.; Han, J.; Xu, C.; Jawad, S.; Abdulrasool, G. Experimental investigation of soil arching mobilization and degradation under localised surface loading. J. Geotech. Geonviron. Eng. 2019, 145, 04019114. [Google Scholar] [CrossRef]
- Lin, X.; Chen, R.; Wu, H.; Meng, F.; Liu, Q.; Su, D. A composite function model for predicting the ground reaction curve on a trapdoor. Comput. Geotech. 2022, 142, 104581. [Google Scholar] [CrossRef]
- George, T.I.; Dasaka, S.M. Mechanics of arch action in soil arching. Acta Geotech. 2023, 18, 1991–2009. [Google Scholar] [CrossRef]
- Witthoeft, A.F.; Kim, H. Numerical Investigation of Earth Pressure Reduction on Buried Pipes Using EPS Geofoam Compressible Inclusions. Geosynthics Int. 2015, 23, 1–14. [Google Scholar] [CrossRef]
- Spangler, M.G. The Structural Design of Flexible Pipe Culverts; Bulletin 153; Iowa Engineering Experiment Station: Ames, IA, USA, 1941. [Google Scholar]
- ATV-DVWK-A 127E; Static Calculation of Drains and Sewers. German Association for Water, Wastewater and Waste: Hennef, Germany, 2000.
- Tognon, A.R.M.; Rowe, R.K.; Brachman, R.W.I. Evaluation of side wall frictionfor a buried pipe testing facility. Geotext. Geomembr. 1999, 17, 193–212. [Google Scholar] [CrossRef]
- Brachman, R.W.; Moore, I.D.; Rowe, R.K. The Performance of a Laboratory Facility for Evaluating the Structural Response of Small-Diameter Buried Pipes. Can. Geotech. J. 2001, 38, 260–275. [Google Scholar] [CrossRef]
- Akınay, E. Sıkışabilir Yatak Malzemesi Kullanımının Gömülü Esnek Boru Davranışı Üzerindeki Etkilerinin İncelenmesi. Ph.D. Thesis, Graduate School of Science and Engineering, Yildiz Technical University, Yildiz, Turkey, 2017. (In Turkish). [Google Scholar]
- Dhar, A.S.; Moore, I.D.; McGrath, T.J. Two-dimensional analyses of thermoplastic culvert deformations and strains. J. Geotech. Geoenviron. Eng. 2004, 130, 199–208. [Google Scholar] [CrossRef]
- Dhar, A.S.; Moore, I.D. Analysis of local bending in twin-wall pipes: Comparison with measurements. J. Civ. Eng. 2008, 36, 43–63. [Google Scholar]
- Al-Abri, D.S.; Mohamedzein, Y.E.A. Performance of Plastic Pipes Installed in Dune Sand. In Pipelines: Climbing New Peaks to Infrastructure Reliability: Renew, Rehab, and Reinvest; American Society of Civil Engineers: Reston, VI, USA, 2010; pp. 402–414. [Google Scholar] [CrossRef]
- Naeini, S.A.; Mahmoudi, E.; Shojaedin, M.M. Mechanical response of buried High-Density Polyethylene pipelines under normal fault motions. KSCE J. Civ. Eng. 2016, 20, s12205–s122015. [Google Scholar] [CrossRef]
- Kilic, H.; Bicer, P.; Bozkurt, S. A Numerical Investigation of Induced and Embedded Trench Installations for Large-Diameter Thermoplastic Pipes under High Fill Stresses. Appl. Sci. 2023, 13, 3040. [Google Scholar] [CrossRef]
- Krynine, D.P. Discussion of Stability and stiffness of cellular cofferdams by Karl Terzaghi. Trans Am. Soc. Civ. Eng. 1945, 110, 1175–1178. [Google Scholar]
- Vardoulakis, I.; Graf, B.; Gudehus, G. Trap-door problem with dry sand: A statical approach based upon model test kinematics. Int. J. Numer. Anal. Methods Geomech. 1981, 5, 57–78. [Google Scholar] [CrossRef]
- Handy, R.L. The arch in soil arching. J. Geotech. Eng. 1985, 111, 302–318. [Google Scholar] [CrossRef]
- Dewoolkar, M.M.; Santichaianant, K.; Ko, H.Y. Centrifuge modeling of granular soil response over active circular trapdoors. Soils Found. 2007, 47, 931–945. [Google Scholar] [CrossRef]
- Liang, L.; Xu, C.; Chen, Q.; Chen, Q. Experimental and theoretical investigations on evolution of soil-arching effect in 2D trapdoor problem. Int. J. Geomech. 2020, 20, 06020007. [Google Scholar] [CrossRef]
- Terzi, N.U.; Yılmazturk, F.; Yıldırım, S.; Kılıç, H. Experimental investigations of backfill conditions on the performance of high-density polyethelene pipes. Exp. Tech. 2012, 36, 40–49. [Google Scholar] [CrossRef]
- Kang, J.S.; Han, T.H.; Kang, Y.J.; Yoo, C.H. Short-term and long-term behaviours of buried corrugated high-density polyethylene (HDPE) pipes. Compos. Part B Eng. 2009, 40, 404–412. [Google Scholar] [CrossRef]


| Backfill Soil Properties | ||||||||
| Unit Weight (kN/m3) | Model | ν | c (kPa) | ϕ (°) | E50 (MPa) | Eoed (MPa) | Eur (MPa) | Rint-1 tank-soil |
| 17 | H.S | 0.33 | - | 40 | 28 | 28 | 70 | 0.17 |
| Pipe Properties | ||||||||
| Density (kg/m3) | Model | ν | E (MPa) | EA (kN/m) | EI (kN/m2/m) | Rint-2 pipe-soil | ||
| 970 | L.E | 0.45 | 450 | 9000 | 0.30 | 0.50 | ||
Disclaimer/Publisher’s Note: The statements, opinions and data contained in all publications are solely those of the individual author(s) and contributor(s) and not of MDPI and/or the editor(s). MDPI and/or the editor(s) disclaim responsibility for any injury to people or property resulting from any ideas, methods, instructions or products referred to in the content. |
© 2024 by the authors. Licensee MDPI, Basel, Switzerland. This article is an open access article distributed under the terms and conditions of the Creative Commons Attribution (CC BY) license (https://creativecommons.org/licenses/by/4.0/).
Share and Cite
Gulen, M.; Kilic, H. Effects of Pipe Deflection and Arching on Stress Distribution and Lateral Earth Pressure Coefficient in Buried Flexible Pipes. Appl. Sci. 2024, 14, 1667. https://doi.org/10.3390/app14041667
Gulen M, Kilic H. Effects of Pipe Deflection and Arching on Stress Distribution and Lateral Earth Pressure Coefficient in Buried Flexible Pipes. Applied Sciences. 2024; 14(4):1667. https://doi.org/10.3390/app14041667
Chicago/Turabian StyleGulen, Murat, and Havvanur Kilic. 2024. "Effects of Pipe Deflection and Arching on Stress Distribution and Lateral Earth Pressure Coefficient in Buried Flexible Pipes" Applied Sciences 14, no. 4: 1667. https://doi.org/10.3390/app14041667