Article

Determination of Nonylphenol in a Highly Sensitive Chemiluminescent Immunoenzyme Assay of Natural Waters

by
Anna N. Berlina
*,
Nadezhda S. Komova
,
Kseniya V. Serebrennikova
,
Anatoly V. Zherdev
and
Boris B. Dzantiev
A.N. Bach Institute of Biochemistry, Research Center of Biotechnology of the Russian Academy of Sciences, Leninsky Prospect 33, Moscow 119071, Russia
*
Author to whom correspondence should be addressed.
Appl. Sci. 2024, 14(5), 1685; https://doi.org/10.3390/app14051685
Submission received: 21 November 2023 / Revised: 28 December 2023 / Accepted: 18 February 2024 / Published: 20 February 2024
(This article belongs to the Special Issue Novel Analytical Methods Applied to Food and Environment)

Abstract

:
A competitive chemiluminescent immunoenzyme assay (CL-EIA) technique is proposed for the sensitive determination of one of the environmentally significant toxicants of anthropogenic origin-nonylphenol—in natural waters. The chosen chemiluminescent detection is characterized by a higher sensitivity compared to the colorimetric. The limit of nonylphenol detection was 9 ng/mL compared to 55 ng/mL for colorimetric one in optimal conditions. The developed analysis can be used for two purposes; it is highly sensitive for the possibility of toxicological analysis and dilution of complex matrices with raw buffer solution, as well as for the analysis of water samples without pretreatment and dilution. The method has a working range from 28 to 1800 ng/mL. The degree of nonylphenol revealing in the spiked samples of river, spring, and waterfall water was 82–119%.

1. Introduction

Modern life constantly forces humanity to confront new threats. In addition to natural disasters, people continue to face resource scarcity, biological hazards, epidemics, poor nutrition, poor sanitation, pollution, or shortages of fresh drinking water. Very often, humans are the cause, since urban growth, increased consumption, overpopulation, and the release of various chemicals lead to contamination of the most valuable source of life—drinking water [1]. In addition, various emissions end up in water sources used for agricultural and domestic purposes, which in turn leads to imminent health risks for the population due to contamination of groundwater [2]. Recently, there has been more and more talk about the dangers of plastic containers, microplastics, and dangerous chemicals leached from them [3,4]. Investigations conducted in various countries show that compounds belonging to different classes penetrate into the environment, such as heavy metals, phthalates, alkylphenols (nonylphenol (NP), octylphenol (OP) and others), bisphenol A, brominated flame retardants, and other organic compounds [5,6]. All listed groups of compounds are subject to regulation in accordance with regulatory documents of various countries. A fairly large proportion of additives easily penetrate from plastic into water due to the lack of chemical bonds with the polymer base [7].
One of these dangerous compounds is nonylphenol, a toxic degradation product of the corresponding ethoxylate, which is actively used by humans for various household purposes as detergents [8]. Penetrating into freshwater sources of the environment, it accumulates in them [9], as well as water bodies and soil. Their interaction with solid carriers occurs under the influence of van der Waals forces, hydrophobic, and electrostatic interaction [10,11]. Its proven toxic effects on the human body are associated with a destructive effect on the reproductive system due to estrogen-like actions and interaction with estrogen receptors [8,12]. The main mechanism of toxic action is associated with oxidative stress in cells [13]. Due to the abovementioned effects, both NP and OP should be determined in water [14,15].
Usually, chromatographic methods with mass spectrometric detection are used in practical analytical laboratories to determine nonylphenol and structurally similar alkylphenols. Despite their sensitivity and widespread use in environmental monitoring, these methods are not suitable for screening a large number of samples, and the analysis requires sample preparation in a laboratory setting [16]. As an alternative, immunochemical techniques are offered, which allow the analysis of groups of samples under the same conditions, in the absence of, or with minimal, sample preparation [17]. Among them, immunoenzyme assay (EIA) provided in microplates still has not lost its popularity due to their widespread use in medical, clinical, food, and veterinary laboratories [18]. The relative ease of analysis, small sample volumes—about 50–150 µL, and the availability of portable readers, as well as the possibility of replacing labels and using them in multianalysis, make various EIA options excellent alternatives to chromatographic methods [18,19].
There is one more important nuance. Nonylphenol is a very hydrophobic compound, which is not only washed out of plastic but is also adsorbed onto it, including onto the components of immunochemical test systems [20]. This compound has a tendency to adsorb on various polymeric materials that also have a hydrophobic surface, which has been repeatedly studied based on its properties [21,22,23,24]. The tendency for spontaneous adsorption of NP on the surface, or its pronounced hydrophobicity, requires changing of the conditions for the immunoenzyme assay. The addition of blocking compounds or suitable organic solvents is typically used to retain the analyte in the reaction media. However, not all solvents can be used in immunoassays, since they lead to inactivation of antibodies [25]. Previous work in the laboratory was based on the use of methanol at a concentration of 10–30% for the detection of hydrophobic analytes such as food dyes, phthalates, and mycotoxins by immunochemical techniques [26,27]. Therefore, this work is aimed at improving the analytical data obtained using the classical colorimetric and developed alternative approaches.
The development of modern immunoanalytical systems requires careful optimization of all stages from the preparation of immunoreagents to the choice of a method for detecting the analytical signal. Commercially available EIA test systems use colorimetric or chemiluminescent detection for diagnostic purposes [28,29,30]. In most cases, chemiluminescence provides a more sensitive determination of analytes compared to colorimetric detection [31,32,33]. Luminol is used as the substrate of chemiluminescence [34,35]. Developments based on chemiluminescence are used in food analysis [36] and environmental objects [33]. Traditionally, the signal in the wells is measured once at a certain time after adding the substrate solution to the wells in which antigen–antibody complexes have formed, containing an enzymatic tag as a catalyst for substrate oxidation. However, the kinetics and signal changes [31,37], which depend on the amount of label in the immune complexes, are not taken into account.
This paper proposes to demonstrate how monitoring signal changes can achieve the best analytical performance for the determination of nonylphenol in water. This approach allows for providing the assay due to the availability of equipment and the ease of performing the analysis itself.

2. Materials and Methods

2.1. Materials and Components

Nonylphenol (NP), bisphenol A, Triton X-100, Tween-20, Tween-80, luminol, p-iodophenol, gelatin, formaldehyde solution, soybean trypsin inhibitor (STI), dimethylsulfoxide, and Tween-80 were from Sigma-Aldrich (St. Louis, MO, USA). Rabbit antiserum was obtained as described in [20] by rabbit immunization with NP–BSA conjugate, stored at -20 °C, and used in this work. Goat polyclonal antibodies against rabbit IgG labeled with horseradish peroxidase (GARI-HRP) were obtained from IMTEK (Moscow, Russia). Liquid colorimetric substrate 3,3′,5,5′-tetramethylbenzidine (TMB) with H2O2 (substrate solution) was obtained from Immunotech (Moscow, Russia). Methanol was obtained from Fluka (Switzerland). Buffers and water solutions were prepared with the use of purified water with a resistance of not more than 18.6 MΩ·cm at 25 °C (Simplicity Water Purification System, Millipore, Bedford, MA, USA).
Black polystyrene plates (96-well black Maxisorp Nunc microplates (NUNC 437111)) were obtained from Thermo Fisher Scientific, Roskilde, Denmark). Transparent 96-well microplates were obtained from Costar (Corning Costar, MO, USA). Syringe filters of 0.22 µm for purifying samples and filtration of water solutions were obtained from Sartorius (Gettingen, Germany).
We used 1 mM, 10 mM, and 50 mM phosphate-buffered saline, pH 7.4 (1 mM PBS, 10 mM PBS, 50 mM PBS, correspondingly), 50 mM PBS with 0.1% gelatin (pH 7.4), 50 mM PBS with 0.05% Tween-80 (PBST, pH 7.4), and 0.1 M carbonate buffer (pH 10.0).

2.2. Methods

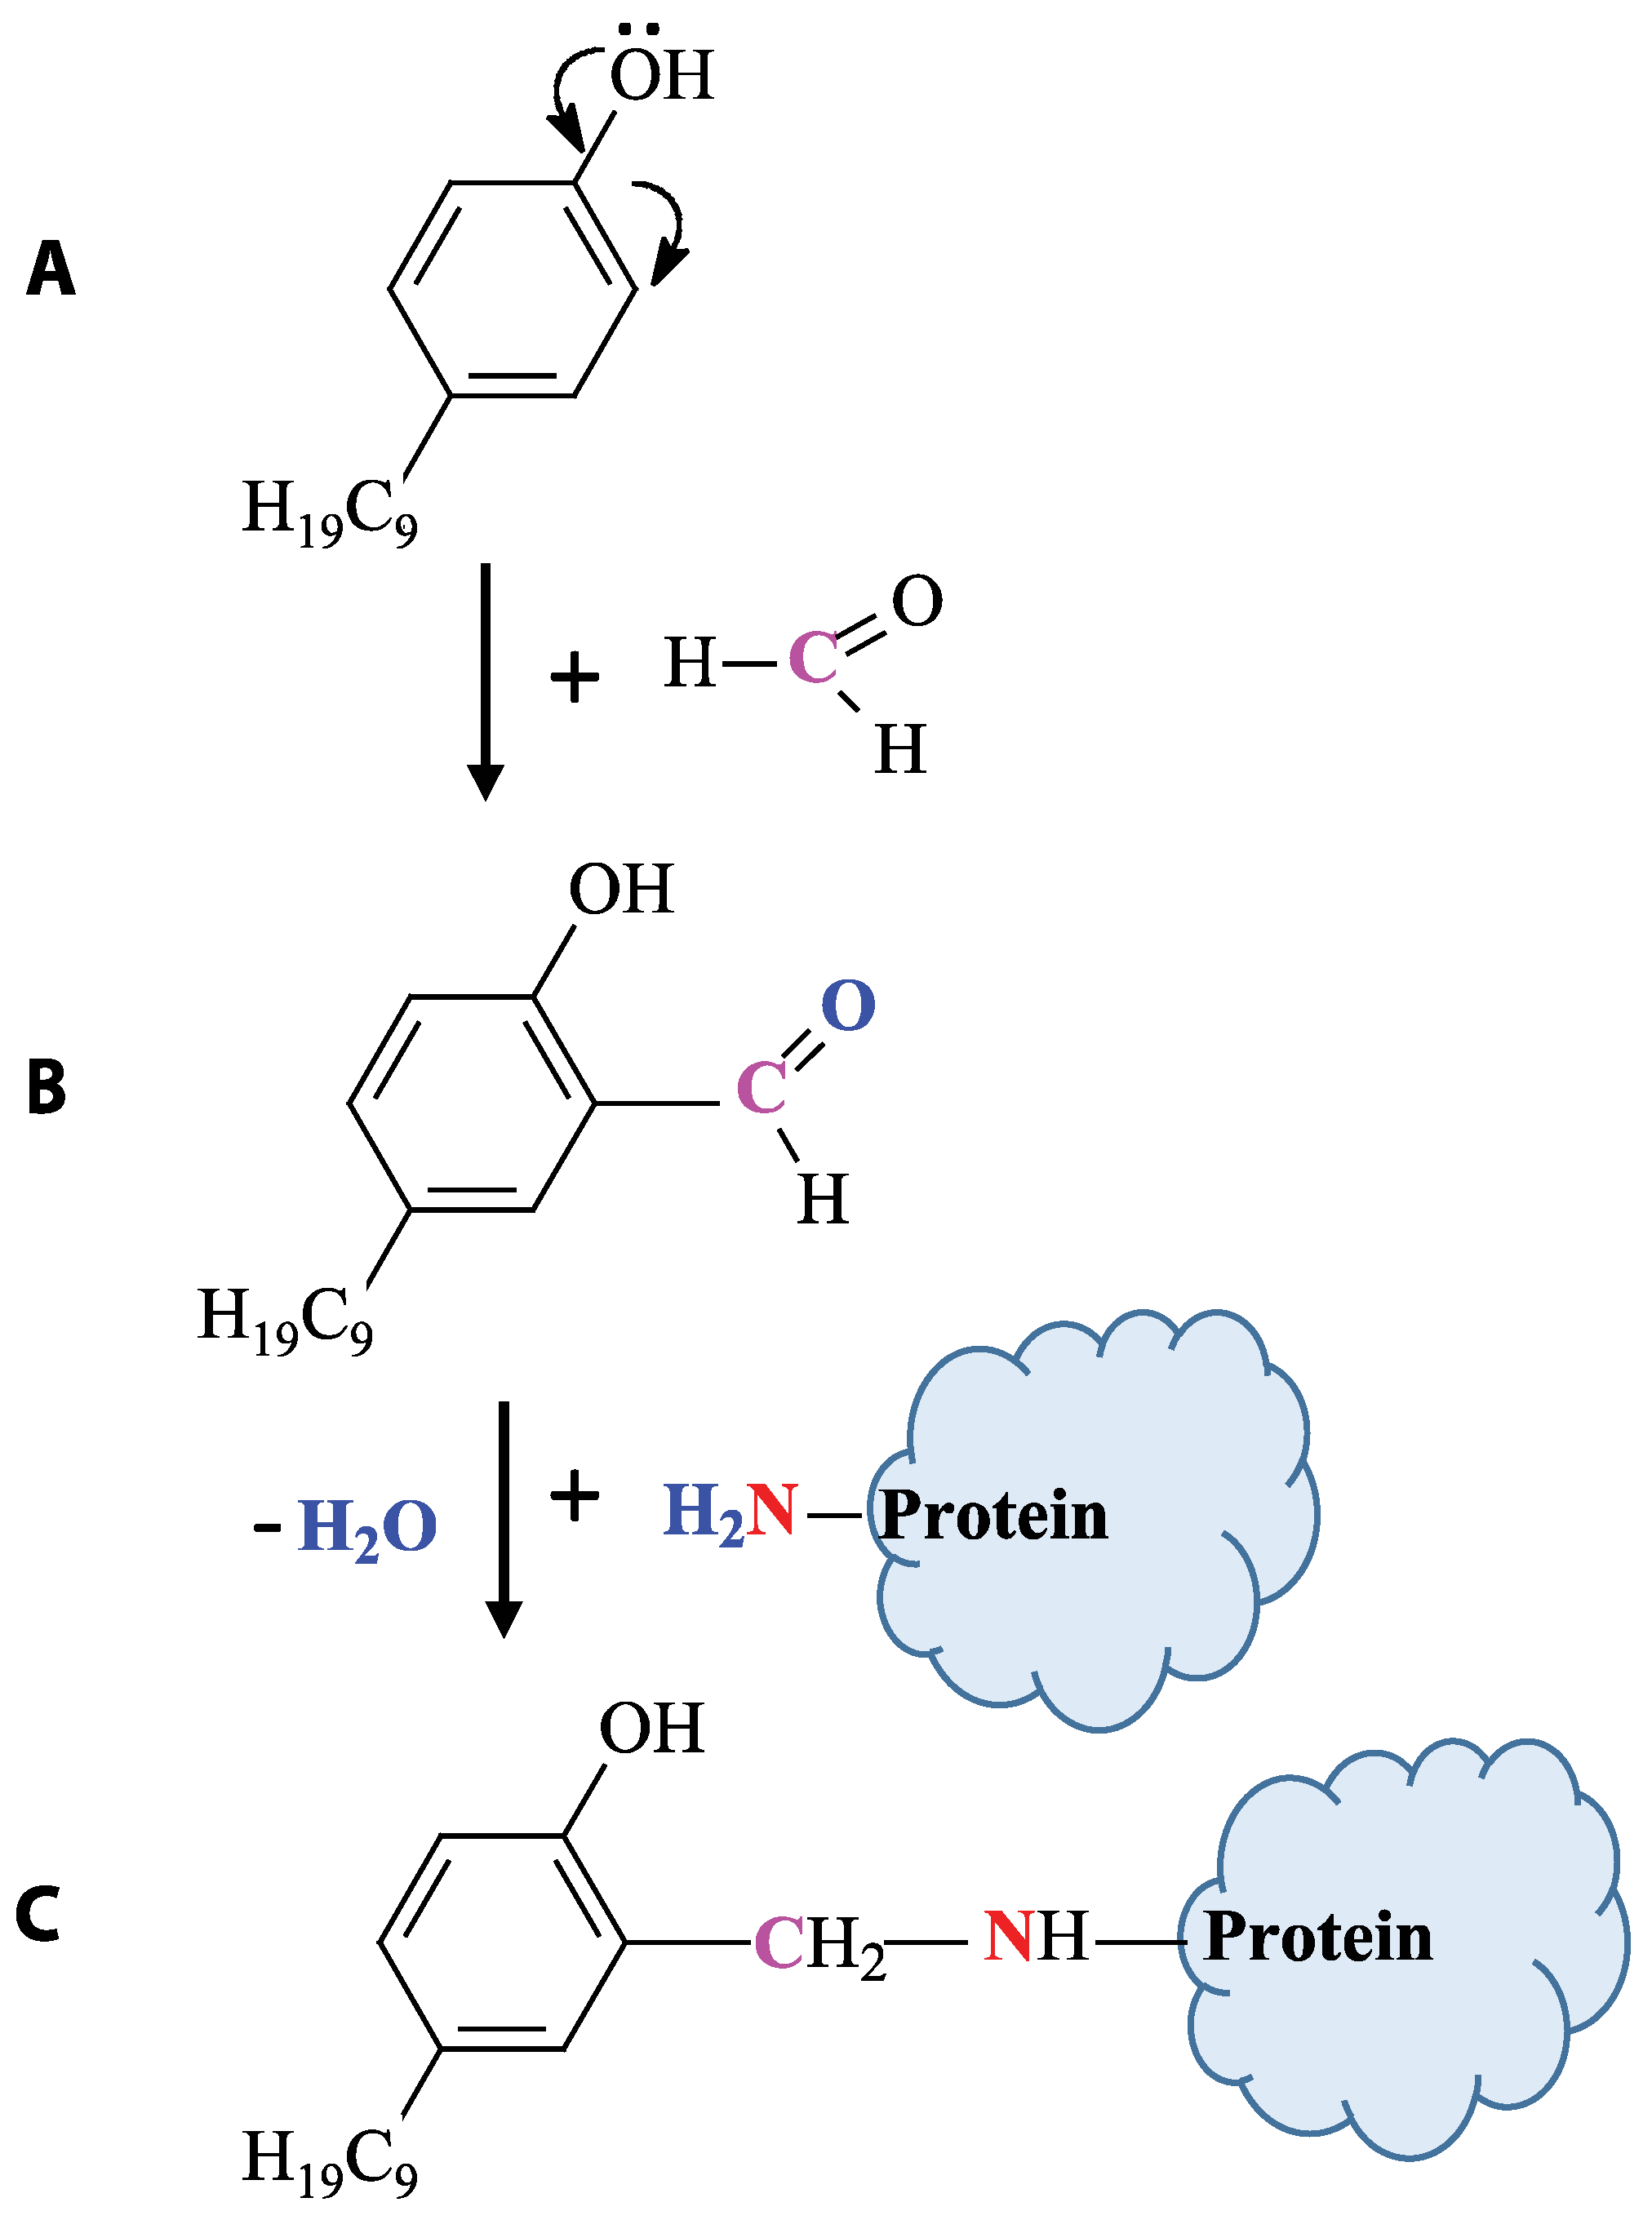
2.2.1. Synthesis of the Conjugate of Hapten and Carrier Protein Conjugate

The hapten–protein conjugate was synthesized as described by Mart’ianov et al. [20]. Briefly, 11.5 mg of nonylphenol (NP) was dissolved in 348 μL of dimethyl sulfoxide (DMSO) at a concentration of 33 mg/mL. Then, 11 mg of soybean trypsin inhibitor (STI) was dissolved in 1 mL of 0.1 M carbonate buffer (pH = 10). Then, 58 μL of nonylphenol solution was added to the protein solution. Next, 100 μL of 35–37% formaldehyde was added to each Eppendorf, followed by incubation under stirring for 30 min at room temperature and then 5 days at 37 °C. The resulting conjugate preparation after synthesis was dialyzed against 10 mM PBS, divided into small portions (by 50 µL), and stored at −20 °C until analysis.

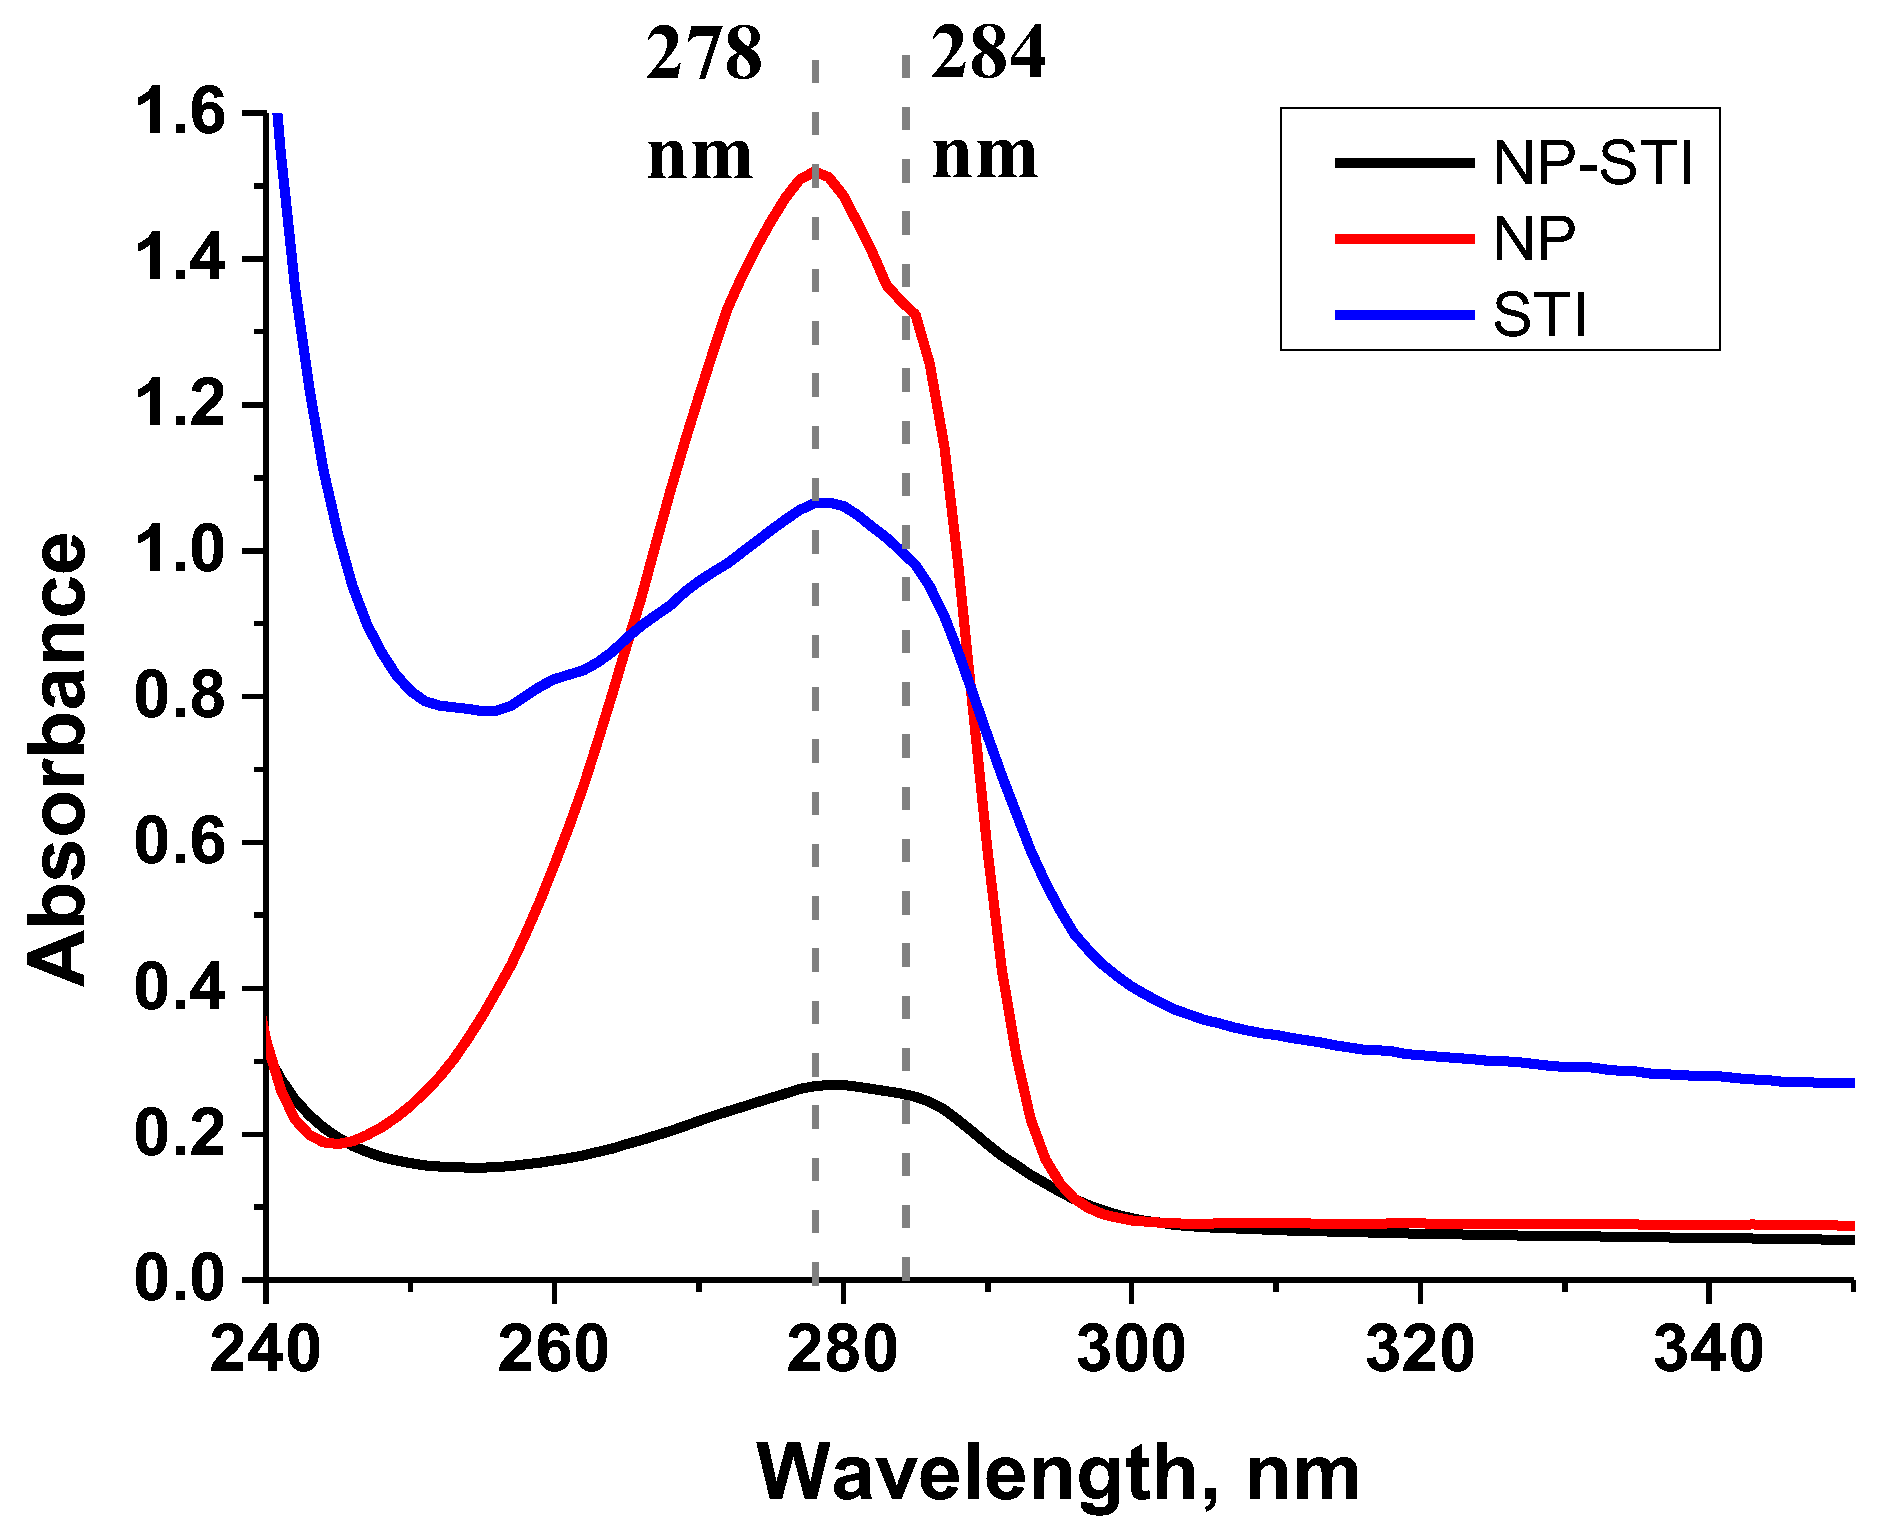
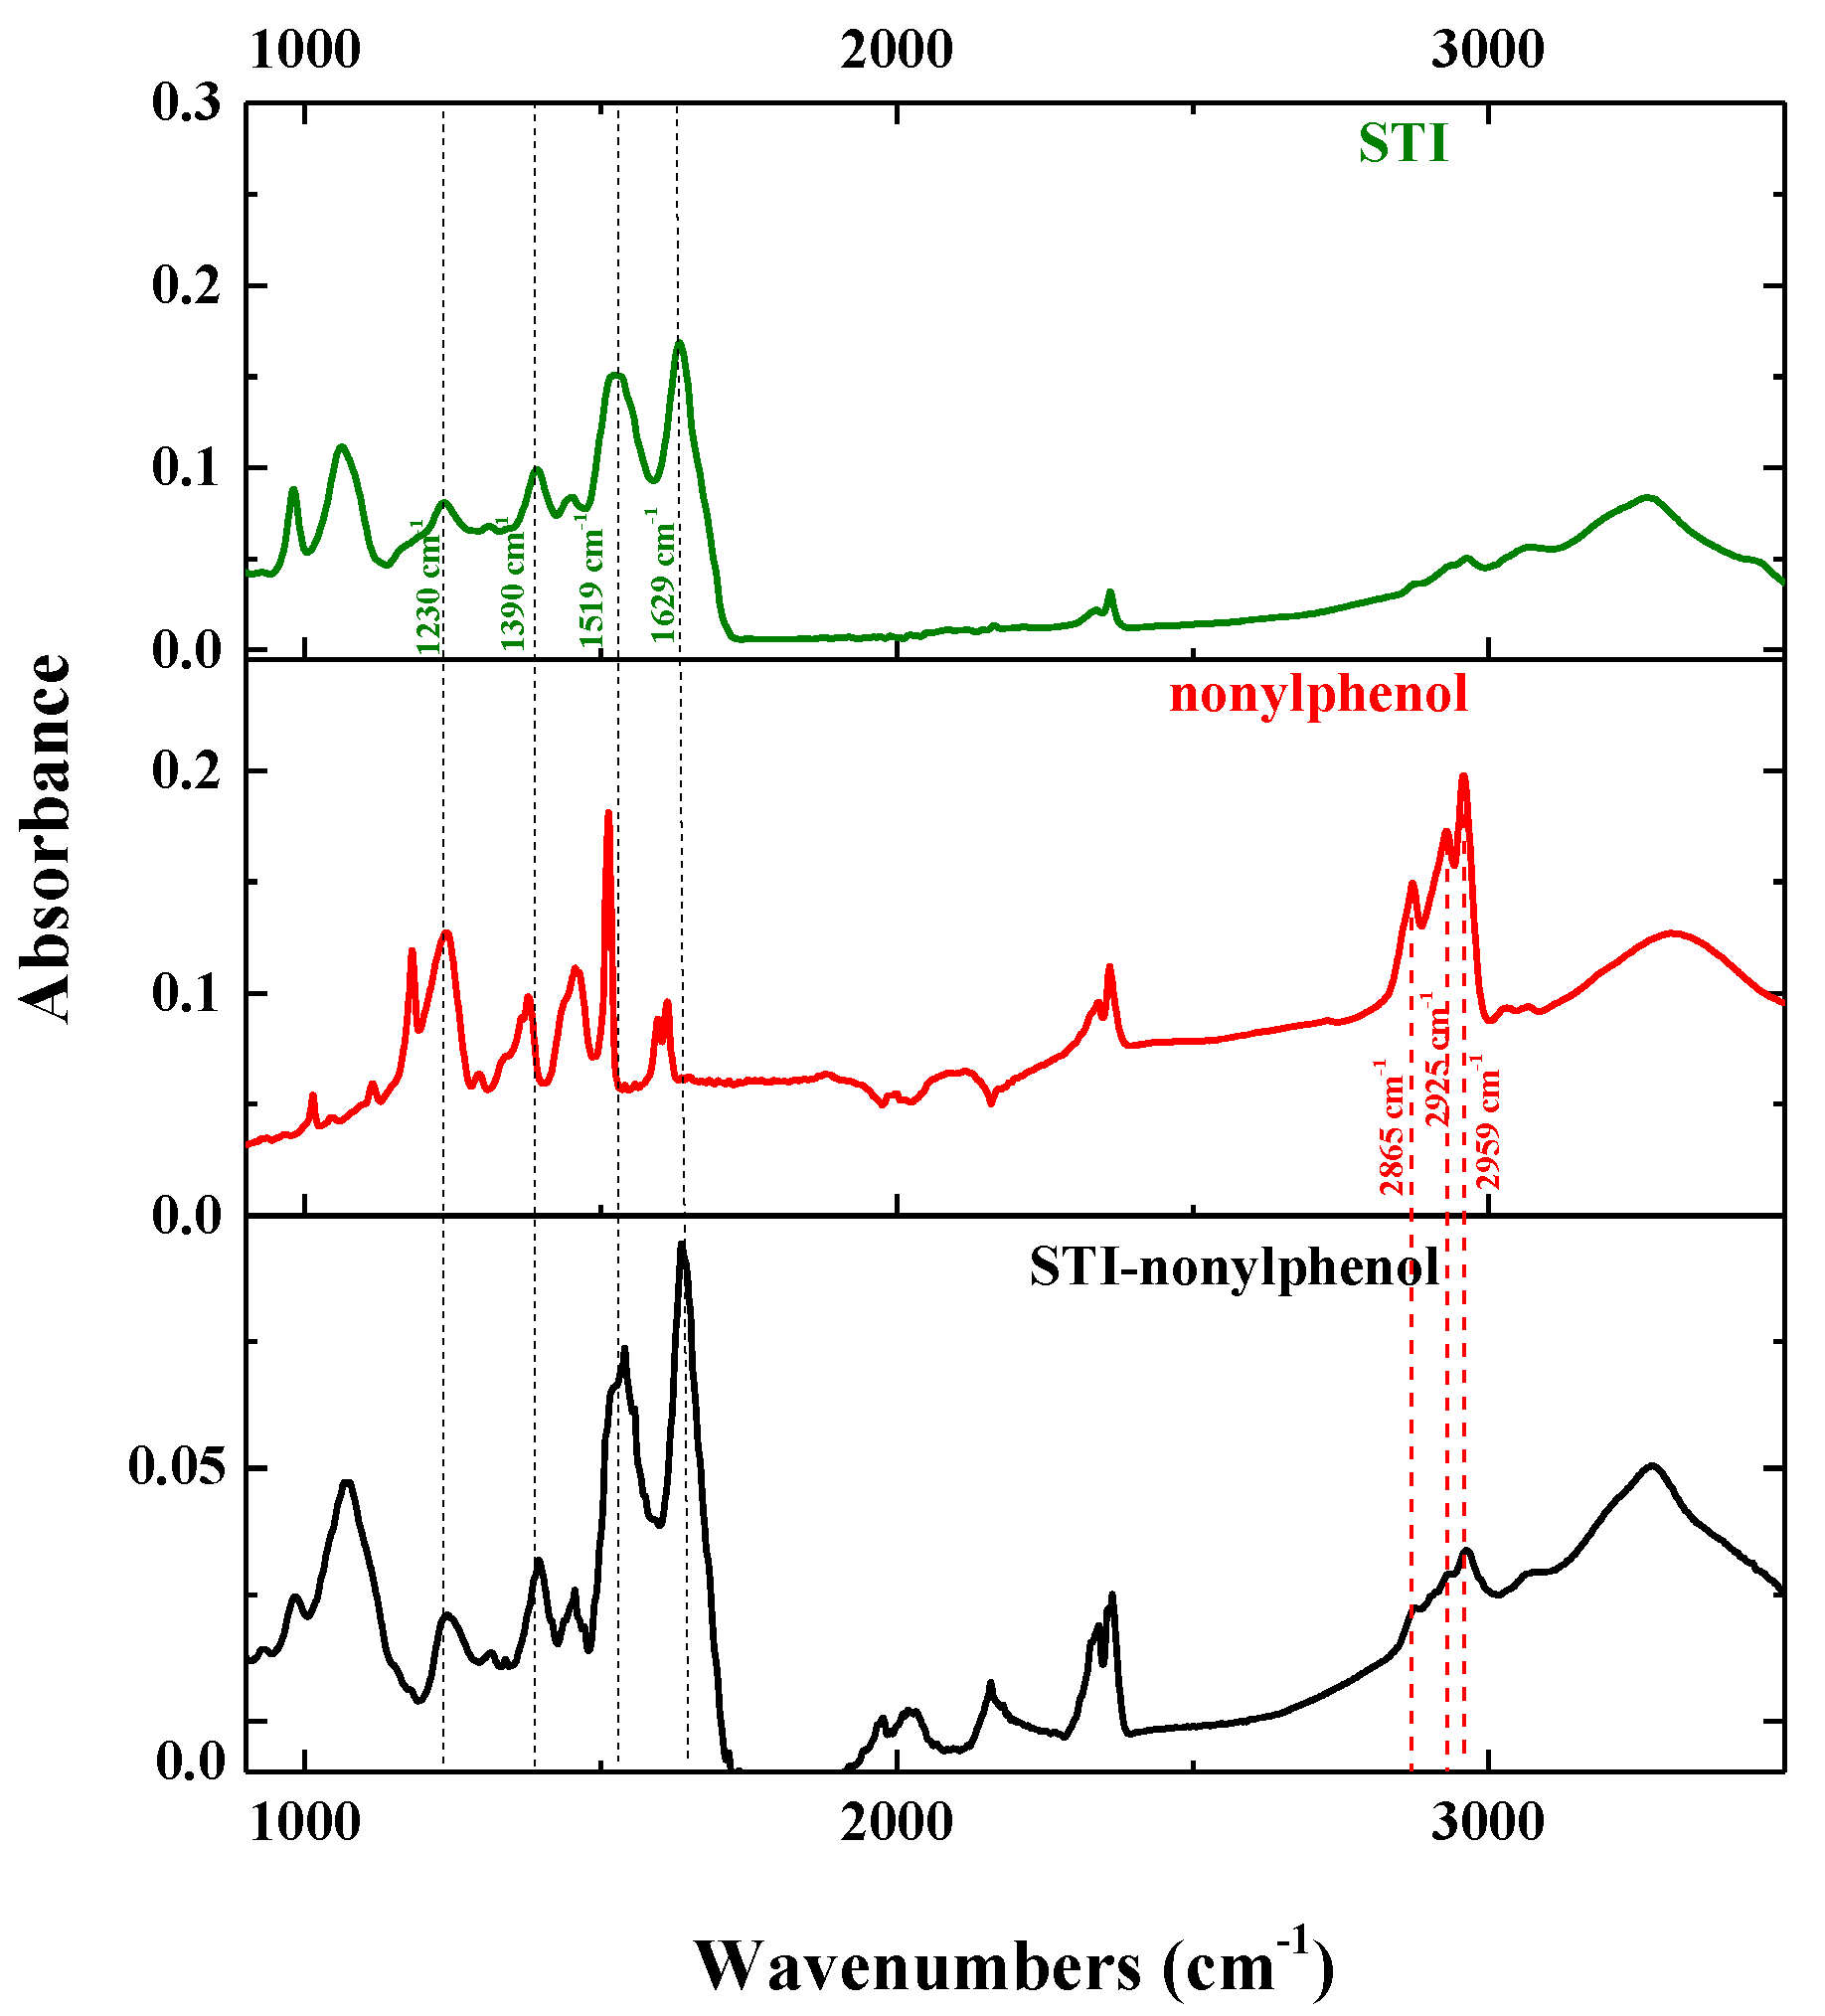
2.2.2. Characteristics of the NP–STI Conjugate

The resulting conjugate was characterized by spectrophotometry and FT-IR. A UV-2450 spectrophotometer (Shimadzu, Kyoto, Japan) was used to record absorption spectra of the synthesized conjugate in the range of 240–400 nm. FT-IR spectra were recorded in the range of 400–4000 cm−1 using an FT/IR-6700 Fourier transform infrared (FT-IR) spectrophotometer (JASCO, Tokyo, Japan). All measurements were provided at room temperature. The obtained spectra of the conjugate, pure nonylphenol, and protein were compared with each other at the levels of characteristic vibrations.
Titration of surface amino groups was carried out according to [38] with modifications. Briefly, 50 μL of a solution of the conjugate or the original protein (the concentration varied from 2.5 mg/mL to 2.4 μg/mL with a 2-fold dilution at each step) was added to the wells of a polystyrene ELISA microplate (Costar 9018 manufactured by Corning (USA)). Then, 50 μL of a saturated NaHCO3 solution and 50 μL of a 0.2% TNBS solution were added. The resulting mixture was incubated for 2 h at 37 °C, after which the reaction was stopped by sequential addition of 25 μL of 10% SDS-Na and 25 μL of 0.5 M HCl.

2.2.3. Collection and Storage of Water Samples

All-natural water samples were collected in glass vials from ecologically pure springs. Probes of around 10 mL were stored at −20 °C prior to the analysis. The samples of river waters were filtered through a syringe-driven filter (Biofil 0.45 µm; Guangzhou, China) and stored at −20 °C until use.

2.2.4. Colorimetric EIA

First, STI–NP was adsorbed at the concentrations 0.1–5 µg/mL in 50 mM PBS, pH 7.4, into the wells of a transparent microplate and incubated overnight. Then, the wells were washed three times with 50 mM PBST containing 0.05% Tween-80, pH 7.4 (washing buffer). The solution of 50 mM PBS, pH 7.4, with 0.1% gelatin (blocking buffer) was dropped by 150 µL per well and incubated for 30 min at 37 °C. After this procedure, microplate wells were washed again with the washing buffer, and rabbit antiserum solutions were added at the volume of 100 µL at different dilutions (from 1:100 to 1:1,000,000) and incubated at 37 °C for 1 h. The anti-NP rabbit antiserum was diluted in the blocking buffer. The resulting immune complexes were observed with the goat anti-rabbit IgG labeled with horseradish peroxidase (GARI-HRP) diluted 1:3000 in 50 mM PBST with 0.05% Tween-80 at 37 °C. Then, 100 µL of the substrate solution was added to develop the color in the wells for 15 min. After this, the reaction was stopped by the addition of 50 µL 0.1 M H2SO4.
For competitive immunoassay, NP solutions with different concentrations (from 100,000 µg/mL to 0.01 ng/mL) in methanol: water (1:4) were added to the wells and then anti-NP rabbit antiserum in chosen dilution in equal volume. The incubation was provided for 1 h at +37 °C. The development of complexes was provided as described above.

2.2.5. Chemiluminescent EIA

The analysis was provided in a similar way. First, STI–NP was adsorbed at the concentrations of 0.1–5 µg/mL in 50 mM PBS into the wells of black Nunc microplates overnight, then washed three times and blocked with the solution of 50 mM PBS with 0.1% gelatin. The next procedures were provided as described above. After the development of immune complexes with GARI-HRP, the substrate mixture was added. Measurement was provided in kinetic mode with 15 measurements of measurements, where 1 measurement corresponds to 120 s. The used substrate mixture included 11.7 mL of 100 mM Tris-HCl buffer, pH 8.9 with 1 mmol luminol, 2 mmol 4-iodophenol, and 2 mmol H2O2 [39]. To measure chemiluminescent signal in the wells, a Zenyth 3100 multifunctional reader (Anthos Instrument, Wals, Austria) was used.
For chemiluminescent EIA, the kinetic measurement mode was used in each stage of this investigation, both when optimizing parameters and when obtaining calibration dependencies. This means that after measuring all 96 wells of the plate, which takes a total of 120 s, the next measurement of equal duration begins. In total, data obtained after 15 consecutive chemiluminescence measurements in all wells of the plate were analyzed.
To study the kinetics, two conditions for experiments implementation were considered, one with 100 µg/mL of NP (minimal chemiluminescence) and one without NP (maximal chemiluminescence). The chemiluminescence was measured in triplicate during 15 cycles, each of 120 s, as described above. The dependences of relative luminescence units (RLUs) from number of measurements were obtained and processed using Origin 9.0 software (Northampton, MA, USA).

2.2.6. EIA Data Processing

The curves were plotted as the dependence of analytical signal (optical density at 450 nm (OD450) or relative chemiluminescent units (RLU)) from the concentration of analyte in competitive or dilution of antisera in noncompetitive EIA. All measurements were carried out in duplicate or triplicate. A four-parametric sigmoidal equation was used to describe the dependence in competitive immunoassay. The main analytical parameters used to choose optimal conditions of analysis were as follows. The concentration of analyte that inhibits analytical signal by 10% (IC10) was chosen as a parameter to compare different competitive curves. The limit of detection (LOD) was calculated based on three standard deviations of the signal in the absence of a competitor. The linear range of determined concentrations of NP was determined as an IC20–IC80 interval. It means that the concentrations that inhibit the analytical signal by 20–80% were used as a working range.

3. Results

3.1. Synthesis and Characterization of Hapten–Protein Conjugate

The development of a competitive enzyme immunoassay requires the availability of basic reagents such as a hapten–protein conjugate, a free hapten, specific antibodies (or antiserum), and anti-species antibody conjugate labeled with peroxidase to detect formed immune complexes.
The conjugate of nonylphenol (the structure is shown in Figure 1A) with soybean trypsin inhibitor (STI) as the carrier protein (hapten–protein conjugate, NP–STI) was obtained by the Mannich reaction (Figure 1) at the molar ratio of 30:1. During the reaction, formaldehyde is transformed into CH2 group as a substituent in orthoposition next to the phenolic hydroxyl group (Figure 1B). This group in the conjugate is a link between the protein amino group and the NP core (Figure 1C). The resulting conjugate was characterized by spectrophotometry and FT-IR spectroscopy.
The absorption spectrum of the NP–STI conjugate has a characteristic peak at 278 nm and a shoulder at 284 nm, which is characteristic of both the protein (280 nm) and native nonylphenol (278 nm) (Figure 2). The data were used to determine conjugate concentrations. The resulting NP–STI conjugate had a concentration of 7.4 mg/mL.
The STI protein, hapten (nonylphenol), and synthesized NP–STI conjugate were characterized by FT-IR spectroscopy, demonstrated in Figure 3. The spectrum of the NP–STI conjugate shows bands in the region of 1700–1600 cm−1, 1575–1480 cm−1, and 1230–1300 cm−1 associated with the amide group of proteins [40] (Figure 3, FT-IR spectrum of STI). The characteristic bands in the region of 2831–3000 cm−1 in the spectrum of nonylphenol, attributed to asymmetric and symmetric stretching vibrations of CH2 [41], are repeated in the spectrum of the NP–STI conjugate. Thus, FT-IR spectroscopy data confirm the successful preparation of the NP–STI conjugate.
Comparison of the titrations of free amino groups for STI and STI–NP demonstrated that the number of nonylphenol molecules on the surface of the NP–STI conjugate is about two. Taking into account the fact that the entire STI globule contains nine lysine residues, only approximately 20% of the remainder of the total. Such a relatively small load is adopted in competitive ELISAs, since it makes it possible to more effectively prevent the binding of antibodies to the conjugate when a free hapten is introduced [42].

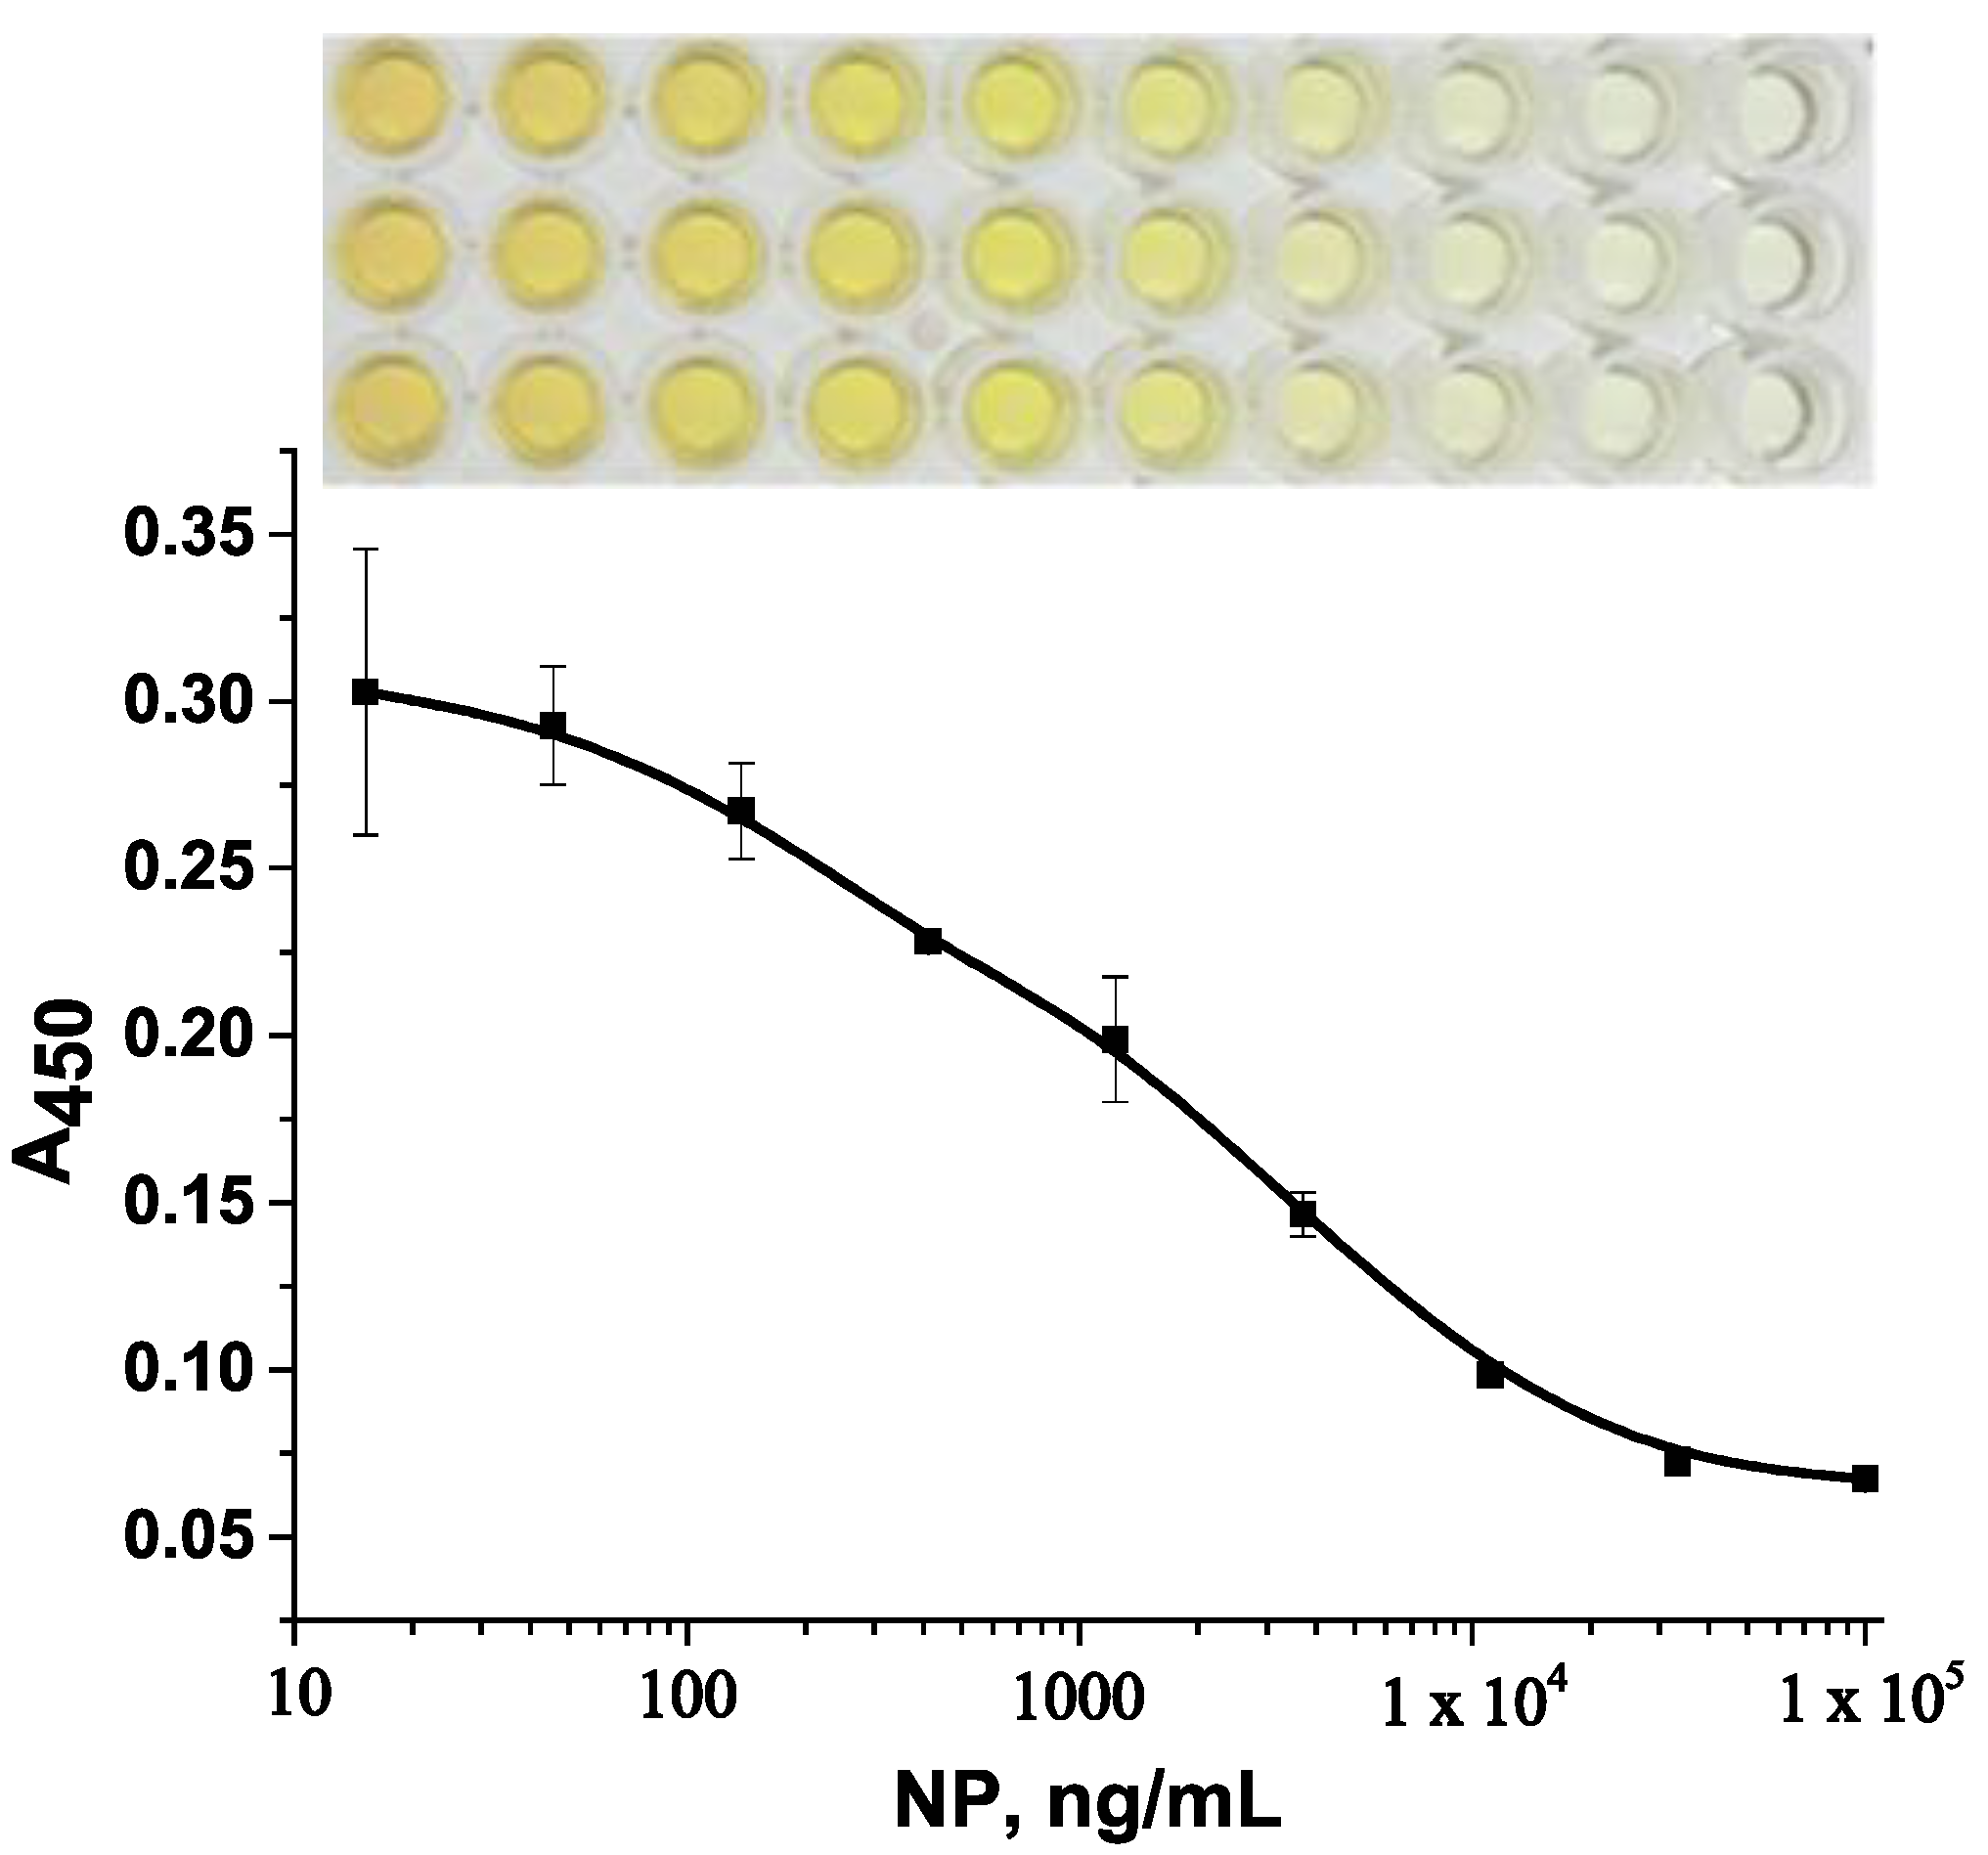
3.2. Competitive EIA with Colorimetric Detection

To carry out this work, we used antibodies obtained earlier in the laboratory during the immunization of rabbits [20]. Their specificity for nonylphenol was established earlier by Mart’anov et al. [43]. Triton X-100 used for EIA buffer solutions preparation was detected to be cross-reactant at 9.9%. The detergent Tween-80 did not show any cross-reactivity and, thus, was used in the preparation of the buffer solution when preparing the competition. Comparison of analytical parameters obtained by performing a competitive EIA with various concentrations of immobilized hapten–protein conjugate allowed us to analyze conditions with the ability to achieve a minimum IC10 and a wide operating range. Thus, a decrease in the concentration of NP–STI from 5 μg/mL to 0.1 μg/mL was characterized by a significant decrease in the IC10 from 76.7 ng/mL to 17.6 ng/mL (Table 1). At the same time, there was a simultaneous decrease in the analytical signal (to 0.08 with a background optical density of 0.06) at concentrations below 1 µg/mL, and more time was required for the reaction with the substrate—over 60 min. Therefore, in order to avoid increasing the time of analysis and working with low signal amplitudes, we believe that the optimal concentration will be 1 μg/mL in a colorimetric analysis. The typical dose–response curve is shown in Figure 4.

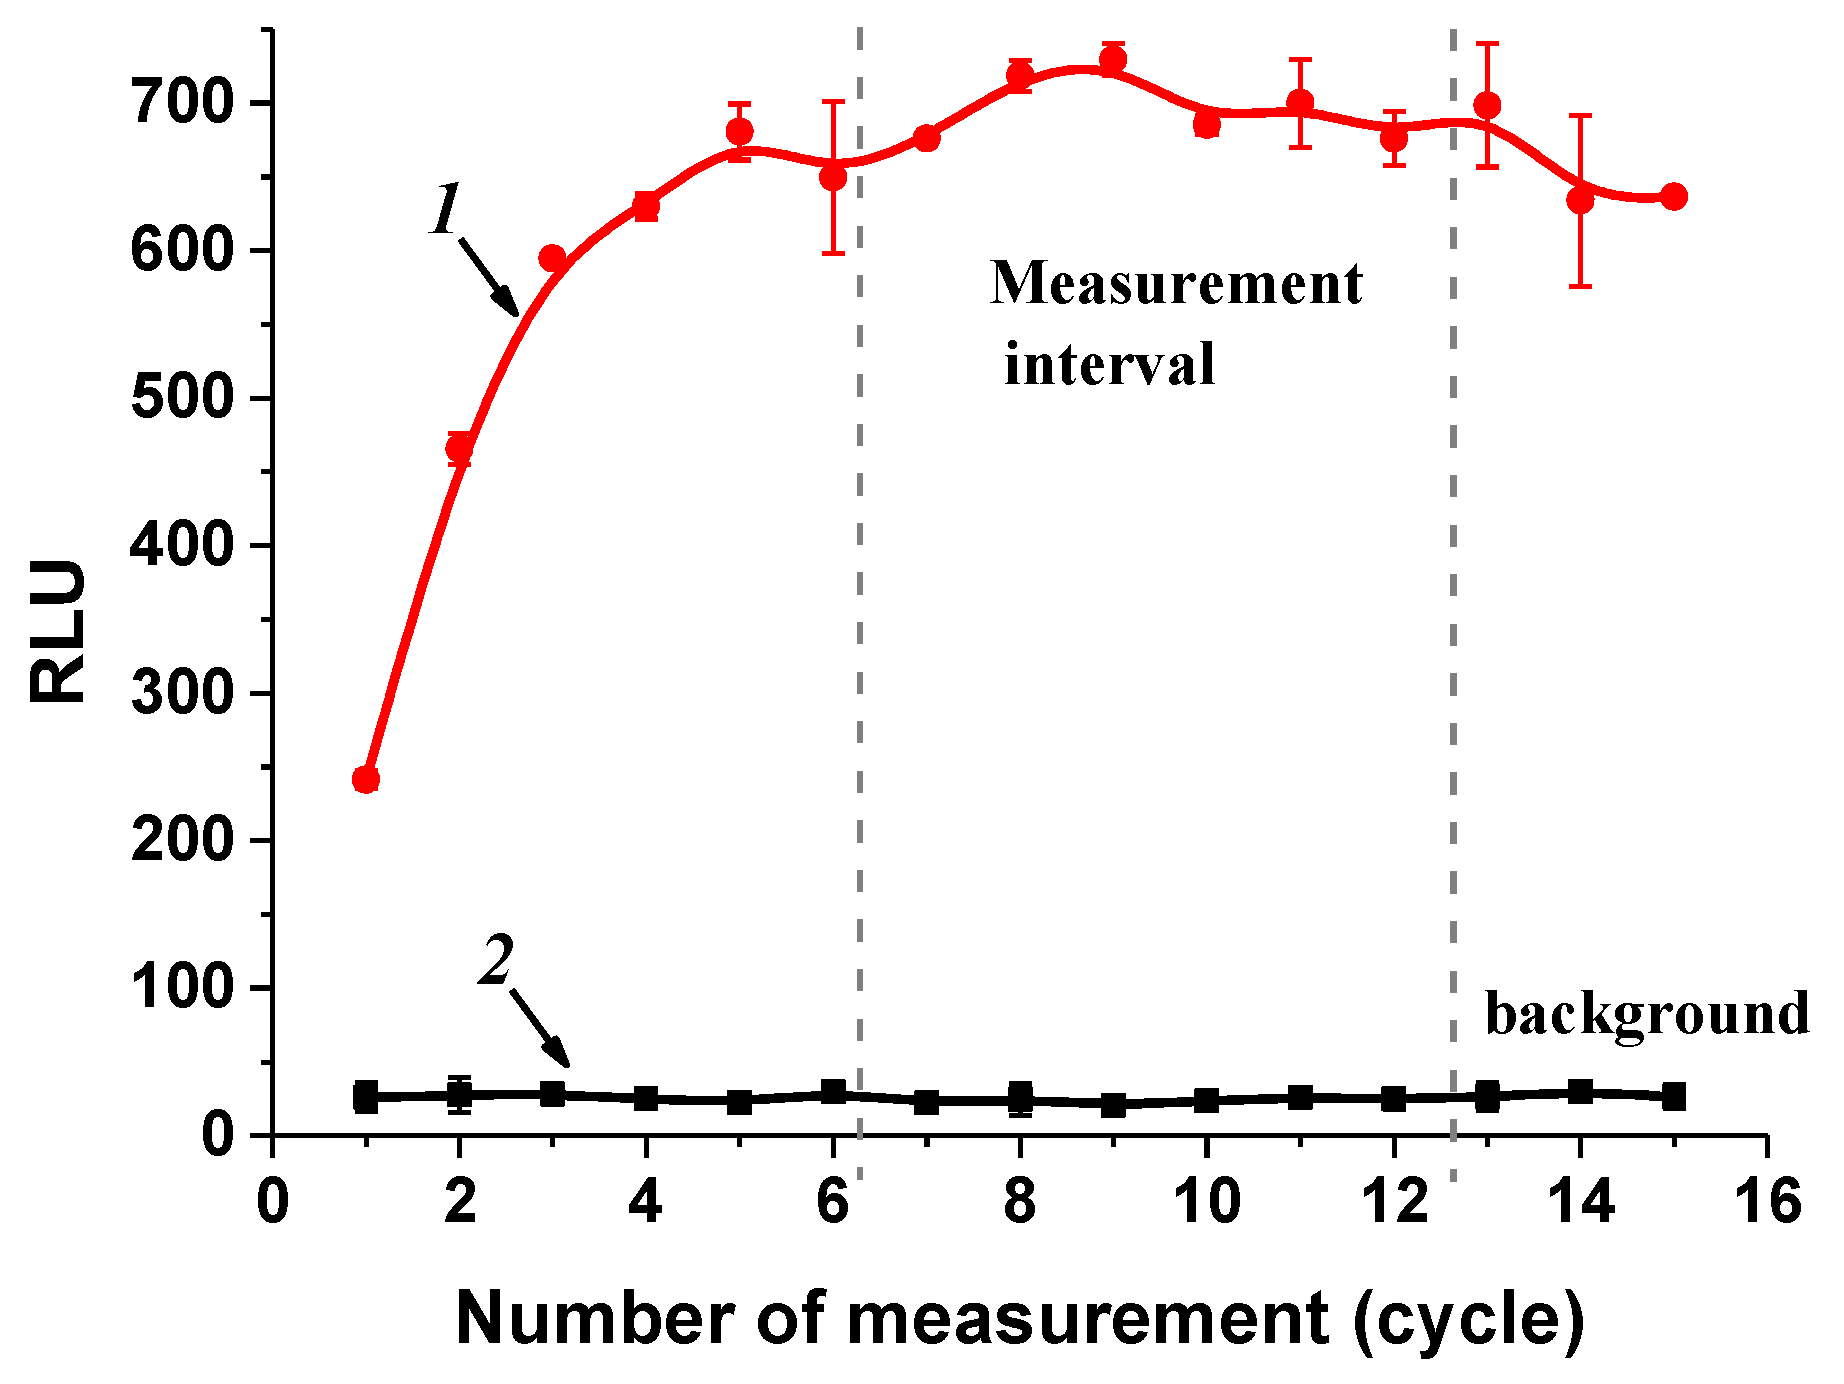
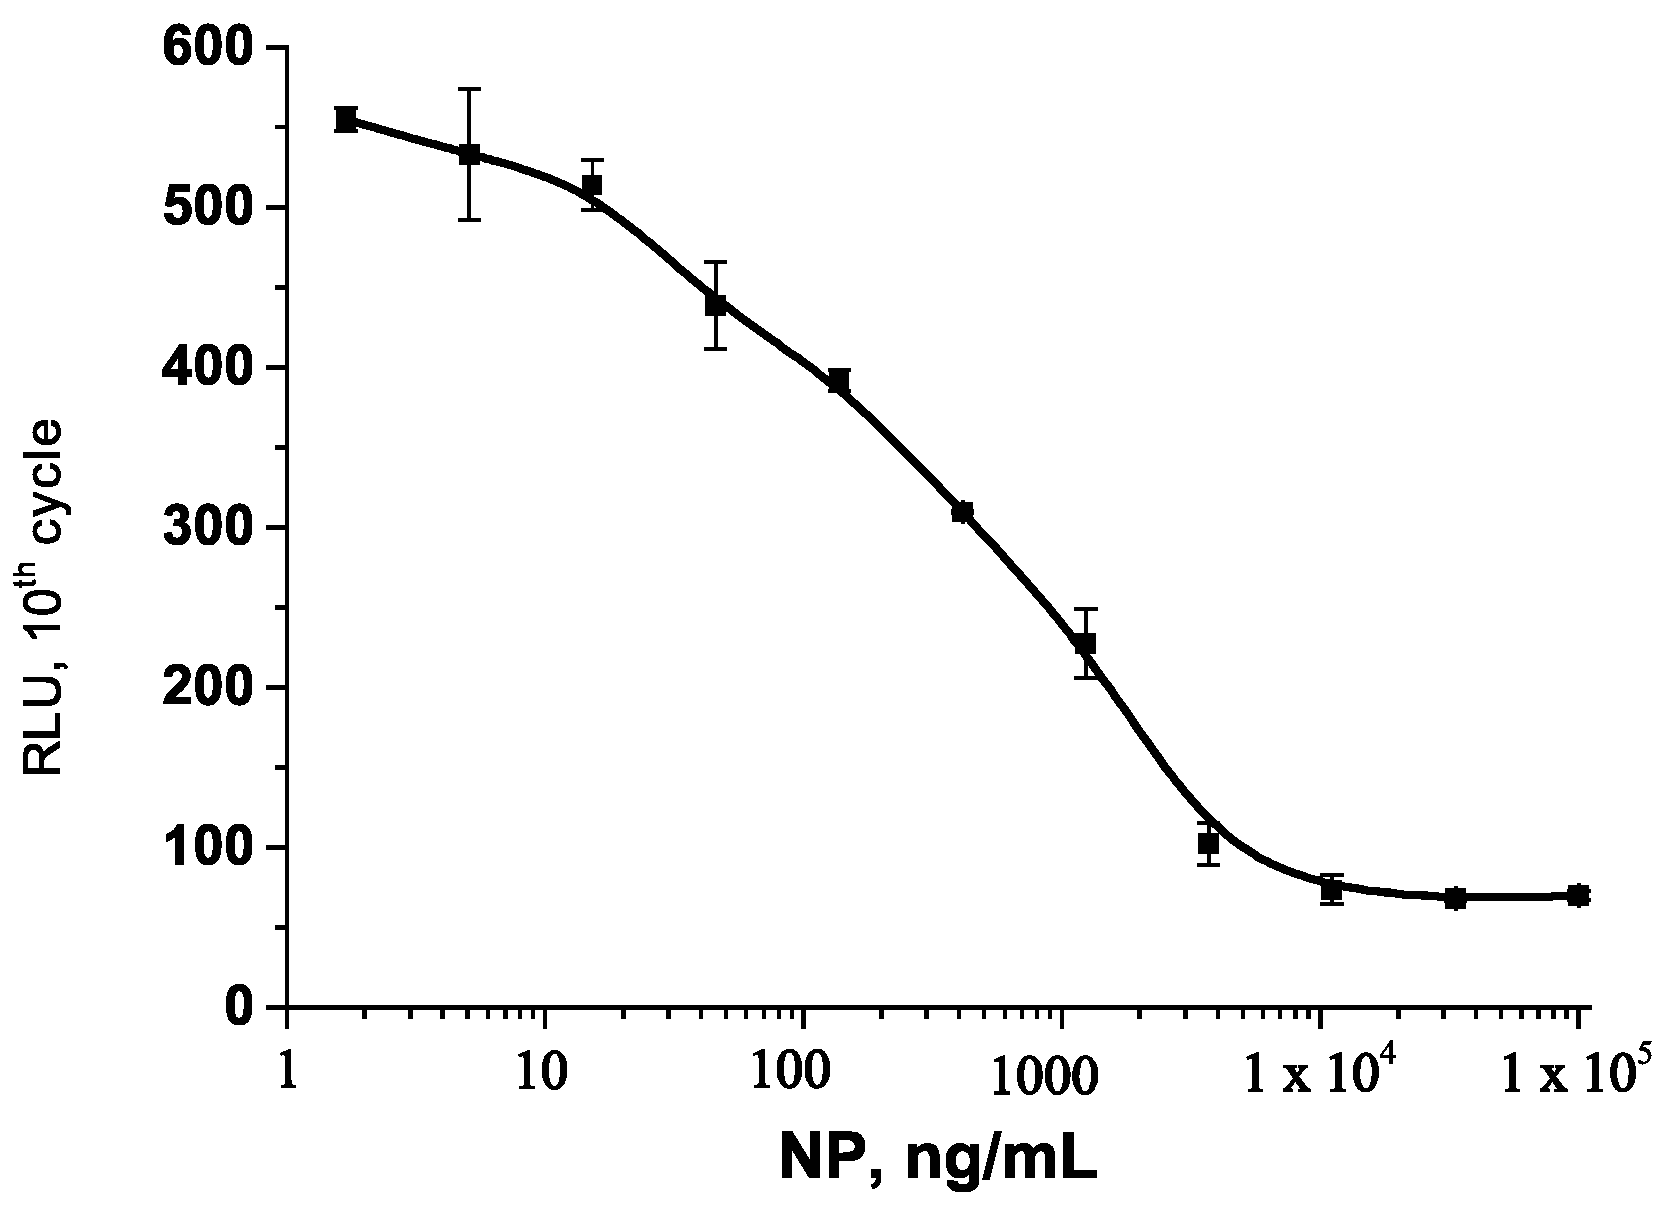
3.3. Chemiluminescent EIA

Therefore, even if the concentrations of NP–STI are selected in the colorimetric analysis, the conditions in the chemiluminescent analysis should be rechecked and the interaction conditions in the multivariate analysis should be optimized.
Unlike colorimetric detection, where the oxidation reaction of a chromogenic substrate is stopped by introducing an acid into the reaction mixture, chemiluminescent detection is characterized by an increase and then attenuation of the signal due to the influence of free radicals and oxidation products [44]. Note that identifying the kinetic patterns of the reaction of substrate oxidation in some cases can affect the final parameters of the system. To achieve equilibrium in the system, different times are required depending on the number of immune complexes formed in the wells of the plate and, accordingly, on the amount of label (horseradish peroxidase) in them.
The presented signal kinetics in the chosen wells in the absence of the analyte in the sample and in the presence of a high concentration of nonylphenol demonstrates that equilibrium in the system occurs between five and eight measurements in the absence of the analyte (Figure 5). These measurements correspond to 10 min and 16 min. It should be noted that the stabilization of the signal in the absence and presence of nonylphenol was maintained from the 7th to the 12th measurement (14–24 min)—see the highlighted interval in Figure 5. No further measurements were taken since this would significantly increase the analysis time. As shown in one of our previous works [27], the set of system parameters affects the possibility of reliable detection of the analyte in samples. Therefore, we took into account the data obtained during a long-term study of the kinetics of the analytical signal in the wells of a microplate in this work.

3.4. Optimizing Parameters of Chemiluminescent EIA Test System

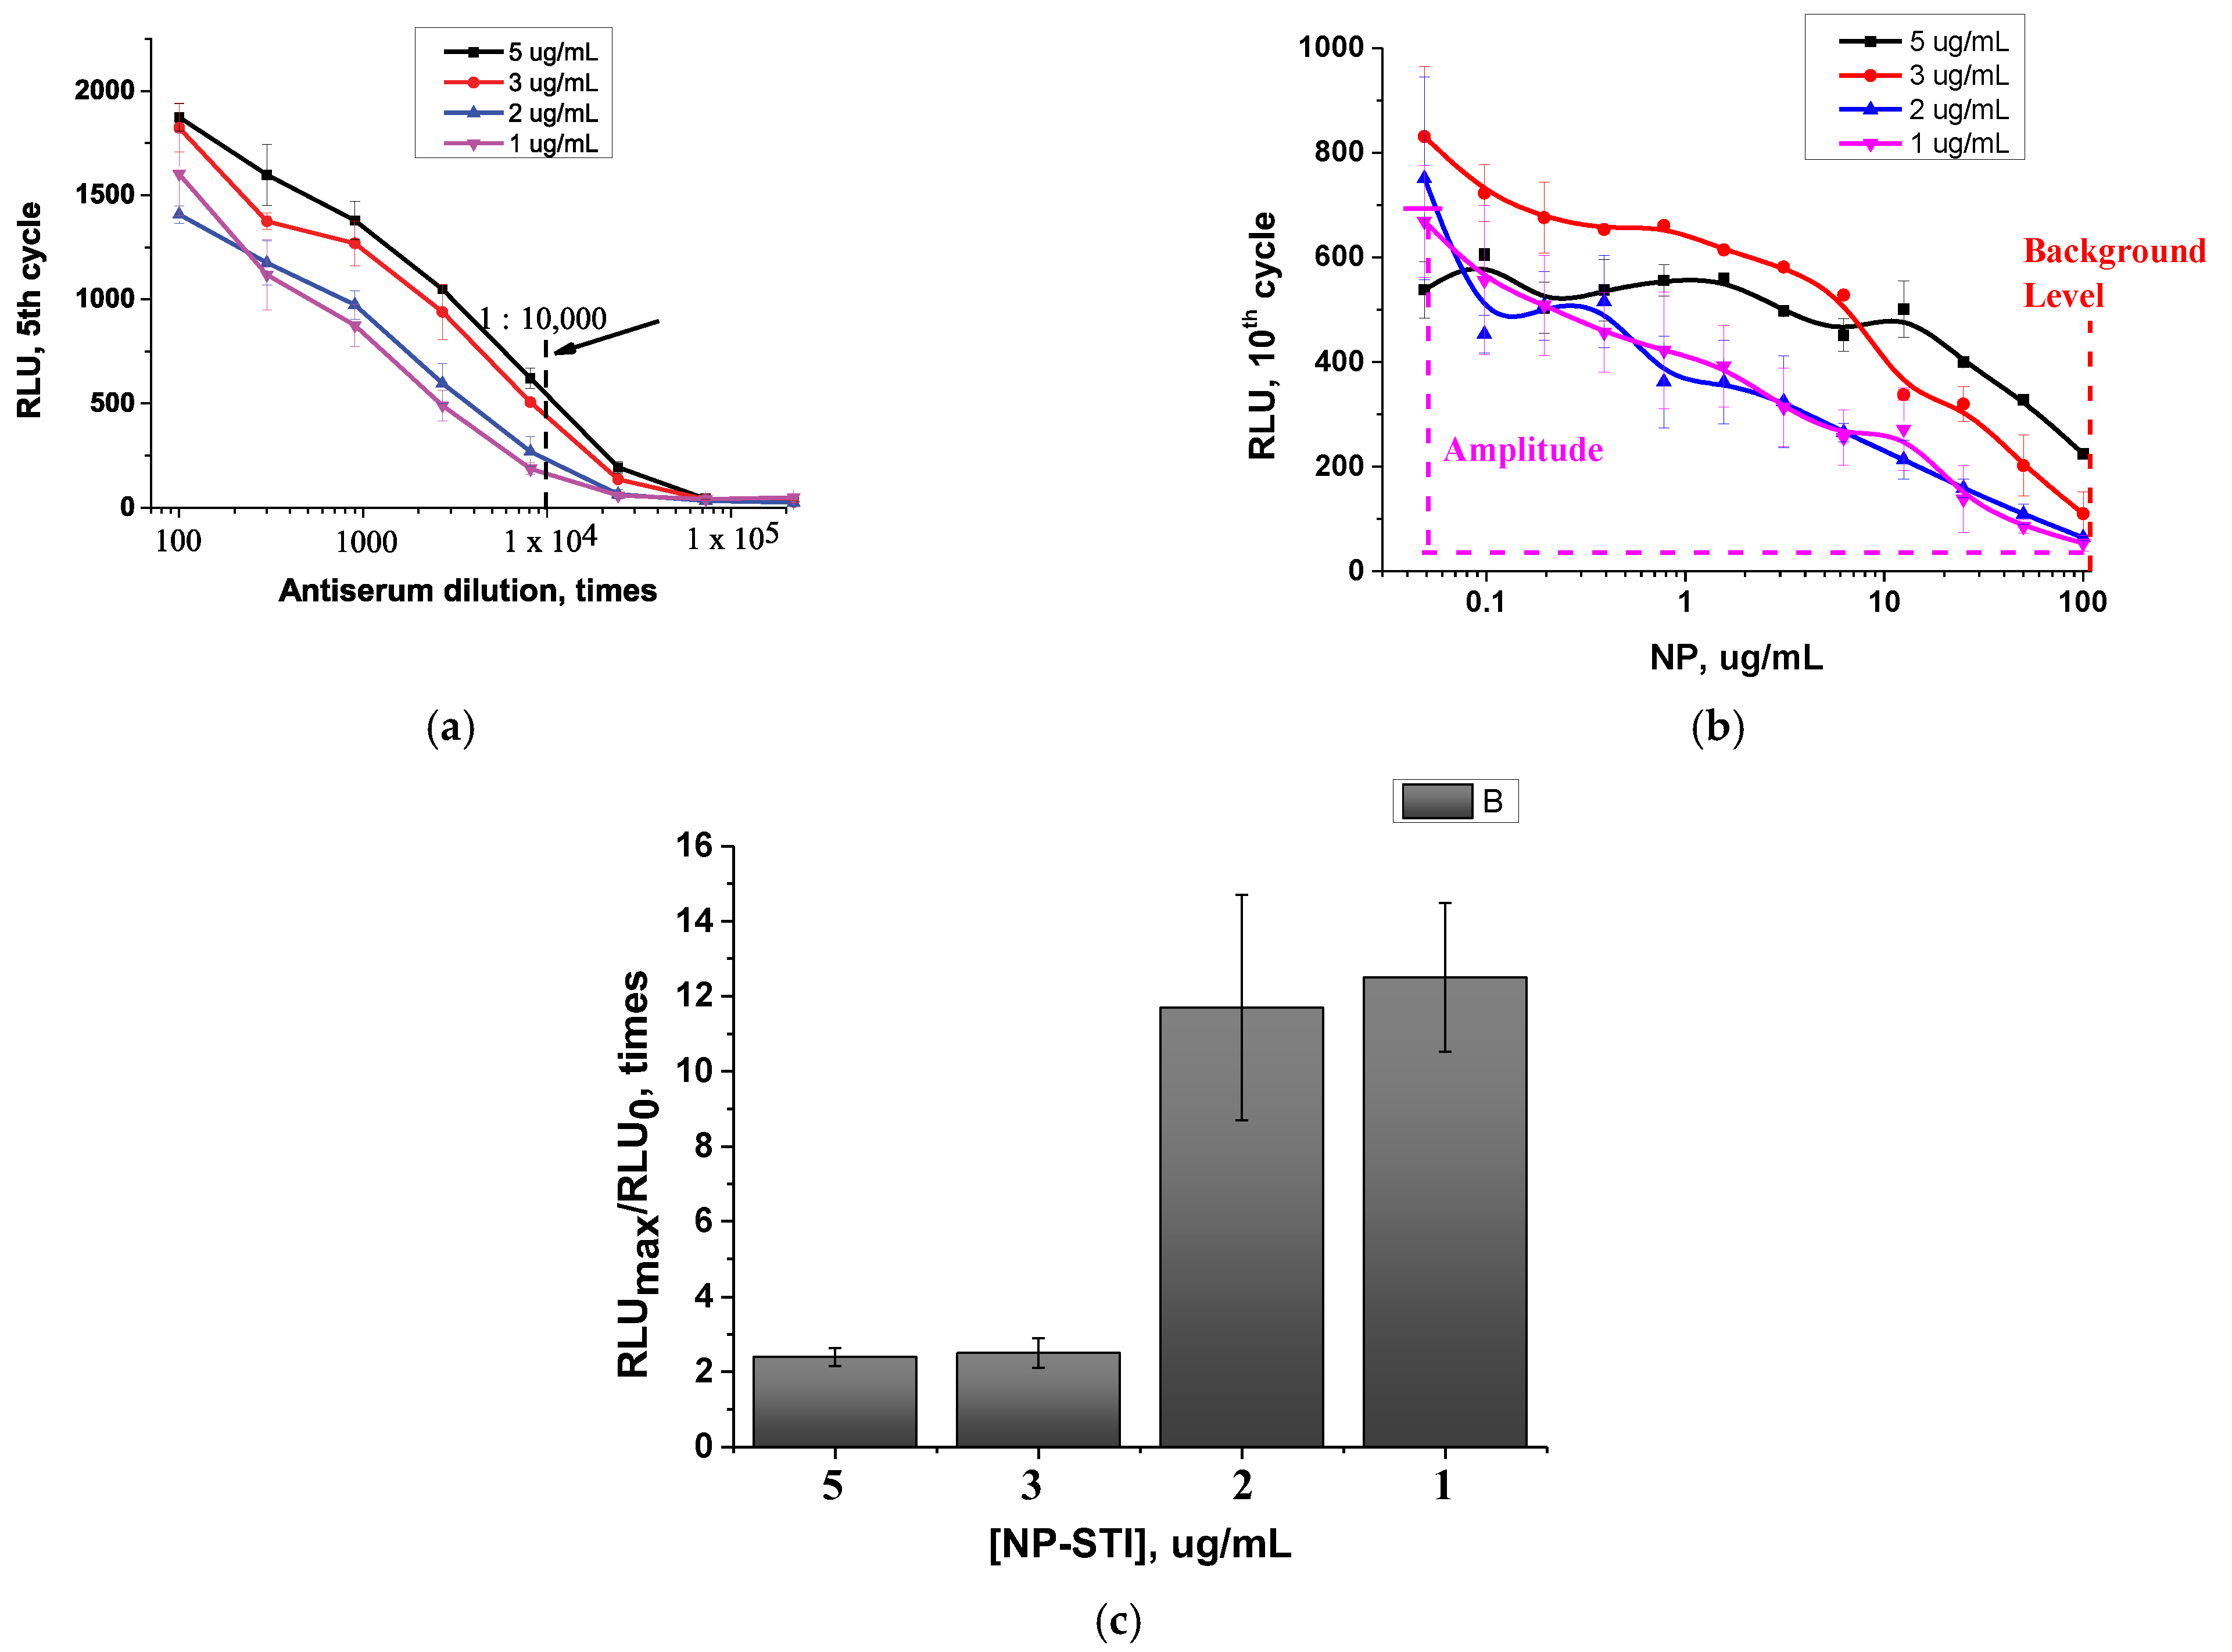
3.4.1. The Choice of STI–NP Concentrations and Antiserum Dilution

When optimizing a system, a set of curves obtained by varying two parameters is considered and their combination is selected. The first step of the optimization was the selection of the concentration of STI–NP immobilized into the wells of the plate at concentrations of 1–5 μg/mL and rabbit antiserum dilution. A rabbit antiserum containing specific antibodies to nonylphenol was titrated (Figure 6a). By analogy with the colorimetric EIA, calibration curves of the dependence of the signal on the concentration of nonylphenol at the selected dilution of the antiserum (1:10,000 for 1 and 2 μg/mL and 1:20,000 for 3 and 5 μg/mL of the adsorbed hapten–protein conjugate, respectively), were obtained.
As can be seen from Figure 6a, the signal intensity depends on the concentration of the NP–STI conjugate immobilized in the wells of the microplate. Figure 6b shows the dependence of the intensity of the chemiluminescent signal on the concentration of the analyte. Thus, it is clear that the level of the background signal increases (at the maximum concentration of the analyte, Figure 6b) with the increase in concentration of the NP–STI. The maximum amplitudes of the analytical signal with a minimum deviation value were achieved when using a concentration of NP–STI 1 μg/mL (Figure 6c) in combination with a dilution of antiserum of 1:10,000 to conduct a competitive analysis of nonylphenol.

3.4.2. Optimization of Competitive Stage Duration

In addition to the choice of concentrations of immunoreagents, the duration of the competitive stage of the immune interaction was selected. The main criteria were low values of the analyte detection limit and reproducibility of the analytical signal. These experiments were necessary in order to reduce the analysis time without loss of the analytical performance of the analysis achieved during the previous optimization. For this purpose, the antiserum solution was added to the wells of the microplate at certain intervals (every 15 min) to ensure compliance with the intervals. Analysis of the data obtained during this titration made it possible to determine the optimal conditions for working with the use of buffer solutions.
When plotting dose–response curves obtained by changing the duration of the competition stage, it turned out that the lowest values of the detection limits of NP were achieved during a 30 min incubation stage (Table 2). At the same time, the parameters of curves are better for 45 min incubation, as well as the value of the average deviation. Formally, the values obtained by fitting the curves at a 15 min competition stage are superior to those for 30 min. However, due to the low analytical signal (about 130 RLU) and low signal-to-background ratio (130/25 = 5.2), the highest average error of detection (17.3%), the use of this curve with such parameters to analyze the samples is inappropriate. Therefore, based on the results shown in Table 2, the duration of the competition stage of 45 min was chosen for further analysis. The IC10 parameter after a 45 min incubation was 9.0 ng/mL, which is comparable to commercial kits for the determination of NP and corresponding ethoxylates from Ring Biotechnology Co., Ltd. (Beijing, China) [45] with the detection limit of 5 ng/mL.

3.5. Chemiluminescent EIA of NP in Natural Waters

Natural and artificial sources of drinking water differ in chemical composition and biological environment. Therefore, despite the apparent simplicity of this object, changes in the course of the curve or the analytical characteristics of the method should be taken into account. Despite the fact that the free valences in wells of a microplate are blocked using a blocking buffer (PBS with the addition of 0.1% gelatin) during chemiluminescent EIA before the competition, the effect of the sample matrix is able to be detected.
Typically, two main approaches were used for enzyme immunoassay to obtain a calibration curve for the determination of analytes in complex matrices. The first approach is to adapt the calibration to the matrix, and the second one is to eliminate the influence of the matrix (processing, extraction, solvent change, protein precipitation, etc.).
To evaluate the possible influence of the sample matrix, calibration curves were obtained in various media. The tested media were distilled water, PBS of various molarities (from 1 to 50 mM), PBST, and PBS with the addition of 0.1% gelatin. Table 3 shows the values of the IC10 parameter, as well as other data estimated from the obtained curves. It can be seen that when the medium is replaced, there is a significant change in both the detection limits and the boundaries of the working ranges of NP concentrations; therefore, all these parameters should be taken into account when analyzing water samples in the future.
It is noteworthy that in terms of analytical parameters, distilled water turned out to be closest to the water samples. Therefore, when carrying out the experiment, the values of the chemiluminescent signal were extrapolated to the curve obtained using distilled water as a medium at the competition stage (Figure 7). The advantage of using this environment is, on the one hand, universality, and, on the other hand, the absence of the influence of the quality of salts used in the preparation of a buffer solution. In addition, in such a matrix, we can analyze samples without dilution, which would help to avoid false negative results of the analysis, when the low content of the NP is even more reduced by diluting the sample. The resulting curve is characterized by a detection limit of nonylphenol of 15 ng/mL and the working range of determined concentrations of 61–5300 ng/mL. Analysis of the literature, which provides data on the detection of NP in natural waters, demonstrates different levels of content—from 0.3 ng/mL to 6 μg/mL [46,47]. The obtained analytical data satisfy the requirements of environmental monitoring.
The samples used in this work were confirmed as negative and free of nonylphenol. The test samples and distilled water showed identical analytical signal values at the zero point. Therefore, spiked samples were prepared for analysis by introducing known amounts of NP.
As can be seen from Table 4, when nonylphenol was added in various concentrations to water samples that did not contain nonylphenol, this method allowed detection from 82.7 to 122%. It should be noted that the detection method (colorimetric or chemiluminescent) did not affect the recovery values. However, the ranges of working concentrations were different. As a result, the sensitivity of chemiluminescence-based assay was higher. In the case of chemiluminescent detection, the IC10 parameter was 9 ng/mL, compared to 55 ng/mL for colorimetry. Summarizing the analytical characteristics of both methods, it turns out that the limit of detection of nonylphenol was 20 ng/mL when performing chemiluminescent EIA. Colorimetric determination is characterized by the LOD value of 98 ng/mL.
The works of predecessors showed interest in this issue (Table 5). However, it should be noted that the presented work has no analogs both in terms of the type of analytical signal detection and in studying the influence of data processing. In addition, the high sensitivity of the analysis achieved in the presented work was previously achieved using either high-affinity antibodies or the use of a sample concentration step. Thus, the results demonstrated in this work demonstrate the applicability of the developed test system for the determination of nonylphenol in natural waters.

4. Conclusions

This work proposes a method for determining the content of nonylphenol using the developed chemiluminescent competitive enzyme immunoassay. By optimizing the analysis conditions, it was possible to decrease the detection limit of the target analyte to 9 ng/mL, compared to the colorimetric EIA (55 ng/mL), in a buffer solution. In addition, the chemiluminescence method allows one to evaluate the kinetics of substrate oxidation in microplate wells with different label contents.
The advantages of chemiluminescence are high signal values, wide operating ranges, absence of background luminescence, and the possibility to evaluate the signal in kinetic mode. The main disadvantage is a high risk of nonspecific substrate oxidation. The proposed option for detecting and analyzing an analytical signal clearly demonstrates its performance in the case of choosing the optimal time of interaction with the substrate and establishing equilibrium in the system. This work shows that the maximum convergence of the curves in various water samples is observed 20 min after adding the substrate mixture to the wells. The proposed method and approach have good prospects for further application for the detection of analytes in water samples by CL-EIA.

Author Contributions

Conceptualization, A.N.B.; validation, N.S.K.; formal analysis, N.S.K. and K.V.S.; investigation, A.N.B.; resources, A.N.B.; writing—original draft preparation, A.N.B. and N.S.K.; writing—review and editing, A.N.B., N.S.K., K.V.S., A.V.Z. and B.B.D.; visualization, A.N.B.; supervision, A.V.Z. and B.B.D.; project administration, A.V.Z. and B.B.D.; funding acquisition, A.N.B. and B.B.D. All authors have read and agreed to the published version of the manuscript.

Funding

This work was financially supported by the Russian Science Foundation (grant 22-13-00293).

Institutional Review Board Statement

The animal study protocol was approved by the Institutional Ethics Committee of the Research Center of Biotechnology.

Informed Consent Statement

Not applicable.

Data Availability Statement

The raw data supporting the conclusions of this article will be made available by the authors on request.

Acknowledgments

The measurements were carried out on the equipment of the Shared-Access Equipment Centre “Industrial Biotechnology” of Research Center of Biotechnology of the Russian Academy of Sciences.

Conflicts of Interest

The authors declare no conflicts of interest.

References

  1. Babuji, P.; Thirumalaisamy, S.; Duraisamy, K.; Periyasamy, G. Human Health Risks due to Exposure to Water Pollution: A Review. Water 2023, 15, 2532. [Google Scholar] [CrossRef]
  2. Li, P.; Sabarathinam, C.; Elumalai, V. Groundwater pollution and its remediation for sustainable water management. Chemosphere 2023, 329, 138621. [Google Scholar] [CrossRef]
  3. Revel, M.; Châtel, A.; Mouneyrac, C. Micro (nano) plastics: A threat to human health? Curr. Opin. Environ. Sci. Health 2018, 1, 17–23. [Google Scholar] [CrossRef]
  4. Fred-Ahmadu, O.H.; Bhagwat, G.; Oluyoye, I.; Benson, N.U.; Ayejuyo, O.O.; Palanisami, T. Interaction of chemical contaminants with microplastics: Principles and perspectives. Sci. Total Environ. 2020, 706, 135978. [Google Scholar] [CrossRef]
  5. Russo, G.; Laneri, S.; Di Lorenzo, R.; Neri, I.; Dini, I.; Ciampaglia, R.; Grumetto, L. Monitoring of Pollutants Content in Bottled and Tap Drinking Water in Italy. Molecules 2022, 27, 3990. [Google Scholar] [CrossRef]
  6. Lu, I.C.; Chao, H.-R.; Mansor, W.-N.-W.; Peng, C.-W.; Hsu, Y.-C.; Yu, T.-Y.; Chang, W.-H.; Fu, L.-M. Levels of Phthalates, Bisphenol-A, Nonylphenol, and Microplastics in Fish in the Estuaries of Northern Taiwan and the Impact on Human Health. Toxics 2021, 9, 246. [Google Scholar] [CrossRef]
  7. da Costa, J.P.; Santos, P.S.; Duarte, A.C.; Rocha-Santos, T. (Nano) plastics in the environment–sources, fates and effects. Sci. Total Environ. 2016, 566, 15–26. [Google Scholar] [CrossRef]
  8. De la Parra-Guerra, A.C.; Acevedo-Barrios, R. Studies of Endocrine Disruptors: Nonylphenol and Isomers in Biological Models. Environ. Toxicol. Chem. 2023, 42, 1439–1450. [Google Scholar] [CrossRef]
  9. Sharma, V.K.; Anquandah, G.A.; Yngard, R.A.; Kim, H.; Fekete, J.; Bouzek, K.; Ray, A.K.; Golovko, D. Nonylphenol, octylphenol, and bisphenol-A in the aquatic environment: A review on occurrence, fate, and treatment. J. Environ. Sci. Health Part A 2009, 44, 423–442. [Google Scholar] [CrossRef]
  10. Wang, S.; Zhang, J.; Zhou, F.; Liang, C.; He, L.; Jiao, W.; Wu, W. Adsorption of EDCs on Reclaimed Water-Irrigated Soils: A Comparative Analysis of a Branched Nonylphenol, Nonylphenol and Bisphenol A. Water 2021, 13, 2532. [Google Scholar] [CrossRef]
  11. He, S.; Sun, S.; Xue, H.; Kang, C.; Yu, S. Polypropylene microplastics aging under natural conditions in winter and summer and its effects on the sorption and desorption of nonylphenol. Environ. Res. 2023, 225, 115615. [Google Scholar] [CrossRef]
  12. Nagarajan, M.; Maadurshni, G.B.; Manivannan, J. Exposure to low dose of Bisphenol A (BPA) intensifies kidney oxidative stress, inflammatory factors expression and modulates Angiotensin II signaling under hypertensive milieu. J. Biochem. Mol. Toxicol. 2023, 38, e23533. [Google Scholar] [CrossRef]
  13. Dwivedi, S.; D’Souza, L.C.; Shetty, N.G.; Raghu, S.V.; Sharma, A. Hsp27, a potential EcR target, protects nonylphenol-induced cellular and organismal toxicity in Drosophila melanogaster. Environ. Pollut. 2022, 293, 118484. [Google Scholar] [CrossRef]
  14. Olaniyan, L.W.B.; Okoh, O.O.; Mkwetshana, N.T.; Okoh, A.I. Environmental Water Pollution, Endocrine Interference and Ecotoxicity of 4-tert-Octylphenol: A Review. In Reviews of Environmental Contamination and Toxicology Volume 248; de Voogt, P., Ed.; Springer International Publishing: Cham, Switzerland, 2020; pp. 81–109. [Google Scholar] [CrossRef]
  15. Penserini, L.; Cantoni, B.; Gabrielli, M.; Sezenna, E.; Saponaro, S.; Antonelli, M. An integrated human health risk assessment framework for alkylphenols due to drinking water and crops’ food consumption. Chemosphere 2023, 325, 138259. [Google Scholar] [CrossRef]
  16. Pascale, R.; Acquavia, M.A.; Onzo, A.; Cataldi, T.R.I.; Calvano, C.D.; Bianco, G. Analysis of surfactants by mass spectrometry: Coming to grips with their diversity. Mass Spectrom. Rev. 2023, 42, 1557–1588. [Google Scholar] [CrossRef]
  17. Ahsan, H. Monoplex and multiplex immunoassays: Approval, advancements, and alternatives. Comp. Clin. Pathol. 2022, 31, 333–345. [Google Scholar] [CrossRef]
  18. Ito, E.; Iha, K.; Yoshimura, T.; Nakaishi, K.; Watabe, S. Chapter Four—Early diagnosis with ultrasensitive ELISA. In Advances in Clinical Chemistry; Makowski, G.S., Ed.; Elsevier: Amsterdam, The Netherlands, 2021; Volume 101, pp. 121–133. [Google Scholar]
  19. Wu, L.; Li, G.; Xu, X.; Zhu, L.; Huang, R.; Chen, X. Application of nano-ELISA in food analysis: Recent advances and challenges. TrAC Trends Anal. Chem. 2019, 113, 140–156. [Google Scholar] [CrossRef]
  20. Mart’ianov, A.A.; Zherdev, A.V.; Eremin, S.A.; Dzantiev, B.B. Preparation of antibodies and development of enzyme-linked immunosorbent assay for nonylphenol. Int. J. Environ. Anal. Chem. 2004, 84, 965–978. [Google Scholar] [CrossRef]
  21. Lu, J.; Wu, J.; Wu, J.; He, X. Adsorption of nonylphenol on coastal saline soil: Will microplastics play a great role? Chemosphere 2023, 311, 137032. [Google Scholar] [CrossRef]
  22. Li, X.; Chen, S.; Li, L.; Quan, X.; Zhao, H. Electrochemically enhanced adsorption of nonylphenol on carbon nanotubes: Kinetics and isotherms study. J. Colloid Interface Sci. 2014, 415, 159–164. [Google Scholar] [CrossRef]
  23. Zhao, Y.; Song, J.; Wu, D.; Tang, T.; Sun, Y. One-step synthesis of hydrophobic mesoporous silica and its application in nonylphenol adsorption. J. Phys. Chem. Solids 2015, 86, 1–4. [Google Scholar] [CrossRef]
  24. Kronberg, B.; Stenius, P.; Thorssell, Y. Adsorption of nonylphenol—Poly(propylene oxide)—Poly(ethylene oxide) nonionic surfactants on polystyrene latex. Colloids Surf. 1984, 12, 113–123. [Google Scholar] [CrossRef]
  25. Wang, J.; Li, H.; Shelver, W.L.; Wang, Z.; Li, Q.X.; Li, J.; Xu, T. Development of a monoclonal antibody-based, congener-specific and solvent-tolerable direct enzyme-linked immunosorbent assay for the detection of 2,2′,4,4′-tetrabromodiphenyl ether in environmental samples. Anal. Bioanal. Chem. 2011, 401, 2249–2258. [Google Scholar] [CrossRef]
  26. Berlina, A.N.; Zherdev, A.V.; Xu, C.; Eremin, S.A.; Dzantiev, B.B. Development of lateral flow immunoassay for rapid control and quantification of the presence of the colorant Sudan I in spices and seafood. Food Control 2017, 73, 247–253. [Google Scholar] [CrossRef]
  27. Berlina, A.N.; Ragozina, M.Y.; Gusev, D.I.; Zherdev, A.V.; Dzantiev, B.B. Development of Chemiluminescent ELISA for Detection of Diisobutyl Phthalate in Water, Lettuce and Aquatic Organisms. Chemosensors 2023, 11, 393. [Google Scholar] [CrossRef]
  28. Tré-Hardy, M.; Wilmet, A.; Beukinga, I.; Dogné, J.-M.; Douxfils, J.; Blairon, L. Validation of a chemiluminescent assay for specific SARS-CoV-2 antibody. Clin. Chem. Lab. Med. (CCLM) 2020, 58, 1357–1364. [Google Scholar] [CrossRef]
  29. Hiebert, J.; Zubach, V.; Charlton Carmen, L.; Fenton, J.; Tipples Graham, A.; Fonseca, K.; Severini, A. Evaluation of Diagnostic Accuracy of Eight Commercial Assays for the Detection of Measles Virus-Specific IgM Antibodies. J. Clin. Microbiol. 2021, 59, e03161-20. [Google Scholar] [CrossRef]
  30. Khan, M.; Shah, S.H.; Salman, M.; Abdullah, M.; Hayat, F.; Akbar, S. Enzyme-Linked Immunosorbent Assay versus Chemiluminescent Immunoassay: A General Overview. Glob. J. Med. Pharm. Biomed. Update 2023, 18, 1. [Google Scholar] [CrossRef]
  31. Cabello, M.C.; Bartoloni, F.H.; Bastos, E.L.; Baader, W.J. The Molecular Basis of Organic Chemiluminescence. Biosensors 2023, 13, 452. [Google Scholar] [CrossRef]
  32. Chu, Y.; Han, T.; Deng, A.; Li, L.; Zhu, J.-J. Resonance energy transfer in electrochemiluminescent and photoelectrochemical bioanalysis. TrAC Trends Anal. Chem. 2020, 123, 115745. [Google Scholar] [CrossRef]
  33. Deepa, S.; Venkatesan, R.; Jayalakshmi, S.; Priya, M.; Kim, S.-C. Recent advances in catalyst-enhanced luminol chemiluminescence system and its environmental and chemical applications. J. Environ. Chem. Eng. 2023, 11, 109853. [Google Scholar] [CrossRef]
  34. Giussani, A.; Farahani, P.; Martínez-Muñoz, D.; Lundberg, M.; Lindh, R.; Roca-Sanjuán, D. Molecular Basis of the Chemiluminescence Mechanism of Luminol. Chem.—A Eur. J. 2019, 25, 5202–5213. [Google Scholar] [CrossRef]
  35. Marquette, C.A.; Blum, L.J. Applications of the luminol chemiluminescent reaction in analytical chemistry. Anal. Bioanal. Chem. 2006, 385, 546–554. [Google Scholar] [CrossRef]
  36. Deshpande, K.; Kanungo, L. Chemiluminescence and fluorescence biosensors for food application: A review. Sens. Actuators Rep. 2023, 5, 100137. [Google Scholar] [CrossRef]
  37. Hirano, T.; Matsuhashi, C. Soft Crystal Chemiluminescence Systems Using Organic Peroxides. In Soft Crystals: Flexible Response Systems with High Structural Order; Springer Nature Singapore: Singapore, 2023; pp. 155–177. [Google Scholar]
  38. Habeeb, A.F.S.A. Determination of free amino groups in proteins by trinitrobenzenesulfonic acid. Anal. Biochem. 1966, 14, 328–336. [Google Scholar] [CrossRef]
  39. Sakharov, I.Y.; Berlina, A.N.; Zherdev, A.V.; Dzantiev, B.B. Advantages of Soybean Peroxidase over Horseradish Peroxidase as the Enzyme Label in Chemiluminescent Enzyme-Linked Immunosorbent Assay of Sulfamethoxypyridazine. J. Agric. Food Chem. 2010, 58, 3284–3289. [Google Scholar] [CrossRef]
  40. Kong, J.; Yu, S. Fourier transform infrared spectroscopic analysis of protein secondary structures. Acta Biochim. Biophys. Sin. 2007, 39, 549–559. [Google Scholar] [CrossRef]
  41. Bonenfant, D.; Niquette, P.; Mimeault, M.; Furtos-Matei, A.; Hausler, R. UV-VIS and FTIR spectroscopic analyses of inclusion complexes of nonylphenol and nonylphenol ethoxylate with β-cyclodextrin. Water Res. 2009, 43, 3575–3581. [Google Scholar] [CrossRef]
  42. Zvereva, E.A.; Byzova, N.A.; Sveshnikov, P.G.; Zherdev, A.V.; Dzantiev, B.B. Cut-off on demand: Adjustment of the threshold level of an immunochromatographic assay for chloramphenicol. Anal. Methods 2015, 7, 6378–6384. [Google Scholar] [CrossRef]
  43. Mart’ianov, A.A.; Dzantiev, B.B.; Zherdev, A.V.; Eremin, S.A.; Cespedes, R.; Petrovic, M.; Barcelo, D. Immunoenzyme assay of nonylphenol: Study of selectivity and detection of alkylphenolic non-ionic surfactants in water samples. Talanta 2005, 65, 367–374. [Google Scholar] [CrossRef]
  44. Pascual, C.; Romay, C. Effect of antioxidants on chemiluminescence produced by reactive oxygen species. J. Biolumin. Chemilumin. 1992, 7, 123–132. [Google Scholar] [CrossRef]
  45. Ring Biotechnology Co., Ltd. Nonylphenol Ethoxylates, NPE ELISA Kit. Available online: https://foodtestkit.com/products/nonylphenol-ethoxylates-npe-elisa-kit/ (accessed on 18 February 2024).
  46. Sharma, M.; Chadha, P.; Madhu Sharma, C. Toxicity of non-ionic surfactant 4-nonylphenol an endocrine disruptor: A review. Int. J. Fish. Aquat. Stud. 2018, 6, 190–197. [Google Scholar]
  47. Babay, P.A.; Itria, R.F.; Romero Ale, E.E.; Becquart, E.T.; Gautier, E.A. Ubiquity of Endocrine Disruptors Nonylphenol and Its Mono-and Di-E thoxylates in Freshwater, Sediments, and Biosolids Associated with High and Low Density Populations of Buenos Aires, Argentina. CLEAN–Soil Air Water 2014, 42, 731–737. [Google Scholar] [CrossRef]
  48. Lu, Y.; Peterson, J.R.; Gooding, J.J.; Lee, N.A. Development of a Competitive ELISA for the Detection of 4-tert-Octylphenol in Seafood. Food Anal. Methods 2015, 8, 1923–1935. [Google Scholar] [CrossRef]
  49. Li, Z.; Liu, L.; Song, S.; Guo, S.; Kuang, H.; Xu, C. Development of an enzyme-linked immunosorbent assay for octylphenol. Food Agric. Immunol. 2014, 25, 397–410. [Google Scholar] [CrossRef]
  50. Berlina, A.N.; Ragozina, M.Y.; Komova, N.S.; Serebrennikova, K.V.; Zherdev, A.V.; Dzantiev, B.B. Comparison of Au, Au–Pt, and Au–Ag nanoparticles as markers for immunochromatographic determination of nonylphenol. Chim. Techno Acta 2023, 10, 202310103. [Google Scholar] [CrossRef]
  51. Berlina, A.N.; Komova, N.S.; Serebrennikova, K.V.; Zherdev, A.V.; Dzantiev, B.B. Comparison of different formats for immunochromatographic detection of surfactant nonylphenol. Eng. Proc. 2023, 48, 9. [Google Scholar]
Figure 1. Scheme of conjugation of nonylphenol with carrier protein by Mannich reaction. (A)—nonylphenol structure; (B)—intermediate compound having active group reacting with primary amines to form the hapten–protein conjugate—(C).
Applsci 14 01685 g001
Figure 2. Absorption spectra of the NP–STI conjugate, NP and STI.
Applsci 14 01685 g002
Figure 3. Characterization of NP–STI conjugate (black line) by FT-IR technique in comparison with native STI (green line) and nonylphenol (red line).
Applsci 14 01685 g003
Figure 4. Dose–response curve for the determination of nonylphenol in EIA with colorimetric detection (concentration of NP–STI in wells 1 μg/mL); n = 3. Inset—picture of microplate wells corresponding to the points (concentrations) of the curve.
Applsci 14 01685 g004
Figure 5. Kinetics of the analytical signal in black microplate wells in the absence (1) and presence (2) of the analyte. Concentration of NP–STI in wells: 2 μg/mL; antiserum dilution: 1:20,000. All measurements were performed in triplicate. The SD parameter did not exceeded 10%.
Applsci 14 01685 g005
Figure 6. Dependence of the chemiluminescent signal on the antiserum dilution in absence of nonylphenol (a); dependence of chemiluminescent signal on the analyte concentration (b); signal-to noise ratio at different NP–STI concentration in the wells in competitive chemiluminescent EIA (c). The concentration of NP–STI was 1 µg/mL; antiserum dilution was 1:10,000. All measurements were performed in duplicate. The SD in the 10th measurement did not exceeded 12%.
Applsci 14 01685 g006
Figure 7. Calibration curve in distilled water. The concentration of NP–STI was 1 µg/mL; antiserum dilution: 1:10,000. All measurements were performed in duplicate. The SD in the 10th measurement did not exceeded 8%.
Applsci 14 01685 g007
Table 1. Analytical parameters of competition curves obtained by immobilization of the NP–STI conjugate at various concentrations in PBS.
Concentration of NP–STIIC10, ng/mLIC20, ng/mLIC50, ng/mLIC80, ng/mLResponses max/minError *, %
5 µg/mL77175190021,9000.33/0.186.2
3 µg/mL490350123019,4000.31/0.181.9
2 µg/mL115614182011,1000.29/0.122.8
1 µg/mL55190159013,3000.3/0.055.6
0.5 µg/mL238376871200.22/0.062.9
0.1 µg/mL185029017400.11/0.064.3
0.01 µg/mL929394950.08/0.064.8
* The average error of detection in the range of IC10–IC80.
Table 2. Analytical parameters of competitive curves for NP determination obtained by assessing intermediate data when studying the kinetics of the analytical signal (10th measurement).
Duration of CompetitionIC10, ng/mLIC20, ng/mLIC50, ng/mLIC80, ng/mLResponses max/minError *, %
60 min29764002100685/246.5
45 min925138758606/218.2
30 min82087380442/2413.9
15 min132463170134/2417.3
* The average error of detection in the range of IC10–IC80.
Table 3. Analytical parameters of competitive curves for the NP determination obtained using various media.
No.MediumIC10, ng/mLIC20, ng/mLIC80, ng/mLIC50, ng/mLResponses max/minError *, %
1Distilled water15.060.975300669.80765/705.3
2PBS 1 mM8.932.272633.1291.51574/1536.8
3PBS 10 mM28.485.673731.93565.44608/1409.2
4PBS 50 mM22.051.8970.13224.10550/1018.4
5PBST4.0617.802778.7222.34580/924.2
650 mM PBS + 0.1% gelatin24.173.113251.55487.56640/956.0
* The average error of detection in the range of IC10–IC80.
Table 4. Data on NP concentration observed by the developed chemiluminescent EIA in the spiked water samples (10th measurement, n = 3) and colorimetric EIA.
Added, NP Detected, NP, Chemiluminescence
Probe 1 (River)Probe 2 (Waterfall)Probe 3 (Pond)
ng/mLng/mL%ng/mL%ng/mL%
4555 ± 8.4122 ± 15.253 ± 2.3117.7 ± 4.350 ± 5.3111.1 ± 10.5
135140 ± 13.7103.7 ± 9.8130 ± 7.596.3 ± 5.8148 ± 10.4109.6 ± 7.0
400431 ± 49.1107.8 ± 11.4411 ± 42.3102.8 ± 10.3395 ± 15.098.8 ± 3.8
12001023 ± 53.285.3 ± 5.2954 ± 127.879.5 ± 13.4992 ± 69.382.7 ± 7.0
Detected, NP, Colorimetry
200235 ± 3.2117.5 ± 1.4184 ± 8.192 ± 4.4234 ± 7.9117.0 ± 3.4
600589 ± 6.498.2 ± 1.1532 ± 16.588.7 ± 3.1519.6 ± 16.686.6 ± 3.2
800830 ± 12.2103.8 ± 14.7792 ± 13.699 ± 1.8762.4 ± 11.495.3 ± 1.5
10001206 ± 10.4120.6 ± 0.9998 ± 19.299.8 ± 2.0832 ± 16.283.2 ± 2.0
Table 5. Works on the immunochemical determination of alkylphenols in the most recent 10 years.
No.TechniqueDetectionSampleAntibody IC10 or IC50Ref.
1ELISAColorimetryPrawn and clam samples (seafood)polyclonal10 μg/L
20 μg/L
[48]
2ELISAColorimetryLake waterMonoclonal, polyclonal76 ng/mL—OP
24 ng/mL—NP
[49]
3LFIAColorimetry-polyclonal1 μg/mL[50]
4LFIAColorimetrySpring water polyclonal1.1 and 0.4 μg/mL[51]
5EIAChemiluminescentSpring waterpolyclonal7 ng/mLThis work
Disclaimer/Publisher’s Note: The statements, opinions and data contained in all publications are solely those of the individual author(s) and contributor(s) and not of MDPI and/or the editor(s). MDPI and/or the editor(s) disclaim responsibility for any injury to people or property resulting from any ideas, methods, instructions or products referred to in the content.

