Abstract
In the exploration tunnels of the Xiageliao landslide, slide failures were found not only inside the slip soil but also on the contact surface between the slip soil and the tuff. The undisturbed slip soil was collected from the exploration tunnel for testing to explore the pattern of slide failure occurrence. The surfaces of concrete blocks of different shapes were used to simulate slip soil–tuff contact surfaces of different roughness. The shear strength of these contact surfaces with different roughness was tested using a large-scale shear test system and analyzed through comparison with the shear strength of the slip soil. The test results showed that the interface roughness significantly affected the shear strength of the slip soil contact interface and determined the shear failure mode of the slip soil. When the roughness is below a certain level, the shear strength of the contact surface is less than the soil shear strength, and when the roughness reaches a certain level, the shear strength of the contact surface exceeds the strength of the slip soil itself. Thus, the strength of the slip soil itself sometimes differs from the strength of the slip surface. Based on the Moore–Cullen law, the test results found a formula for calculating the contact surface shear strength. These results provide some references for the risk evaluation of landslides.
1. Introduction
As a major mountain geohazard worldwide, landslide research focuses on the strength parameter of the slip surface. The study of the strength parameters of slip soils has produced rich results by many scholars worldwide. In recent years, with the deepening of research, more and more scholars have shifted the focus of research from the strength of the slip soil itself to the strength of the contact surface between the slip soil and its neighboring rock and soil layers [1,2,3,4,5,6,7,8,9,10].
Potyondy [11] and Jewell [12] first studied the mechanical properties of the contact surface between various structural materials and the geotechnical body with the help of strain-controlled straight shear instrumentation. They summarized through experimental research that the water content of the geotechnical body and the structure indicates that the roughness and the vertical stress will affect the contact surface shear strength. Yoshimi and Kishida [13] introduced an X-ray photographic technique to a sand–steel contact surface shear test. They found that the steel surface roughness significantly affected the shear strength. Hu and Pu [3] applied a digital camera to a sand–steel contact surface straight shear test. They pointed out that a critical level of roughness classified contact surfaces as low roughness surface and high roughness surface. These two types of surfaces determined two modes of shear failure on the contact surface. Kou et al. [14], based on straight shear tests on calcareous sand–steel contact surfaces with different interfacial roughness levels and grain sizes, pointed out that roughness and average grain size significantly affected the shear behavior of calcareous sand–steel contact surfaces. Clough and Duncan [15] conducted an experimental study on the mechanical properties of sand–concrete contact surfaces on a box-type straight shear apparatus. Based on the test results, they proposed a hyperbolic relationship between the shear stress and the relative tangential displacement at the contact surface between sand and concrete. Uesugi and Kishida [16] proposed the existence of critical roughness by using a direct simple shear test (DSS-test) for two types of cohesive soils in contact with steel plates. When the roughness of the steel plate was less than the critical roughness, the strength of the contact surface was lower than that of the clay, and when it was more significant than the critical roughness, the failure occurred in the clay, and the strength was equal to that of the clay. Huck et al. [17] concluded that the shear strength of sandy soils in contact with structures conforms to the Moore–Cullen law. Tiwari et al. [18] selected different types of soils and structures to determine the shear mechanical properties of contact surfaces. The results indicated that soil type, saturation, and structural surface material control the shear performance of soil–structure contact surfaces.
Until now, only a few researchers have conducted the strength testing of contact surfaces using undisturbed slip soils. Most of them collect slip soils through drilling or surface excavation, and some scholars even simulate the mechanical characteristics of slip soils through indoor proportioning. Although these results have a robust discussion and reference value, they ultimately need to establish a direct link with the actual situation of landslide engineering.
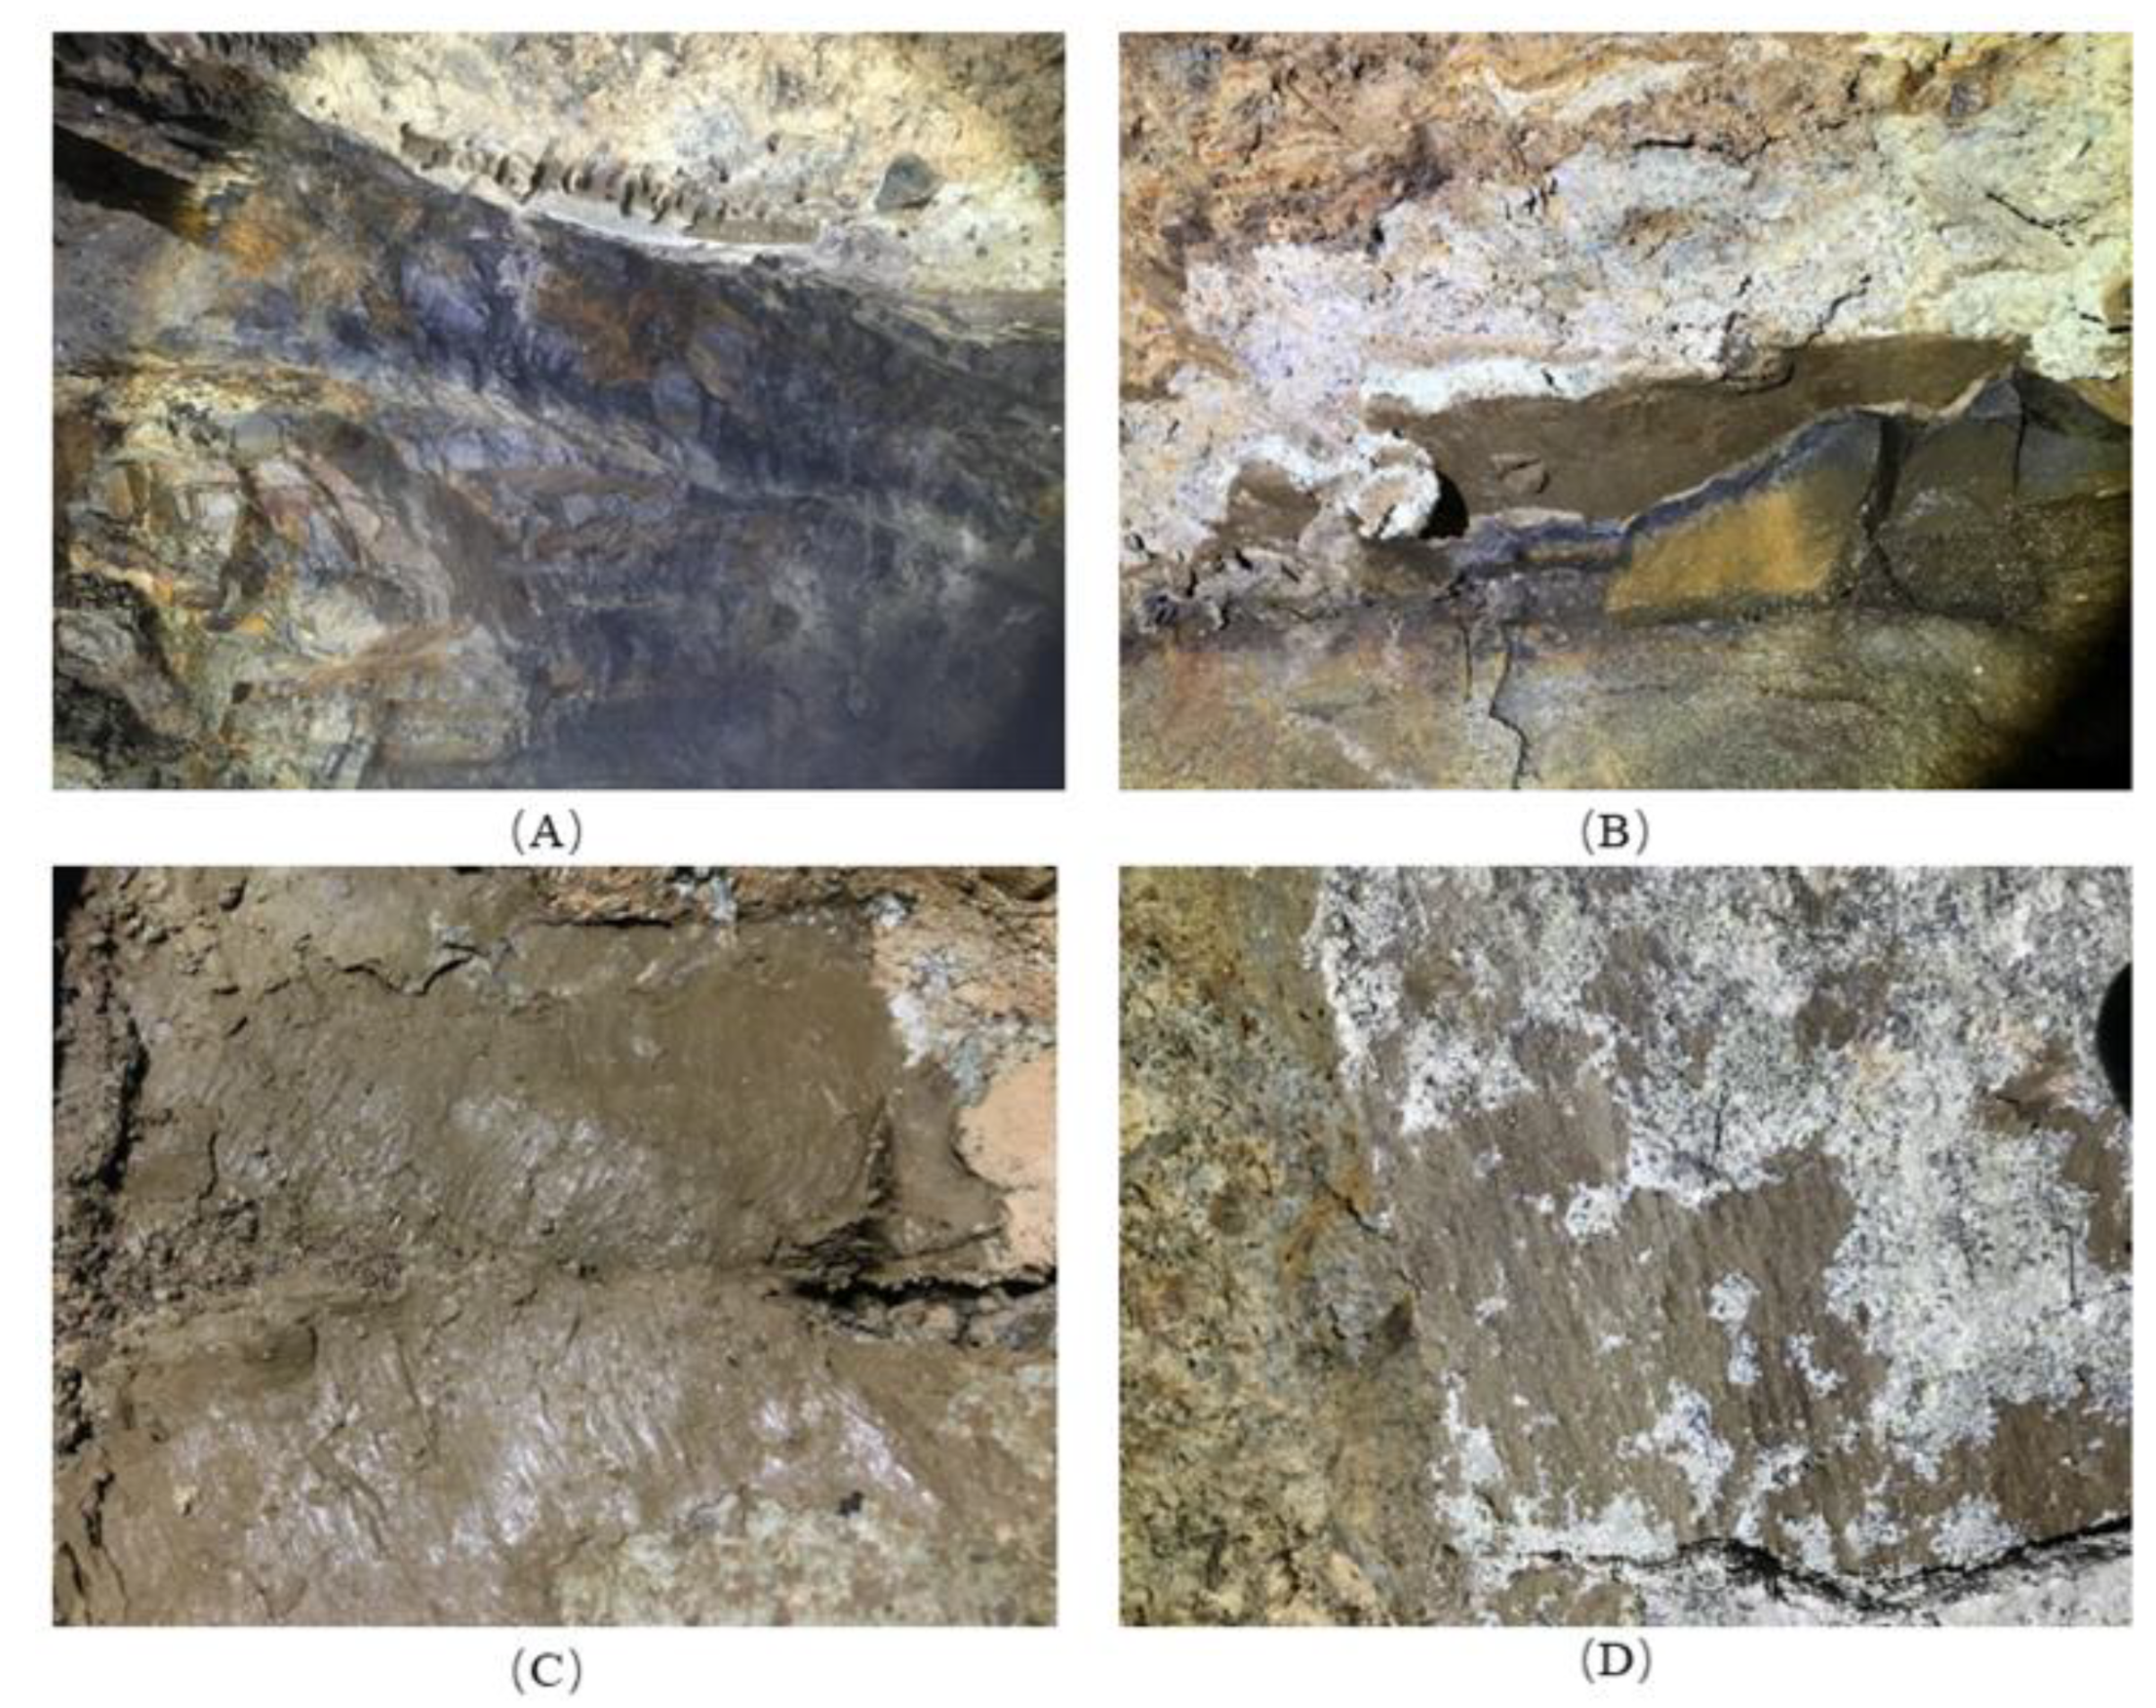
In this paper, with the help of the existing investigation results of the Xiageliao landslide located on the east coast of China as a research base, undisturbed slip soil was observed and taken from the exploration tunnel for testing. The landslide is a large tuff landslide with a volume of 1100 × 104 m3, and the slip soil is buried at a depth of up to 100 m. The nature of the slip soil is yellowish-brown clay, and obvious scratch marks due to sliding are visible in some sections, as shown in Figure 1. During the survey, it was found that in some places, the scratch marks appeared inside the slip soil, as shown in Figure 1C, and in some areas, the scratch marks appeared between the slip soil and the tuff, as shown in Figure 1D. This evidence demonstrates that slide failure of a landslide was not simply a failure along the slip soil itself or at the contact surface between the slip soil and the tuff but rather a combined pattern of failure constrained by other factors.

Figure 1.
Slip soil and the scratch marks (at the top of the tunnel). (A) Panoramic view of slip soil. (B) Close-up of slip soil. (C) Scratch within slip soil. (D) Scratch on the surface of slip soil. All views are elevated.
To study the shear strength of the slip soil in contact with the tuff and its failure mode, samples of slip soil were collected from the exploration tunnel, and relevant tests were conducted in the laboratory to study the slide failure mode of the landslide. These experiments investigated the shear strength of contact surfaces under different contact relationships by simulating contact surfaces with different degrees of roughness. The factors affecting the failure mode of the contact surface were also studied.
2. Materials and Methods
2.1. Instruments
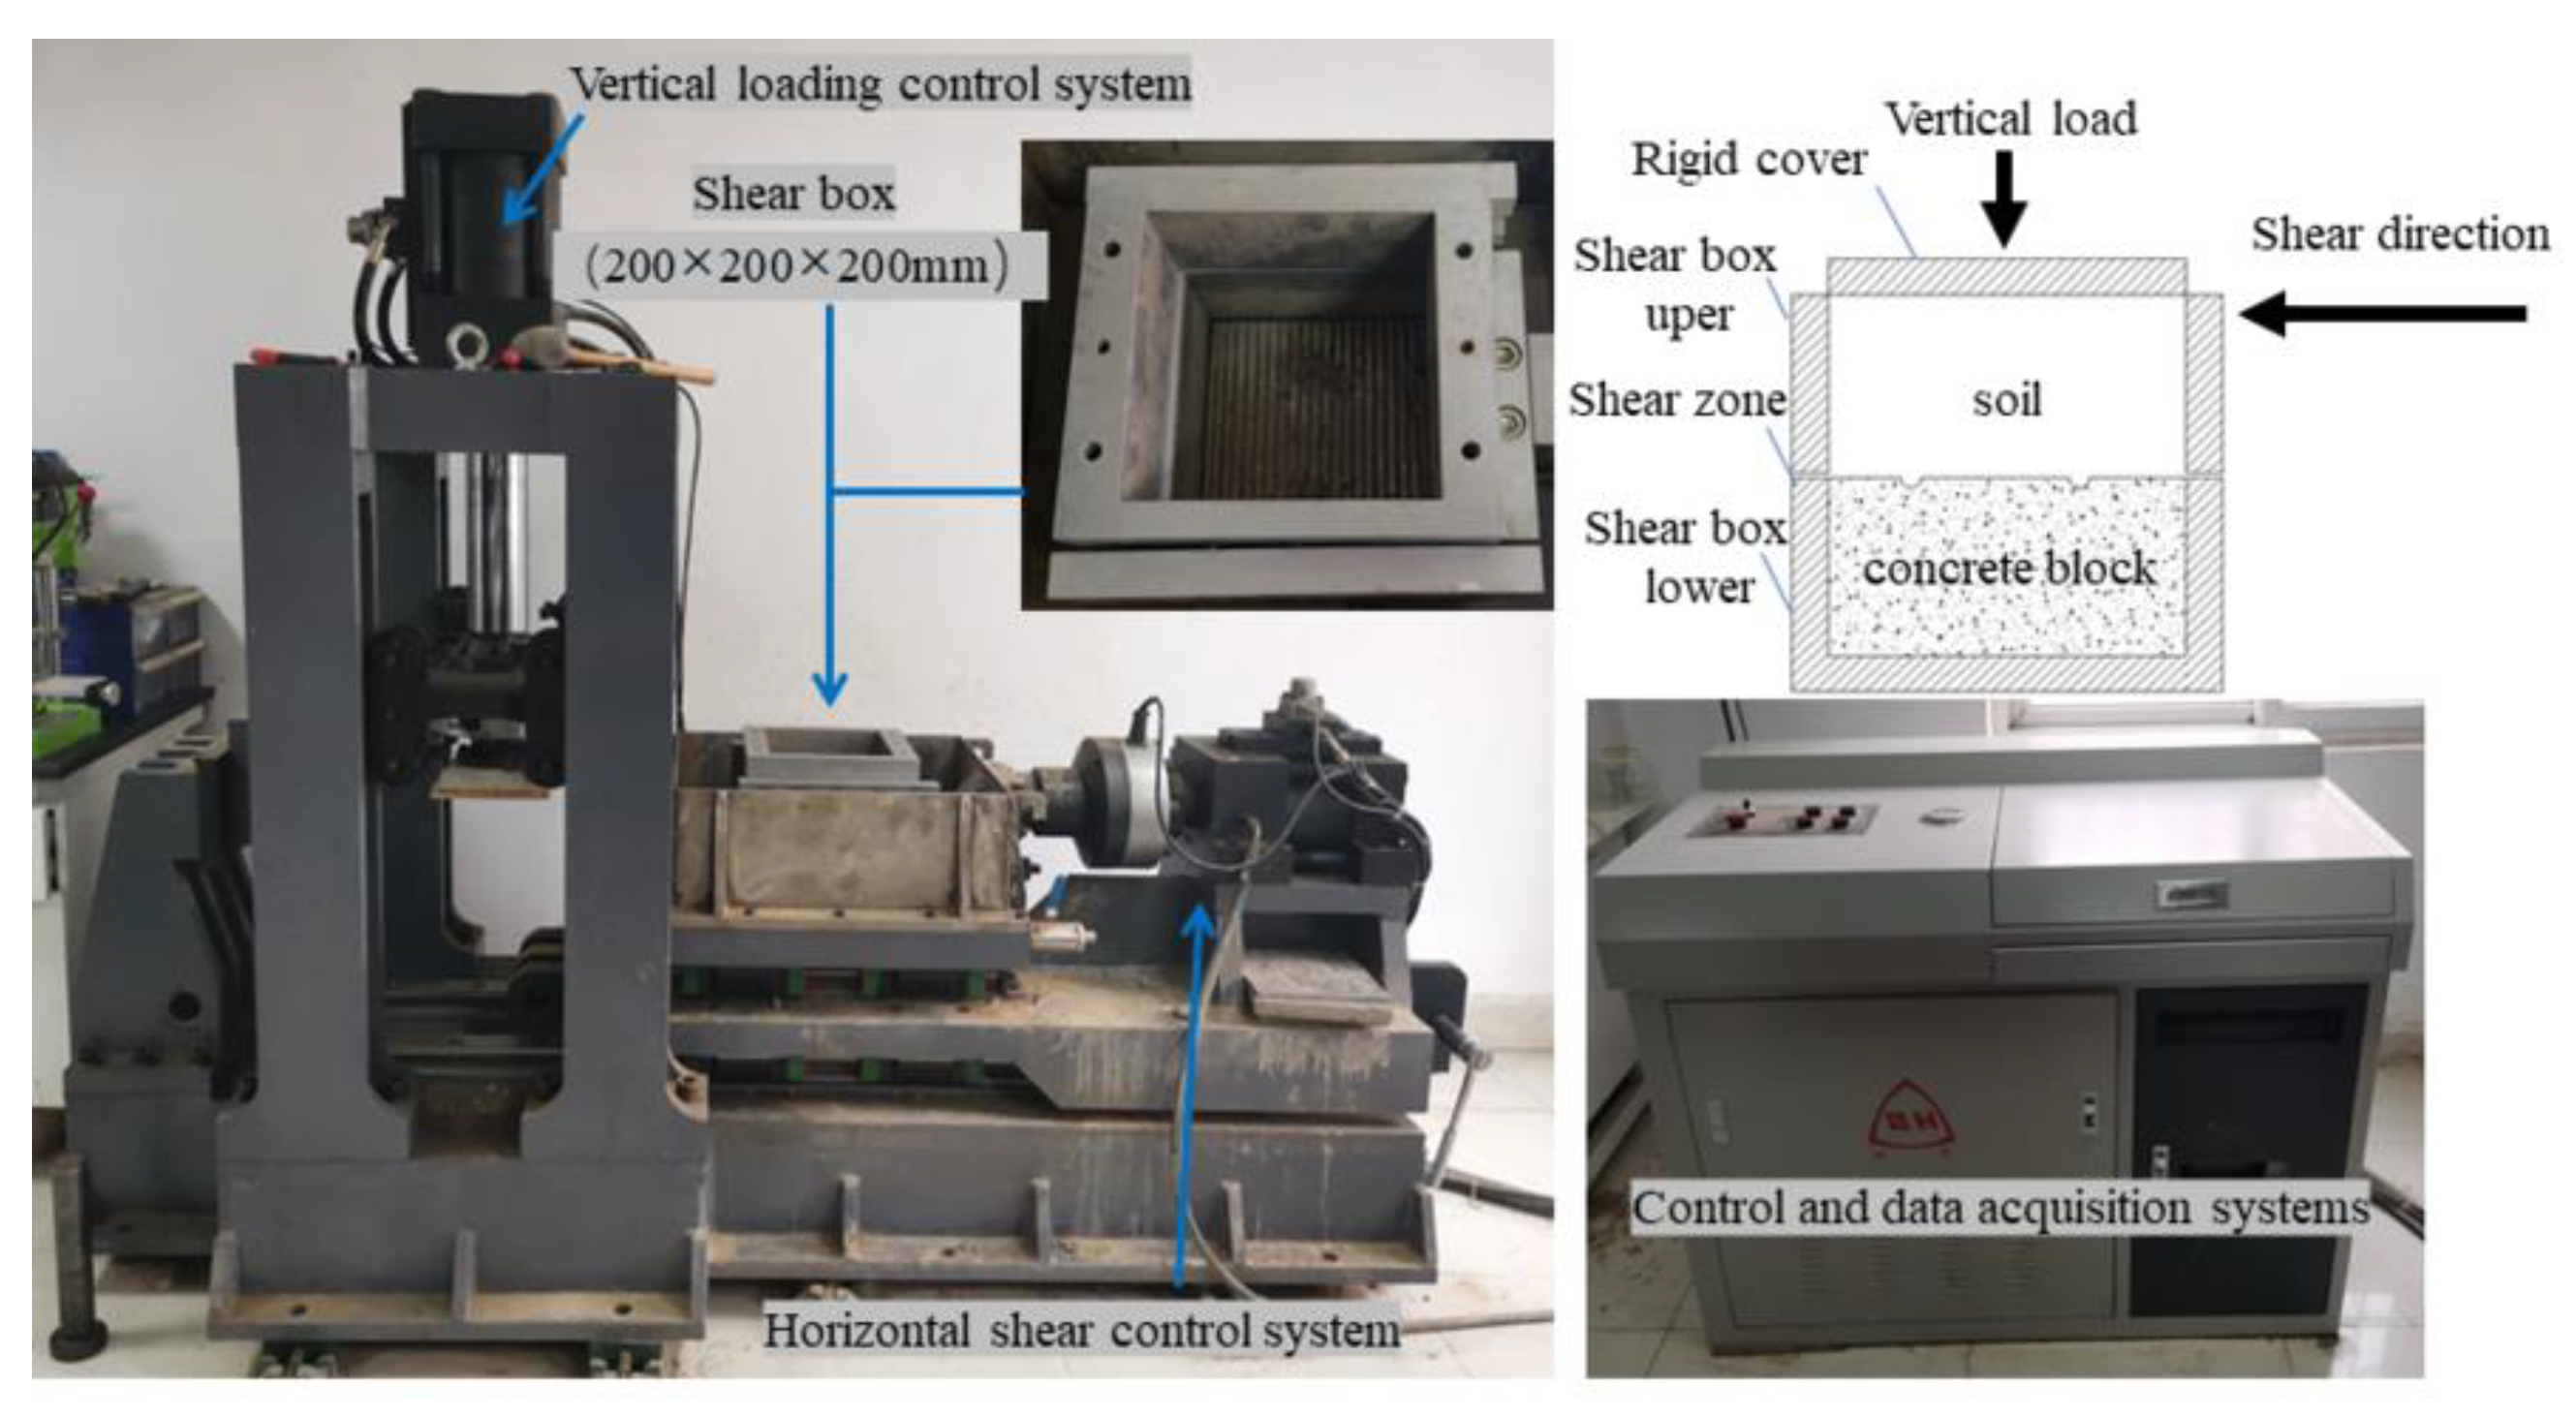
The test instrument was selected from a large-scale straight shear tester from the China University of Geosciences (Wuhan), shown in Figure 2. The instrument’s shear box is divided into two parts (upper one and lower one); the overall internal geometry of the shear box is 200 × 200 × 200 mm. The instrument can realize equal speed stress and displacement control, and the control mode can be switched smoothly during the test. During the test, a concrete block was placed in the lower box, and the upper box was filled with slip soil. The direct shear test system can be easily operated, precisely controls the shear displacement rate, and automatically collects shear stress data.

Figure 2.
Large-scale straight shear test system.
2.2. Preparation of Materials and Samples
The soil samples used for testing were taken from slip soils found in the exploration tunnels of the Xiageliao landslide in Zhejiang Province, China. An amount of 100 g slip soil was taken and dried in an oven at a temperature of 105 °C for 24 h. The soil properties and water content of the slip soil were calculated and are summarized in Table 1 [19]. The remaining sample was prepared for the large-scale straight shear test. To ensure that the physical parameters of the samples remained consistent, they were partitioned, weighed, and stored in sealed containers. They were remolded based on their natural properties state, as shown in Table 1.

Table 1.
Basic physical properties of slip soil.
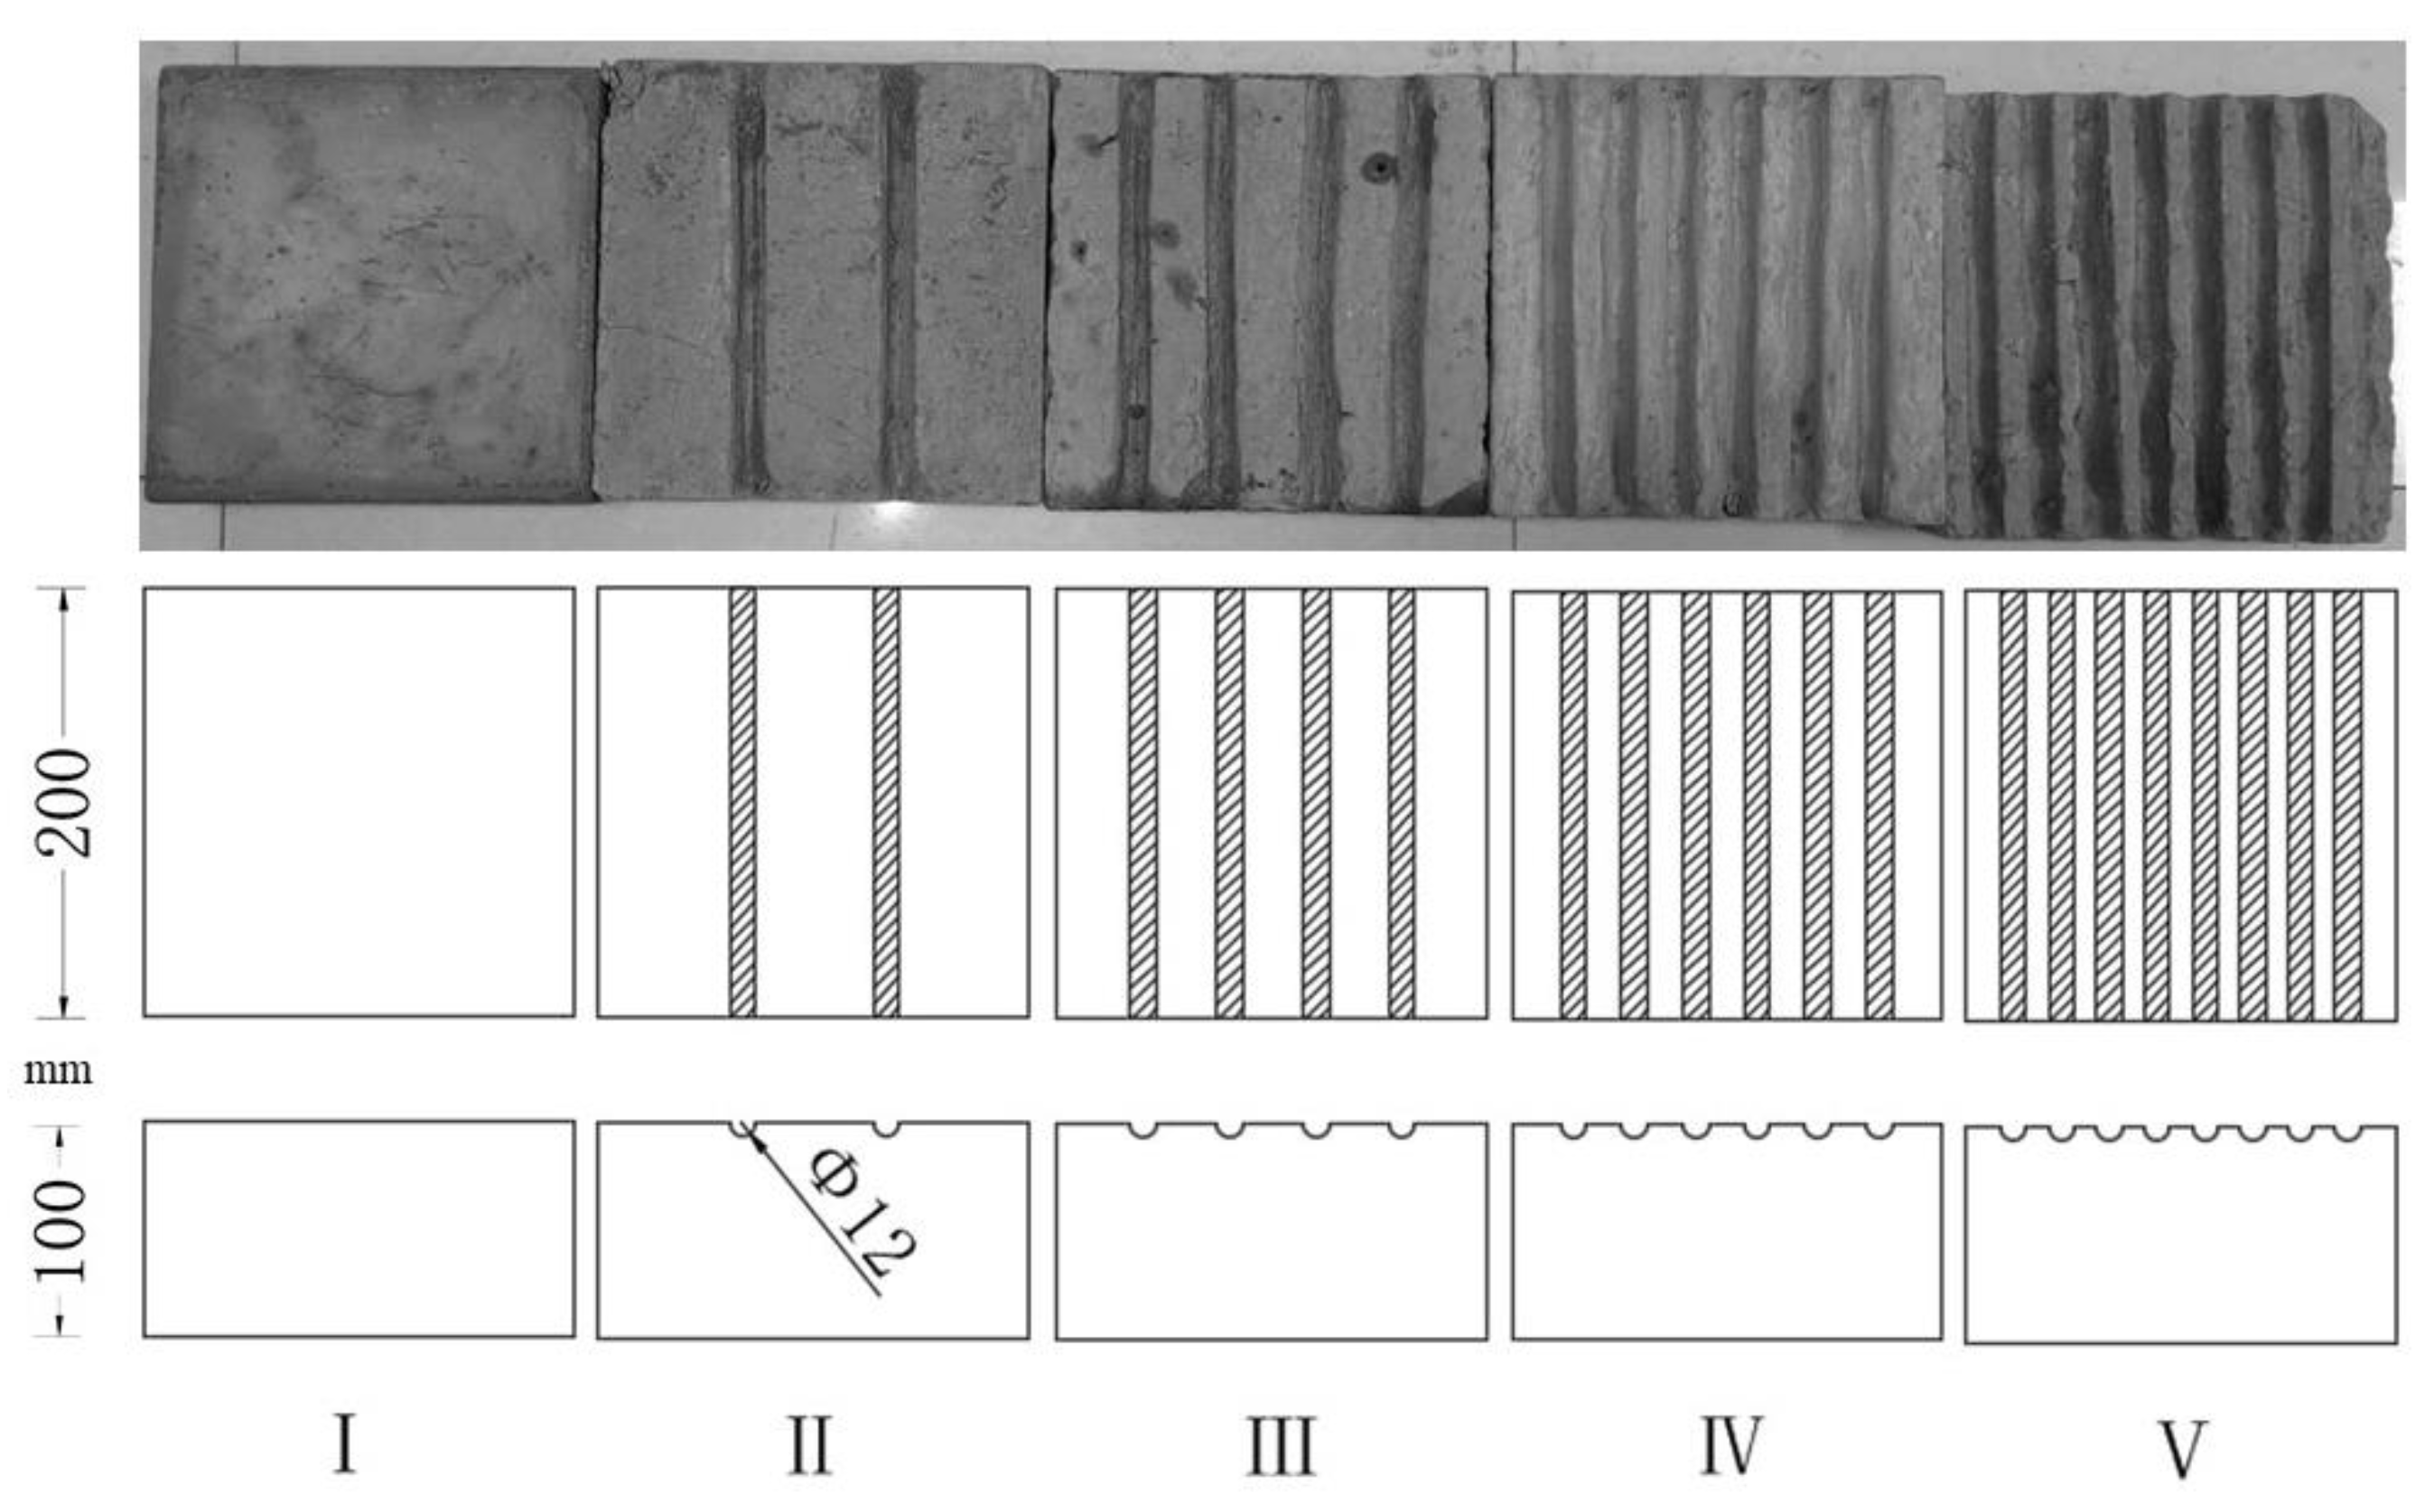
Many scholars have utilized structures with regularly shaped surfaces in modeling tests to aid in studying rough structural surfaces. This paper adopted a similar approach to simulate the rough contact surface of actual soil and bedrock bodies by creating regular semicircular grooves in concrete specimen blocks. According to the tuff test on the slide bed of the Xiageliao landslide, its uniaxial compressive strength can be up to 55.8~135 MPa, so C50 concrete was selected to make the sample blocks. The concrete blocks were made of C50 concrete with a water–cement ratio of 0.43 and a water consumption of 195 kg for 1 m3 of concrete.
The size of the precast concrete specimen was 200 mm × 200 mm × 100 mm, with semicircular grooves arranged parallel to the specimen’s surface, all 12 mm in diameter. To study the effect of the change in roughness on the mechanical properties of the contact surface, the surface roughness of the specimen was adjusted by changing the number of grooves, and a total of five concrete specimens with different rough surfaces were prefabricated for the test, as shown in Figure 3.

Figure 3.
Concrete blocks with different surface roughness values.
2.3. Experimental Process
A total of 24 sets of shear tests were conducted. Each of the contact surfaces of slip soils with five different levels of roughness (R1 to R5) were individually tested in straight shear with vertical loads of 100 kPa, 200 kPa, 400 kPa, and 800 kPa. Additionally, the slip soil was tested in straight shear at these levels of vertical load.
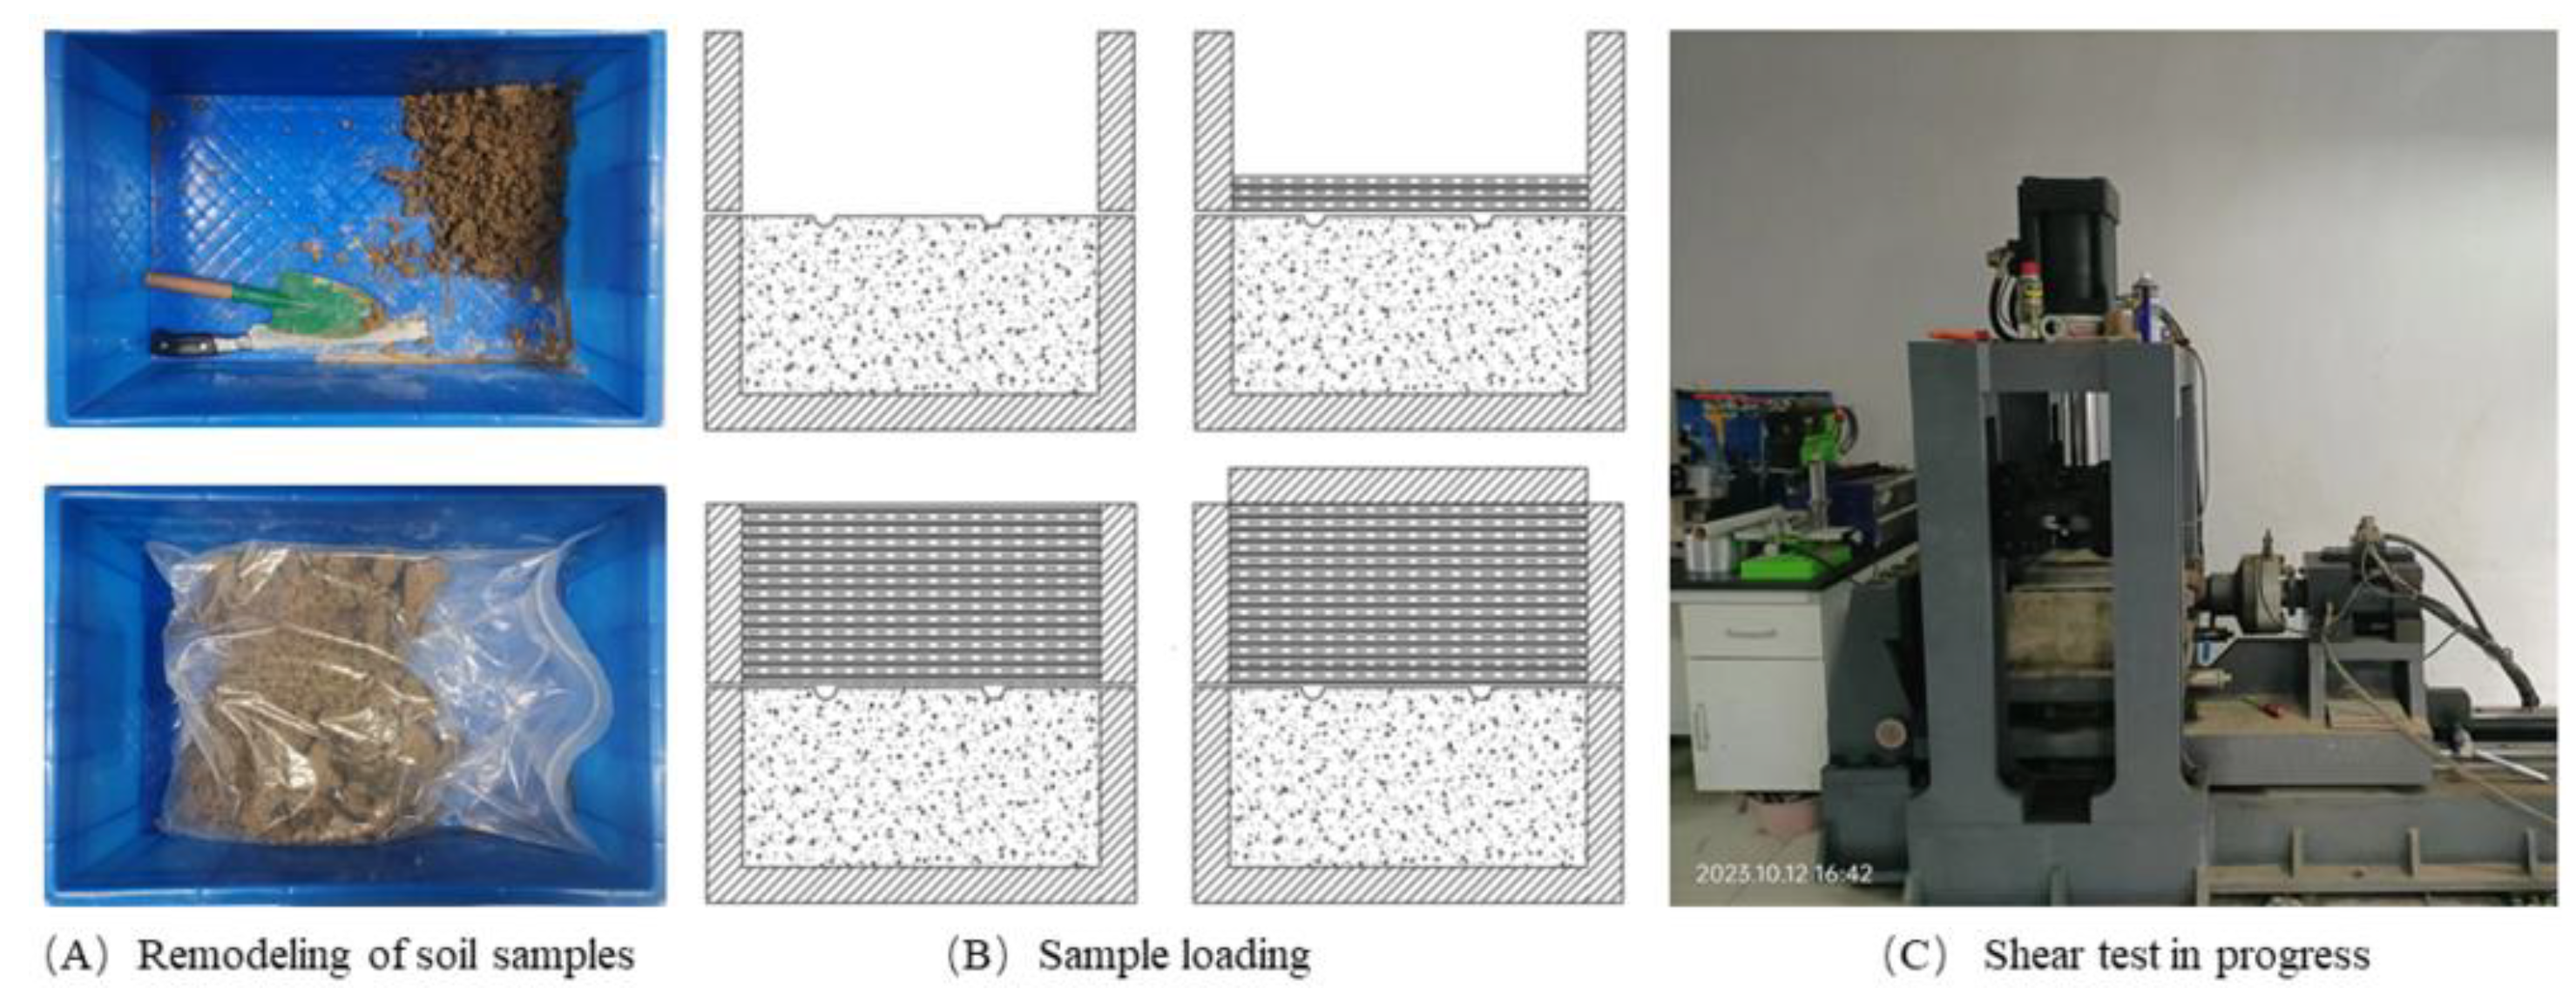
The tests were carried out in unconsolidated undrained form with a 1 mm/min shear rate. The test process is defined as follows and shown in Figure 4:

Figure 4.
Main testing process. (A) Remodeling of samples. (B) Sample loading. (C) Shear test in progress.
- (1)
- The mass of slip soil required for the test was calculated based on the volume of soil required for the test (volume of the upper shear box plus the volume of the grooves on the surface of the concrete block) and the slip soil was dried, pulverized, sieved (2 cm), and remolded according to the parameters in Table 1. Deionized water was used throughout the remolding process.
- (2)
- The shear box and its guide rails were cleaned, and a layer of Vaseline jelly was applied to the inside; the securing pins were inserted into the upper and lower shear boxes. Markers were marked on the inside wall of the upper shear box with chalk at 20 mm intervals from the bottom to the top.
- (3)
- The prepared concrete block was placed into the lower shear box, and the grooves on the concrete block were kept perpendicular to the shear direction; we ensured that the concrete block was in tight contact with all four walls of the shear box and that the upper surface was flush with the upper edge of the shear box.
- (4)
- The mass of soil required to fill the grooves by the volume of the grooves on the concrete block’s surface was calculated. This portion of the soil sample from the remolded slip soil sample using a weighing scale was removed, and the remaining soil sample was divided into five equal parts by mass.
- (5)
- One of the five equal parts of the soil sample from Step 4 was taken and mixed with the soil sample that filled the grooves. One more soil sample and four soil samples of uniformly less weight were obtained.
- (6)
- The larger mass of the soil sample was filled in the shear box first; its surface was gently swept and compacted evenly with a lightweight rubber mallet. We ensured that it was 20 mm thick according to the markers marked in Step 1.
- (7)
- The remaining four soil samples were sequentially loaded into the shear box; we swept their surfaces each time and compacted them evenly with a lightweight rubber mallet, thus ensuring that the thickness of each layer was 20 mm.
- (8)
- After all soil samples were loaded, the surface of the soil samples was planned to ensure uniformity. Finally, the pins were removed, the soil surface was covered with a rigid cover plate, the box was pushed into the test system, and a vertical load of 50 kPa was applied for 5 min.
- (9)
- We applied vertical stress and horizontal force to the shear test and collected the data using sensors and computers in real time.
3. Analysis of Shear Test Results
It should provide a concise and precise description of the experimental results, their interpretation, and the experimental conclusions that can be drawn.
3.1. Calculation of Contact Interface Friction (R)
Several methods are used to evaluate the roughness of structural surfaces [20,21,22]. These include the sand filling method, the fractional dimension method based on the geometric profile curve of the structural surface, and the maximum peak-to-valley distance method. The sand filling method is widely used in engineering applications due to its simplicity. It involves determining the average sand filling depth to evaluate the roughness of the structural surface. For the concrete blocks with regular grooves on the surface in this test, the contact surface roughness R was applied using the sand filling method. When performing a quantitative evaluation of roughness, the formula can be expressed as follows:
where n refers to the number of grooves on the surface of the concrete block, S refers to the surface area of the concrete block, V refers to the volume of standard sand filled into a single groove, d = 12 mm and refers to the diameter of the semicircular groove, and l = 200 mm and refers to the length of the concrete block perpendicular to the shear direction. The contact surface roughness involved in this paper is shown in Table 2.
Table 2.
Roughness of contact surface of different concrete blocks.
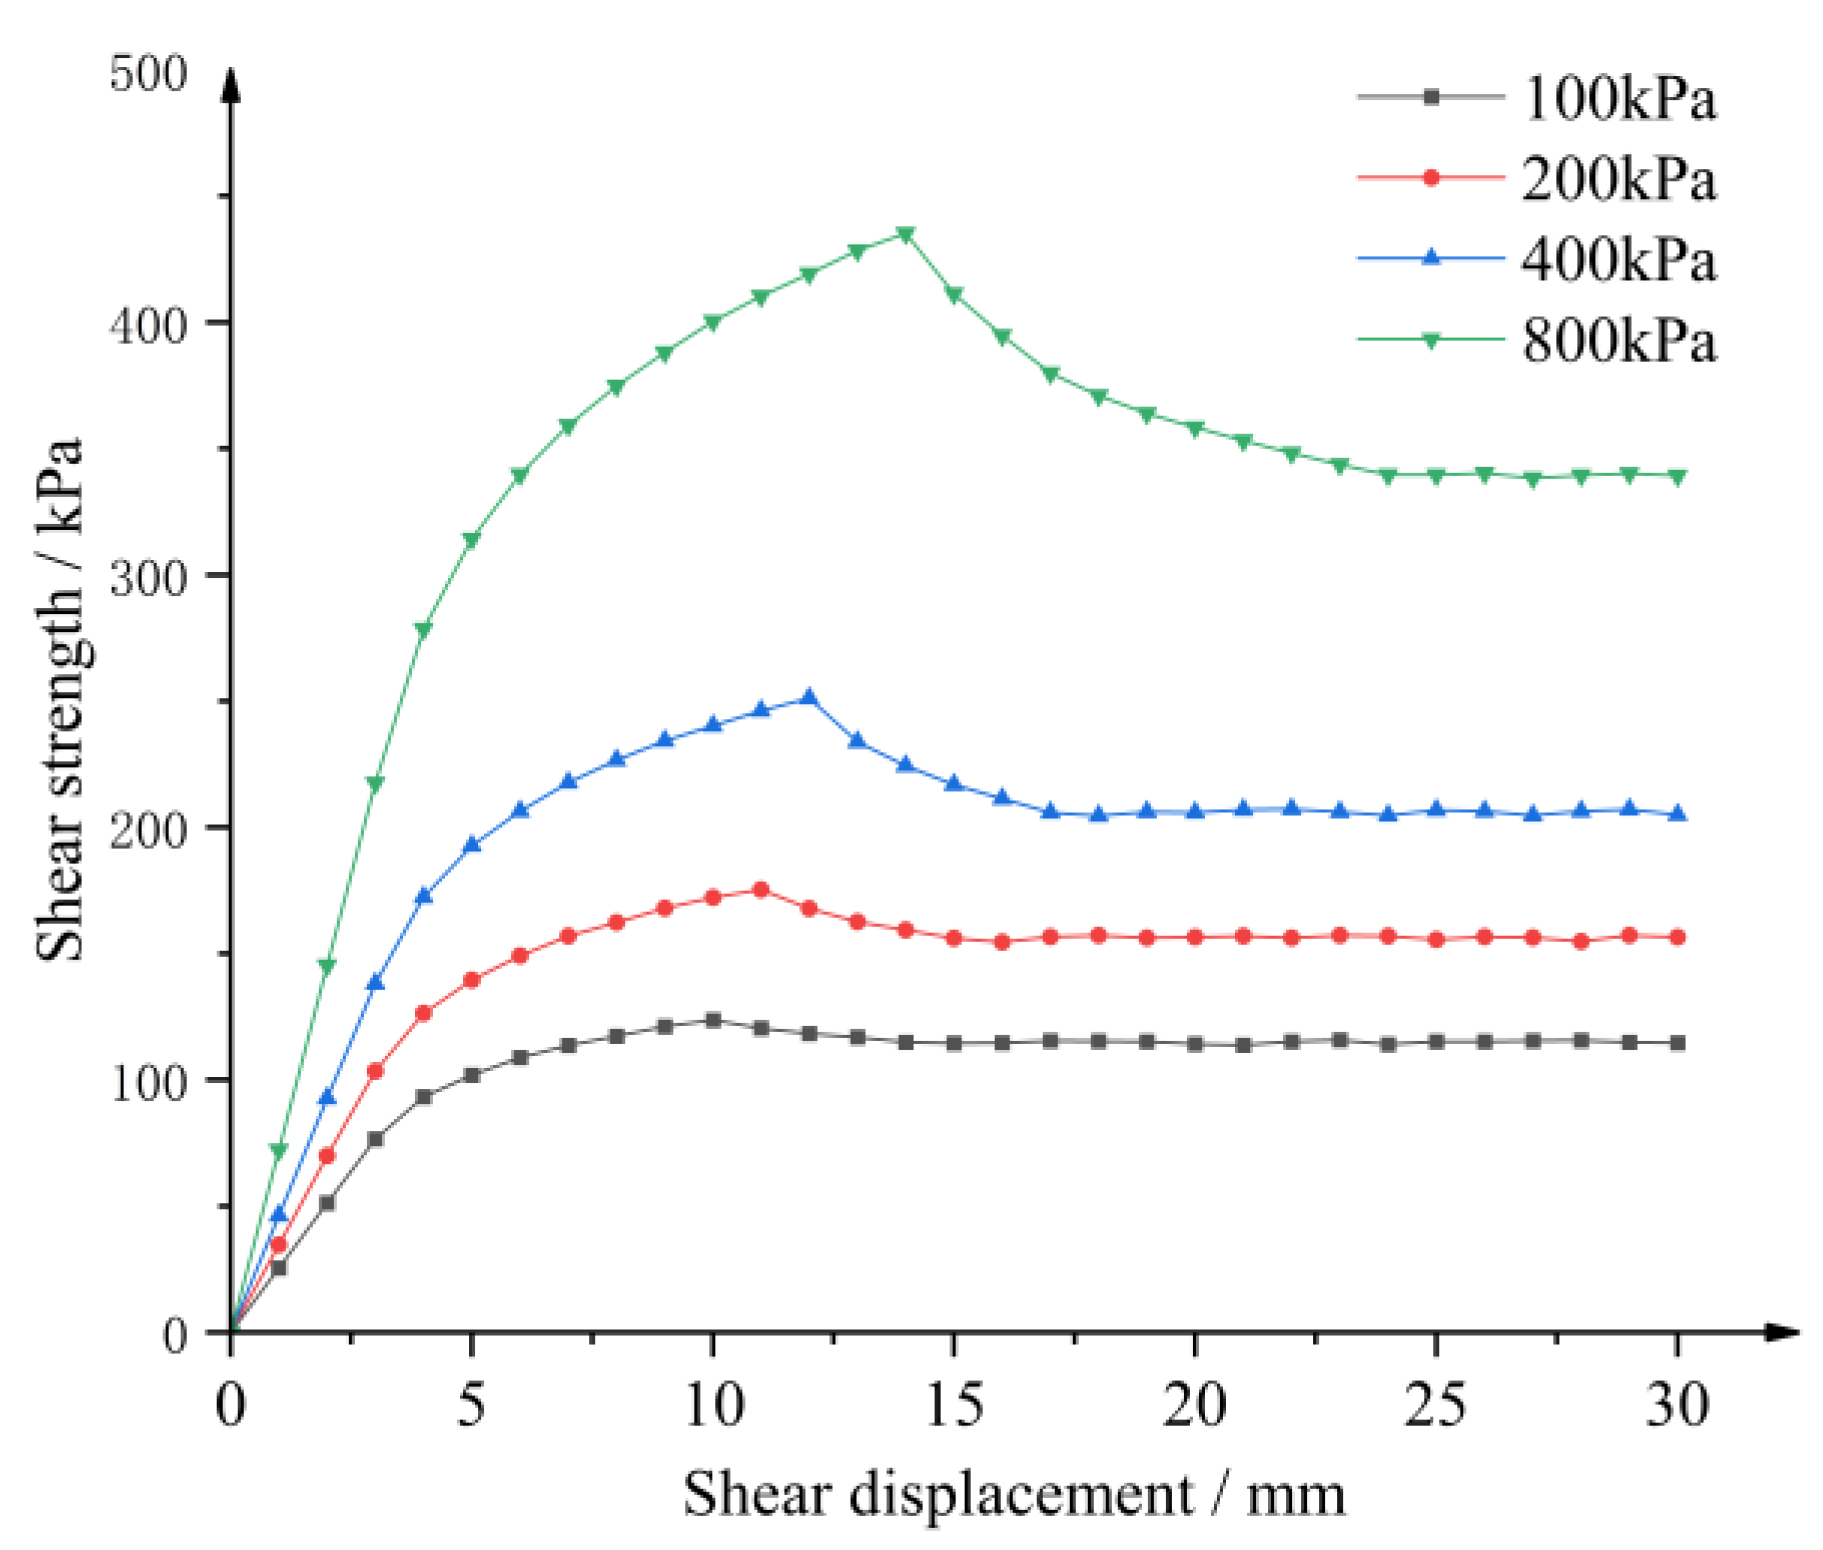
3.2. Results of Slip Soils
Figure 5 displays the shear stress–shear displacement curves for vertical pressures of 100 kPa, 200 kPa, 400 kPa, and 800 kPa. These curves show that the slip soil had a notable peak of shear strength. The stress–displacement curve of the slip soil under low vertical stress (100–200 kPa) did not have a more pronounced peak, and when the stress reached a certain level, the shear deformation increased, and the stress reached a steady state. Such a curve reflects the typical elastic–plastic deformation of the slip soil as it expands and softens during shear due to the failure of the structure. The stress–displacement curve of the slip soil under high vertical stress (400–800 kPa) appears to have a more pronounced peak. When the stress reached a certain level, the shear displacement increased, and the shear stress seemed to decrease and eventually reach a steady state. The slip soil showed strain softening; it had significant peak and residual strengths.

Figure 5.
The stress–displacement curves for slip soil.
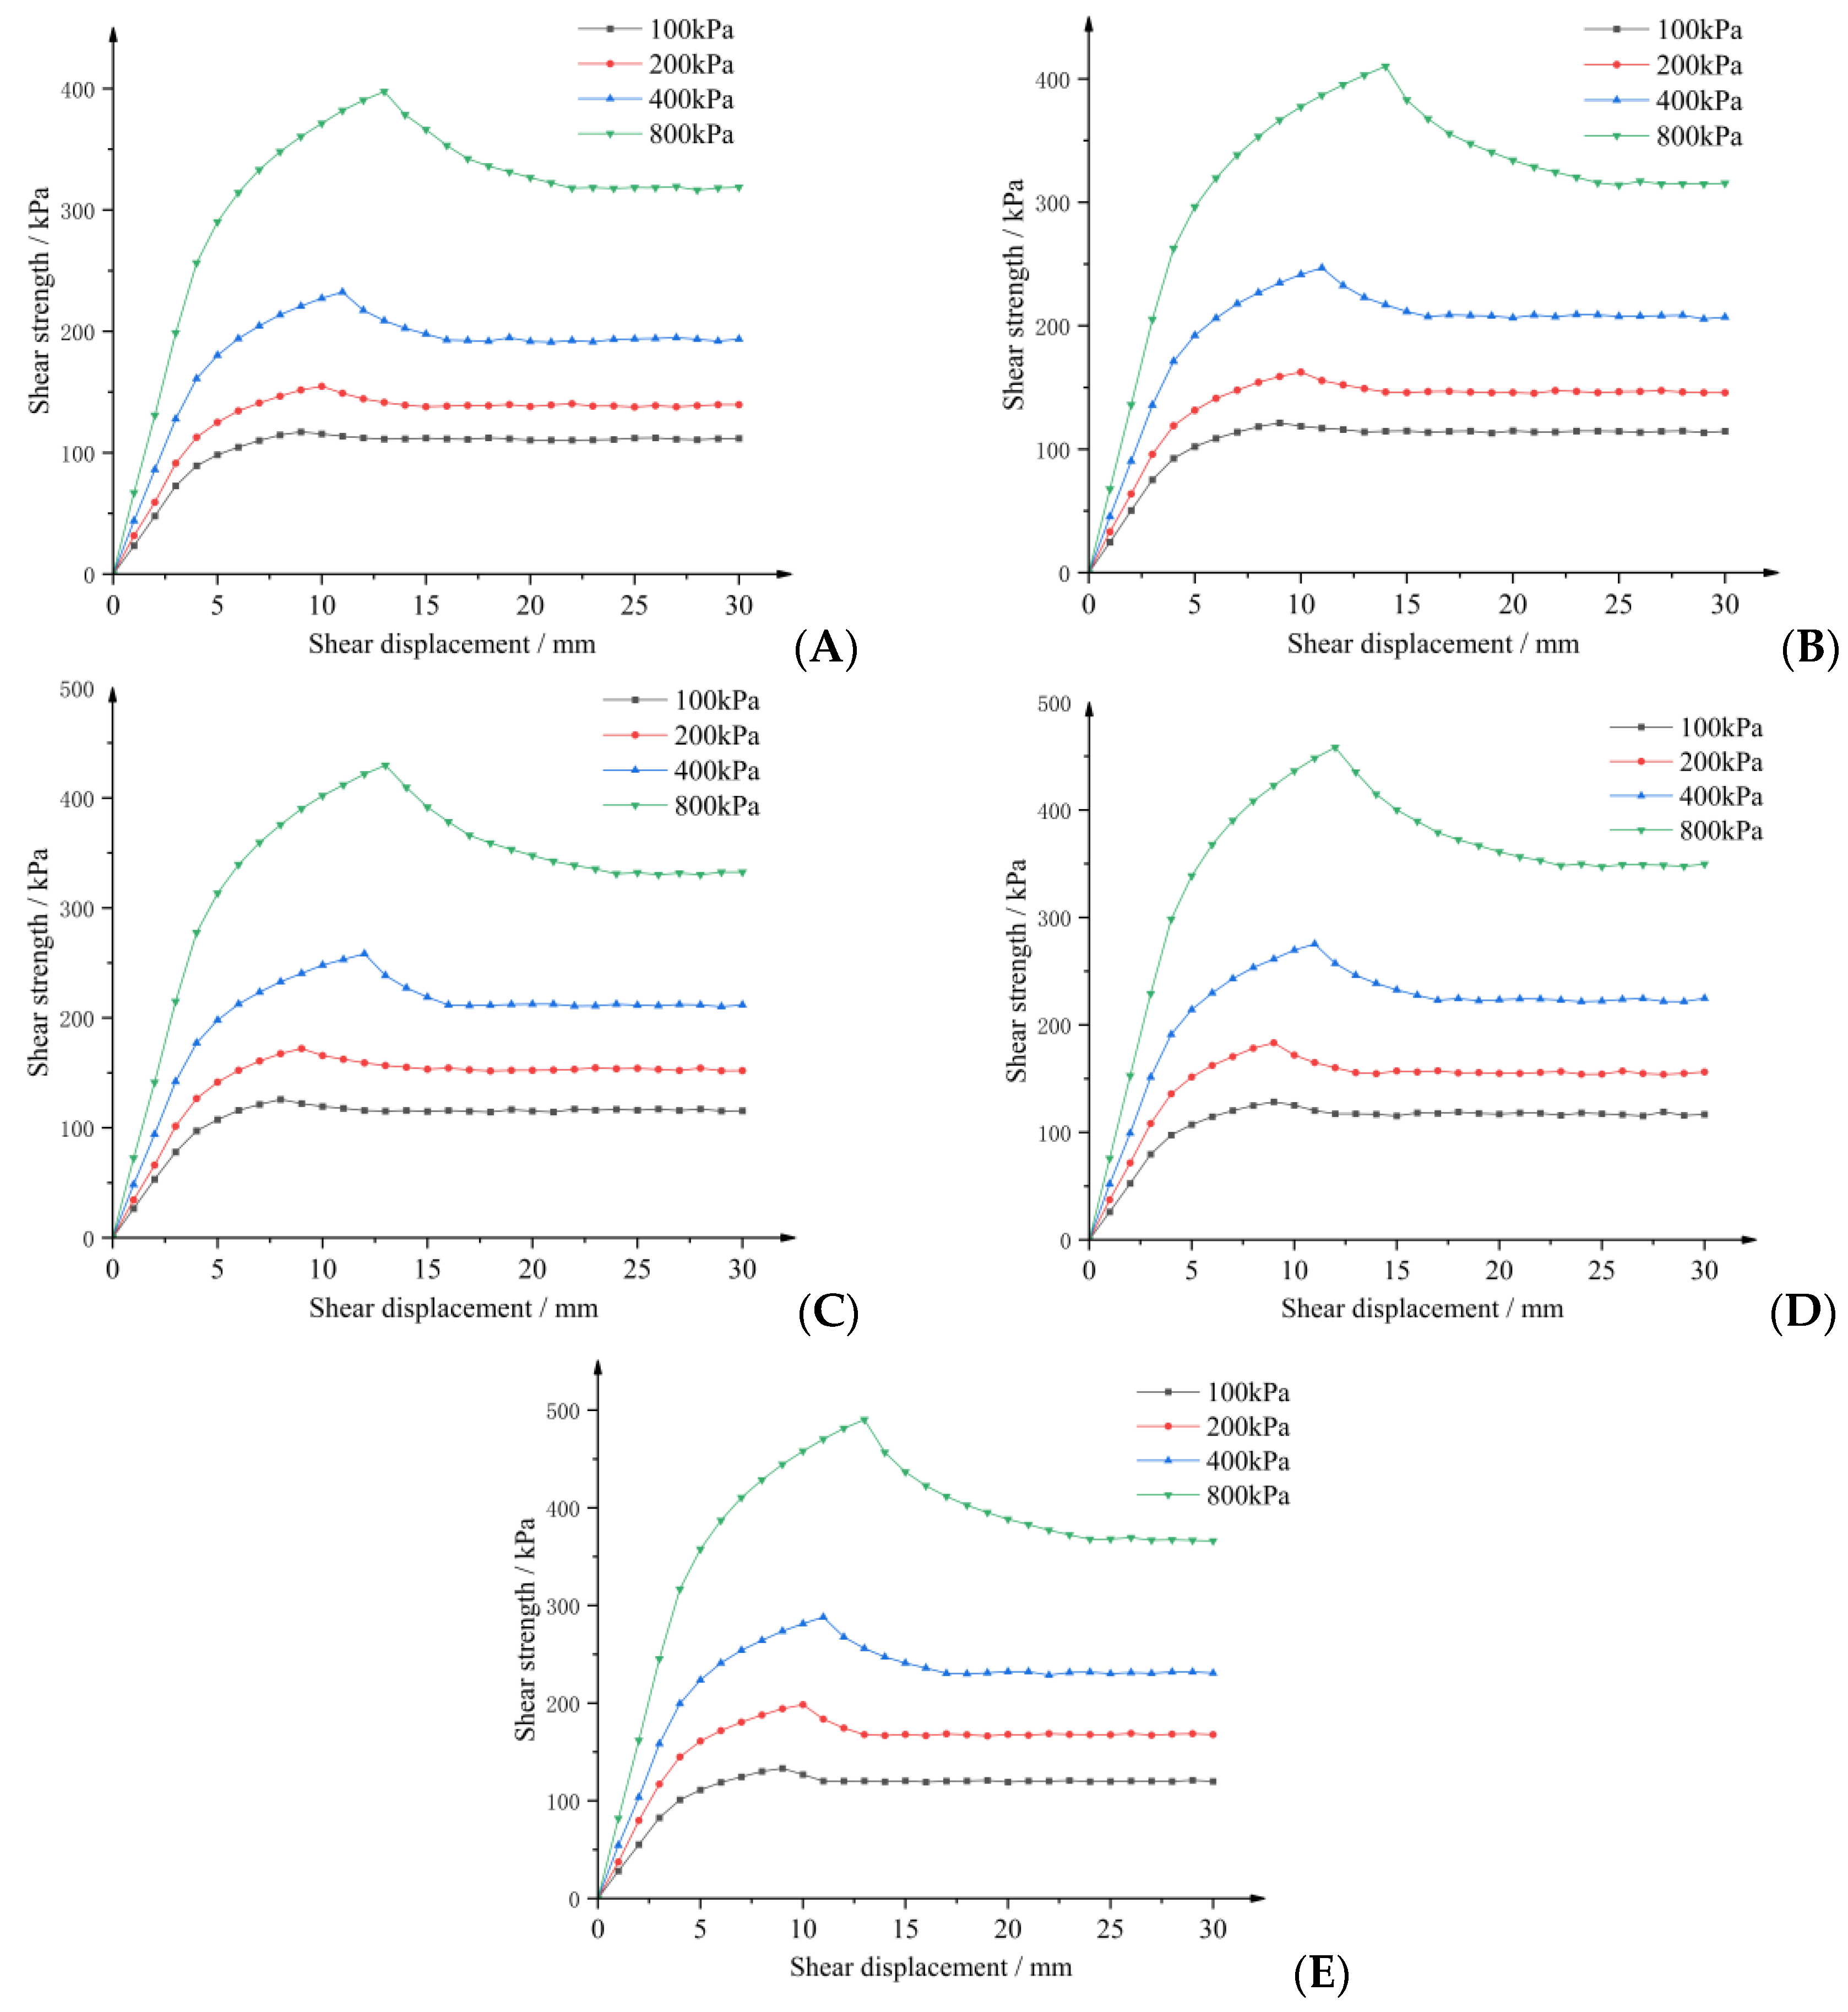
3.3. Effect of Vertical Stress on Different Roughness
The test results show that, regardless of the level of roughness of the contact surface, the strain softening property of the contact surface gradually increased with the increase in the vertical stress (Figure 6). Since it was still a shear failure of the slip soil, the morphology of the curves remained generally similar but still differed at different roughness levels. At the same surface roughness, higher vertical stress resulted in a higher initial shear modulus and peak shear strength. By comparing the changes in curve morphology from Figure 6A–E, it can be seen that at low roughness, the curves had an obvious turning point at lower horizontal displacement, and the curves tended to be horizontally straight and falling after the turning point. When the vertical stress increased, the curve showed a hyperbolic type. After the shear stress reached the peak value, there was a prominent decreasing section, and finally, it tended to be horizontal. As the roughness of the contact surface increased, even under low vertical stress, the curve did not tend to be horizontal directly but still had a specific strain softening and finally tended to be horizontal. When the contact surface roughness was the largest, as shown in Figure 6E, the curves showed a more apparent hyperbolic type at all levels of vertical stress, and there was a prominent decreasing section after the shear stress reached the peak. Finally, the shear stress stabilized, and the curves tended to be horizontal. The two forms of shear stress–shear displacement, fold linear and hyperbolic, characterize two different failure forms of the contact surface in the shear process: shear slide failure concentrated on the surface of the slip soil and shear elastic–plastic failure within the slip soil near the contact surface.

Figure 6.
The stress–displacement curves for different roughness of soil–concrete surface. (A) For R1. (B) For R2. (C) For R3. (D) For R4. (E) For R5.
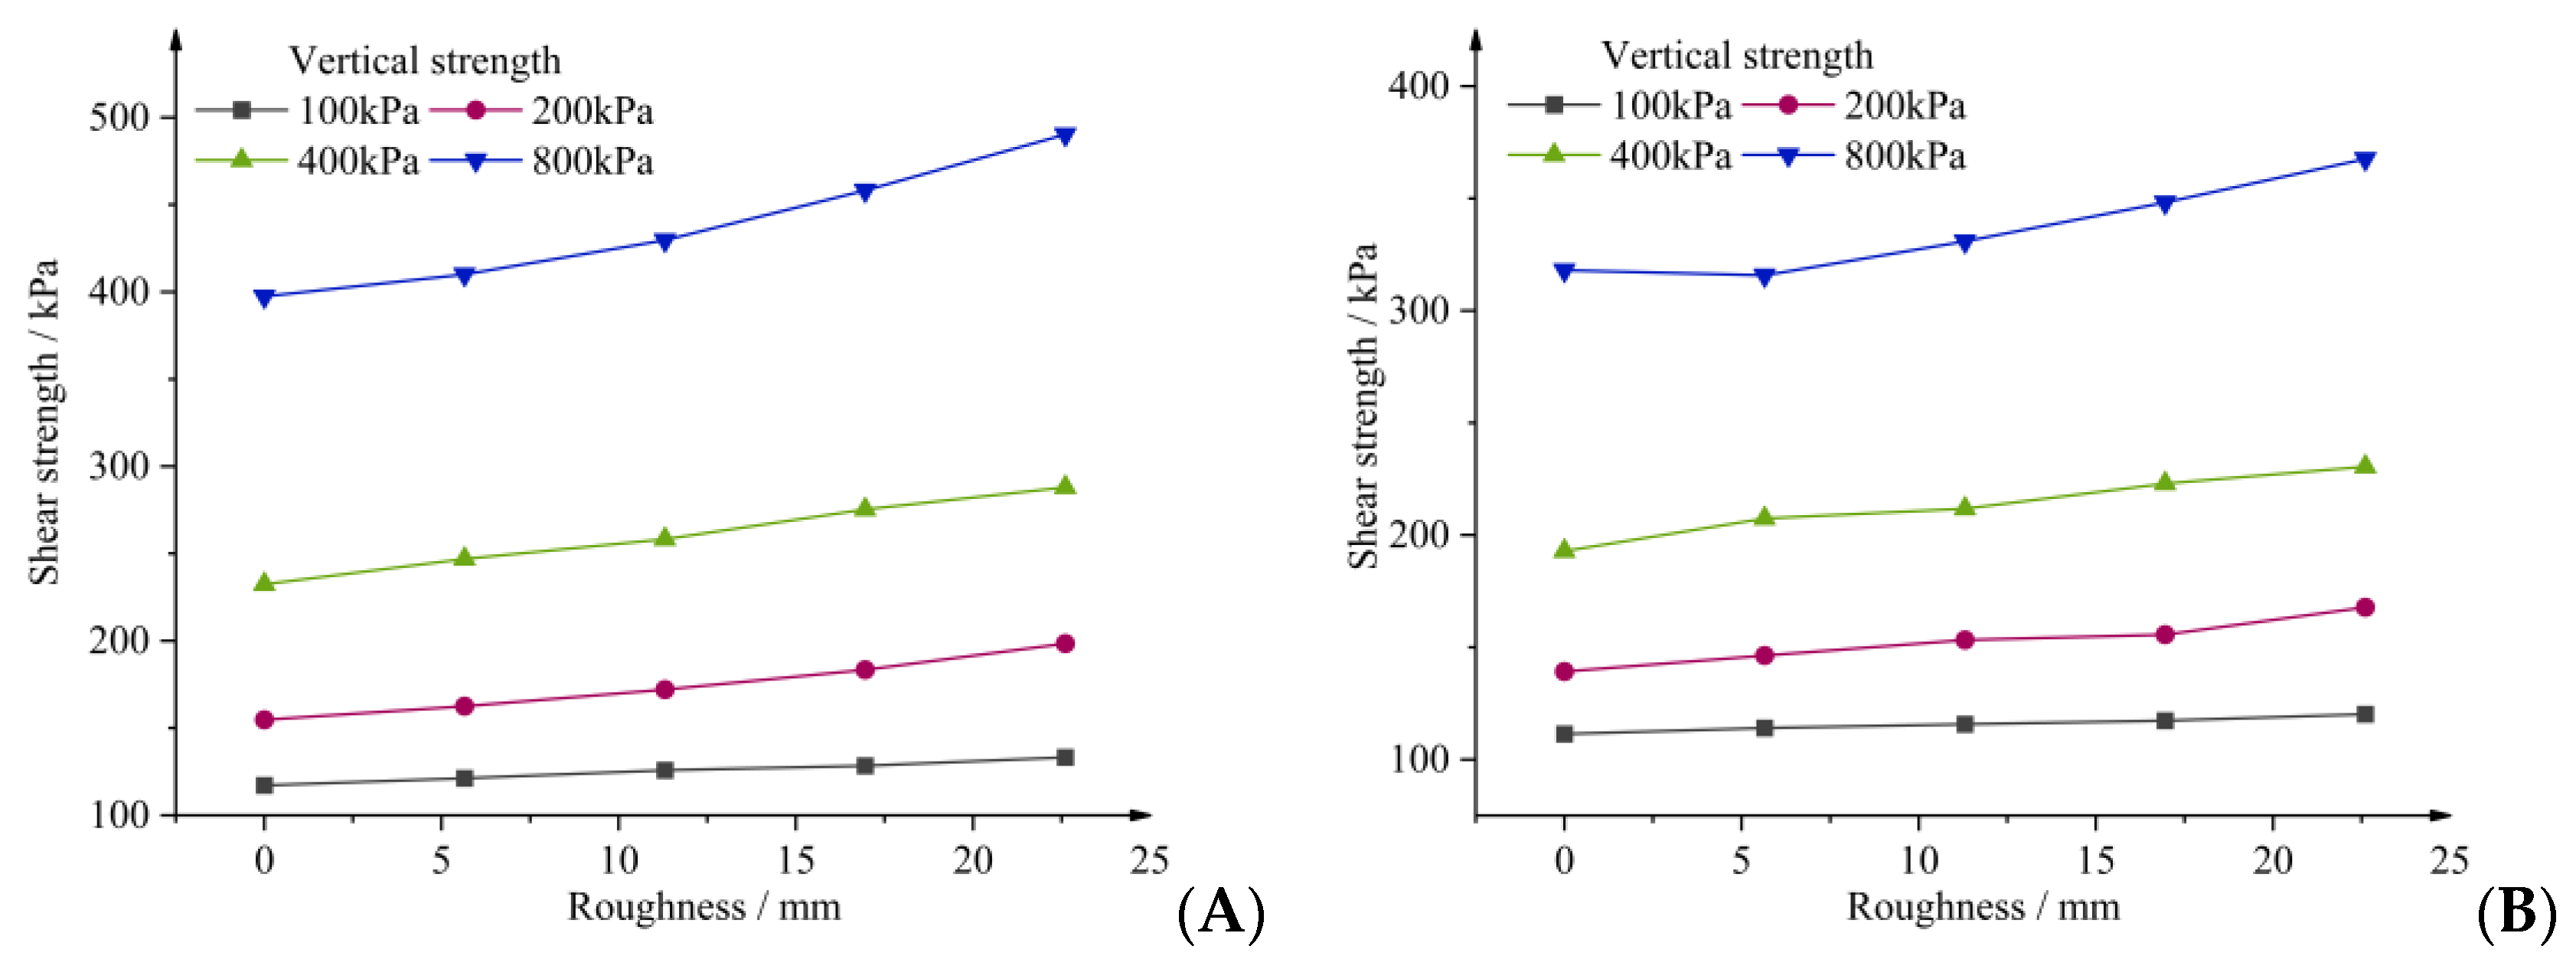
3.4. Effect of Roughness on Shear Strength
The shear strength of the contact surface of slip soil and concrete under different vertical stresses with different roughness was compared, as shown in Figure 7. Overall, increased roughness of contact surface and vertical stresses resulted in more significant peak and residual strengths. As the vertical stress increased, the contact surface shear strength variation curves for each roughness followed a transition from fold linear to hyperbolic. This means that the higher the roughness, the more the failure of the contact surface is biased from a surface slide failure to a failure within the slip soil.

Figure 7.
The stress curves for different roughness and vertical strength of the soil–concrete surface. (A) For peak intensity. (B) For residual intensity.
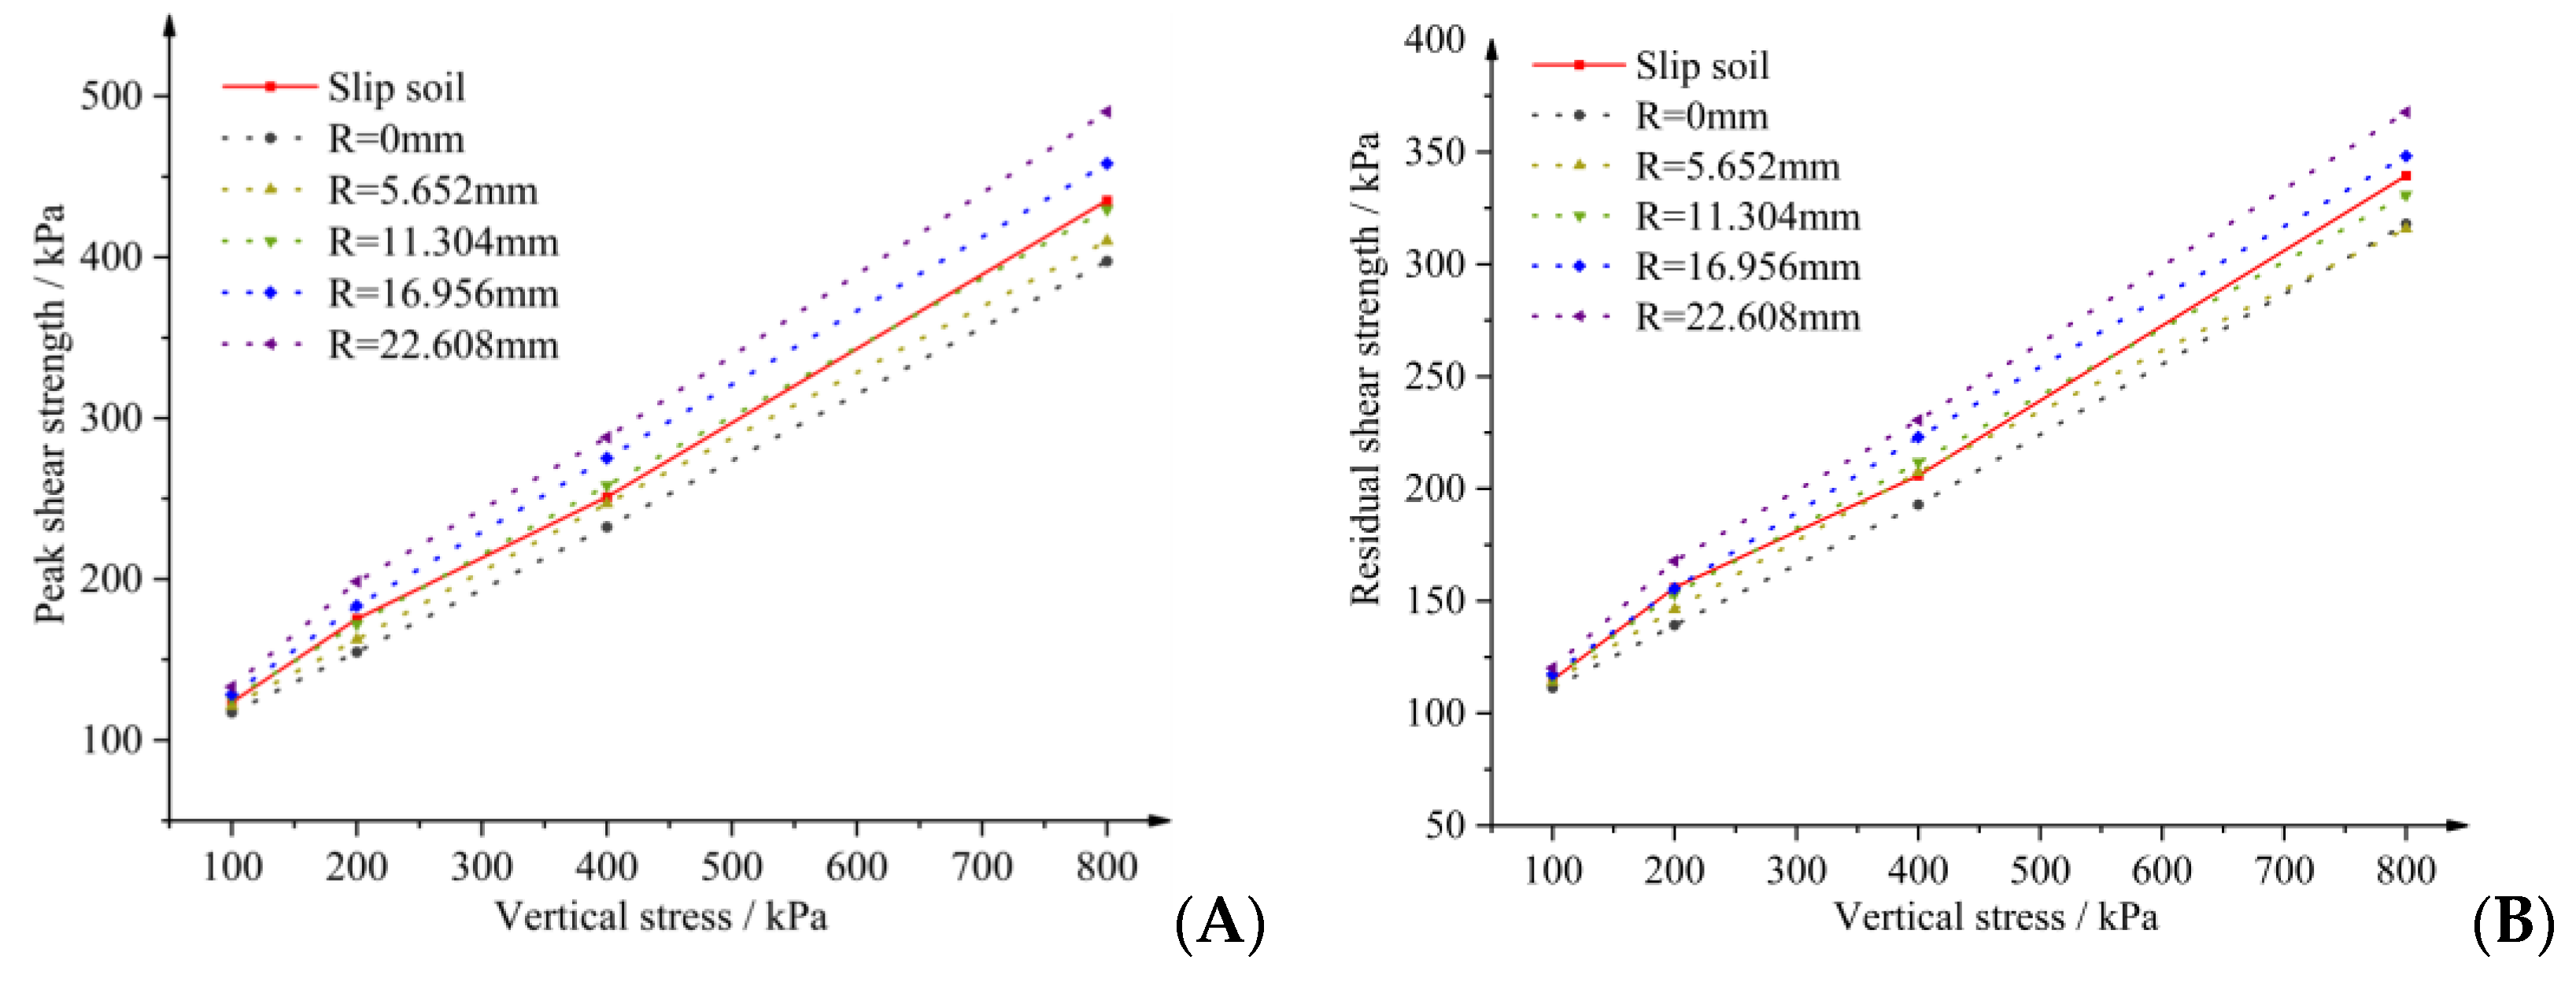
After comparing the shear strengths of the slip soil and contact surfaces with different roughness levels (Figure 8), the following conclusions can be drawn:

Figure 8.
Shear strength of slip soil and contact surfaces with different roughness. (A) For peak intensity. (B) For residual intensity.
- (1)
- When the roughness of the contact surface was low, the contact surface’s peak shear strength and residual shear strength were lower than that of the slip soil itself.
- (2)
- When the roughness of the contact surface reached R3 (11.304 mm), the shear strengths of the contact surface fell near the strength of the soil itself at different vertical stresses, which can be regarded as basically equal to the strength of the slip soil.
- (3)
- When the roughness of the contact surface was more significant than 11.304 mm, the shear strength of the contact surface was higher than the strength of the soil itself.
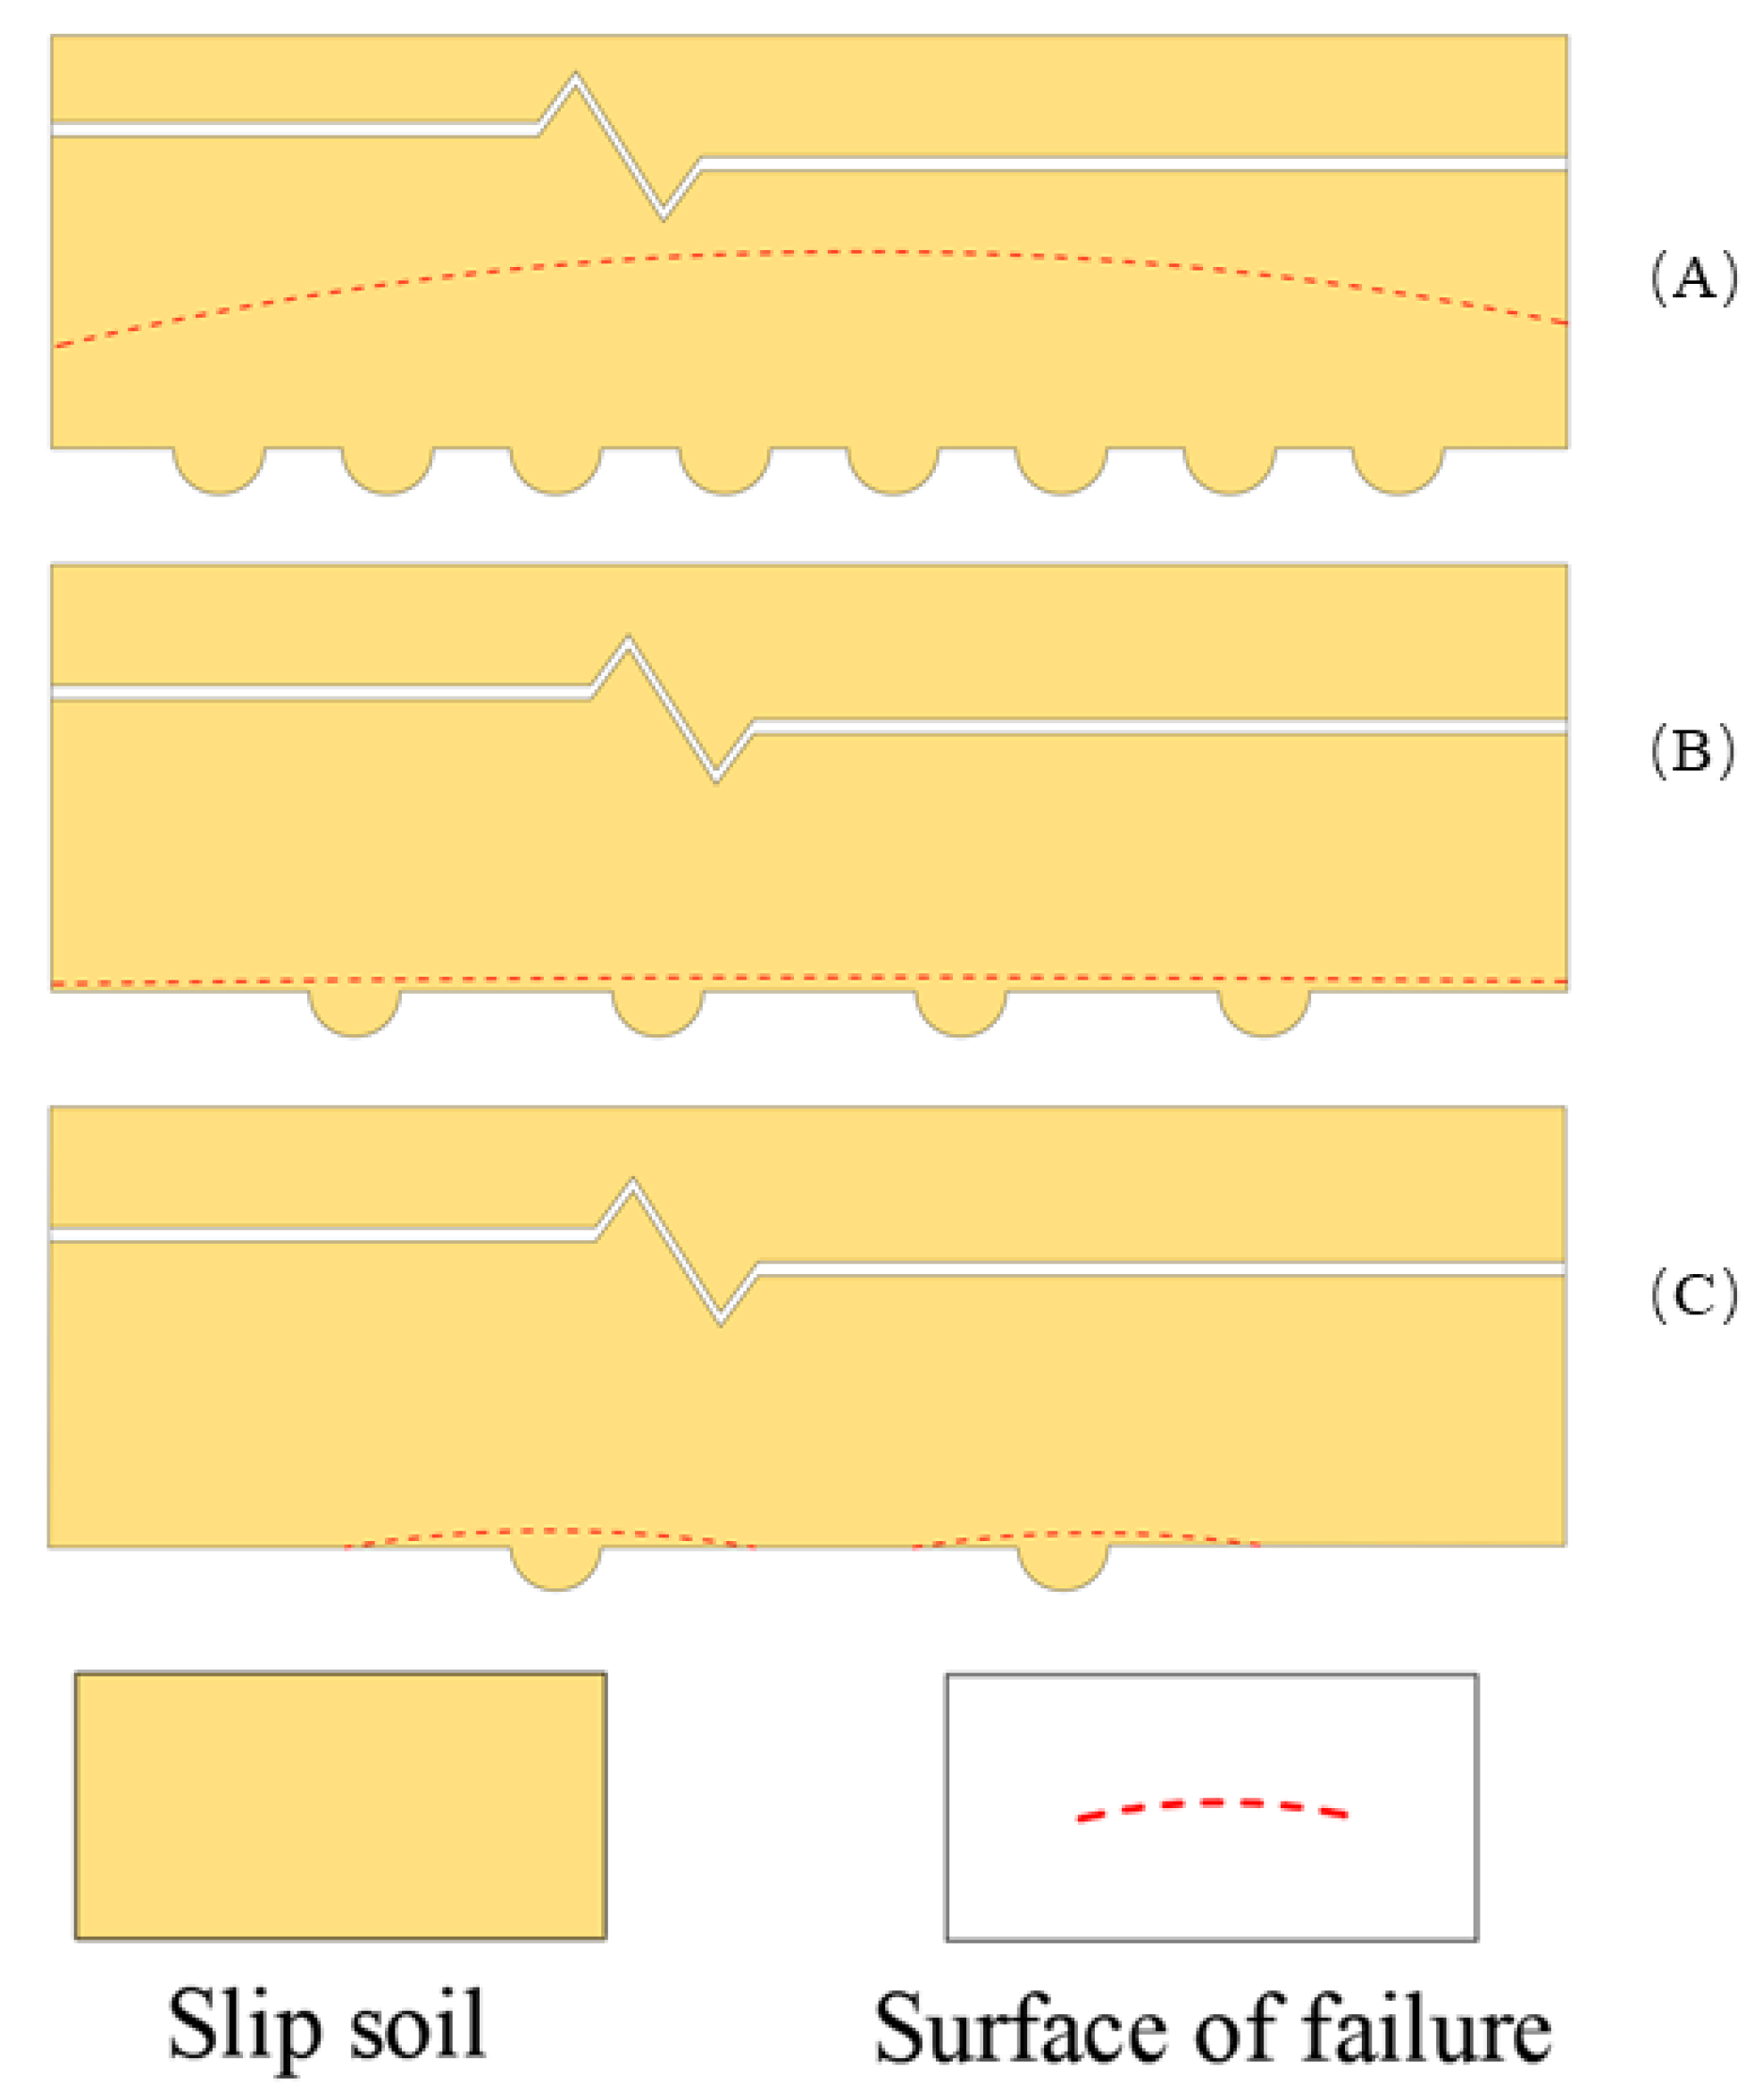
Such a result implies that within the test regime designed in this paper, a critical roughness R0 of the contact surface exists, which determines the shear failure mode of the contact surface, as shown in Figure 9. Figure 9 shows failure pattern diagrams for contact surfaces with different roughness levels; the figure shows a side view perpendicular to the direction of shear. When the roughness of the contact surface was higher than R0, the shear failure penetrated deep into the interior of the soil, thus forming a shear failure region, which is shown in Figure 9A. The softening of the slip soil strain was concentrated in this region. At the same time, the shear strain and normal deformation of the contact surface were also concentrated in this region, and the final shear strength was greater than the strength of the soil itself. When the roughness was equal to R0, the shear process proceeded roughly along a curved surface with a slight curvature at a very shallow surface in the slip soil, and the final strength result was close to the strength of the soil itself. When the roughness was less than R0, the shear failure was mainly concentrated at the roots of the soil columns filling the grooves of the concrete block, which is essentially the shearing of the protruding parts of these soils and the sliding between the two materials, as shown in Figure 9C. The shear strength of the contact surface was then less than the shear strength of the soil itself.

Figure 9.
Failure pattern diagrams for contact surfaces with different roughness levels. (A) For R > R0. (B) For R = R0. (C) For R < R0.
3.5. Shear Strength of Slip Soil-Rigid Contact Surfaces Considering Roughness
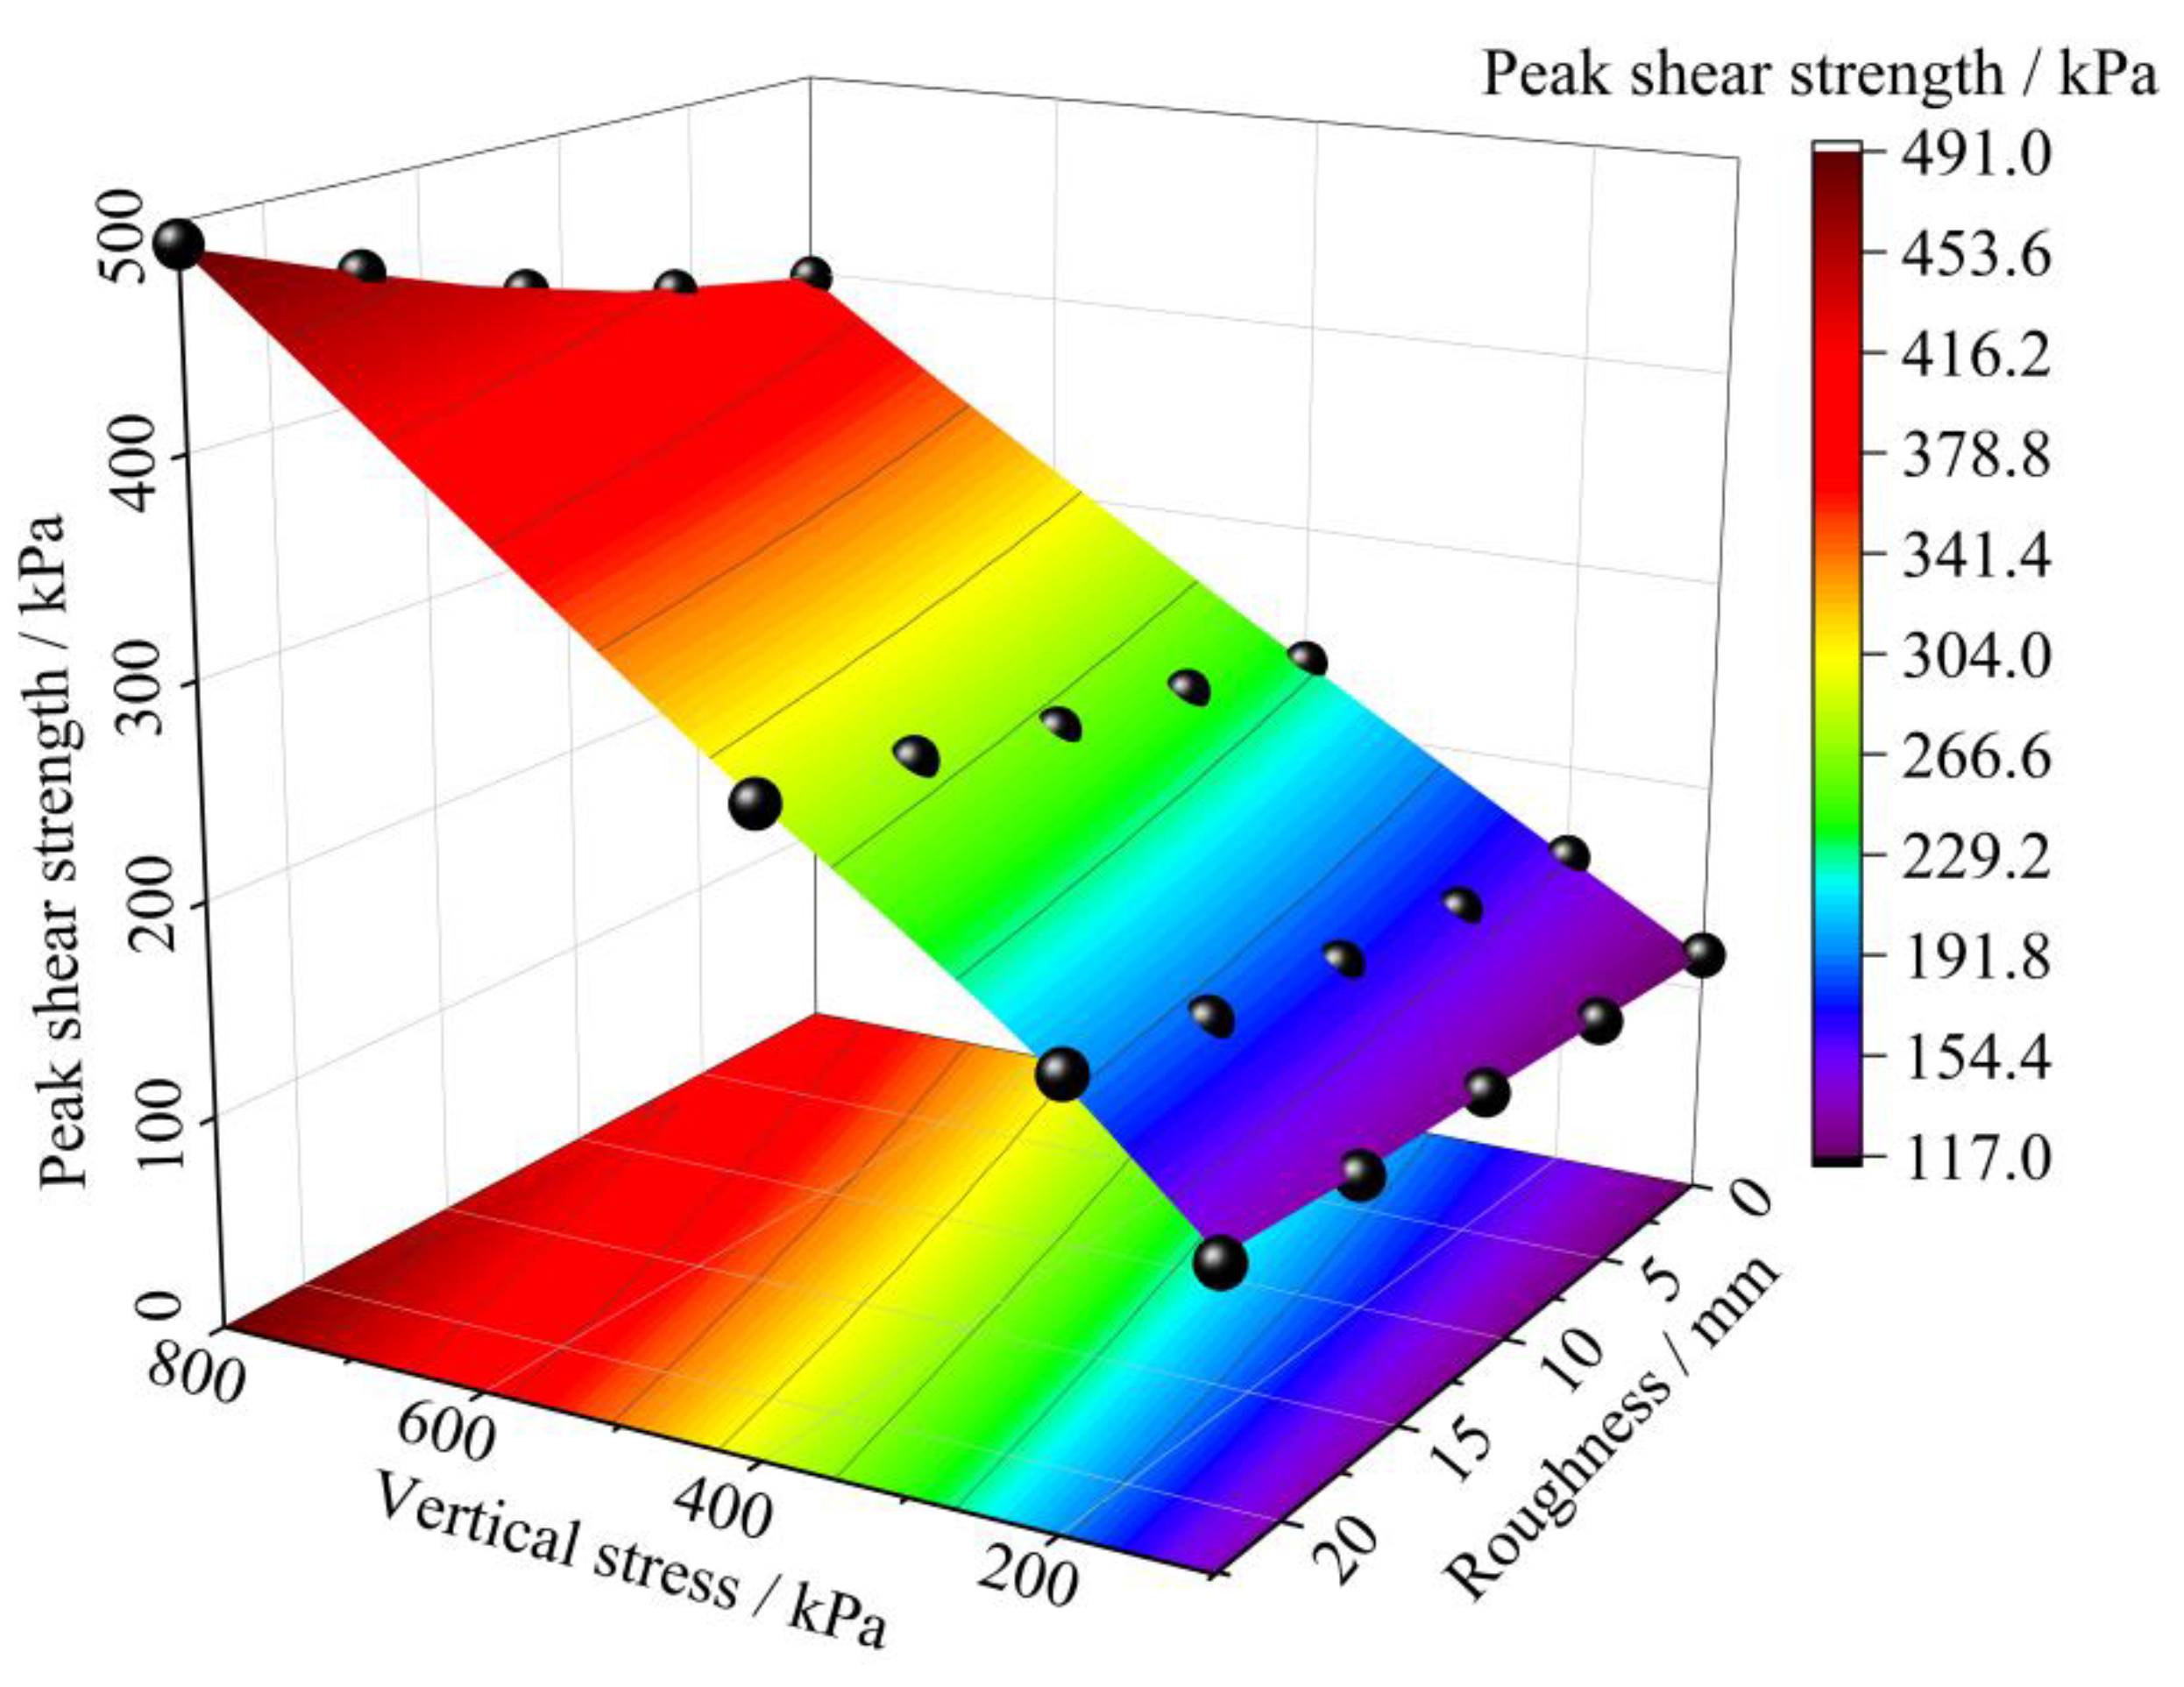
The test data of the peak shear strength of the slip soil–concrete contact surface, the contact surface roughness, and the vertical stress were fitted in a spatial coordinate system. These points form a surface, which is the spatial surface where the peak strength of the contact surface varies with roughness and vertical stress, as shown in Figure 10. It can be seen that the peak shear strength of the slip soil–concrete contact surface increased with the increase in vertical stress and contact surface roughness. The peak shear strength reached the maximum state when the roughness and vertical stress reached the maximum value. In addition, in the direction of change in the vertical stress, the magnitude of change in the peak shear strength was more significant than that along the contact surface roughness. This suggests that vertical stresses have a more significant effect on the peak shear strength of the contact surface.

Figure 10.
Spatial envelope of shear strength, roughness, and vertical stress on the contact surface.
To further explore the extent to which vertical stress and contact surface roughness affect the peak strength of the contact surface, a mathematical analysis of the surface enveloped by the spatial points of peak strength was fitted.
According to previous studies [23,24,25,26], the failure of the contact surface of the soil with a rigid object obeys the Moore–Cullen law. The steps involved in the method are as follows:
In the formula, τ is the contact surface shear strength, σ is the contact surface vertical stress, φ is the contact surface internal friction angle, and c is the contact surface cohesion. Considering the number of grooves on the surface of the test piece to take the limit, the contact surface roughness reaches the maximum roughness state: a calculated Rmax = 45.216 mm. The definition of the roughness influence coefficient for the contact surface roughness and the maximum roughness state of the contact surface of the ratio is as follows:
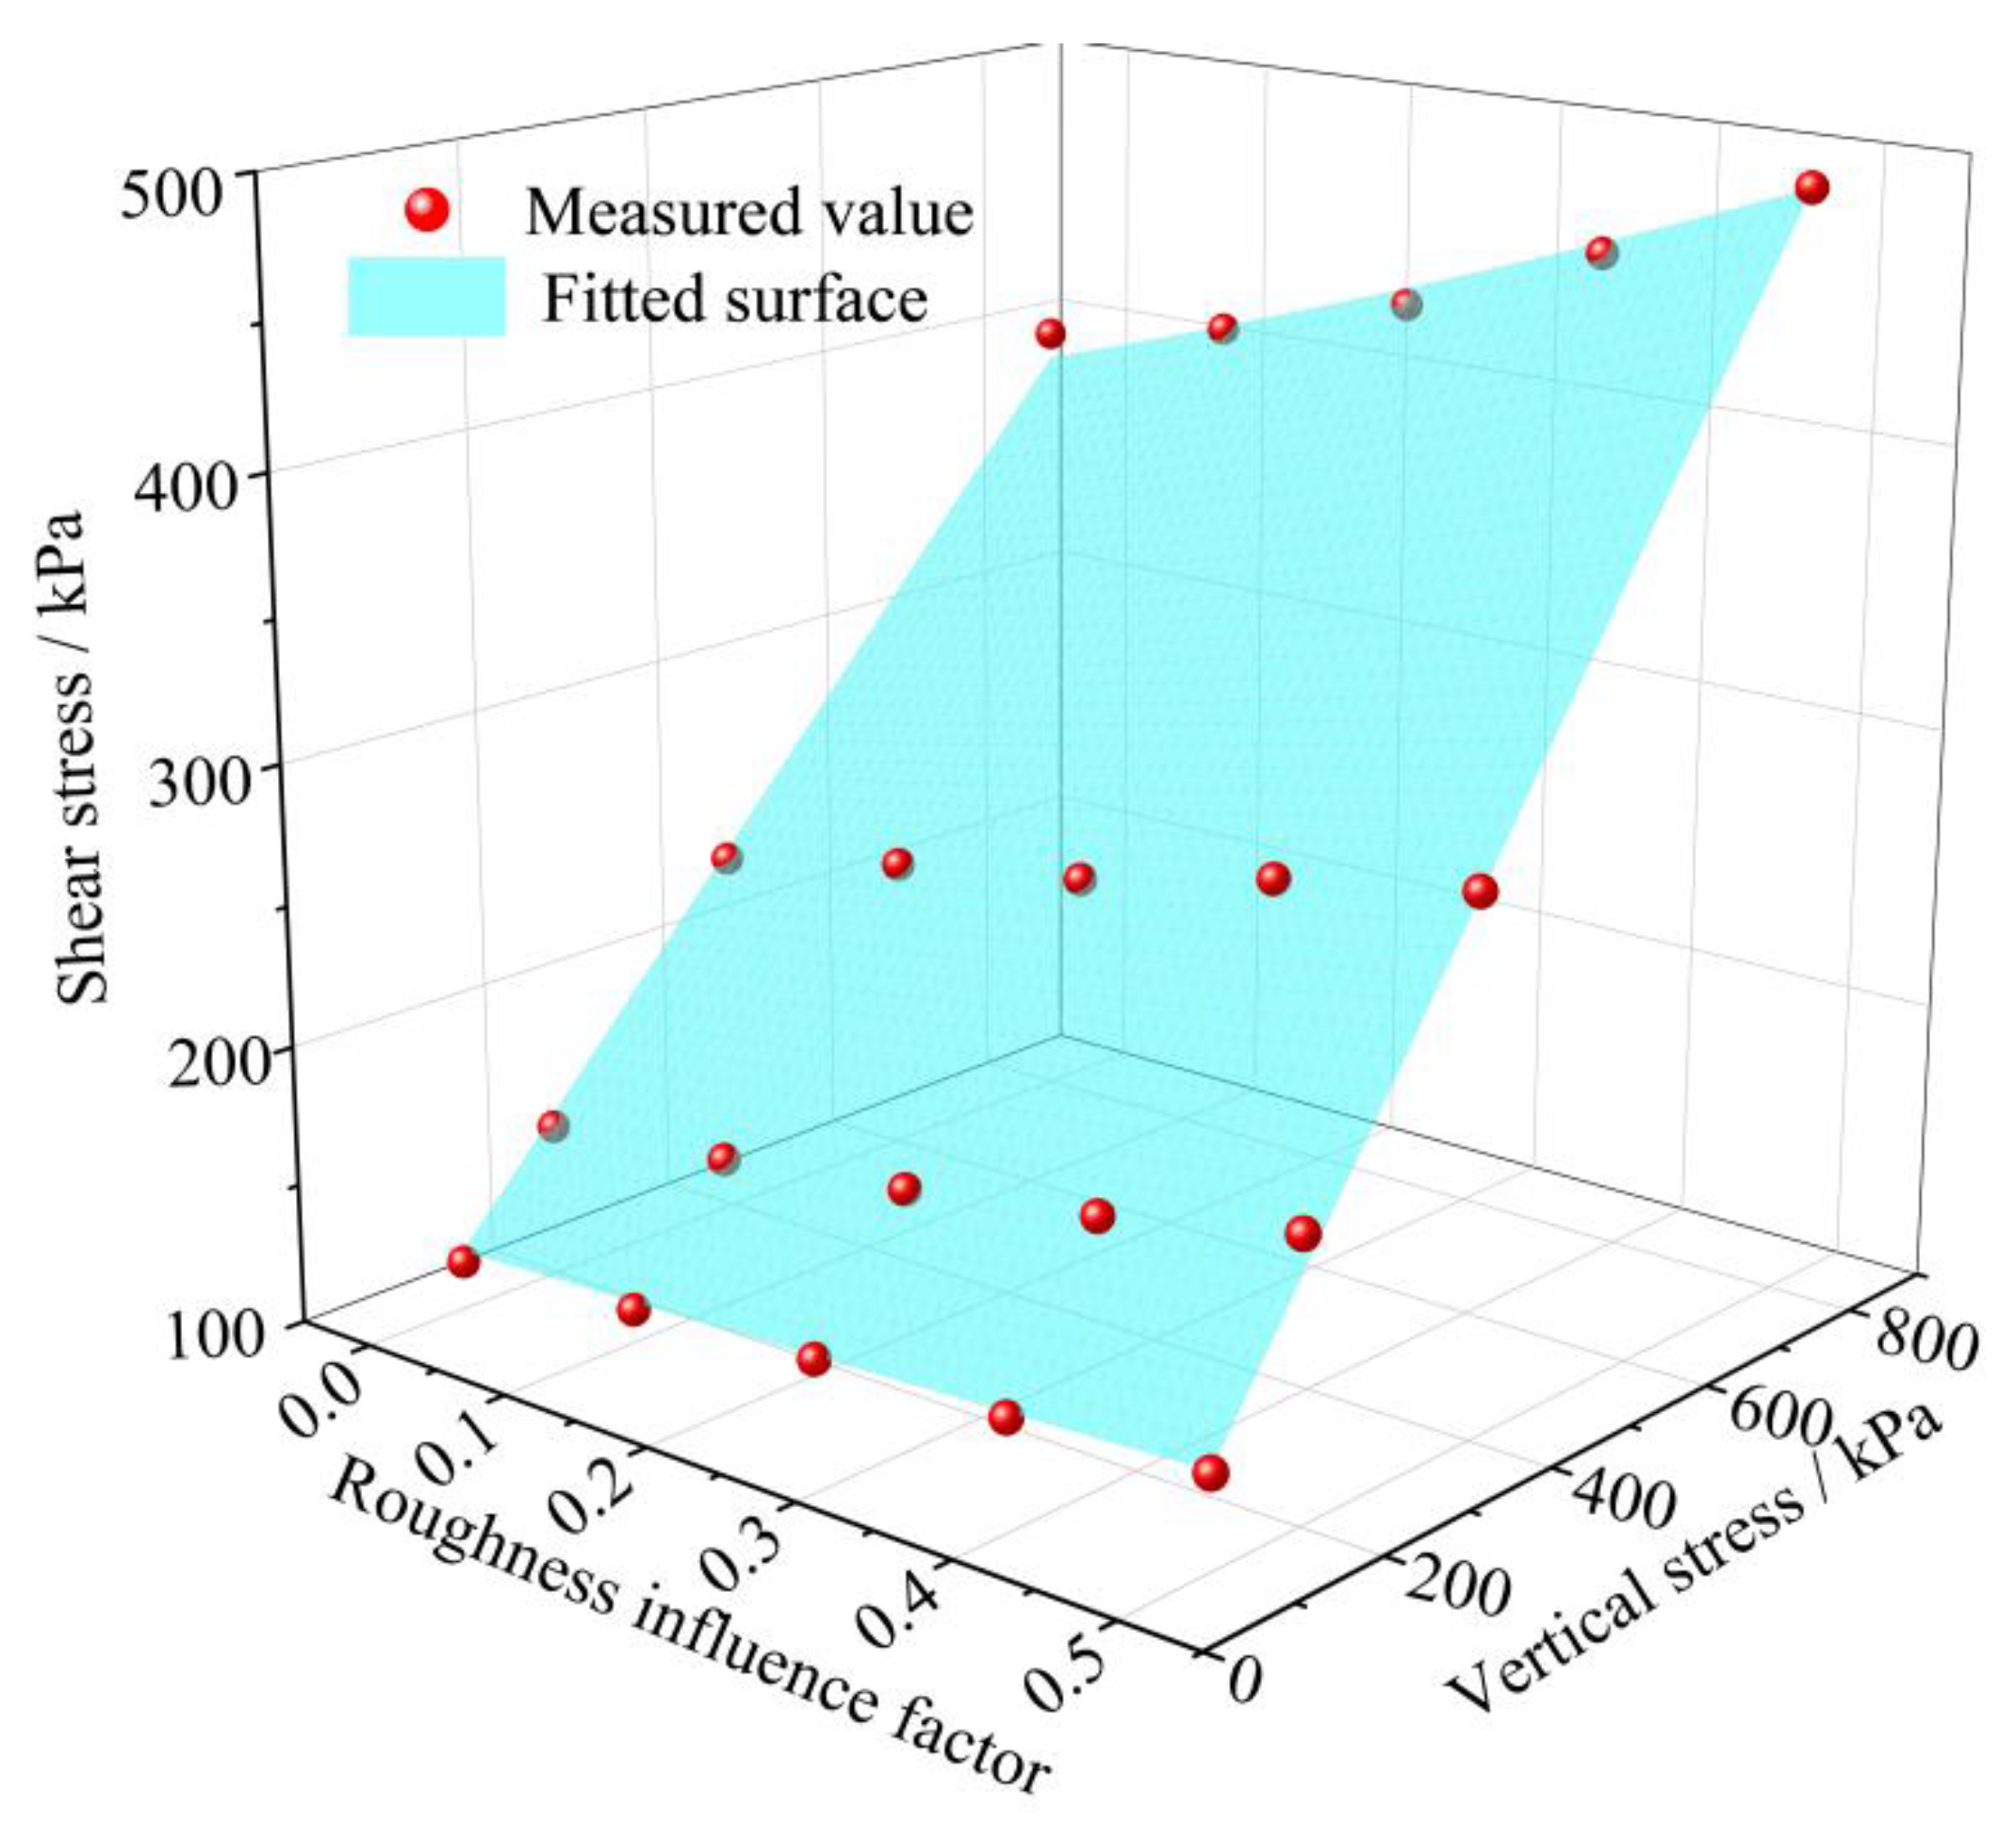
According to (4), the corresponding roughness influence coefficients are 0, 0.125, 0.25, 0.375, and 0.5 at contact surface roughness levels of 0 mm, 5.652 mm, 11.304 mm, 16.956 mm, and 22.608 mm, respectively. The experimental results of Xu et al. [26] show that the cohesion of a clay–hydraulic soil contact surface can be approximately taken as the clay’s cohesion. Therefore, in this study, it is assumed that the contact surface cohesion is not affected by the contact surface roughness and is only controlled by the nature of the soil. The contact surface roughness has a significant effect on the contact surface internal friction angle, i.e.,:
F(λ) is the tangent of the roughness influence coefficient as a function of the contact surface roughness. Based on the test results, nonlinear curve fitting was performed, and the fitting function results yielded the following equations:
Thus, the formula for calculating the shear strength between the slip soil and the rigid interface considering roughness was finally obtained, as shown in Equation (8).
The data obtained from the test were substituted for correlation coefficient analysis. The correlation coefficient R2 of the fitted Equation (8) was 0.982, which indicates a better fitting result; the fitted surface is shown in Figure 11.

Figure 11.
Measured values and fitted curves.
4. Conclusions
In the exploration tunnels for the Xiageliao landslide, scratches caused by sliding were found both within the slip soil and on its contact with bedrock. This means that landslide failure is not always along a single surface nor present in a single geotechnical layer. Tests were performed on undisturbed slip soil samples collected from the exploration tunnel. The following conclusions have been drawn regarding the shear strength and mode of failure of the contact surfaces of slip soil and tuff:
- (1)
- At low vertical stress, the stress–displacement curves show a folded line shape at all roughness levels. With the increase in vertical stress, the stress–displacement curves of all roughness levels are gradually transformed into a hyperbolic shape.
- (2)
- The roughness of the contact surface of the slip soil and tuff determines the slip soil’s failure mode and shear strength. In nature, shear failure of low roughness contact surfaces is a sliding failure in the partial contact region. Shear failure of a contact surface with high roughness is an elastic–plastic failure within the slip soil. When the roughness is low, the shear strength of the contact surface is less than the shear strength of the slip soil itself; when the roughness is high, the shear strength of the contact surface is higher than the shear strength of the slip soil itself.
- (3)
- Based on Moore–Cullen’s law, a formula for calculating the shear strength of the contact surface of the slip soil as a function of roughness was found. The formula has a correlation coefficient of R2 = 0.982, which is compatible with the test data and can be used as a reference for evaluating the shear strength of the interface between slip soil and rigid objects.
These conclusions can provide some references in geotechnical engineering practice. When evaluating the stability of slopes, the mechanical parameters of the contact surfaces of the rock and soil layers can be taken into account, thus making the calculated parameters more realistic. Similarly, these results can better explain the problem of inconsistency in the direction of sliding and the amount of displacement in different parts of large landslides.
Author Contributions
Conceptualization, G.X. and M.X.; writing original draft preparation, M.X. and J.Z.; writing review and editing, G.X. and J.Z.; project administration, J.Z. All authors have read and agreed to the published version of the manuscript.
Funding
This research received no external funding.
Institutional Review Board Statement
Not applicable.
Informed Consent Statement
Not applicable.
Data Availability Statement
The raw data supporting the conclusions of this article will be made available by the authors on request.
Conflicts of Interest
Author Junyu Zhang was employed by the company Zhejiang Zhezhong Geological Engineering Survey Institute Co., Ltd. The remaining authors declare that the re-search was conducted in the absence of any commercial or financial relationships that could be construed as a potential conflict of interest.
References
- Yin, Q.; Wu, J.; Zhu, C.; He, M.; Meng, Q.; Jing, H. Shear mechanical responses of sandstone exposed to high temperature under constant normal stiffness boundary conditions. Geomech. Geophys. Geo-Energy Geo-Resour. 2021, 7, 35. [Google Scholar] [CrossRef]
- Boukpeti, N.; White, D.J. Interface shear box tests for assessing axial pipe–soil resistance. Géotechnique 2016, 67, 18–30. [Google Scholar] [CrossRef]
- Hu, L.; Pu, J. Testing and modeling of soil-structure interface. J. Geotech. Geoenviron. Eng. 2004, 130, 851–860. [Google Scholar] [CrossRef]
- Yazdani, S.; Helwany, S.; Olgun, G. Influence of temperature on soil–pile interface shear strength. Geomech. Energy Environ. 2019, 18, 69–78. [Google Scholar] [CrossRef]
- Fleming, I.R.; Sharma, J.S.; Jogi, M.B. Shear strength of geomembrane–soil interface under unsaturated conditions. Geotext. Geomembr. 2006, 24, 274–284. [Google Scholar] [CrossRef]
- Martinez, A.; Frost, J.D. The influence of surface roughness form on the strength of sand–structure interfaces. Géotechnique Lett. 2017, 7, 104–111. [Google Scholar] [CrossRef]
- Martinez, A.; Stutz, H.H. Rate effects on the interface shear behaviour of normally and overconsolidated clay. Géotechnique 2019, 69, 801–815. [Google Scholar] [CrossRef]
- Xu, Q.; Wang, W.; Li, L. Failure mechanism of gently inclined shallow landslides along the soil-bedrock interface on ring shear tests. Bull. Eng. Geol. Environ. 2021, 80, 3733–3746. [Google Scholar] [CrossRef]
- Senthilkumar, V.; Chandrasekaran, S.S.; Maji, V.B. Rainfall-induced landslides: Case study of the Marappalam landslide, Nilgiris District, Tamil Nadu, India. Int. J. Geomech. 2018, 18, 05018006. [Google Scholar] [CrossRef]
- Wang, L.; Jiang, H.; Yang, Z. Development of discontinuous deformation analysis with displacement-dependent interface shear strength. Comput. Geotech. 2013, 47, 91–101. [Google Scholar] [CrossRef]
- Potyondy, J.G. Skin friction between various soils and construction materials. Géotechnique 1961, 11, 339–353. [Google Scholar] [CrossRef]
- Jewell, R.A.A. Direct shear tests on sand. Geotechnique 1989, 39, 309–322. [Google Scholar] [CrossRef]
- Yoshimi, Y.; Kishida, T. A ring torsion apparatus for evaluating friction between soil and metal surfaces. Geotech Test. J. 1981, 4, 8. [Google Scholar] [CrossRef]
- Kou, H.L.; Diao, W.Z.; Zhang, W.C.; Zheng, J.B.; Wu, C. Experimental study of interface shearing between calcareous sand and steel plate considering surface roughness and particle size. Appl. Ocean. Res. 2021, 107, 102490. [Google Scholar] [CrossRef]
- Clough, G.W.; Duncan, J.M. Finite element analyses of retaining wall behavior. J. Soil Mech. Found. Eng. 1971, 97, 1657–1673. [Google Scholar] [CrossRef]
- Uesugi, M.; Kishida, H. Frictional resistance at yield between dry sand and mild steel. Soils Found. 1986, 26, 139–149. [Google Scholar] [CrossRef]
- Huck, P.J.L.T. Dynamic Response of Soil/Concrete Interfaces at High Pressure; Air Force Weapons Laboratory: Washington, DC, USA, 1974. [Google Scholar]
- Tiwari, B.; Ajmera, B.; Kaya, G. Shear Strength Reduction at Soil Structure Interface. In GeoFlorida 2010: Advances in Analysis, Modeling & Design; ASCE: Washington, DC, USA, 2010. [Google Scholar]
- Liu, F.; Wang, P.; Wang, J.; Cai, Y. Cyclic and post-cyclic shear behavior of sand-geogrid interface under different shear rates. Chin. J. Rock Mech. Eng. 2016, 35, 387–395. [Google Scholar]
- Kulatilake, P.; Um, J.; Panda, B.; Nghiem, N. Development of new peak shear strength criterion for anisotropic rock joints. J. Eng. Mech. ASCE 1999, 125, 1010–1017. [Google Scholar] [CrossRef]
- Zhao, Y.; Zhang, C.; Wang, Y.; Lin, H. Shear-related roughness classification and strength model of natural rock joint based on fuzzy comprehensive evaluation. Int. J. Rock Mech. Min. Sci. 2020, 137, 104550. [Google Scholar] [CrossRef]
- Fathipour-Azar, H. Data-driven estimation of joint roughness coefficient. J. Rock Mech. Geotech. Eng. 2021, 13, 10. [Google Scholar] [CrossRef]
- Shi, X.; Zhang, J.S.; Liu, P. Experimental research on shearing properties of the interface between red clay and concrete. J. Cent. South Univ. (Sci. Technol.) 2015, 46, 1826–1831. [Google Scholar]
- Hu, J.; Cui, H.; Yang, X. Experimental research on shearing properties of interface between silty clay and recycled concrete. Sci. Technol. Eng. 2019, 19, 231–235. [Google Scholar]
- Wan, X.S.; Zhou, H.; Lu, J.G. Experimental study on shear characteristics of saline frozen soil-concrete interface. J. Eng. Geol. 2023, 277. [Google Scholar]
- Xu, F.; Chen, L.; Zhao, C.Y. Experimental study on the interface shear behavior of clay and cement soil. Adv. Eng. Sci. 2021, 53, 110–117. [Google Scholar]
Disclaimer/Publisher’s Note: The statements, opinions and data contained in all publications are solely those of the individual author(s) and contributor(s) and not of MDPI and/or the editor(s). MDPI and/or the editor(s) disclaim responsibility for any injury to people or property resulting from any ideas, methods, instructions or products referred to in the content. |
© 2024 by the authors. Licensee MDPI, Basel, Switzerland. This article is an open access article distributed under the terms and conditions of the Creative Commons Attribution (CC BY) license (https://creativecommons.org/licenses/by/4.0/).