
Stability Analysis of Buck Converter Based on Passivity-Based Stability Criterion


Abstract
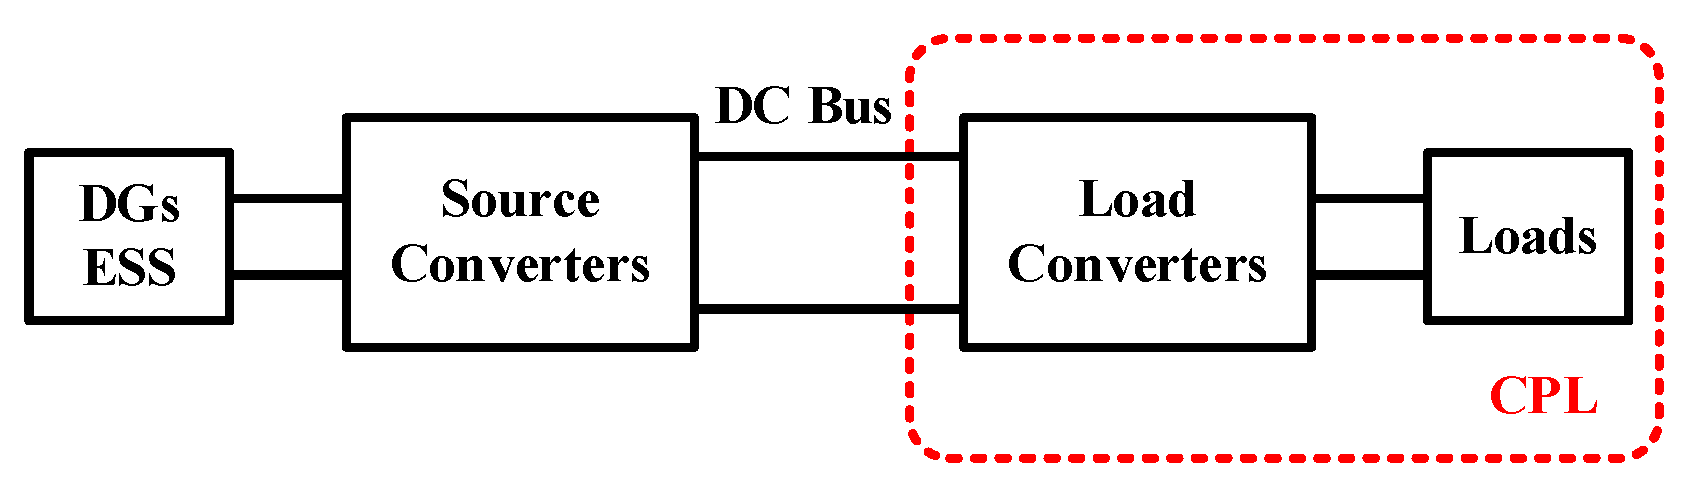
:1. Introduction
2. Passivity-Based Stability Criterion
- Y(s) has no right half plane zeros.
- or .
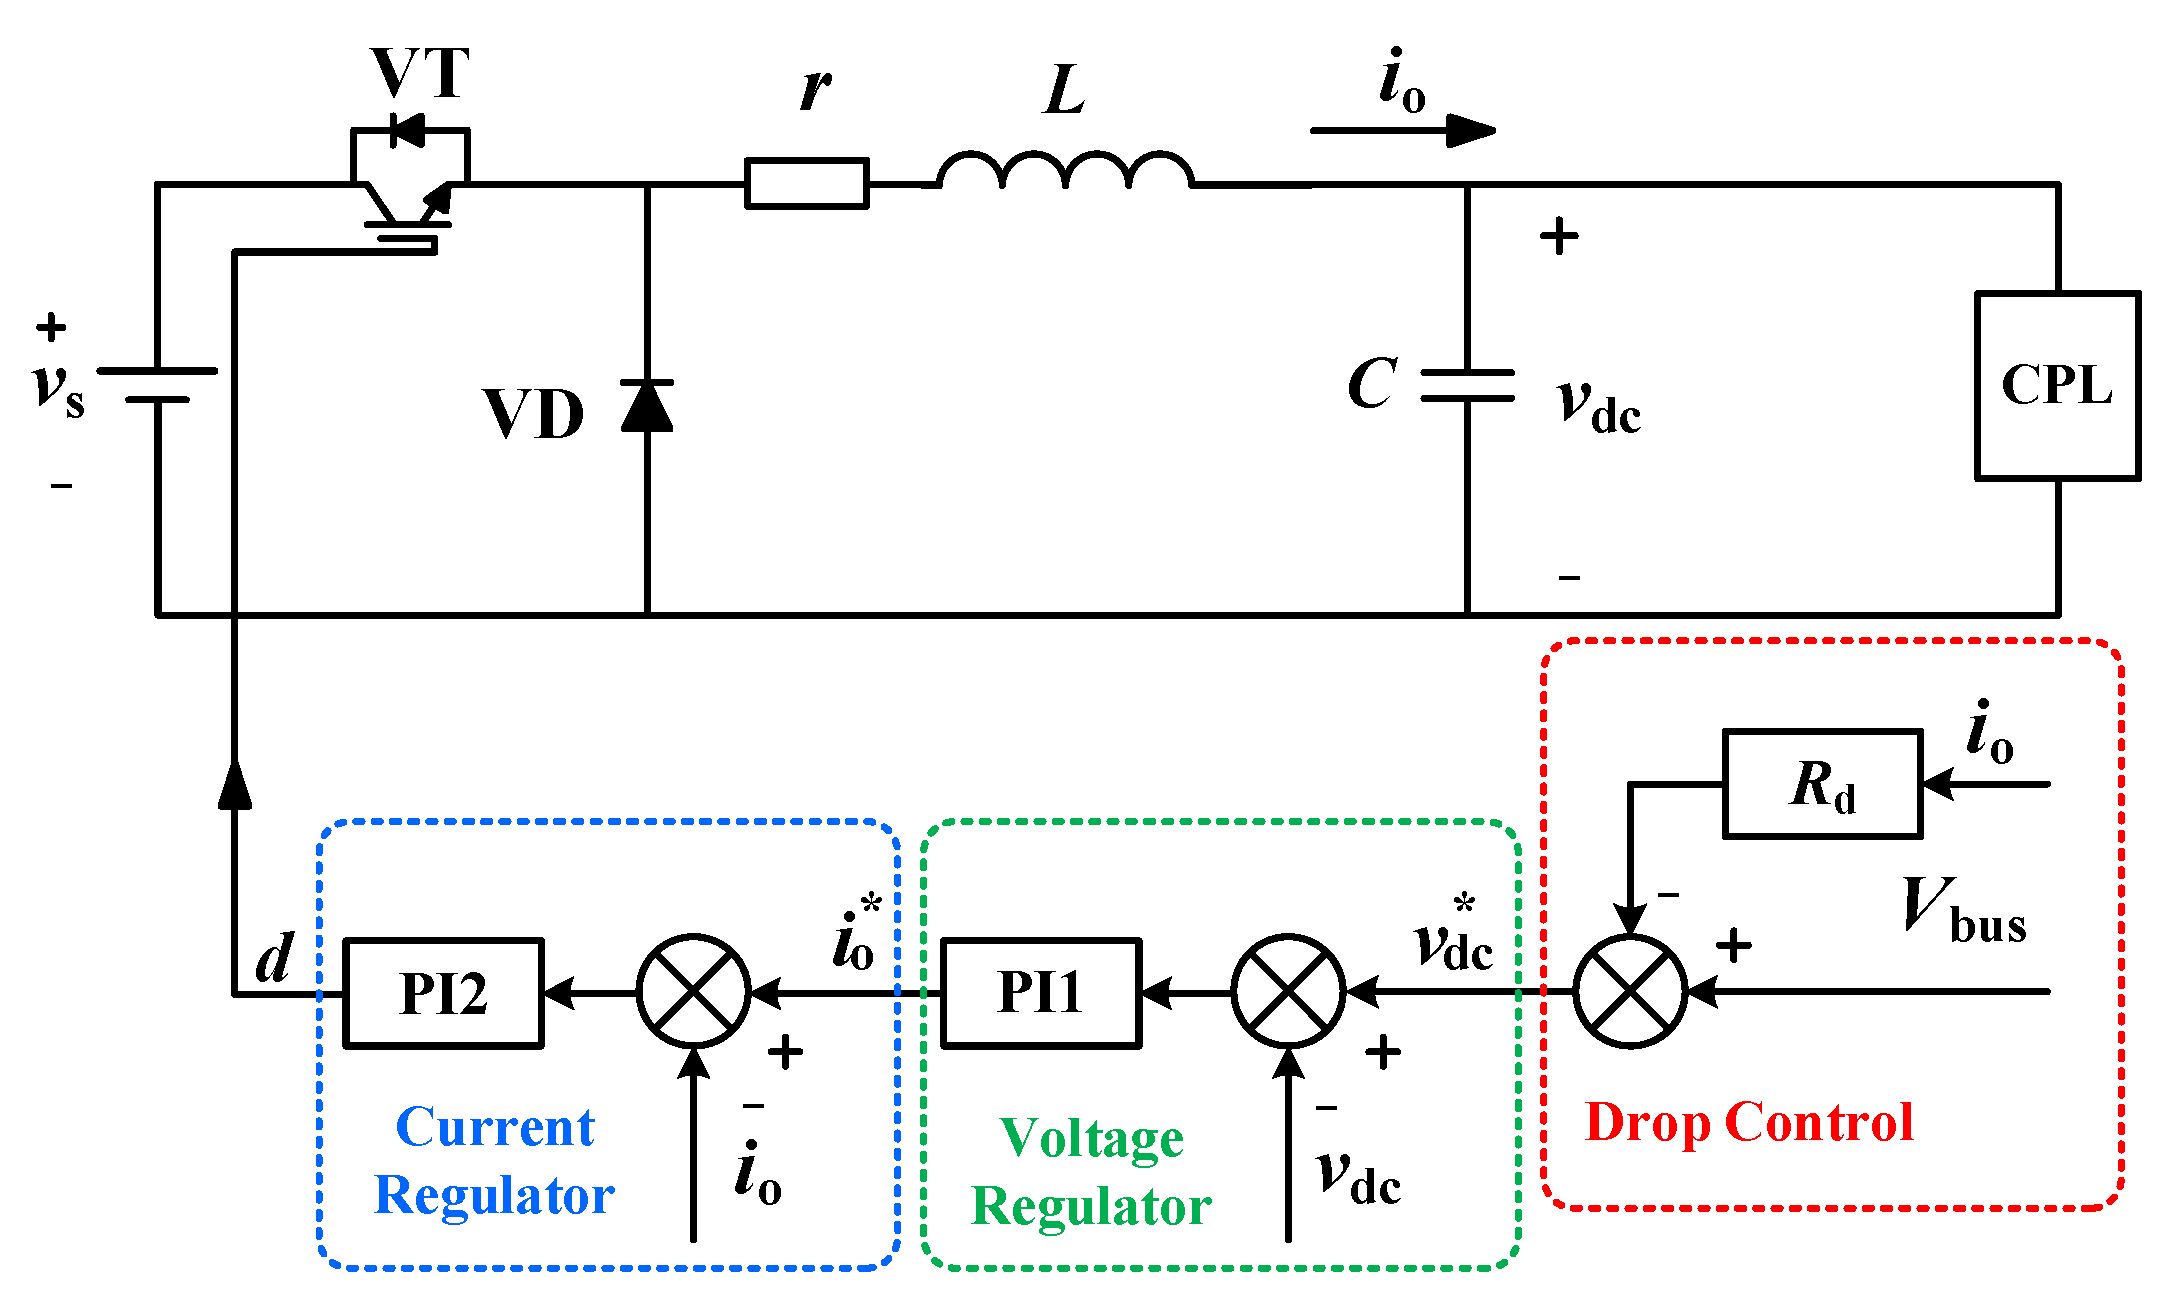
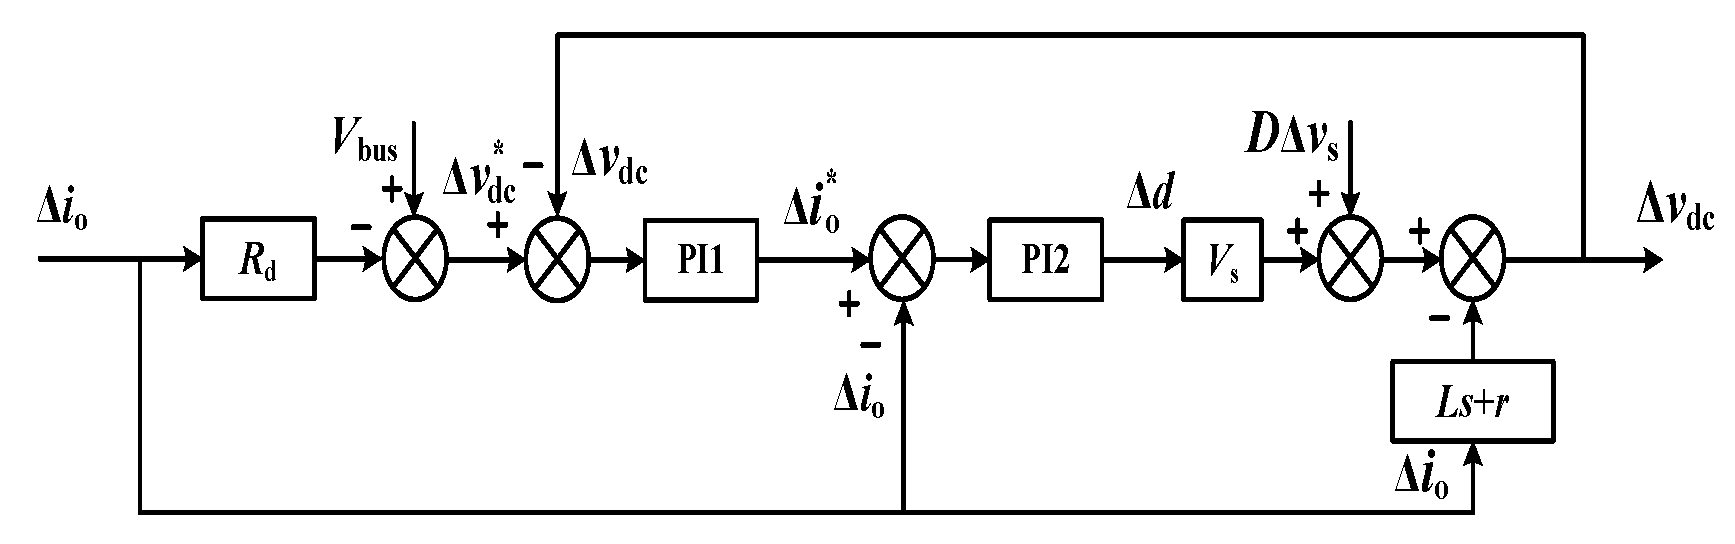
3. Model and Passivity Analysis of the Buck-CPL Subsystem
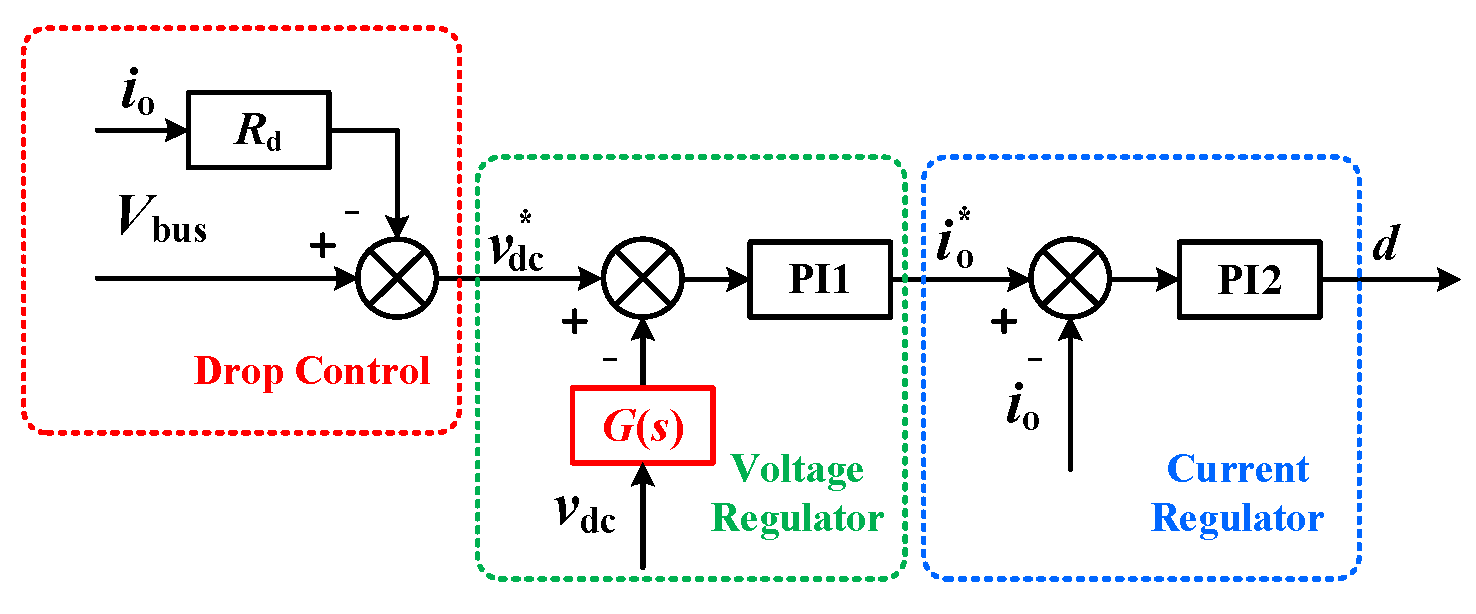
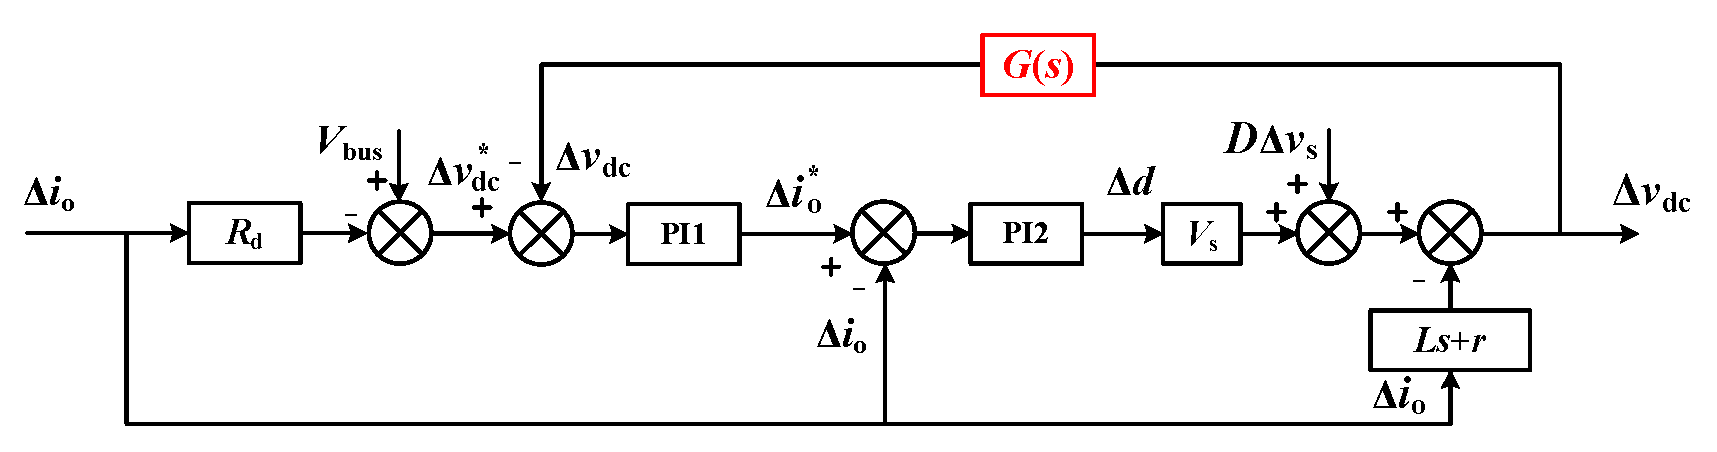
4. Improved Control Strategy
5. Simulation Validation
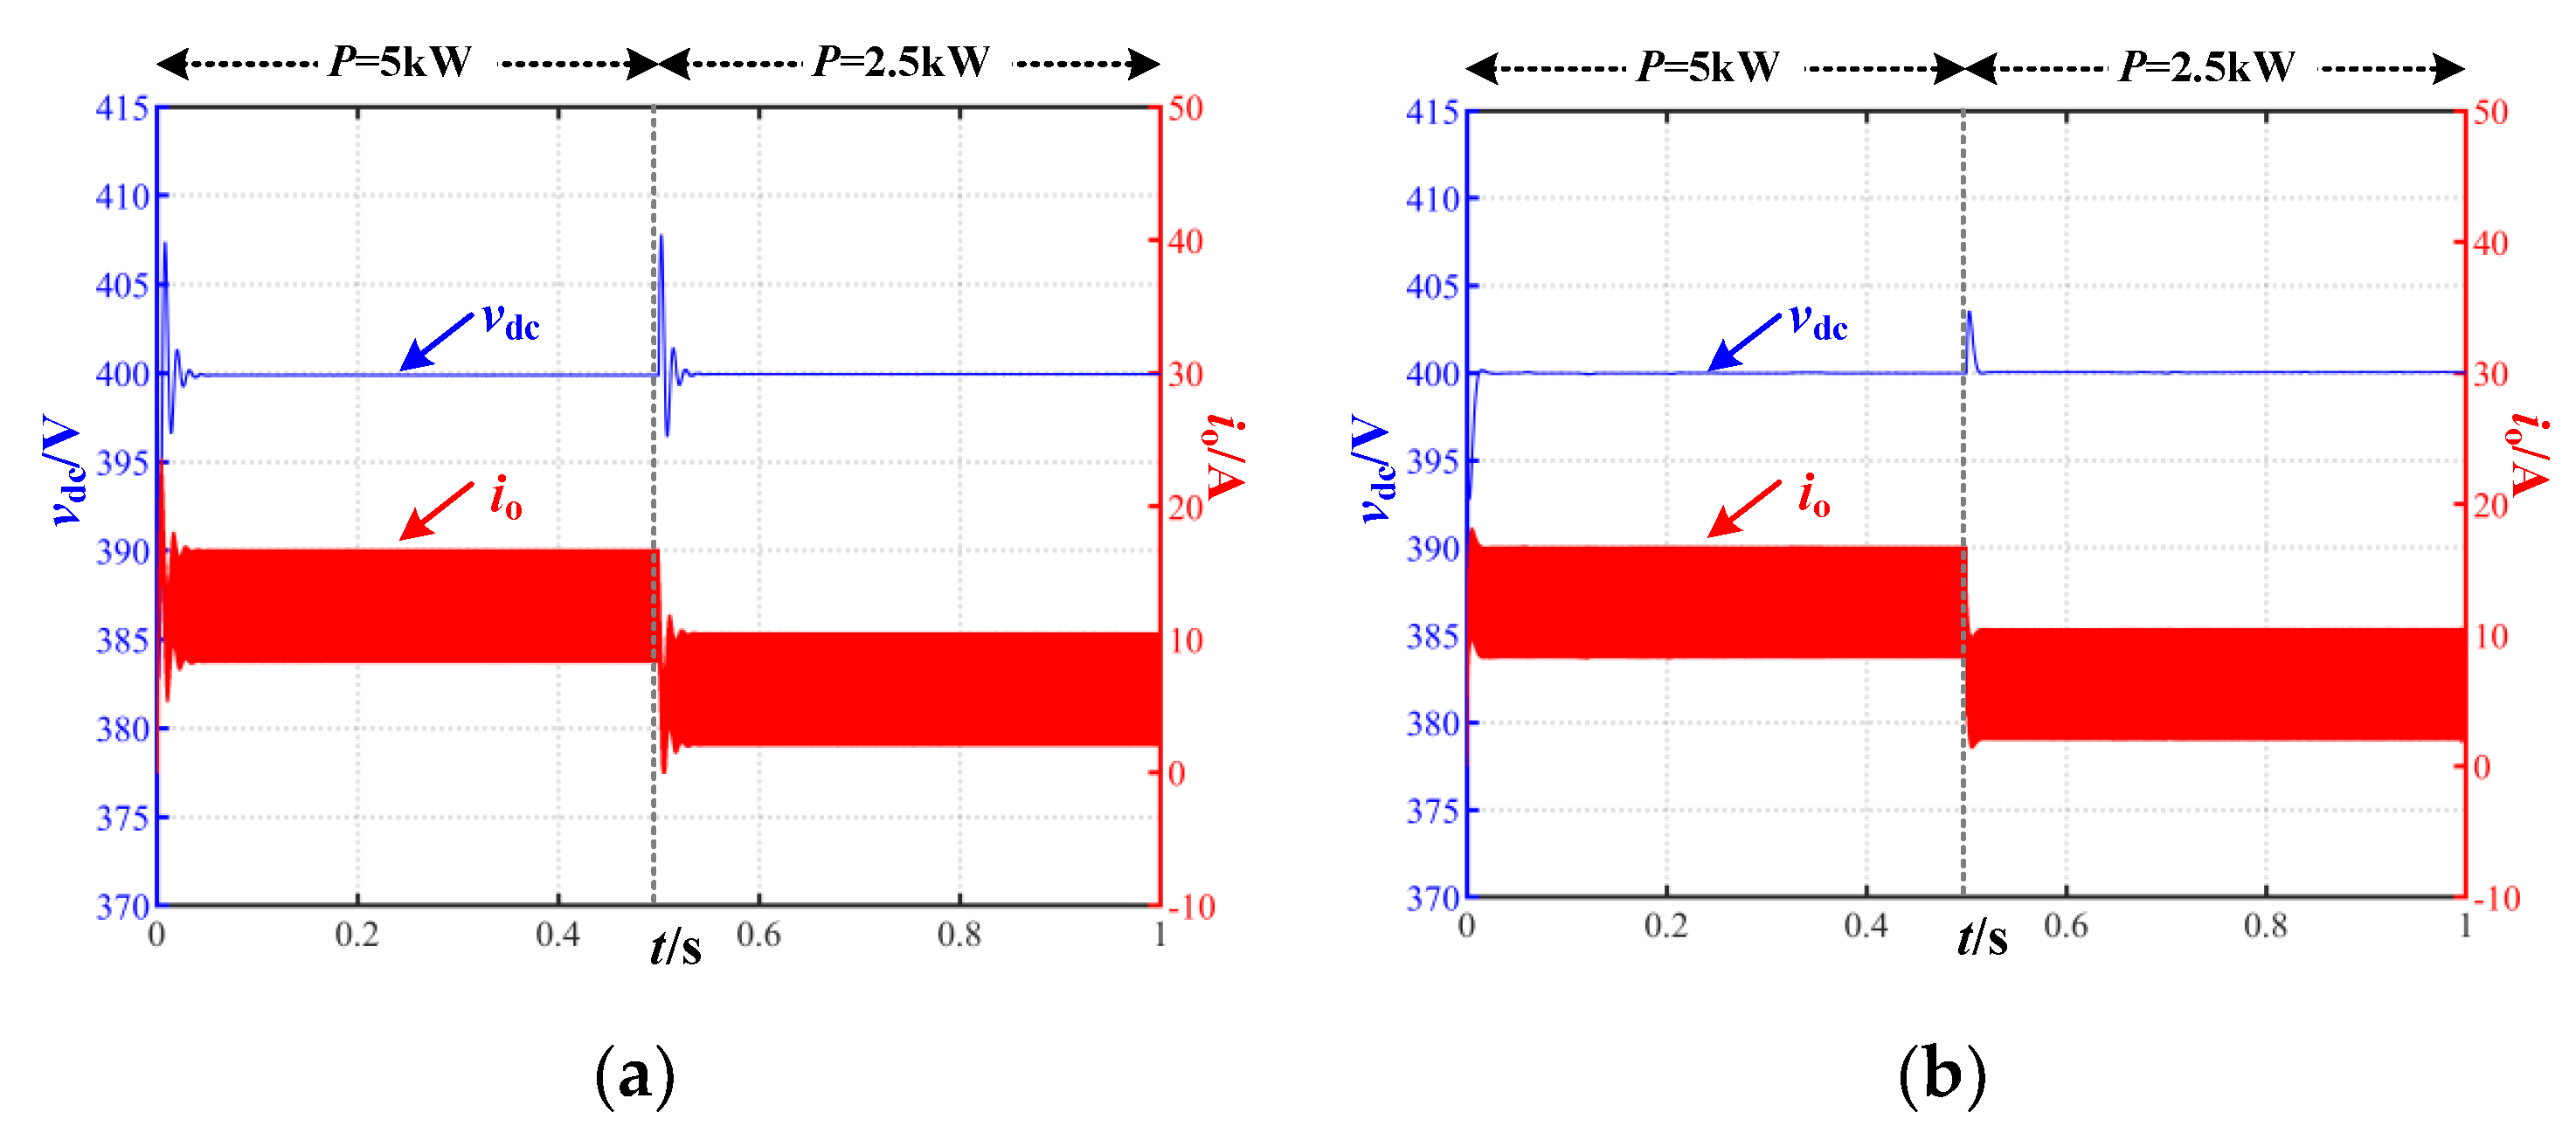
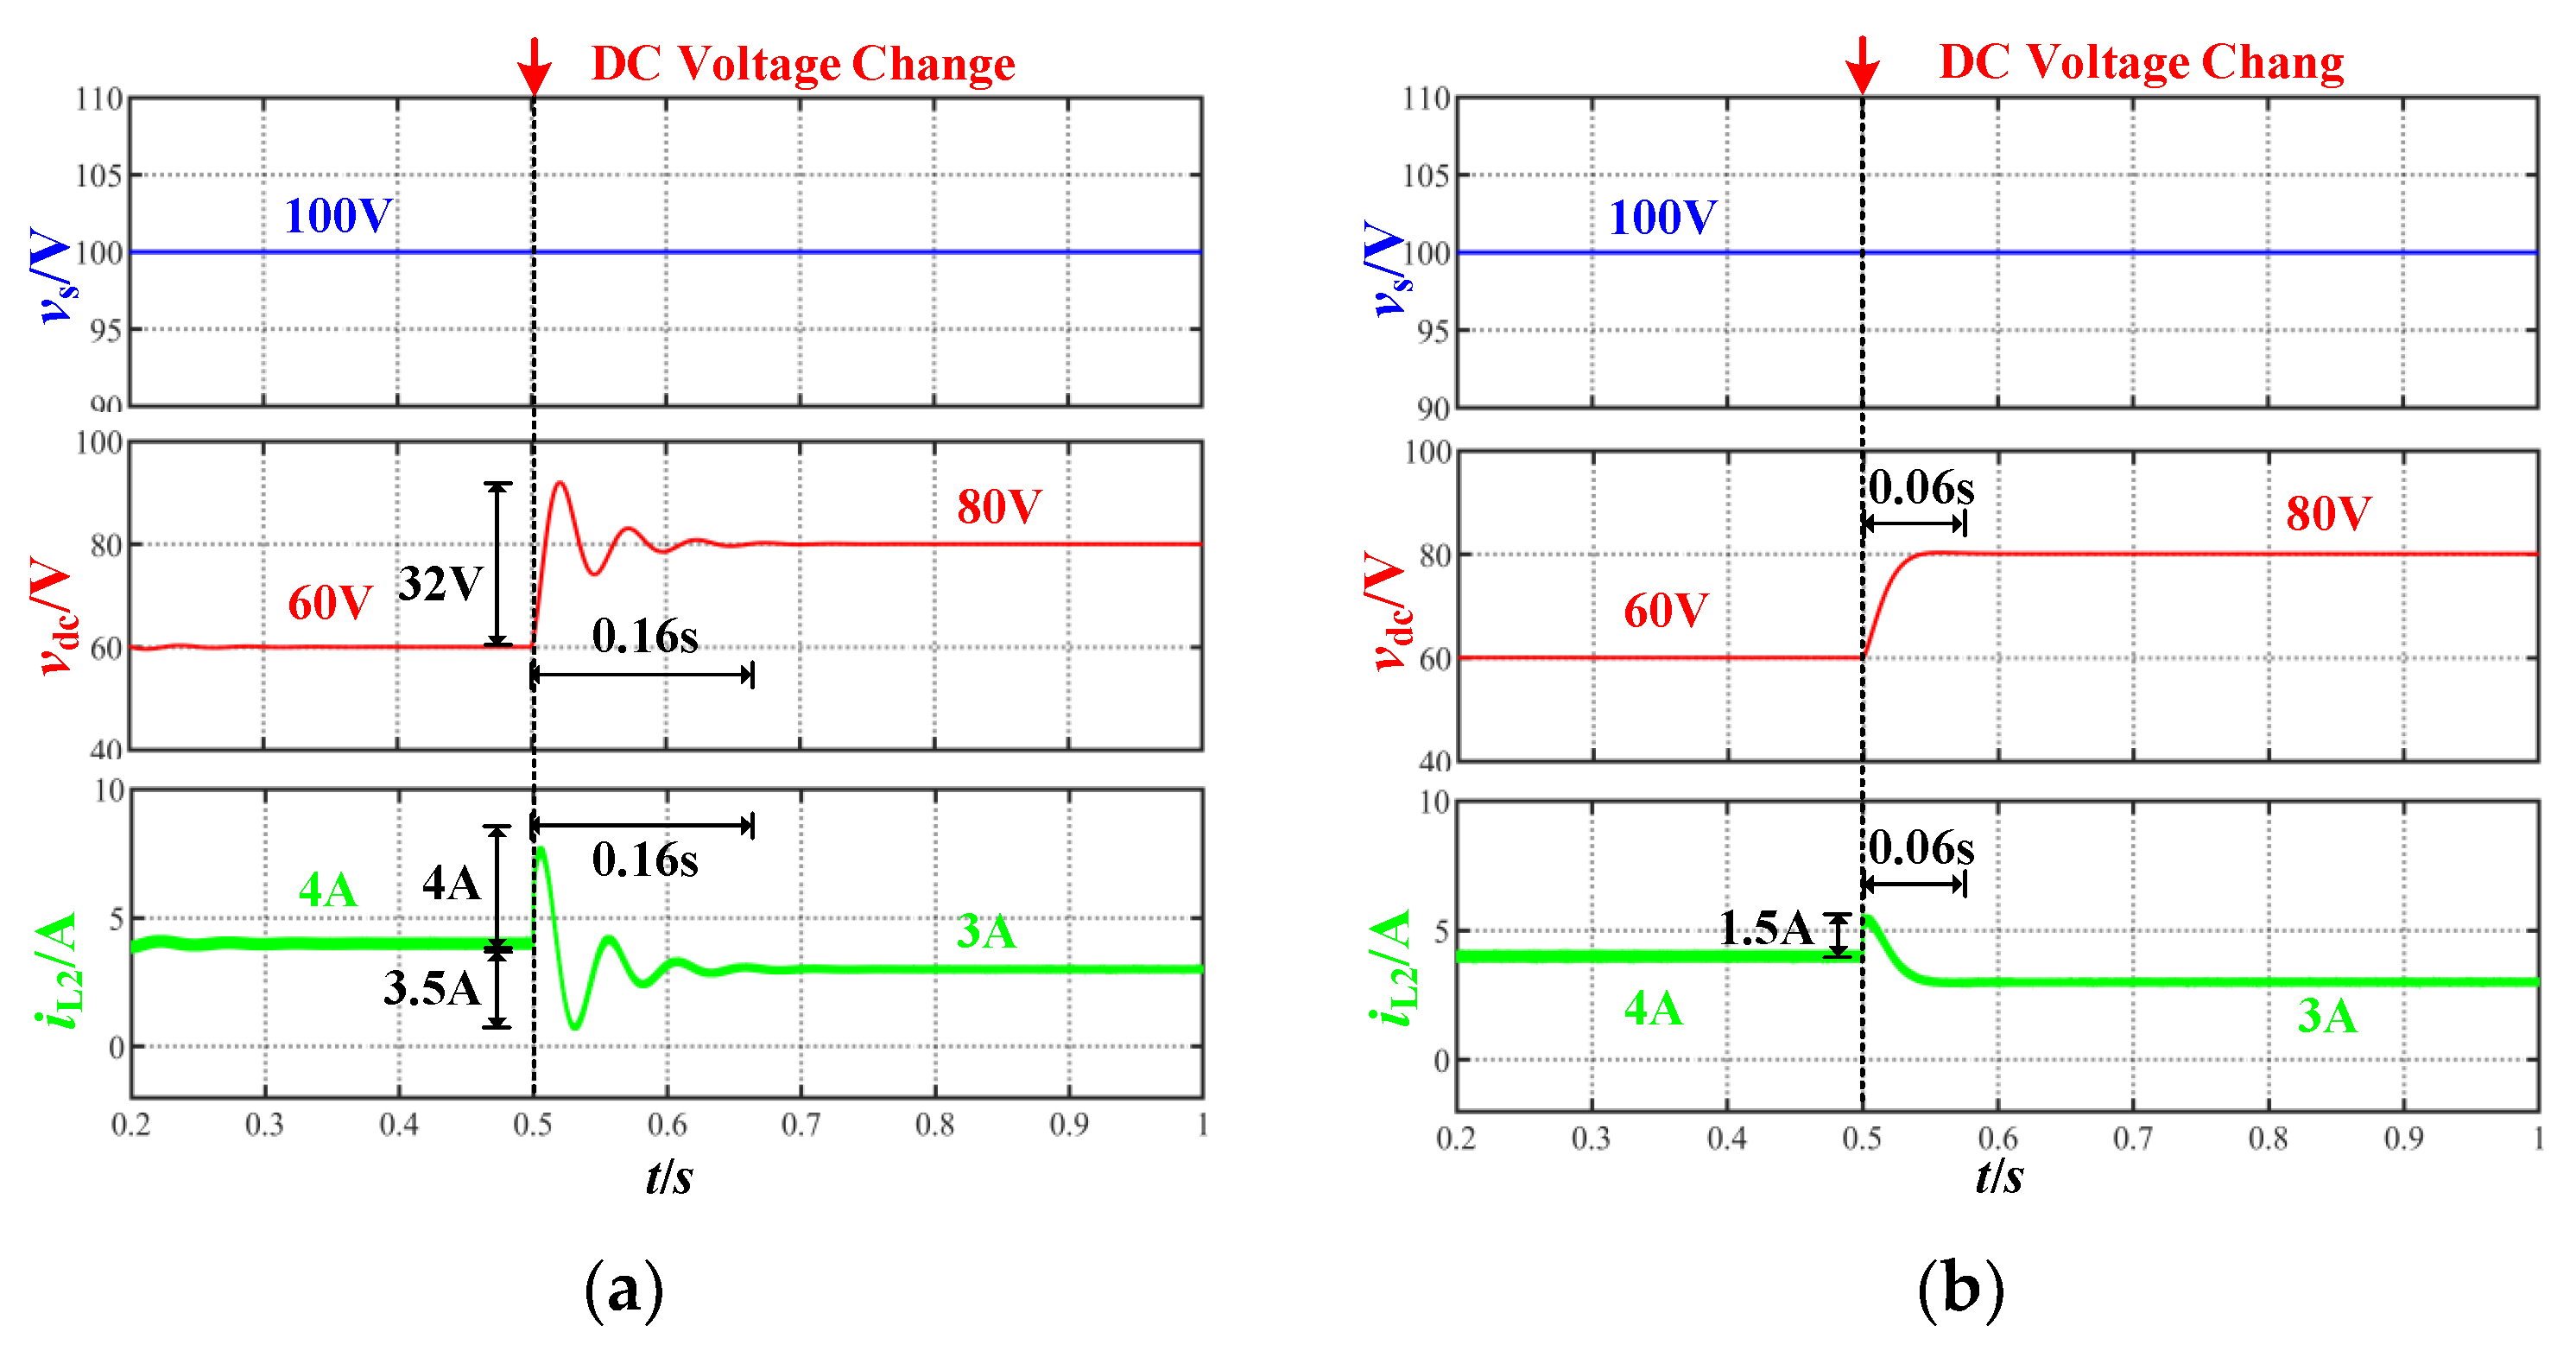
5.1. Simulation of the Improved Control Strategy for the Buck Converter with CPL
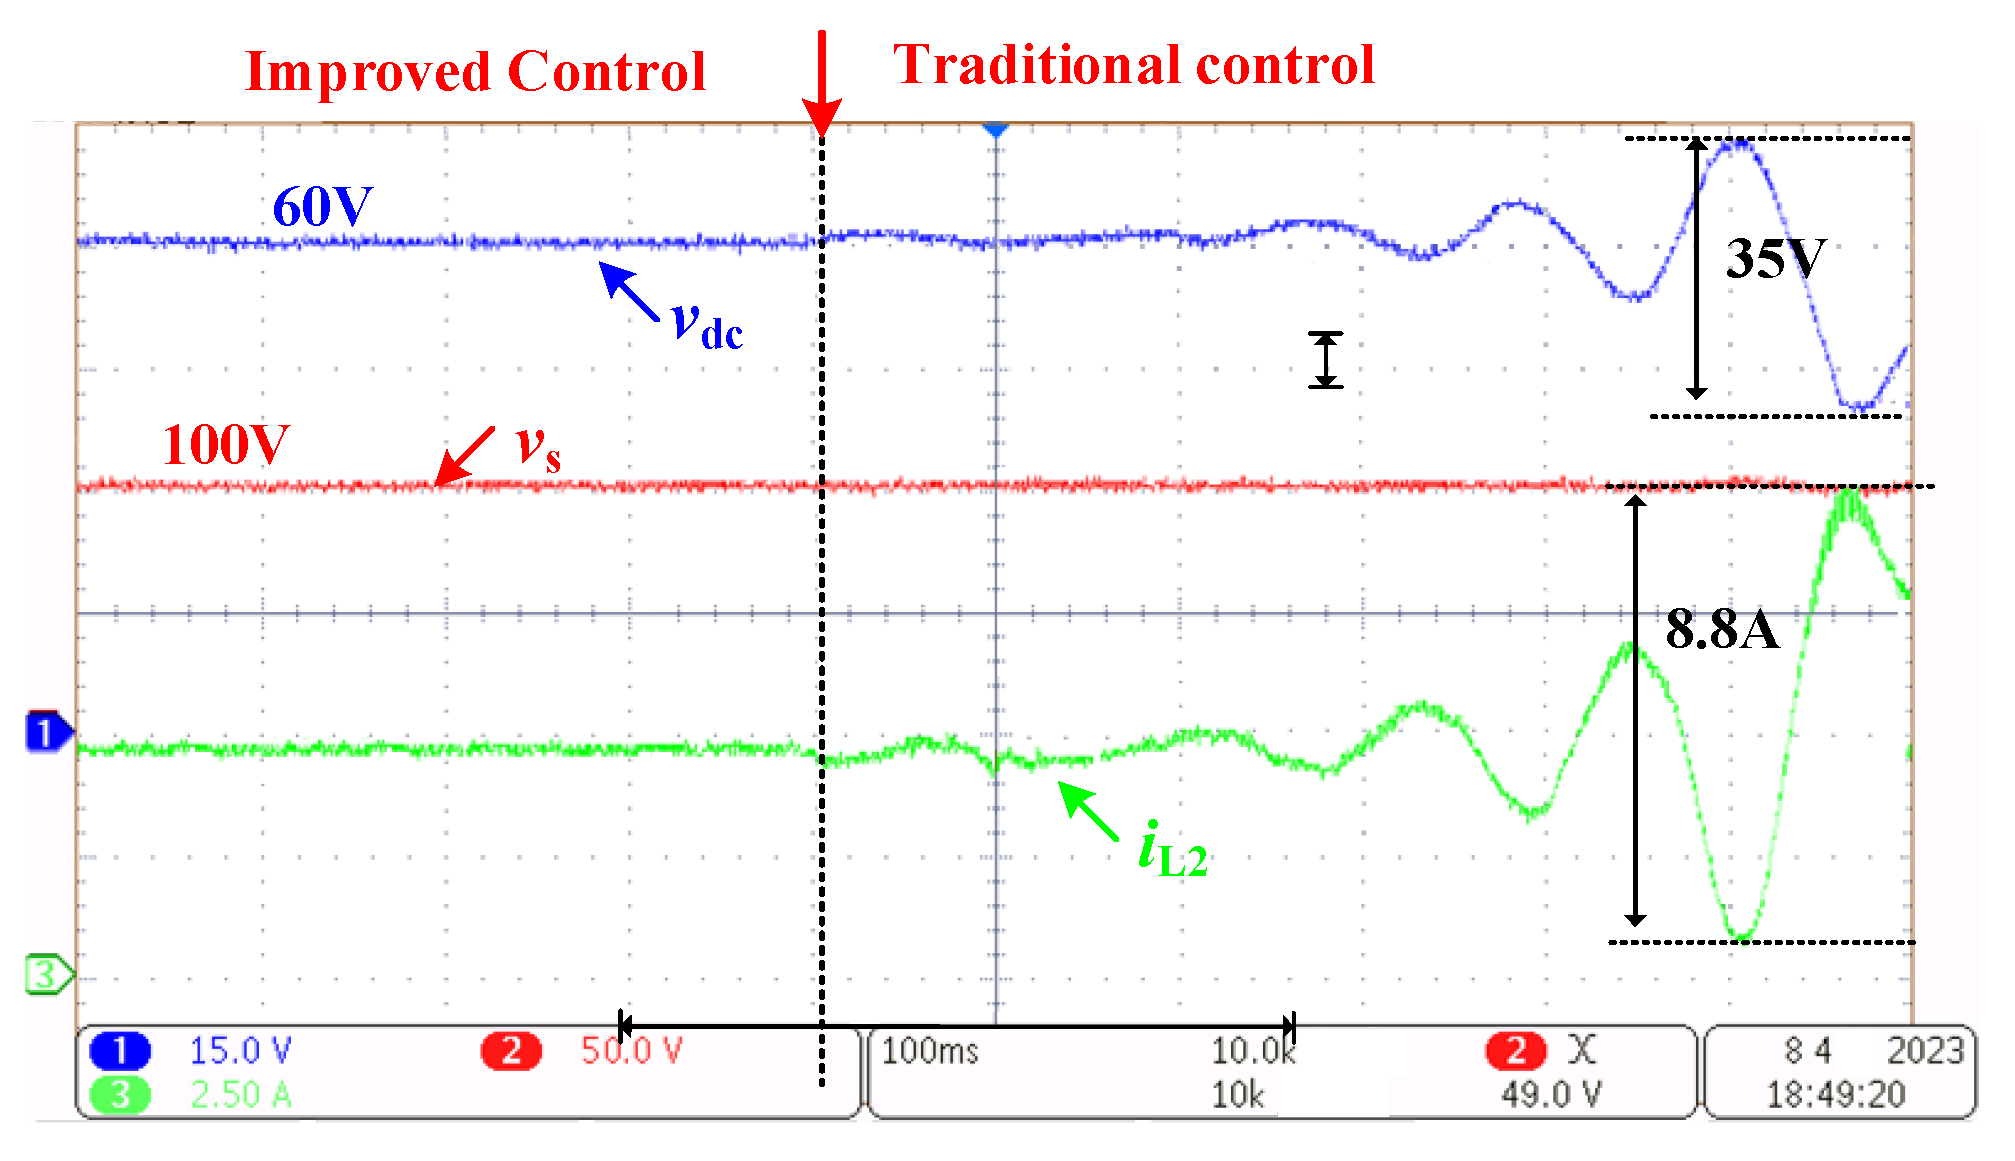
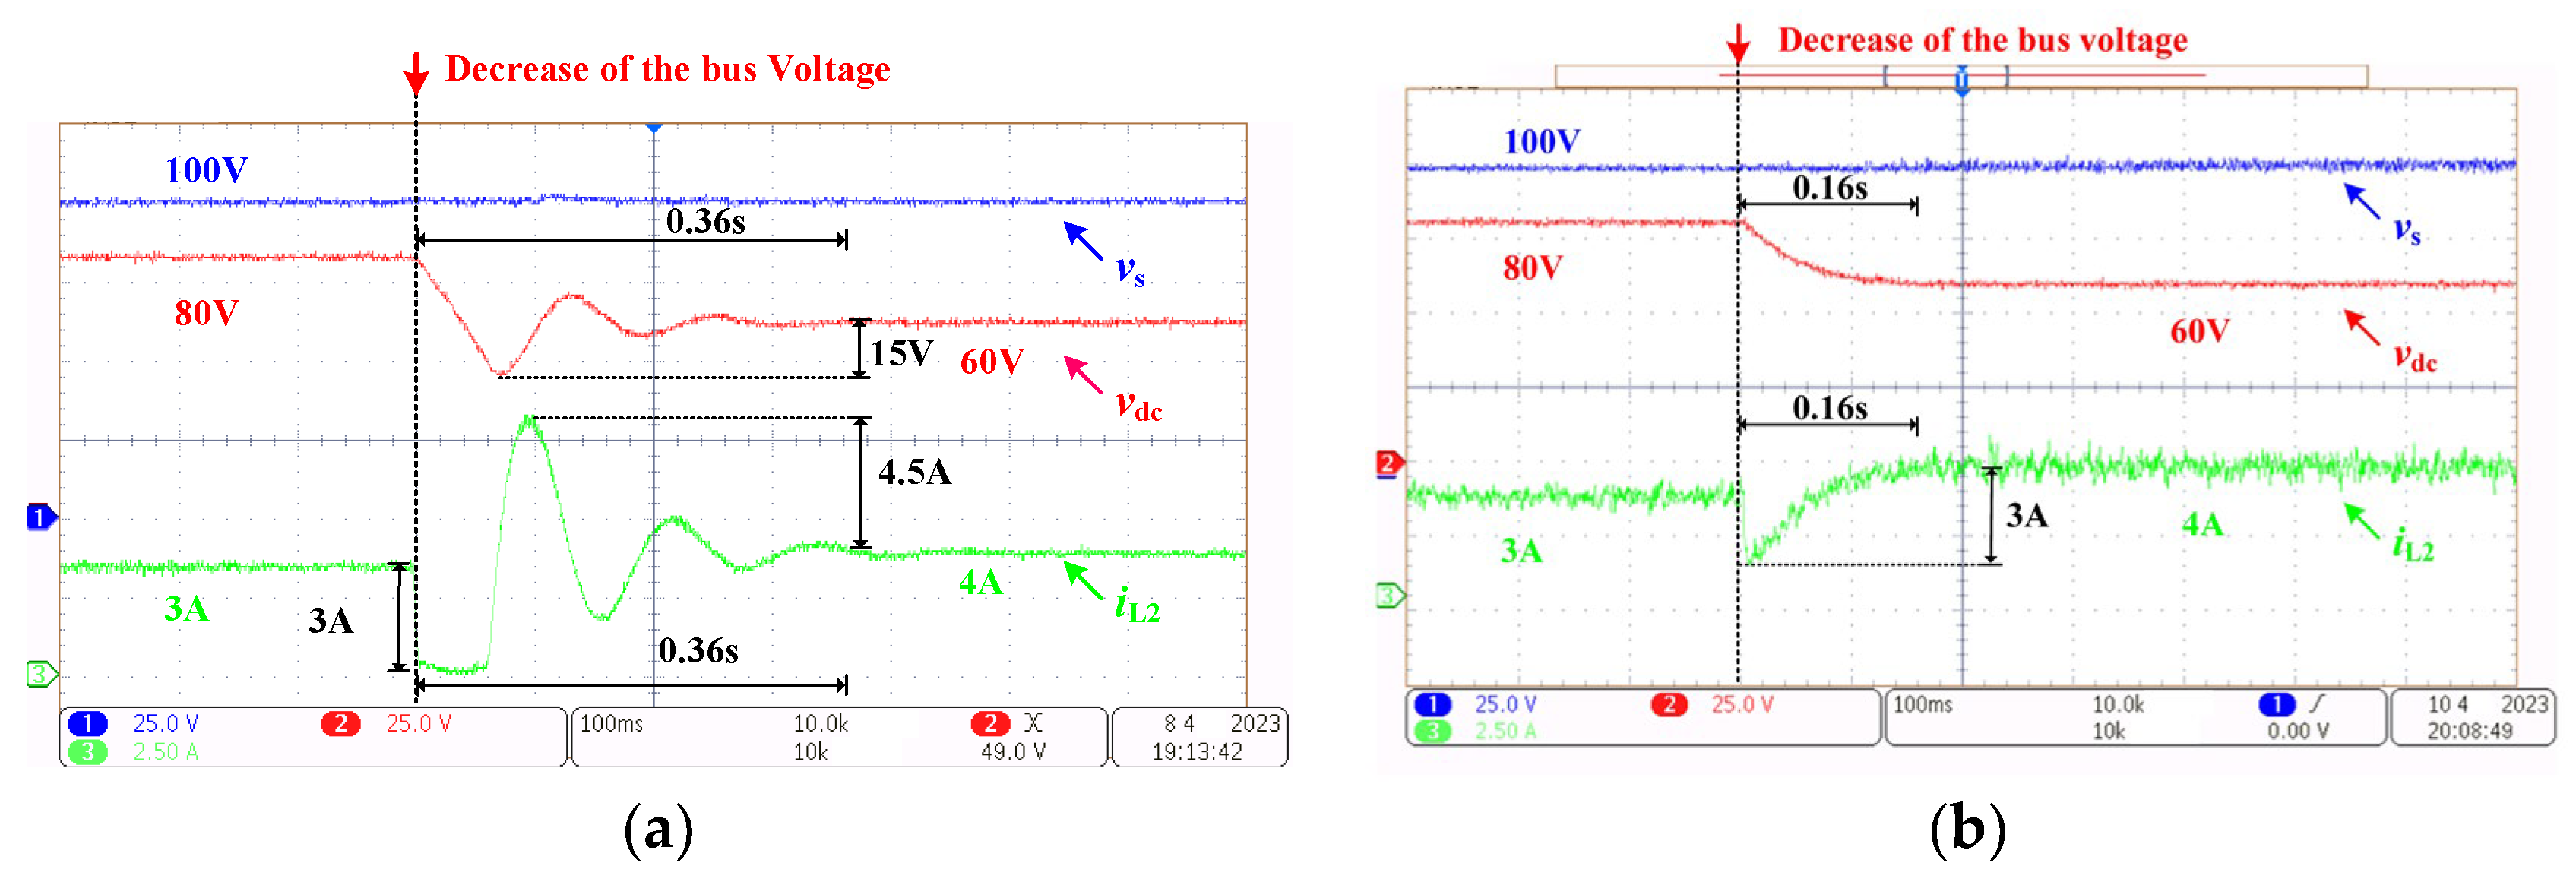
5.2. Experimental Validation of Buck-CPL
6. Conclusions
Author Contributions
Funding
Institutional Review Board Statement
Informed Consent Statement
Data Availability Statement
Conflicts of Interest
References
- Liu, Z.; Li, J. Robust Stability of DC Microgrid Under Distributed Control. IEEE Access 2022, 10, 97888–97896. [Google Scholar] [CrossRef]
- Khan, S.S.; Wen, H. A Comprehensive Review of Fault Diagnosis and Tolerant Control in DC-DC Converters for DC Microgrids. IEEE Access 2021, 9, 80100–80127. [Google Scholar] [CrossRef]
- Dragičević, T.; Lu, X.; Vasquez, J.C.; Guerrero, J.M. DC microgrids (Part II): A review of power architectures, applications, and standardization issues. IEEE Trans. Power Electron. 2016, 31, 3528–3549. [Google Scholar] [CrossRef]
- Guo, L.; Feng, Y.; Li, X.; Wang, C.; Li, Y. Stability Analysis and Research of Active Damping Method for DC Microgrid. Proc. CSEE 2016, 36, 927–936. [Google Scholar]
- Hussain, M.N.; Mishra, R.; Agarwal, V. A Frequency-Dependent Virtual Impedance for Voltage-Regulating Converters Feeding Constant Power Loads in a DC Microgrid. IEEE Trans. Ind. Appl. 2018, 54, 5630–5639. [Google Scholar] [CrossRef]
- Dragičević, T.; Lu, X.; Vasquez, J.C.; Guerrero, J.M. DC microgrids (Part I): A review of control strategies and stabilization techniques. IEEE Trans. Power Electron. 2016, 31, 4876–4891. [Google Scholar]
- Sudhoff, S.D.; Crider, J.M. Advancements in generalized immittance based stability analysis of DC power electronics based distribution systems. In Proceedings of the IEEE Electric Ship Technologies Symposium, Alexandria, VA, USA, 10–13 April 2011; pp. 207–212. [Google Scholar]
- Vesti, S.; Suntio, T.; Oliver, J.A.; Prieto, R.; Cobos, J.A. Impedance-Based Stability and Transient-Performance Assessment Applying Maximum Peak Criteria. IEEE Trans. Power Electron. 2013, 28, 2099–2104. [Google Scholar] [CrossRef]
- Wang, R.; Sun, Q.; Hu, W.; Xiao, J.; Zhang, H.; Wang, P. Stability-Oriented Droop Coefficients Region Identification for Inverters Within Weak Grid: An Impedance-Based Approach. IEEE Trans. Syst. Man Cybern. Syst. 2021, 51, 2258–2268. [Google Scholar] [CrossRef]
- Gu, Y.; Li, W.; He, X. Passivity-Based Control of DC Microgrid for Self-Disciplined Stabilization. IEEE Trans. Power Syst. 2015, 30, 2623–2632. [Google Scholar] [CrossRef]
- Zhang, X.; Ruan, X.; Chi, K.T. Impedance-Based Local Stability Criterion for DC Distributed Power Systems. IEEE Trans. Circuits Syst. 2015, 62, 916–925. [Google Scholar] [CrossRef]
- Loranca-Coutiño, J.; Mayo-Maldonado, J.C.; Escobar, G.; Maupong, T.M.; Valdez-Resendiz, J.E.; Rosas-Caro, J.C. Data-Driven Passivity-Based Control Design for Modular DC Microgrids. IEEE Trans. Ind. Electron. 2022, 69, 2545–2556. [Google Scholar] [CrossRef]
- Xu, Q.; Zhang, C.; Wen, C.; Wang, P. A Novel Composite Nonlinear Controller for Stabilization of Constant Power Load in DC Microgrid. IEEE Trans. Smart Grid 2019, 10, 752–761. [Google Scholar] [CrossRef]
- Tesfaye, A.; Zhang, J.H.; Zheng, D.H.; Shiferaw, D. Short-term wind power forecasting using artificial neural networks for resource scheduling in microgrids. Int. J. Sci. Eng. Appl. 2016, 5, 144–151. [Google Scholar] [CrossRef]
- Nayak, A.; Rayguru, M.M.; Mishra, S.; Hossain, M.J. A Quantitative Approach for Convergence Analysis of a Singularly Perturbed Inverter-Based Microgrid. IEEE Trans. Energy Convers. 2021, 36, 3016–3030. [Google Scholar] [CrossRef]
- Azad, M.; Mahmud, M.R.; Pota, H. Switching Frequency Sensitivity Analysis of DC Microgrid Connected Distributed Generation Based on Dynamic Phasor Model. In Proceedings of the 2021 IEEE Industrial and Commercial Power Systems Europe (EEEIC/I&CPS Europe), Bari, Italy, 7–10 September 2021; pp. 1–6. [Google Scholar]
- Antoszczuk, P.D.; Retegui, R.G.; Funes, M.; Wassinger, N.; Maestri, S. Interleaved Current Control for Multiphase Converters with High Dynamics Mean Current Tracking. IEEE Trans. Power Electron. 2016, 31, 8422–8434. [Google Scholar] [CrossRef]
- Ghaderi, D.; Maroti, P.K.; Sanjeevikumar, P.; Holm-Nielsen, J.B.; Hossain, E.; Nayyar, A. A Modified Step-Up Converter with Small Signal Analysis-Based Controller for Renewable Resource Applications. Appl. Sci. 2020, 10, 102. [Google Scholar] [CrossRef]
- Qi, Q.; Ghaderi, D.; Guerrero, J.M. Sliding mode controller-based switched-capacitor-based high DC gain and low voltage stress DC-DC boost converter for photovoltaic applications. Int. J. Electr. Power Energy Syst. 2021, 125, 106496. [Google Scholar] [CrossRef]
- Babes, B.; Mekhilef, S.; Boutaghane, A.; Rahmani, L. Fuzzy Approximation-Based Fractional-Order Nonsingular Terminal Sliding Mode Controller for DC–DC Buck Converters. IEEE Trans. Power Electron. 2022, 37, 2749–2760. [Google Scholar] [CrossRef]
- Echalih, S.; Abouloifa, A.; Lachkar, I.; El Aroudi, A.; Hekss, Z.; Giri, F.; Al-Numay, M.S. A Cascaded Controller for a Grid-Tied Photovoltaic System with Three-Phase Half-Bridge Interleaved Buck Shunt Active Power Filter: Hybrid Control Strategy and Fuzzy Logic Approach. IEEE J. Emerg. Sel. Top. Circuits Syst. 2022, 12, 320–330. [Google Scholar] [CrossRef]
- Riccobono, A.; Santi, E. A novel Passivity-Based Stability Criterion (PBSC) for switching converter DC distribution systems. In Proceedings of the 2012 Twenty-Seventh Annual IEEE Applied Power Electronics Conference and Exposition (APEC), Orlando, FL, USA, 5–9 February 2012; pp. 2560–2567. [Google Scholar]
- Yu, J.; Yu, J.; Wang, Y.; Cao, Y.; Lu, X.; Zhao, D. Passivity-based active stabilization for DC microgrid applications. CSEE J. Power Energy Syst. 2018, 4, 29–38. [Google Scholar] [CrossRef]
- Siegers, J.; Arrua, S.; Santi, E. Stabilizing controller design for multibus MVdc distribution systems using a passivity-based stability criterion and positive feedforward control. IEEE J. Emerg. Sel. Top. Power Electron. 2017, 5, 14–27. [Google Scholar] [CrossRef]
- Harnefors, L.; Finger, R.; Wang, X.; Bai, H.; Blaabjerg, F. VSC input admittance modeling and analysis above the Nyquist frequency for passivity-based stability assessment. IEEE Trans Ind. Electron. 2017, 64, 6362–6370. [Google Scholar] [CrossRef]
- Chen, H.C.; Cheng, P.T.; Wang, X.; Blaabjerg, F. A passivity-based stability analysis of the active damping technique in the offshore wind farm applications. IEEE Trans Ind. Appl. 2018, 54, 5074–5082. [Google Scholar] [CrossRef]
- Kakigano, H. Stabilization Method for Residential DC System Based on Passivity Criterion. In Proceedings of the 2018 International Power Electronics Conference, Niigata, Japan, 20–24 May 2018. [Google Scholar]
- Plesnick, S.; Singh, P. A Generalized Passivity-based Stability Criterion for Assessing Large Signal Stability of Interconnected DC Power Systems. IEEE Trans. Aerosp. Electron. Syst. 2022, 59, 30–38. [Google Scholar] [CrossRef]
- Mokogwu, C.N.; Hashtrudi-Zaad, K. Energy-Based Analysis of String Stability in Vehicle Platoons. IEEE Trans. Veh. Technol. 2022, 71, 5915–5929. [Google Scholar] [CrossRef]
- Dey, K.; Kulkarni, A.M. Passivity Based Grid-Connectivity Criterion for Ensuring Stability of a Network with Controlled Power Injection Devices. In Proceedings of the 2019 IEEE Power & Energy Society General Meeting (PESGM), Atlanta, GA, USA, 4–8 August 2019; pp. 1–5. [Google Scholar] [CrossRef]
- Górecki, P. Electrothermal Averaged Model of a Diode–IGBT Switch for a Fast Analysis of DC–DC Converters. IEEE Trans. Power Electron. 2022, 37, 13003–13013. [Google Scholar] [CrossRef]
- Górecki, P.; Wojciechowski, D. Accurate Electrothermal Modeling of High Frequency DC–DC Converters with Discrete IGBTs in PLECS Software. IEEE Trans. Ind. Electron. 2023, 70, 5739–5746. [Google Scholar] [CrossRef]
- Górecki, P.; Górecki, K. Methods of Fast Analysis of DC–DC Converters—A Review. Electronics 2021, 10, 2920. [Google Scholar] [CrossRef]


| Advanced Control Methods | Model | Implementation Complexity | Performance |
|---|---|---|---|
| Sliding mode method | Averaged | High | Good |
| Predictive methods | Averaged | High | Good |
| Fuzzy methods | Averaged | High | Good |
| PID methods | Simple | Moderate | Averaged |
| PI methods | Simple | Simple | Common |
| Parameters | Values |
|---|---|
| Input voltage vs | 100 (V) |
| Output voltage vdc | 60 (V) |
| Parasitic resistance r | 0.12 (Ω) |
| Inductance L | 8 (mH) |
| Capacitance C | 4600 (uF) |
| Traditional Control | Improved Control | |
|---|---|---|
| Parameters | Rd2 = 0.01 | Rd2 = 0.01 |
| kp21 = 0.015 | kp21 = 0.015 | |
| ki21 = 200 | ki21 = 200 | |
| kp22 = 0.002 | kp22 = 0.002 | |
| ki22 = 0.5 | ki22 = 0.5 | |
| kF = 0.001 |
Disclaimer/Publisher’s Note: The statements, opinions and data contained in all publications are solely those of the individual author(s) and contributor(s) and not of MDPI and/or the editor(s). MDPI and/or the editor(s) disclaim responsibility for any injury to people or property resulting from any ideas, methods, instructions or products referred to in the content. |
© 2024 by the authors. Licensee MDPI, Basel, Switzerland. This article is an open access article distributed under the terms and conditions of the Creative Commons Attribution (CC BY) license (https://creativecommons.org/licenses/by/4.0/).
Share and Cite
Zhang, Y.; Si, J.; Wang, X.-T.; Li, J.; Zhao, H. Stability Analysis of Buck Converter Based on Passivity-Based Stability Criterion. Appl. Sci. 2024, 14, 1755. https://doi.org/10.3390/app14051755
Zhang Y, Si J, Wang X-T, Li J, Zhao H. Stability Analysis of Buck Converter Based on Passivity-Based Stability Criterion. Applied Sciences. 2024; 14(5):1755. https://doi.org/10.3390/app14051755
Chicago/Turabian StyleZhang, Yajing, Jinyao Si, Xiu-Teng Wang, Jianguo Li, and Hongyan Zhao. 2024. "Stability Analysis of Buck Converter Based on Passivity-Based Stability Criterion" Applied Sciences 14, no. 5: 1755. https://doi.org/10.3390/app14051755