Featured Application
This study identifies factors influencing Human-driven vehicle (HDV) drivers’ attitudes toward connected autonomous vehicles (CAVs), affirming that psychological characteristics significantly impact interactive driving choices. The findings hold vital policy implications for government agencies and CAV producers, guiding strategic decisions in the autonomous transportation landscape.
Abstract
Human-driven vehicles (HDVs) will share the road with connected autonomous vehicles (CAVs) in the near future. Accordingly, the investigation of the interactive behavior of HDV drivers toward CAVs is becoming critical. In this study, a questionnaire survey was first conducted. The heterogenous clusters of HDV drivers were revealed through the latent profile analysis based on the collected dataset, with the focus on their trust and familiarity with CAVs, their attitudes towards sharing the road with CAVs, and their risk perception and perceived behavior control when they faced the CAVs. Subsequently, the correlation between the respective latent cluster and several socio-demographic factors was understood based on the multinomial logistic regression model, and the choice behavior of each cluster in different interactive driving scenarios was revealed. Three vital findings were reported. (1) Three profile clusters of HDV drivers (i.e., negative individuals, neutral individuals, and positive individuals) were revealed. (2) The drivers of a low/middle income and with a long driving experience were more likely to be negative individuals, whereas the CAV experience can make drivers feel positive towards CAVs. (3) Negative individuals might give up on changing lanes when a CAV platoon driving was noticed in the target lanes; in addition, they might raise more rigorous requirements for vehicle spacing in the lane-changing process when finding CAVs driving in the target lanes. To be specific, negative and neutral individuals preferred driving in front of the CAV platoons. The findings can provide references for developing effective management measures or CAV control strategies for transportation systems.
1. Introduction
Recently, connected autonomous vehicles (CAVs) have been developing rapidly. Traffic safety and efficiency can be significantly increased by the vehicle-to-vehicle and vehicle-to-infrastructure wireless communication technologies of CAVs [1]. However, it may take many years to transition from a purely human-driven vehicle (HDV) traffic system to a pure CAV traffic system. Within this transition period, we may see that HDVs and CAVs share the same road [2].
To date, existing research based on traffic model simulation has confirmed that introducing CAVs can lead to improved traffic capacity, shorten collision numbers and relieve congestion of a mixed traffic flow [3,4,5,6,7]. However, human factors are generally disregarded in most existing model simulation studies. Different from the stable and accurate driving strategies of CAVs, the driving behavior of humans can be dependent on numerous dynamics factors (e.g., socio-economic factors, psychological factors, personality traits, driving skills, and driving desires [8]). It is obvious that human factors will play an essential role in governing the safety and dynamics of mixed traffic. In both simulation research and real-world road environments, a significant number of traffic crashes persist due to interactions between HDV Drivers and CAVs [9,10]. In addition, several empirical studies have suggested that HDV drivers are likely to change their driving behavior in a negative manner when interacting with CAVs [11,12]. Thus, the investigation of the interactive behavior of HDV drivers to CAVs takes on critical significance [13,14]. Since real-world data lack detail for in-depth analysis, there are still uncertainties about the above-mentioned interactions. Thus, the fundamental questions to be answered are what factors account for or influence HDV drivers’ subjective feelings when interacting with CAVs and how CAVs will affect the behavior and performance of HDV drivers.
To address the above-described questions, the aim of this study is to better understand HDV drivers’ psychological characteristics when facing CAVs and the decision-making tendencies of drivers with different psychological characteristics in various HDV–CAV interaction scenarios. This is achieved by using a two-step method consisting of latent profile analysis and the multinomial logistic regression model, based on the data from a designed questionnaire survey in China. Particularly, the main contributions of this study lie in the following:
- (1)
- The way heterogenous HDV drivers cluster in accordance with their psychological characteristics when they faced CAVs were revealed, and the variables affecting individual classification were analyzed;
- (2)
- The behavior choice of each HDV driver cluster was identified in a wide variety of interactive driving scenarios;
- (3)
- This study contributed to the development of more accurate, realistic and robust microscopic traffic flow models to determine the characteristics of the mixed traffic flow of CAVs and HDVs and develop effective operation and control strategies for future transportation systems.
The rest of this study is structured as follows. In Section 2, a literature review of the research on public opinion towards CAVs and the behavioral adjustment of HDV drivers interacting with CAVs is presented. In Section 3, the methodology of this study is introduced. In Section 4, the data and questionnaire employed in this study are presented. In Section 5, the clusters of HDV drivers, the factors for individual classification and the behavior choice of the respective driver cluster in a wide variety of scenarios are investigated. In the last section, the conclusions and suggestions for future research are summarized. In Section 6, conclusions and suggestions are presented. In the last section, limitations and future research are provided.
2. Literature Review
2.1. The Studies of Public Opinion towards CAVs
Several recent surveys have attempted to gain insights into public concerns regarding CAVs, which can be summarized in three aspects (i.e., trust, attitudes, and the willingness to use).
2.1.1. Trust
Trust in CAVs takes on critical significance in shaping the expectations of human drivers towards the driving behavior of CAVs. Insights into factors for trust have aroused attention from researchers [15,16]. It has been defined as “the attitude that an agent will help achieve an individual’s goals in a scenario characterized by uncertainty and vulnerability” [17]. As revealed by existing research on factors for human trust in CAVs, trust is significantly affected by knowledge and information regarding CAVs [18]. When humans are provided with positive knowledge and insights regarding CAV technology, their perceived benefits of CAV technology will be increased, and their perceived risks decline, such that their trust in CAVs will be improved generally [19,20,21]. In terms of demographic factors, Ward et al. (2017) suggested that the trust of AV technology varies significantly with the age of people [22], whereas no gender effect was identified by Molnar et al. (2018) [23] and Schwarz et al. (2019) [24]. Lee et al. (2016) and Choi et al. (2015) also indicated that improving drivers’ perception of the accuracy of CAVs and providing system information or the driving scenarios of CAVs are of great significance in forming a trustful correlation between drivers and CAVs [25,26]. There are also many models and theories discussing factors affecting people’s trust in automation and CAVs, such as the Expectation–Confirmation Theory [27].
2.1.2. Attitude
Attitude refers to a person’s summary evaluations (e.g., unfavorable and favorable, or dislike and like) of an attitude object. As CAV technology has been leaping forward, several social problems have been raised. The existing prediction results have suggested that CAVs would enable novel user groups to enjoy mobility but that society would not be enthusiastic to CAVs [28]. Thus, public concerns on CAVs should be investigated [29]. The research in this area has been multidisciplinary, usually involving psychological or social principles [30,31,32,33]. For instance, as indicated by a study conducted by Nielsen et al. (2018) [34], attitudinal segments differ depending on socio-demographic profiles, current travel behavior, interest in use-cases for CAVs, and anticipated changes in behavior in a future with CAVs. People who are enthusiastic about CAVs are typically male, young, highly educated, and live in large urban areas. Furthermore, certain ways of improving AV acceptance, such as information exposure [35,36], direct experience [37], and interaction experience [38], have been examined in existing research.
2.1.3. Willingness to Use or Pay
As an important indicator of acceptance, a drivers’ intended use of CAVs has attracted certain scholar attention. To date, most studies have relied on questionnaire surveys to provide important insights for the people’s willingness to buy or use CAVs (see the detailed summary by refs. [39,40]). In terms of demographic characteristics, the main findings show that the willingness to use CAVs could be affected by age, gender, income, and education factors [41,42,43]. In terms of the psychological characteristics, trust and perceived benefit are positive predictors, and perceived risk and perceived dread are negative predictors [44,45]. In addition, other factors such as economic factors [46,47,48], such as the price of CAVs [49,50], also play an important role. To provide the CAV experience through interactions with a system, Buckly et al. (2018) [51] investigated the psychosocial factors associated with the intended use of CAVs based on a simulator study. Their results showed that the attitude toward the behavior, subjective norms, and perceived behavioral control are significant predictors of intentions to use CAVs. A similar result was also found by Li et al. (2022) [52].
In brief, the current studies have extensively investigated the trust, attitude, and willingness to use/buy CAVs, and have made lots of reliable conclusions. However, the problems of the willingness to share roads with CAVs and confidence or risk perception when interacting with CAVs have not been given enough attention. On this basis, in-depth research should be conducted to evaluate public opinion towards the various scenarios in mixed traffic with CAVs.
2.2. The Studies of the Behavioral Adjustment of HDV Drivers Interacting with CAVS
Since human drivers may have mixed opinions towards CAVs, they may behave differently when interacting with CAVs. Behavior adjustment may appear in many different forms when driving, such as speed management, following distance, the method of overtaking or lane changing, braking, the level of attention, and gap acceptance [53]. Existing studies have been conducted using field tests, driving simulators or questionnaire surveys, with the aim of investigating how CAVs influence HDV drivers’ behavior.
2.2.1. Field Tests
Field tests are usually conducted on vehicle testing grounds or closed roads to study one-to-one HDV–CAV interaction. Among different driving scenarios, car-following behavior has been studied more extensively based on field tests [54,55]. For instance, a field study by Rahmati et al. (2019) [56] suggests that there is a significant difference between human drivers’ behavior when following CAVs compared with HDVs. Human drivers feel more comfortable following CAVs, and drive closer to their leader if they followed CAVs. Zhao et al. (2020) [57] investigated the car-following behavior of drivers with different levels of trust in CAVs. The results show that drivers’ responses to the lead vehicles depend on their subjective trust towards CAV technology. Soni et al. (2022) also investigated the overtaking behavior of human drivers when facing CAVs, based on field tests [58]. However, the significant challenges in investigating issues relating to field tests are that sample sizes are small and the road conditions of the test grounds are limited. Thus, the research results are not comprehensively representative, and driving behaviors in complex scenarios cannot be investigated.
2.2.2. Driving Simulator Experiments
Driving simulator experiments are capable of making up for the defects of the field tests to some extent. A critical factor, i.e., the design of road alignment and the driving environment, is considered to represent the driving scenario realistically in simulator experiments [40]. For complex road environments, existing driving simulator research has investigated lane-changing accepted gaps on basic and on-ramp/off-ramp sections [59,60] and the behavioral adaption of HDV drivers driving next to a dedicated lane for CAVs [61,62]. Furthermore, a driving simulator is capable of exploring the merging decisions at the intersections. For instance, Trende et al. (2019) [63] investigated the potential behavioral differences regarding human–human and human–CAV interactions in a sophisticated merging scenario at the unsignalized intersection through conducting a driving simulator experiment. The study was conducted with 17 subjects using a full-scale fixed-base driving simulator. As indicated by the result, when interacting with CAVs, the drivers can merge more frequently in front of CAVs while displaying a notably higher gap acceptance in merging scenarios at the unsignalized intersection. Zhou et al. (2023) [64] conducted a study on the car-following behavior of HDV drivers in mixed-flow traffic using a driving simulator, considering three different CAV control settings (string-stable, string-unstable, and HDV-like). Analysis of post-experiment interview results and eye-tracking data revealed that the majority of HDV drivers preferred the string-stable CAV control setting. However, it was noted that this preference could induce driver distraction.
2.2.3. Questionnaire Surveys
Compared with field tests and driving simulator experiments, questionnaire surveys have a larger sample size and their driving scenarios can be more diverse. Notably, a survey-based method pays more attention to the individual heterogeneity of drivers (e.g., driving styles, personality traits, trust, or attitude towards CAVs). For instance, Liu et al. (2020) [65] adopted a survey-based study that rated the bullying intention of the human driver to CAVs when faced with a list of hypothetical traffic scenarios. As indicated by the results, participants show a greater intention to drive aggressively toward CAVs than toward HDVs. A similar result was reported by Lee et al. (2021) [66]. Regarding the effect of driving style, Ma et al. (2022) [67] investigated drivers’ subjective feelings and decision making when they faced CAVs in mixed traffic. As revealed by their results, aggressive drivers are more likely to take advantage of CAVs on the road, and defensive drivers are not significantly affected by the type of vehicles with which they are interacting.
Table 1 lists the details and major conclusions of the above-mentioned research focusing on understanding the behavioral adjustment of HDV drivers when interacting with CAVs. In brief, as reviewed in this section, although there are some commonly agreed findings, most of the existing studies do not recognize the significance of human psychological characteristics, and the few studies that consider the drivers’ individual heterogeneity still focus on a single aspect, only taking into account the sociodemographic variables, trust in CAV technology or personal traits (i.e., driving style and emotions). Thus, what factors account for or affect human psychological characteristics when facing CAVs and how individual groups with a wide variety of psychological characteristics towards CAVs make decisions in a wide range of driving scenarios remain unclear.

Table 1.
Studies focusing on the behavior adjustment of HDV drivers when facing CAVs.
3. Methodology
3.1. Latent Profile Analysis
In the selection of the classification method for this study, latent profile analysis (LPA) was chosen for four principal reasons. Firstly, LPA, as an individual-centered analytical technique utilizing data and probability models, effectively discerns latent model classifications among individuals [68]. This method has demonstrated success across various fields [69], offering a viable solution for driver classification in our study. Secondly, the adoption of LPA is underpinned by its adherence to specific-fit index standards, providing more accurate outcomes compared to traditional classification approaches. Furthermore, the inherent flexibility of latent class clustering eliminates the need to pre-specify the number of groups or label individual observations, allowing for the determination of the optimal number of clusters through diverse statistical criteria. Lastly, LPA’s capability to accommodate various types of variables, such as counts, continuous, categorical, and nominal variables, without the necessity for standardization [70] renders it a judicious selection within the context of this research.
LPA has been increasingly used as an analysis approach over the past few years, and it is becoming more common in applied research, especially in marketing. In the same vein, it has been widely used in the transportation field.
The overall goal of LPA is to uncover latent profiles or groups (k) of individuals (i) who share a meaningful and interpretable pattern of responses on their measures of interests (j). This is performed using joint and marginal probabilities in within-cluster and between-cluster models.
The within-class models are expressed as follows:
where denotes the model implied mean; represents the model implied variance, which will vary across j = 1, 2, …, J outcomes and k = 1, 2, …, K classes or profiles. The general assumptions of LPA include that of outcome variables being normally distributed within each class and the above-mentioned within-class outcomes being locally independent.
The between-class model represents the probability of membership in a given class k, and it is defined as follows:
where denotes a multinomial intercept (fixed at 0 for the final class); represents the latent classification variable in terms of the individual. On that basis, the within-class and between-class models can be incorporated into a single model based on the law of total probability, such that it yields
The above equation expresses the marginal probability density function for an individual (i) after summing across the joint within-class and between-class density probabilities for the J outcome variables, weighted by the probability of class or profile membership from Equation (3). Lastly, the LPA analysis results in a posterior probability for the respective individual are defined in Equation (5):
The above equation represents the probability of an individual (i) being assigned membership () to a specific class or profile (k), given their scores on the outcome variables in the vector. A posterior probability (t) was determined for the respective individual in the respective profile. To be specific, values closer to 1.0 indicate a higher probability of membership to a specific profile. With an increase in difference between the posterior probabilities for an individual, the certainty regarding their membership assignment turns out to be increased.
3.2. Multinomial Logit-Based Analysis
Although individuals in a respective cluster were considered relatively homogenous, heterogeneity might have remained among individuals in the respective subgroup. Furthermore, the respective cluster tended to make different driving decisions in a wide variety of driving scenarios.
In the selection of the multinomial logistic (MNL) model as the analytical framework for this study, a meticulous evaluation was conducted to appraise its suitability and advantages. Firstly, the MNL model, acclaimed for its statistical robustness, facilitates modeling based on the joint probability distribution of multiple classification outcomes. This structural characteristic allows for the simultaneous consideration of various factors influencing classification outcomes, contributing to a nuanced and comprehensive understanding of the intricate relationship between demographic characteristics and driver classification. Secondly, the MNL model showcases a notable capability of addressing sample imbalances, especially in scenarios where different types of driver samples may be unevenly distributed. This capability ensures a balanced and unbiased modeling approach, establishing a robust foundation for analyzing diverse classification outcomes. Additionally, the MNL model is distinguished by its flexibility in accommodating diverse variable types, encompassing counts, continuous, and categorical variables. This allows for the incorporation of a wide range of driver characteristics into the model, thereby fostering a more comprehensive analysis of their impact. Lastly, the intuitive nature of parameter interpretation in the MNL model facilitates a clear understanding of how demographic characteristics impact the classification and behavioral choices of different driver types. Hence, an MNL analysis was employed in our study to comprehend the correlation between driver groups and individual socio-demographic characteristics, as well as to analyze the behavior choices of different clusters in the face of distinct driving scenarios.
The MNL model presents a number of equivalent formulations of simple logistic regression, which can be expressed as follows:
where X is a set of independent variables; Y is a set of dependent variables; is the probability of jth dependent variable; is the ith independent variable; and and are the regression coefficients.
4. Data Collection
Considering the limitation of selecting random and large-scale samplings as well as simulating the diversity in traffic scenarios of driving simulators, a questionnaire survey was conducted. The questionnaire consisted of three parts: socio-demographics, psychological characteristics when facing CAVs, and a behavioral choice survey when driving on an identical road to CAVs. To clarify the scope of the experiments and help the respondents understand CAVs, a brief description of CAVs was presented before conducting the survey. In the language description of the questionnaire, a brief introduction to the performance of CAVs was provided: CAVs equipped with advanced on-board sensors, controllers, and actuators, and integrated with network communication technology. The technical system of CAVs consists of sensing, decision making, control, communication positioning, and a data platform, enabling the precise understanding of traffic conditions (such as surrounding vehicles’ movement information, road conditions, etc.) and making rapid driving decisions, achieving autonomous driving under controllable operating conditions. Compared to conventional vehicles, CAVs have a shorter response time and can maintain a smaller following distance for stable operation. Data were collected via a professional web-based survey tool “Wen Juan Xing”. The questionnaire was distributed to groups who were aged older than 18 and had driver’s licenses, and spread by the social media platform “WeChat”. After, the data were cleaned; the validated responses of 339 respondents were obtained.
4.1. Sample Distribution
Table 2 lists the socio-demographic sample distribution. As depicted in Table 2, the number of female and male respondents was similar. For age, 24–30 years of age (45.13%) accounted for nearly half of the respondents. The percentage of those 51 or older (4.43%) was the least. In terms of monthly income, the survey was distributed across a wide range of income levels. The largest proportion reached 40.71%, with this group making less than 5000 RMB per month. A possible reason for the above result is that the questionnaire was spread though the circle of authors’ friends, and most of them were studying or working at a university. Moreover, 59% of respondents had achieved a junior college/college diploma, while 34.22% had masters or doctorates, and 6.78% were high school graduates or GED. For the driving experience, the percentage of the group with 1–5 years of driving experience (42.77%) was the largest, and the percentage of the group with over 10 years of driving experience (9.44%) was the smallest. The annual driving mileage values were relatively evenly distributed among the respondents, in which the percentage of the group that drove less than 10,000 km per year (28.32%) was the largest, and the percentage of the group that drove 30,001–50,000 km per year was the smallest. The majority of the respondents (79.06%) did not have any CAV experience.
Table 2.
Summary of sample’s socio-demographic characteristics.
4.2. The Survey of Drivers’ Psychological Characteristics
Given the behaviors of humans are determined by intentions to act in a certain way, the design of the questionnaire of drivers’ psychological characteristics when facing CAVs conformed to the theory of planned behavior (TPB), including five latent psycho variables (i.e., familiarity, trust, attitude, risk perception and perceived behavior control). The operational definitions for each of the five latent variables are listed in Table 3, and the 16 measurement items are listed in Table 4. All items employed a 5-point Likert scale, ranging from 1 = ‘totally disagree’ to 5 = ‘totally agree’.
Table 3.
Operational definition of five latent variables.
Table 4.
Measurement items.
4.3. The Survey of Behavioral Choice
The behavioral choice survey was developed to investigate human drivers’ driving behavior adjustment under the effect of CAVs in mixed traffic. The respondents were instructed to imagine driving HDVs in mixed traffic and interacting with CAVs in different driving scenarios involving car-following and lane-changing processes. The following behavior choices were examined: (1) car-following willingness, (2) car-following distance, (3) lane-changing intention under the effect of a CAV platoon, (4) rear critical gap for lane-changing, and (5) front critical gap for lane-changing.
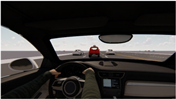
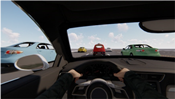
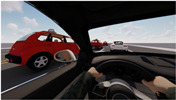
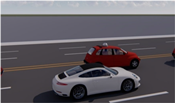
The respective question followed a scene image made by Lumion 11.0, such that the specific driving scenarios could be straightforwardly visually depicted. To make the difference between CAVs and HDVs, the CAVs were presented in a red color, with a camera mounted on top, without any driver. To be specific, more information regarding the hypothetical scenarios is presented as follows: (1) the HDVs had no V2V equipment and they did not exhibit the capability of receiving any real-time information; (2) the road conditions were favorable; (3) the drivers (respondents) exhibited the capability of identifying the type of surrounding vehicles through their appearances.
After reading the written scenarios and understanding the corresponding driving scenario through the scene graphs, the respondents were asked to select the preferred options measuring their behavior choice. The specific descriptions and behavior options for the five driving scenarios are summarized in Table 5.
Table 5.
The hypothetical scenarios when driving in mixed traffic.
5. Results and Discussion
5.1. Cluster Analysis
5.1.1. Latent Profile Cluster Identification
The LPA was performed using the Mplus software (version 7.0). Model fit information was examined to determine the number of clusters, as shown in Table 6. As depicted in Table 6, the results of AIC, BIC, aBIC declined with the increase in the cluster number, while the decreasing trends of the three criteria turned out to be gentle after three clusters. Also, the three clusters’ LMR < 0.05 and the entropy approached 1. As indicated by the above result, three was the satisfying cluster number for this study. Hence, the human drivers fell into three clusters for their psychological characteristics when facing CAVs.
Table 6.
Model fit based on the number of clusters.
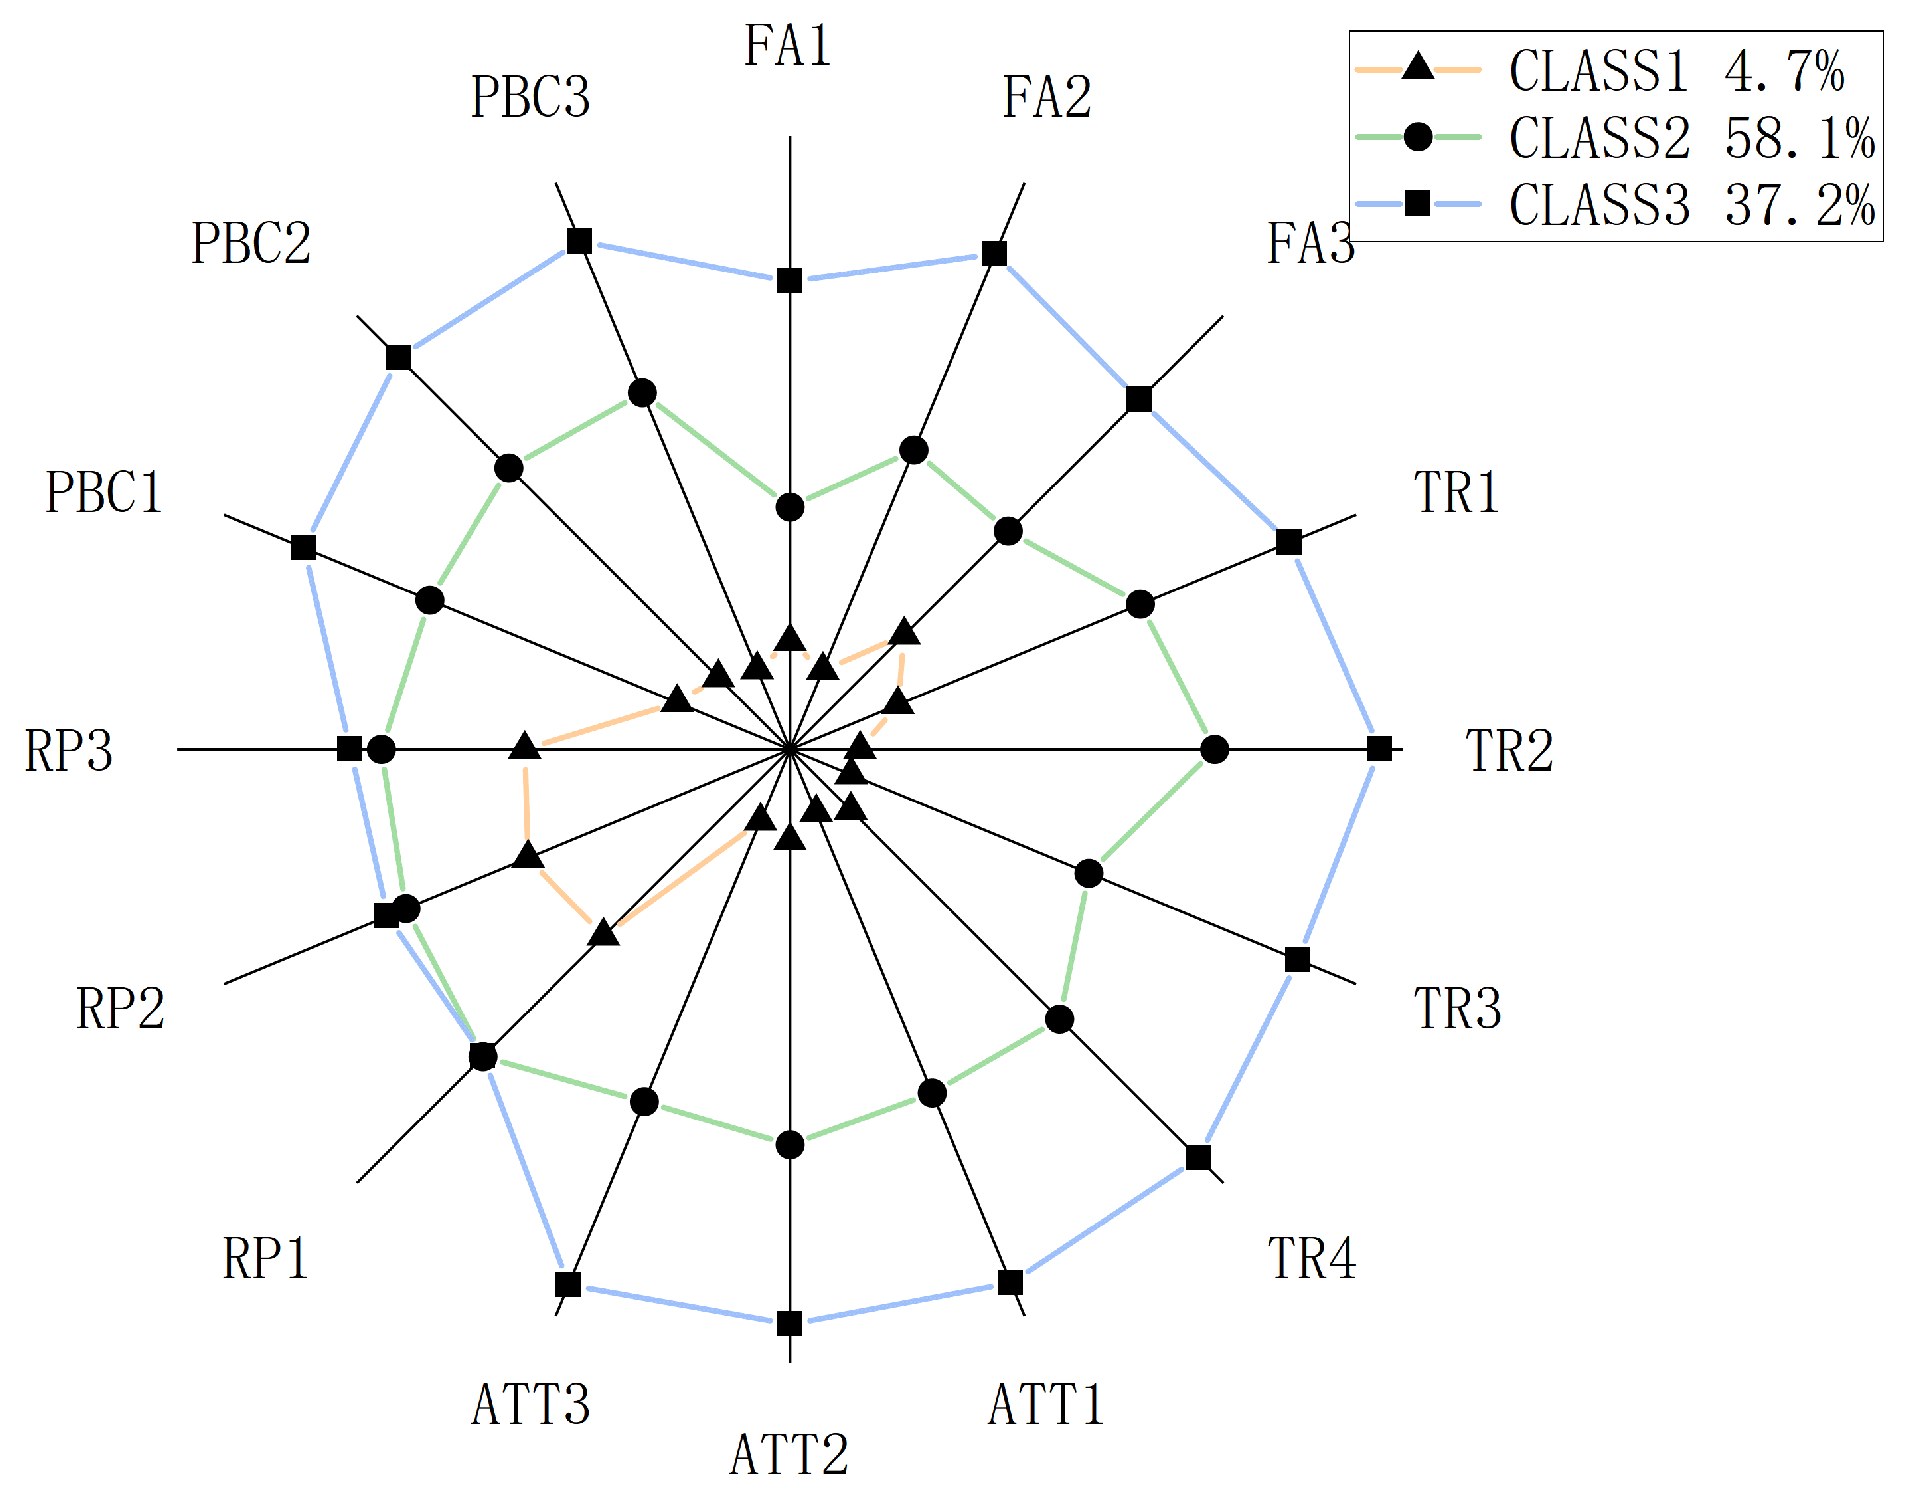
The scores of the observed variables for the different clusters are graphically presented in Figure 1. Moreover, the mean and variance of the five latent variables (i.e., FA, TR, ATT, RP, and PBC) were investigated in depth based on the analysis of variance (ANOVA) from Table 7. The results further confirmed that significant differences were reported among the three clusters in the latent variables, suggesting reasonable latent profile analysis results.
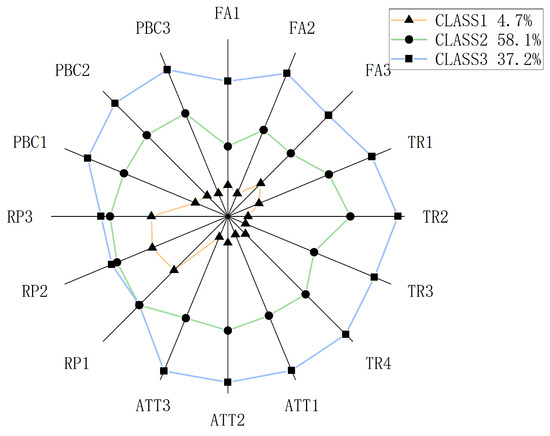
Figure 1.
Observed variable scores of different latent classes.
Table 7.
The mean and variance of the five latent variables.
According to the observed variable scores and the value of latent variables, we named the three clusters as follows:
Cluster 1 (4.7% of the sample): “Negative individuals”. The smallest cluster had the lowest average of all five latent variables in comparison to the other two clusters, indicating little understanding of CAVs, suspicion of CAV performance, and the most passive attitude towards sharing the same road as CAVs. In addition, this cluster had poor risk awareness and confidence when driving on a road of HDVs mixed with CAVs.
Cluster 2 (58.1% of the sample): “Neutral individuals”. This cluster can be regarded as neutral-minded and conservative. Even though they had a neutral outlook in relation to familiarity, trust, attitude and perceived behavior control, they had relatively strong risk awareness when sharing the same road as CAVs.
Cluster 3 (37.2% of the sample): “Positive individuals”. This cluster had the highest familiarity and trust in CAVs, and had the most optimistic attitude towards sharing the same road as CAVs. In addition, this cluster had the strongest risk awareness and confidence when driving on the road mixed with CAVs.
5.1.2. Latent Profile Descriptive Associations
We performed multinomial regression analysis using IBM SPSS Statistics 26 to identify factors for driver classification. The following independent variables were tested in the MNL model: gender, age, monthly income, the highest level of education, driving experience, annual driving mileage, and CAV experience. Table 8 presents the multinomial regression results and uses the “neutral” cluster as the reference group. A detailed discussion about the coefficients of the attributes follows.
Table 8.
Multinomial logistic regression—the effects of socio-demographic characteristics.
As depicted in Table 8, the gender, age, highest level of education and annual driving mileage parameters did not achieve statistical significance, suggesting that no difference in the distribution of the above-described socio-demographic characteristics was found within the clusters. In other words, the above-mentioned factors did not result in the heterogeneity of psychological characteristics when facing the CAVs.
Regarding the effects of monthly income, the results indicated that compared to the respondents with a relatively high income (over 30,000 RMB per month), the respondents with a low income (less than RMB 5000 per month) and middle income (RMB 5000~10,000 per month) were more likely to be negative towards CAVs (cluster 1). Regarding the effects of the driving experience, compared with the respondents with 1~5 years of driving experience, those who had driven for over 10 years were significantly more likely to be negative towards CAVs (cluster 1). As revealed by the above result, drivers who had been driving in the conventional traffic for a long time would face more difficulty adapting to a novel traffic system mixed with CAVs and HDVs. Regarding the effects of the CAV experience, compared to the respondents without CAV experience, those who had driven or taken a CAV were more likely to be in the positive cluster. Accordingly, the practical experience of CAV performance and driving mode can allow HDV drivers to trust CAVs and acquire in-depth understanding about CAVs, making them more willing to share roads with CAVs and more confident in driving in mixed traffic.
5.2. Cluster-Based Choice Behavior Analysis
In this subsection, MNL was adopted to explore the correlation between the individual clusters and their behavioral choices in different driving scenarios. Table 9 list the modeling results.
Table 9.
The behavior choice for different clusters in car-following willingness.
For car-following willingness, option C, “Regardless of the type of front vehicle, if the driving demand cannot be met, the intention of changing lanes will be generated; otherwise, I will continue to drive on the current lane”, was employed as the reference group. As depicted in Table 9, when a CAV served as the leading vehicle, positive individuals were more likely to keep following in comparison to the neutral individuals. The major reason for the above result is that positive individuals trusted the performance of the CAVs and showed strong confidence in their driving ability when sharing the same road as CAVs.
For the car-following distance, option B, “No difference with the leading vehicle is HDV”, was employed as the reference group. As depicted in Table 10, no significant correlation was reported between an individual cluster and the choice of car-following distance when a CAV served as the leading vehicle. This result was consistent with the conclusion of the field experiment in ref. [58], suggesting that no significant difference was reported in the headway when a CAV was followed compared with the result when an HDV was followed.
Table 10.
The behavior choice for different clusters in car-following distance.
For lane-changing intention under the effect of a CAV platoon, option B, “Decelerate to change lanes and drive behind the CAV platoon”, was assigned to the reference group. As depicted in Table 11, compared with positive individuals, negative individuals had a higher possibility of giving up changing lanes when finding a CAV platoon in the target lane. The major reason for the above result is their distrust of the safety and stability of a CAV platoon. In addition, if lanes were changed, negative individuals and neutral individuals turned out to be more likely to accelerate and switch to the position in front of the CAV platoon, suggesting that they preferred driving in front of the CAV platoon.
Table 11.
The behavior choice for different clusters in lane-changing intention when facing a CAV platoon.
As depicted in Table 12, in the lane-changing process, when CAVs served as the rear vehicles in the target lane, negative individuals were more likely to increase the requirements for vehicle spacing compared with when HDVs were the rear vehicles in the target lane. When CAVs served as the leading vehicles in the target lane, as depicted in Table 13, compared with the neutral individuals, positive individuals were more likely to lift the requirements for vehicle spacing compared with when HDVs were the leading vehicles in the target lane. As revealed by the above result, when interacting with CAVs, positive individuals exploited the CAV’s technological advantages and defensive programming in the lane-changing scenario.
Table 12.
The behavior choice for different clusters in rear critical gap for lane changing.
Table 13.
The behavior choice for different clusters in front critical gap for lane changing.
6. Conclusions
This study provided insights into how HDV drivers perceive and interact with CAVs on the road. First, five psychological parameters of HDV drivers facing CAVs were identified in accordance with the theory of planned behavior. As indicated by the result of the latent profile analysis, three heterogenous individual clusters were identified (i.e., negative individuals, neutral individuals, and positive individuals). The psychological characteristics of the respective cluster were defined following an ANOVA. Negative individuals were likely to gain few insights into CAVs, had suspicion of CAV performance, and had the most passive attitude towards sharing the same road as CAVs. And this cluster had poor risk awareness and confidence when driving on the road mixed with CAVs. The neutral individuals have an average of neutral in relation to most of the psychological variables, and they had relatively strong risk awareness when sharing the same road as CAVs. Positive individuals, obviously, had the highest familiarity and trust in the CAVs and the most optimistic attitude towards sharing the same road as CAVs. Second, using a multinomial logistic regression model, we investigated the correlation between the latent clusters and socio-demographic variables. The results showed that gender, age, the highest level of education and annual driving mileage parameters were not statistically significant. In terms of income, the respondents with a low income (less than RMB 5000 per month) and middle income (RMB 5000~10,000 per month) were more likely to be negative towards CAVs. In terms of the effects of driving experience, the drivers who had driven for more than ten years were significantly more likely to be negative towards CAVs. In addition, the drivers who had driven or taken a CAV were more likely to be in the positive cluster. Lastly, cluster-based choice behaviors in five interacting driving scenarios were analyzed based on multinomial logistic regression. The result suggested that positive individuals had stronger car-following willingness when the leading vehicle was a CAV. When noticing a CAV platoon driving in the target lane, negative individuals were more likely to give up on changing lanes. In addition, if lanes were changed, negative individuals and neutral individuals were more likely to accelerate and drive in front of the CAV platoon. When realizing the leading or rear vehicles in the target lane were CAVs during the lane-changing process, negative individuals were more likely to increase the requirement for the vehicle spacing while positive individuals would reduce the corresponding requirement. Notably, no significant differences was reported in the car-following distances between the above-described three clusters, consistent with the field test results [58].
This study revealed the factors for HDV drivers’ subjective feelings towards CAVs. The results confirmed that the choice behavior under an interactive driving scenarios can be significantly affected by a drivers’ psychological characteristics when they face CAVs. The findings, to a certain extent, have vital policy significance for government agencies and CAV producers.
- (1)
- Education for HDV drivers
One of the major concerns regarding CAVs is how CAVs are promoted and how well people understand CAVs. Thus, HDV drivers should realize the safety and other potential benefits that CAVs may provide. Government agencies could make promotional videos or brochures to introduce a CAV’s advanced techniques and driving performance for drivers with different level of driving experience. CAV producers should create opportunities for the public to experience autonomous vehicles to help drivers gain insights into CAVs following their practical experience.
- (2)
- Lane management strategies
From a policy perspective, many uncertain risks will be generated related to the high level of interaction between CAVs and HDVs. For instance, Favarò et al. (2017) [71] analyzed accident reports from the California DMV and suggested rear-end collisions as the most frequent type of accident arising from HDV–CAV interactions. Thus, a strategy for separating HDVs and CAVs should be developed. Effective access control should also be devised for dedicated lanes. In addition, it was also found in the study that negative individuals were more likely to give up changing lanes when realizing that a CAV platoon was driving in the target lane. As an example, we believe that CAV-dedicated lanes could be set up if CAVs, at a certain penetration rate, are forming CAV platoons.
- (3)
- Control strategies for CAVs
Even though experimental conditions cannot predict the intended behavior of a respective type of human driver exactly, HDV–CAV interactions should be considered when developing operation strategies of CAVs. For instance, designers and engineers are capable of designing different ACC systems for a CAV when facing different interacting vehicles (e.g., maintaining an appropriate speed); for example, when the CAV senses that the interacting vehicle is an HDV, it avoids frequent acceleration and deceleration with the aim of ensuring the comfortable driving of HDVs.
7. Limitations and Future Research
This study has confronted a notable constraint concerning sample provenance. Despite the perceived diversity and reliability of online participants, the sample distribution exhibited disparities when compared to the broader population. Furthermore, to comprehensively investigate interactions between HDV drivers and CAVs under diverse cultural contexts, varied driving environments, and distinct CAV experiences, subsequent research will demand more expansive and diversified samples encompassing a spectrum of demographic variables. Another limitation of this study lies in the hypothetical driving scenarios used in the questionnaire survey, which may only have captured surface-level feelings and behavioral intentions of the individuals. To delve deeper into this issue, future work plans include adopting more realistic experimental methods, such as conducting driving simulator experiments or field tests.
Author Contributions
Study conception and design: D.K. and M.W.; data collection: L.S., Q.W. and K.Z.; analysis and interpretation of results: M.W. and X.Z.; draft manuscript preparation: D.K. and M.W. All authors have read and agreed to the published version of the manuscript.
Funding
This research was funded by The National Natural Science Foundation of China, grant number 52302373, Beijing Municipal Education Commission Science and Technology Program General Project, grant number KM202110005002, Beijing Natural Science Foundation, grant number L231023, Beijing Nova Program, grant number 20230484443, Tianjin Transportation Technology Development Surface Project, grant number 2024-B05, and The APC was funded by The National Natural Science Foundation of China.
Institutional Review Board Statement
Not applicable.
Informed Consent Statement
Informed consent was obtained from all subjects involved in the study.
Data Availability Statement
For inquiries related to the availability of the original data, please contact the corresponding author.
Conflicts of Interest
The authors declare no conflicts of interest.
References
- Shladover, S.E. Connected and automated vehicle systems: Introduction and overview. J. Intell. Transp. Syst. 2018, 22, 190–200. [Google Scholar] [CrossRef]
- Carrone, A.P.; Rich, J.; Vandet, C.A.; An, K. Autonomous vehicles in mixed motorway traffic: Capacity utilisation, impact and policy implications. Transportation 2021, 48, 2907–2938. [Google Scholar] [CrossRef]
- Yao, Z.; Hu, R.; Jiang, Y.; Xu, T. Stability and safety evaluation of mixed traffic flow with connected automated vehicles on expressways. J. Saf. Res. 2020, 75, 262–274. [Google Scholar] [CrossRef]
- Jin, S.; Sun, D.H.; Zhao, M.; Li, Y.; Chen, J. Modeling and stability analysis of mixed traffic with conventional and connected automated vehicles from cyber physical perspective. Phys. A Stat. Mech. Its Appl. 2020, 551, 124217. [Google Scholar] [CrossRef]
- Zhu, W.X.; Zhang, H.M. Analysis of mixed traffic flow with human-driving and autonomous cars based on car-following model. Phys. A Stat. Mech. Its Appl. 2018, 496, 274–285. [Google Scholar] [CrossRef]
- Cao, Z.; Lu, L.; Chen, C.; Chen, X.U. Modeling and simulating urban traffic flow mixed with regular and connected vehicles. IEEE Access 2021, 9, 10392–10399. [Google Scholar] [CrossRef]
- Ozkan, M.F.; Ma, Y. Modeling driver behavior in car-following interactions with automated and human-driven vehicles and energy efficiency evaluation. IEEE Access 2021, 9, 64696–64707. [Google Scholar] [CrossRef]
- Treiber, M.; Kesting, A. Traffic Flow Dynamics: Data, Models and Simulation; Springer: Berlin/Heidelberg, Germany, 2013; pp. 983–1000. [Google Scholar] [CrossRef]
- Petrović, Đ.; Mijailović, R.; Pešić, D. Traffic accidents with autonomous vehicles: Type of collisions, manoeuvres and errors of conventional vehicles’ drivers. Transp. Res. Procedia 2020, 45, 161–168. [Google Scholar] [CrossRef]
- Miqdady, T.; de Oña, R.; de Oña, J. In search of severity dimensions of traffic conflicts for different simulated mixed fleets involving connected and autonomous vehicles. J. Adv. Transp. 2023, 2023, 4116108. [Google Scholar] [CrossRef]
- Adewale, A.; Lee, C. Prediction of car-following behavior of autonomous vehicle and human-driven vehicle based on drivers’ memory and cooperation with lead vehicle. Transp. Res. Rec. 2023, 0, 03611981231195051. [Google Scholar] [CrossRef]
- Wei, S.; Shao, M. Existence of connected and autonomous vehicles in mixed traffic: Impacts on safety and environment. Traffic Inj. Prev. 2023, 25, 1–10. [Google Scholar] [CrossRef]
- Sharma, I.; Mishra, S. Ranking preferences towards adopting autonomous vehicles based on peer inputs and advertisements. Transportation 2023, 50, 2139–2192. [Google Scholar] [CrossRef]
- Stange, V.; Kühn, M.; Vollrath, M. Manual drivers’ experience and driving behavior in repeated interactions with automated Level 3 vehicles in mixed traffic on the highway. Transp. Res. Part F Traffic Psychol. Behav. 2022, 87, 426–443. [Google Scholar] [CrossRef]
- Manchon, J.B.; Bueno, M.; Navarro, J. From manual to automated driving: How does trust evolve? Theor. Issues Ergon. Sci. 2021, 22, 528–554. [Google Scholar] [CrossRef]
- Zhang, Q.; Zhang, T.; Ma, L. Human acceptance of autonomous vehicles: Research status and prospects. Int. J. Ind. Ergon. 2023, 95, 103458. [Google Scholar] [CrossRef]
- Lee, J.D.; See, K.A. Trust in automation: Designing for appropriate reliance. Hum. Factors 2004, 46, 50–80. [Google Scholar] [CrossRef] [PubMed]
- Feldhütter, A.; Gold, C.; Hüger, A.; Bengler, K. Trust in automation as a matter of media influence and experi-ence of automated vehicles. In Proceedings of the Human Factors and Ergonomics Society Annual Meeting, Los Angeles, CA, USA, 8 September 2016. [Google Scholar] [CrossRef]
- Velasco, J.P.N.; Farah, H.; van Arem, B.; Hagenzieker, M.P. Studying pedestrians’ crossing behavior when interacting with automated vehicles using virtual reality. Transp. Res. Part F Traffic Psychol. Behav. 2019, 66, 1–14. [Google Scholar] [CrossRef]
- Hagenzieker, M.P.; Van Der Kint, S.; Vissers, L.; Van Schagen, I.N.G.; De Bruin, J.; Van Gent, P.; Commandeur, J.J. Interactions between cyclists and automated vehicles: Results of a photo experiment. Transp. Saf. Secur. 2020, 12, 94–115. [Google Scholar] [CrossRef]
- Vlakveld, W.; van der Kint, S.; Hagenzieker, M.P. Cyclists’ intentions to yield for automated cars at intersections when they have right of way: Results of an experiment using high-quality video animations. Transp. Res. Part F Traffic Psychol. Behav. 2020, 71, 288–307. [Google Scholar] [CrossRef]
- Ward, C.; Raue, M.; Lee, C.; D’Ambrosio, L.; Coughlin, J.F. Acceptance of automated driving across generations: The role of risk and benefit perception, knowledge, and trust. In Proceedings of the Human-Computer Interaction. User Interface Design, Development and Multimodality: 19th International, Vancouver, BC, Canada, 9–14 July 2017. [Google Scholar] [CrossRef]
- Molnar, L.J.; Ryan, L.H.; Pradhan, A.K.; Eby, D.W.; Louis, R.M.S.; Zakrajsek, J.S. Understanding trust and acceptance of automated vehicles: An exploratory simulator study of transfer of control between automated and manual driving. Transp. Res. Part F Traffic Psychol. Behav. 2018, 58, 319–328. [Google Scholar] [CrossRef]
- Schwarz, C.; Gaspar, J.; Brown, T. The effect of reliability on drivers’ trust and behavior in conditional automation. Cogn. Technol. Work 2019, 21, 41–54. [Google Scholar] [CrossRef]
- Lee, J.; Kim, N.; Imm, C.; Kim, B.; Yi, K.; Kim, J. A question of trust: An ethnographic study of automated cars on real roads. In Proceedings of the 8th International Conference on Automotive User Interfaces and Interactive Vehicular Applications, Ann Arbor, MI, USA, 24–26 October 2016. [Google Scholar] [CrossRef]
- Choi, J.K.; Ji, Y.G. Investigating the importance of trust on adopting an autonomous vehicle. Int. J. Hum.-Comput. Interact. 2015, 31, 692–702. [Google Scholar] [CrossRef]
- Zhang, Q.; Yang, X.J.; Robert, L.P. Expectations and trust in automated vehicles. In Proceedings of the Extended Abstracts of the 2020 CHI Conference on Human Factors in Computing Systems, Honolulu, HI, USA, 25–30 April 2020. [Google Scholar] [CrossRef]
- Zong, S. How Connected Autonomous Vehicles Would Affect Our World?—A Literature Review on the Impacts of CAV on Road Capacity, Environment and Public Attitude. In Proceedings of the 2019 7th International Conference on Traffic and Logistic Engineering (ICTLE 2019), Paris, France, 21–23 August 2019. [Google Scholar] [CrossRef]
- Lamotte, R.; De Palma, A.; Geroliminis, N. On the use of reservation-based autonomous vehicles for demand management. Transp. Res. Part B Methodol. 2017, 99, 205–227. [Google Scholar] [CrossRef]
- Pettigrew, S.; Dana, L.M.; Norman, R. Clusters of potential autonomous vehicles users according to propensity to use individual versus shared vehicles. Transp. Policy 2019, 76, 13–20. [Google Scholar] [CrossRef]
- Hardman, S.; Berliner, R.; Tal, G. Who will be the early adopters of automated vehicles? Insights from a survey of electric vehicle owners in the United States. Transp. Res. Part D Transp. Environ. 2019, 71, 248–264. [Google Scholar] [CrossRef]
- Hulse, L.M.; Xie, H.; Galea, E.R. Perceptions of autonomous vehicles: Relationships with road users, risk, gender and age. Saf. Sci. 2018, 102, 1–13. [Google Scholar] [CrossRef]
- Sela, Y.; Amichai-Hamburger, Y. “Baby, I Can’t Drive My Car”: How Controllability Mediates the Relationship between Personality and the Acceptance of Autonomous Vehicles. Int. J. Hum.-Comput. Int. 2023, 39, 1–11. [Google Scholar] [CrossRef]
- Nielsen, T.A.S.; Haustein, S. On sceptics and enthusiasts: What are the expectations towards self-driving cars? Transp. Pol. 2018, 66, 49–55. [Google Scholar] [CrossRef]
- Anania, E.C.; Rice, S.; Walters, N.W.; Pierce, M.; Winter, S.R.; Milner, M.N. The effects of positive and negative information on consumers’ willingness to ride in a driverless vehicle. Transp. Pol. 2018, 72, 218–224. [Google Scholar] [CrossRef]
- Liu, P.; Ma, Y.; Zuo, Y. Self-driving vehicles: Are people willing to trade risks for environmental benefits? Transp. Res. A Policy Pract. 2019, 125, 139–149. [Google Scholar] [CrossRef]
- Liu, P.; Xu, Z.; Zhao, X. Road tests of self-driving vehicles: Affective and cognitive pathways in acceptance formation. Transp. Res. A Policy Pract. 2019, 124, 354–369. [Google Scholar] [CrossRef]
- Penmetsa, P.; Adanu, E.K.; Wood, D.; Wang, T.; Jones, S.L. Perceptions and expectations of autonomous vehicles–A snapshot of vulnerable road user opinion. Technol. Forecast. Soc. Chang. 2019, 143, 9–13. [Google Scholar] [CrossRef]
- Liu, P.; Guo, Q.; Ren, F.; Wang, L.; Xu, Z. Willingness to pay for self-driving vehicles: Influences of demographic and psychological factors. Transp. Res. Part C Emerg. Technol. 2019, 100, 306–317. [Google Scholar] [CrossRef]
- Sharma, A.; Ali, Y.; Saifuzzaman, M.; Zheng, Z.; Haque, M.M. Human factors in modelling mixed traffic of traditional, connected, and automated vehicles. In Proceedings of the AHFE 2017 International Conference on Human Factors in Simulation and Modeling, Los Angeles, CA, USA, 17–21 July 2017. [Google Scholar] [CrossRef]
- Dennis, S.; Paz, A.; Yigitcanlar, T. Perceptions and attitudes towards the deployment of autonomous and connected vehicles: Insights from Las Vegas, Nevada. J. Urban Technol. 2021, 28, 75–95. [Google Scholar] [CrossRef]
- Li, W.; Wu, G.; Yao, D.; Zhang, Y.; Barth, M.J.; Boriboonsomsin, K. Stated acceptance and behavioral responses of drivers towards innovative connected vehicle applications. Accid. Anal. Prev. 2021, 155, 106095. [Google Scholar] [CrossRef]
- Othman, K. Exploring the evolution of public acceptance towards autonomous vehicles with the level of knowledge. Innov. Infrastruct. Solut. 2023, 8, 208. [Google Scholar] [CrossRef]
- Liu, P.; Yang, R.; Xu, Z. Public acceptance of fully automated driving: Effects of social trust and risk/benefit perceptions. Risk Anal. 2019, 39, 326–341. [Google Scholar] [CrossRef] [PubMed]
- O’Hern, S.; Louis, R.S. Technology readiness and intentions to use conditionally automated vehicles. Transp. Res. Part F Traffic Psychol. Behav. 2023, 94, 1–8. [Google Scholar] [CrossRef]
- Talebian, A.; Mishra, S. Predicting the adoption of connected autonomous vehicles: A new approach based on the theory of diffusion of innovations. Transp. Res. Part C Emerg. Technol. 2018, 95, 363–380. [Google Scholar] [CrossRef]
- Bansal, P.; Kockelman, K.M. Forecasting Americans’ long-term adoption of connected and autonomous vehicle technologies. Transp. Res. Part A Policy Pract. 2017, 95, 49–63. [Google Scholar] [CrossRef]
- Rezaei, A.; Cao, M.; Liu, Q.; De Vos, J. Synthesising the Existing Literature on the Market Acceptance of Autonomous Vehicles and the External Underlying Factors. J. Adv. Transp. 2023, 2023, 6065060. [Google Scholar] [CrossRef]
- Nordhoff, S.; Kyriakidis, M.; Van Arem, B.; Happee, R. A multi-level model on automated vehicle acceptance (MAVA): A review-based study. Theor. Issues Ergon. Sci. 2019, 20, 682–710. [Google Scholar] [CrossRef]
- Chee, P.N.E.; Susilo, Y.O.; Wong, Y.D.; Pernestål, A. Which factors affect willingness-to-pay for automated vehicle services? Evidence from public road deployment in Stockholm, Sweden. Eur. Transp. Res. Rev. 2020, 12, 20. [Google Scholar] [CrossRef]
- Buckley, L.; Kaye, S.A.; Pradhan, A.K. Psychosocial factors associated with intended use of automated vehicles: A simulated driving study. Accid. Anal. Prev. 2018, 115, 202–208. [Google Scholar] [CrossRef]
- Li, G.; Liang, Y.; Wang, H.; Chen, J.; Chang, X. Factors influencing users’ willingness to adopt connected and autonomous vehicles: Net and configurational effects analysis using PLS-SEM and FsQCA. J. Adv. Transp. 2022, 2022, 7489897. [Google Scholar] [CrossRef]
- Tanveer, M.; Kashmiri, F.A.; Naeem, H.; Yan, H.; Qi, X.; Rizvi, S.M.A.; Wang, T.; Lu, H. An assessment of age and gender characteristics of mixed traffic with autonomous and manual vehicles: A cellular automata approach. Sustainability 2020, 12, 2922. [Google Scholar] [CrossRef]
- Mahdinia, I.; Mohammadnazar, A.; Arvin, R.; Khattak, A.J. Integration of automated vehicles in mixed traffic: Evaluating changes in performance of following human-driven vehicles. Accid. Anal. Prev. 2021, 152, 106006. [Google Scholar] [CrossRef]
- Stern, R.E.; Cui, S.; Delle Monache, M.L.; Bhadani, R.; Bunting, M.; Churchill, M.; Hamilton, N.; Haulcy, R.; Pohlmann, H.; Wu, F.; et al. Dissipation of stop-and-go waves via control of autonomous vehicles: Field experiments. Transp. Res. Part C Emerg. Technol. 2018, 89, 205–221. [Google Scholar] [CrossRef]
- Rahmati, Y.; Khajeh Hosseini, M.; Talebpour, A.; Swain, B.; Nelson, C. Influence of autonomous vehicles on car-following behavior of human drivers. Transp. Res. Record. 2019, 2673, 367–379. [Google Scholar] [CrossRef]
- Zhao, X.; Wang, Z.; Xu, Z.; Wang, Y.; Li, X.; Qu, X. Field experiments on longitudinal characteristics of human driver behavior following an autonomous vehicle. Transp. Res. Part C Emerg. Technol. 2020, 114, 205–224. [Google Scholar] [CrossRef]
- Soni, S.; Reddy, N.; Tsapi, A.; van Arem, B.; Farah, H. Behavioral adaptations of human drivers interacting with automated vehicles. Transp. Res. Part F Traffic Psychol. Behav. 2022, 86, 48–64. [Google Scholar] [CrossRef]
- Rad, S.R.; Farah, H.; Taale, H.; van Arem, B.; Hoogendoorn, S.P. The impact of a dedicated lane for connected and automated vehicles on the behaviour of drivers of manual vehicles. Transp. Res. Part F Traffic Psychol. Behav. 2021, 82, 141–153. [Google Scholar] [CrossRef]
- Lee, S.; Oh, C.; Hong, S. Exploring lane change safety issues for manually driven vehicles in vehicle platooning environments. IET Intell. Transp. Syst. 2018, 12, 1142–1147. [Google Scholar] [CrossRef]
- Schoenmakers, M.; Yang, D.; Farah, H. Car-following behavioural adaptation when driving next to automated vehicles on a dedicated lane on motorways: A driving simulator study in the Netherlands. Transp. Res. Part F Traffic Psychol. Behav. 2021, 78, 119–129. [Google Scholar] [CrossRef]
- Gouy, M.; Wiedemann, K.; Stevens, A.; Brunett, G.; Reed, N. Driving next to automated vehicle platoons: How do short time headways influence non-platoon drivers’ longitudinal control? Transp. Res. Part F Traffic Psychol. Behav. 2014, 27, 264–273. [Google Scholar] [CrossRef]
- Trende, A.; Unni, A.; Weber, L.; Rieger, J.W.; Luedtke, A. An investigation into human-autonomous vs. human-human vehicle interaction in time-critical situations. In Proceedings of the 12th ACM International Conference on PErvasive Technologies Related to Assistive Environments, New York, NY, USA, 5–7 June 2019. [Google Scholar] [CrossRef]
- Zhou, A.; Liu, Y.; Tenenboim, E.; Agrawal, S.; Peeta, S. Car-Following Behavior of Human-Driven Vehicles in Mixed-Flow Traffic: A Driving Simulator Study. IEEE Trans. Intell. Veh. 2023, 8, 2661–2673. [Google Scholar] [CrossRef]
- Liu, P.; Du, Y.; Wang, L.; Da Young, J. Ready to bully automated vehicles on public roads? Accid. Anal. Prev. 2020, 137, 105457. [Google Scholar] [CrossRef]
- Lee, Y.C.; Momen, A.; LaFreniere, J. Attributions of social interactions: Driving among self-driving vs. conventional vehicles. Technol. Soc. 2021, 66, 101631. [Google Scholar] [CrossRef]
- Ma, Z.; Zhang, Y. Driver-Automated Vehicle Interaction in Mixed Traffic: Types of Interaction and Drivers’ Driving Styles. Hum. Factors 2022, 66, 544–561. [Google Scholar] [CrossRef]
- Ferguson, S.L.; Moore, E.W.G.; Hull, D.M. Finding latent groups in observed data: A primer on latent profile analysis in Mplus for applied researchers. Int. J. Behav. Dev. 2020, 44, 458–468. [Google Scholar] [CrossRef]
- Spurk, D.; Hirschi, A.; Wang, M.; Valero, D.; Kauffeld, S. Latent profile analysis: A review and “how to” guide of its application within vocational behavior research. J. Vocat. Behav. 2020, 120, 103445. [Google Scholar] [CrossRef]
- Liu, P.; Fan, W. Exploring injury severity in head-on crashes using latent class clustering analysis and mixed logit model: A case study of North Carolina. Accid. Anal. Prev. 2020, 135, 105388. [Google Scholar] [CrossRef] [PubMed]
- Favarò, F.M.; Nader, N.; Eurich, S.O.; Tripp, M.; Varadaraju, N. Examining accident reports involving autonomous vehicles in California. PLoS ONE 2017, 12, e0184952. [Google Scholar] [CrossRef] [PubMed]

Disclaimer/Publisher’s Note: The statements, opinions and data contained in all publications are solely those of the individual author(s) and contributor(s) and not of MDPI and/or the editor(s). MDPI and/or the editor(s) disclaim responsibility for any injury to people or property resulting from any ideas, methods, instructions or products referred to in the content. |
© 2024 by the authors. Licensee MDPI, Basel, Switzerland. This article is an open access article distributed under the terms and conditions of the Creative Commons Attribution (CC BY) license (https://creativecommons.org/licenses/by/4.0/).