Article

A Pavement Crack Detection Method via Deep Learning and a Binocular-Vision-Based Unmanned Aerial Vehicle

1
Faculty of Civil Aviation and Aeronautics, Kunming University of Science and Technology, Kunming 650500, China
2
International Joint Laboratory for Green Construction and Intelligent Maintenance of Yunnan Province, Kunming 650500, China
3
Kunming Institute of Physics, Kunming 650223, China
4
Faculty of Civil Engineering and Mechanics, Kunming University of Science and Technology, Kunming 650500, China
*
Authors to whom correspondence should be addressed.
Appl. Sci. 2024, 14(5), 1778; https://doi.org/10.3390/app14051778
Submission received: 20 December 2023 / Revised: 9 February 2024 / Accepted: 19 February 2024 / Published: 22 February 2024

Abstract

:
This study aims to enhance pavement crack detection methods by integrating unmanned aerial vehicles (UAVs) with deep learning techniques. Current methods encounter challenges such as low accuracy, limited efficiency, and constrained application scenarios. We introduce an innovative approach that employs a UAV equipped with a binocular camera for identifying pavement surface cracks. This method is augmented by a binocular ranging algorithm combined with edge detection and skeleton extraction algorithms, enabling the quantification of crack widths without necessitating a preset shooting distance—a notable limitation in existing UAV crack detection applications. We developed an optimized model to enhance detection accuracy, incorporating the YOLOv5s network with an Efficient Channel Attention (ECA) mechanism. This model features a decoupled head structure, replacing the original coupled head structure to optimize detection performance, and utilizes a Generalized Intersection over Union (GIoU) loss function for refined bounding box predictions. Post identification, images within the bounding boxes are segmented by the Unet++ network to accurately quantify cracks. The efficacy of the proposed method was validated on roads in complex environments, achieving a mean Average Precision (mAP) of 86.32% for crack identification and localization with the improved model. This represents a 5.30% increase in the mAP and a 6.25% increase in recall compared to the baseline network. Quantitative results indicate that the measurement error margin for crack widths was 10%, fulfilling the practical requirements for pavement crack quantification.

1. Introduction

As road mileage increases, the need for meticulous road health inspections intensifies. Cracks, often the initial indicators of road deterioration, evolve dynamically due to material aging, traffic loading, and environmental factors. In road health monitoring, crack detection is pivotal, offering insights into a road’s current state and forecasting potential safety hazards and deterioration patterns. Consequently, profound research into crack detection methodologies and the advancement of precise, efficient crack identification and analysis tools are crucial for intelligent road inspection [1,2,3]. The accurate detection, localization, and width measurement of cracks are vital as different pavement conditions necessitate varied repair standards and urgency levels. Current crack detection methods, however, face significant challenges. Traditional manual inspections are labor-intensive, time-consuming, and often inefficient. The complexity and size of road networks further complicate accurate detection and quantitative analysis. In recent years, the development of unmanned aerial vehicle (UAV) technology and deep learning algorithms has opened new avenues for pavement crack detection [4,5,6,7]. UAVs, characterized by their speed, efficiency, compactness, high passability, and low risk, have gained prominence in construction defect detection. When combined with deep learning algorithms, such as convolutional neural networks, they excel in complex detection environments and in hazard identification. These technologies have sparked innovative detection approaches and have been substantiated in numerous studies.
Deep learning models, with their intricate network structures, adeptly learn and recognize various crack features from extensive datasets, exhibiting high flexibility and accuracy in identifying diverse crack types and sizes. Compared with traditional manual methods, deep learning substantially enhances the efficiency and speed of crack detection, reduces human resource dependence, and minimizes the likelihood of errors. Zhang et al. [8] pioneered the use of deep convolutional neural networks for crack detection and classification. Cha et al. [9] introduced a combination of convolutional neural networks (CNNs) and a sliding window technique for high-resolution crack imagery, advancing structural health detection. Jiang et al. [10] employed a novel optimization strategy including deeply differentiable convolution and inverse residual networks to significantly enhance concrete crack detection accuracy. Yang et al. [11] developed the Feature Pyramid and Hierarchical Boosting Network (FPHBN) for crack detection, which layers weights over nested samples to balance simple and complex sample contributions. Yun et al. [12] utilized a Generative Adversarial Network (GAN)-based data enhancement approach for crack images and employed an improved VGG network for enhanced accuracy. Rao et al. [13] designed a CNN-based method using non-overlapping windows to expedite crack detection and streamline analysis. Yu et al. [14] improved the Dempster–Shafer algorithm for handling conflicting CNN results, which boosted detection accuracy. Silva et al. [15] enhanced the VGG16 model and investigated various parameters’ impacts on detection outcomes. UAVs are in the spotlight due to their efficiency and flexibility in engineering inspections. They cover extensive areas rapidly and are equipped with high-resolution cameras and sensors for data precision. Duan et al. [16] developed a binocular-vision-based UAV platform for improved image recognition. Ma et al. [17] combined UAV remote sensing with binocular vision for precise power equipment detection. Shuai et al. [18] introduced a UAV-mounted binocular vision system for obstacle detection in power infrastructure. Gopalakrishnan et al. [19] utilized a transfer learning approach with a pre-trained VGG-16 network for building crack detection via a UAV. Lei et al. [20] proposed the Crack Central Point Method (CCPM), combining UAVs and digital image processing for robust bridge crack detection with limited data. Liu et al. [21] employed UAVs for high-rise-building crack detection, addressing motion blur with a GAN-based model. Although there have been significant advancements, the task of detecting pavement cracks remains challenging. Variations in image scale and complex background conditions contribute to the occurrence of leakage and misdetection.
Quantifying pavement crack sizes allows for an accurate assessment of a road’s current condition, which facilitates the implementation of preventive maintenance measures. Such measures not only prolong the road’s service life but also diminish long-term maintenance expenses. Regarding crack width measurement, Kim et al. [22] employed a hybrid image processing technique alongside a UAV equipped with ultrasonic displacement sensors, enabling working distance calculation and crack width estimation. Liu et al. [23] employed a deep learning approach to analyze signals from distributed fiber optic sensors, enhancing the efficiency of detecting spatially distributed cracks. However, the application of fiber optic sensors is not feasible for large-scale pavement crack detection. Park et al. [24] utilized deep learning and laser sensors in a structured light application for detecting and quantifying surface cracks in concrete structures based on the laser beam’s projection position on the surface. Yu et al. [25] achieved bridge crack identification, segmentation, and width calculation using a UAV with a monocular camera aided by a Mask R-CNN. Peng et al. [26] introduced a two-stage crack identification method combining a UAV with a laser range finder and image threshold segmentation for crack width determination. Zhou et al. [27] employed Faster R-CNN for crack region detection and used maximum entropy threshold segmentation and Canny edge detection to determine crack dimensions. Ding et al. [28] developed a method to quantify cracks in various measurement poses using a full-field-scale UAV gimbal camera, addressing the challenge of image measurement relative to markers. However, current crack quantization methods face issues of either insufficient accuracy or high equipment costs.
The existing research on pavement crack detection has achieved some progress, but the quantitative detection of cracks continues to encounter challenges. Firstly, pavement cracks exhibit a wide range of dimensional variations and often manifest in variable, complex backgrounds, posing difficulties for deep learning-based target detection algorithms. Secondly, in instances in which a photo contains multiple or exceedingly long cracks, using a single measured distance as the representative shooting distance for width calculation lacks precision. This paper introduces a novel crack-labeling method that employs a small frame overlay technique to accurately label and train a crack dataset. Additionally, a binocular ranging algorithm is used to determine the shooting distances to various crack segments. By precisely measuring the shooting depth, this approach significantly enhances the accuracy of crack width measurements, allowing for differentiated width calculations across various crack sections.

2. Materials and Methods

2.1. Overview of the YOLOv5 Algorithm

YOLOv5, an efficient and precise single-stage target detection network, was introduced by Glenn Jocher in 2020. It processes faster than two-stage networks and has become widely applied in various target detection tasks. We utilize the fastest YOLOv5s as the base model among the four versions provided by the small, medium, large, and extra-large models of YOLOv5. The network’s architecture comprises four main components, the input, backbone, neck, and head, as depicted in Figure 1.
The backbone, a critical component of YOLOv5s, efficiently extracts spatial features from input images. It primarily consists of the CBS (convolutional layer, batch Normalization, and SiLU activation function), C3 (three convolutional blocks), and SPPF (Spatial Pyramid Pooling Fast) modules. The CBS module lays the foundation for feature extraction and assists the C3 module. The C3 module further enhances the structural depth of the network. The SPPF module, an optimized version of the SPP, refines feature representation by reducing the pooling window scale and simplifying the process. Thus, the inference of the network model is accelerated. This design aids in extracting features at multiple scales while preserving the spatial hierarchy.
The neck structure, comprising the Feature Pyramid Network (FPN) and the Path Aggregation Network (PAN), processes feature maps of varying sizes obtained from the backbone. These features are fused and upsampled, generating new multi-scale feature maps for detecting objects of different sizes. The detection head uses anchor boxes to depict the confidence level and bounding box regression, and it generates a multi-dimensional array containing the target category, confidence level, and bounding box dimensions. The detection results are then refined using a confidence threshold and non-maximum suppression (NMS).
The integration of the FPN and PAN in YOLOv5s facilitates an effective fusion of top-down semantic and bottom-up positional information flows to enhance the network’s multi-scale target detection capability. This design allows YOLOv5s to efficiently predict targets of various sizes across different feature resolutions, making it suitable for computation-limited environments.

2.2. Improvements in YOLOv5s Network Model

A challenge in pavement crack detection is the significant variation in crack shape and size from image to image. The crack images in our constructed dataset have scale and shape diversity. The original YOLOv5s model, despite its obvious advantage in detection speed, does not perform well on targets with multiple scales and shapes. To solve this problem, we train model weights on the channel dimension of the feature layer extracted by the backbone network so that the network strengthens the part with pavement defects and weakens the useless information in the image. This strategy reduces the network’s focus on irrelevant image information, which improves the network’s feature extraction efficiency in complex contexts. We employ an enhanced YOLOv5s framework that integrates the ECA-Net (efficient channel attention network) [29], an improvement upon the Squeeze-and-Excite Network (SE-Net) [30]. This integration serves to reduce model complexity and dependence on dimensionality reduction.
We introduce a decoupled head structure for the independent optimization of dimension prediction and category confidence, enhancing model accuracy without extra computational load. The standard CIoU (Complete Intersection over Union) loss function is replaced with the GIoU (Generalized Intersection over Union) loss function to offer a more general metric for assessing target box overlap. The GIoU is particularly beneficial for targets with significant size variations. The above adjustments more effectively correct discrepancies between predicted and actual boxes.
Integrating the ECA attention mechanism, implementing a decoupled head structure, and utilizing the GIoU loss function result in a more efficient and robust YOLOv5s-based model. The proposed model significantly improves the accuracy of multi-scale pavement crack detection in complex real-world environments.

2.2.1. ECA Attention Mechanism

The ECA-Net captures cross-channel interactions with one-dimensional convolution instead of fully connected layers. The mechanism follows a principle of localized cross-channel interactions in which each channel only interacts with its k neighboring channels, and k is adaptively determined based on the number of channels. A one-dimensional convolution efficiently implements the process, which generates attention weights based on dependencies between channels. As illustrated in Figure 2, the ECA attention module initially conducts global average pooling on the feature maps of H × W × C, compressing each feature map of H × W × 1 into a single value, thereby yielding an output array of 1 × 1 × C. This process calculates the average response of each channel, capturing its global information. Subsequently, a 1D convolution with a kernel size of k is employed, effectively replacing the two fully connected layers found in the SE-Net.
The convolution kernel size of the ECA-Net is derived as an adaptive function of the number of input channels, as described in Equation (1). This equation calculates the logarithm of the channel count ( c ), adds the offset ( b ), and divides by r to adjust the scale. The resultant value ( k ) is obtained by taking the absolute value to obtain a non-negative number and then converting the non-negative number into the nearest odd number. The o d d in the equation denotes taking the nearest odd number. This approach effectively captures channel dependencies while maintaining a low level of computational complexity. It reduces the parameter count and the computational cost but preserves performance compared to the SE-Net.
k = φ ( c ) = | log s c + b r | o d d
Here, b and r are constants, typically set to b = 1 and r = 2 . Each channel’s weight is determined via the sigmoid activation function following the convolution operation. Convolution-shared weights are employed to further enhance network performance. This method efficiently captures the information of locally interacting channels while reducing the network’s parameters. The shared-weights approach is calculated in Equation (2).
ω i = σ ( j = 1 k W i j Y i j ) ,   Y i j Ω i k
Here, σ ( · ) represents the sigmoid activation function. W i j denotes the j th local weight matrix within the i th grouped weight matrix of the c channels, and Y i j is derived similarly. The final step involves multiplying the obtained weights by the original input feature map to generate a feature map with attention weights. The ECA-Net can amplify the weights of the effective channels, thus minimizing the loss of important information during the convolutional dimensionality reduction process.

2.2.2. Optimization of Network Structure and Loss Function

Object detection algorithms are usually divided into two different tasks: classification and localization. The classification task focuses on identifying texture and appearance features to determine objects’ categories, while the localization task aims to pinpoint the objects’ exact locations by accurately capturing edge information. Previous methods utilized a single feature map for both tasks, which may result in suboptimal performance due to the differing feature requirements of each task. The classification result depends on feature similarity to a specific class, whereas the localization task requires precise spatial coordinate predictions for bounding box adjustments. The previous approach often led to spatial misalignment between tasks as the feature needs of the classification and localization tasks may be different.
To address the above problems, we implemented a decoupled head structure which was initially introduced and validated in YOLOx [31]. As illustrated in Figure 3, this structure enables separate feature extraction pathways for classification and localization, and each pathway includes a custom-designed network layer. This design not only improves detection accuracy but also accelerates the convergence of network training and improves detection efficiency by focusing on the respective key features.
Crack detection in complex pavement scenes especially benefits from this decoupled head structure. The classification pathway can focus on identifying the essential features of cracks, significantly reducing the interference of complex backgrounds. Although the decoupled head provides different feature maps for the two tasks, it is designed to remain lightweight, which is critical for pavement crack detection systems that require real-time responses. Compared to conventional coupled heads, decoupled heads exhibit more efficient processing capabilities in terms of characterization requirements for different tasks, enhancing the classification and localization of objects. Furthermore, this structure efficiently preserves channel information through depth and breadth optimization, lowering computational demands and boosting network speed. Consequently, the decoupled head structure offers a solution for object detection, particularly in dynamic and intricate pavement environments.
In the original YOLOv5 model, the regression loss function of a bounding box is CIoU (Complete Intersection over Union) loss. The Unet++ network was chosen for further crack segmentation after object detection using YOLOv5s, and high recall is crucial. GIoU (Generalized Intersection over Union) shows superior performance with small-box annotations. Thus, the GIoU loss function is used in the improved YOLOv5s. These modifications enhance the model’s compatibility with small-bounding-box annotations and boost precision and recall in crack identification. The loss function is defined as shown in Equations (3)–(6):
L o s s C I o U = 1 I o U + ρ 2 ( b , b g t ) c 2 + a v
v = 4 π 2 ( t a n 1 w g t h g t t a n 1 w h ) 2
a = v ( 1 I o U ) + v
L G I o U = 1 I o U + | C ( A B ) | | C |
where the variables are defined as follows:
  • IoU (Intersection over Union) calculates the ratio of intersection to union between the predicted and actual boxes;
  • b represents the centroid of the predicted box, and b g t is the centroid of the actual box;
  • ρ denotes the Euclidean distance;
  • c is the length of the diagonal of the encompassing rectangle formed by both boxes;
  • α is the weight coefficient;
    v measures the aspect ratio discrepancy between the predicted and actual boxes.
The introduction of aspect ratio considerations in the CIoU loss function emphasizes the bounding box’s shape. However, this complexity leads to significant computational overhead during training and is less suited for crack prediction with the annotation of a small bounding box. Thus, we introduce GIoU loss (Equation (6)), which considers the smallest enclosing rectangle of both bounding boxes, resulting in a more stable loss value.

2.3. Binocular Distance Measurement Algorithm

Binocular vision leverages the parallax principle to ascertain the three-dimensional attributes of the object intended for measurement, utilizing images captured by left and right cameras. As illustrated in Figure 4, for any spatial point, both cameras simultaneously capture the point’s position, denoted as W . Based on the spatial positions xl and xr read by each camera, the position of spatial point W is calculated.
The 3D world coordinates of an object are projected onto the image plane and transformed into 2D image coordinates during camera imaging. Conversely, in the binocular vision 3D reconstruction process, the aim is to reverse this operation, reconstructing the object’s 3D world coordinates from its 2D image coordinates. This reconstruction necessitates utilizing parallax information from binocular cameras.
The positions of the imaging points captured by the left and right cameras in the image coordinate system require a spatial transformation matrix to map them into 3D world coordinates. This transformation hinges on the binocular cameras’ internal and external parameters. The internal parameters include the focal length, optical center, and lens aberration coefficient, characterizing the camera sensor’s imaging properties. The external parameters describe the camera’s position and orientation relative to the world coordinate system, incorporating the rotation matrix and the translation vector between the two cameras. The above parameters, which are crucial for 3D reconstruction, are obtainable through precise calibration. MATLAB 2020a’s Camera Calibration Toolbox is employed for this standard calibration, which involves capturing a series of images of a fixed calibration object (such as a checkerboard grid) to extract spatial geometric feature points and compute the camera’s internal and external parameters.
W ( X , Y , Z ) is considered a spatial point for which the imaging point in the pixel coordinate system is ( u ,   v ) and the model plane is Z = 0 . The parameters can be obtained by utilizing the checkerboard grid coordinates as the world coordinate system. They can be derived using Equation (7):
s [ u v 1 ] = A [ r 1 r 2 r 3 t ] [ X Y 0 1 ] = A [ r 1 r 21 r 3 ] [ X Y 1 ]
where the variables are defined as follows:
  • s represents the scale factor, indicating the mapping scale;
  • [ r 1 r 2 r 3 ]   denotes the rotation matrix between the camera coordinate system and the world coordinate system;
  • r 1   and r 2   are unit orthogonal vectors within the unit orthogonal matrix;
  • t symbolizes the translation vector of the camera coordinate system relative to the world coordinate system;
A is the camera parameter matrix, as shown in Equation (8).
A = ( f x 0 u 0 0 f y v 0 0 0 1 )
Here,   f x represents the number of pixels focused in the x-direction, and f y   signifies the number of pixels focused in the y-direction. The coordinates ( u 0 ,   v 0 ) denote the camera’s center point. Let H = [ r 1 r 21 t ] = [ h 1 h 2 h 3 ] to obtain Equations (9) and (10):
s [ u v 1 ] = H [ X Y 1 ]
{ h 1 T A T A 1 h 2 = 0 h 1 T A T A 1 h 1 = h 2 T A T A 1 h 2
The matrices for both the internal and external parameters can be obtained using Equations (7)–(10).
After calibration, we utilize functions from the OpenCV 4.5.5 library for image correction in the binocular system. Initially, parameters are fed into the cv2.stereoRectify() function, enabling the correction of images from both cameras to a nearly coplanar 2D plane. Subsequently, the cv2.initUndistortRectifyMap() function generates a mapping matrix for both image and distortion correction. Finally, the cv2.remap() function is utilized to accurately calibrate the images from the left and right cameras, ensuring the precision of the subsequent stereo matching. The binocular stereo-matching process employs the Semi-Global Block Matching (SGBM) algorithm [32], implemented in OpenCV. The SGBM algorithm incorporates both local pixel correlations and global visual information in its pixel-level matching, markedly enhancing the accuracy and robustness of the matching, particularly in areas with sparse or repetitive textures.
Since crack widths are usually narrow, the method of using similar triangles for width measurements after extracting feature points using a binocular camera may lead to significant errors. The accuracy of the measurements can be significantly improved by using a camera pinhole model. This model combines the focal length, shooting distance, and unit length of the sensor to calculate the physical dimensions of a pixel point at a specific shooting distance. Then, it calculates crack width based on the physical dimensions. The camera pinhole model is used to calculate the physical size of each pixel at the corresponding distance, as shown in Figure 5. The calculation is shown in Equations (11) and (12) after substituting the calibrated camera parameters:
m = f M D
M = w p D P c f
where the variables are defined as follows:
  • m represents the size of the object on the image plane;
  • f denotes the camera’s focal length;
  • M is the actual size of the object in the x-axis direction;
  • D is the distance from the object to the camera;
  • w p indicates the number of pixels in the object’s width;
  • P c refers to the number of pixels on the camera’s sensor corresponding to 1 cm.

2.4. Crack Segmentation and Quantification Method

Before quantizing cracks, the U-Net++ network [33] is used for fine crack image segmentation. U-Net++ is a deep learning image segmentation network based on a prototype of U-Net. It is optimized by introducing nested jump connections and a deep supervision mechanism. It maintains U-Net’s architecture, comprising an encoder and a decoder. The encoder features a 3 × 3 convolutional layer, a subsequent batch normalization layer, and a ReLU activation function for high-level semantic feature extraction. To reduce computational complexity, the encoder utilizes a 2 × 2 max pooling layer for downsampling. The decoder’s design is distinguished by its nested and dense jump connections, enabling the encoder’s outputs to connect not only to the corresponding decoder layer but also to all preceding decoder layers. The decoder upsamples the feature maps, matching the original image’s resolution, to produce precise pixel-level segmentation labels.
The above designs create a dense feature transfer network, facilitating full-scale feature utilization and enhancing the fusion of low- and high-level features. U-Net++ introduces a predictive output module at the encoder’s final layer to bolster model robustness and minimize over-segmentation risk. This module pre-determines the presence of target objects across the entire image region, thus reducing non-target region mis-segmentation. Furthermore, U-Net++ adopts an intensely supervised strategy with a custom composite loss function, which offers multi-scale training supervision to improve segmentation performance.
After image segmentation, potential edge contours are identified through a gradient strength and orientation analysis. A non-maximum suppression technique refines the edges, and a dual-thresholding approach distinguishes solid and weak edges, ensuring continuity and clarity. The distance transform algorithm calculates each pixel’s proximity to the nearest background pixel for extracted crack edges. This transform indicates the distance to the crack’s central region in crack detection and is equal to half the crack width. The crack width, as depicted in Figure 6, the shooting distance, and the binocular camera parameters can be input into Equation (12) to accurately calculate the actual crack width.

3. Implementation Details and Experimental Results

3.1. Production of Datasets

The dataset included 400 images of pavement cracks captured with the DJI Mavic 3 Drone from China and 3266 open-source crack images collected by Zhu [33]. In addition, an innovative strategy of crack annotation was introduced for precise identification and measurement.
Labelimg, an open-source annotation tool, was used to label cracks according to the small-bounding-box overlay method, as shown in Figure 7. This annotation method allowed us to cover the full length of a crack, marking the various parts of the crack by means of small, dense bounding boxes. This annotation strategy is designed to support binocular-vision-based ranging algorithms. Accurate distance measurements of different parts of a single long crack can improve the quantification accuracy of crack width. This meticulous annotation method allows for further analyses of the cracks’ spatial distribution characteristics.
The cracks needed to be segmented for quantitative analysis, and the algorithm used was U-Net++. The crack segmentation dataset was prepared by utilizing publicly available datasets. The dataset sources are detailed in Table 1, and they comprised a total of 2851 images. The images in the dataset underwent preprocessing to align with the network’s requirements, which included cropping and resizing to ensure a consistent resolution of 256 × 256 pixels for each image. Subsequently, a subset of 11,298 images was chosen from the preprocessed images to construct the segmentation dataset for our model training. This dataset was then partitioned into training, validation, and test sets, following an 8:1:1 ratio to facilitate model training and evaluation.

3.2. Experimental Environment and Experimental Subjects

All experiments in this study were conducted on a cloud server equipped with NVIDIA GeForce 4090 GPUs, using a CUDA parallel computing architecture within the Pytorch framework to construct the detection model. Python and OpenCV were utilized for data augmentation, and the environment configuration is detailed in Table 2. The optimizer Adam was employed in model training. The initial learning rate was set to 1 × 10 2 , and the weight decay rate was set to 5 × 10 4 . The epoch of the training process was set to 250, and the batch size was set to 16. All input images were resized to 640 × 640 pixels to conform to the model.
The model’s testing phase involved using a concrete road at Kunming University of Science and Technology to evaluate the accuracy and efficiency of both the crack identification and localization and the image segmentation models, as depicted in Figure 8. For road image acquisition, we utilized a DJI Mavic3 UAV equipped with a Raspberry Pi 4B and a binocular camera, and the shooting parameters are detailed in Table 3.

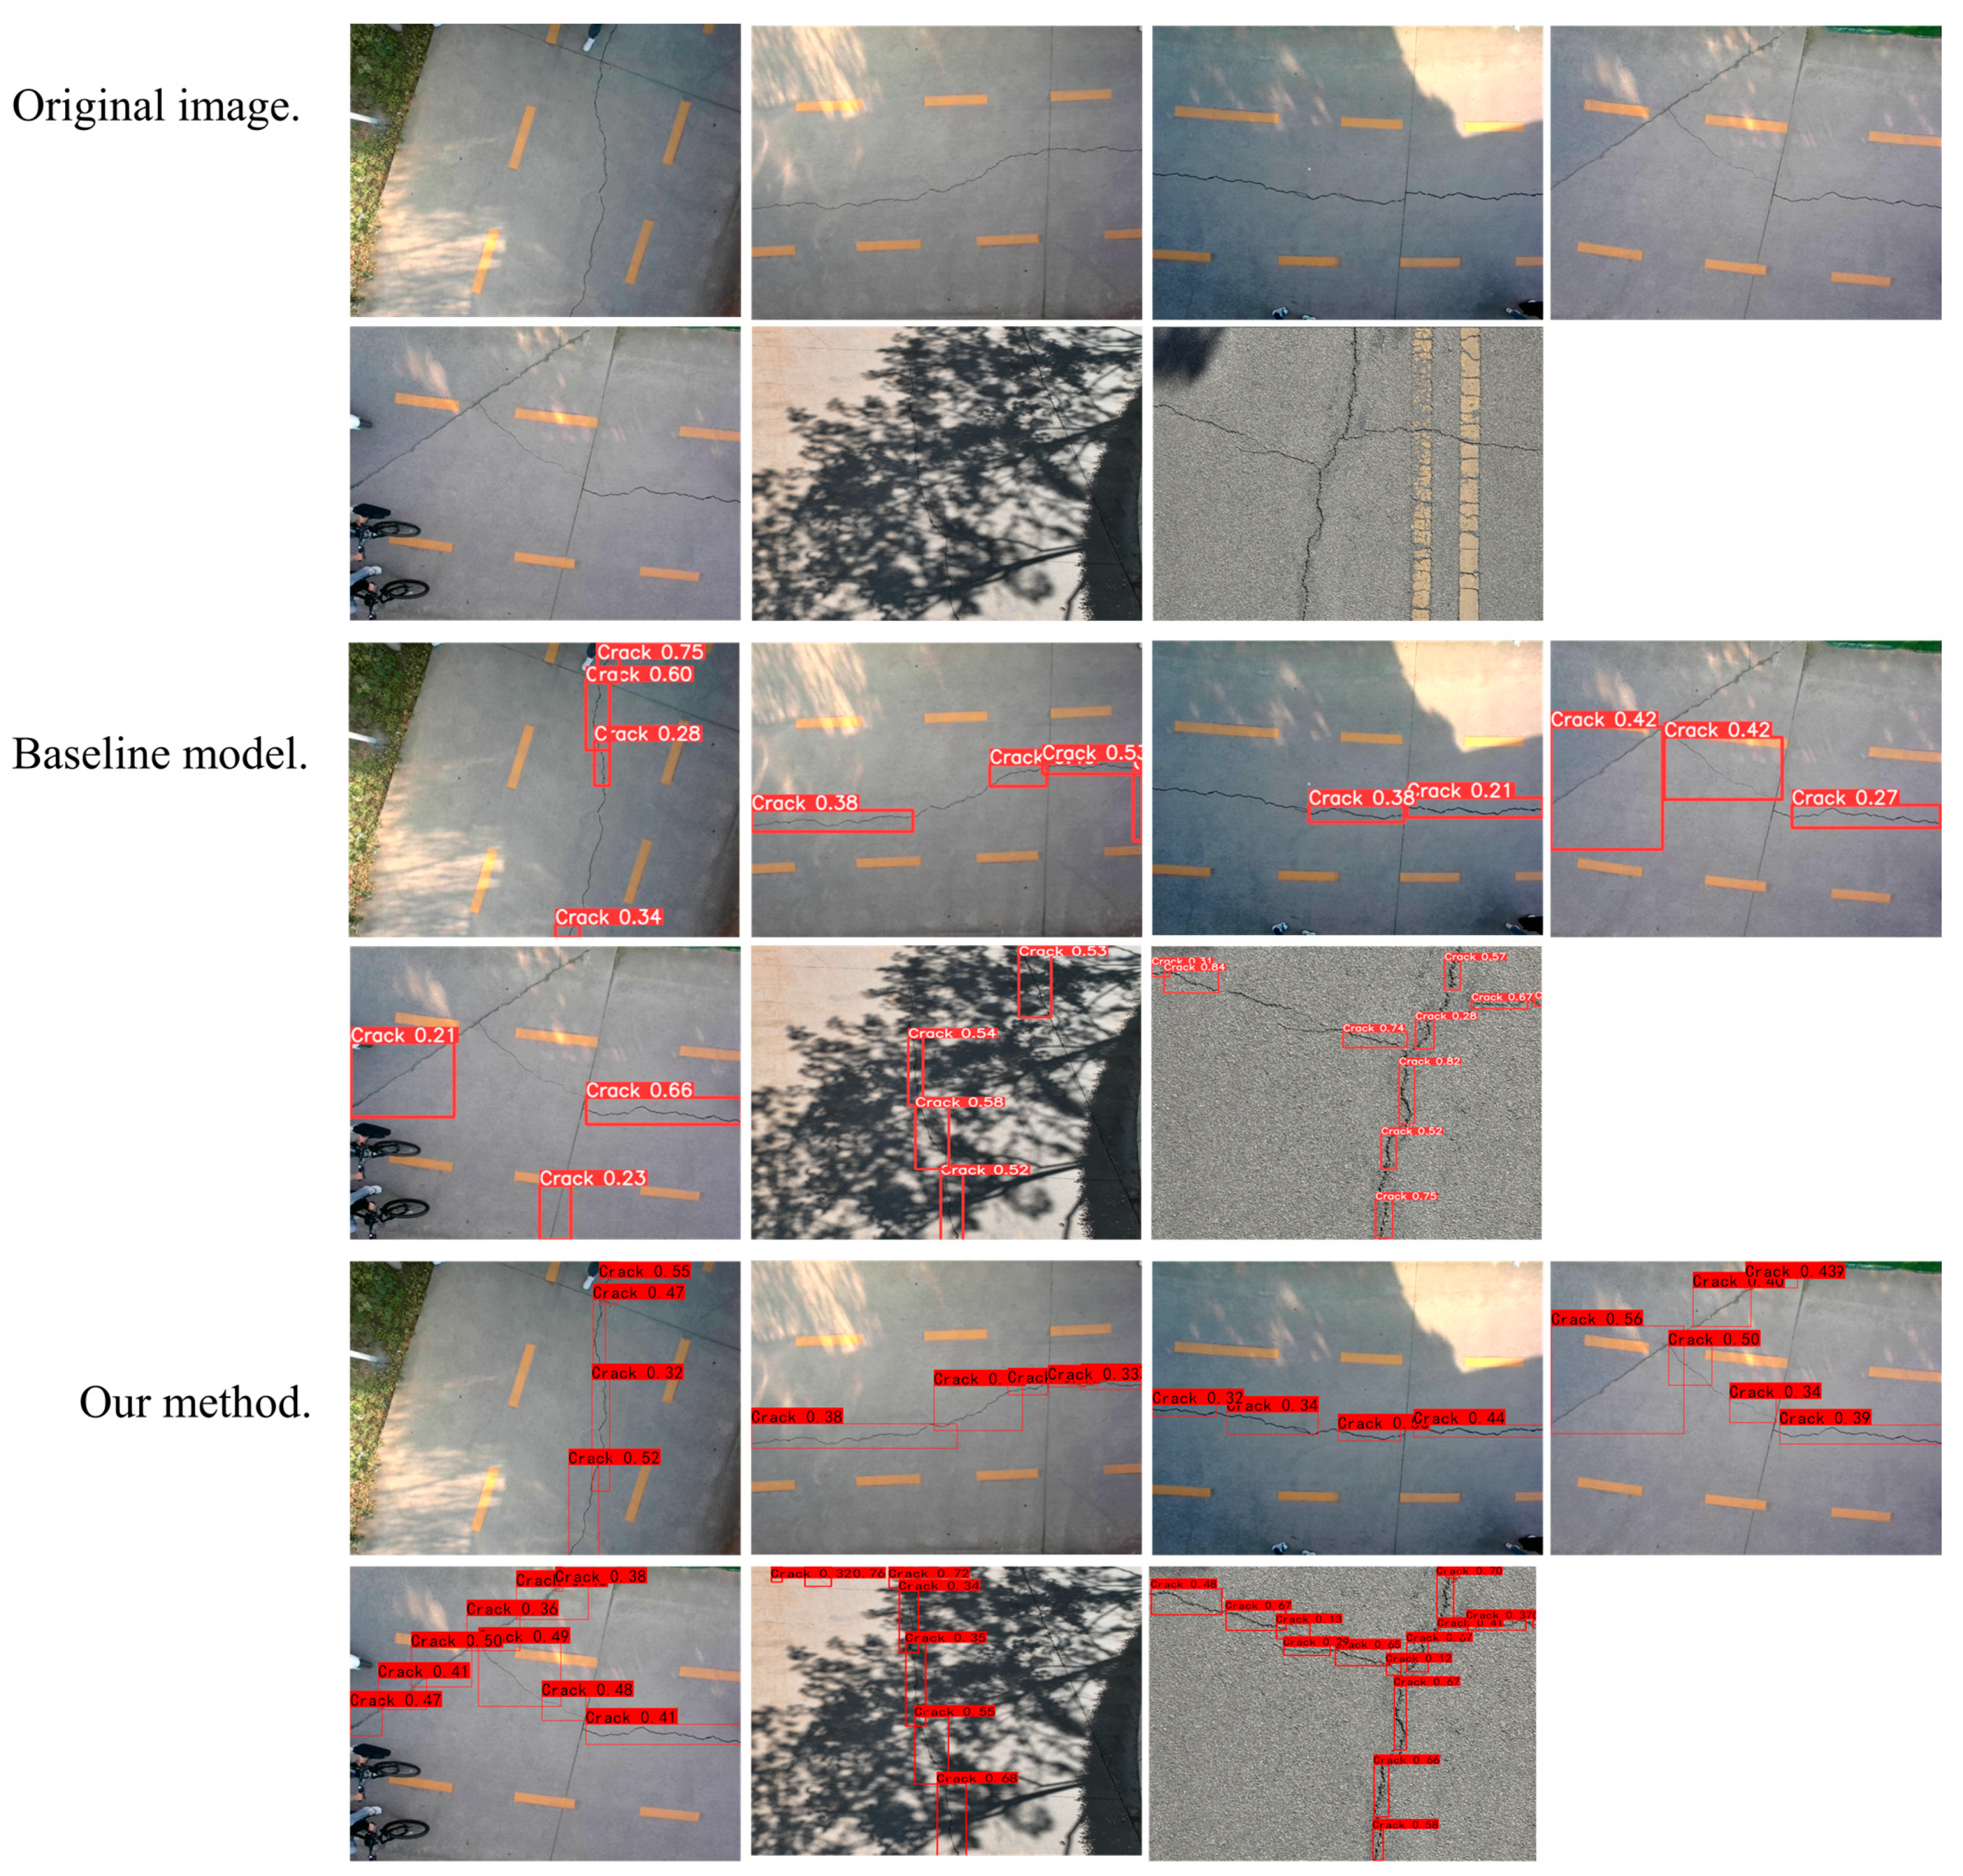
3.3. Comparison of Network Improvements

The baseline model utilizes the YOLOv5s network structure. The ECA module is incorporated into the Bottleneck structure based on the baseline model, optimizing feature transfer and reuse by fusing the ECA mechanism with the Bottleneck module, a modification we refer to as Baseline + ECA. The YOLOX network’s decoupled head structure also replaces the YOLOv5s’s coupled head structure and is called Baseline + DH. Concurrently, the CIoU localization loss is substituted with GIoU and is designated Baseline + GIoU. These three enhancements collectively form Baseline + GIoU + ECA + DH. This study conducted comparative experiments on datasets with fine-crack annotations to evaluate the efficacy of these improvements. The weight of the localization loss was adjusted in the loss function to improve the recall of crack detection. The training process is shown in Figure 9. The proposed model had the highest recall and the lowest loss value throughout the training process.
As shown in Table 4, the baseline model’s mean Average Precision (mAP) for crack detection tasks was 81.02%. Implementing the ECA mechanism at critical points within the network structure reduced the model’s parameters and adeptly captured inter-channel dependencies through a localized cross-channel interaction strategy. This integration of the ECA module elevated the mAP to 82.82%, underscoring the mechanism’s effectiveness in augmenting the model’s crack feature recognition capabilities. Furthermore, introducing the YOLOx decoupled head structure refined the network training by distinctly separating the classification and localization tasks. This separation resulted in enhanced focus and precision, leading to a 2.10% increase in the mAP and an improvement in recall to 82.56%. By converting the bounding box loss function to GIoU loss, which accounted for both the coverage and the distance between bounding boxes, the model gained more comprehensive crack localization feedback, further raising the mAP to 82.33%. The combined application of these three improvements significantly boosted the network’s recall to 86.82% and boosted the mAP to 86.32%. These data emphatically demonstrate that the strategic enhancements to the YOLOv5s architecture improve its capability to detect pavement crack defects.
Figure 10 exemplifies the results of pavement crack detection. The initial YOLOv5s model, prior to improvement, exhibited missed detections, particularly in areas with long cracks. The enhanced model demonstrated improved recall, comprehensively covering the cracks with small boxes and exhibiting higher confidence.

3.4. Comparison of Crack Measurement Results

The final improved model is compared with several other mainstream target detection models, SSD [38], Faster R-CNN [39], and RetinaNet [40], under the same experimental conditions to verify the detection advantages of this paper’s model over the others in pavement crack recognition. SSD uses a VGG16 backbone network, and Faster R-CNN and RetinaNet use a ResNet50 backbone network. Figure 11 displays the detection performance of each model for pavement cracks. The model developed in this study demonstrates the highest detection rate, accurately delineating the entire crack with numerous small bounding boxes. This indicates the significant efficacy of the targeted improvement strategy for long cracks in pavement, as proposed in this paper. Conversely, the SSD model fails to identify some targets and inaccurately positions another defective target. The Faster R-CNN model incorrectly identifies expansion joints as cracks, lacking the precision to distinguish between actual cracks and similar background features effectively. Similarly, the RetinaNet model fails to localize defects accurately, with its detection bounding boxes not enclosing the crack targets adequately.
The methodology introduced in this research demonstrates a superior equilibrium between accuracy, computational efficiency, and model compactness, as depicted in Table 5. It achieves a mean accuracy (mA) of 86.32% and processes up to 152.7 frames per second (FPS) while maintaining a minimal model size of 15.3 MB, offering near-optimal accuracy alongside greater processing speed and reduced storage requirements compared to existing methods such as SSD, Faster R-CNN, and RetinaNet. The proposed method’s efficiency makes it particularly apt for real-time processing applications and deployment on devices with constrained computational capacity, thereby providing an enhanced balance among detection precision, operational velocity, and ease of implementation.

3.5. Comparison of Crack Measurement Results

The UAV hovered about 4 m in the air to capture images of cracks in concrete pavement. The crack width was calculated following the identification and segmentation of cracks using the aforementioned image processing method. Concurrently, crack widths were manually measured with calipers for comparison. The 25 extracted cracks were selected for a quantitative analysis and numbered #1-#25. The results of the UAV’s measurements and the manual measurements are presented in Table 6. The table includes an original image, a segmented image, the measurements of the shooting distances, and the values of the crack widths measured by the UAV and manually. The results reveal that the absolute error remained below 4.14 mm when measuring cracks less than 2 cm wide. However, the binocular camera had resolution limitations, resulting in higher relative errors, with a maximum of 28.89%. Nevertheless, the absolute error remained low. For cracks wider than 2 cm, the absolute error did not exceed 3.53 mm, and the maximum relative error was 9.57%, which remained below the 10% criterion. These findings indicate that the measurements of cracks wider than 2 cm fell within acceptable error limits. These results provide valuable empirical support for the utilization of binocular cameras in crack measurement. They demonstrate that under specific conditions, these measurements remain informative despite the presence of relative errors.

4. Discussion

In this study, a binocular-vision UAV was employed to identify and quantify pavement cracks with success. However, the UAV’s payload limitations restricted our ability to utilize a higher-performance, long-baseline binocular camera, subsequently impacting the precision of distance measurements. This limitation became particularly pronounced during changing lighting conditions, when the effects on ranging accuracy were significantly magnified.
Considering these challenges, our future efforts will be directed toward overcoming payload limitations. By increasing the UAV’s load capacity, we aim to integrate a more advanced binocular camera system and a LiDAR unit. Such enhancements are expected to not only augment the accuracy of distance measurements but also to refine overall efficiency in quantifying pavement crack characteristics. Furthermore, we intend to investigate advanced image processing and deep learning algorithms to reduce the impact of variations in ambient lighting on the accuracy of distance measurements. Through the synergistic application of these technologies, we anticipate a significant enhancement in both the performance and reliability of the system, all while maintaining its compactness and efficiency.
In summary, although the current binocular vision system has its limitations, we are optimistic that through systematic improvements and technological advancements, the accuracy of ranging and crack detection can be effectively enhanced. Future efforts will be concentrated on increasing the drone’s payload capacity, exploring higher-performance sensing devices, and optimizing algorithms, with the goal of achieving higher pavement crack recognition accuracy and crack quantification precision.

5. Conclusions

This paper introduces a deep learning model that integrates the YOLOv5s model, efficient channel attention, and a decoupled head structure, aiming to enhance the accuracy and speed of pavement crack detection, particularly for extra-long cracks on road surfaces. Furthermore, by employing binocular camera technology, this study expands the application scenarios for UAV-based crack analysis, overcoming the limitation of needing to preset the shooting distance inherent in previous UAV crack-detection technologies. The main findings and conclusions are as follows:
  • An improved crack detection algorithm is proposed, significantly enhancing pavement crack recognition accuracy through the optimization of the detection network structure. This algorithm meets stringent accuracy requirements for crack detection in real-world applications, with notable increases in network recall to 86.82% and mAP to 86.32%.
  • This study describes a method to accurately measure the photographed depths of different portions of a long crack in a roadway surface using a binocular unmanned aerial vehicle capable of quantifying the widths of various sections of long cracks within images. The method successfully solves the errors arising from relying on approximate distances for depth measurements when UAVs detect pavement and bridge cracks.
  • The combined use of binocular UAV vision and deep learning algorithms for crack detection is effectively applied to the quantitative analysis of pavement cracks. For cracks wider than 2 cm, the absolute error does not exceed 3.53 mm, and the maximum relative error is maintained at 9.57%, remaining below the 10% standard.
These outcomes furnish empirical support for the precision of crack measurement techniques.

Author Contributions

Conceptualization, H.X.; methodology, J.Z.; software, W.H.; validation, P.L. and K.Z.; investigation, P.L.; resources, R.G. and W.H.; writing—original draft preparation, J.Z.; writing—review and editing, H.X.; visualization, J.Z.; supervision, R.G.; project administration, K.Z.; funding acquisition, H.X. All authors have read and agreed to the published version of the manuscript.

Funding

This research was funded by National Natural Science Foundation of China, grant number 12262015.

Institutional Review Board Statement

Not applicable.

Informed Consent Statement

Not applicable.

Data Availability Statement

The data presented in this study are available on request from the corresponding author. The data are not publicly available due to privacy.

Conflicts of Interest

The authors declare no conflicts of interest.

References

  1. Hsieh, Y.-A.; Tsai, Y.J. Machine learning for crack detection: Review and model performance comparison. J. Comput. Civ. Eng. 2020, 34, 04020038. [Google Scholar] [CrossRef]
  2. Ali, R.; Chuah, J.H.; Talip, M.S.A.; Mokhtar, N.; Shoaib, M.A. Structural crack detection using deep convolutional neural networks. Autom. Constr. 2022, 133, 103989. [Google Scholar] [CrossRef]
  3. Kheradmandi, N.; Mehranfar, V. A critical review and comparative study on image segmentation-based techniques for pavement crack detection. Constr. Build. Mater. 2022, 321, 126162. [Google Scholar] [CrossRef]
  4. Taha, B.; Shoufan, A. Machine learning-based drone detection and classification: State-of-the-art in research. IEEE Access 2019, 7, 138669–138682. [Google Scholar] [CrossRef]
  5. Meng, S.; Gao, Z.; Zhou, Y.; He, B.; Djerrad, A. Real-time automatic crack detection method based on drone. Comput.-Aided Civ. Infrastruct. Eng. 2023, 38, 849–872. [Google Scholar] [CrossRef]
  6. Liu, Y.F.; Nie, X.; Fan, J.S.; Liu, X.G. Image-based crack assessment of bridge piers using unmanned aerial vehicles and three-dimensional scene reconstruction. Comput.-Aided Civ. Infrastruct. Eng. 2020, 35, 511–529. [Google Scholar] [CrossRef]
  7. Liu, Y.; Hajj, M.; Bao, Y. Review of robot-based damage assessment for offshore wind turbines. Renew. Sustain. Energy Rev. 2022, 158, 112187. [Google Scholar] [CrossRef]
  8. Zhang, L.; Yang, F.; Zhang, Y.D.; Zhu, Y.J. Road crack detection using deep convolutional neural network. In Proceedings of the 2016 IEEE International Conference on Image Processing (ICIP), Phoenix, AZ, USA, 25–28 September 2016; pp. 3708–3712. [Google Scholar]
  9. Cha, Y.J.; Choi, W.; Büyüköztürk, O. Deep learning-based crack damage detection using convolutional neural networks. Comput.-Aided Civ. Infrastruct. Eng. 2017, 32, 361–378. [Google Scholar] [CrossRef]
  10. Jiang, Y.; Pang, D.; Li, C. A deep learning approach for fast detection and classification of concrete damage. Autom. Constr. 2021, 128, 103785. [Google Scholar] [CrossRef]
  11. Yang, F.; Zhang, L.; Yu, S.; Prokhorov, D.; Mei, X.; Ling, H. Feature pyramid and hierarchical boosting network for pavement crack detection. IEEE Trans. Intell. Transp. Syst. 2019, 21, 1525–1535. [Google Scholar] [CrossRef]
  12. Que, Y.; Dai, Y.; Ji, X.; Leung, A.K.; Chen, Z.; Tang, Y.; Jiang, Z. Automatic classification of asphalt pavement cracks using a novel integrated generative adversarial networks and improved VGG model. Eng. Struct. 2023, 277, 115406. [Google Scholar] [CrossRef]
  13. Rao, A.S.; Nguyen, T.; Palaniswami, M.; Ngo, T. Vision-based automated crack detection using convolutional neural networks for condition assessment of infrastructure. Struct. Health Monit. 2021, 20, 2124–2142. [Google Scholar] [CrossRef]
  14. Yu, Y.; Samali, B.; Rashidi, M.; Mohammadi, M.; Nguyen, T.N.; Zhang, G. Vision-based concrete crack detection using a hybrid framework considering noise effect. J. Build. Eng. 2022, 61, 105246. [Google Scholar] [CrossRef]
  15. Silva, W.R.L.d.; Lucena, D.S.d. Concrete cracks detection based on deep learning image classification. Proceedings 2018, 2, 489. [Google Scholar]
  16. Duan, H.; Xin, L.; Chen, S. Robust cooperative target detection for a vision-based UAVS autonomous aerial refueling platform via the contrast sensitivity mechanism of eagle’s eye. IEEE Aerosp. Electron. Syst. Mag. 2019, 34, 18–30. [Google Scholar] [CrossRef]
  17. Ma, Y.; Li, Q.; Chu, L.; Zhou, Y.; Xu, C. Real-time detection and spatial localization of insulators for UAV inspection based on binocular stereo vision. Remote Sens. 2021, 13, 230. [Google Scholar] [CrossRef]
  18. Shuai, C.; Wang, H.; Zhang, W.; Yao, P.; Qin, Y. Binocular vision perception and obstacle avoidance of visual simulation system for power lines inspection with UAV. In Proceedings of the 2017 36th Chinese Control Conference (CCC), Dalian, China, 26–28 July 2017; pp. 10480–10485. [Google Scholar]
  19. Gopalakrishnan, K.; Khaitan, S.K.; Choudhary, A.; Agrawal, A. Deep convolutional neural networks with transfer learning for computer vision-based data-driven pavement distress detection. Constr. Build. Mater. 2017, 157, 322–330. [Google Scholar] [CrossRef]
  20. Lei, B.; Wang, N.; Xu, P.; Song, G. New crack detection method for bridge inspection using UAV incorporating image processing. J. Aerosp. Eng. 2018, 31, 04018058. [Google Scholar] [CrossRef]
  21. Liu, Y.; Yeoh, J.K.; Chua, D.K. Deep learning–based enhancement of motion blurred UAV concrete crack images. J. Comput. Civ. Eng. 2020, 34, 04020028. [Google Scholar] [CrossRef]
  22. Kim, H.; Lee, J.; Ahn, E.; Cho, S.; Shin, M.; Sim, S.-H. Concrete crack identification using a UAV incorporating hybrid image processing. Sensors 2017, 17, 2052. [Google Scholar] [CrossRef]
  23. Liu, Y.; Bao, Y. Intelligent monitoring of spatially-distributed cracks using distributed fiber optic sensors assisted by deep learning. Measurement 2023, 220, 113418. [Google Scholar] [CrossRef]
  24. Park, S.E.; Eem, S.-H.; Jeon, H. Concrete crack detection and quantification using deep learning and structured light. Constr. Build. Mater. 2020, 252, 119096. [Google Scholar] [CrossRef]
  25. Yu, J.-y.; Li, F.; Xue, X.-k.; Zhu, P.; Wu, X.-y.; Lu, P.-s. Intelligent Identification of Bridge Structural Cracks Based on Unmanned Aerial Vehicle and Mask R-CNN. China J. Highw. Transp. 2021, 34, 80–90. [Google Scholar]
  26. Peng, X.; Zhong, X.; Zhao, C.; Chen, A.; Zhang, T. A UAV-based machine vision method for bridge crack recognition and width quantification through hybrid feature learning. Constr. Build. Mater. 2021, 299, 123896. [Google Scholar] [CrossRef]
  27. Zhou, Q.; Ding, S.; Qing, G.; Hu, J. UAV vision detection method for crane surface cracks based on Faster R-CNN and image segmentation. J. Civ. Struct. Health Monit. 2022, 12, 845–855. [Google Scholar] [CrossRef]
  28. Ding, W.; Yang, H.; Yu, K.; Shu, J. Crack detection and quantification for concrete structures using UAV and transformer. Autom. Constr. 2023, 152, 104929. [Google Scholar] [CrossRef]
  29. Wang, Q.; Wu, B.; Zhu, P.; Li, P.; Zuo, W.; Hu, Q. ECA-Net: Efficient channel attention for deep convolutional neural networks. In Proceedings of the IEEE/CVF Conference on Computer Vision and Pattern Recognition, Seattle, WA, USA, 13–19 June 2020; pp. 11534–11542. [Google Scholar]
  30. Hu, J.; Shen, L.; Sun, G. Squeeze-and-excitation networks. In Proceedings of the IEEE Conference on Computer Vision and Pattern Recognition, Salt Lake City, UT, USA, 18–23 June 2018; pp. 7132–7141. [Google Scholar]
  31. Ge, Z.; Liu, S.; Wang, F.; Li, Z.; Sun, J. Yolox: Exceeding yolo series in 2021. arXiv 2021, arXiv:2107.08430 2021. [Google Scholar]
  32. Hirschmuller, H. Accurate and efficient stereo processing by semi-global matching and mutual information. In Proceedings of the 2005 IEEE Computer Society Conference on Computer Vision and Pattern Recognition (CVPR’05), San Diego, CA, USA, 20–25 June 2005; pp. 807–814. [Google Scholar]
  33. Zhou, Z.; Siddiquee, M.; Tajbakhsh, N.; Liang, J.U. A nested U-Net architecture for medical image segmentation (2018). arXiv 2018, arXiv:1807.10165. [Google Scholar]
  34. Zou, Q.; Cao, Y.; Li, Q.; Mao, Q.; Wang, S. CrackTree: Automatic crack detection from pavement images. Pattern Recognit. Lett. 2012, 33, 227–238. [Google Scholar] [CrossRef]
  35. Shi, Y.; Cui, L.; Qi, Z.; Meng, F.; Chen, Z. Automatic road crack detection using random structured forests. IEEE Trans. Intell. Transp. Syst. 2016, 17, 3434–3445. [Google Scholar] [CrossRef]
  36. Amhaz, R.; Chambon, S.; Idier, J.; Baltazart, V. Automatic crack detection on two-dimensional pavement images: An algorithm based on minimal path selection. IEEE Trans. Intell. Transp. Syst. 2016, 17, 2718–2729. [Google Scholar] [CrossRef]
  37. Eisenbach, M.; Stricker, R.; Seichter, D.; Amende, K.; Debes, K.; Sesselmann, M.; Ebersbach, D.; Stoeckert, U.; Gross, H.-M. How to get pavement distress detection ready for deep learning? A systematic approach. In Proceedings of the 2017 International Joint Conference on Neural Networks (IJCNN), Anchorage, AK, USA, 14–19 May 2017; pp. 2039–2047. [Google Scholar]
  38. Liu, W.; Anguelov, D.; Erhan, D.; Szegedy, C.; Reed, S.; Fu, C.-Y.; Berg, A.C. Ssd: Single shot multibox detector. In Proceedings of the Computer Vision–ECCV 2016: 14th European Conference, Amsterdam, The Netherlands, 11–14 October 2016; pp. 21–37. [Google Scholar]
  39. Ren, S.; He, K.; Girshick, R.; Sun, J. Faster r-cnn: Towards real-time object detection with region proposal networks. In Proceedings of the Advances in Neural Information Processing Systems, Montreal, QC, Canada, 7–12 December 2015; Volume 28. [Google Scholar]
  40. Lin, T.-Y.; Goyal, P.; Girshick, R.; He, K.; Dollár, P. Focal loss for dense object detection. In Proceedings of the IEEE International Conference on Computer Vision, Venice, Italy, 22–29 October 2017; pp. 2980–2988. [Google Scholar]
Figure 1. Network structure of YOLOv5s.
Applsci 14 01778 g001
Figure 2. Network structure of efficient channel attention module.
Applsci 14 01778 g002
Figure 3. Decoupled head architecture.
Applsci 14 01778 g003
Figure 4. Binocular disparity principle.
Applsci 14 01778 g004
Figure 5. Camera pinhole model.
Applsci 14 01778 g005
Figure 6. Crack segmentation process: (a) crack detection results, (b) extraction of crack images, (c) segmentation images, (d) edge detection results, and (e) crack skeletonization.
Applsci 14 01778 g006
Figure 7. The dataset annotation method.
Applsci 14 01778 g007
Figure 8. Experimental process and site.
Applsci 14 01778 g008
Figure 9. Comparison of recall and loss curves between the improved model and the original model.
Applsci 14 01778 g009
Figure 10. Comparison of actual detection effects between improved model and baseline model.
Applsci 14 01778 g010
Figure 11. Comparison of the actual detection effects of different models.
Applsci 14 01778 g011
Table 1. Information on public datasets.
Dataset NameNumberImage SizeExample Images
CRACK500 [8]5002560 × 1440 pixels
2592 × 1946 pixels
Applsci 14 01778 i001
Cracktree200 [34]206800 × 600 pixelsApplsci 14 01778 i002
CFD [35]118480 × 320 pixelsApplsci 14 01778 i003
AEL [36]58311 × 462 pixels
768 × 512 pixels
700 × 1000 pixels
Applsci 14 01778 i004
GAPs384 [37]19691920 × 1080 pixelsApplsci 14 01778 i005
Table 2. Configuration of the deep learning computing environment.
Configured ContentsType
Operating SystemLinux
CPUXeon(R) Platinum 8352V
GPUNVIDIA GeForce RTX 4090, 24G
PytorchVersion 2.0.1
CUDAVersion 11.7
cuDNNVersion 8.5.0
PythonVersion 3.8
Table 3. Parameters of the image acquisition device.
HardwareConfigured Contents
UAV typeDJI mavic3
MicrocomputerRaspberry Pi 4B
Camera frame rate30 fps/s
Camera pixels4 million pixels
Maximum camera resolution2688 × 1520
Binocular camera baseline70 mm
Camera focal length3.0 mm
Table 4. Comparative results of network improvements.
Network ModelPrecision (%)Recall (%)mAP (%)
YOLOv5s baseline82.5780.5781.02
YOLOv5s + ECA80.6683.6882.82
YOLOv5s + decoupled head86.4182.5683.12
YOLOv5s + GIoU82.1285.5582.33
YOLOv5s + ECA + GIoU + decoupled head85.9686.8286.32
Table 5. Test results of different models.
ModelmAP (%)FPS (Frames-1)Weight (MB)
SSD 77.32112.299.7
Faster R-CNN87.2533.7602.4
RetinaNet81.9455.1153.2
YOLOv5s82.61173.513.4
Our method86.32152.715.3
Table 6. The results of the UAV’s measurements and manual measurements.
SampleNo.SegmentationMax Width
(Pixels)
Distance
(m)
Crack Width (mm)Error Value
UAV Manual Abs.
(mm)
Rel.
(%)
Applsci 14 01778 i006#1Applsci 14 01778 i0073.004.4523.2725.0−1.736.94
#2Applsci 14 01778 i0084.003.9727.6725.52.178.53
#3Applsci 14 01778 i0094.243.7830.2233.0−2.788.42
#4Applsci 14 01778 i0104.003.7025.7928.5−2.719.50
Applsci 14 01778 i011#5Applsci 14 01778 i0122.004.4715.5813.52.0815.41
#6Applsci 14 01778 i0132.834.1920.6622.5−1.848.16
#7Applsci 14 01778 i0143.003.9820.8123.0−2.199.53
#8Applsci 14 01778 i0153.003.8820.2921.5−1.215.65
#9Applsci 14 01778 i0164.243.7127.4130.0−2.598.62
Applsci 14 01778 i017#10Applsci 14 01778 i0184.004.5131.4434.5−3.068.87
#11Applsci 14 01778 i0193.004.2922.4324.5−2.078.45
#12Applsci 14 01778 i0204.244.0129.6332.5−2.878.83
Applsci 14 01778 i021#13Applsci 14 01778 i0225.664.0940.3438.51.844.79
#14Applsci 14 01778 i0234.243.9829.4127.51.916.94
#15Applsci 14 01778 i0242.834.3721.5523.5−1.958.29
#16Applsci 14 01778 i0252.834.7923.6226.0−2.389.14
#17Applsci 14 01778 i0263.005.5328.9132.0−3.099.65
#18Applsci 14 01778 i0272.005.8920.5318.52.0310.97
#19Applsci 14 01778 i0282.836.4831.96301.966.53
Applsci 14 01778 i029#20Applsci 14 01778 i0303.004.7424.7827.0−2.228.22
#21Applsci 14 01778 i0314.244.5333.4737.0−3.539.53
#22Applsci 14 01778 i0323.004.1921.9124.0−2.098.73
#23Applsci 14 01778 i0332.233.9815.4712.03.4728.89
#24Applsci 14 01778 i0342.833.8819.1415.04.1427.57
#25Applsci 14 01778 i0354.244.0029.5632.5−2.949.06
Disclaimer/Publisher’s Note: The statements, opinions and data contained in all publications are solely those of the individual author(s) and contributor(s) and not of MDPI and/or the editor(s). MDPI and/or the editor(s) disclaim responsibility for any injury to people or property resulting from any ideas, methods, instructions or products referred to in the content.

