Article

The Influence of the Operator’s Perception on the Energy Demand for a Hydraulic Manipulator with a Large Working Area

Faculty of Mechanical Engineering, Military University of Technology, 00-908 Warsaw, Poland
*
Author to whom correspondence should be addressed.
Appl. Sci. 2024, 14(5), 1800; https://doi.org/10.3390/app14051800
Submission received: 30 January 2024 / Revised: 19 February 2024 / Accepted: 20 February 2024 / Published: 22 February 2024
(This article belongs to the Special Issue Advances in Robotic Manipulators and Their Applications)

Abstract

:
The efficient operation of hydraulic manipulators with expansive working areas is crucial in various applications such as the construction industry, the rescue service, and the military. These machines are characterized by having more capabilities than humans, and they perform tasks that are not repeated in the same environment. For this reason, they are most often controlled by a human in a teleoperation system. This research investigates the influence of the operator’s perception on the energy demand of such manipulators. Specifically, the research focused on assessing how the intuitive control systems, such as primary–secondary solutions, impact the energy consumption. Understanding the relation between the operator’s perception and the energy demand is essential for optimizing manipulator design and operation. Experimental research was conducted to analyze the velocity and acceleration of the manipulator’s effector, which is controlled by human operators under different movement ranges and size ratios. The obtained test results allow for the assessment of the dynamic loads, velocity, and energy consumption of the movement of a manipulator with a large working area due to the limitations resulting from the operator’s perception.

1. Introduction

Nowadays, energy saving and productivity have become important problems, especially in a manipulator with a large working area. A significant problem with these types of manipulators results primarily from the high dead weight of such structures, the lifting capacity, and the drive system used. In most cases, manipulators with a large working area are equipped with a hydrostatic drive system that allows for the implementation of pick-and-place tasks by manipulating large-mass loads over long ranges. Unfortunately, hydraulic systems are characterized by significant energy consumption [1,2,3]. This is primarily related to mechanical, volumetric, and energy losses resulting from throttling and the lifted load [3,4]. The total efficiency of the drive system of a manipulator with a hydrostatic drive system can reach up to 50% and is even lower if the energy demand is not precisely estimated. This is also important from the point of view of the HMI (Human–Machine Interface) manipulator control system. Modern HMI systems are adapted to the natural predispositions of humans [5,6,7,8,9] to implement the control process more effectively, increase efficiency, and reduce dynamic loads on the manipulator. There are many different solutions for this type of HMI, in which the most important role is played by the controller, which tracks and copies the movement of the operator’s upper limb. Publications [10,11] have shown that due to the operator’s perception, it is possible to control the manipulator effector more efficiently (at higher velocities) using this type of system. One of these papers stated that the operator is able to control the effector of a manipulator moving at velocities of up to 5 m/s, which is a much higher value than currently available solutions offer. Therefore, from an energy point of view, the inclusion of intuitive HMI systems can significantly change the energy demand for large-scale manipulators. In addition to knowing the nominal values of the effector’s movement velocity, its nature is also important, especially in transient states (the acceleration and deceleration phase). This is important due to the increased demand for energy resulting from dynamic surpluses.
Taking into account the energy consumption of the control process, the authors refer to two groups of manipulators in the literature. The first of them are industrial manipulators, which replace humans to carry out repetitive manual tasks. They perform tasks in certain and structured environments, and they are always pre-programmed to repeat the same job [12,13]. The second group is teleoperated manipulators that work in unknown and less structured environments, and their tasks are not predefined [14,15]. Due to the wide scope of their application [16,17,18,19,20,21,22,23,24,25], they are characterized by a large working area (larger than the operator’s arm reach) and a hydraulic drive system, and their control method (e.g., direct or coordinated teleoperation) allows for the transfer of manipulation skills from humans to manipulators.
Regarding industrial manipulators, the literature most often contains works analyzing effector control algorithms along a trajectory with low energy consumption and productivity [16,17,18]. For example, paper [16] presents the minimization of energy demand and reduction in the work cycle time for an industrial manipulator by using an algorithm known as a teaching–learning-based optimization. Thanks to this approach, the cycle time was reduced by 20%, and the energy demand was reduced by 15%. Similar issues were discussed in ref. [17], where a reduction in energy demand by up to 20% was achieved by optimizing the trajectory in terms of energy consumption and the velocity of pick-and-place tasks. When analyzing teleoperated manipulators, in the literature, one can most often find works analyzing their energy efficiency during the operation of their drive systems, the implementation of the assumed effector trajectory, or energy recovery. In ref. [2], the authors present the solution of a wobble plate hydraulic joint with high energy efficiency instead of the classic actuator element (hydraulic cylinder). The proposed solution allows for energy savings (energy-saving) by reducing pressure losses resulting from controlling several units at the same time. In turn, in ref. [26], the authors described research allowing for minimizing the energy demand for an anthropomorphic manipulator by determining an energy-efficient trajectory when the effector avoids single spheroidal obstacles. The issue of energy efficiency is also raised when implementing the assumed trajectories of the effector of the mobile manipulator. This is particularly important from the point of view of controlling redundant manipulators. Due to the minimization of energy consumption, individual elements of the manipulator should be controlled in such a way that the effector moves along the assumed trajectory [1,3,27,28]. The issue of energy consumption is also discussed in terms of the functionality of the manipulators. In ref. [29], an attempt was made to determine the energy demand for a mobile manipulator when working on vineyards. Additionally, there are many works describing the effectiveness of energy recovery during movements with negative loads [30,31,32].
On the one hand, based on the analyzed research, it can be concluded that the issue of reducing the energy demand for manipulators is very important and widely discussed by many authors. The research most often concerns the minimization of the energy demand while implementing the assumed trajectory by the effector or the implementation of a trajectory with low energy consumption. On the other hand, the issue of energy consumption in controlling teleoperated manipulators due to the operator’s perception is no longer discussed as widely by researchers, and this is important from the point of view of designing their drive systems and increasing work efficiency. Modern manipulators should be characterized by the lowest possible energy consumption and high work efficiency. To achieve these features, it is necessary to select appropriate drive systems that will not be oversized (excessive power of the components reduces the efficiency of the system) and will enable the implementation of working movements at maximum velocities, limited only by the operator’s perception. Therefore, this work focused on assessing the energy demand when controlling manipulators with a large working area due to the operator’s perception.
The remainder of this paper is organized as follows: Section 2 presents the research methodology and experimental setting and derives the equations that are used for calculating power and energy indicators. In Section 3, the experimental results are analyzed to determine the energy demand when controlling manipulators using three size ratios and three movement ranges. Finally, conclusions and suggestions for future work are discussed in Section 4.

2. Methods

Designing a drive system that ensures high work efficiency requires knowledge of the expected velocities of the manipulator effector movements and the occurring loads. This research aimed to determine the maximum movement velocities of the effector, limited only by the operator’s perception, and the occurring accelerations, which determine the dynamic loads. Knowing them is necessary to properly estimate the power demand and energy consumption of the manipulator. Since the manipulator’s movement velocities and power requirements may depend on the size, weight, and reach of the manipulator, it is necessary to conduct tests for different ranges and size ratios. The size ratio [10] should be understood as the ratio of the effector’s displacement to the movement of the hand controlling the effector’s operation in accordance with the relationship which results from Figure 1:
K = A B A B
where A B is the effector displacement; and A B is the operator’s hand displacement.
Taking into account that dynamic loads (resulting from accelerations) and, consequently, the power demand and energy consumption of the manipulator’s movement depend on the inertia of the manipulator together with the transferred load, the unit energy indicator was used to assess the energy consumption of the movement, expressed as follows:
E k * = E k m z
where mz is the equivalent mass reflecting the inertia of the manipulator and the transferred load, reduced to the local effector system; and Ek is the kinetic energy that is needed to move the manipulator effector that is determined from the following equation:
E k = 1 2 m z v e 2
where ve is the effector velocity resulting from the following equation:
v e = ω L
where ω is the angular velocity of the manipulator.
The kinetic energy indicator E k * describes the amount of energy that is needed to move 1 kg of equivalent mass mz and allows for estimating the energy consumption of the movement of a manipulator with any inertia. In a similar way, the power indicator N* was defined, which determines the power demand resulting from dynamic loads.
The power indicator describes the rate of change of kinetic energy that is necessary to move 1 kg of equivalent mass mz and allows for estimating the expected drive power of a manipulator with a specific inertia. It is described by an equation:
N * = N m z = a v e
where a is the effector acceleration. The power that is needed to move the effector results from the force F that is needed to move the effector and the velocity of the effector ve according to the following equation:
N = F v e = a   m z   v e
Energy and power indicators defined in this way allow for the assessment of the power demand and energy consumption of moving the manipulator effector based on kinematic values that should be determined experimentally.

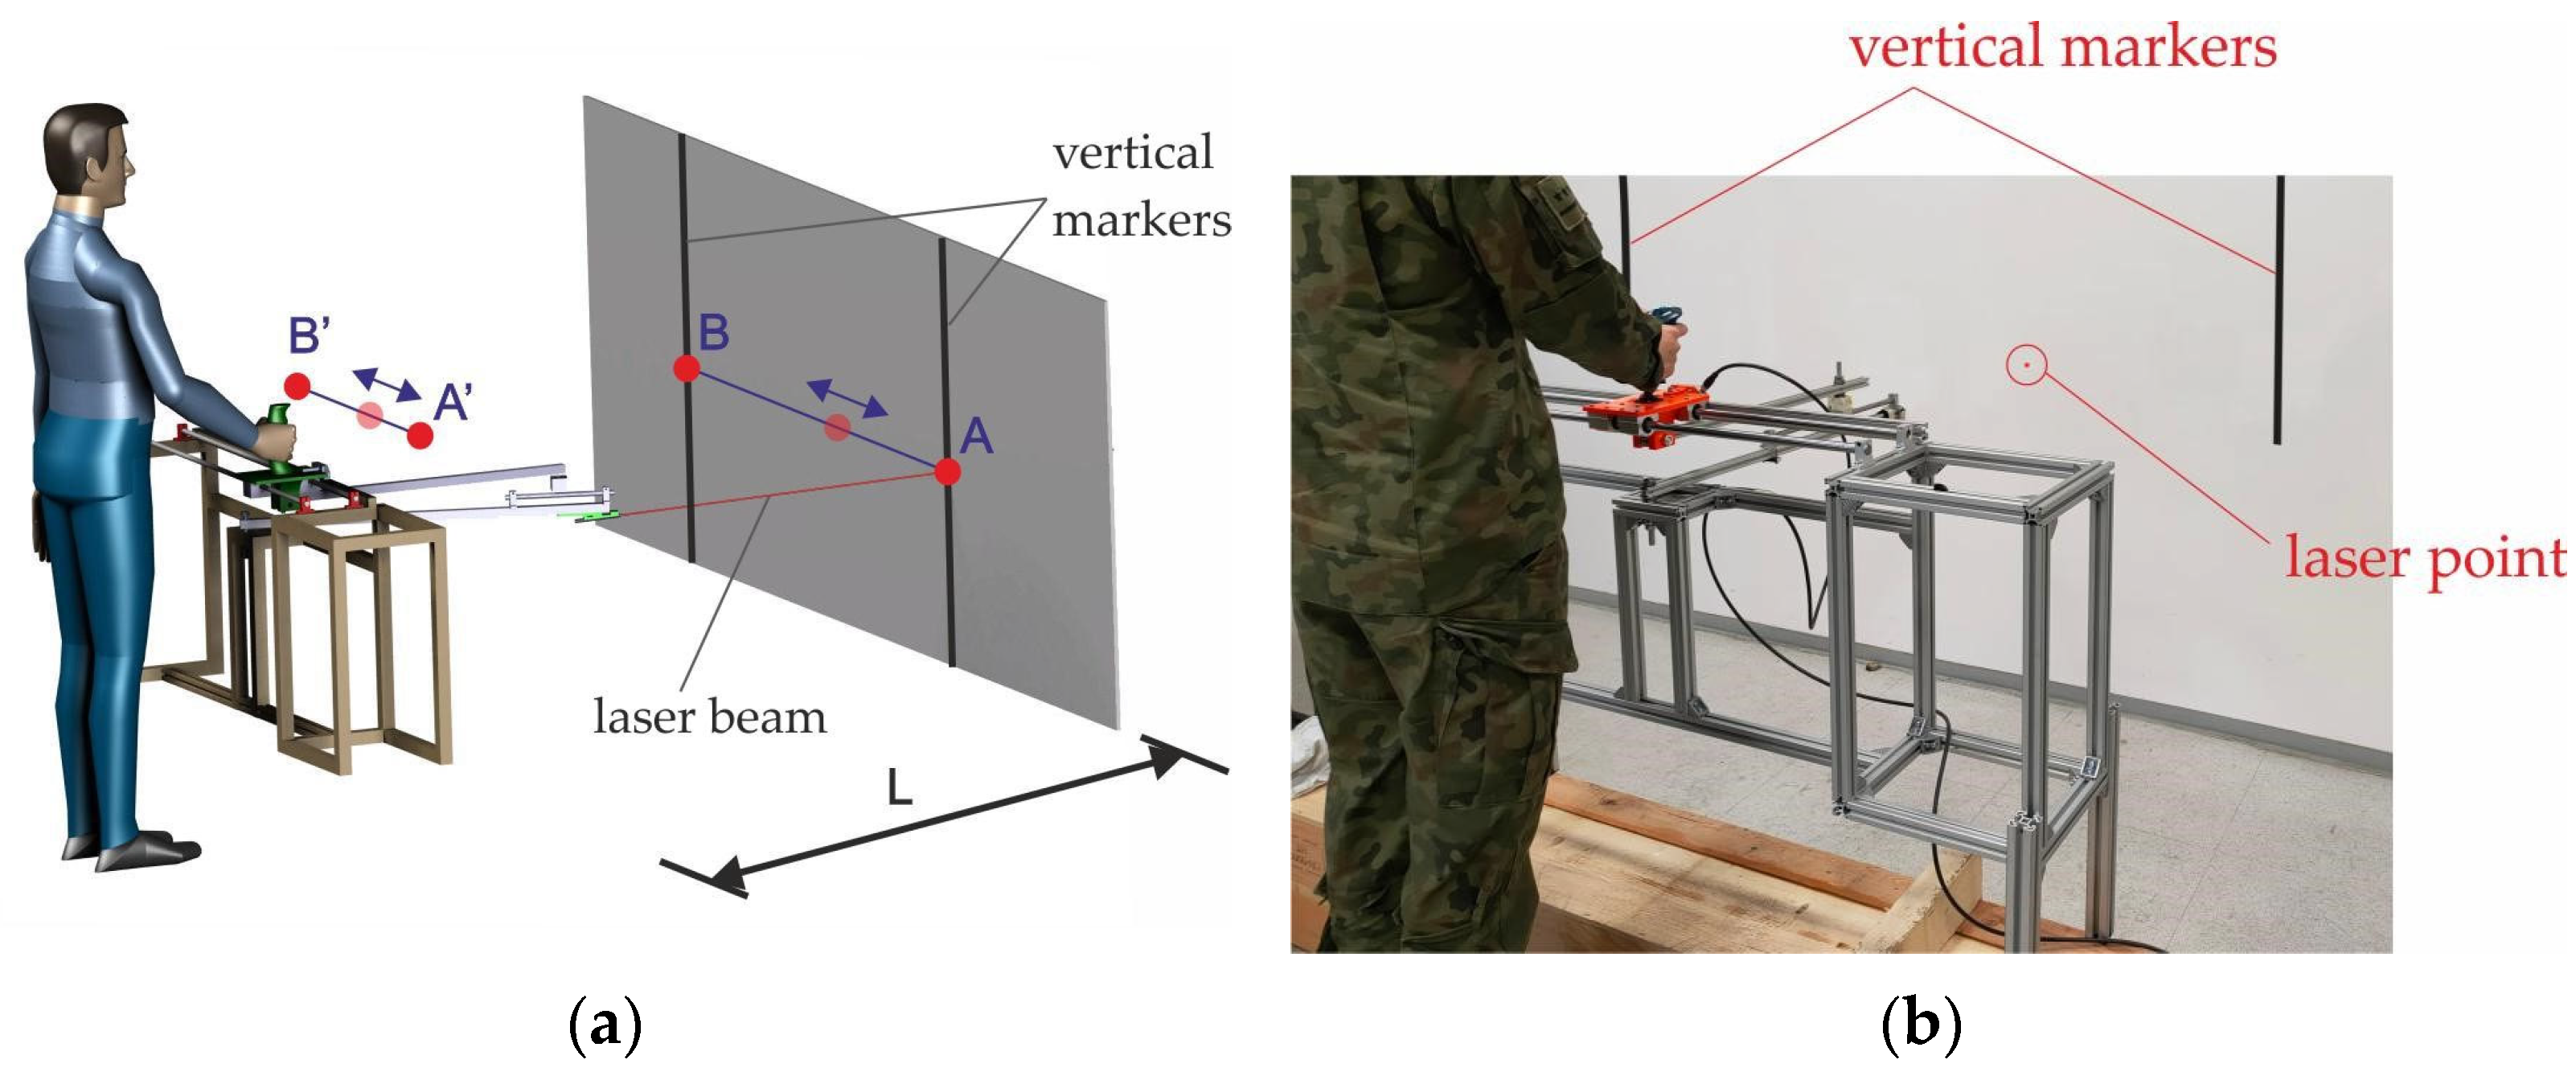
2.1. Experimental Setting and User Task

The tests were carried out on the test stand shown in Figure 1. The station allows us to simulate the movement of the manipulator effector in the form of a laser spot in proportion to the movement of the operator’s hand. The research consisted of moving the laser spot on the screen between vertical markers (A, B) by the operator moving the lever on section A’B’, to which the laser pointer was attached (which simulated the primary controller). Each operator had to move the laser spot from A to B and back along a straight line. Because previous research [11] showed that the velocity of effector movement does not depend on the direction of the straight-line trajectory, the research was carried out only in the field of lateral movement. Depending on the distance L of the operator from the screen (corresponding to the range of the manipulator), it was possible to simulate the movement of the manipulator effector with a different working area (characterized by different kinematic amplifications).
Due to the typical ranges of manipulators with a large working area [1,11,21,33,34], the tests were carried out for three ranges L (6 m, 3 m, and 1.5 m), corresponding to the size ratio K of ×10, ×5, and ×2.5. The maximum marker spacing (effector movement range) was 8 m, 4 m, and 2 m, respectively. The range of motion of the effector was within the human color vision zone, which is approximately 60–70° and within the human stereoscopic field of vision, which is approximately 100–120° [35,36,37]. Additionally, to improve perception, operators could move their eyes or head.
The hand displacement that was necessary to induce such a movement was C1 = 0.8 m and was within the operator’s comfort zone in accordance with the requirements contained in [38,39,40].
In order to check the influence of the effector’s range of motion on the velocities, accelerations, and power and energy demand, additional tests were carried out, reducing the marker spacing by 50% and 75%, which corresponded to the hand movement at C2 = 0.4 m and C3 = 0.2 m. Table 1 lists the ranges of movements that were performed by the operator and the effector for the tested manipulator’s size ratios and ranges.
The tests were carried out for two velocities of movement of the manipulator effector: normal and fast movements [11]. Normal movements did not require special focus and maximum attention from the operator, while fast movements corresponded to the velocity at which the operator was able to perform the given task as quickly as possible.
Effector velocities and accelerations were determined based on hand movement measurements using the size ratio used. Three phases were distinguished in the analyzed movements: acceleration (ta), steady movement (ts), and braking (td) (Figure 2). The time in which the movement velocity does not differ by more than 5% from the maximum value was considered to be a steady phase. Based on the recorded data, the following were determined:
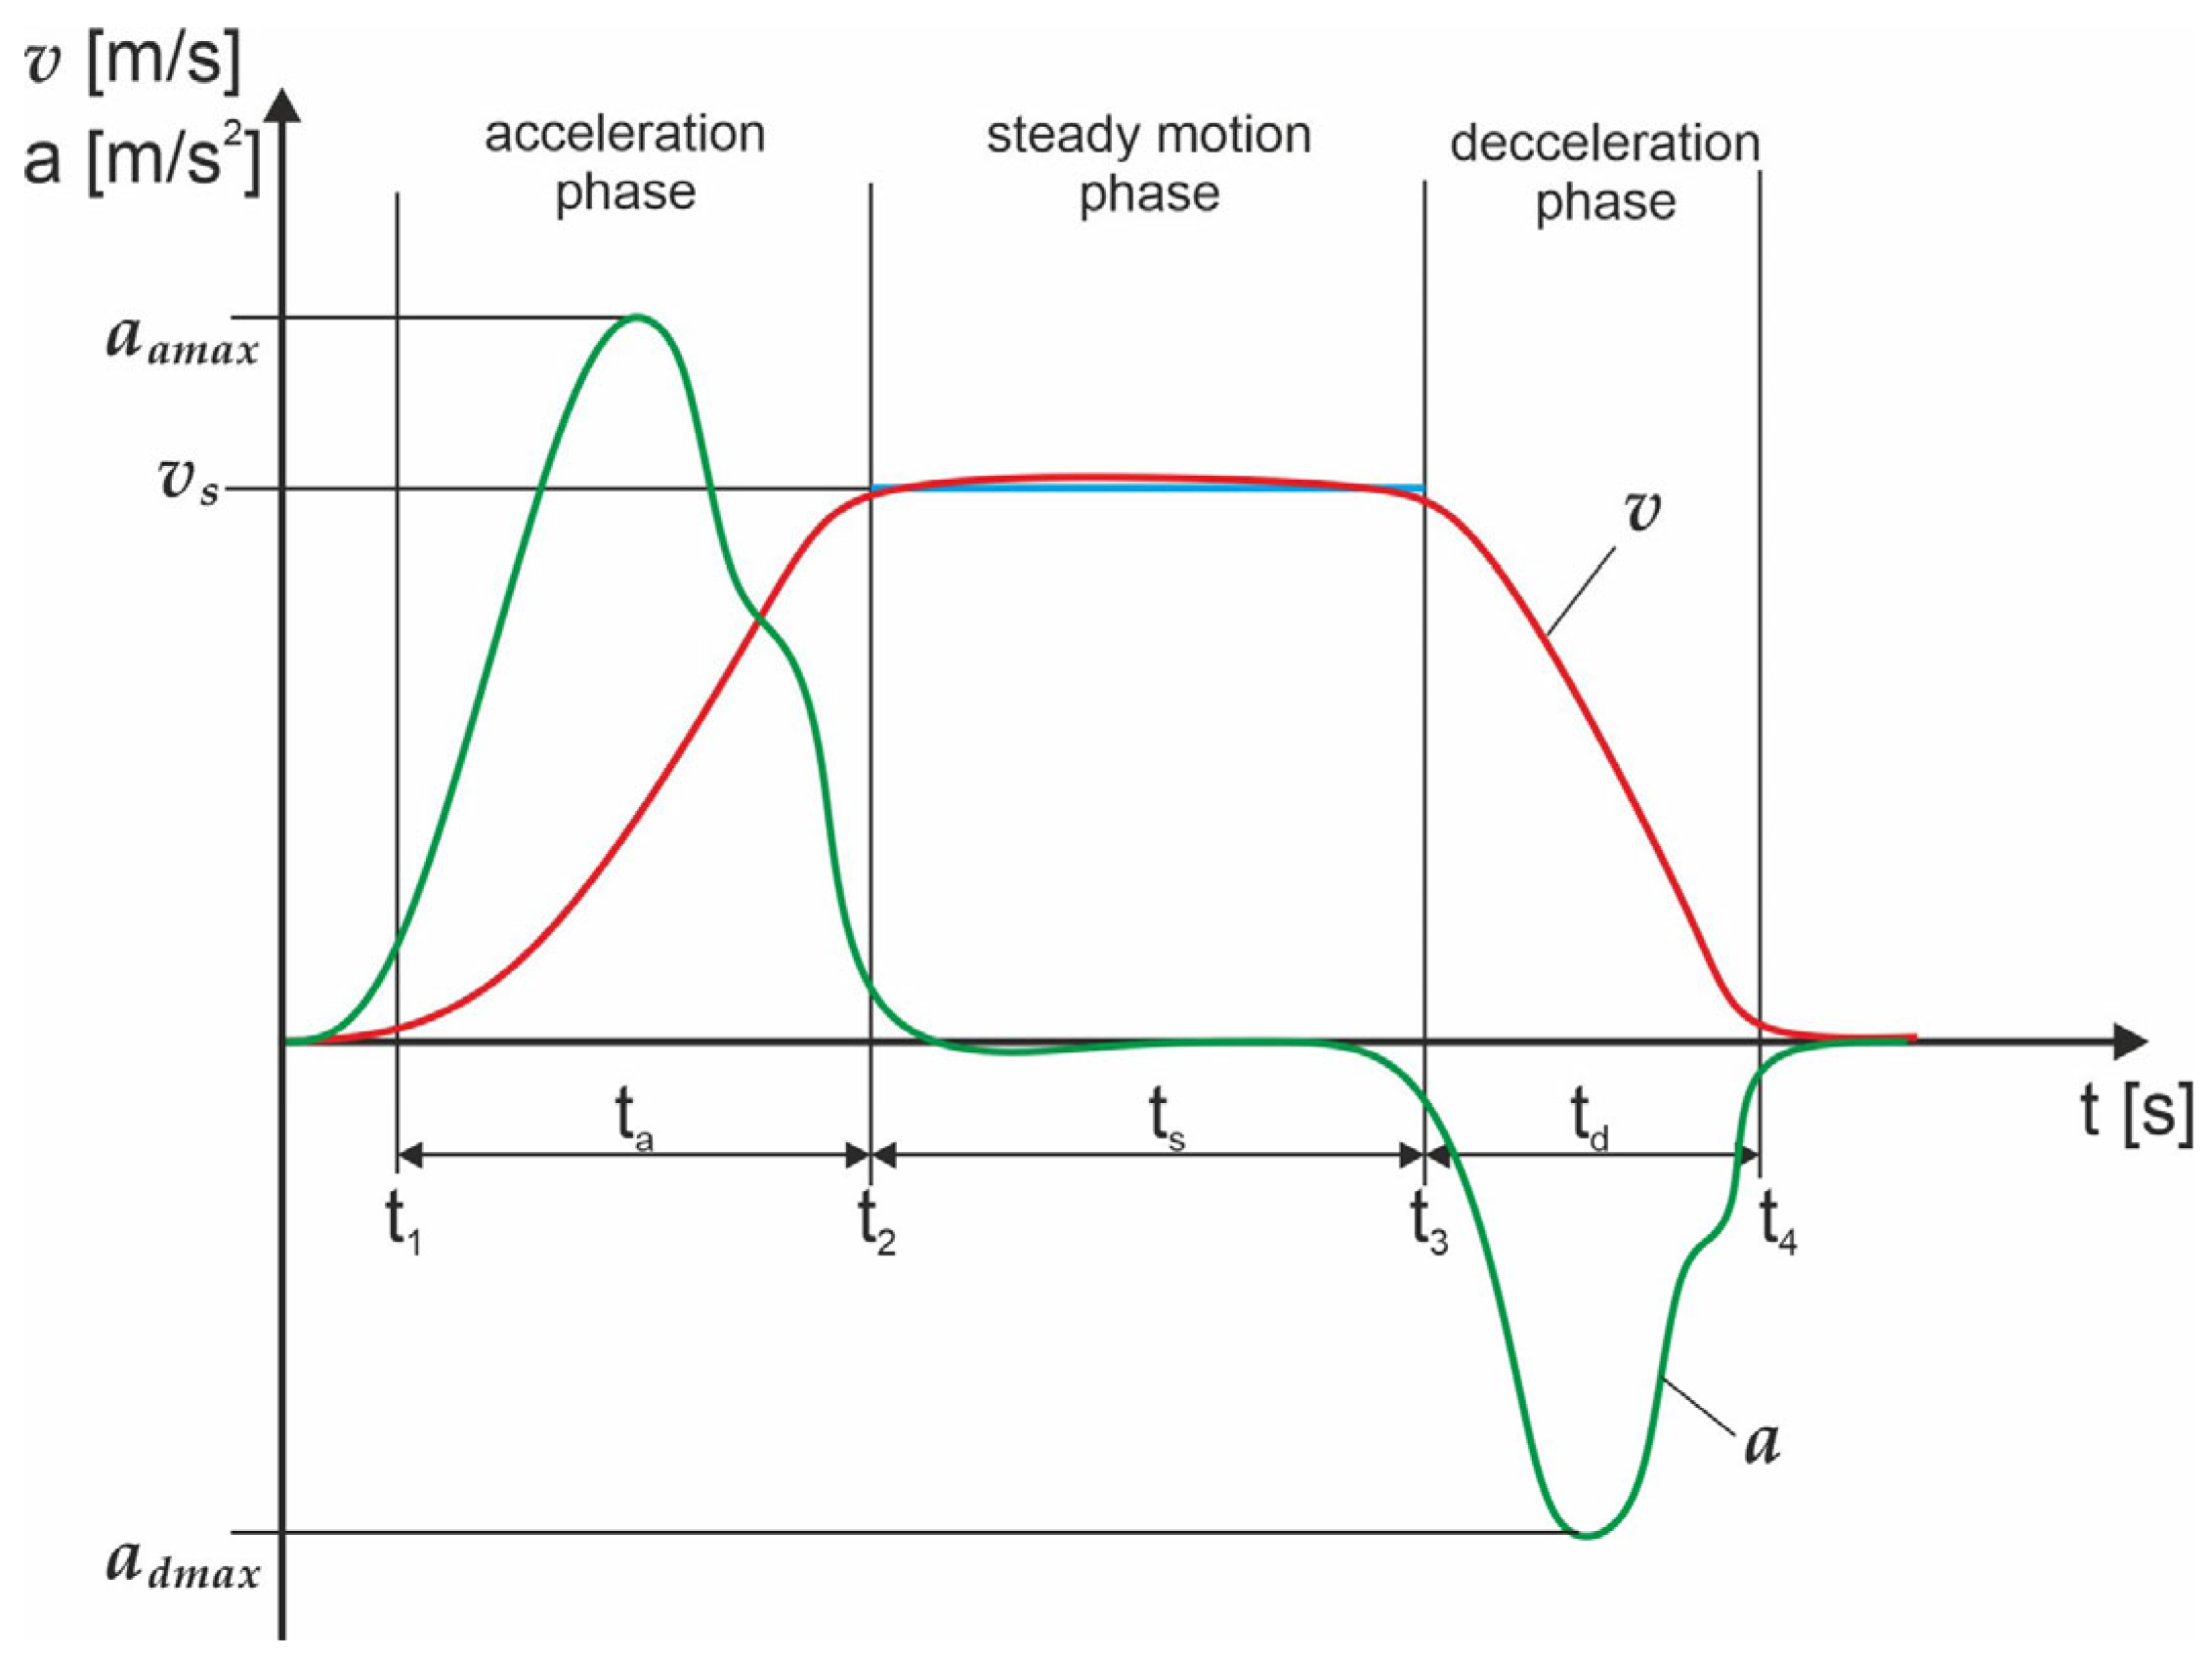
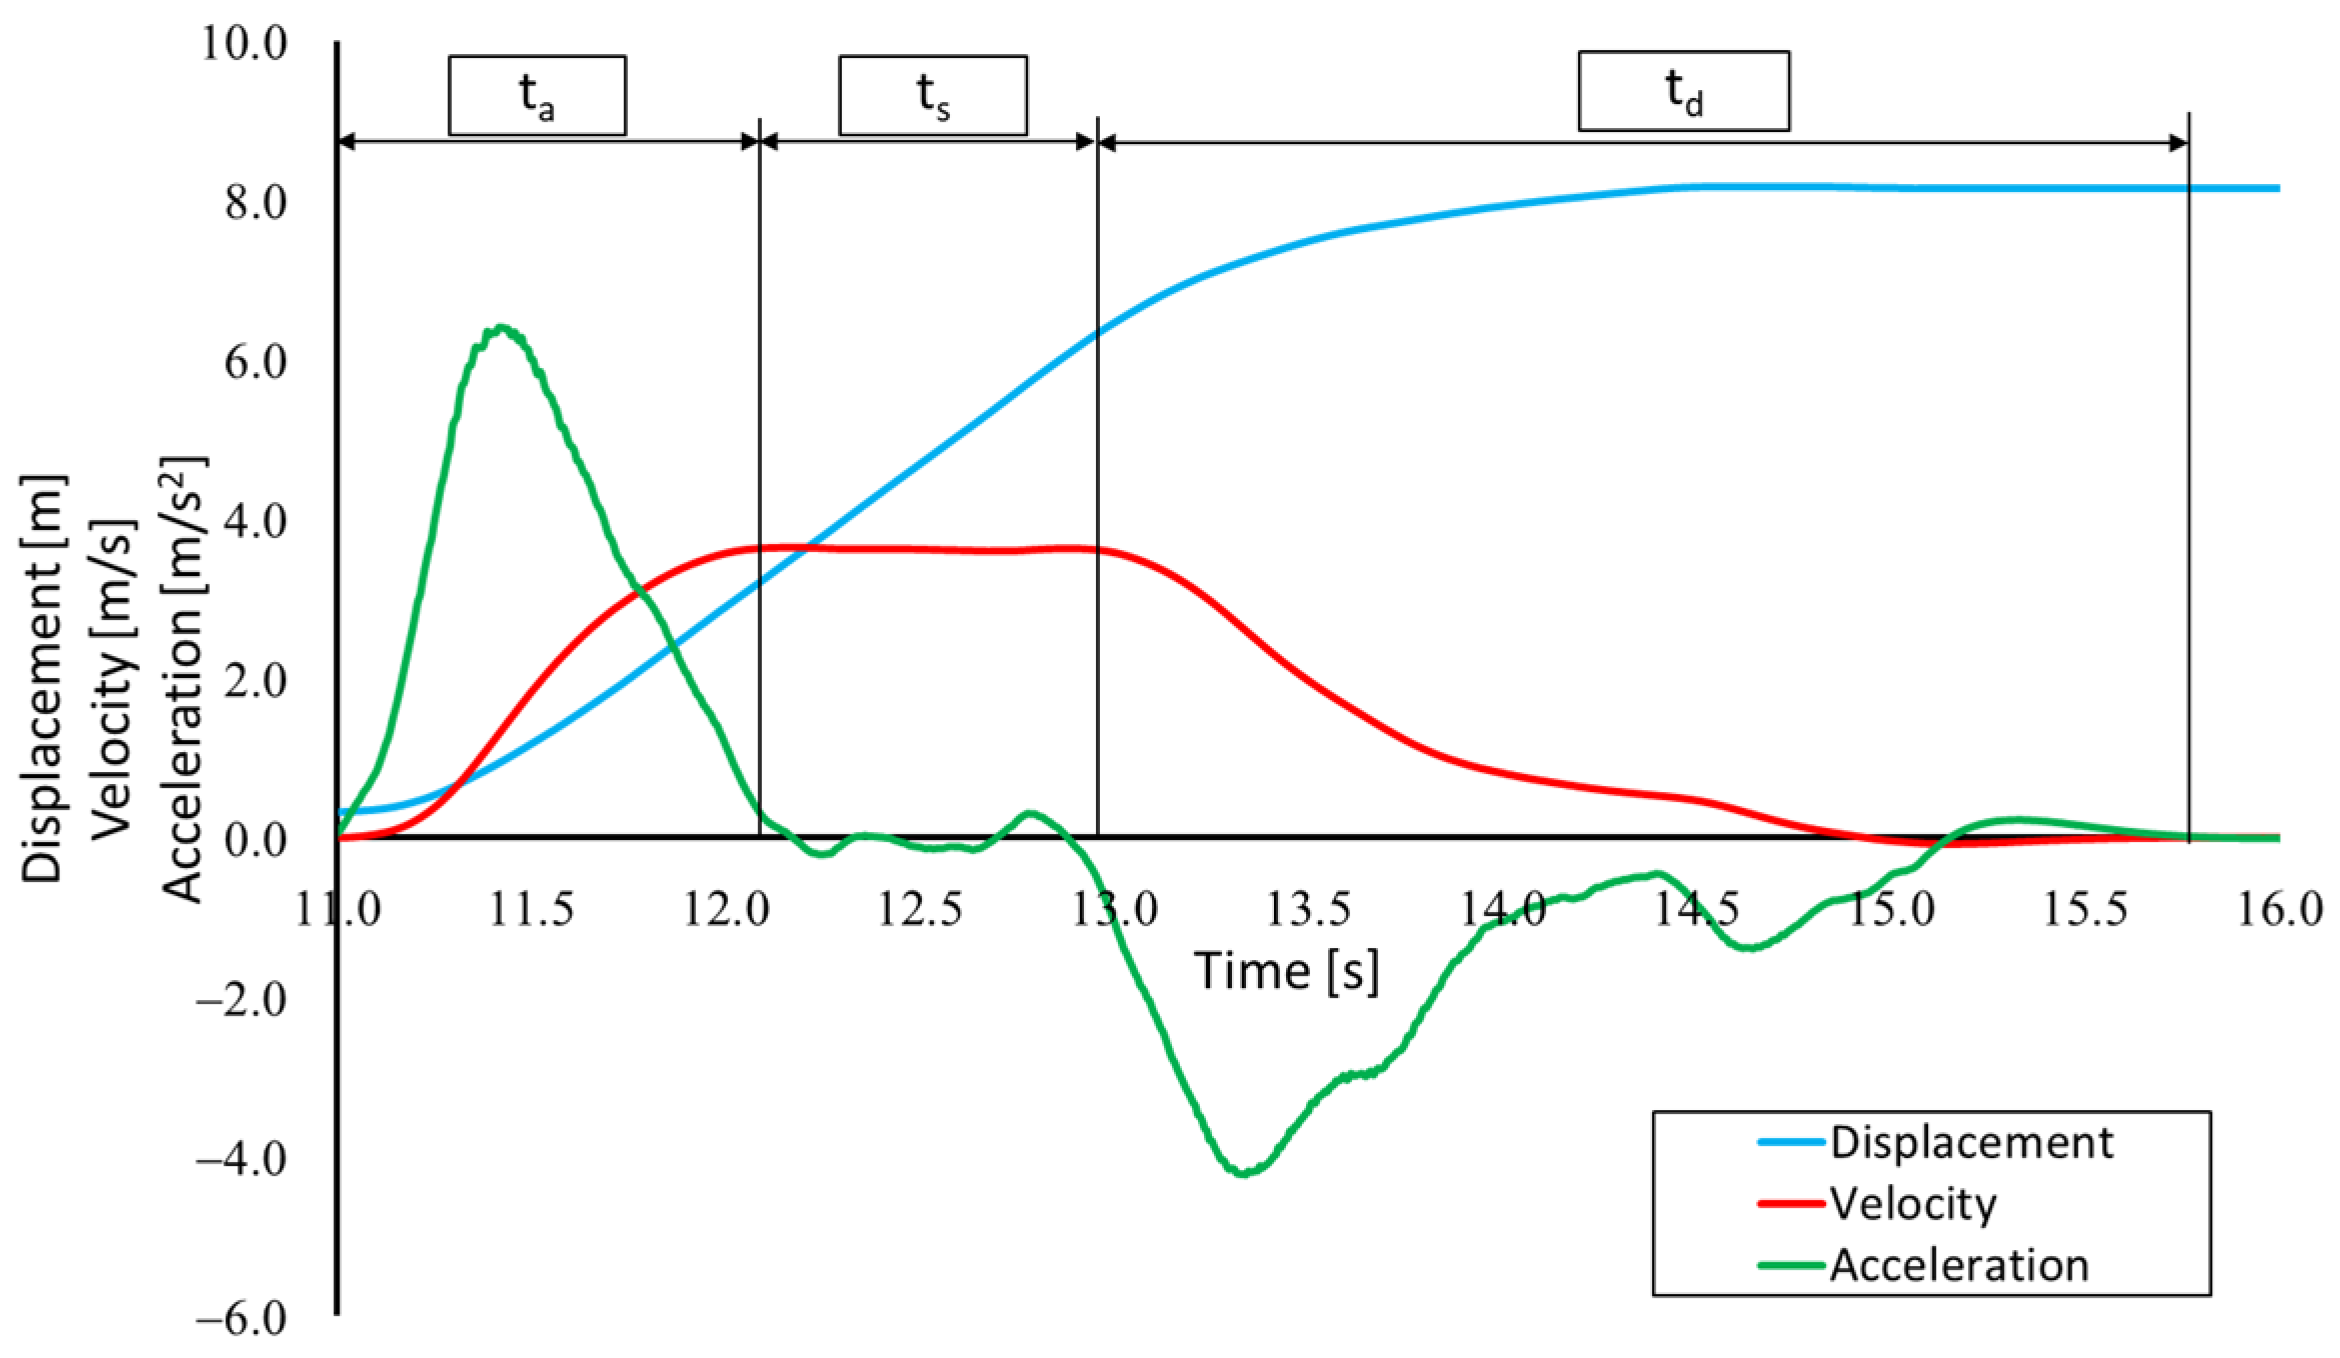
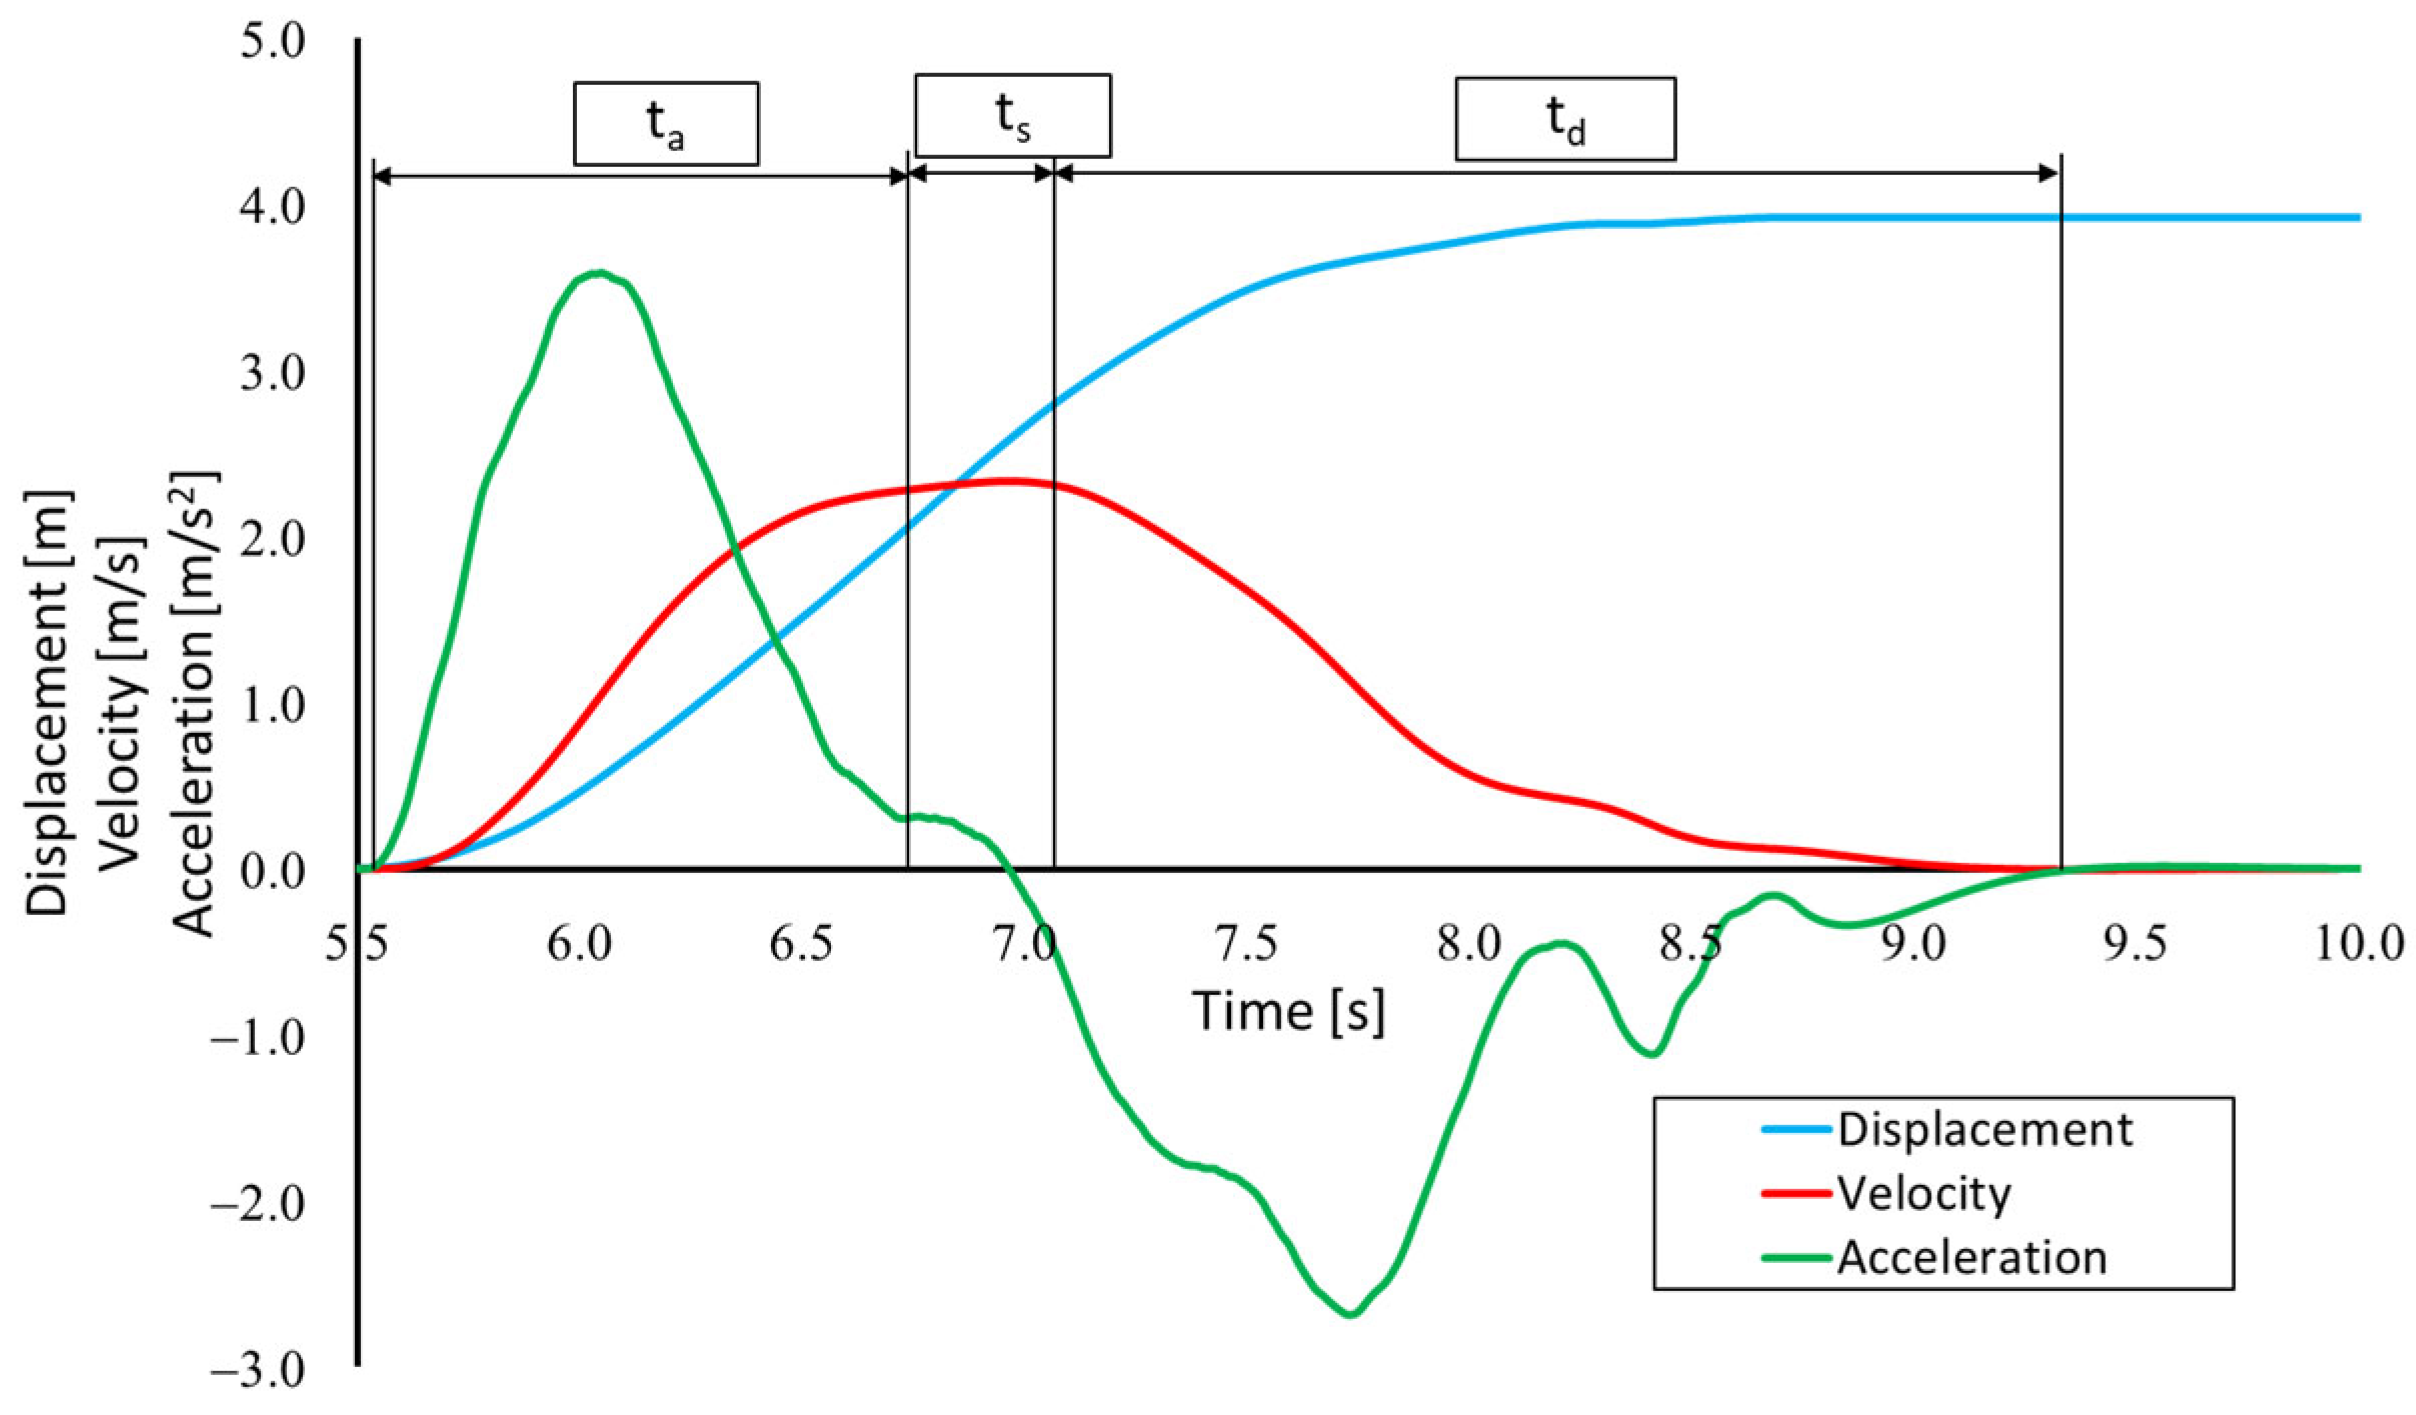
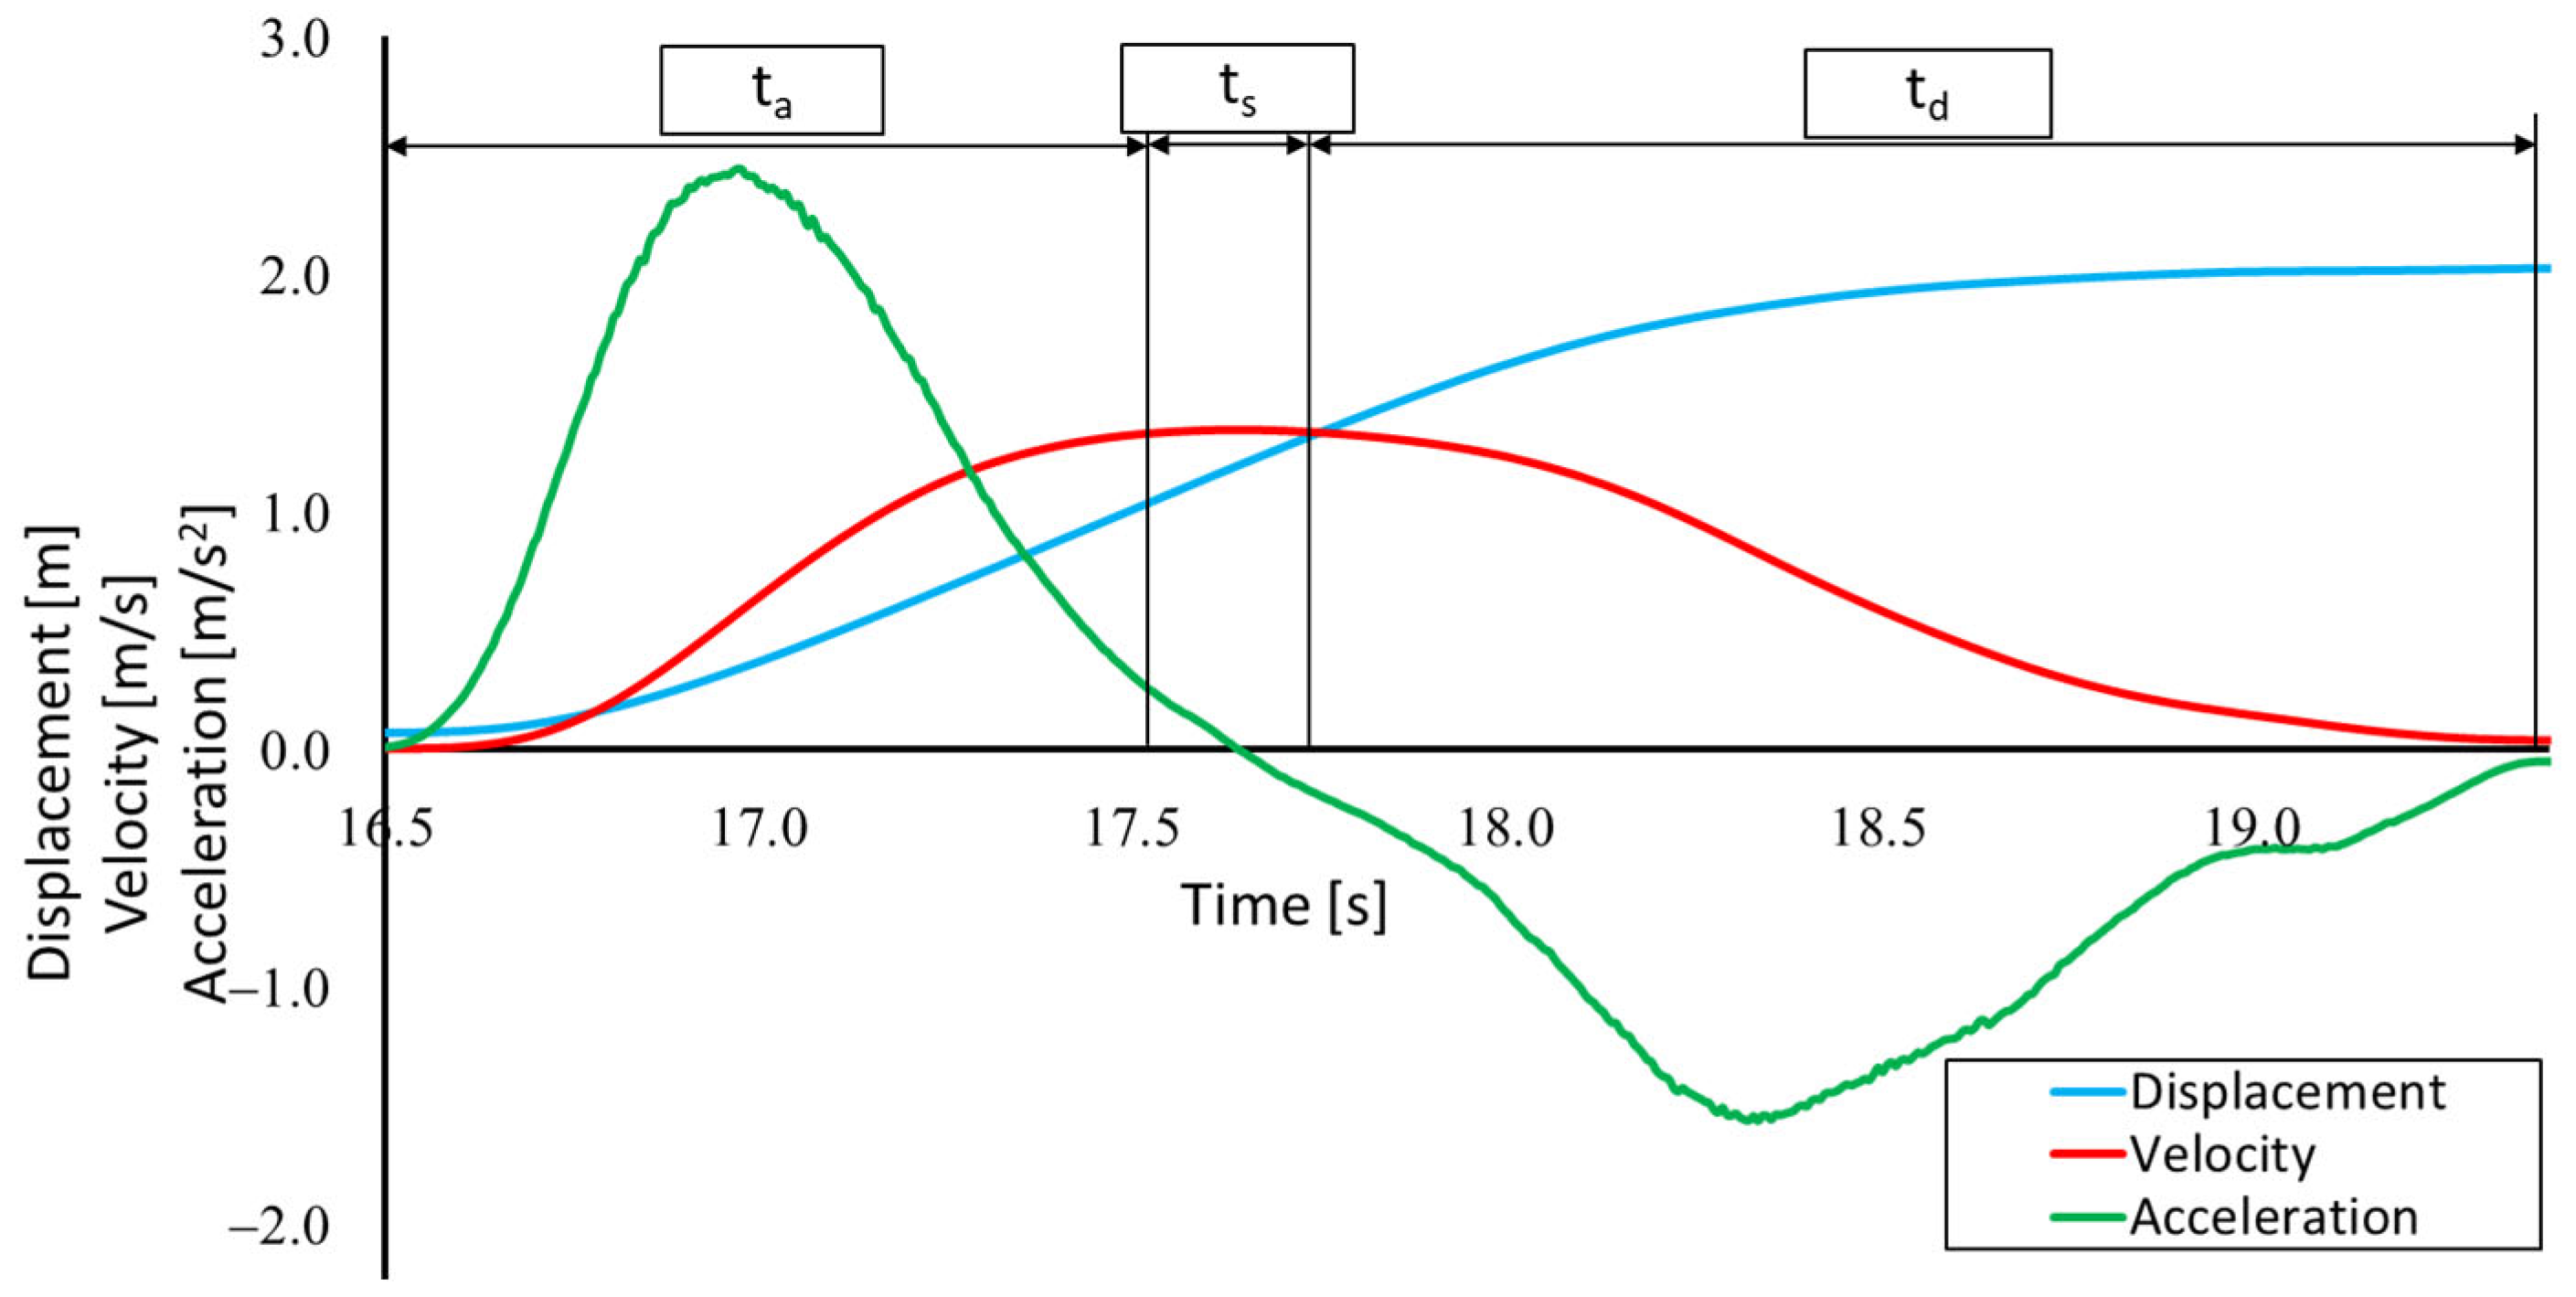
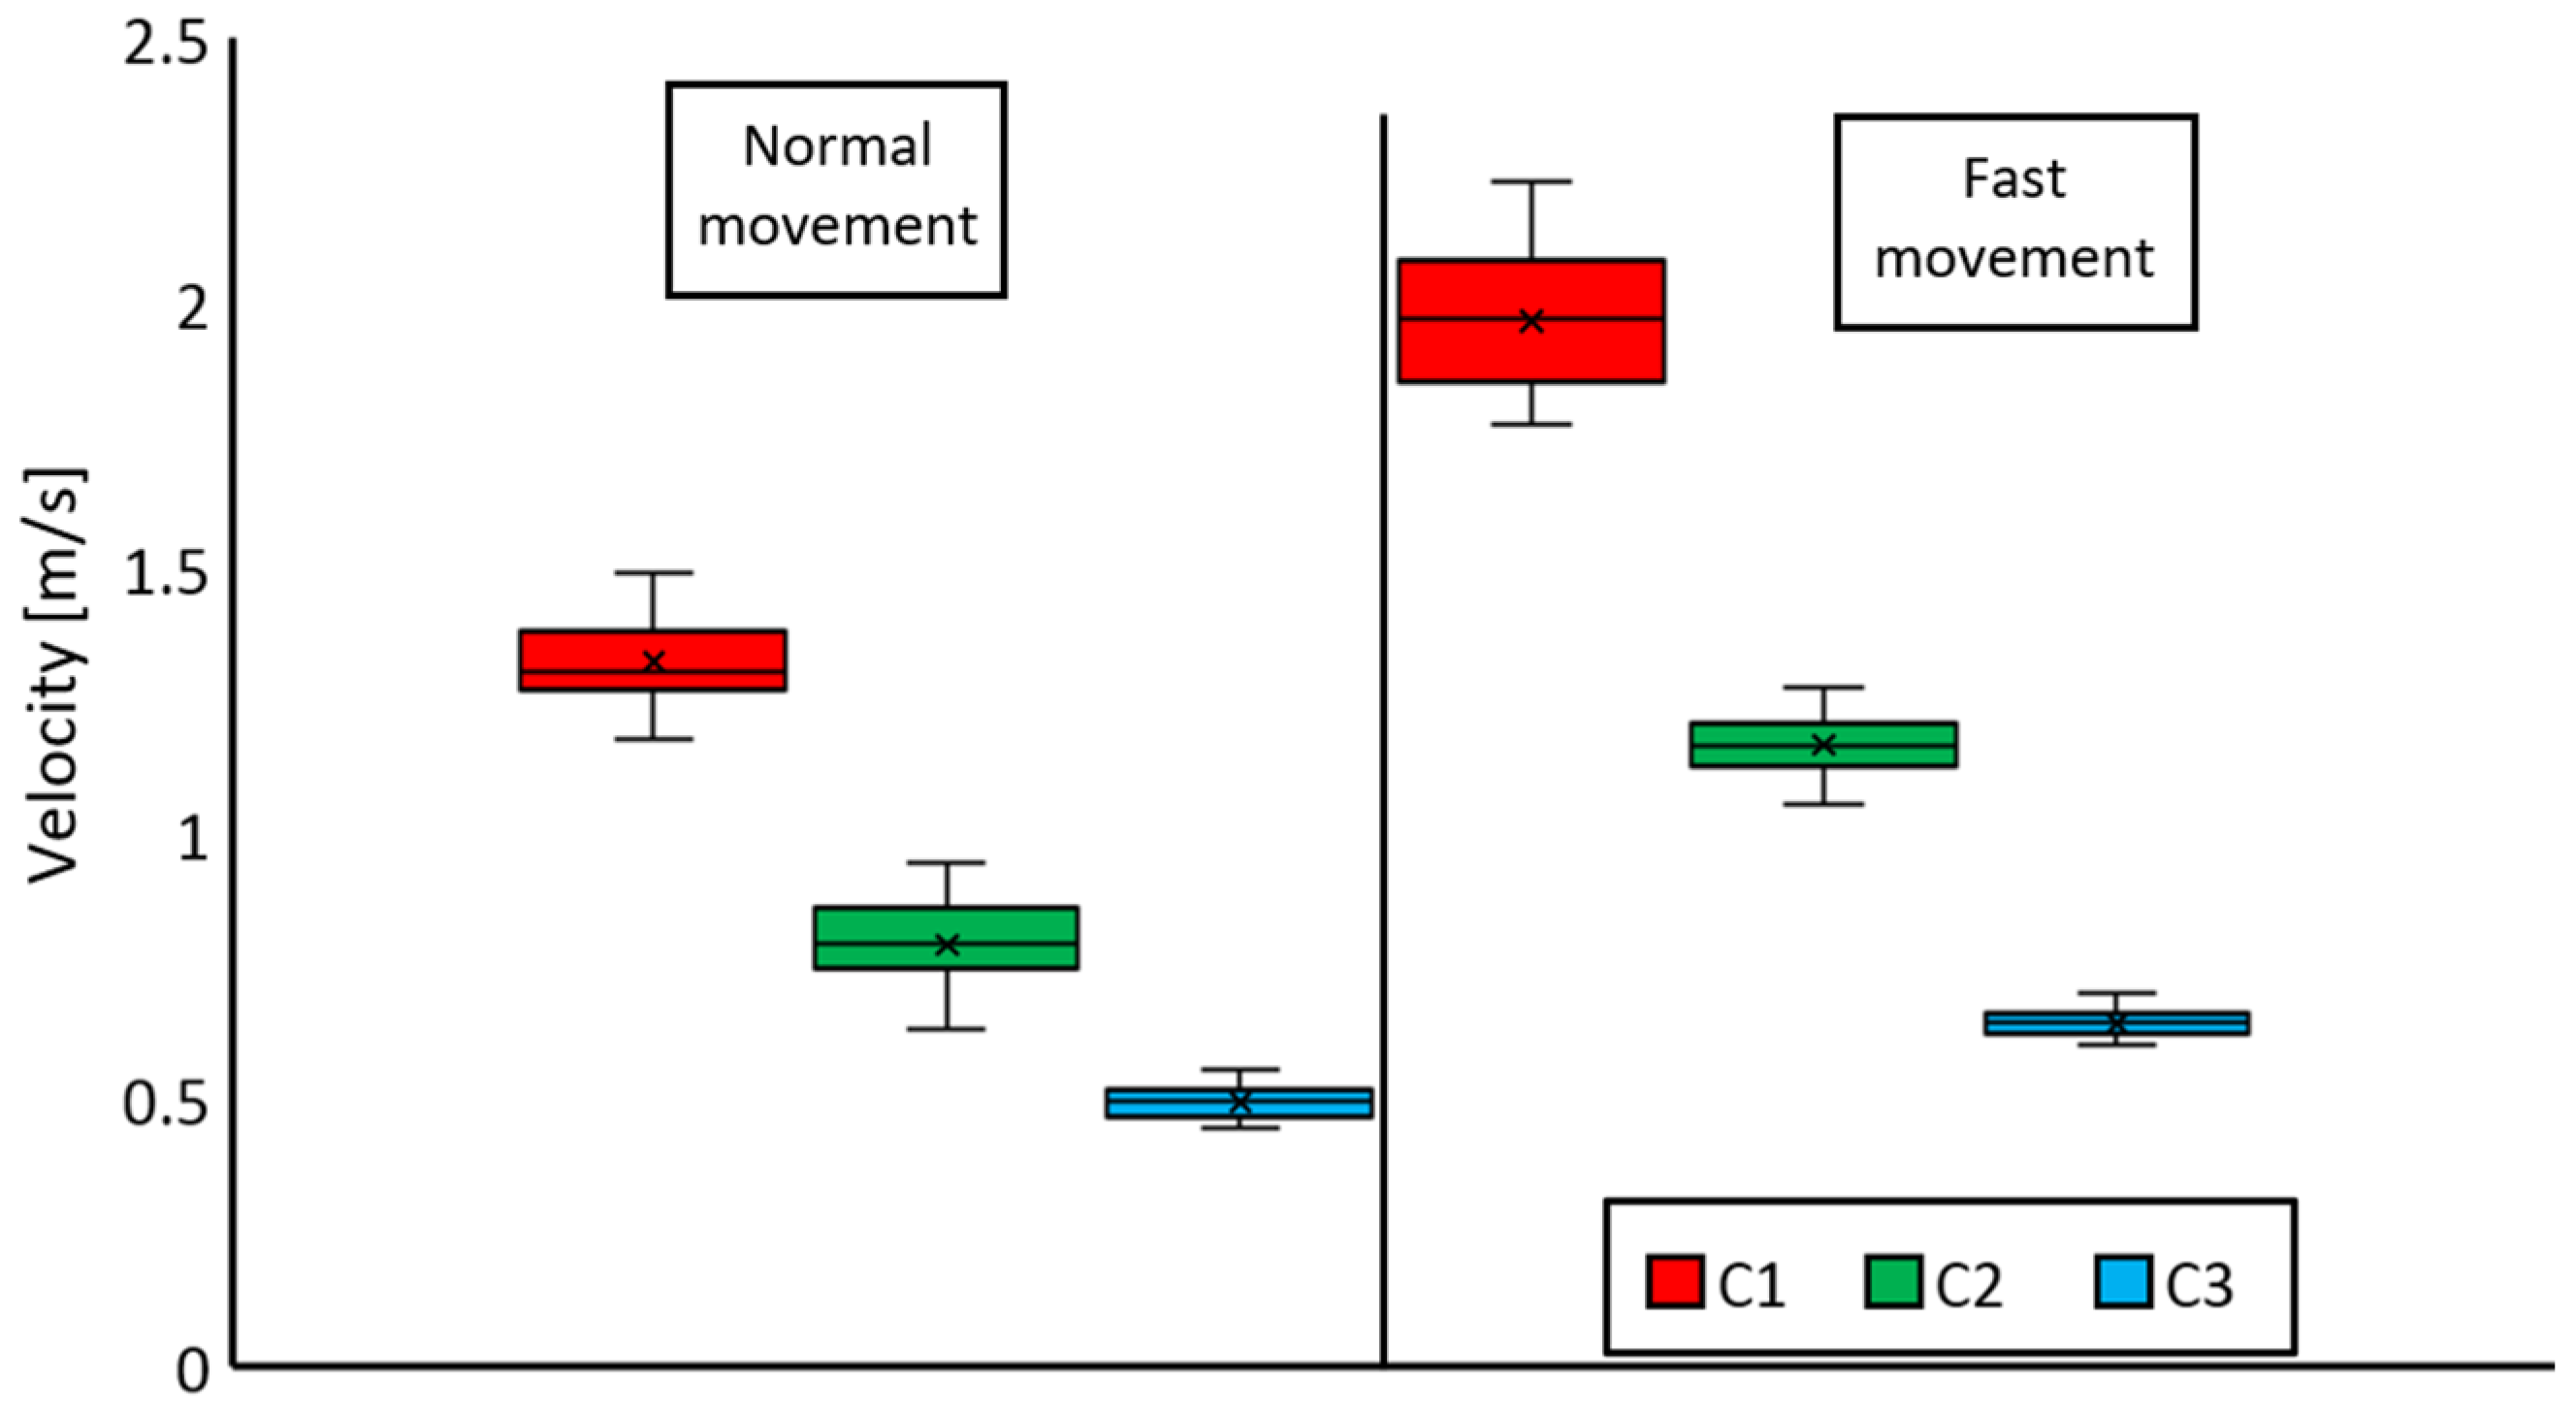
  • vs—the average effective velocity of the effector’s movement for the entire steady motion phase (PS);
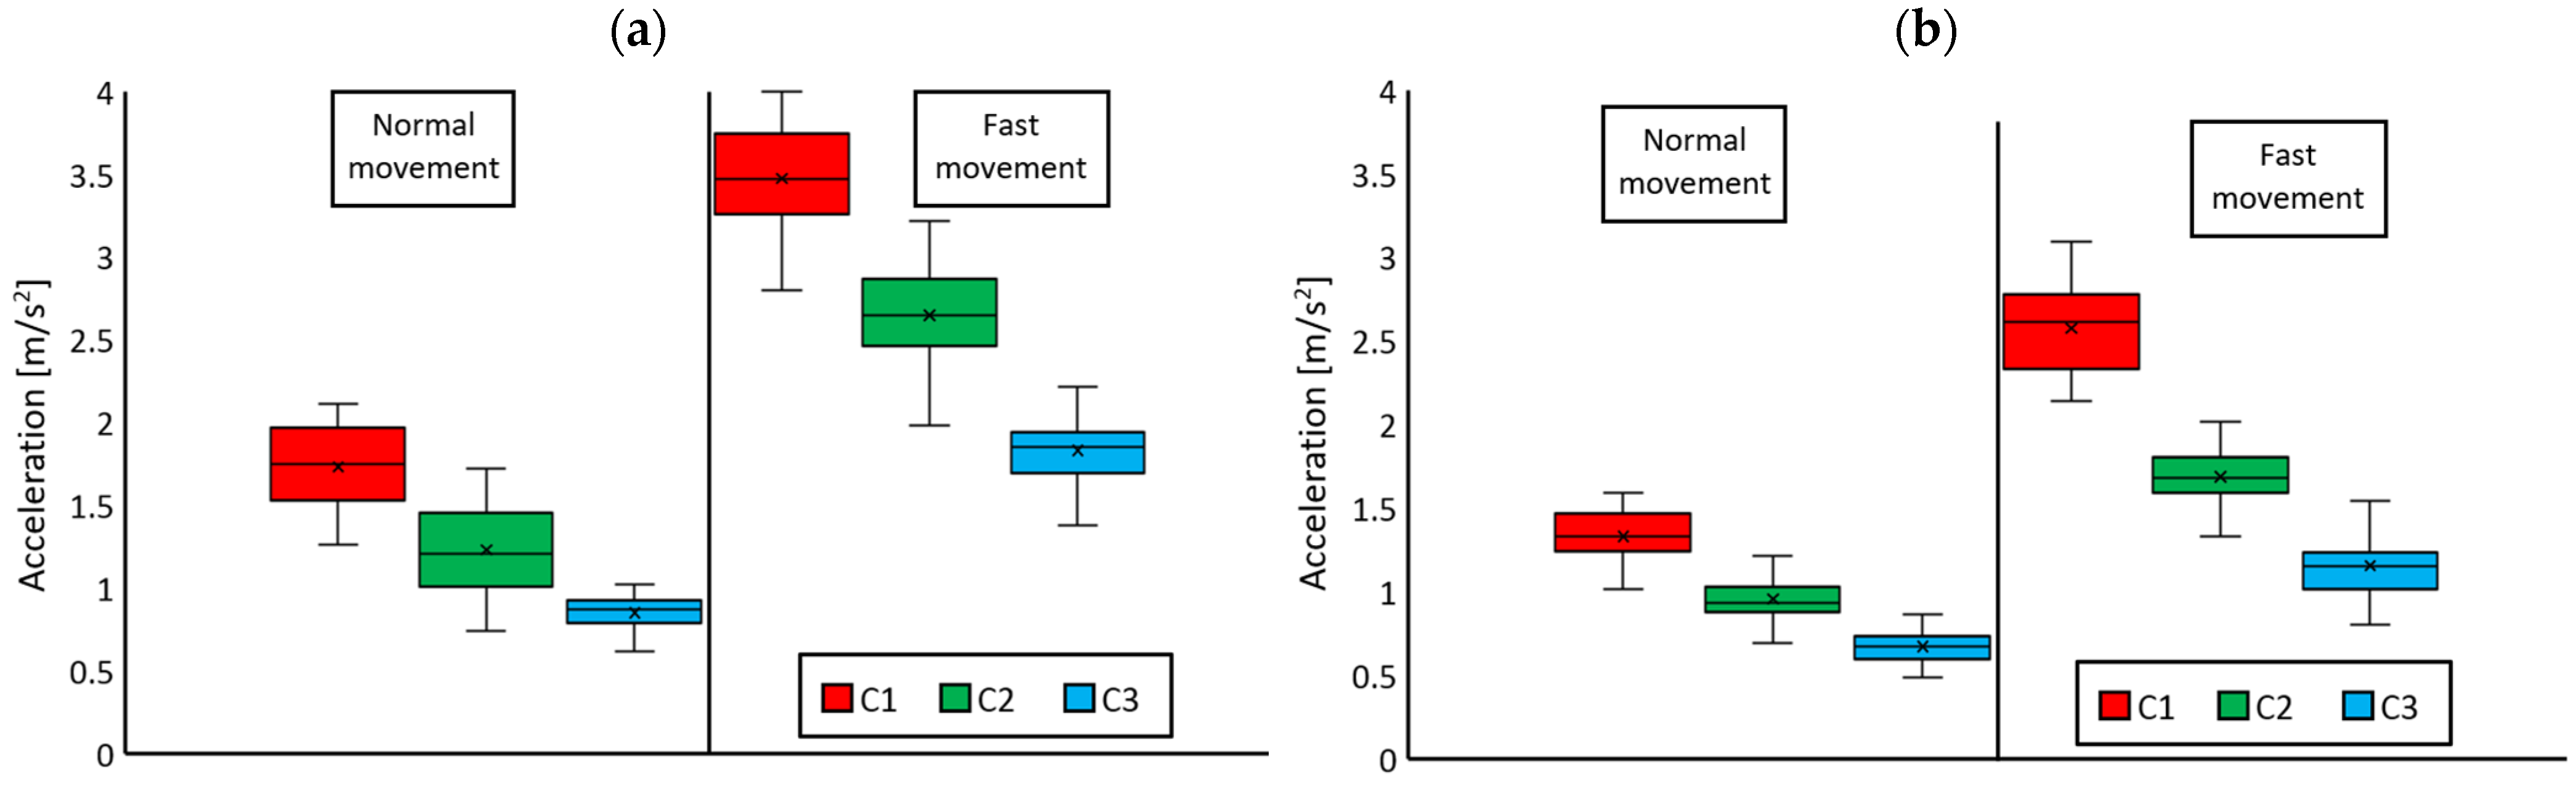
  • aamax—the maximum acceleration of the effector’s movement for the acceleration phase (PA);
  • admax—the maximum acceleration of the effector’s movement for the deceleration phase (PD);
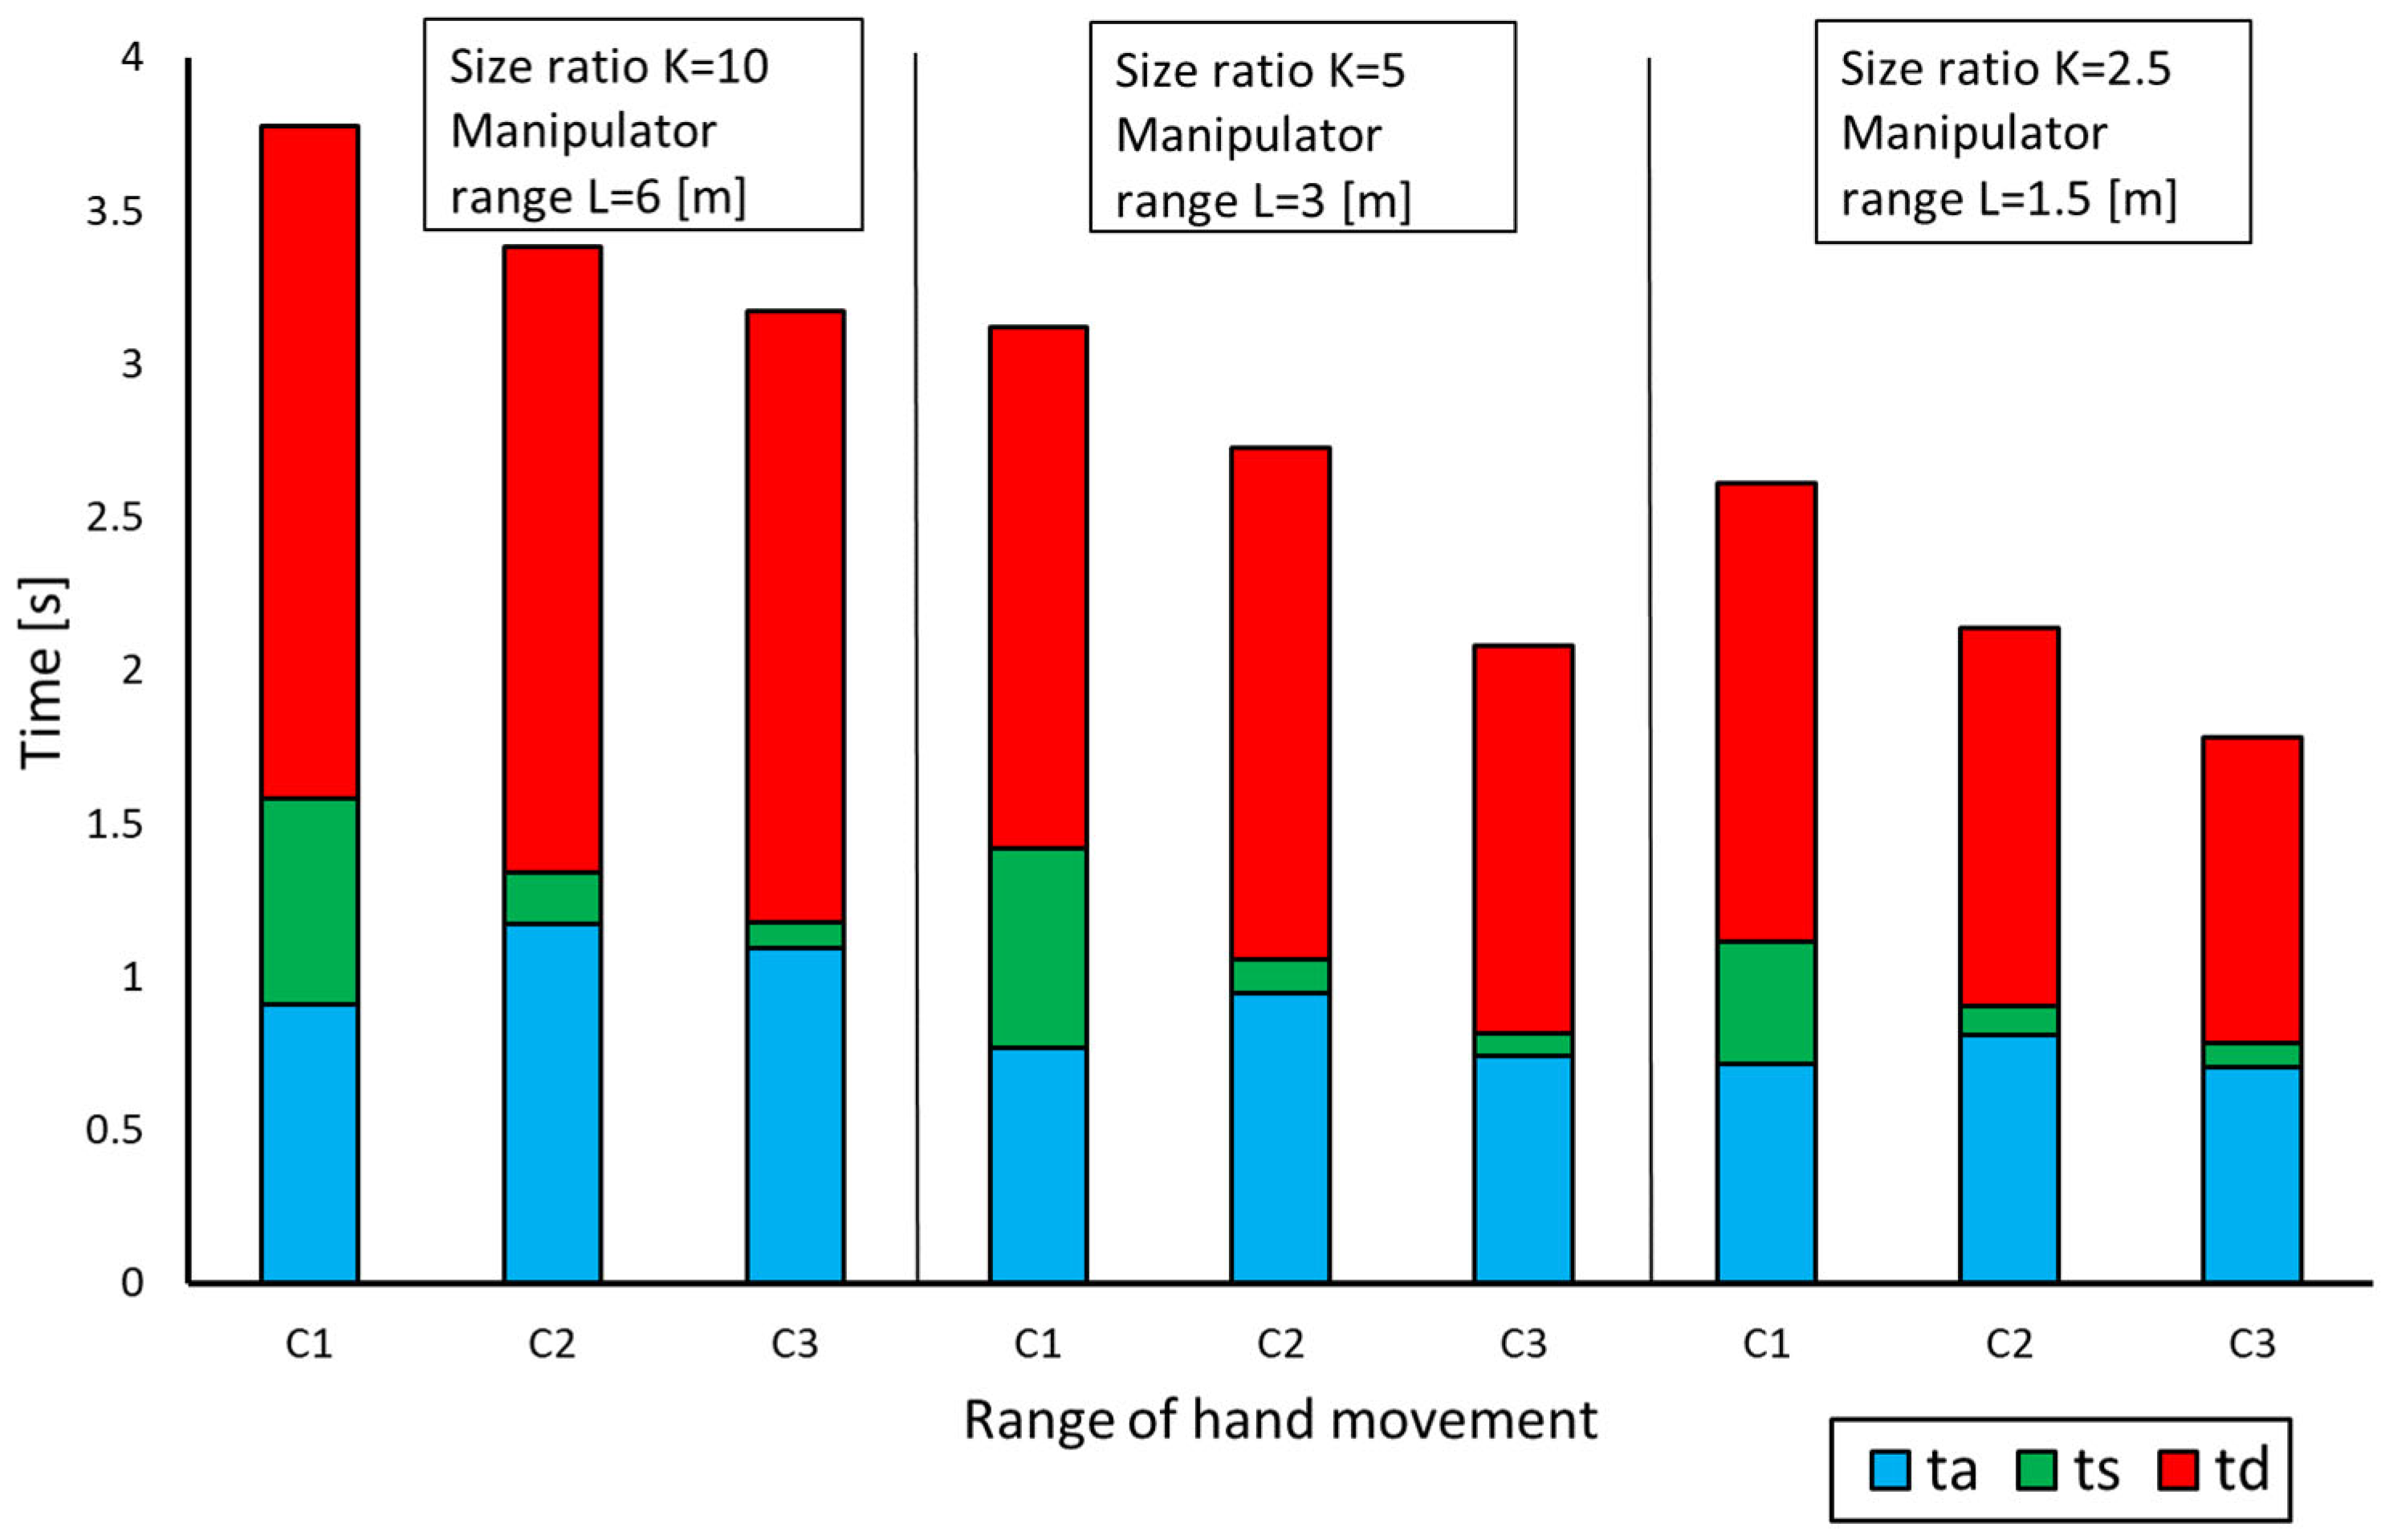
  • ts—the average steady motion phase duration;
  • ta—the average acceleration phase (PA) duration;
  • td—the average deceleration phase (PD) duration.
Based on the recorded runs, the maximum value of power indicators was determined for the following phases:
  • Acceleration phase N a m a x * according to the following equation:
    N a m a x * = max v ( t ) · a ( t )               t < t 1 , t 2 >
  • Deceleration phase N d m a x * according to the following equation:
    N d m a x * = max v ( t ) · a ( t )               t < t 3 , t 4 >
Energy consumption indicators, according to [41], were determined for the following phases:
  • Acceleration phase E k a * according to the following equation:
    E k a * = t 1 t 2 v ( t ) · a ( t ) d t
  • Steady motion phase E k s * according to the following equation:
    E k s * = t 2 t 3 v ( t ) · a ( t ) d t
  • Deceleration phase E k d * according to the following equation:
    E k d * = t 3 t 4 v ( t ) · a ( t ) d t
All subjects performed normal and fast movements with their dominant hand. Each subject performed trials with six normal and six fast movements for each. Therefore, the number of recorded, normal movements was 1620 (30 subjects × 6 movements × 3 lengths of hand movement × 3 size ratio), and for fast movements, it was the same number of records, 1620 (30 subjects × 6 movements × 3 lengths of hand movement × 3 size ratio). This test was conducted after two practice trials.

2.2. Participants

Two-step human hand movement velocity testing for different size ratios was conducted in a group of 30 people (male) aged 21 to 37 years with heights of 165–194 cm. The largest group of respondents (22 people) were students aged 21–22. All of these volunteers were right-handed.

3. Results and Discussion

The Shapiro–Wilk test was used to check the normality of the distribution. The distributions of the following parameters were analyzed:
-
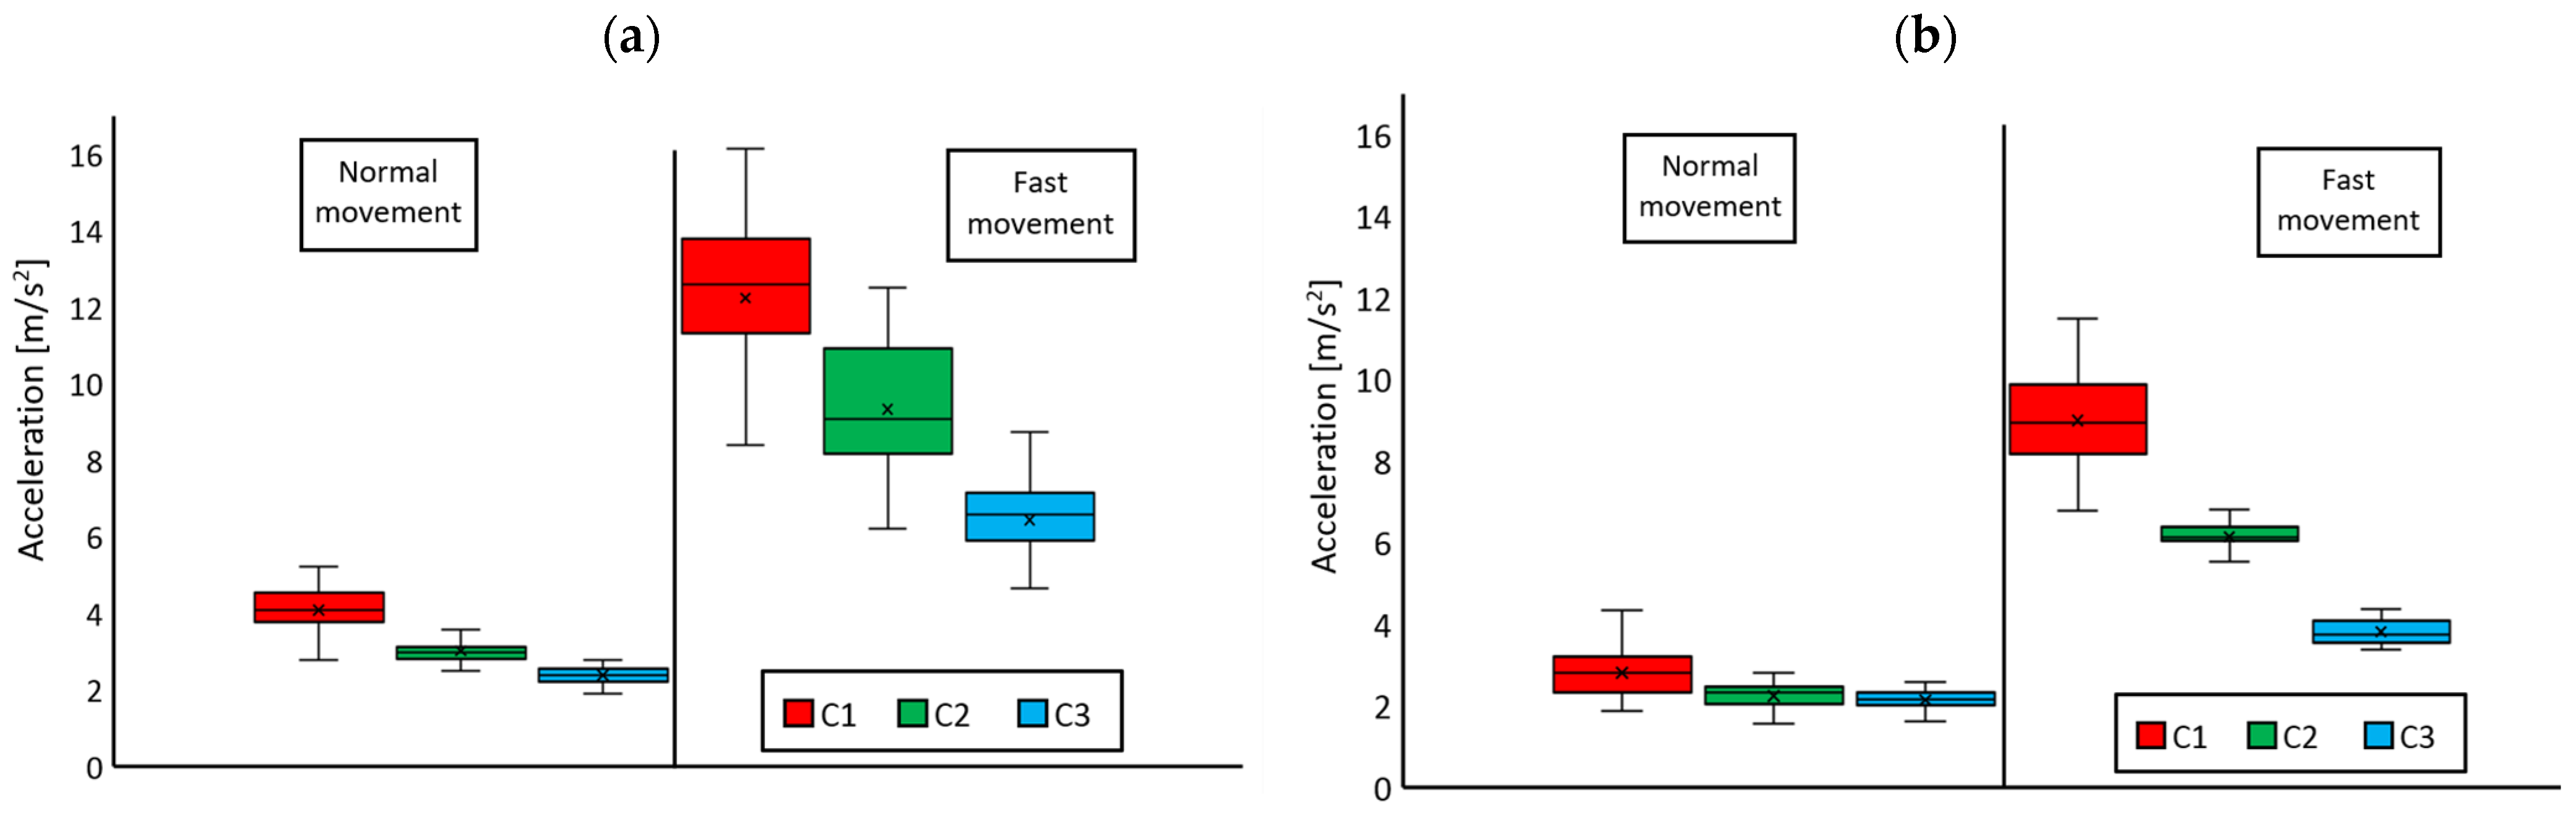
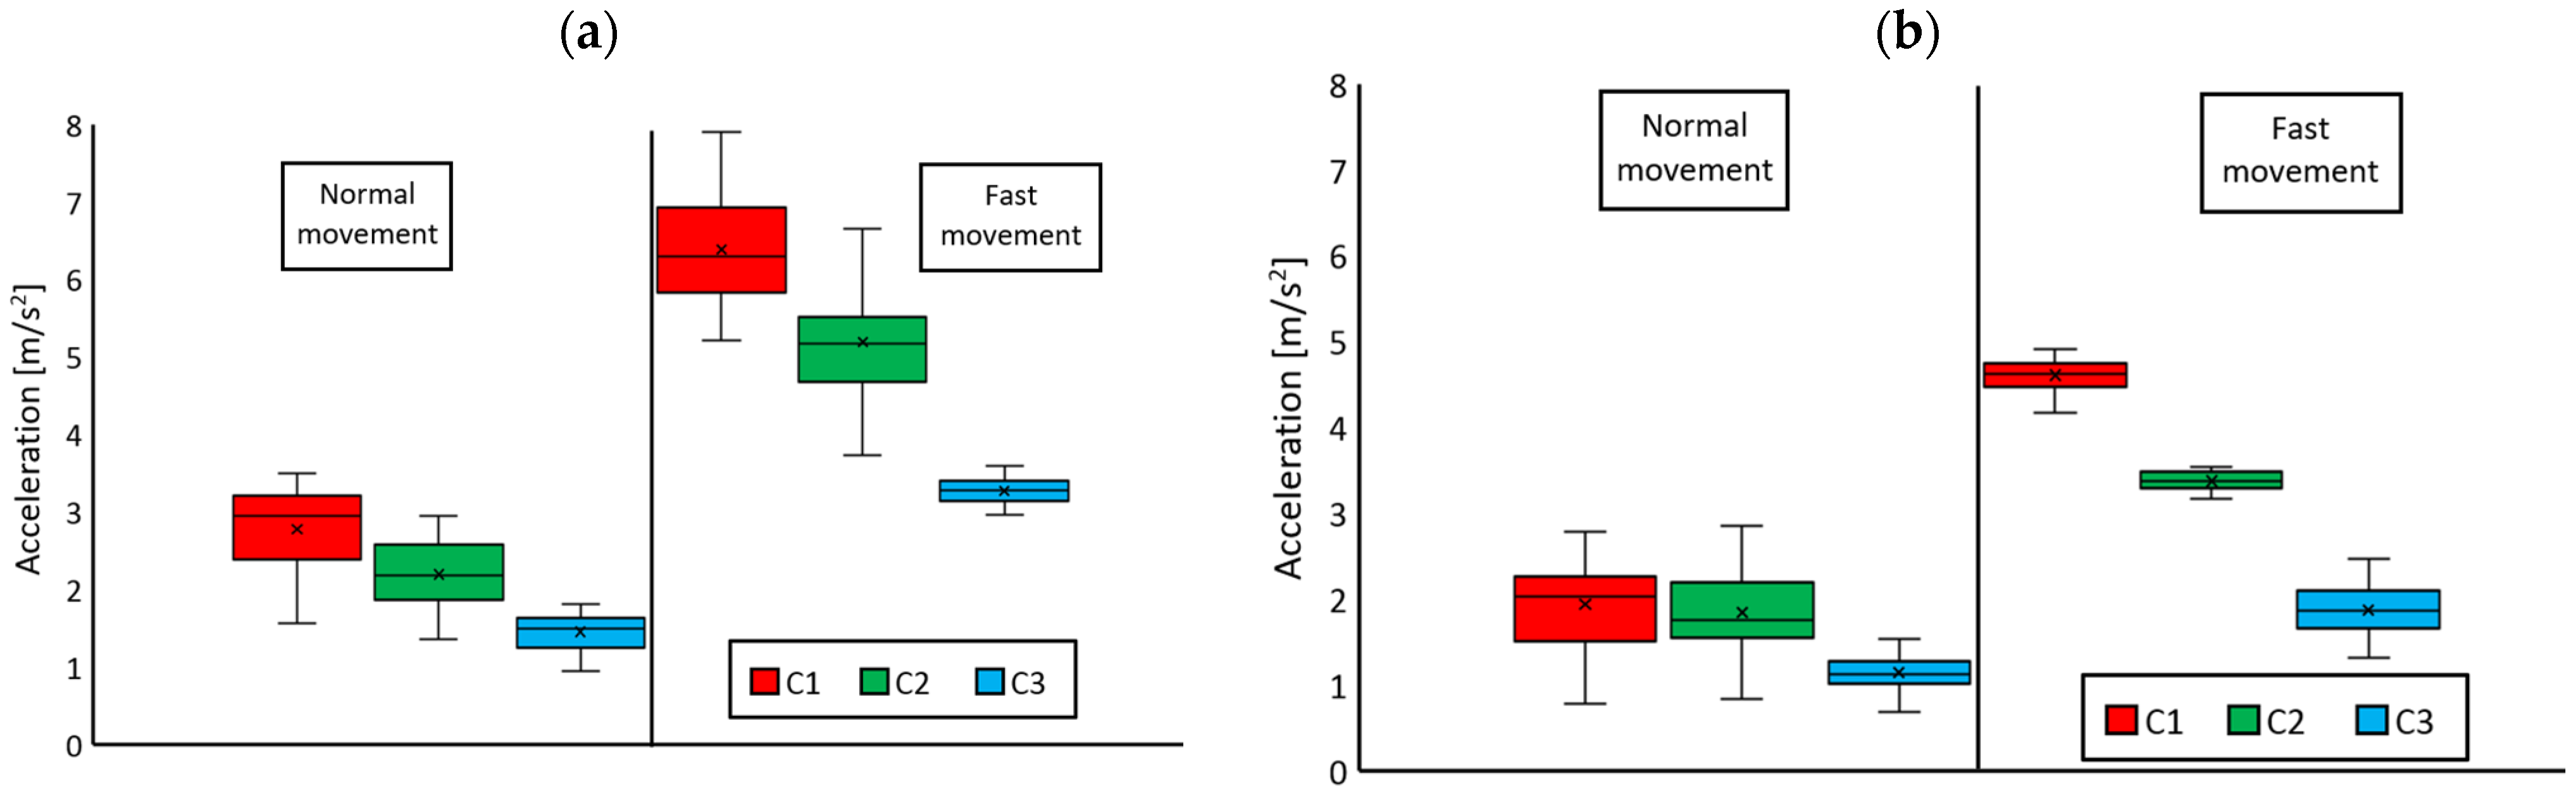
The maximum accelerations in PA—aamax i PD—admax;
-
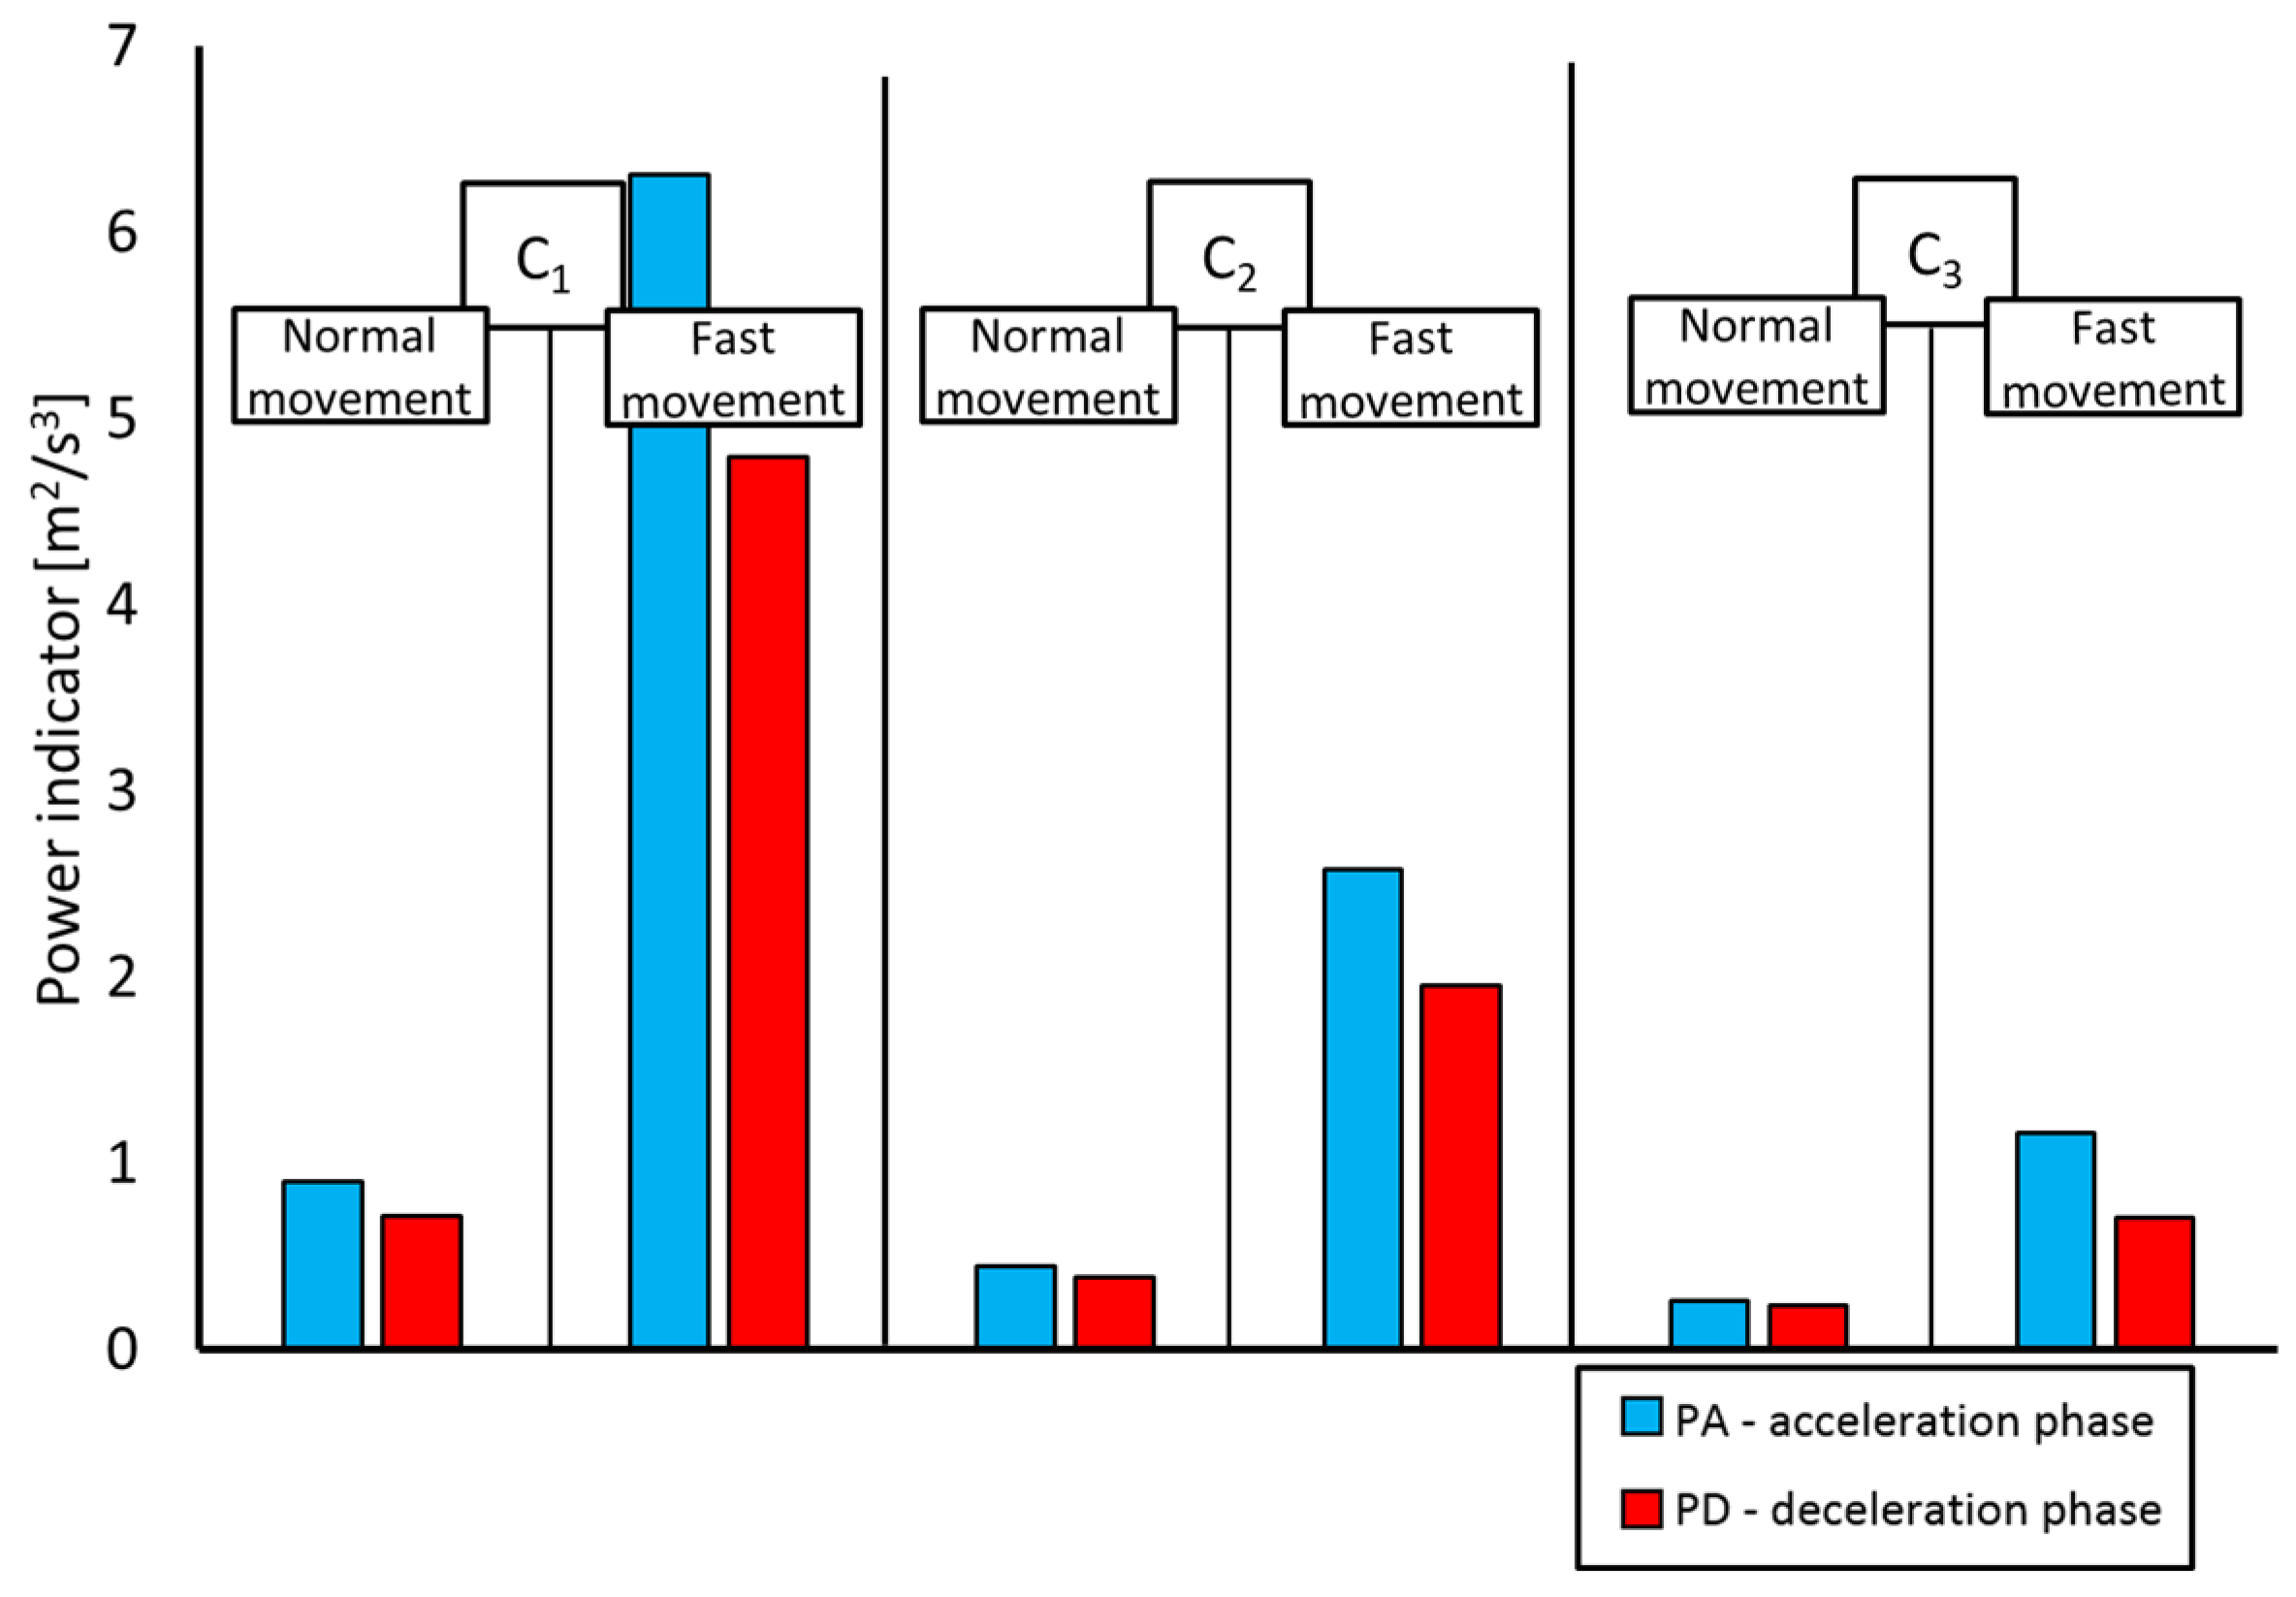
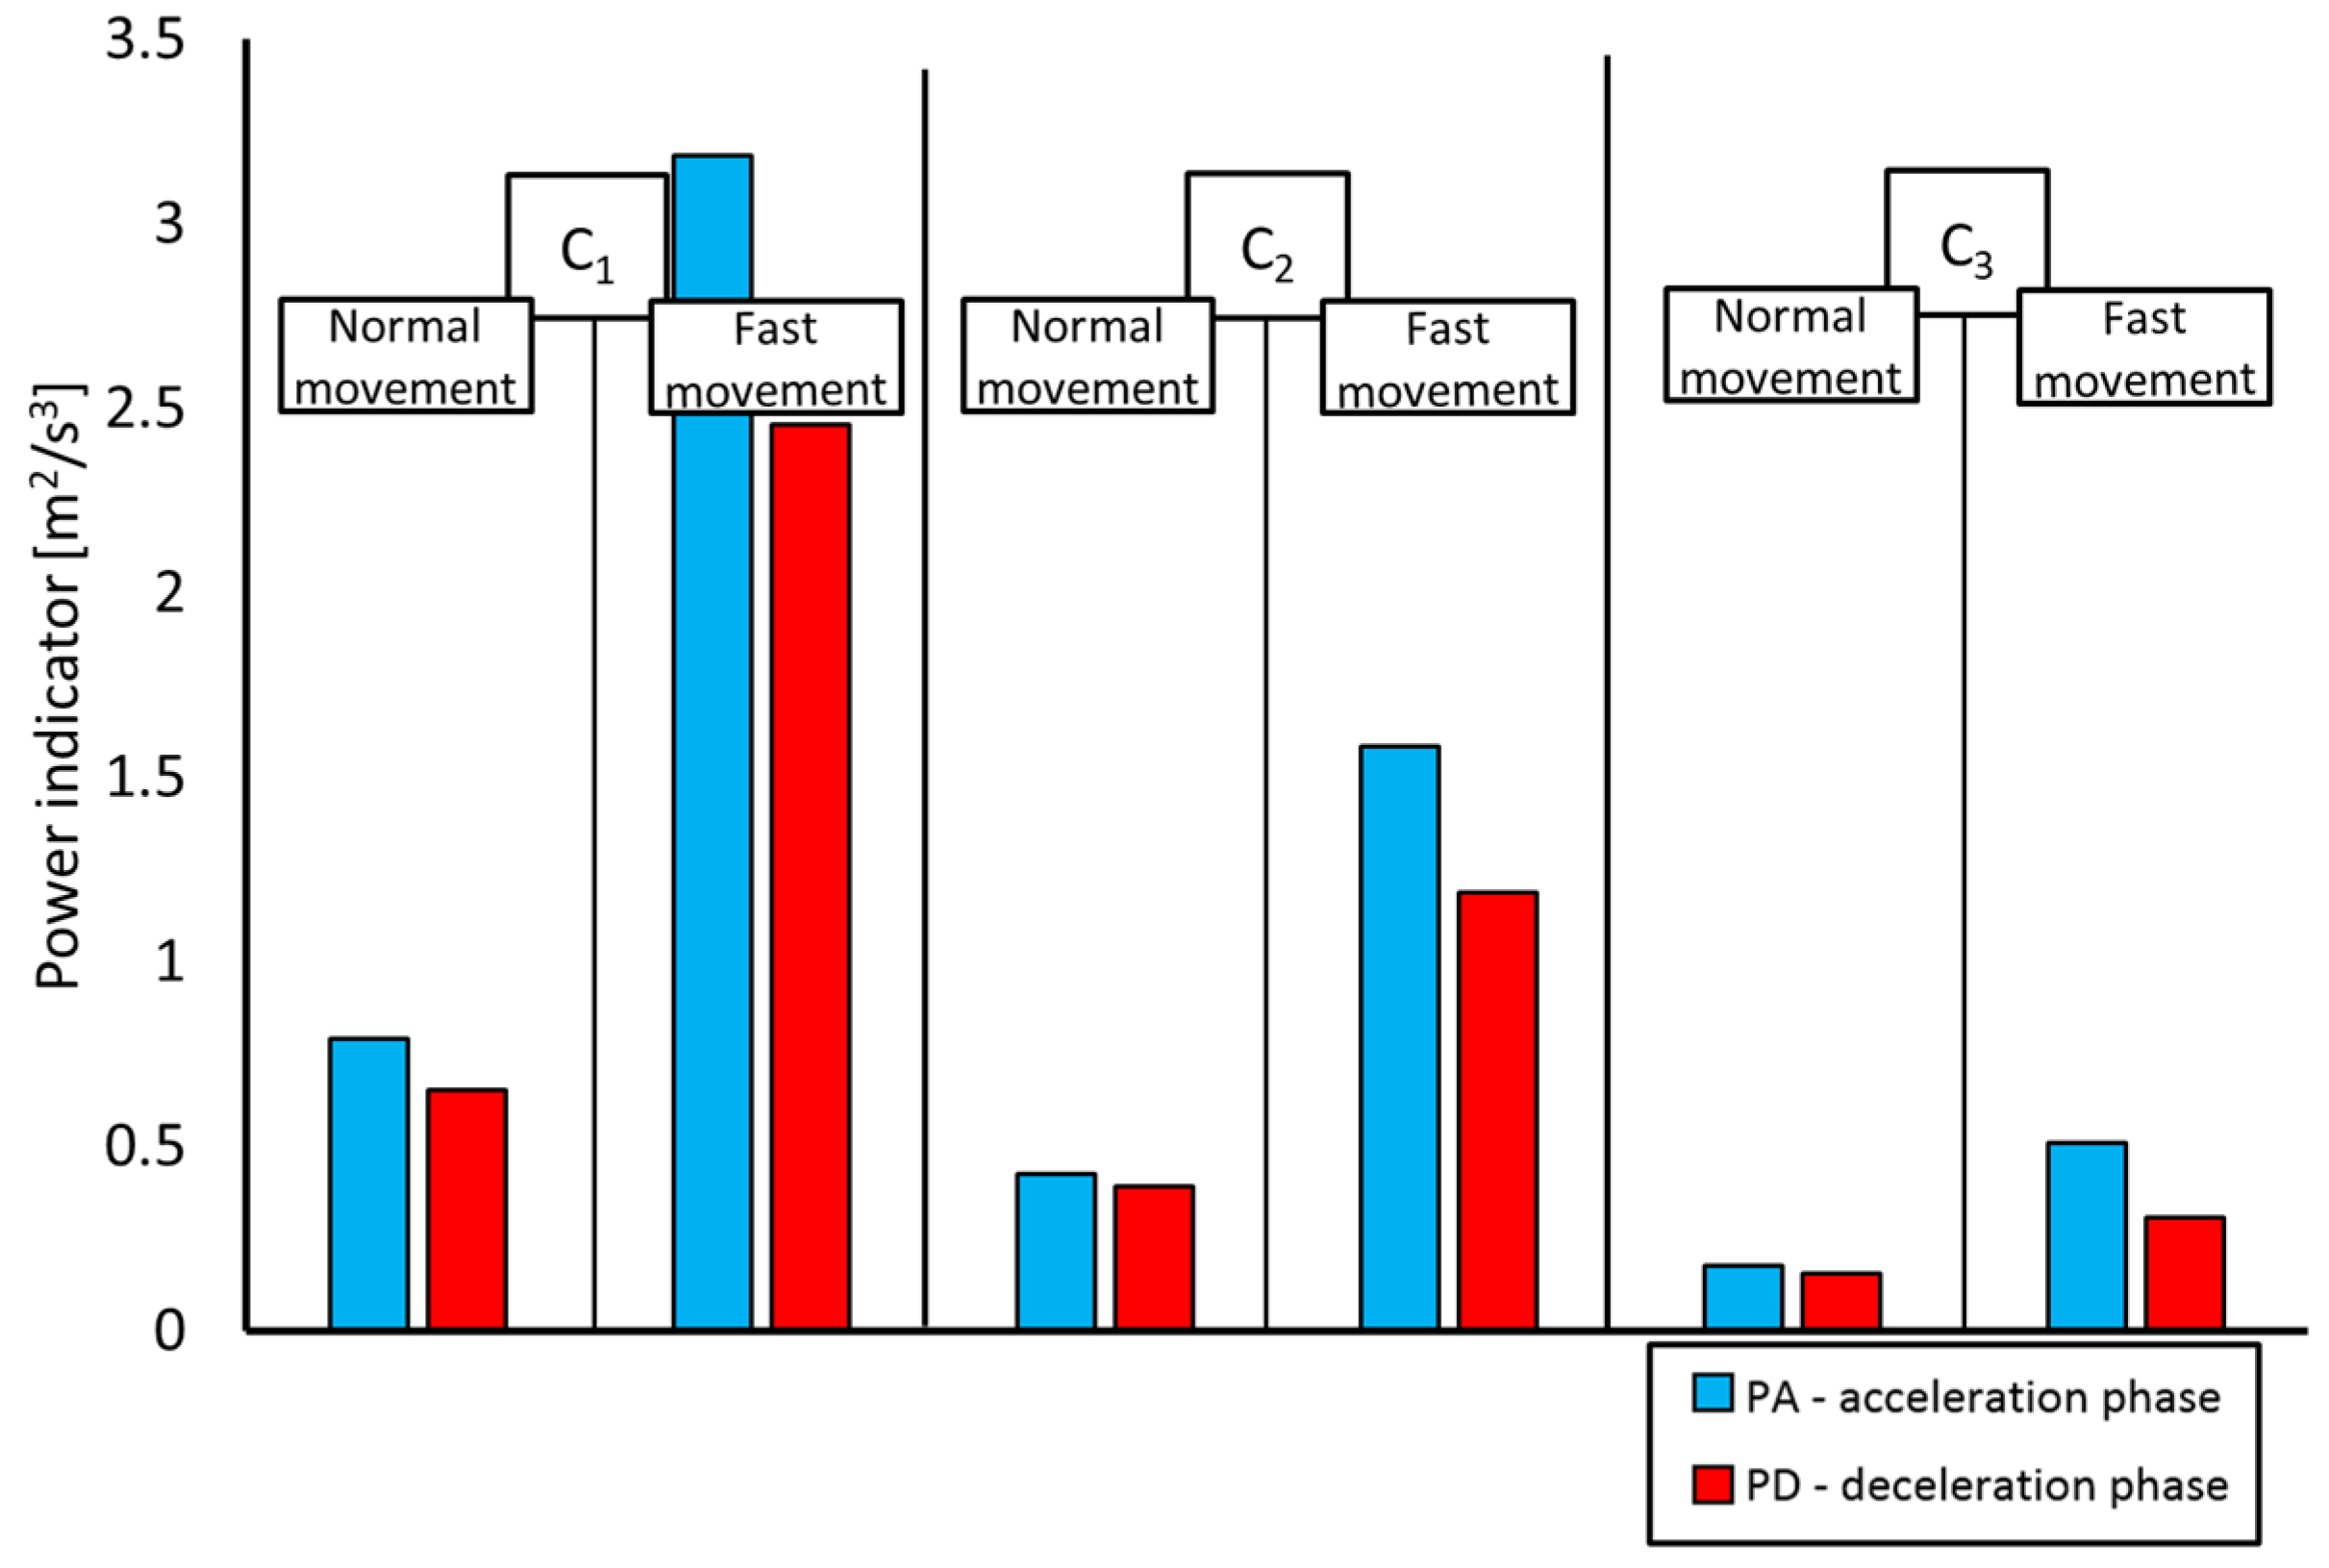
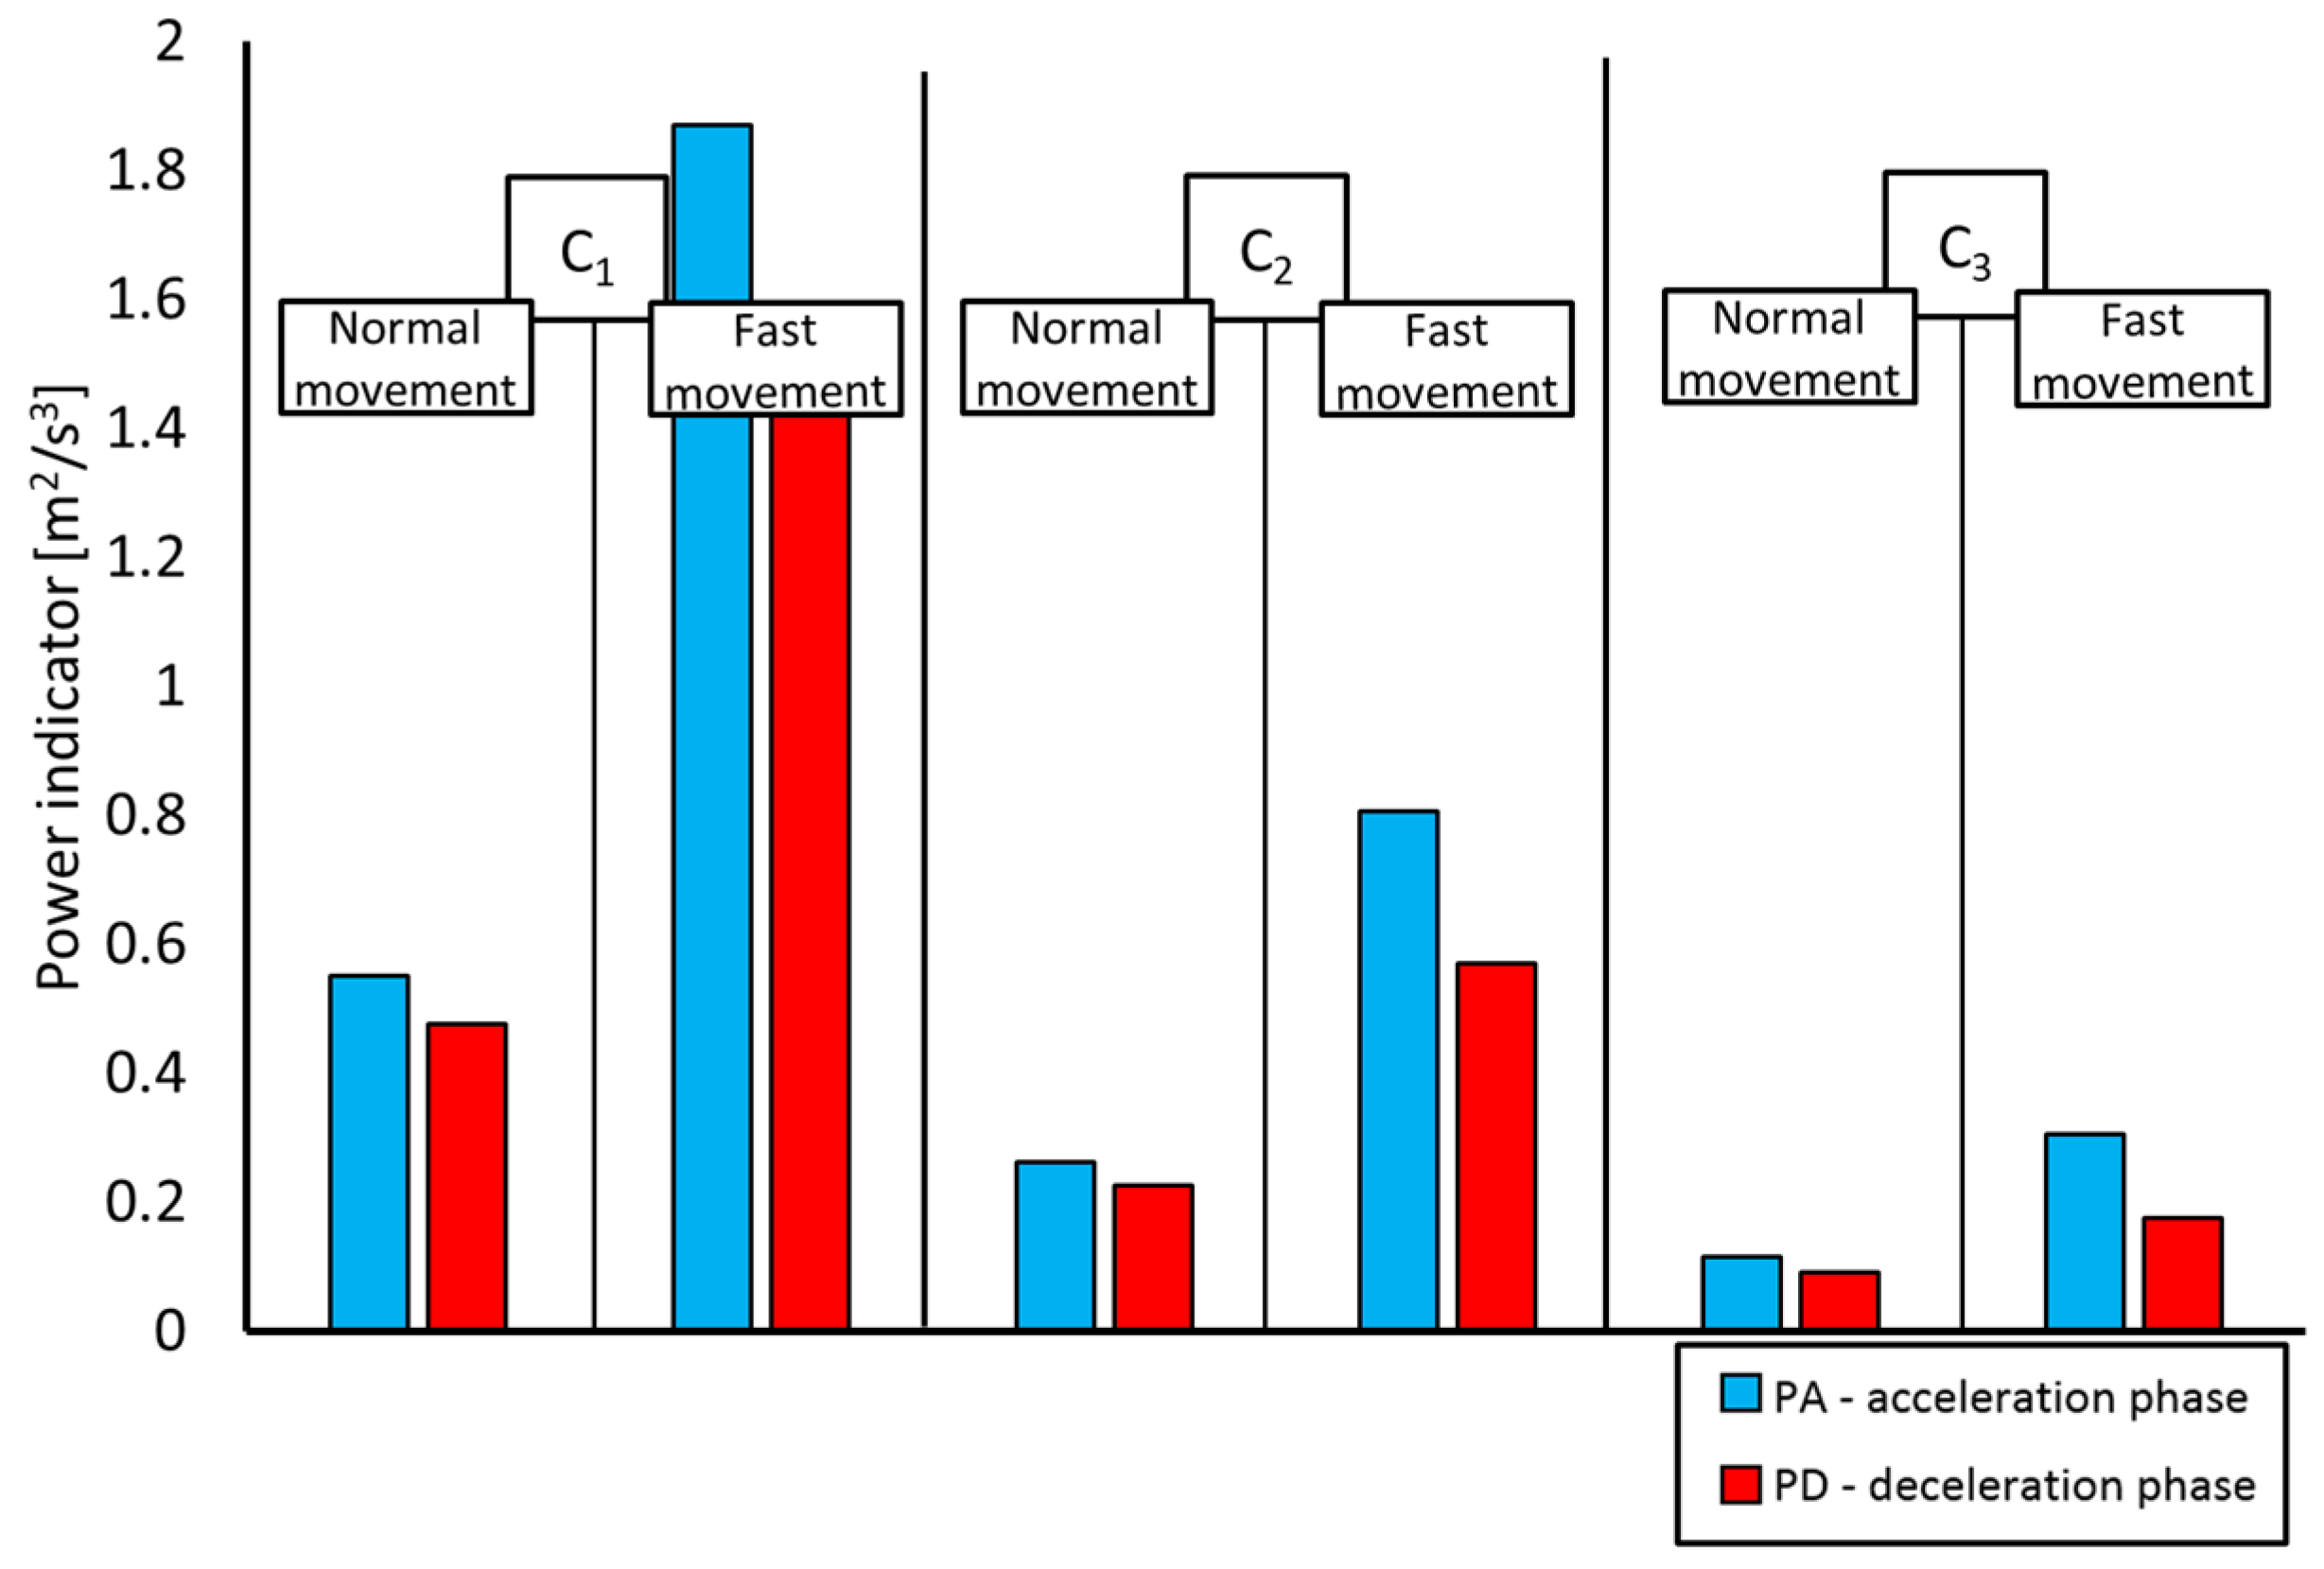
The power indicator in PA—Namax i PD—Ndmax;
-
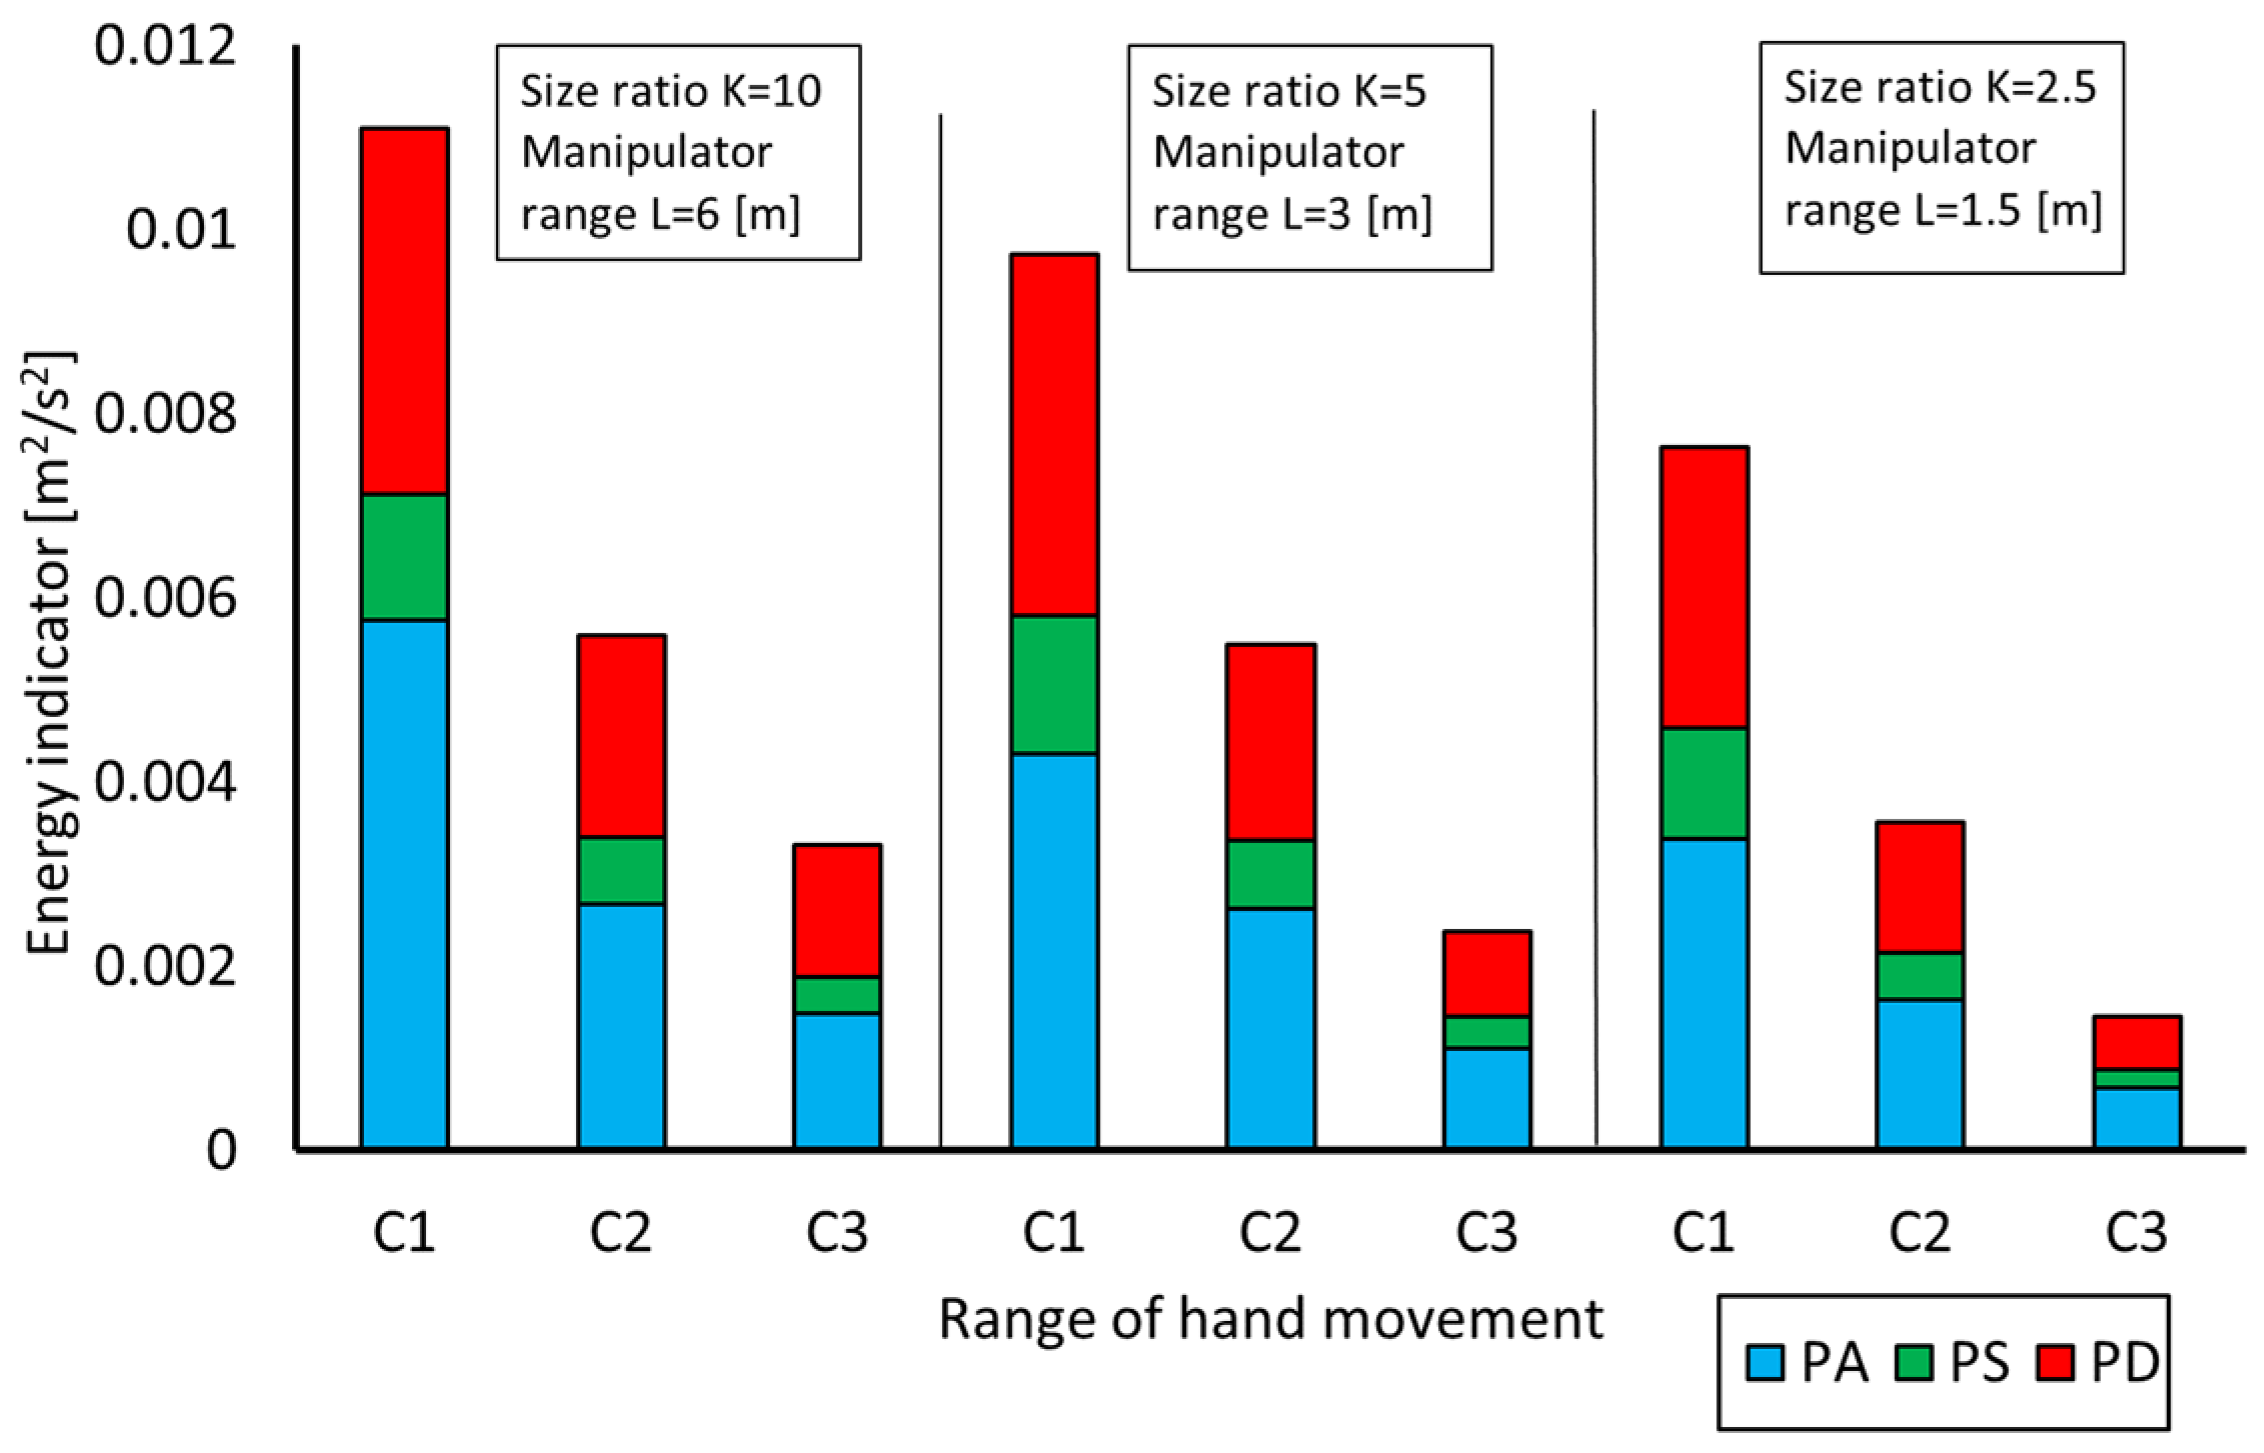
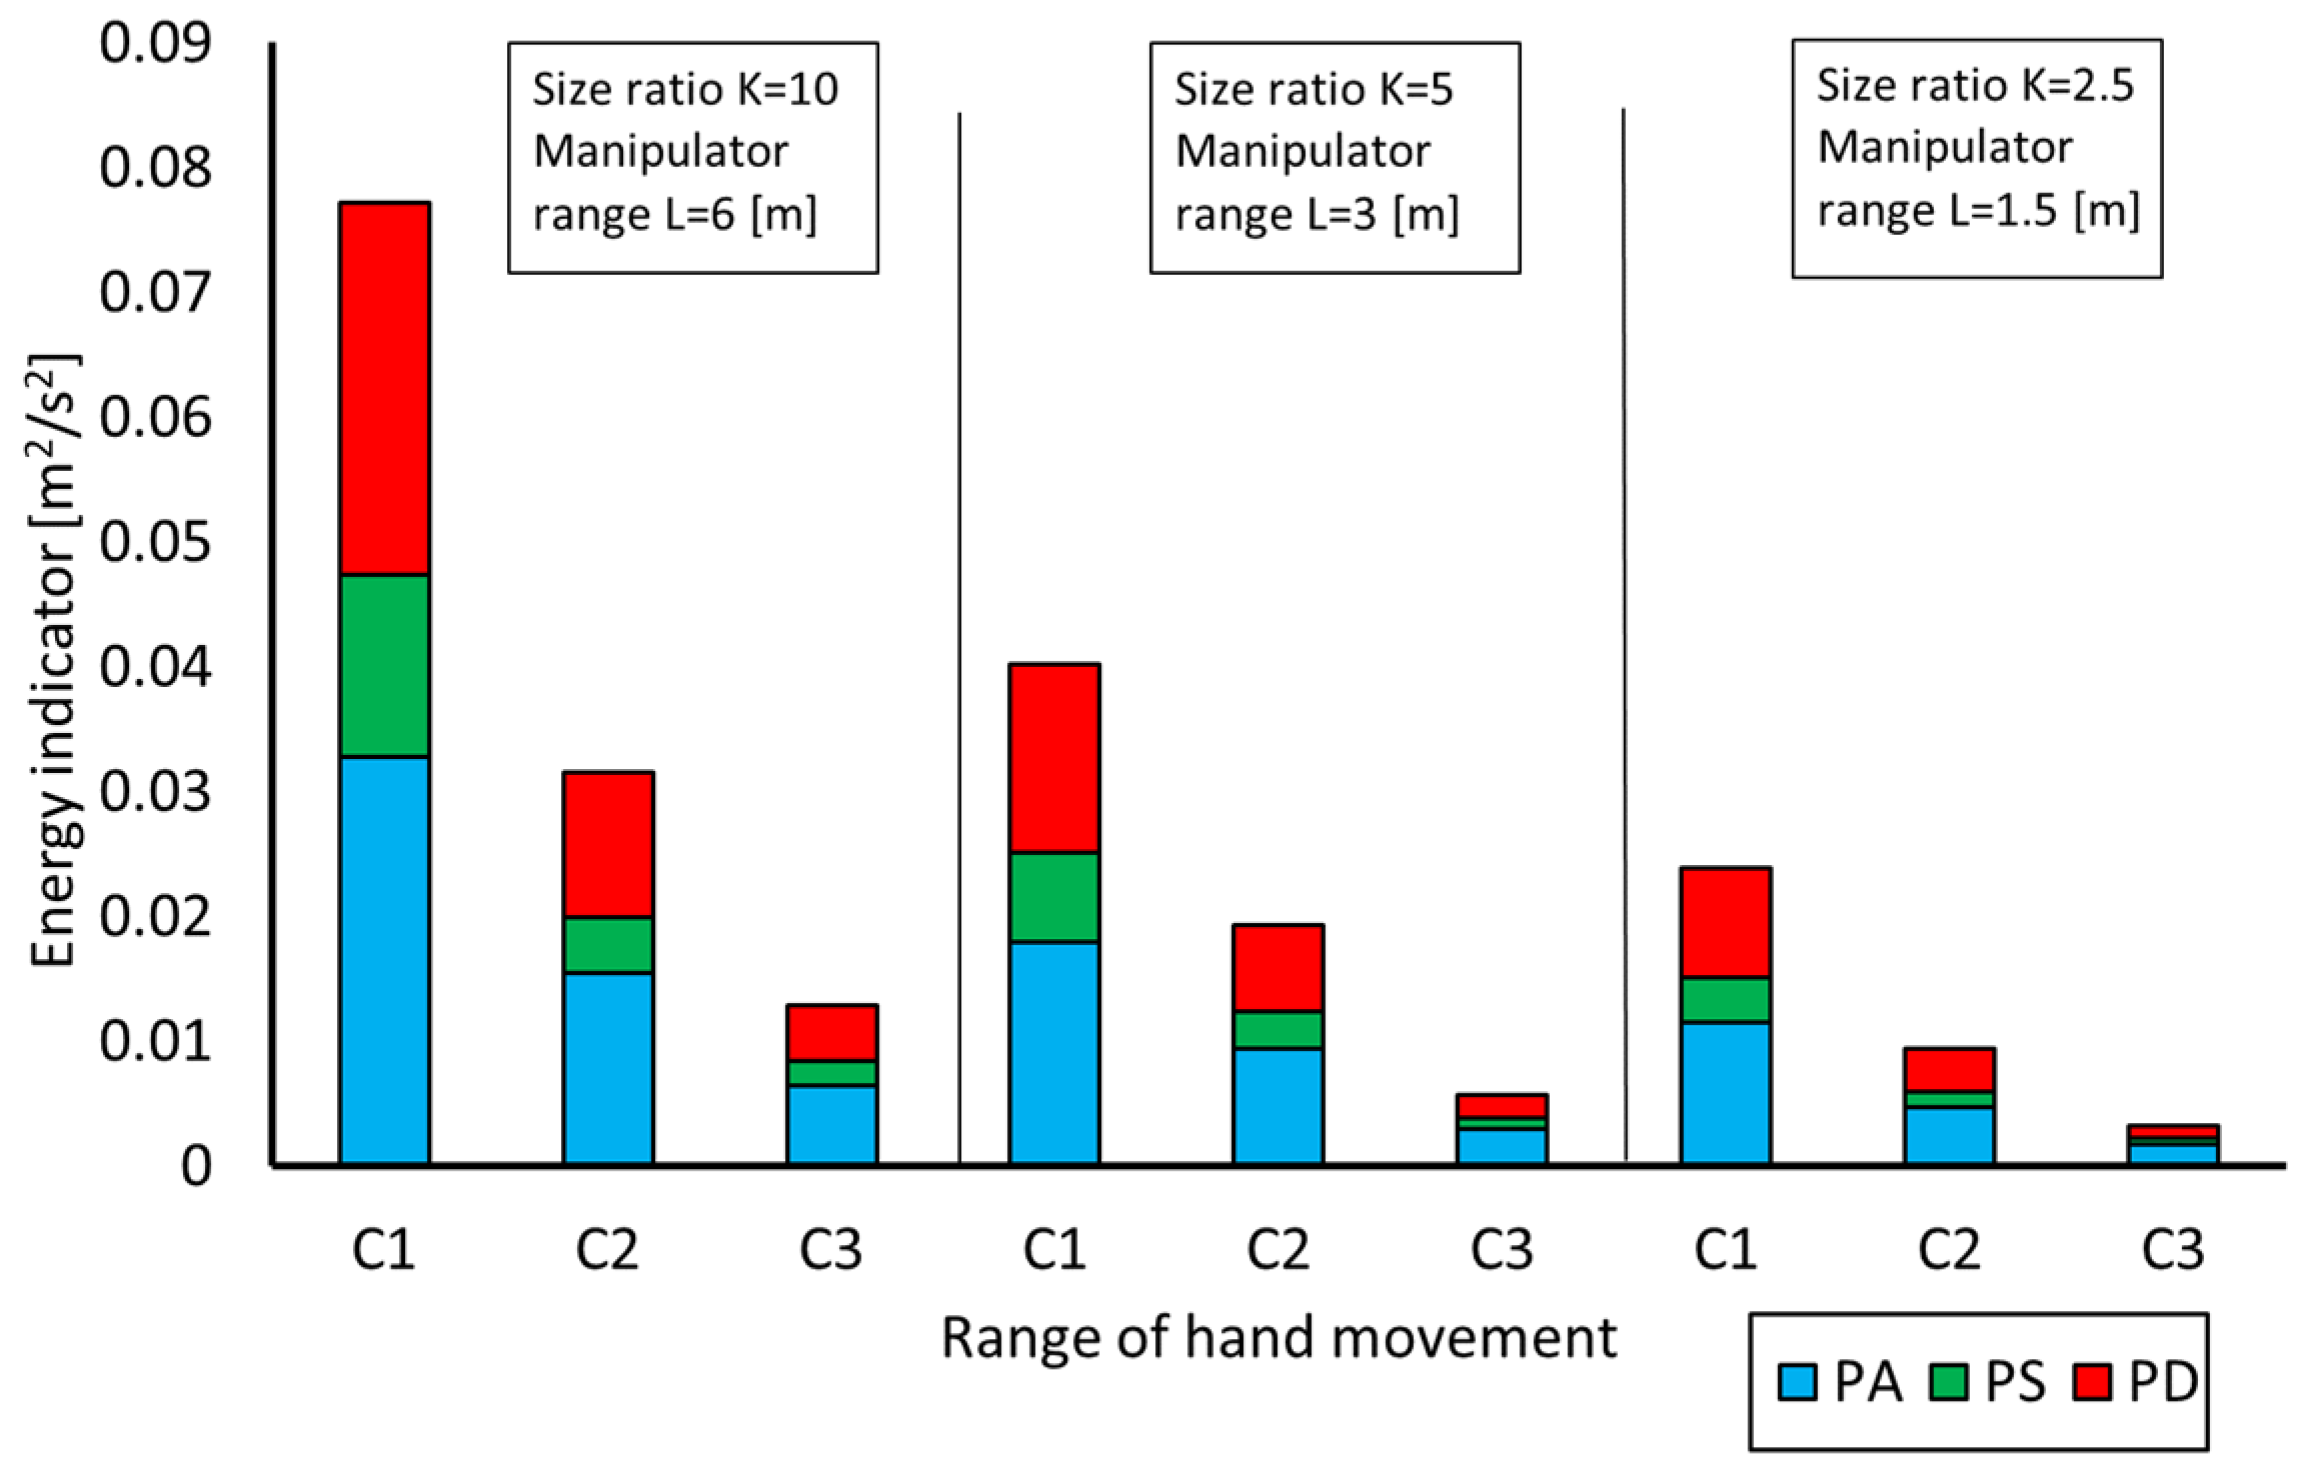
The energy indicator in PA—Ea i PD—Ed.
They were checked for fast and normal movements, for all size ratios K = 2.5, K = 5, and K = 10 and all tested ranges of C1 movement; C2 and C3. The significance level α = 0.05 was adopted. For the 30 people tested, according to the data in the tables of coefficients for the Shapiro–Wilk test [42,43], the critical value is W ( 0.05 ,   30 ) = 0.927 . The results are presented in Table 2, where W is the Shapiro–Wilka test indicator, and p is the probability of occurrence of the assumed type I error [44].
Based on the conducted ANOVA analysis, it was found that the number of trials is sufficient to demonstrate the following, with a test power of over 80%:
(a)
The power indicator depends on the size ratio:
-
For the C1 normal movements range (α = 0.05 and RMSSE (Root Mean Square Standardized Effect) = 0.5864 and fast movements range (α = 0.05 and RMSSE = 1.0315);
-
For the C2 normal movements range (α = 0.05 and RMSSE = 0.7375) and fast movements range (α = 0.05 and RMSSE = 1.0937);
-
For the C3 normal movements range (α = 0.05 and RMSSE = 1.0167) and fast movements range (α = 0.05 fast RMSSE = 1.0289).
(b)
The energy indicator depends on the movement range:
-
For the size ratio K = 10 of normal movements (α = 0.05 and RMSSE = 0.6970) and fast movements (α = 0.05 and RMSSE = 0.4420);
-
For the size ratio K = 5 of normal movements (α = 0.05 and RMSSE = 0.6235) and fast movements (α = 0.05 and RMSSE = 0.5725);
-
For the size ratio K = 2.5 of normal movements (α = 0.05 and RMSSE = 0.5938) and fast movements (α = 0.05 and RMSSE = 0.5858).
Examples of waveform values of the effector’s velocity and acceleration changes for one of the operators for normal movements with three ranges of movements (C1, C2, C3) and two size ratios (K = 10 and K = 2.5) are shown in Figure 3, Figure 4, Figure 5 and Figure 6.
Analyzing the examples of waveforms (Figure 3, Figure 4 and Figure 5), it can be seen that as the range of movement decreases, the duration of the steady phase decreases, the maximum movement velocities decrease, and accelerations decrease, both in the acceleration and deceleration phases. Reducing the size ratio has a similar effect on movement parameters (Figure 6). For the movement with the smallest range (C3), the share of the steady phase (PS) is even five times smaller than for the movements with the largest range tested (C1). For movements with small ranges and low size ratios, the steady phase (PS) may be difficult to observe or may not occur. A significant share of acceleration phases (PAs) in the entire effector movement, especially for short ranges of movement (C3), may indicate a high energy demand. However, the significant share of the deceleration phase (PD) in the movement proves the validity of its regeneration and, thus, the possibility of reducing the energy consumption of the manipulator work.
Summaries of the average velocities of the effector obtained during the tests in the steady phase of V movement, for the tested size ratios (K = 10, K = 5, K = 2.5) and ranges of movement (C1, C2, C3), are presented in Figure 7, Figure 8 and Figure 9.
Analyzing the presented graphs (Figure 7, Figure 8 and Figure 9), it can be seen that the effector movement velocities have the highest values for the size ratio K = 10 and the range of movement C1. They are on average 3.8 m/s for normal movements and 7.3 m/s for fast movements (an increase of 92%). Reducing the kinematic size ratio value results in a reduction in the velocity, vs, which for K = 2.5 is 65% lower than for K = 10 and amounts to 1.3 m/s for normal movements and is 73% lower in the case of fast movements, and it is on average 2 m/s. The results obtained from the study also indicate that reducing the range of motion reduces the velocity of the effector’s vs for each of the tested size ratios and types of movement. The most visible reduction in velocity associated with the range of motion occurs for the highest size ratio value. The velocity, vs, for K = 10 and the C3 range (0.2 m) is 1.7 m/s for normal movements and 2.6 m/s for fast movements. However, the value of velocity, vs, for K = 10 and the range of movement C1 (0.8 m) is 2.3 times higher for normal movements and almost 3 times higher for fast movements. In the case of the velocity, vs, values for a size ratio K = 2.5 and the range of motion C3, it can be seen that in normal movements, this velocity is only 20% lower than in fast movements, which is the smallest difference when comparing the velocity values obtained for fast and normal movements. It should be noted that the increase in the velocity of the effector is not directly proportional to the size ratio—with larger amplifications, the movement velocities are relatively lower, although they reach very high values. For a size ratio K = 10 (range 6 m), the maximum velocities of normal movements reach 5 m/s, and with high operator concentration, they even exceed 9 m/s. It should be noted that the influence of concentration increases as the manipulator’s range increases. At low size ratios, the relative differences in normal and fast velocities are smaller. Concentration has a very large impact on the velocity of movements, work cycle time, work efficiency, and demand for power and energy. Hence, when designing manipulators for normal long-term operation, normal velocities can be taken into account, while when designing manipulators for rescue or intervention work, the possibility of developing higher s velocities should be considered.
A summary of the effector accelerations obtained during the tests in the acceleration (PA) and deceleration (PD) phases for the tested size ratios (K = 10, K = 5, K = 2.5) and ranges of movement (C1, C2, C3) is presented in Figure 10, Figure 11 and Figure 12.
Analyzing the presented graphs (Figure 10, Figure 11 and Figure 12), it can be seen that the highest accelerations occurred in the acceleration phase in fast movements with size a ratio K = 10 and amounted to 12.3 m/s2. In normal movements, the maximum accelerations for the analogous size ratio K were three times lower than in fast movements. It can also be noticed that, regardless of the tested size ratio and type of movement, the accelerations in the deceleration phase (PD) were lower than in the acceleration phase (PA). In the case of normal movements, accelerations in the deceleration phase (PD) were lower than accelerations in the acceleration phase (PA), from 23 to 44% for the C1 range of motion, 22 to 25% for the C2 range of motion, and 10 to 23% for the C3 range of motion.
In the case of fast movements, the differences were 25–26% for the C1 range of motion, 34–36% for the C2 range of motion, and 37–43% for the C3 range of movement. Analyzing the data from the graphs, it can also be seen that for normal movements with the lowest tested size ratio K = 2.5, regardless of the range of movement (C1, C2, C3), the decrease in the acceleration value in the deceleration phase in relation to the acceleration phase was very similar and amounted to 23%.
Against this background, it is worth analyzing the operator’s hand movements. The average velocities of the operator’s hand in the steady phase of the movement (PS) for fast and normal movements are presented in Table 3.
Analyzing the obtained hand movement velocities, it can be noticed that the operator obtains the highest values of hand movement velocity at the largest range of movement (C1) and for the smallest size ratios (K = 2.5), and they are 0.529 m/s for normal movements and 0.793 m/s for fast movements, respectively. These velocities, in relation to the size ratio K = 10 and the same range of C1 movement, are as much as about 40% higher for normal movements and 10% higher for fast movements. They are 0.376 m/s and 0.719 m/s, respectively. It should be noted that the velocity differences for fast movements and different size ratios are relatively small, while the normal velocities for different size ratios are significantly different. In the case of other size ratios and ranges of movement, the velocity values of fast movements are higher than for normal movements, ranging from 30% for reinforcement K = 2.5 and range of movement C3 to 78% for reinforcement K = 10 and range of movement C2. It can also be noticed that as the value of the range of motion decreases, the velocity in the steady phase decreases.
A summary of the average duration of the movement and its individual phases—acceleration (PA), steady phase (PS), and deceleration (PD)—depending on the tested size ratio, range, and type of movement, is presented in Figure 13 and Figure 14.
Analyzing the duration of individual movements, it can be noticed that in the case of normal movements (Figure 13), as the size ratio decreased, the duration of the acceleration, steady state, and deceleration phases also decreased. For example, for the C2 movement range and size ratio K = 10, the movement duration was 3.4 s; for size ratio K = 5, the movement duration was 2.7 s; and for size ratio K = 2.5, it was 2.1 s.
The deceleration phase (PD) has the largest share in the entire movement and on average constitutes 60% of the entire movement duration. The steady phase (PS) has the smallest share in the entire movement, which ranges from 15 to 20% for the C1 range of motion and 2 to 5% for the C3 range of motion.
Analyzing the duration of fast movements (Figure 14), it can be concluded that the deceleration phase has the dominant share in the entire work cycle, as in normal movements, it constitutes on average 60% of the movement duration, regardless of the length of the movement and the size ratio. The total duration of fast movements for individual reinforcements (K = 10, K = 5, K = 2.5) is at a similar level, and for the C1 range of motion, it is 2.5 s, 2.3 s, and 2.2 s, respectively. As in the case of normal movements, the duration of the steady phase in fast movements decreases as the range of movement decreases. For the C1 movement range, the duration of the steady phase constitutes 5–8% of the total movement, while for the C3 movement range, it constitutes 2–4% of the total movement.
Based on the obtained research results and Equations (7)–(11), the individual power and energy requirements of manipulators with different ranges, performing movements in the operating ranges C1, C2, and C3, were determined. The summary of the obtained power indices N a m a x * and N d m a x * for the tested size ratios, ranges, and types of movement is presented in Figure 15, Figure 16 and Figure 17.
Analyzing the presented graphs, it can be seen that the value of the power index in fast movements is from 3 (for K = 2.5) to 6 times (for K = 10) higher than in normal movements. The difference in power meter values between fast and normal movements will compound as the size ratio value and move range decrease. For example, the power index for K = 10 and the C1 range is 60% greater than the power index for K = 2.5 and the corresponding range of motion. In the case of fast movements, the difference in power indicators is much greater, and when comparing the value of the power indicator for K = 10 for the C1 range to K = 2.5 for the C1 range, the difference reaches 220%.
Comparing the power index for the acceleration and deceleration phases, it can be noticed that for both fast and normal movements, it has lower values for the deceleration phase. The difference in the case of normal movements ranges from 20 to 28% and is the smallest for movements with the smallest C3 range. In the case of fast movements, the difference is greater and amounts to up to 70%. In the case of fast movements, the greatest differences can be observed for movements with the smallest reinforcements and the smallest ranges, unlike in the case of normal movements.
A significant value of the power indicator occurring in the braking phase, regardless of the movement, indicates the validity of attempting to recover energy, store it, and use it to implement the acceleration phase when operating manipulators.
The list of energy indicators, calculated in accordance with Equations (9)–(11), in the acceleration phase— E k a * —steady phase— E k s * —and deceleration phase— E k d * —for the tested size ratios, ranges, and types of movement is presented in Figure 18 and Figure 19.
Regarding the analysis of changes in the energy index value, a similar trend of changes in the power index can be observed. The highest values of the energy index occurred for the highest values of size ratios and ranges of motion in both normal and fast movements. The maximum values of the energy index reached 0.08 m2/s2 for the longest ranges of C1 movement and size ratio K = 10 in fast movements and were almost four times higher than in the case of the analogous parameters in normal movements.
The energy index in the steady phase (PS) constitutes from 12 to 15% of the total energy index in normal movements, and in fast movements, it constitutes from 13 to 19% of the total index.

4. Conclusions

The power and energy indicators that were developed in this study allow for a clear determination of the demand for power and energy of manipulators with different control ranges, whose effector copies the movements of the operator’s hand. Therefore, they can be treated as universal indicators for assessing the demand for the unit’s power and energy of manipulators.
Knowledge of the velocity of working movements, accelerations occurring, and power and energy indicators can be very helpful in the effective design of the manipulator drive system and the selection of its components, in terms of the achieved work efficiency and the demand for power and energy.
The results of the conducted research also make it possible to determine the accelerations that are achieved by the effectors of manipulators with different ranges that are controlled by humans and at different velocities. This information may be extremely important for the assessment of the dynamic loads on the structure and the drive system and for the effective design of manipulator control systems.
The use of the developed test stand made it possible to determine the velocity and acceleration limits of the manipulator’s effector movements resulting from the operator’s perception. The tests were not burdened with errors resulting from the limitations of the manipulator related to the parameters of the drive system used, its dynamics, and the control system. Therefore, the obtained results allow for the development of new generation of drive systems and control systems that increase the efficiency of manipulators.

Author Contributions

Conceptualization, K.C. and P.K.; methodology, P.K., M.J.Ł. and R.T.; software, K.C. and P.K.; validation, K.C. and M.P.; formal analysis, M.J.Ł., M.P. and R.T.; investigation, P.K. and M.J.Ł.; resources, K.C. and P.K.; data curation, M.P.; writing—original draft preparation, K.C. and P.K.; writing—review and editing, P.K., K.C. and M.J.Ł.; visualization, M.P.; supervision, R.T. and M.J.Ł.; project administration, M.J.Ł.; funding acquisition, M.J.Ł. All authors have read and agreed to the published version of the manuscript.

Funding

This work was financed/co-financed by the Military University of Technology under research project UGB 708/2024.

Institutional Review Board Statement

The study was conducted in accordance with the Declaration of Helsinki, and the protocol was approved by the Ethics Committee operating at Warsaw University of Life Science, resolution 15 February 2022, number 6/2022.

Informed Consent Statement

Informed consent was obtained from all subjects involved in the study.

Data Availability Statement

Data are contained within the article. The original contributions presented in the study are included in the article, further inquiries can be directed to the corresponding author.

Conflicts of Interest

The authors declare no conflicts of interest.

References

  1. Nurmi, J.; Mattila, J. Global Energy-Optimal Redundancy Resolution of Hydraulic Manipulators: Experimental Results for a Forestry Manipulator. Energies 2017, 10, 647. [Google Scholar] [CrossRef]
  2. Fang, D.; Yang, J.; Shang, J.; Wang, Z.; Feng, Y. A Novel Energy-Efficient Wobble Plate Hydraulic Joint for Mobile Robotic Manipulators. Energies 2018, 11, 2915. [Google Scholar] [CrossRef]
  3. Zheng, S.; Ding, R.; Zhang, J.; Xu, B. Global energy efficiency improvement of redundant hydraulic manipulator with dynamic programming. Energy Convers. Manag. 2021, 230, 113762. [Google Scholar] [CrossRef]
  4. Ge, L.; Quan, L.; Zhang, X.; Zhao, B.; Yang, J. Efficiency improvement and evaluation of electric hydraulic excavator with speed and displacement variable pump. Energy Convers. Manag. 2017, 150, 62–71. [Google Scholar] [CrossRef]
  5. Zhao, L.; Yang, T.; Yang, Y.; Yu, P. A Wearable Upper Limb Exoskeleton for Intuitive Teleoperation of Anthropomorphic Manipulators. Machines 2023, 11, 441. [Google Scholar] [CrossRef]
  6. Chon, S.U.; Seo, J.; Kim, J.; Han, S.; Park, S.; Kim, J.T.; Kim, J.; Cho, J. Design of an Intuitive Master for Improving Teleoperation Task Performance Using the Functional Separation of Actuators: Movement and Gravity Compensation. Actuators 2022, 11, 204. [Google Scholar] [CrossRef]
  7. Yamakawa, Y.; Katsuki, Y.; Watanabe, Y.; Ishikawa, M. Development of a High-Speed, Low-Latency Telemanipulated Robot Hand System. Robotics 2021, 10, 41. [Google Scholar] [CrossRef]
  8. Zhu, J.; Liu, X.; Shi, Q.; He, T.; Sun, Z.; Guo, X.; Liu, W.; Sulaiman, O.B.; Dong, B.; Lee, C. Development Trends and Perspectives of Future Sensors and MEMS/NEMS. Micromachines 2020, 11, 7. [Google Scholar] [CrossRef] [PubMed]
  9. Scibilia, A.; Pedrocchi, N.; Fortuna, L. Modeling Nonlinear Dynamics in Human-Machine Interaction. IEEE Access 2023, 11, 58664–58678. [Google Scholar] [CrossRef]
  10. Krogul, P.; Cieślik, K.; Łopatka, M.J.; Przybysz, M.; Rubiec, A.; Muszyński, T.; Rykała, Ł.; Typiak, R. Experimental Research on the Influence of Size Ratio on the Effector Movement of the Manipulator with a Large Working Area. Appl. Sci. 2023, 13, 8908. [Google Scholar] [CrossRef]
  11. Cieślik, K.; Łopatka, M.J. Research on Speed and Acceleration of Hand Movements as Command Signals for Anthropomorphic Manipulators as a Master-Slave System. Appl. Sci. 2022, 1, 3863. [Google Scholar] [CrossRef]
  12. Si, W.; Wang, N.; Yang, C. A review on manipulation skill acquisition through teleoperation-based learning from demonstration. Cogn. Comput. Syst. 2020, 3, 1–16. [Google Scholar] [CrossRef]
  13. Marvel, J.; Bostelman, R. Towards mobile manipulator safety standards. In Proceedings of the IEEE International Symposium on RObotic and Sensors Environments (ROSE), Washington, DC, USA, 21–23 October 2013. [Google Scholar]
  14. Lichiardopol, S. A Survey on Teleoperation; DCT rapporten 2007; Technische Universiteit Eindhoven: Eindhoven, The Netherlands, 2007; Volume 2007.155. [Google Scholar]
  15. Lopez Pulgarin, E.J.; Tokatli, O.; Burroughes, G.; Herrmann, G. Assessing tele-manipulation systems using task performance for glovebox operations. Front. Robot. AI 2022, 9, 932538. [Google Scholar] [CrossRef] [PubMed]
  16. Shinde, V.B.; Pawar, P.J. Minimizing cycle time and energy consumption for a multi-degree serial manipulator using teaching–learning-based optimization. J Braz. Soc. Mech. Sci. Eng. 2023, 45, 263. [Google Scholar] [CrossRef]
  17. Shah, H.N.M.; Sulaiman, M.; Isa, K.S.M.; Kamis, Z.; Baharon, M.R. Optimization of Energy Consumption in KUKA KR 16 Articulated Robot Manipulator. Int. J. Recent Technol. Eng. 2019, 8, 6470–6476. [Google Scholar] [CrossRef]
  18. Garriz, C.; Domingo, R. Trajectory Optimization in Terms of Energy and Performance of an Industrial Robot in the Manufacturing Industry. Sensors 2022, 22, 7538. [Google Scholar] [CrossRef] [PubMed]
  19. Łopatka, M.J.; Rubiec, A. Concept and Preliminary Simulations of a Driver-Aid System for Transport Tasks of Articulated Vehicles with a Hydrostatic Steering System. Appl. Sci. 2020, 10, 5747. [Google Scholar] [CrossRef]
  20. Dąbrowska, A.; Jaskółowski, M.B.; Rubiec, A. Cameras vibrations influence on efficiency of teleoperated Unmanned Ground Vehicle. In Proceedings of the 21st International Conference on Methods and Models in Automation and Robotics (MMAR), Miedzyzdroje, Poland, 29 August–1 September 2016; pp. 772–777. [Google Scholar] [CrossRef]
  21. Łopatka, M.J.; Krogul, P.; Przybysz, M.; Rubiec, A. Preliminary Experimental Research on the Influence of Counterbalance Valves on the Operation of a Heavy Hydraulic Manipulator during Long-Range Straight-Line Movement. Energies 2022, 15, 5596. [Google Scholar] [CrossRef]
  22. Caiza, G.; Garcia, C.A.; Naranjo, J.E.; Garcia, M.V. Flexible Robotic Teleoperation Architecture for Intelligent Oil Fields. Heliyon 2020, 6, e03833. [Google Scholar] [CrossRef] [PubMed]
  23. Conte, D.; Leamy, S.; Furukawa, T. Design and Map-Based Teleoperation of a Robot for Disinfection of COVID-19 in Complex Indoor Environments. In Proceedings of the 2020 IEEE International Symposium on Safety, Security, and Rescue Robotics (SSRR), Abu Dhabi, United Arab Emirates, 4–6 November 2020; pp. 276–282. [Google Scholar]
  24. Guo, J.; Ye, L.; Liu, H.; Wang, X.; Liang, L.; Liang, B. Safety-Oriented Teleoperation of a Dual-Arm Mobile Manipulation Robot. In Intelligent Robotics and Applications, Proceedings of the 15th International Conference, ICIRA 2022, Harbin, China, 1–3 August 2022; Liu, H., Yin, Z., Liu, L., Jiang, L., Gu, G., Wu, X., Ren, W., Eds.; Springer International Publishing: Cham, Switzerland, 2022; pp. 780–792. [Google Scholar]
  25. Łopatka, M.J.; Muszyński, T. Future robots using in C-IED detection. In Proceedings of the 1st International Conference Challenges to Nacional Defence in Contemporary Geopolitical Situation (CNDCGS’2018), Pabrade, Lithuania, 25–27 April 2018. [Google Scholar]
  26. Petrenko, V.I.; Tebueva, F.B.; Antonov, V.O.; Gurchinsky, M.M. Mathematical methods for planning energy-efficient motion path of the manipulator anthropomorphic robot for the typical obstacles. IOP Conf. Ser. Mater. Sci. Eng. 2020, 919, 052055. [Google Scholar] [CrossRef]
  27. Ma, C.; Gao, H.; Ding, L.; Tao, J.; Xia, K.; Yu, H.; Deng, Z. Optimal Energy Consumption for Mobile Manipulators Executing Door-Opening Task. Math. Probl. Eng. 2018, 2018, 8987953. [Google Scholar] [CrossRef]
  28. Du, H.; Du, J.M.; Chen, L.A.; Mai, Z.W.; Liu, X.H.; Cai, H.Z. Multi-DOF Robotic Manipulator Trajectory Controlling Based on Minimum Energy Optimization. In Advances in Intelligent Systems Research; Atlantis Press: Amsterdam, The Netherlands, 2015; pp. 345–349. [Google Scholar] [CrossRef]
  29. Hrabar, I.; Vasiljević, G.; Kovačić, Z. Estimation of the Energy Consumption of an All-Terrain Mobile Manipulator for Operations in Steep Vineyards. Electronics 2022, 11, 217. [Google Scholar] [CrossRef]
  30. Khiyavi, O.A.; Seo, J.; Lin, X. Energy Saving in an Autonomous Excavator via Parallel Actuators Design and PSO-Based Excavation Path Generation. Eng. Proc. 2022, 24, 5. [Google Scholar] [CrossRef]
  31. Xiao, Y.; Guan, C.; Li, P.Y.; Wang, F. Optimal design of a compound hybrid system consisting of torque coupling and energy regeneration for hydraulic hybrid excavator. In Proceedings of the IEEE International Conference on Advanced Intelligent Mechatronics (AIM), Busan, Republic of Korea, 7–11 July 2015; pp. 1525–1530. [Google Scholar]
  32. Yu, Y.X.; Ahn, K.K. Application of hydraulic transformer on energy saving for boom system of hybrid hydraulic excavator. Appl. Mech. Mater. 2017, 868, 118–123. [Google Scholar] [CrossRef]
  33. Wang, W.; Chi, H.; Zhao, S.; Du, Z. A control method for hydraulic manipulators in automatic emulsion filling. Autom. Constr. 2018, 91, 92–99. [Google Scholar] [CrossRef]
  34. Ambar, R.B.; Sagara, S. Development of a master controller for a 3-link dual-arm underwater robot Artif. Life Robot. 2015, 20, 327–335. [Google Scholar] [CrossRef]
  35. Howard, I.P. Binocular Vision and Stereopsis; Oxford University Press: Oxford, UK, 1995; ISBN -13: 9780195084764. [Google Scholar]
  36. Zauner, J.; Broszio, K.; Bieske, K. Influence of the Human Field of View on Visual and Non-Visual Quantities in Indoor Environments. Clocks Sleep 2023, 5, 476–498. [Google Scholar] [CrossRef] [PubMed]
  37. Strasburger, H.; Rentchsler, I.; Juttner, M. Peripheral vision and pattern recognition: A review. J. Vis. 2011, 11, 1–82. [Google Scholar] [CrossRef]
  38. SAE J833; Human Physical Dimensions. SAE International: Warrendale, PA, USA, 1989.
  39. SAE J898; Control Locations for Off-Road Work Machines. SAE International: Warrendale, PA, USA, 1994.
  40. ISO 14738:2002; Safety of Machinery—Anthropometric Requirements for Design of Workstations at Machinery. International Organization for Standarization: Geneva, Switzerland, 2002; pp. 1–26.
  41. Kosucki, A.; Stawiński, Ł.; Malenta, P.; Zaczyński, J.; Skowrońska, J. Energy consumption and energy efficiency improvement of overhead crane’s mechanisms. Eksploat. I Niezawodn.—Maint. Reliab. 2020, 22, 323–330. [Google Scholar] [CrossRef]
  42. Navidi, W. ISE Statistics for Engineers and Scientists; McGraw-Hill Education: New York, NY, USA, 2023. [Google Scholar]
  43. Tomšik, R. Power Comparisons of Shapiro-Wilk, Kolmogorov-Smirnov and Jarque-Bera Tests. Sch. J. Res. Math. Comput. Sci. 2019, 3, 238–243. [Google Scholar]
  44. Salvendy, G.; Karwowski, W. Handbook of Human Factors and Ergonomics, 5th ed.; John Wiley & Sons: Hoboken, NJ, USA, 2021. [Google Scholar]
Figure 1. The test stands [10]: (a) a 3D model; (b) illustration of case study.
Applsci 14 01800 g001
Figure 2. The scheme of indicators for evaluating experimental research.
Applsci 14 01800 g002
Figure 3. An example of changes in the effector’s displacement, velocity, and acceleration for a normal movement, size ratio K = 10 and range of movement C1.
Applsci 14 01800 g003
Figure 4. An example of changes in the effector’s displacement, velocity, and acceleration for a normal movement, size ratio K = 10, and range of movement C2.
Applsci 14 01800 g004
Figure 5. An example of changes in the effector’s displacement, velocity, and acceleration for a normal movement, size ratio K = 10 and range of movement C3.
Applsci 14 01800 g005
Figure 6. An example of changes in the effector’s displacement, velocity, and acceleration for a normal movement, size ratio K = 2.5 and range of movement C1.
Applsci 14 01800 g006
Figure 7. Effector’s RMS velocity-vs, in the steady motion phase for size ratio K = 10.
Applsci 14 01800 g007
Figure 8. Effector’s RMS velocity-vs, in the steady motion phase for size ratio K = 5.
Applsci 14 01800 g008
Figure 9. Effector’s RMS velocity-vs, in the steady motion phase for size ratio K = 2.5.
Applsci 14 01800 g009
Figure 10. Effector’s accelerations for size ratio K10: (a) acceleration phase, (b) deceleration phase.
Applsci 14 01800 g010
Figure 11. Effector’s accelerations for size ratio K = 5: (a) acceleration phase, (b) deceleration phase.
Applsci 14 01800 g011
Figure 12. Effector’s accelerations for size ratio K = 2.5: (a) acceleration phase, (b) deceleration phase.
Applsci 14 01800 g012
Figure 13. Average duration of movement and its phases for normal movements; ta—acceleration, ts—steady phase, td—deceleration.
Applsci 14 01800 g013
Figure 14. Average duration of movements and their phases for fast movements; ta—acceleration, ts—steady phase, td—deceleration.
Applsci 14 01800 g014
Figure 15. Summary of the power index obtained from the tests for the ranges of motion and size ratio K = 10.
Applsci 14 01800 g015
Figure 16. Summary of the power index obtained from the tests for the ranges of motion and size ratio K = 5.
Applsci 14 01800 g016
Figure 17. Summary of the power index obtained from the tests for the ranges of motion and size ratio K = 2.5.
Applsci 14 01800 g017
Figure 18. Summary of energy index values obtained for normal movements.
Applsci 14 01800 g018
Figure 19. Summary of energy index values obtained for fast movements.
Applsci 14 01800 g019
Table 1. Ranges of movements carried out by the effector for the tested amplifications and ranges of the manipulator; parameter markings in accordance with Figure 1.
Parameter NameRange of Hand Movement |A′B′| [m]
C1 = 0.8C2 = 0.4C3 = 0.2
Size Ratio KManipulator Range L [m]Effector Displacement |AB| [m]
×106842
×53421
×2.51.5210.5
Table 2. Summary of the results of the analysis of normality distribution of the Shapiro–Wilk test.
Parameter Fast MovementNormal Movement
K = 10K = 5K = 2.5K = 10K = 5K = 2.5
C1C2C3C1C2C3C1C2C3C1C2C3C1C2C3C1C2C3
PAaamaxW0.941380.964410.971540.975510.964760.976340.980780.989050.980010.95180.939760.946280.927140.963410.950220.958890.951090.94857
p0.099070.399450.582220.697730.407240.722020.845860.985480.825800.18880.089610.002320.038820.377370.171340.290180.180760.01369
NamaxW0.965450.987900.950280.948820.970820.987250.932950.994970.968290.935090.930270.9615520.967280.949360.945170.945410.93860.94007
p0.423150.975950.172030.157160.561720.969130.176710.999930.493610.00370.148240.001810.467790.162530.125330.127210.083390.09133
EaW0.953530.972460.962370.965990.955710.968980.974110.986030.984070.930470.947870.956450.957110.932190.939220.961190.928740.95521
p0.210000.608370.355710.436120.239800.511780.656670.953390.920340.050540.027260.039560.260910.03580.014220.332160.018510.23259
PDadmaxW0.987820.951140.945810.958650.961200.985360.960460.979090.976920.981680.947980.927140.957160.940870.94970.944790.952310.93787
p0.975150.181300.130470.285910.332290.943160.318180.800900.739130.868350.149210.038820.261640.096010.165930.122460.194910.07969
NdmaxW0.947360.970620.966770.965390.952790.980330.989720.966650.963120.927990.93330.967280.944510.937050.960980.963720.954930.9354
p0.143590.556170.455060.421890.200670.834290.989610.452110.371250.043430.060140.467790.120320.004110.328010.384190.228730.01141
EdW0.978330.965930.979830.972920.976820.982690.960440.975160.940960.942930.9377760.957110.945730.945530.928870.959560.967680.94386
p0.779600.434680.821010.621820.736120.891700.317940.687390.128400.109090.079150.260910.129820.128240.025070.301790.477710.1156
Table 3. Average velocities of the operator’s hand movement in the steady phase for the tested ranges of movement and strengthening.
Movement TypeSize Ratio KParameter NameRange of Hand Movement
C1C2C3
Normal
movement
×10vs [m/s]0.3760.2450.167
×5vs [m/s]0.4430.3070.176
×2.5vs [m/s]0.5290.3290.197
Fast
movement
×10vs [m/s]0.7190.4360.237
×5vs [m/s]0.7430.4740.241
×2.5vs [m/s]0.7950.4880.258
Disclaimer/Publisher’s Note: The statements, opinions and data contained in all publications are solely those of the individual author(s) and contributor(s) and not of MDPI and/or the editor(s). MDPI and/or the editor(s) disclaim responsibility for any injury to people or property resulting from any ideas, methods, instructions or products referred to in the content.

