Abstract
To ensure precise and real-time perception of high-speed roadway conditions and minimize the potential threats to traffic safety posed by road debris and defects, this study designed a real-time monitoring and early warning system for high-speed road surface anomalies. Initially, an autonomous mobile intelligent road inspection robot, mountable on highway guardrails, along with a corresponding cloud-based warning platform, was developed. Subsequently, an enhanced target detection algorithm, YOLOv5s-L-OTA, was proposed. Incorporating GSConv for lightweight improvements to standard convolutions and employing the optimal transport assignment for object detection (OTA) strategy, the algorithm’s robustness in multi-object label assignment was enhanced, significantly improving both model accuracy and processing speed. Ultimately, this refined algorithm was deployed on the intelligent inspection robot and validated in real-road environments. The experimental results demonstrated the algorithm’s effectiveness, significantly boosting the capability for real-time, precise detection of high-speed road surface anomalies, thereby ensuring highway safety and substantially reducing the risk of liability disputes and personal injuries.
1. Introduction
A small leak can sink a large ship, and the neglect of debris and road hazards costs lives and money every year. Drivers have very little reaction time when facing emergencies at high speeds, which directly leads to higher casualty rates and more severe property losses in highway accidents. According to statistics from the Traffic Management Bureau of the Ministry of Public Security, China’s highway mileage fatality rate is currently 4.51 times that of ordinary highways, and the highway accident fatality rate is 2.21 times that of ordinary highways. In terms of the causes of accidents, road factors account for 28.1%. In this paper, we innovatively plan for the thrown objects and road defects that appear on the highway as abnormal conditions. If abnormal conditions on highways can be discovered and dealt with in a short time, the damage to personal and property safety can be greatly reduced. Therefore, technology for detecting abnormal conditions on high-speed pavements is indispensable in ensuring road safety.
In the current discourse on the safety analysis of vehicles traveling on highways, the focus can be broadly categorized into three key aspects: driver behavior and decision making analysis, traffic flow and road conditions, and high-speed emergency response. The analysis of driver behavior and decision making encompasses factors such as driver distraction, fatigue driving, and speeding, all of which are potential causes of traffic accidents. Moslem and colleagues integrated the Best–Worst Method (BWM) with Triangular Fuzzy Sets to evaluate critical driver behavioral factors affecting road safety, addressing the complexity and uncertainty of decision making and enhancing the consistency of decisions [1]. Driver distraction is a common cause of safety crashes [2]. Some scholars have employed deep convolutional neural networks (CNNs) in a driving activity recognition system capable of identifying seven common driving activities, categorizing them into normal driving tasks and distracted driving tasks. In the binary classification of detecting driver distraction, the system achieved an accuracy rate of 91.4% [3]. Shahverdy and others utilized driving signals, including acceleration, gravity, throttle, speed, and revolutions per minute (RPM), along with statistical information to identify five driving styles: normal driving, aggressive driving, distracted driving, drowsy driving, and drunk driving. To leverage the successful application of deep neural networks in imaging, these researchers further explored the use of recursive graph techniques, teaching two-dimensional convolutional neural networks (CNNs) on images constructed from driving signals. Their experimental results confirmed the effectiveness of this approach in detecting driver behaviors [4,5]. Traffic congestion, improper road design, poor road conditions, and adverse weather conditions can also increase the risk of accidents [6]. Research by Bi found a close correlation between complex weather patterns and traffic [7]. Zhu and colleagues developed a traffic optimization decision system that analyzes real-time traffic conditions by calculating traffic volume, density, and speed, and established a traffic prediction model [8]. Rodriguez-Rangel and colleagues introduced a system that utilizes a monocular camera to estimate vehicle speeds on highways. The system employs YOLOv3 and Kalman filters for vehicle detection and tracking, providing auxiliary research for road accidents [9]. The rapid response to highway accidents, the timely arrival of emergency personnel, effective accident scene management, and casualty care are also subjects of extensive research by many scholars [10]. Zou and colleagues conducted a visual exploration of the knowledge base, thematic distribution, research frontiers, and trends in road safety research. Utilizing the methods proposed based on MKD (multiple knowledge dimensions) visual analysis, they established a reference for the application and development of methodologies in the field of road safety research [11]. Some scholars have practically implemented a method named DEA-ANN (data envelopment analysis–artificial neural networks) within a geographic information system (GIS) environment to conduct road safety risk analysis [12]. Leveraging drones as tools for data acquisition and employing advancements in computer vision algorithms for traffic flow analysis, risk assessment, and infrastructure damage evaluation represent a novel approach in road safety research. However, this method involves airspace usage and faces numerous challenges in practical deployment [13,14,15,16].
As elucidated from the above analysis, current scholarly research in the realm of highway accident analysis and prevention predominantly concentrates on three aspects: firstly, the analysis of driver behavior; secondly, the natural weather conditions and traffic flow on highways; and thirdly, the emergency response measures post-accidents. However, given the high sensitivity of highway traffic systems to even minor issues, small problems in road conditions can rapidly escalate into serious consequences. Therefore, from the viewpoint of highway administrators, there is an urgent need to develop a system capable of swiftly and precisely detecting and pinpointing any anomalies on highways, and that can immediately alert maintenance personnel for remedial action. Fortuitously, with the continuous evolution of artificial intelligence technology, the application of target detection techniques from deep learning in the identification of road surface information has commenced. This advancement is significantly instrumental in augmenting our monitoring and response capabilities to anomalies on highways, marking a critical progression in this field.
The current landscape of deep learning-based object detection algorithms can be broadly categorized into two approaches: two-stage and single-stage methods [17]. Two-stage object detection algorithms operate in a bifurcated manner, initially generating candidate regions, followed by classification via convolutional neural networks. Representative algorithms in this category include R-CNN [18], Fast R-CNN [19,20], and Faster R-CNN [21]. However, due to their inherent two-stage nature, these algorithms often exhibit slower detection speeds when dealing with large model sizes and numerous parameters. On the other hand, single-stage detection algorithms have effectively addressed these speed limitations. Notable among these are SSD [22,23], RetinaNet [24], and YOLO [25,26,27,28]. With the maturation of single-stage algorithms (e.g., YOLO), they have not only demonstrated superiority in detection speed compared to two-stage methods but also achieved comparable or even superior accuracy. Despite these advances, there are still significant challenges when applying such algorithms to roadway abnormal condition detection. Object detection tasks are typically executed by edge devices situated alongside highways, imposing stringent requirements on the algorithm’s real-time performance, accuracy, and complexity. Furthermore, there is a notable deficiency in these models’ understanding of the spatial positioning of anomalies on highway surfaces. This shortfall becomes particularly evident when confronted with multiple target categories that exhibit low differentiation, where the detection precision still necessitates enhancement.
Addressing these challenges, we have developed an intelligent patrol platform, capable of autonomous operation and mountable on highway guardrails. This platform is designed to detect and identify potential safety hazards, such as debris and common types of road defects, as anomalous events on the highway surface. In response to the imperative need for heightened efficiency and precision, we have conceptualized and developed YOLOv5s-L-OTA, an innovative lightweight detection model. This model is anchored on the principles of an optimal label assignment strategy. Demonstrating robust performance in a series of rigorous experimental evaluations, it stands as a significant advancement in enhancing model accuracy and processing speed. In summary, the contributions of this article are as follows:
- (1)
- We have developed an intelligent patrol robot capable of operating from highway guardrails. Contrasting with roadside fixed-point cameras, our robot benefits from a closer proximity to the road surface, enabling it to capture anomalies more clearly and accurately.
- (2)
- In our approach, we employ GSConv to reduce the number of parameters and floating-point operations in the feature fusion network. This is achieved by effectively blending the outputs of standard and depth-wise convolutions, substantially mitigating feature loss incurred during the fusion process.
- (3)
- To enhance the accuracy of detecting multiple types of targets on road surfaces, we introduced a label allocation strategy grounded in the optimal transport assignment problem. This approach facilitates more effective learning and convergence of the model during training, catering to the nuanced requirements of diverse target detection.
- (4)
- We proposed a lightweight detection model based on an optimal label allocation strategy. Extensive experiments on our self-labeled road dataset demonstrate that the model introduced in this study effectively reduces complexity while maintaining precision.
- (5)
- By synergizing robotic technology, edge computing, and an improved object detection algorithm, we have developed an integrated solution for highway surface monitoring.
2. Materials and Methods
2.1. System Components
Highway condition-sensing devices are often deployed only at key points like ramps and toll booths, leading to inadequate monitoring over the entirety of the highway network. To enhance the monitoring capabilities across all highway segments and to assist road management authorities in actively alerting and managing abnormal conditions on the road surface, this paper introduces a fusion solution that integrates robotic technology, edge computing, and advanced object detection, as shown in Figure 1. This solution primarily consists of an intelligent patrol robot, equipped with an enhanced object detection algorithm, in conjunction with a cloud-based early warning platform.
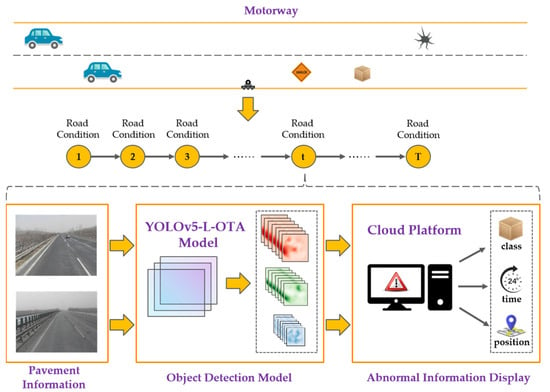
Figure 1.
Workflow demonstration diagram of the integrated approach to high-speed pavement monitoring.
The intelligent patrol robot is comprised of four key components: a real-time monitoring module, an anomaly recognition module, a positioning module, and a module for reporting and storing anomalies. Imagine a workflow spanning T moments in time. The real-time monitoring module’s primary role is to capture the highway surface information at each moment t as the robot traverses a specified highway segment. The collected road surface data are then transmitted to the anomaly recognition module. Within this module, the neural network model proposed in this paper conducts object detection on the real-time road imagery. If the detection results align with any predefined anomalous states in the database, the positioning module is activated to relay this information to the highway maintenance authorities. Moreover, the storage module archives images of road anomalies on a local forensic server. This enables maintenance authorities to remotely access the server, ensuring the traceability and verifiability of the reported data.
The cloud-based early warning platform consists of two main components: a data storage module and a road anomaly information display module. Images of road surface anomalies and their corresponding location information, transmitted from the road patrol robots, are stored in the cloud database. The road anomaly information display module retrieves data from this storage module and presents it on a front-end interface for review by road management authorities.
2.2. Object Detection Algorithm
2.2.1. YOLOv5 Model
YOLO (You Only Look Once) is a single-stage, high-efficiency object detection algorithm that enables end-to-end training while ensuring real-time processing capabilities, along with maintaining a high level of average accuracy [26]. Various versions of YOLO have evolved, with YOLOv5 being a relatively mature version that has been extensively tested and validated within the community. Its stability and reliability are crucial for practical applications, and compared to subsequent iterations, YOLOv5 demands more moderate computational resources.
The YOLOv5 network’s operation can be categorized into three distinct parts: feature extraction, feature enhancement and fusion, and predicting objects corresponding to the prior boxes. Corresponding to the tasks accomplished by YOLOv5, its model architecture can be divided into three major components: the Backbone for primary feature extraction, the Neck for enhanced feature extraction, and the Yolo Head. The structural design of the model is illustrated in Figure 2.
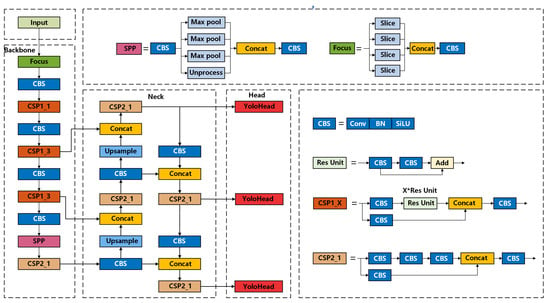
Figure 2.
YOLOv5 network structure diagram.
The input image initially undergoes feature extraction within the Backbone component of YOLOv5, where the extracted features are referred to as feature layers. During this primary feature extraction stage, three effective feature layers are obtained. These layers are then fed into the Neck for feature fusion through up-sampling and down-sampling processes, which integrate features of varying scales.
The Yolo Head module serves as both a classifier and a regressor in YOLOv5. It leverages the feature extraction capabilities of the Backbone and the feature fusion from the Neck to produce three enhanced effective feature layers. Each feature layer possesses dimensions in terms of width, height, and channel count, allowing the feature map to be viewed as a collection of feature points, each with its own set of channel features.
The Yolo Head module is responsible for determining whether the prior boxes on the feature points correspond to any objects. Its classification and regression tasks are executed within a 1 × 1 convolution.
2.2.2. GSConv
In the architecture of YOLOv5, the Neck component plays a crucial role in fusing the low-level and high-level feature information extracted by the Backbone network. This fusion is achieved through a combination of up-sampling and down-sampling techniques. Primarily, this process is facilitated by a series of standard convolutional operations. The structure of the standard convolutional (Conv) module within the Neck is depicted in Figure 3.
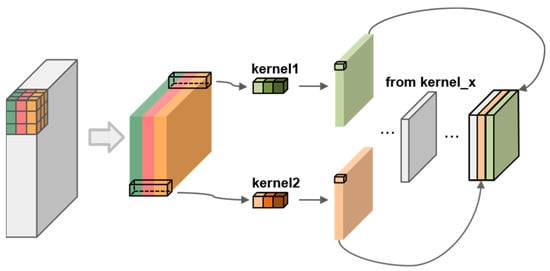
Figure 3.
Conv module structure.
In standard convolution, each set of convolutional kernels operates on the corresponding channels of the input feature map, with their outputs being element-wise added to produce a single feature map. While this approach achieves the goal of feature fusion, it poses challenges for mobile and embedded devices, which may struggle to run complex deep learning network models. Consequently, in the field of computer vision, there is an ongoing effort to miniaturize neural networks. Currently, this objective is primarily achieved through the use of depth-wise separable convolution (DSConv). DSConv reduces the number of parameters and floating-point operations (FLOPs), making it more feasible for less powerful devices.
In contrast to standard convolution, depth-wise separable convolution involves each channel of the input feature map convolving with only one kernel, as illustrated in Figure 4. Due to utilizing only a fraction of the parameters compared to standard convolution, this approach significantly reduces the size and computational load of the model. However, in depth-wise separable convolution, each kernel operates on a single channel, resulting in isolated the processing of channel information. This separation means that the feature information between channels is not effectively fused during the computation process.
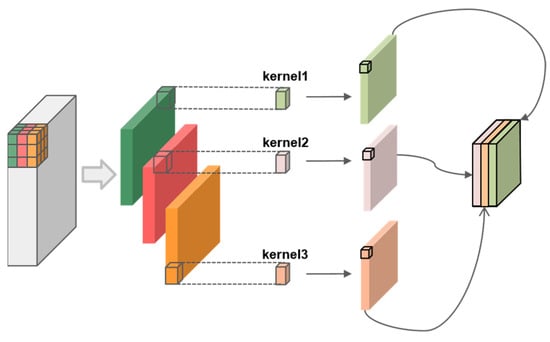
Figure 4.
DSConv module structure.
To mitigate complexity while retaining as much inter-channel information as possible, we have applied a lightweight modification to the standard convolution structure. This involves the introduction of a lightweight convolution method, GSConv (grouped separable convolution), to enhance the standard convolution (Conv) within the CBS module of the Neck layer. The structure of the GSConv module is depicted in Figure 5. This adaptation not only lightens the computational load but also preserves the crucial interplay of features across different channels, a balance crucial for the efficiency and effectiveness of the model.

Figure 5.
GSConv module structure.
In GSConv, the input feature map initially undergoes a 1 × 1 standard convolution, compressing the number of channels. This is followed by a 5 × 5 depth-wise convolution with a stride of 1, maintaining the output channel count at half of the original number. The outputs of the standard and depth-wise convolutions are then concatenated. Subsequently, a shuffle operation is applied to deeply blend the information generated by both processes. GSConv harnesses the rich feature extraction of standard convolution and the resource efficiency of depth-wise convolution, offering significant advantages when deployed on edge devices compared to traditional convolution. The adoption of GSConv effectively minimizes the drawbacks of DSConv while capitalizing on its strengths.
2.2.3. OTA
In the YOLO series of models, label assignment refers to the process of allocating each ground truth box () to the anchor box () that best matches it. During the label assignment phase in YOLOv5, the intersection over union () metric is used to measure the degree of overlap between the anchor boxes and the actual bounding boxes. The formula for calculating is as follows:
The label assignment in YOLOv5 involves determining if the value exceeds a predefined threshold. This process identifies the anchor box that best matches the current ground truth box, designating it as the reference anchor box for label assignment. Although this principle is straightforward and efficient, it relies solely on the distance relationship between the anchor box and the ground truth box, specifically the overlapping ratio. This singular metric can lead to misjudgments in cases of overlapping and occluded targets. Additionally, for smaller objects, the lower values may result in failure to assign the correct label to the corresponding anchor box.
To address the aforementioned challenges, we have incorporated the optimal transport (OT) problem into the label assignment process of object detection algorithms. The OT problem involves a scenario with m goods suppliers and n goods recipients. Each supplier i possesses units of goods, while each recipient j requires units. The transportation cost per unit of goods from supplier i to recipient j is denoted as . The crux of this problem is to devise a transportation plan such that goods from all suppliers are transported to all recipients at the lowest possible cost. The mathematical expression for this problem is as follows:
In the context of a high-speed highway image requiring detection, let us consider a scenario with m ground truth boxes and n anchor boxes. Each ground truth box is conceptualized as a supplier possessing k positive labels, while each anchor box is viewed as a demander in need of one label. The transportation cost for transferring a positive label from a ground truth box to an anchor box is defined as the weighted sum of their classification and regression losses. The formula for this cost is expressed as follows:
In Formula (3), 1 ≤ i ≤ h, 1 ≤ j ≤ h, θ is the model parameter, and respectively, represent the prediction score and bounding box of the anchor box classification, and , respectively, represent the real box category and bounding box, represents cross entropy loss and IOU loss, and α is the balance coefficient.
In the task of detecting abnormal conditions on high-speed road surfaces, a critical aspect involves not only utilizing some anchor boxes as positive samples but also designating others as negative samples. To effectively manage this, the concept of ‘background’ is introduced as an additional supplier, exclusively tasked with providing negative labels. The calculation method for the transportation cost of conveying a negative label from the background to a specific anchor box is as follows:
In Formula (4), the represents the background class.
This approach to handling negative samples in the detection process is vital for reducing false positives and improving the overall accuracy of the model. The incorporation of the background as a separate entity in the label assignment process allows for a more nuanced understanding of the scene, enhancing the model’s ability to discern between actual objects and mere background elements. The supply relationship for the number of positive labels that each ground truth can allocate to anchor points, as well as the number of negative labels that the background can supply, is as follows:
By constructing a cost matrix using and , and employing the Sinkhorn–Knopp iteration algorithm, we have efficiently determined the optimal transport path. Once the optimal transport plan is established, the corresponding label allocation scheme can be decoded, ensuring each anchor point is assigned to the supplier providing the most labels. This methodology effectively selects the best solution among numerous potential matching schemes, significantly enhancing the model’s capability for label assignment in complex, multi-object scenarios, and bolstering its adaptability to diverse situations.
The optimization process of OTA primarily involves matrix multiplication operations that can be accelerated using GPU hardware [29]. This demonstrates that the strategy not only optimizes the model’s performance in complex environments but also maintains computational efficiency, showcasing a method that balances effectiveness and efficiency.
2.2.4. YOLOv5s-L-OTA Model
In pursuit of achieving superior efficiency and accuracy, we have innovated a lightweight detection model, YOLOv5s-L-OTA, founded on an optimal label assignment strategy. Initially, after a comparative evaluation, we selected the YOLOv5s model for its rapid image processing capabilities, and subsequently, we developed an enhanced version. Tailored to specific detection tasks, we integrated GSConv to reduce model complexity while preserving accuracy, thereby effectively minimizing information loss commonly associated with depth-wise separable convolutions in standard lightweight operations. Spatial Pyramid Pooling was employed to process feature maps from deep networks, ensuring robust feature representation across targets of varying sizes and categories. Moreover, we utilized path aggregation techniques to amalgamate deep semantic information with shallow object details. During the prediction phase of the detector, an optimal transport assignment (OTA)-based label allocation strategy was implemented for loss computation, culminating in a decoded, visualizable format. The network architecture of the proposed model is illustrated in Figure 6, where the modifications are highlighted by the red dashed lines encircling the altered components.
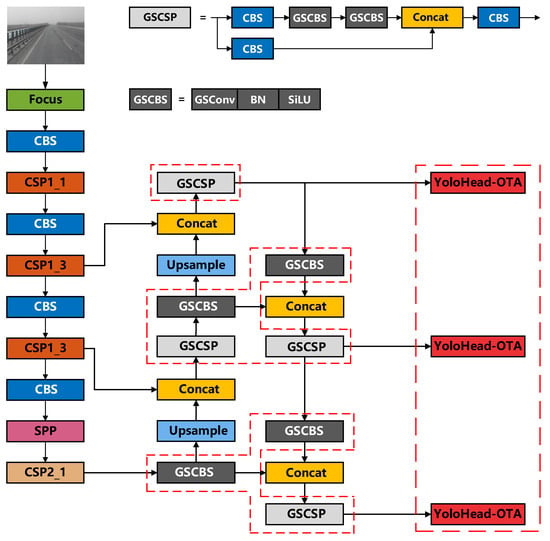
Figure 6.
Improved YOLO model network structure diagram.
3. Experiment
3.1. Algorithm
3.1.1. Experimental Environment
The algorithmic experiments were conducted on a Windows 11 (64 bit) operating system, with PyCharm 2022.2.2 serving as the software environment. The deep learning framework employed was PyTorch version 1.11.0, utilizing CUDA 11.5 for GPU acceleration. In terms of hardware configuration, the system was equipped with an Intel Core(TM) i7-12700H CPU, 16 GB of RAM, and an RTX3060 GPU boasting a 6 GB video memory capacity. During the training of the neural network, the Stochastic Gradient Descent (SGD) optimizer was chosen for its advantages of speed, low memory usage, prevention of overfitting, and simplicity in parameter tuning. To enhance the diversity of the dataset, mosaic data augmentation was employed, which involves transformations such as translation, rotation, and scaling. Additionally, to avoid overfitting on the training data and to save training time, the training process was terminated prematurely if there was no improvement in the model’s performance on the validation set after 30 training epochs. Details of other parameters set for neural network training are outlined in Table 1.

Table 1.
Neural network training parameter settings.
3.1.2. Dataset Development
Leveraging our custom-compiled dataset, HSRD (high-speed road detection), we trained an optimized model specifically for detecting debris and road damage in high-speed highway scenarios. The HSRD dataset comprises two primary sources of raw data. One part consists of manually captured images from real-world highway settings, while the other segment incorporates select images from the publicly available dataset of the Global Road Damage Detection Challenge 2020 (GRDDC-2020). This dual-source approach ensures a diverse and comprehensive collection of data, enhancing the model’s robustness and applicability across various real-world highway conditions.
The GRDDC2020 dataset encompasses images depicting varying road conditions from three countries: the Czech Republic (Czech), India, and Japan. For our study, we specifically selected a subset of asphalt road surface images from the Czech Republic and Japan as complementary data to our manually captured photographs. This selection strategy was aimed at enhancing the diversity and representativeness of our dataset. Detailed information regarding the description and quantity of these datasets, including the segmentation of images from the Czech Republic and Japan, is meticulously documented in Table 2. Visual examples of some images from the HSRD dataset are illustrated in Figure 7.

Table 2.
Dataset information.
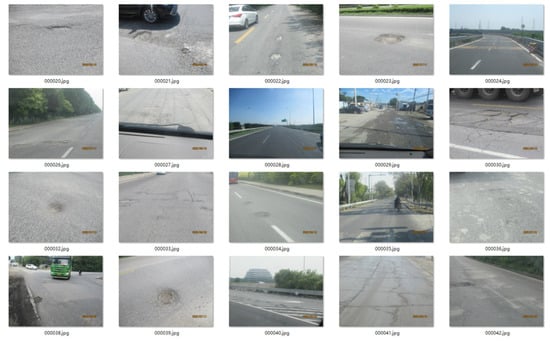
Figure 7.
Example visualization of selected images from the HSRD dataset.
The HSRD dataset encompasses a total of 14 categories, including road defects and debris, with an aggregate of 9445 labels. The dataset exhibits a range of instances per category, with a maximum of 900 and a minimum of 510 instances. Notably, there is no category with an instance count significantly higher or lower than the others, ensuring a relatively balanced distribution. This equilibrium minimizes disparities in instance numbers across categories, promoting an unbiased learning environment for models. This balanced configuration is crucial for equitable model training, ensuring no particular category dominates the learning process. The distribution of instance numbers across different categories is illustrated in Figure 8.
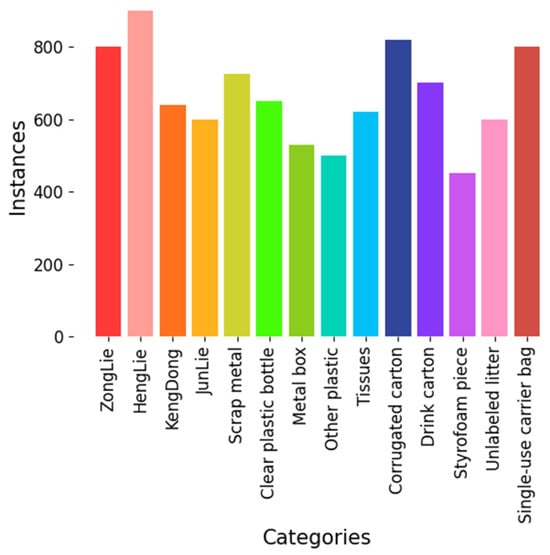
Figure 8.
Chart of categories and number of instances.
3.1.3. Performance Metrics
In the academic realm, time complexity and space complexity are widely recognized metrics for assessing the complexity of a network model. Typically, time complexity is quantified using the number of floating-point operations (FLOPs), whereas space complexity is often measured in terms of the model’s parameter count. In our experiment, we have adopted these two indices—FLOPs and the number of parameters—to evaluate the complexity of our model.
The mean average precision (mAP) is calculated as the mean of the average precision (AP) for each category. This metric effectively gauges the precision performance of a network model in multi-class tasks. In our experiment, we utilize the mAP value at a common confidence threshold of 0.5 as the principal metric for evaluating the model’s accuracy. The calculation formula for the mAP value is as follows:
In Formula (5), N is the total number of categories, and AP(i) is the average accuracy of the i category.
The frames per second (FPS) value, indicative of the number of frames processed per second, serves as a crucial metric for assessing the efficiency and performance of an algorithm. A higher FPS value implies superior real-time performance of the model, signifying its capability to process data more swiftly. The formula for calculating FPS is as follows:
In Formula (6), denotes the average preprocessing time per frame, represents the average inference time per frame, and indicates the average post-processing time per frame. The units for and are all in seconds.
When evaluating object detection models, box_loss reflects the accuracy of bounding box predictions, obj_loss measures the precision of predicting the presence of objects, and cls_loss indicates the correctness of classification. The levels of these three loss metrics are indicative of the model’s performance in terms of localization, object detection, and classification. As these aspects are critical for model optimization, we have incorporated these loss indicators into our evaluation metrics.
3.1.4. Results and Analysis
In this study, to comprehensively evaluate the performance of YOLOv5 in high-speed road detection tasks, we specifically designed a series of experiments comparing different versions of the YOLOv5 architecture. This was carried out to identify the most suitable version to serve as a baseline model for further optimization. We selected the YOLOv5n, YOLOv5s, YOLOv5m, YOLOv5l, and YOLOv5x models for comparison under uniform dataset and training strategy conditions. This approach allowed us to thoroughly assess the performance variations of each version in the specific application scenario of high-speed road detection. The results of these experiments are illustrated in Figure 9.
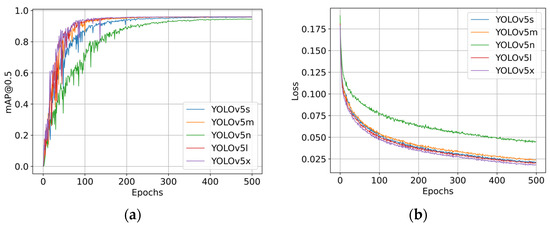
Figure 9.
(a) The comparison of mAP across different versions of YOLOv5. (b) The comparison of loss metrics across different versions of YOLOv5.
As clearly demonstrated in Figure 9a,b, YOLOv5n exhibits a notably weaker performance in terms of average precision and loss convergence compared to the other four models. Meanwhile, the performances of YOLOv5s, YOLOv5m, YOLOv5l, and YOLOv5x are closely matched. Due to its limited capacity, YOLOv5n struggles to fully learn data features, resulting in weaker generalization abilities. In contrast, larger models such as YOLOv5s, m, l, and x, with their increased number of parameters and deeper network architectures, are capable of learning more complex features. Furthermore, an in-depth analysis of the data in Table 3 reveals that the YOLOv5s model has significantly fewer parameters and requires fewer floating-point operations than YOLOv5m, YOLOv5l, and YOLOv5x. This reduced model complexity provides a solid foundation for edge computing applications. Considering these comparative insights, we have selected YOLOv5s as our baseline model.

Table 3.
Size of different versions of YOLOv5.
To validate the effectiveness of lightweight convolution using GSConv in the YOLOv5 network model, and to assess the impact of the optimal transport assignment (OTA) label allocation strategy on model accuracy, this study builds upon the YOLOv5s model. We introduced GSConv to replace the standard convolutions in the Neck section of the original YOLOv5s network, resulting in an improved algorithm termed YOLOv5s-L. Additionally, we incorporated the OTA label allocation strategy into the YOLOv5s-L framework, leading to a further enhanced model named YOLOv5s-Light-OTA. Both of these modified algorithms, YOLOv5s-L and YOLOv5s-L-OTA, were compared with the original YOLOv5s model in experiments conducted on the HSRD dataset. The results of these comparative analyses are detailed in Table 4.

Table 4.
Evaluation of different models’ complexity and prediction performance.
Observing the parameter count and the number of floating-point operations (FLOPs) for each model as presented in Table 4, it is evident that both YOLOv5s-L and YOLOv5s-L-OTA maintain consistency in these metrics. Compared to the original YOLOv5s network model, these modified versions exhibit a 21% reduction in parameters and an 18% decrease in FLOPs. The lightweight modifications to YOLOv5s-L and YOLOv5s-L-OTA result in an increase in frames per second (FPS), from 92 frames in the original model to 120 frames, achieving 1.3 times the original model’s FPS. This enhancement signifies improved real-time responsiveness in practical computations.
Regarding the mean average precision (mAP), our YOLOv5s-L algorithm achieved 94.7%, showing a slight decrease in detection accuracy by 0.8% compared to the original YOLOv5s. However, our YOLOv5s-L-OTA algorithm reached an mAP of 97.5%, which is a 2% improvement in detection accuracy over the original YOLOv5s. These data indicate that while the lightweight version slightly reduces accuracy, the incorporation of the OTA strategy significantly enhances it, demonstrating the effectiveness of our proposed modifications.
To visually illustrate the variation in the mean average precision (mAP) values throughout the experimental results, we provide a comparative line graph depicting the changes in mAP values during training for both the proposed and the original models. As shown in Figure 10, the improved YOLOv5s-L-OTA model consistently maintains a superior position in terms of average precision throughout the entire 500 training epochs. The YOLOv5s-L-OTA model developed in this study demonstrates higher average detection accuracy while operating with lower model complexity.
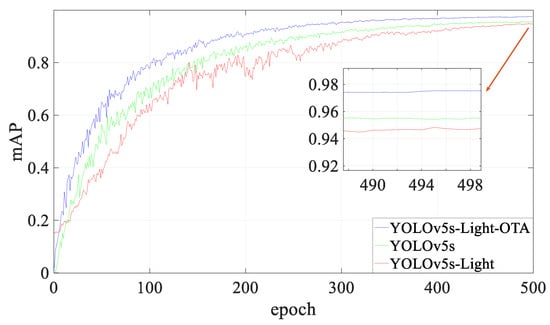
Figure 10.
Comparison of mAP curves between the baseline and improved models.
A higher mean average precision (mAP) value indicates superior detection performance of a model, while the trajectory of the loss curve further reveals the model’s progress in minimizing prediction errors. To obtain a comprehensive evaluation, we consider both of these aspects together. Figure 11 and Figure 12, respectively, illustrate the loss curves for the initial YOLOv5s model and the optimized modified model, YOLOv5s-L-OTA. These figures provide a visual representation of how the modified model enhances detection accuracy while efficiently reducing losses over the course of training.
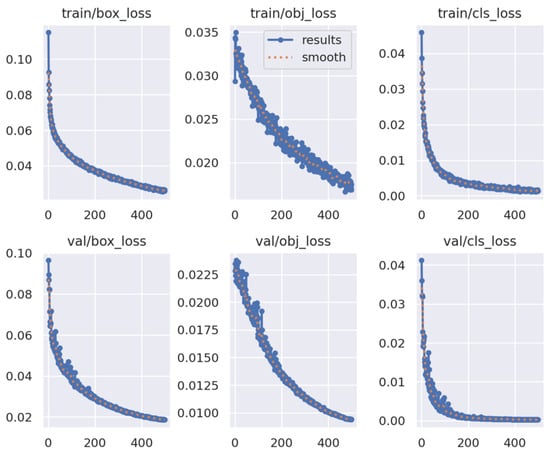
Figure 11.
The loss curves YOLOv5s.
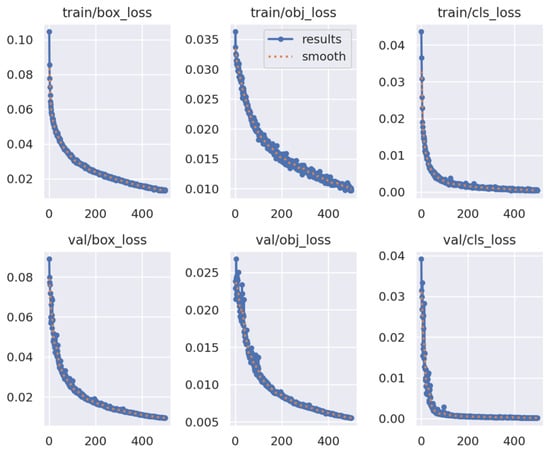
Figure 12.
The loss curves for YOLOv5s-L-OTA.
From the above graphs, it is evident that in both training (train) and validation (val) scenarios for the YOLOv5s model, the values of the three types of loss curves—box_loss, obj_loss, and cls_loss—gradually decrease as the number of training epochs increases, indicating effective learning of data features by the model. However, there is noticeable fluctuation in the obj_loss curve during training and in all three types of loss curves during validation. In contrast, the loss curves of the YOLOv5s-L-OTA model exhibit smoother trajectories in both train and val scenarios, with lower loss values at equivalent training epochs compared to the original model. This suggests that our proposed model has superior learning and generalization capabilities, reflecting the effectiveness of the improvements incorporated in our model.
As illustrated in Figure 13, to further validate the reliability of our algorithm, we conducted experiments on the visualization of detection results. Table 5 presents a quantitative comparison of the number of targets correctly identified by the two models.
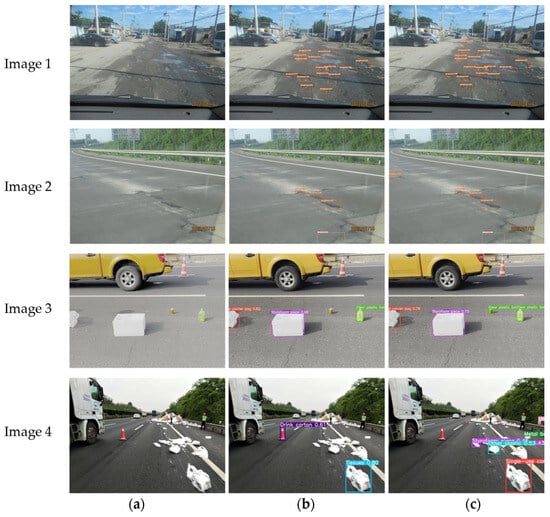
Figure 13.
The detection results of YOLOv5s and YOLOv5s-L-OTA. Column (a) denotes the original image, column (b) denotes the YOLOv5s’ detection result, and column (c) is our model’s detection result.

Table 5.
In some of the images tested, the model accurately predicted the number of objects.
The YOLOv5s algorithm demonstrates limitations in detecting multiple small targets, often leading to false positives and inaccurate localization. However, the optimization of the model through lightweight convolution and the improved label allocation strategy enhances the algorithm’s capacity for effective recognition in scenarios with multiple targets. This approach significantly improves the model’s generalization ability and robustness across diverse environments, resulting in markedly better detection performance.
3.2. Inspection Robot Construction
The intelligent patrol robot designed for our system, as shown in Figure 14, can be mounted on guardrails and autonomously operates in designated areas. Its hardware configuration primarily includes a main control board, a camera, a positioning module, a servo driver, a servo motor, limit sensors, networking equipment, and storage devices. The overall structure of the robot is depicted in Figure 15.
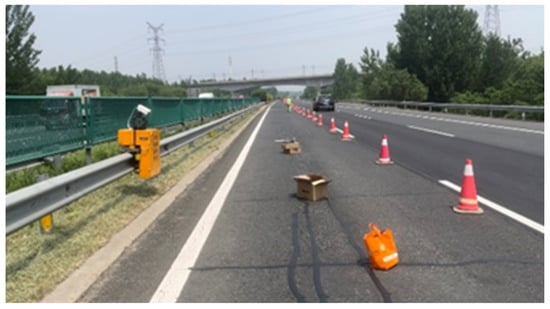
Figure 14.
Intelligent patrol robot in the high-speed site image.
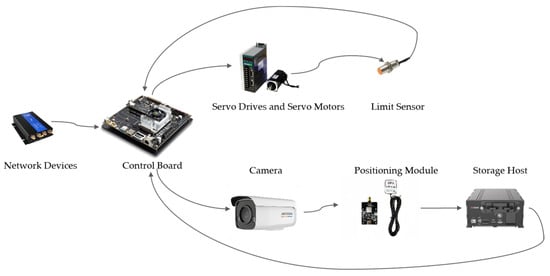
Figure 15.
Key components of robot hardware.
The control board, positioned at the heart of the system, serves as the central processing unit, orchestrating the operations of the entire setup. We have chosen Nvidia’s Jetson TX2, an edge computing module, as the core component, renowned for its low power consumption and high performance in real-time highway anomaly monitoring. Equipped with an Nvidia Pascal GPU and an 8-core CPU cluster that combines Cortex-A57 and Cortex-A53 cores, it supports FP16 computation and hardware-accelerated deep learning inference, enabling efficient multi-threaded processing. Network devices connected to the control board facilitate communication protocols and connectivity, providing channels for remote monitoring and control.
In terms of motion control, the system utilizes an AC permanent magnet synchronous servo driver (SD300 series) with a high-performance chipset, offering speed, position, and torque control. These drivers operate effectively under vibrations up to 0.5 G and temperatures ranging from −20 °C to 80 °C. Their compact design includes an IPM module, enhancing overload capacity. The servo motor has a rated torque of 1.27 N.m and a peak torque of 3.9 N.m, with a torque coefficient of 0.45 N.m/A and a rated voltage of 220 V. Its IP64 protection level ensures reliable operation in various climatic conditions. Magnetic induction proximity switches navigate the patrol robot between two magnetic sensing points for continuous monitoring, suitable for harsh environments, changing magnetic fields without physical contact to trigger switches.
To effectively capture images within a four-lane highway, our system employs a fixed-focus camera with a 4 mm focal length. With an aperture of F1.2 and AGC ON, the camera ensures full-color imaging under minimal illumination conditions as low as 0.002 Lux, thus maintaining the quality of the footage captured on highways.
Positioning is handled by a BDS/GNSS navigation module based on ATGM336H-5N, supporting multiple satellite systems for precise location tracking. The high-capacity storage host efficiently processes and stores high-resolution videos from the camera, ensuring comprehensive data management.
3.3. Cloud Platform
During its movement, the intelligent patrol robot inputs captured images into the YOLOv5s-L-OTA neural network algorithm. Upon detecting debris and road damages as defined in the training dataset, the system performs feature extraction, feature fusion, and object classification. Ultimately, it identifies any anomalies on the road surface that meet the predefined criteria and, in conjunction with location data, uploads this information to a cloud platform for early warning purposes. The cloud platform’s interface is displayed in Figure 16.
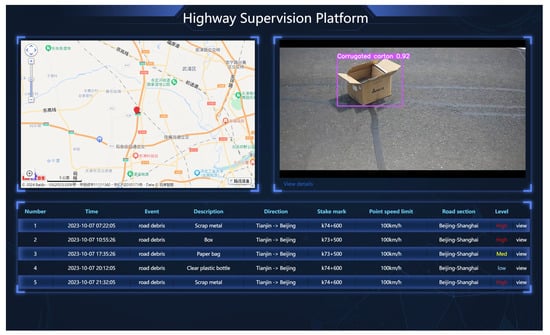
Figure 16.
Cloud platform interface.
4. Conclusions
To address the issue of traditional highway sensing devices being primarily concentrated at toll stations and ramps while neglecting the intermediate road sections, this paper proposes a novel highway surface monitoring method that combines robotics technology with edge computing. We utilize an improved YOLOv5s neural network algorithm for real-time detection of road debris and surface damage on highways. By incorporating an advanced convolution method, GSConv, the model becomes more lightweight without significantly sacrificing feature extraction capability, making it more suitable for operation on edge computing platforms.
Furthermore, we employ a label allocation strategy based on optimal transport theory to enhance the model’s accuracy and robustness in dealing with complex road anomaly scenarios. We also constructed an HSRD dataset encompassing a variety of complex road conditions, including debris and surface damage, to support our research. Compared to the original model, our modified version shows a 21% reduction in parameters and an 18% decrease in floating-point operations, with a 2% increase in mean accuracy and a 1.3 times improvement in frames per second (FPS). This indicates that our algorithm maintains its lightweight nature while achieving higher detection accuracy and better real-time performance.
Finally, we deployed this algorithm on an intelligent road patrol platform, effectively monitoring highway surface conditions. When the camera captures road defects and debris on highways, our enhanced algorithm deployed on smart inspection robots will complete the detection of abnormalities in the scene in approximately 70 milliseconds. Subsequently, utilizing networking devices, it will transmit key information such as location and category through the internet to be displayed on a cloud interface. Provided the network transmission is smooth, the entire process from detection to display on the cloud interface will be completed within one second. Through this comprehensive approach, we are able to monitor highway surface conditions more thoroughly and accurately, contributing to road safety and improved traffic efficiency. The goal of future work is to enhance the diversity of the dataset, for example, by incorporating data on tires discarded due to blowouts, thereby increasing the number of categories recognizable by the target detection model. Simultaneously, efforts will also be directed toward improving the adaptability of the intelligent inspection robot to various types of guardrails, aiming to enhance its practicality in different scenarios.
Author Contributions
Conceptualization, B.S. and J.S.; methodology, J.S.; software, J.S.; validation, J.S.; formal analysis, Y.Z.; investigation, B.S.; resources, B.S.; data curation, Y.Z.; writing—original draft preparation, J.S.; writing—review and editing, Y.Z. and B.S.; visualization, J.S.; supervision, Y.Z.; project administration, B.S.; funding acquisition, B.S. All authors have read and agreed to the published version of the manuscript.
Funding
This project was supported by National Natural Science Foundation of China (52237008, 52107176).
Institutional Review Board Statement
Not applicable.
Informed Consent Statement
Not applicable.
Data Availability Statement
The data presented in this study are available on request from the corresponding author. The data are not publicly available due to current proprietary.
Acknowledgments
The authors are grateful to the editors and anonymous reviewers for their informative suggestions.
Conflicts of Interest
The authors declare no conflicts of interest.
References
- Moslem, S.; Gul, M.; Farooq, D.; Celik, E.; Ghorbanzadeh, O.; Blaschke, T. An Integrated Approach of Best-Worst Method (BWM) and Triangular Fuzzy Sets for Evaluating Driver Behavior Factors Related to Road Safety. Mathematics 2020, 8, 20. [Google Scholar] [CrossRef]
- Ghandour, R.; Potams, A.J.; Boulkaibet, I.; Neji, B.; Al Barakeh, Z. Driver Behavior Classification System Analysis Using Machine Learning Methods. Appl. Sci. 2021, 11, 19. [Google Scholar] [CrossRef]
- Shahverdy, M.; Fathy, M.; Berangi, R.; Sabokrou, M. Driver behavior detection and classification using deep convolutional neural networks. Expert Syst. Appl. 2020, 149, 12. [Google Scholar] [CrossRef]
- Dingus, T.A.; Guo, F.; Lee, S.; Antin, J.F.; Perez, M.; Buchanan-King, M.; Hankey, J. Driver crash risk factors and prevalence evaluation using naturalistic driving data. Proc. Natl. Acad. Sci. USA 2016, 113, 2636–2641. [Google Scholar] [CrossRef]
- Li, G.F.; Wang, Y.; Zhu, F.P.; Sui, X.X.; Wang, N.; Qu, X.D.; Green, P. Drivers’ visual scanning behavior at signalized and unsignalized intersections: A naturalistic driving study in China. J. Saf. Res. 2019, 71, 219–229. [Google Scholar] [CrossRef]
- Malin, F.; Norros, I.; Innamaa, S. Accident risk of road and weather conditions on different road types. Accid. Anal. Prev. 2019, 122, 181–188. [Google Scholar] [CrossRef]
- Bi, H.; Ye, Z.R.; Zhu, H. Data-driven analysis of weather impacts on urban traffic conditions at the city level. Urban Clim. 2022, 41, 16. [Google Scholar] [CrossRef]
- Zhu, Y.Y.; Wu, Q.E.; Xiao, N. Research on highway traffic flow prediction model and decision-making method. Sci. Rep. 2022, 12, 11. [Google Scholar] [CrossRef]
- Rodríguez-Rangel, H.; Morales-Rosales, L.A.; Imperial-Rojo, R.; Roman-Garay, M.A.; Peralta-Peñuñuri, G.E.; Lobato-Báez, M. Analysis of Statistical and Artificial Intelligence Algorithms for Real-Time Speed Estimation Based on Vehicle Detection with YOLO. Appl. Sci. 2022, 12, 20. [Google Scholar] [CrossRef]
- Chen, J.N.; Tao, W.J. Traffic accident duration prediction using text mining and ensemble learning on expressways. Sci. Rep. 2022, 12, 13. [Google Scholar] [CrossRef] [PubMed]
- Zou, X.; Yue, W.L.; Vu, H.L. Visualization and analysis of mapping knowledge domain of road safety studies. Accid. Anal. Prev. 2018, 118, 131–145. [Google Scholar] [CrossRef]
- Shah, S.A.R.; Brijs, T.; Ahmad, N.; Pirdavani, A.; Shen, Y.J.; Basheer, M.A. Road Safety Risk Evaluation Using GIS-Based Data Envelopment Analysis-Artificial Neural Networks Approach. Appl. Sci. 2017, 7, 19. [Google Scholar] [CrossRef]
- Bisio, I.; Garibotto, C.; Haleem, H.; Lavagetto, F.; Sciarrone, A. A Systematic Review of Drone Based Road Traffic Monitoring System. IEEE Access 2022, 10, 101537–101555. [Google Scholar] [CrossRef]
- Outay, F.; Mengash, H.A.; Adnan, M. Applications of unmanned aerial vehicle (UAV) in road safety, traffic and highway infrastructure management: Recent advances and challenges. Transp. Res. Pt. A-Policy Pract. 2020, 141, 116–129. [Google Scholar] [CrossRef]
- Sabour, M.H.; Jafary, P.; Nematiyan, S. Applications and classifications of unmanned aerial vehicles: A literature review with focus on multi-rotors. Aeronaut. J. 2023, 127, 466–490. [Google Scholar] [CrossRef]
- Sun, W.; Dai, L.; Zhang, X.R.; Chang, P.S.; He, X.Z. RSOD: Real-time small object detection algorithm in UAV-based traffic monitoring. Appl. Intell. 2022, 52, 8448–8463. [Google Scholar] [CrossRef]
- Jiao, L.C.; Zhang, F.; Liu, F.; Yang, S.Y.; Li, L.L.; Feng, Z.X.; Qu, R. A Survey of Deep Learning-Based Object Detection. IEEE Access 2019, 7, 128837–128868. [Google Scholar] [CrossRef]
- Girshick, R.; Donahue, J.; Darrell, T.; Malik, J. Rich Feature Hierarchies for Accurate Object Detection and Semantic Segmentation. In Proceedings of the 2014 IEEE Conference on Computer Vision and Pattern Recognition, Columbus, OH, USA, 23–28 June 2014; pp. 580–587. [Google Scholar]
- Girshick, R. Fast R-CNN. In Proceedings of the IEEE International Conference on Computer Vision, Santiago, Chile, 11–18 December 2015; pp. 1440–1448. [Google Scholar]
- He, K.M.; Gkioxari, G.; Dollár, P.; Girshick, R. Mask R-CNN. In Proceedings of the 16th IEEE International Conference on Computer Vision (ICCV), Venice, Italy, 22–29 October 2017; pp. 2980–2988. [Google Scholar]
- Ren, S.Q.; He, K.M.; Girshick, R.; Sun, J. Faster R-CNN: Towards Real-Time Object Detection with Region Proposal Networks. IEEE Trans. Pattern Anal. Mach. Intell. 2017, 39, 1137–1149. [Google Scholar] [CrossRef] [PubMed]
- Jeong, J.; Park, H.; Kwak, N. Enhancement of SSD by concatenating feature maps for object detection. arXiv 2017, arXiv:1705.09587. [Google Scholar]
- Liu, W.; Anguelov, D.; Erhan, D.; Szegedy, C.; Reed, S.; Fu, C.Y.; Berg, A.C. SSD: Single Shot MultiBox Detector. In Proceedings of the 14th European Conference on Computer Vision (ECCV), Amsterdam, The Netherlands, 8–16 October 2016; pp. 21–37. [Google Scholar]
- Lin, T.Y.; Goyal, P.; Girshick, R.; He, K.M.; Dollár, P. Focal Loss for Dense Object Detection. IEEE Trans. Pattern Anal. Mach. Intell. 2020, 42, 318–327. [Google Scholar] [CrossRef] [PubMed]
- Novak, B.; Ilic, V.; Pavkovic, B. YOLOv3 Algorithm with additional convolutional neural network trained for traffic sign recognition. In Proceedings of the Zooming Innovation in Consumer Technologies Conference (ZINC), Electr Network, Novi Sad, Serbia, 26–27 May 2020; pp. 165–168. [Google Scholar]
- Redmon, J.; Divvala, S.; Girshick, R.; Farhadi, A. You Only Look Once: Unified, Real-Time Object Detection. In Proceedings of the 2016 IEEE Conference on Computer Vision and Pattern Recognition (CVPR), Seattle, WA, USA, 27–30 June 2016; pp. 779–788. [Google Scholar]
- Redmon, J.; Farhadi, A. YOLOv3: An Incremental Improvement. arXiv 2018, arXiv:1804.02767. [Google Scholar]
- Redmon, J.; Farhadi, A. YOLO9000: Better, Faster, Stronger. In Proceedings of the 30th IEEE/CVF Conference on Computer Vision and Pattern Recognition (CVPR), Honolulu, HI, USA, 21–26 July 2016; pp. 6517–6525. [Google Scholar]
- Ge, Z.; Liu, S.T.; Liu, Z.M.; Yoshie, O.; Sun, J. OTA: Optimal Transport Assignment for Object Detection. In Proceedings of the IEEE/CVF Conference on Computer Vision and Pattern Recognition (CVPR), Electr Network, Virtual, 19–25 June 2021; pp. 303–312. [Google Scholar]
Disclaimer/Publisher’s Note: The statements, opinions and data contained in all publications are solely those of the individual author(s) and contributor(s) and not of MDPI and/or the editor(s). MDPI and/or the editor(s) disclaim responsibility for any injury to people or property resulting from any ideas, methods, instructions or products referred to in the content. |
© 2024 by the authors. Licensee MDPI, Basel, Switzerland. This article is an open access article distributed under the terms and conditions of the Creative Commons Attribution (CC BY) license (https://creativecommons.org/licenses/by/4.0/).