Article

Evaluation on Material Anisotropy of Acrylonitrile Butadiene Styrene Printed via Fused Deposition Modelling

by
Nima Zohdi
,
Phan Quoc Khang Nguyen
and
Richard (Chunhui) Yang
*
Centre for Advanced Manufacturing Technologies, School of Engineering, Design and Built Environment, Western Sydney University, Penrith, NSW 2751, Australia
*
Author to whom correspondence should be addressed.
These authors contributed equally to this work.
Appl. Sci. 2024, 14(5), 1870; https://doi.org/10.3390/app14051870
Submission received: 8 January 2024 / Revised: 6 February 2024 / Accepted: 22 February 2024 / Published: 24 February 2024
(This article belongs to the Special Issue Advanced Manufacturing Technologies and Their Applications, Volume II)

Abstract

:
Thermoplastic polymers are widely used in industry to generate parts with reasonable production costs, lightweight, chemical stability, sustainability, and recyclability compared to other materials such as metals, metalloids, or even thermoset polymers. The innovative additive manufacturing (AM) techniques, e.g., fused deposition modelling (FDM), can be used to fabricate thermoplastic products with complex geometries and specific properties. However, the mechanical integrity of those FDM-printed plastic parts can be greatly impacted by a phenomenon named material anisotropy. In this study, an experimental study on a popular 3D printing polymer material—acrylonitrile butadiene styrene (ABS)—is performed to determine how FDM process parameters affect the mechanical properties of the printed ABS parts. This study uniquely concentrates on investigating mechanical anisotropy in FDM-printed ABS, delving into a combination of key printing parameters for a comprehensive exploration. Meanwhile, a finite-element-based numerical analysis is also utilised to numerically evaluate the influences of infill percentage and build orientations on the mechanical properties of the 3D-printed ABS materials for comparison. It generates a better understanding of material anisotropy and helps to find the optimal FDM process parameters to print high-quality ABS parts and may attract industrial interests in transitioning from traditional ABS part production methods such as injection moulding or hot pressing to additive manufacturing.

1. Introduction

Additive manufacturing (AM) is innovative and sustainable in comparison to the other two conventional methods of parts production known as formative and subtractive manufacturing [1,2]. This method is based on printing continuous layers of material on top of each other to form the final part with the assistance of a meshed 3D computer model, which is developed using computer-aided design (CAD) software, SolidWorks or similar software to generate a surface tessellation language (STL) file and a slicing software to generate G-codes as a build file of 2D layers for a 3D printer [3,4,5]. In 1986, Chuck (Charles) Hull claimed the discovery of this method [6]. The main advantage of AM to conventional forming and subtractive manufacturing is its ability to generate complex geometries and limit the amount of waste material [7,8,9]. Industries such as automotive, aerospace, and healthcare showed the potential of using AM methods for generating complex, lightweight parts with acceptable performances. The architectural industry by prototyping the small models to the entire building can also gain a huge benefit in saving time and costs in production [4,9,10,11].
A long list of AM methods is now available from which to choose and generate polymeric parts. However, the simplest method that is capable of generating complex geometries, producing less waste and using the relatively cheapest equipment and raw material is fused deposition modelling (FDM) [12], or fused filament fabrication (FFF). Thermoplastic materials, including acrylonitrile butadiene styrene (ABS), high-impact polystyrene (HIPS), nylon, polycarbonate (PC), polyethylene (PE), polyether ether ketone (PEEK), polyethylene terephthalate glycol-modified (PETG), polylactide (PLA), polyoxymethylene (POM), polypropylene (PP), and polyvinyl alcohol (PVA), can be used in conjunction with the FDM method to obtain parts with different mechanical properties [9,13,14,15]. Figure 1 shows a schematic of the typical FDM process.
Since the variation in distinct 3D printing process parameters like layer thickness, raster angle, nozzle temperature [16], infill pattern [17], and infill density can strongly modify the parts’ properties, understanding their influence is a crucial step to guarantee high-quality 3D-printed products. In a study, layer thickness, infill density, and raster angle were found to have significant influences on the mechanical properties of ABS FDM-printed parts. The optimal settings of those three parameters are an infill density of 80%, a 0.5 mm layer thickness, and a raster angle of 65°. In addition, infill density was asserted to have the highest contribution to all mechanical properties [18]. In another research study, Deshwal et al. [19] evaluated the effects of infill density, print speed, and nozzle temperature on the tensile strength of PLA FDM-printed parts. They indicated that increasing infill density and nozzle temperature could lead to an enhancement in tensile strength, as it created a better fusion between adjacent layers, strengthening the internal structure. In a study by Wang et al. [20], the dynamic mechanical properties of FDM parts were the target for improvement when the parts were fabricated with different combinations of layer thickness, extrusion temperature, raster angle, and infill density. The layer thickness was found to have a strong influence on the interlayer bonding strength and a smaller layer thickness should be considered for improving the interlayer bonding strength. The increase in infill density was found to reduce the gaps inside the structures, which enhanced the material properties. Meanwhile, the low nozzle temperature was claimed to affect the fluidity of the deposited materials, weakening the interlayer bonding strength.
Constructing a 3D representative volume element (RVE) is a popular technique to model the internal structure and perform simulations to extract the material properties. From the literature, Hexagon Digimat-FE appeared to be a prominent tool for this purpose. In a study, RVE models of BaTiO3 were developed to extract the effective elastic constant [21]. When the structure comprises regions with different properties or different materials, analytical models such as the rules of mixtures (ROM) can be deployed to determine the overall material properties by considering the contribution of each region or material. In their study, Deng et al. [22] confirmed the feasibility of using ROM to obtain the Young’s modulus and tensile strength of unidirectional carbon-fibre reinforced polymers using 3D printing (CFRP) [22]. However, the ideal ROM assumes the fibres in the composite are aligned unidirectionally and distributed uniformly. That was the reason why in Luo et al.’s study, the original ROM was confirmed to experience discrepancies when the composites consisted of dispersed fibres. The main reason was attributed to the inability of the model to consider stress- and strain-increasing factors due to embedded reinforcements, interface failure, void presence, and so on. To address this issue, the authors developed a modified ROM (MROM) model to capture this nonlinear behaviour of the tensile strength to compensate for the lack of microgeometry analysis [23].
Manufacturing plastic parts using AM, in particular, the FDM process, is drawing a lot of attention recently but despite the benefits they have to offer, some challenges are still preventing the manufacturers from transitioning from conventional methods such as injection moulding and hot pressing to AM methods [24]. The most critical issue when dealing with parts printed by the FDM method is called material anisotropy. The word anisotropy refers to the low layer adhesion and delamination of the deposited layers when the part is under loading. Moreover, the air voids that form between the layers and continue throughout the sample can act as potential pathways for the cracks to propagate. The air gaps, as well as the low interlayer adhesion, can lead to fibre delamination and premature failure of the part when the load direction is perpendicular to the build orientation of the printed parts [9,25,26,27]. The proper selection of the polymer which can show less anisotropy at certain levels, as well as the process parameters can play an important role in mitigating or minimising this anisotropy.
In the preliminary study conducted by the authors [28], mechanical anisotropy phenomena in HIPS and ABS FDM-printed parts were preliminarily investigated. The longitudinal and transverse build orientations have much less influence on HIPS samples than in ABS samples. Lower layer adhesion was found in ABS samples compared to in HIPS samples. As a result, the tensile strength of FDM-printed HIPS is much closer to those to those mould-injected samples. However, other key FDM parameters including printing temperature, infill percentage, and layer thickness were not investigated to optimise the FDM processes. Limited research is available to understand the influences of FDM process parameters and material selection on the degree of material anisotropy in FDM-based printed specimens. The FDM process is one of the most popular methods of additive manufacturing methods, but its inherent structural anisotropy is one of the main drawbacks that may keep industries reluctant to replace this method with their conventional and old means of parts production such as injection moulding or hot pressing.
Although many studies have attempted to study the influence of process parameters, most of them have not incorporated the analysis of internal structures such as SEM or micro-CT to investigate the process parameters’ effects on the degree of anisotropy (DOA). This study has a distinct focus on assessing the structural anisotropy of printed parts. It delves into the impact of altering various printing parameters—such as layer thickness, infill density, nozzle temperature, and raster angle—while maintaining consistency in other factors. Employing this distinctive approach allows for a comprehensive exploration of the influence of each parameter on internal structures through SEM and micro-CT analyses, shedding light on intricate details. Standard tensile samples are printed using the FDM process and tested. The samples are characterised using microstructural analysis including SEM, XRD, TGA, DSC, micro-CT, etc. Although ROM is commonly used for composites that contain at least two materials with different properties, it was not used to extract material properties of 3D-printed polymeric structures except for the authors’ work [24]. From the SEM images, the internal structure of the testing sample is found to comprise two different regions classified by their difference in the alignment of deposited materials. With that gap in mind, the current study develops a systematic methodology to extract the material properties of the 3D-printed samples by first determining the properties of each region using RVE models and then using ROM to compute the final properties. This article is outlined with four main sections. Section 2 provides detailed information on material preparation, 3D printing, and experimental and numerical methods including finite-element (FE) models, ROM, and modified ROM. Section 3 delivers the obtained experimental and numerical results and discusses the effects of the FDM process parameters of interest on the DOA. Section 4 draws conclusions based on the research findings generated in the current research.

2. Materials and Methods

2.1. Material Selection and Filament Preparation

The polymer pellets of ABS were used to extrude filaments with an outer diameter of 1.75 ± 0.08 mm. Pellets of ABS polymer grade PA747 (C8H8·C4H6·C3H3N)n were purchased from ChiMei corporation (Tainan City, Taiwan).
In the first stage, ABS and pellets were extruded into filaments with a diameter of 1.75 mm. To obtain a consistent filament with diameters very close to 1.75 mm, parameters such as extrusion heat zone temperatures, filament winder speeds, cooling systems, and polymer purging speeds were adjusted to an optimum level as listed in Table 1. Before the extruding process began, the as-received polymer pellets of ABS polymers were left to dry overnight at 65 °C in a conventional oven to remove the moisture from the polymer pellets. A single screw extruder—Noztek Xcalibur, Noztek, West Sussex, UK—was used to extrude the polymeric filaments at a temperature ranging between 230 °C and 240 °C. In conjunction with the filament extruder, to obtain filaments with a consistent outer diameter, a filament winder—Noztek winder 2.0—was also employed. Table 1 also shows the extruding and winding parameters that were used throughout the fabrication process to guarantee the consistency of the obtained results.
Figure 2 below shows the employed filament extrusion setup.

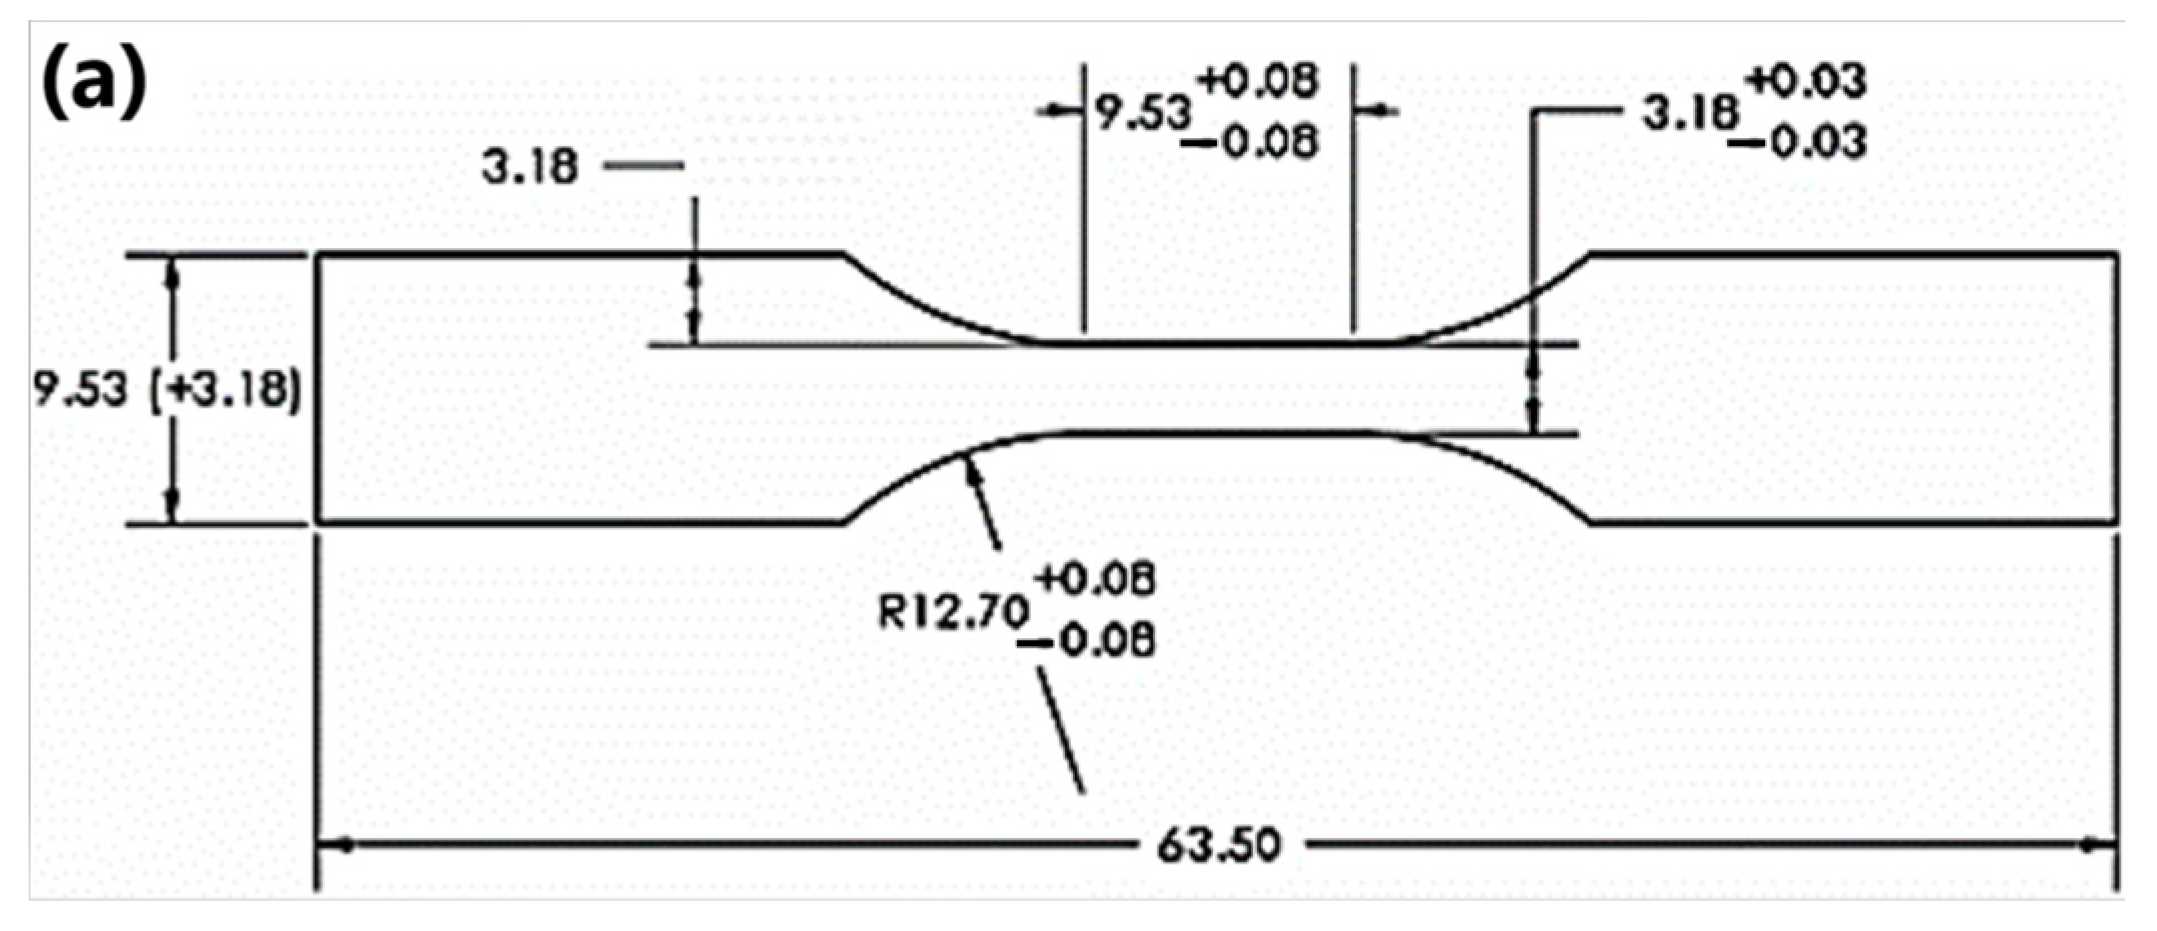
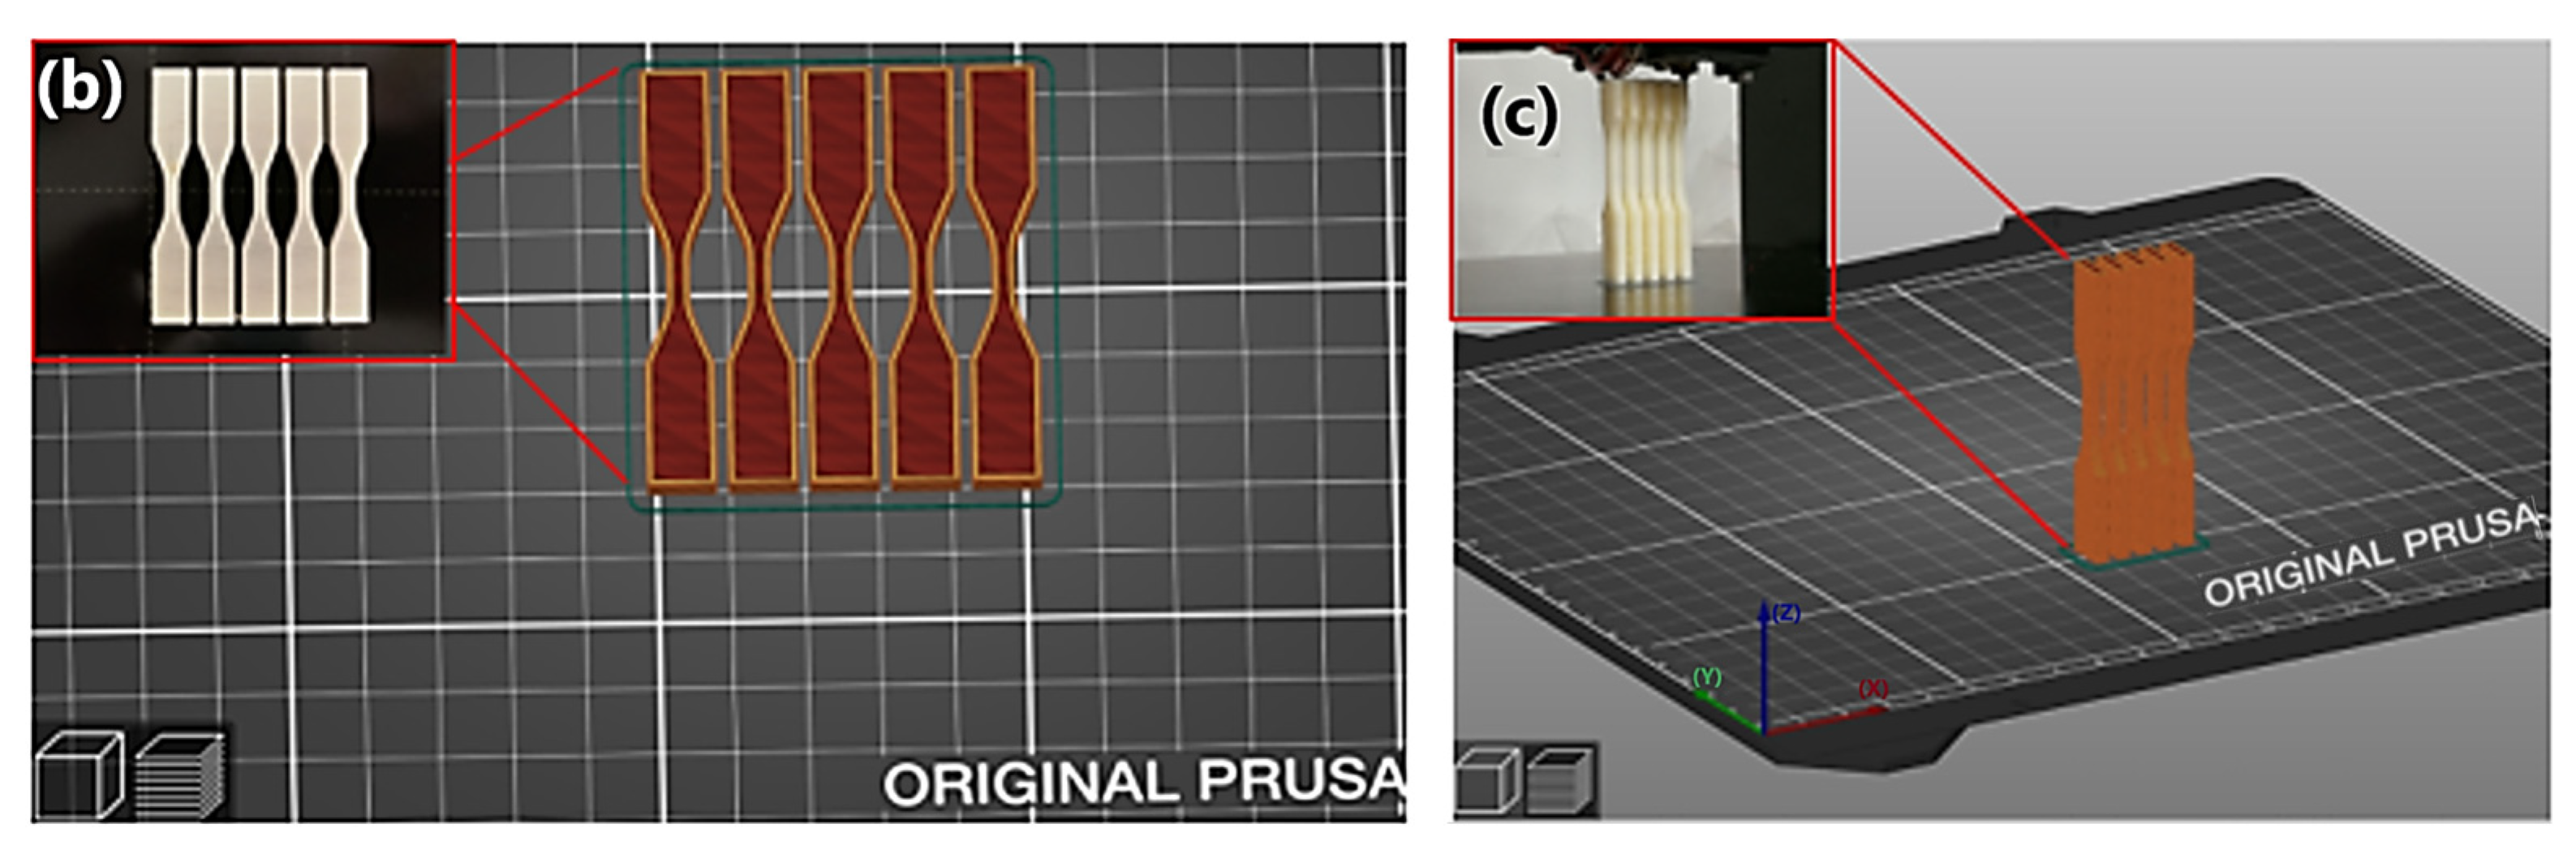
2.2. Coupon Design and Testing

The Type V coupon design for tensile testing and morphology analysis was adopted from the ASTM D638 standard and the coupon samples were then designed using SolidWorks 2021® software to generate the STL or 3MF files. Batches of 5 samples were stacked and sliced using Prusa Slicer 2.6.1 software and then printed using a Prusa MK3S printer (Prague, Czech Republic) as shown in Figure 3. All samples were printed in the two different build orientations of transverse and longitudinal, respectively, to investigate the effects of anisotropy on the mechanical properties of the FDM-printed materials. The dimensions of the 3D-printed samples were measured and recorded as 1% varied to the required standard length of tensile coupons. It should be noted that the printing of polymer samples was carried out with a 0.4 mm diameter of the nozzle head. Detailed settings of the important machine parameters used for printing those samples can be found in Table 2.
Figure 3 shows the geometric details, the build position, and the build orientation of the samples on the build plate of the 3D printer.
To investigate the influences of the processing parameters and material selection on the degree of anisotropy on 3D-printed parts in the transverse and longitudinal build orientations, the effects of four process parameters of layer height, raster angle, printing temperature, and infill percentage are investigated for pure polymers. While one process parameter is varied, others are kept at the default settings of the printer with 240 °C nozzle temperature, 0.2 mm layer thickness, 0/90 raster angle, and 100% infill percentage. For example, if the layer thickness is varied at 0.15 mm, 0.25 mm, and 0.35 mm, the other settings are kept constant with 240 °C nozzle temperature, 0/90 raster angle, and 100% infill percentage. To minimise the error and understand the repeatability of the experiments, 5 replications for each parameter were prepared which resulted in a total number of 260 samples printed and tested for mechanical properties. Figure 4 provides a better understanding of the conditions of printing for each polymer type.

2.3. Characterisation Methods

To investigate the tensile strength of the printed samples, a standard material testing machine—Instron 3365 with a 5-kN load cell—was employed. The mechanical degree of anisotropy defined by two indicators in percentage was calculated using the following equation based on the ultimate tensile strength values collected for different build orientations:
% U T S X = | U T S L U T S T U T S X |
where X is L or T, which denotes the longitudinal and transverse build orientations, respectively. Thermogravimetric analysis (TGA) and differential scanning calorimetry (DSC) measurements were performed by an STA 449 F3 Jupiter TGA-DSC analyser (NETZSCH, Gebrüder, Germany) using closed aluminium pans. The weights of samples were aimed to be kept almost constant at around 8 mg ± 0.5 mg (balance accuracy 0.0001). Specimens were heated from 30 °C to 590 °C at a rate of 10K under a constant flow of Nitrogen gas (25 mL/min, purity > 99%). The test was conducted according to the standard process regulated in ASTM D638. As for morphological analysis, scanning electron microscopy (SEM) was carried out using a Hitachi FlexSEM 1000 II, Tokyo, Japan. The ultra-variable-pressure detector (UVD) feature was used to record images at low-accelerating voltages and low-vacuum conditions.

2.4. Numerical Modelling and Simulations

To capture the anisotropic behaviours of the 3D-printed ABS materials, a mesoscale analysis process was developed, and SEM images of these materials were used to create representative volume elements (RVEs) and finite-element models in the authors’ previous work focusing on numerical modelling [24]. With the current capture of SEM images and softwares’ limitation to construct models at various infill percentages, only one machine parameter of infill percentage was modelled and reported for ABS polymeric parts in this work.
In the proposed mesoscale analysis process, the printing parameters such as a nozzle diameter of 0.4 mm and layer thickness of 0.2 mm along with those manipulated aligned and sparse models were considered to replicate the perimeter and infill regions of the 3D-printed samples, respectively. Based on these parameters, the tensile strength of the 3D-printed ABS material, X T o t a l , could be computed using the rule of mixtures (ROM) as shown in Equation (2).
X P V P + 1 V p X I = X T o t a l   V o i g t   M o d e l
where X P ,   X I are the tensile strengths in the perimeter and infill regions, respectively. The volume fraction V P ( 0 V p 1 ) of the perimeter region was defined based on the images obtained from a standard SEM analysis [22,24].
Considering the above-mentioned settings, the original material data were pre-calibrated using those from the 100% infill-density ABS FDM-printed samples and then the same material file was used for other infill percentages as benchmarking. In Hexagon Digimat-FE, the sparse model was devised to construct infill regions at various infill densities while the aligned model was used for building the perimeter regions. Before conducting FEA, a mesh convergence test was performed, and the maximum element size was found at 0.025 mm. The mesh type of all models was set to conforming (tetra) with quadratic elements. After that, the material properties of the samples printed with longitudinal and transverse build orientations were extracted by changing the direction of the loads onto the RVE models.
Although the ROM can be used for predicting the behaviours of the 3D-printed materials, the accuracy can be hugely impacted by varying the FDM printing settings. Therefore, to increase the accuracy of the model, a modification to the formula is required, introducing two extra terms f(x) and g(x) as shown in Equations (3)–(5) accounting for the FDM settings as the functions of the infill density, x, both in a polynomial of degree four as P x defined by Equation (5). The five constant coefficients in both functions ( a 0 , a 1 , a 2 , a 3 , a 4 ) were obtained from the collected data processed using MATLAB R2022b. The outcome of this part of the work is expected to assist and increase the accuracy of the future modellings of the 3D-printed samples with different infill percentages made from pure thermoplastic polymers.
X P V P + f x 1 V p X I = X T o t a l   M R O M   f o r   t h e   l o n g i t u d i n a l
X P V P + g x 1 V p X I = X T o t a l   M R O M   f o r   t h e   t r a n s v e r s e
P x = a 4 x 4 + a 3 x 3 + a 2 x 2 + a 1 x + a 0

3. Results and Discussion

3.1. Experimental

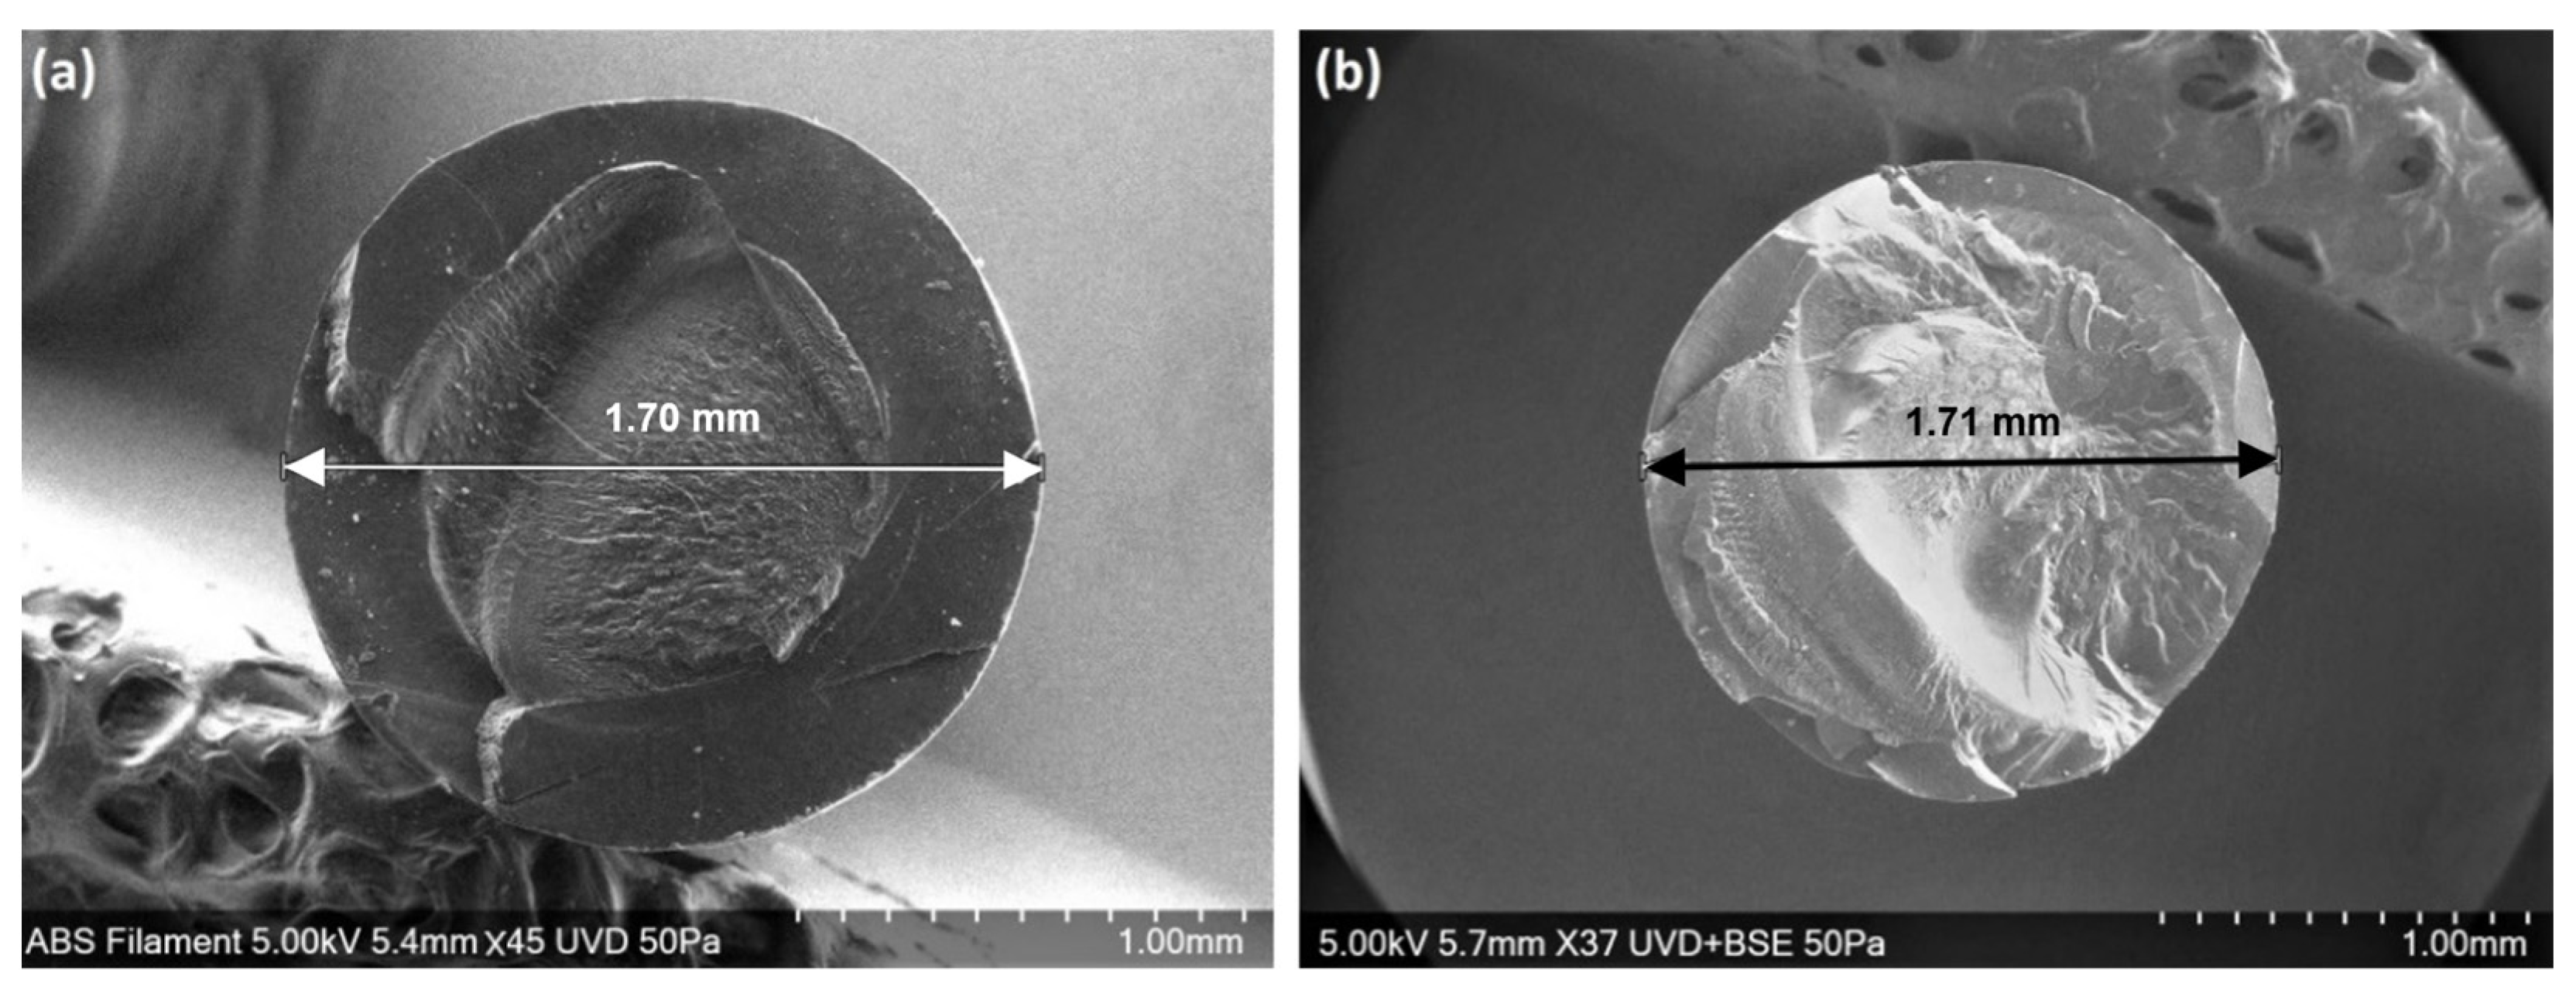
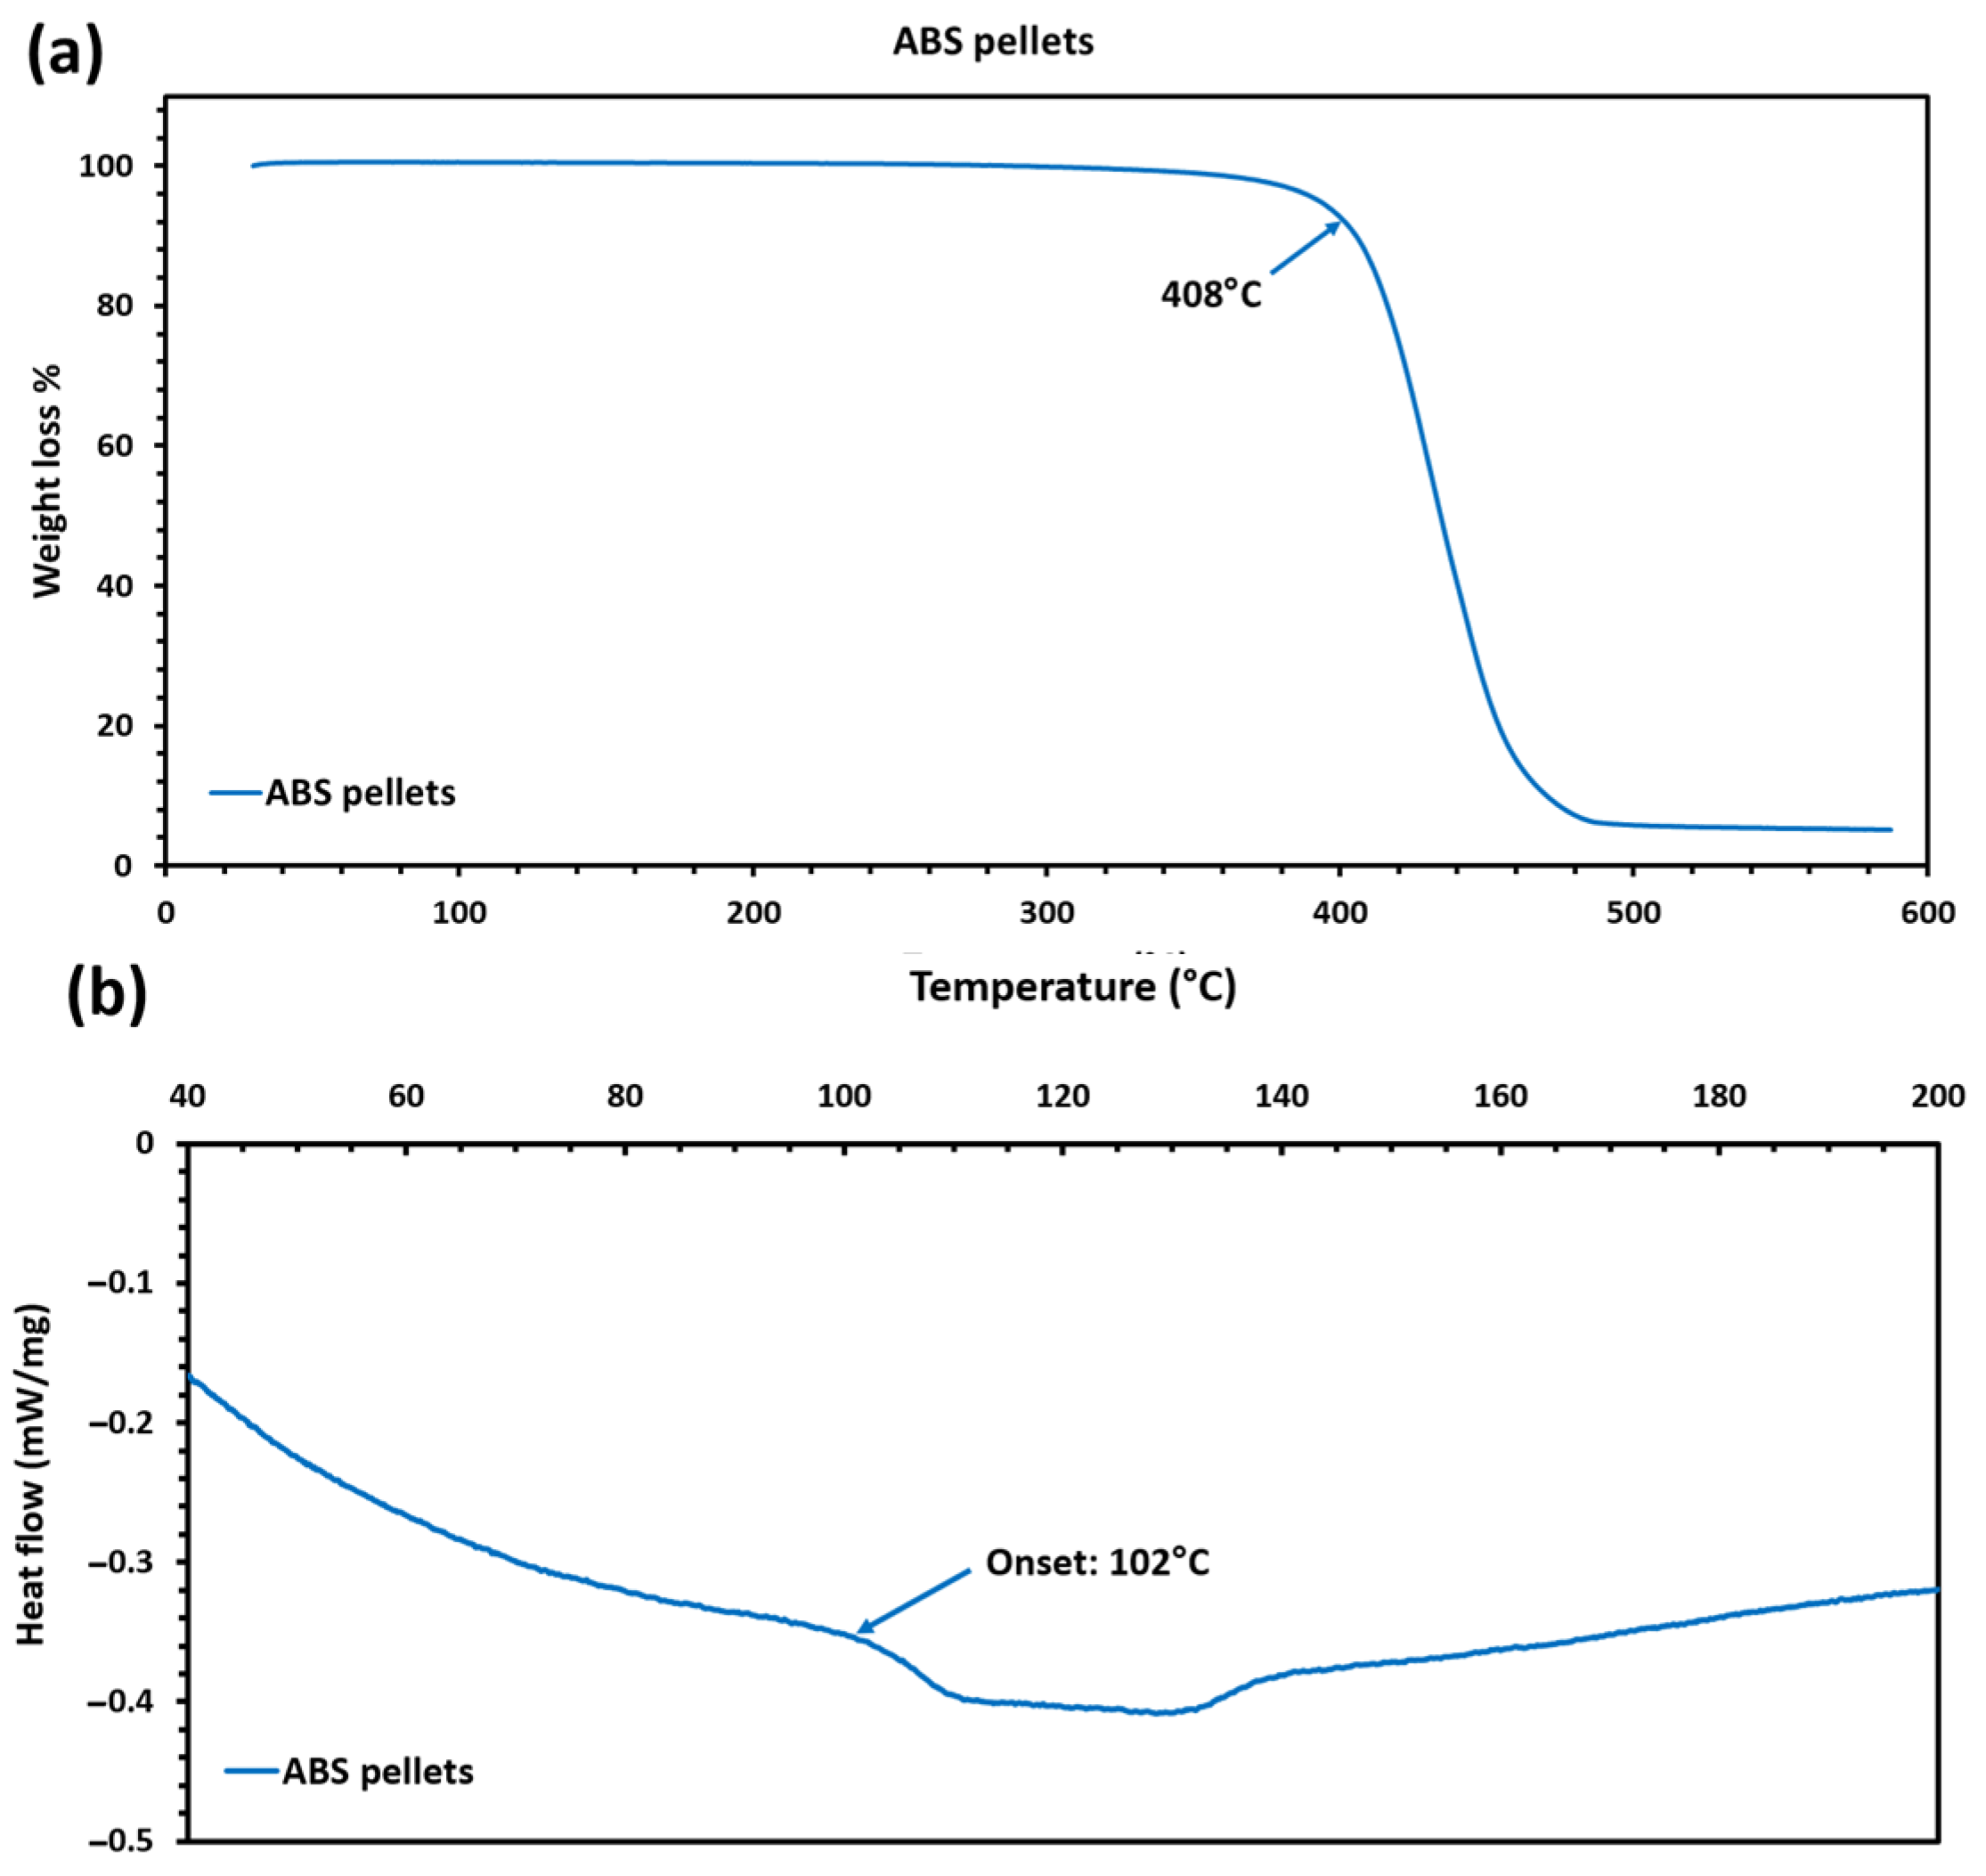
3.1.1. Characterisation of the Extruded ABS Filaments

As the first step, ABS pellets were extruded into printable filaments at 1.75 ± 0.07 mm in diameter. To obtain a consistent filament with diameters very close to 1.75 mm, parameters such as the extrusion heat zone temperatures, winder speeds, cooling systems, and polymer purging speeds were adjusted to an optimum level as stated in Table 1. Figure 5a,b show a comparison between the measured diameter of the as-received ABS filament with the extruded filament.
From the TGA results (Figure 6a), the ABS degradation onset temperature was recorded to be around 387 °C. Given that the temperature range required for 3D printing is well below this value (between 220 °C and 280 °C), therefore, no significant changes/degradations in the produced polymers would occur during the FDM printing process. From the DSC results (Figure 6b), the glass-transition temperature Tg related to the polymer samples without additives is in the range of 100 °C–102 °C which indicates that the pre-selected 240 °C printing temperature is well above the glass-transition temperature and can guarantee a good flow of polymer while extruding and printing.
To investigate the material properties of the FDM-printed samples when the FDM key process parameters including the layer thickness, raster angle, infill percentage, and nozzle temperature are varied, mechanical tests were conducted in this study and the experimental results are presented in the following four Section 3.1.2, Section 3.1.3, Section 3.1.4 and Section 3.1.5.

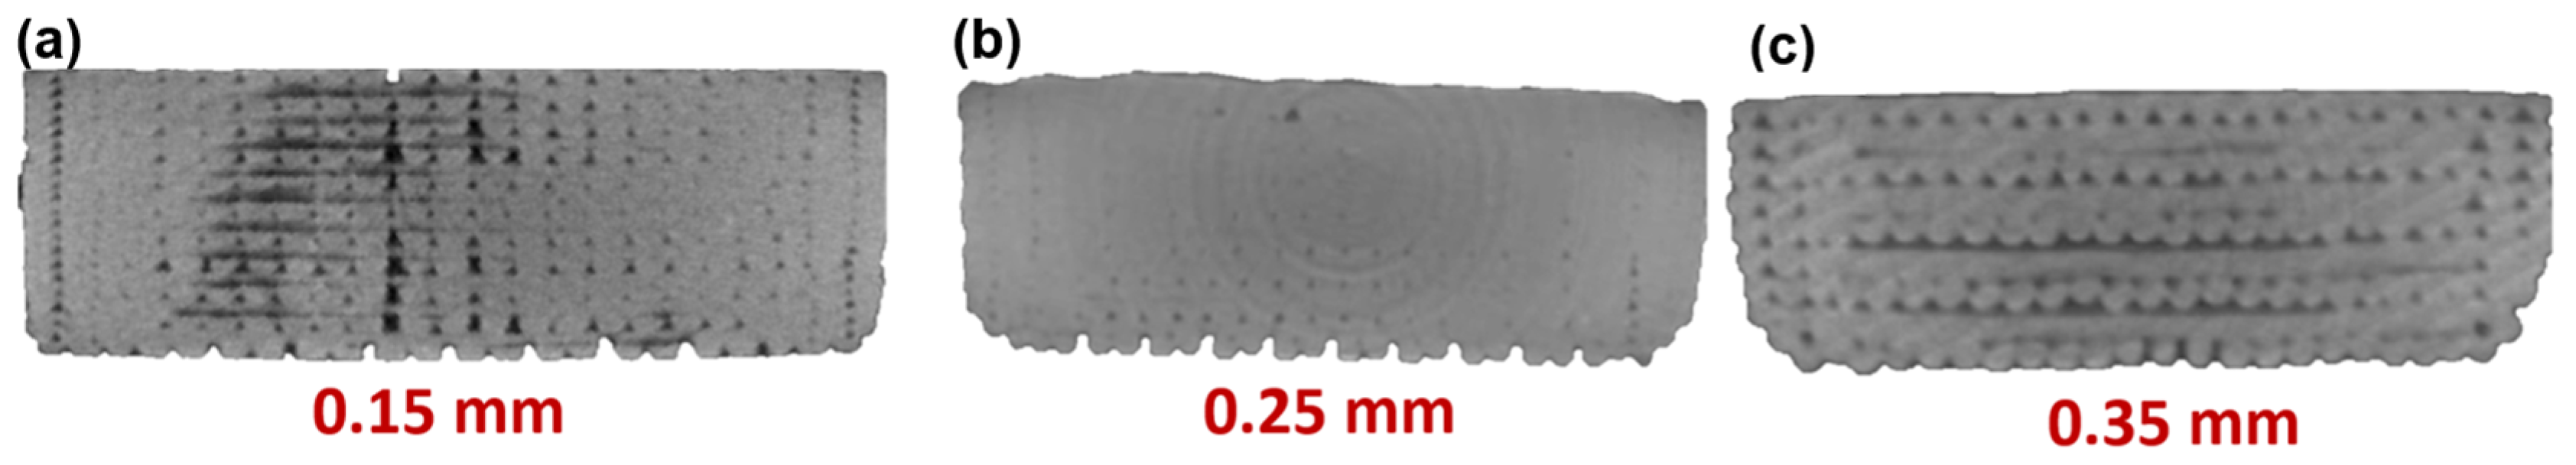
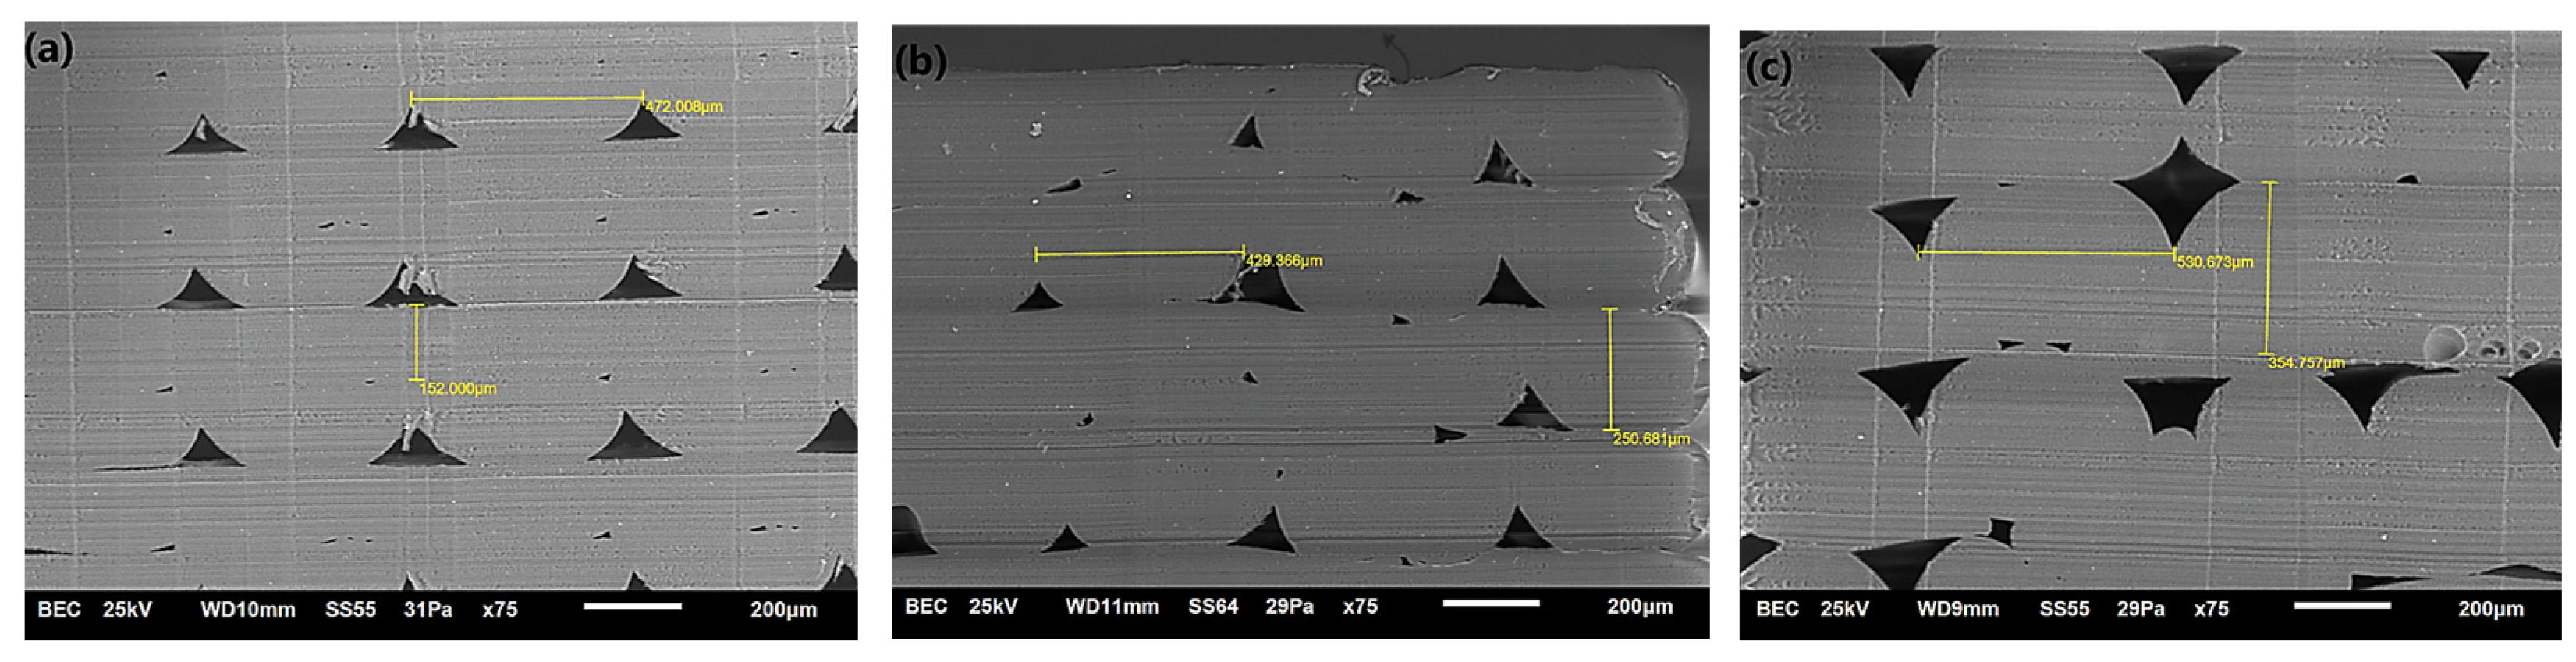
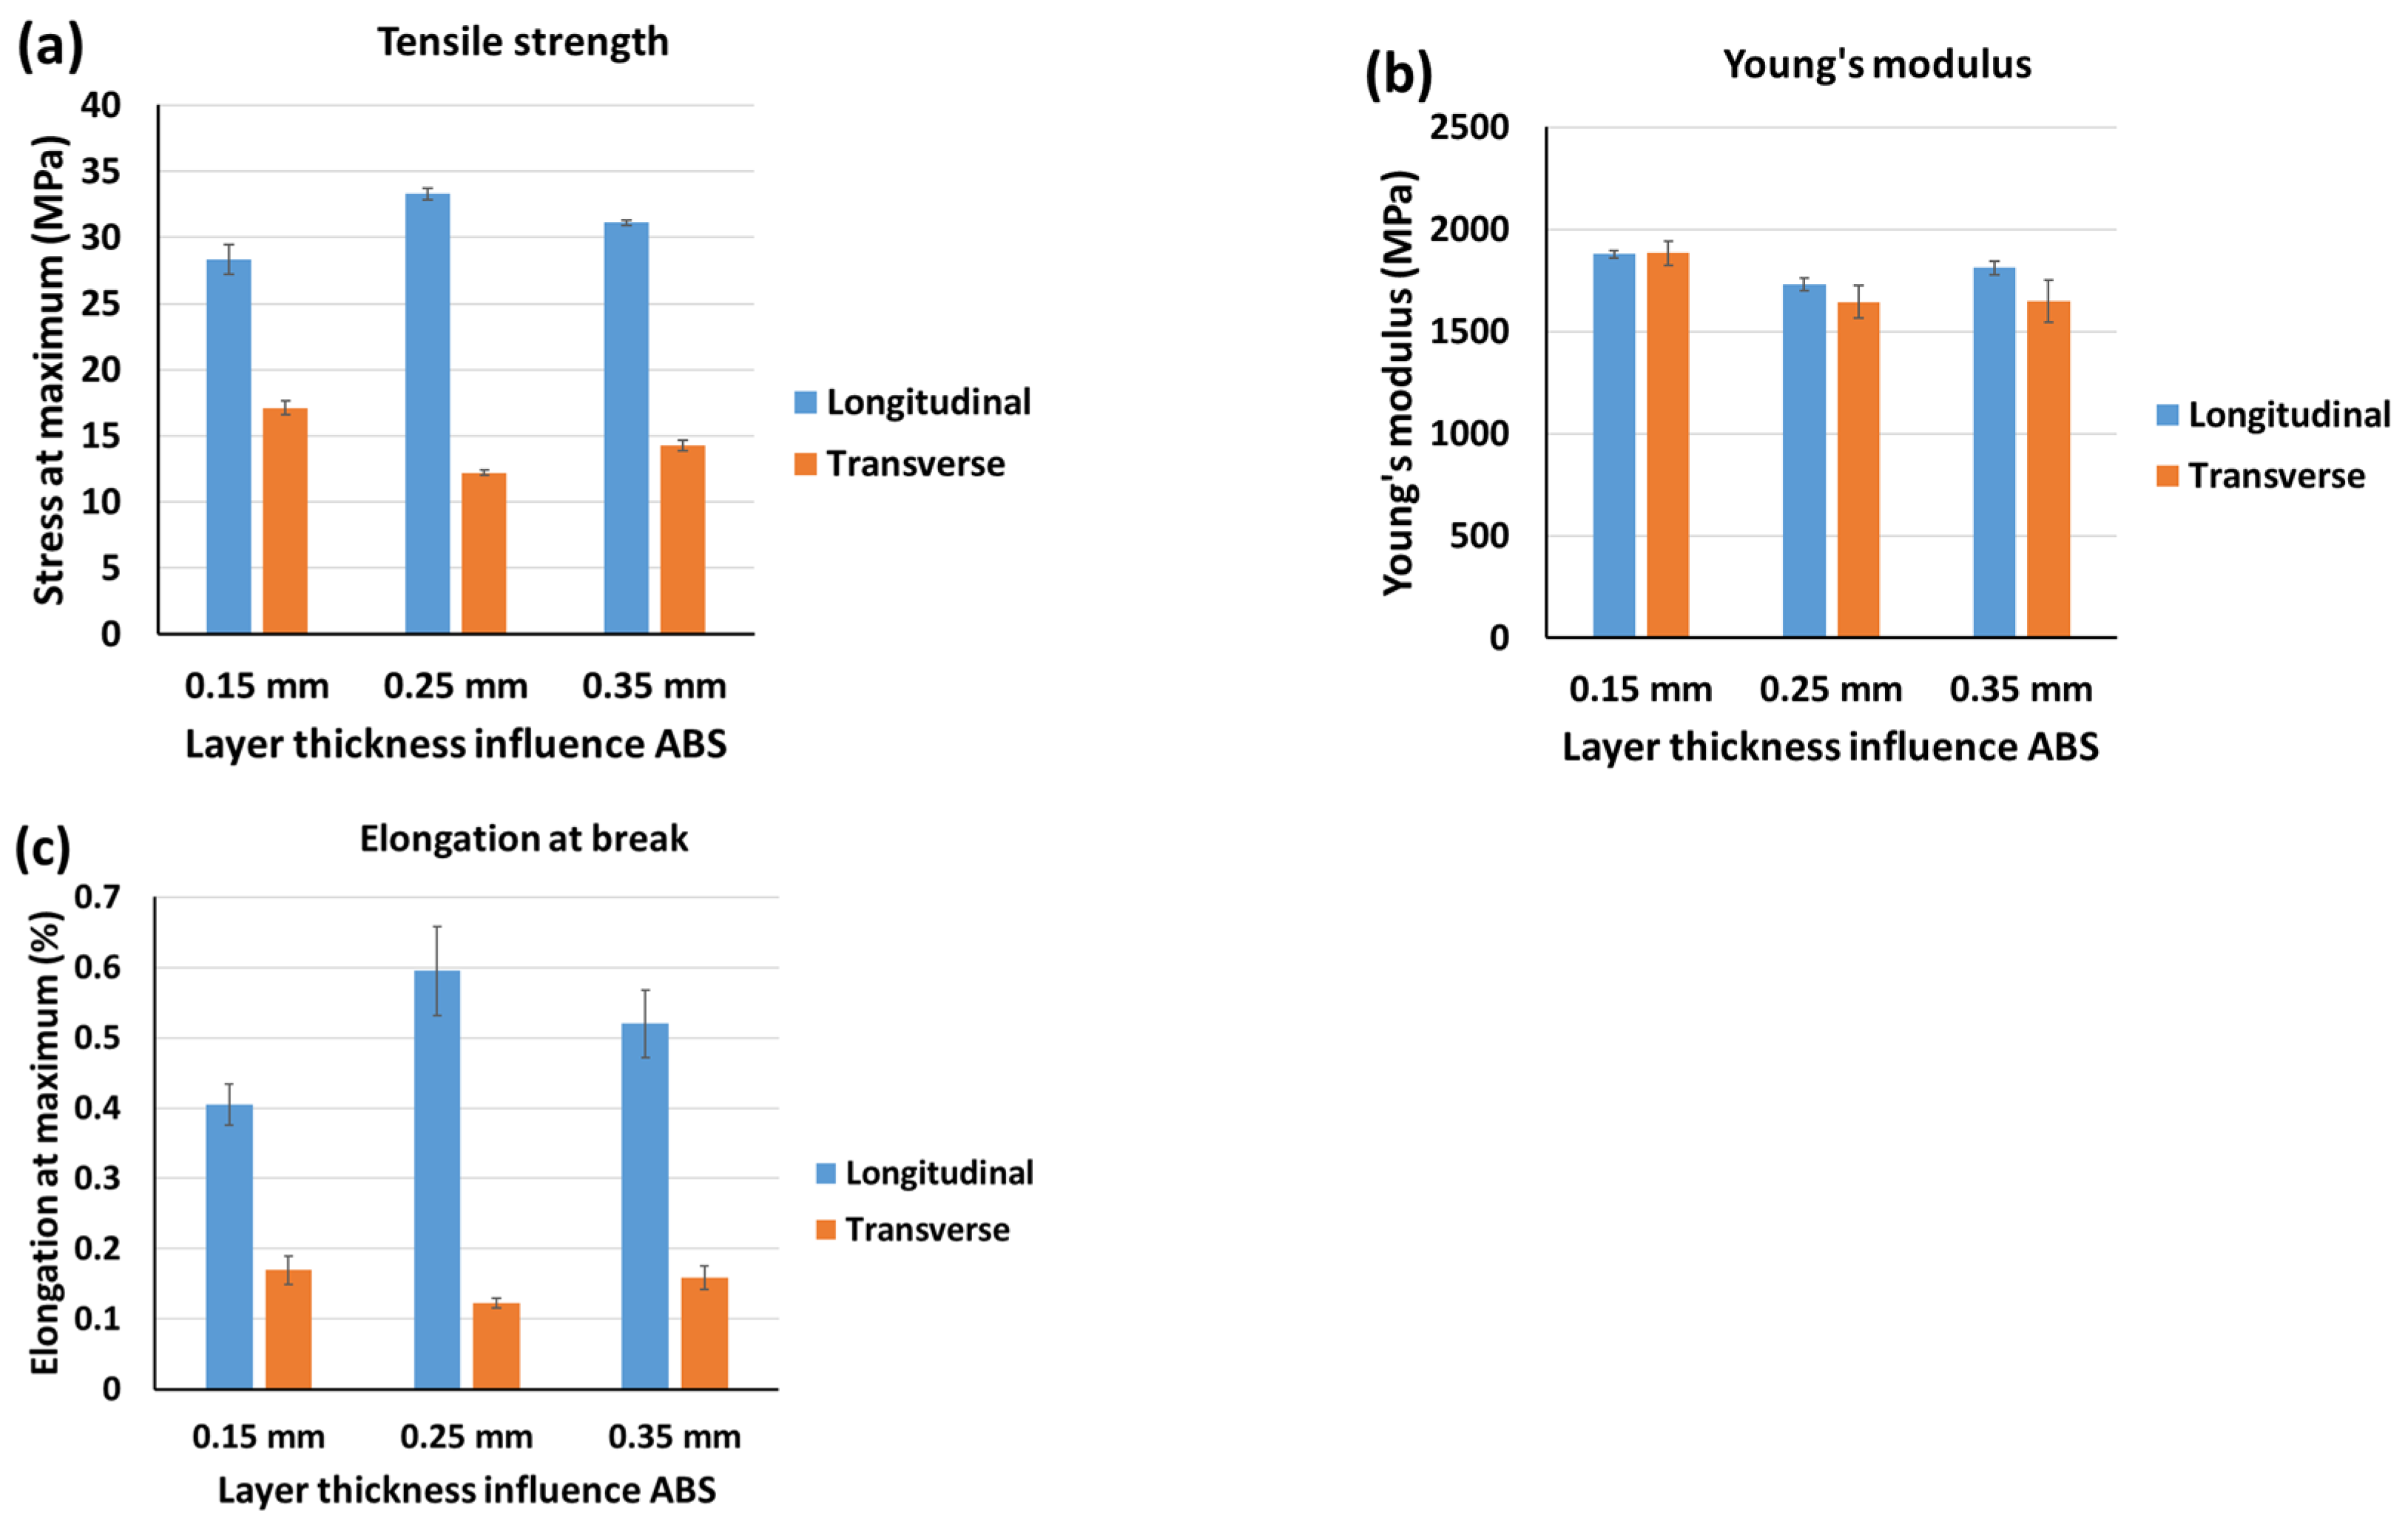
3.1.2. The Effect of Layer Thickness on Anisotropy

Three different layer thicknesses of 0.15 mm, 0.25 mm, and 0.35 mm were selected to investigate the influence of layer thickness on the mechanical properties of ABS parts printed in two longitudinal and transverse build orientations. Figure 7 shows the micro-CT images of the samples before any mechanical force is applied. The lower thickness can cause more air voids and this can potentially increase the chances of crack initiation and propagation in parts. However, the smaller diameter of the extruded filaments can also increase the layer adhesion between the deposited filaments because of the increased surface area. On the other hand, the higher layer thicknesses in Figure 7c show lower layer adhesion and therefore there might be a chance of the sample breaking sooner than the other two-layer thicknesses due to the delamination of the layers.
Figure 8 visualises the SEM images for the samples of ABS printed in the longitudinal build orientation with different layer thicknesses. No mechanical force was applied to these samples and the samples were cut using a microtome. From those images, larger air voids for the higher thickness can be observed.
The mechanical properties of the printed samples (both longitudinal and transverse) were obtained using the Instron machine and the cross-sections of the samples were visualised by SEM. Figure 9 represents the obtained ultimate tensile strengths, elongation at breaks, and Young’s modulus values for ABS samples printed in two build orientations at three layer thicknesses of 0.15 mm, 0.25 mm, and 0.35 mm, respectively. The results show that at a layer thickness of 0.25 mm, the difference between the measured tensile strength and elongation at break for the two build orientations is the maximum. According to the SEM images shown in Figure 8, the 0.25 mm layer thickness created much denser structures than the other two cases, and that is why this layer thickness provided the strongest material. The 0.25 mm thickness results show higher tensile strength properties for longitudinal build orientation, while lower values are recorded for the transverse build orientation. Young’s modulus, on the other hand, showed a drop due to the higher elastic behaviour that this layer thickness can show compared to other layer thickness values. In another study, layer thickness was deemed as the most significant factor and the maximum tensile strength was also found at 0.25 mm [29].
Figure 10 shows the SEM images of samples at the cross-section of the break because of mechanical force. For longitudinal samples printed with a 0.15 mm layer thickness, a smaller and higher number of air voids are observed compared to the 0.25 mm and 0.35 mm layer thickness. This in addition to a smaller interface between the layers results in a lower tensile strength, lower elongation at break, and forming a scattered brittle fracture surfaces (highlighted in yellow when force is applied (Figure 10a)). For longitudinal 0.25 mm and 0.35 mm layer thicknesses (Figure 10b,c), larger diameter filaments result in fewer voids and stronger adhesion between the layers due to a larger interface. From Figure 10b,c, concentric cone-shaped fracture surfaces can be observed which justifies the results of higher tensile and elongation values compared to those from the 0.15 mm layer thickness. The slightly better values for 0.25 mm compared to 0.35 mm could be related to the smaller sizes of filaments and consequently, a higher surface area to adhere with the other adjacent rasters.
For the transverse build orientation (TBO), the mechanical properties behaviour is completely different when changing layer thickness compared to the longitudinal build orientation. In this build orientation, the lowest layer thickness shows the best performance followed by the highest layer thickness value, and then 0.25 mm. In the 0.15 mm layer thickness (Figure 10d), the uneven fractured surface shows a better layer adhesion with fewer air voids compared to 0.25 mm (Figure 10e). In the 0.35 mm layer thickness (Figure 10f), there are no evident air voids, and the layers are well-defused, but the layers are thicker than 0.15 mm and the number of rasters in each layer, as well as their effective surface area, is less and consequently, the tensile stress and strain are slightly lower than 0.15 mm.
The effects of layer thickness on the mechanical properties of the printed ABS samples were investigated and the results of the ultimate tensile strength (UTS) strain at break (Δ), elastic modulus (E), and their associated root square error percentages (SQRT error mean) of the ABS polymer in the two build orientations—longitudinal (LBO) and transverse (TBO)—are mentioned in Table 3.
The mechanical degree of anisotropy for the longitudinal (Δ (UTSL)) and transverse (Δ (UTST)) build orientations at different layer thicknesses for the ABS polymer are shown in Figure 11. Both graphs exhibit comparable trends in terms of anisotropy behaviour. The lowest degree of anisotropy at the 0.15 mm layer thickness for the longitudinal and transverse build orientation was found with values of 65.5% and 39.6%, respectively. At this layer thickness, the longitudinal and transverse build orientations show the lowest difference in tensile strength value which shows an ideal condition for 3D printing a part when isotropic mechanical properties are the priorities. Although the printing time can noticeably increase at this layer thickness, the characteristics of the final printed product can show less profound anisotropy features. At the same time, the elasticity of the part can be compromised because of the build orientation influence which shows less ductile behaviour when printing in the transverse build orientation.

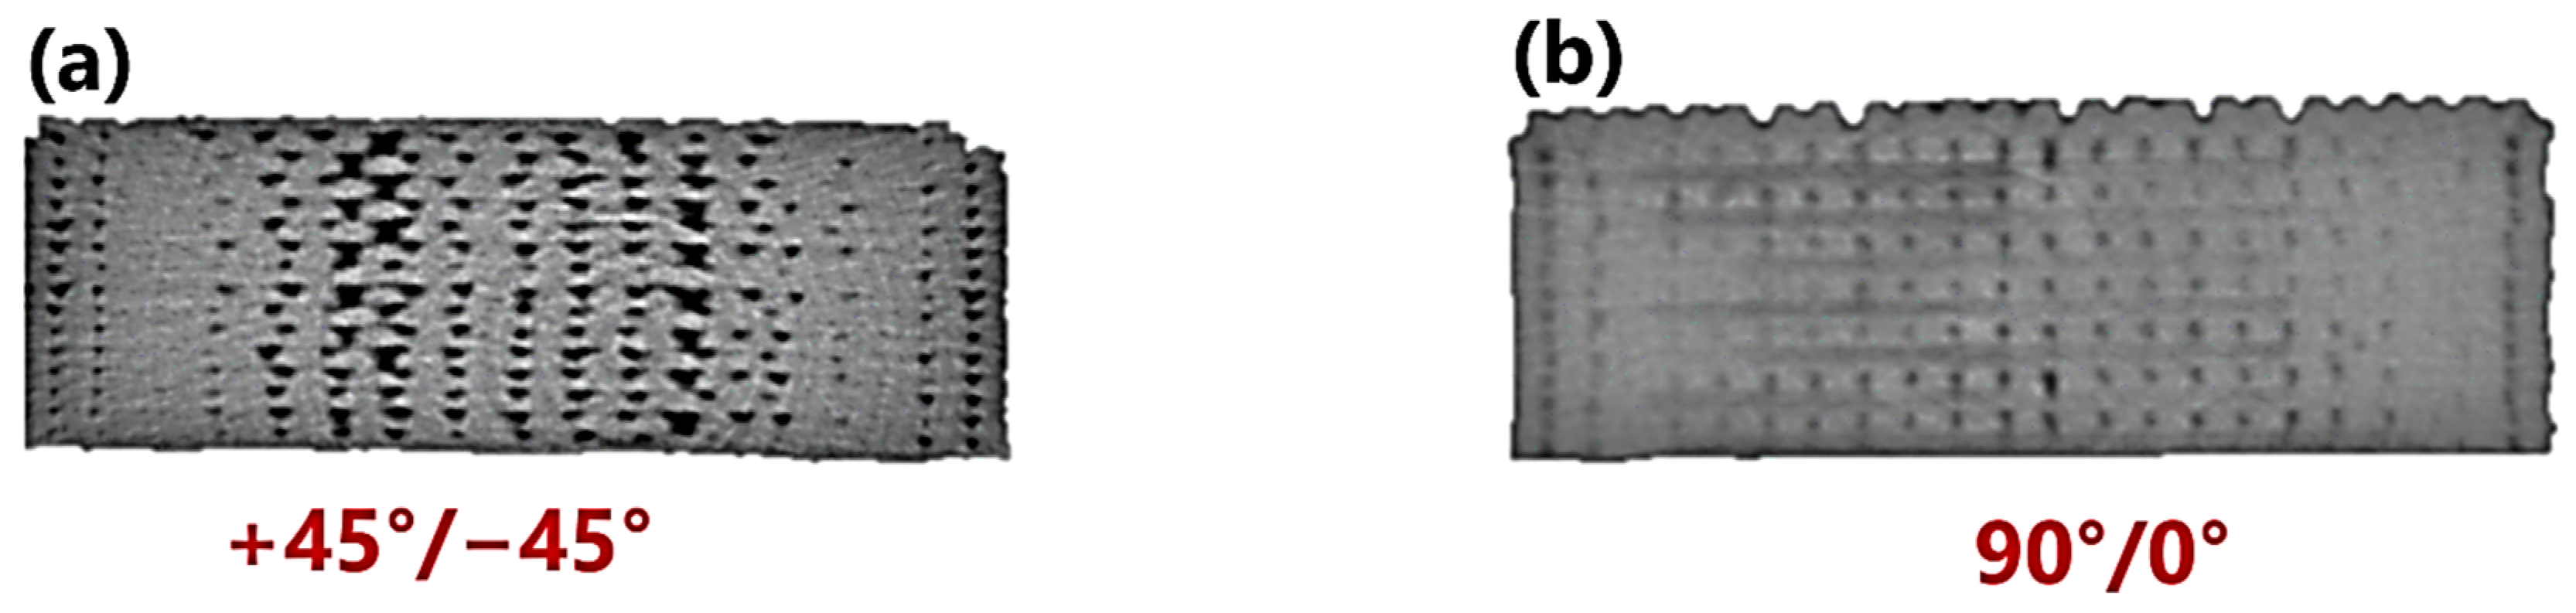
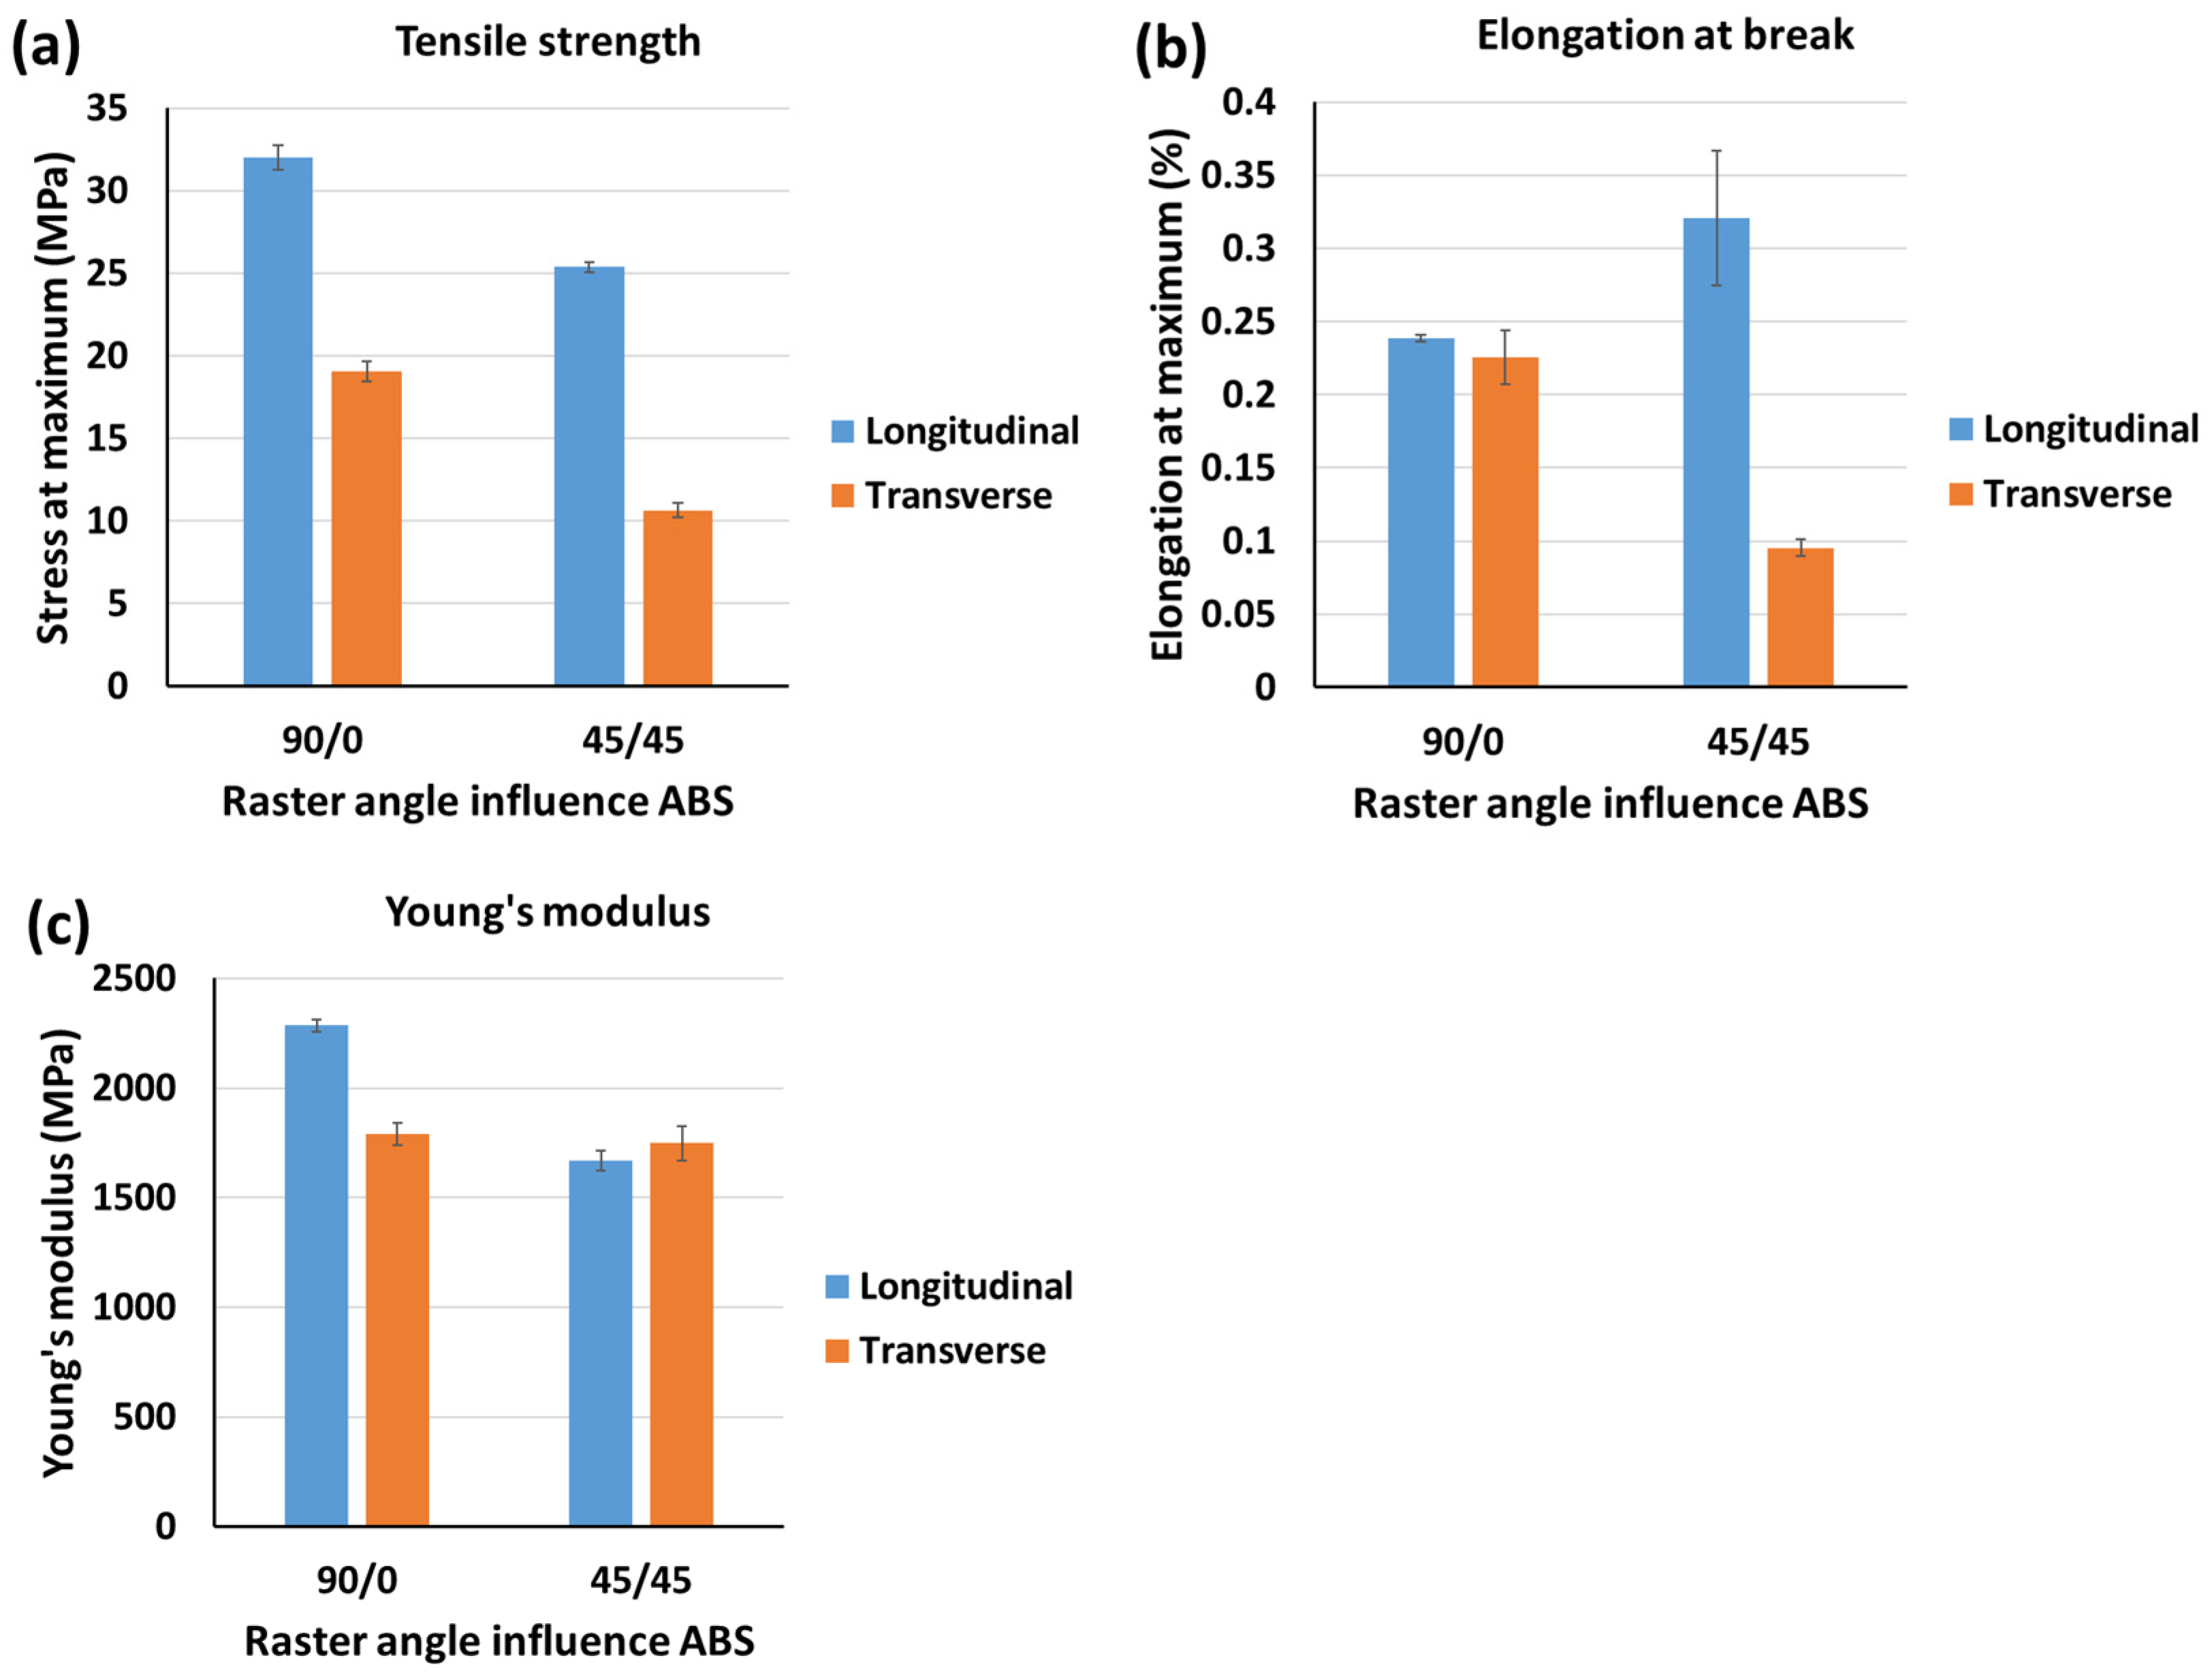
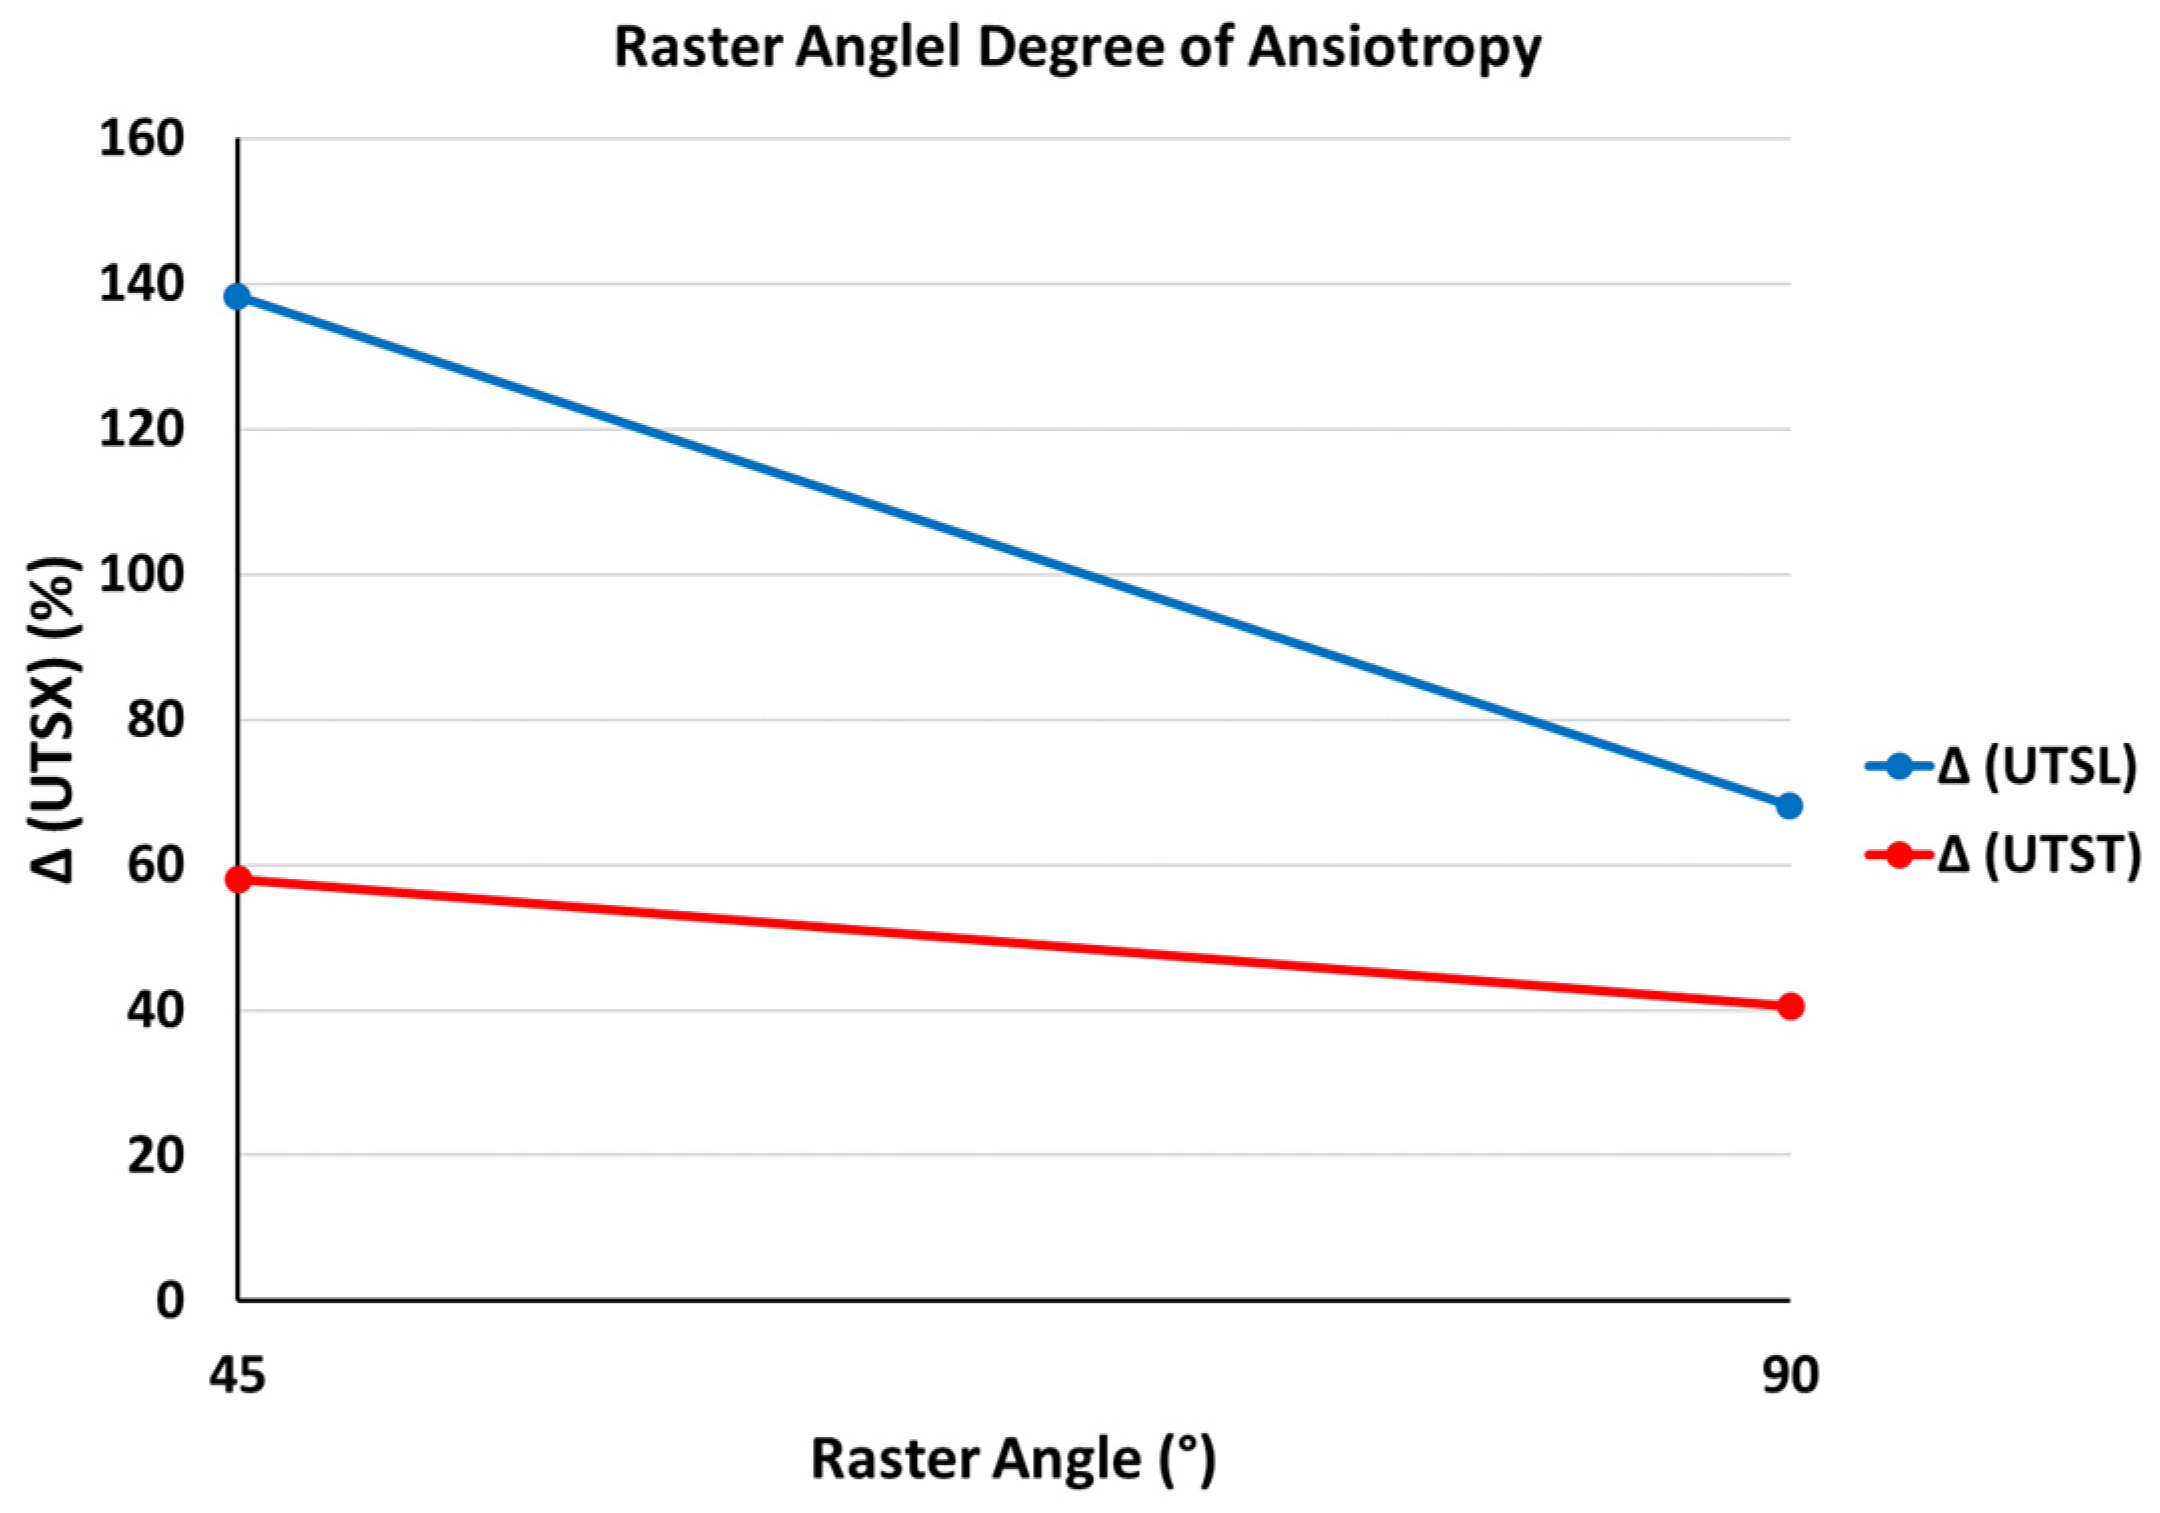
3.1.3. The Effects of Raster Angle on Anisotropy

Two raster angles of 0°/90° and −45°/+45° were selected as the main angles to print samples in two different longitudinal and transverse build orientations. For the 0°/90° setup, the second layer of the deposited filament lays on top of the first layer with the 90° opposite orientation. For the ±45° orientation, the first layer and second layer have an angle of 45° with each other.
Like the layer thickness, the raster angle was identified as an influential machine parameter in the assurance of the anisotropy phenomenon. Figure 12 shows the micro-CT images of samples printed with (a) a +45°/−45° raster angle and (b) a 0°/90° raster angle. The micro-CT images can be a very useful and reliable asset to determine the internal structure of the printed samples without physically damaging or deforming the part. In these images, the sample printed with a +45°/−45° raster angle is showing a structure with potentially more evident air voids compared with the sample printed with a 0°/90° raster angle. This could potentially influence the mechanical integrity of the sample when the part is under load.
Changing the raster angle showed a noticeable influence on the mechanical properties of the printed parts. Figure 13 represents the obtained ultimate tensile strengths, elongation at breaks, and Young’s modulus values for ABS-made samples in the two build orientations—transverse and longitudinal—at two different raster angles of 45°/−45° and 90°/0°.
For the ABS polymer, the ultimate tensile strength for samples printed in the longitudinal build orientation increased by around 7 MPa when the raster angle was switched from +45°/−45° to 90°/0°. The literature also confirmed parts printed at 45°/−45° had lower tensile properties than their counterparts printed at 90°/0° [30,31]. The same trend was also observed for samples printed in the transverse build orientation but with a larger gap of 9 MPa. The elongation at break for samples printed in the longitudinal build orientation was increased by 28% for a +45°/−45° raster angle, whereas the elongation at break for samples printed in the transverse build orientation dropped by 60% for the same raster angle compared to the 90°/0° raster angle. Although Young’s modulus did not change much for the transverse build orientation, samples printed in the longitudinal build orientation dropped by 27% when the raster angle was changed from 90°/0° to +45°/−45°. This means that for samples printed in the longitudinal build orientation, the +45°/−45° raster angle, provides a less stiff structure because of their position to the applied force, whereas the 90°/0° provides a more rigid structure when the load is perpendicular to the rasters. This could be related to the angle that the polymer filaments have to the applied force. When the orientation of the filaments is perpendicular to the direction of the force, the resistance to break comes mostly from the polymer chains and as soon as the rasters find an angle to the applied force, the layer adhesion parameters come into the equation and like the transverse build orientation, the mechanical properties of the printed samples can be affected enormously.
Based on the discussions mentioned above and from the SEM images in Figure 14, it could be seen that the +45°/−45° raster angle shows a weak layer adhesion when printed in the longitudinal and transverse build orientations. The longitudinal build orientation also shows delamination from the perimeter layers.
As the delamination happened in the interface between the perimeter and the inner core of the sample, it confirms that the poor later adhesion when the angle of the load to the polymer changes can be the main reason for the crack initiation, crack propagation, and finally failure of the part. In the transverse build orientation, the smooth fractured surface with evident air voids for +45°/−45° in comparison with the 90°/0° raster angle corresponds to the low layer adhesion of the layers. These air voids which are the potential failure spots in the structure are marked with red arrows and circles in Figure 14c. The uneven fracture surface of the 90°/0° with no obvious interlayer air voids suggests that the part was resisting the layer delamination, as the mechanical testing results suggest. Figure 14 is marked with yellow circles and arrows to show the unevenly broken surfaces of the printed part. The effects of the raster angle on the mechanical properties of the printed ABS samples were investigated and the results are presented in Table 4.
Figure 15 shows the mechanical anisotropy behaviour for the longitudinal (Δ (UTSL)) and transverse (Δ (UTST)) build orientations printed at different raster angles. Similar downward trends for both graphs can be observed. The lowest mechanical anisotropy for the longitudinal and transverse build orientations was recorded when samples were printed at a 90°/0° raster angle, showing a value of 68% and 40%, respectively. This indicates a drop of 70% for samples printed longitudinally and 18% for samples printed transversely when switching from +45°/−45° to 90°/0°.

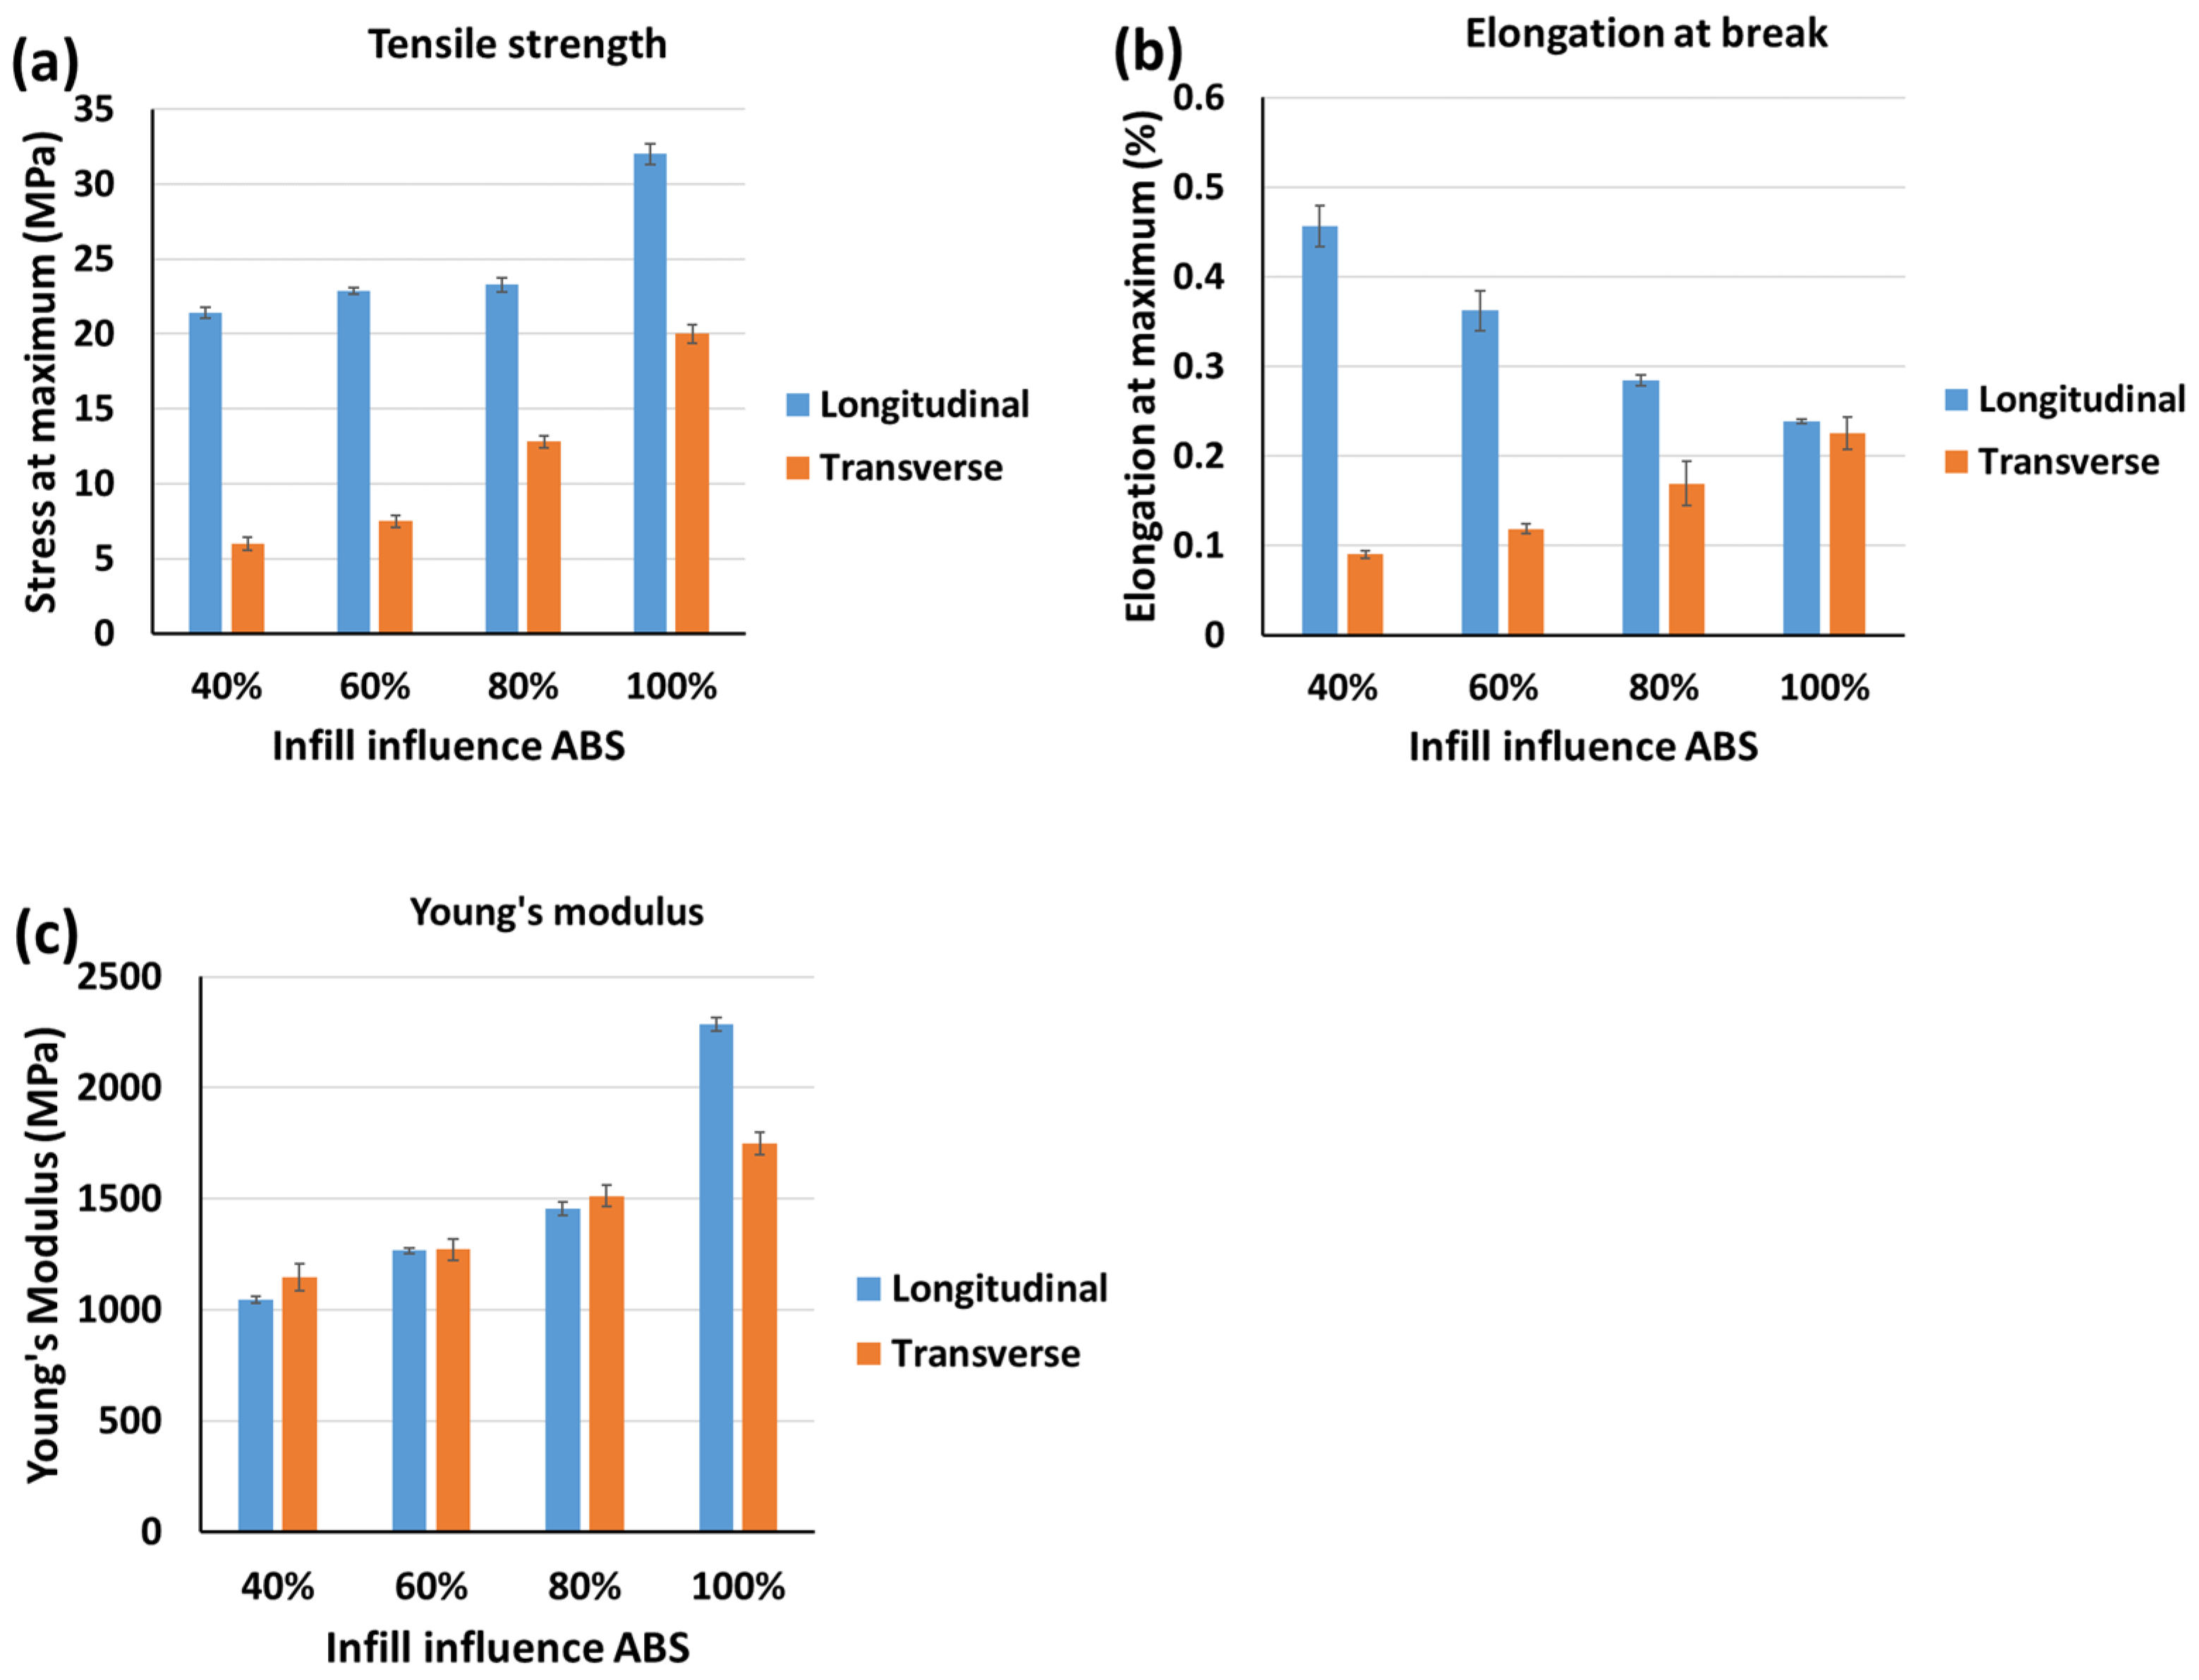
3.1.4. The Effects of Infill Percentage on Anisotropy

For this study, infill percentages of 40%, 60%, 80%, and 100% were considered for ABS polymers and both build orientations: longitudinal and transverse.
Another influential machine parameter on mechanical anisotropy is infill percentage. Although a lower infill percentage can lead to a faster print and therefore a more profitable production method, the lower infill can tremendously influence the mechanical integrity of the printed part. Figure 16 shows the micro-CT images from uninterrupted samples at different infill percentages. The number and the volume of the air voids reduce enormously when the infill percentage is increased from 40% to 100%.
The tensile strength results for samples printed with ABS polymer in the longitudinal build orientation showed a gradual increase of 1 Mpa when the infill percentage was increased from 40% to 80%. The strength showed a jump of 38% when the infill increased from 80% to 100%. Like the UTS values, Young’s modulus values also increased by 17%, 28%, and 54% when the infills increased from 40% to 100%, respectively. On the other hand, the elongation at break showed a steady decline by increasing the infill percentage. The increased tensile strength and Young’s modulus could be related to the better failure resistance and enhanced material bonding of the part due to a denser internal structure when the infill percentage increases, and the decrease in the elongation at break could be related to a decrease in the number of air voids, as well as the stiffer structure with less flexibility. A similar upward trend for the tensile strength and peak point at 100% infill when the infill percentage changed from 20% to 100% was recorded by Tura et al. [32]. The same trend was also recorded when the transverse build orientation was selected. A steady increase was recorded when the infill percentage was increased from 40% to 100%. The same trend was recorded for the elongation at break. Interestingly, the values of the elongation at break for 100% infill for both the longitudinal and transverse build orientations were very close. Figure 17 represents the obtained ultimate tensile strengths, elongation at break, and Young’s modulus values for ABS-made samples in the two build orientations—transverse and longitudinal—at two different infill percentages of 40%, 60%, 80%, and 100%, respectively.
Like the mechanical testing results for ABS samples, from SEM images for the longitudinal build orientation, no significant structural change can be traced for infill percentages between 40% and 80% (Figure 18a–c). However, at 100% infill, a more unified structure with smaller air voids can be seen (Figure 18d). SEM images for ABS samples printed in the transverse build orientation showed that by increasing the infill percentage from 40% infill to 100%, the air voids shrank, and more uneven fracture surfaces were observed (Figure 18e–h). The uneven broken surface structures suggested a better layer adhesion. However, at lower infills in comparison with the 100% infill, the air voids in the structure and lower layer adhesions between the rasters were dominant and that could be the reason for the lower mechanical properties of the lower infill percentages.
The effects of infill percentage on the mechanical properties of the printed ABS samples were investigated and the results can be seen in Table 5.
From Figure 19, it can be perceived that at 100% infill, the mechanical anisotropy of samples for both build orientations reached their minimum values. Also, by increasing the infill percentage, the degree of anisotropy decreased noticeably for samples, which emphasises the influence of the air voids and layer adhesion on the final mechanical properties of the 3D-printed parts.

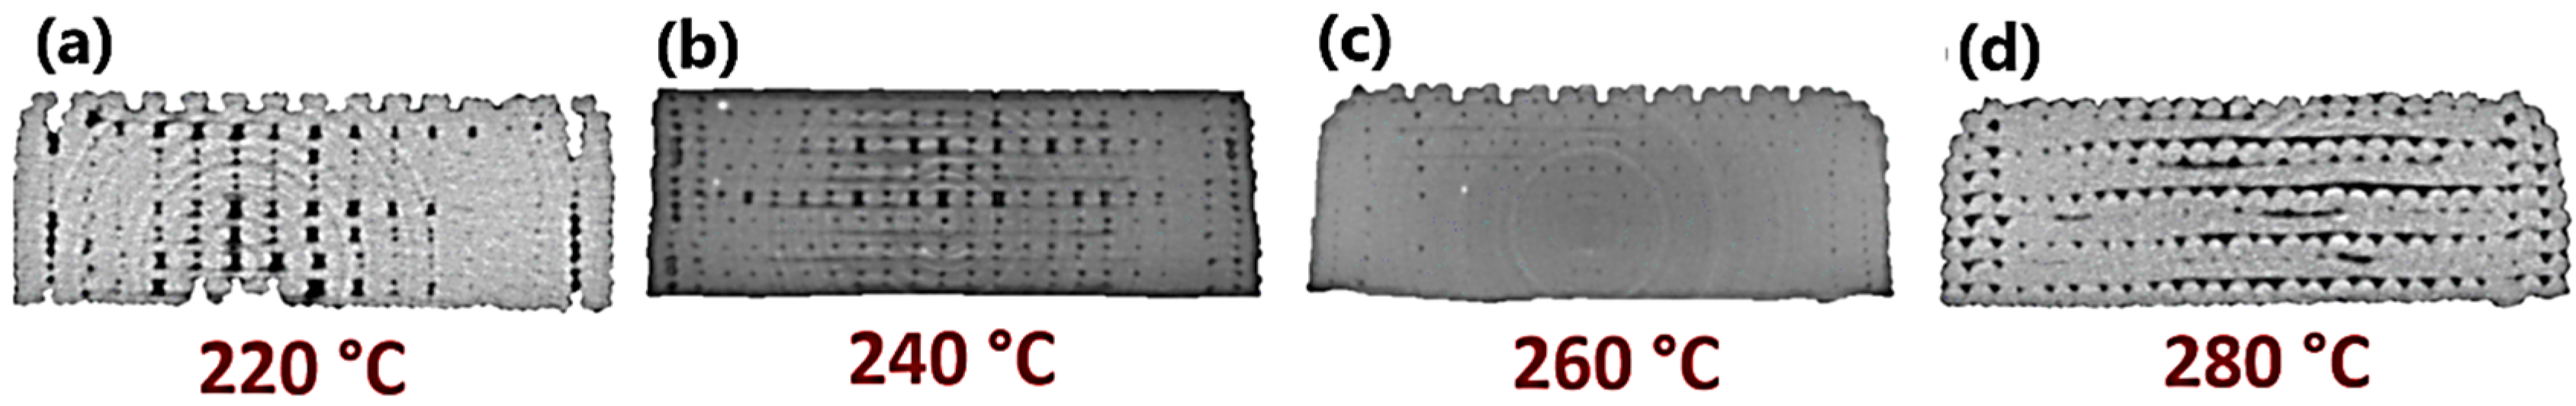
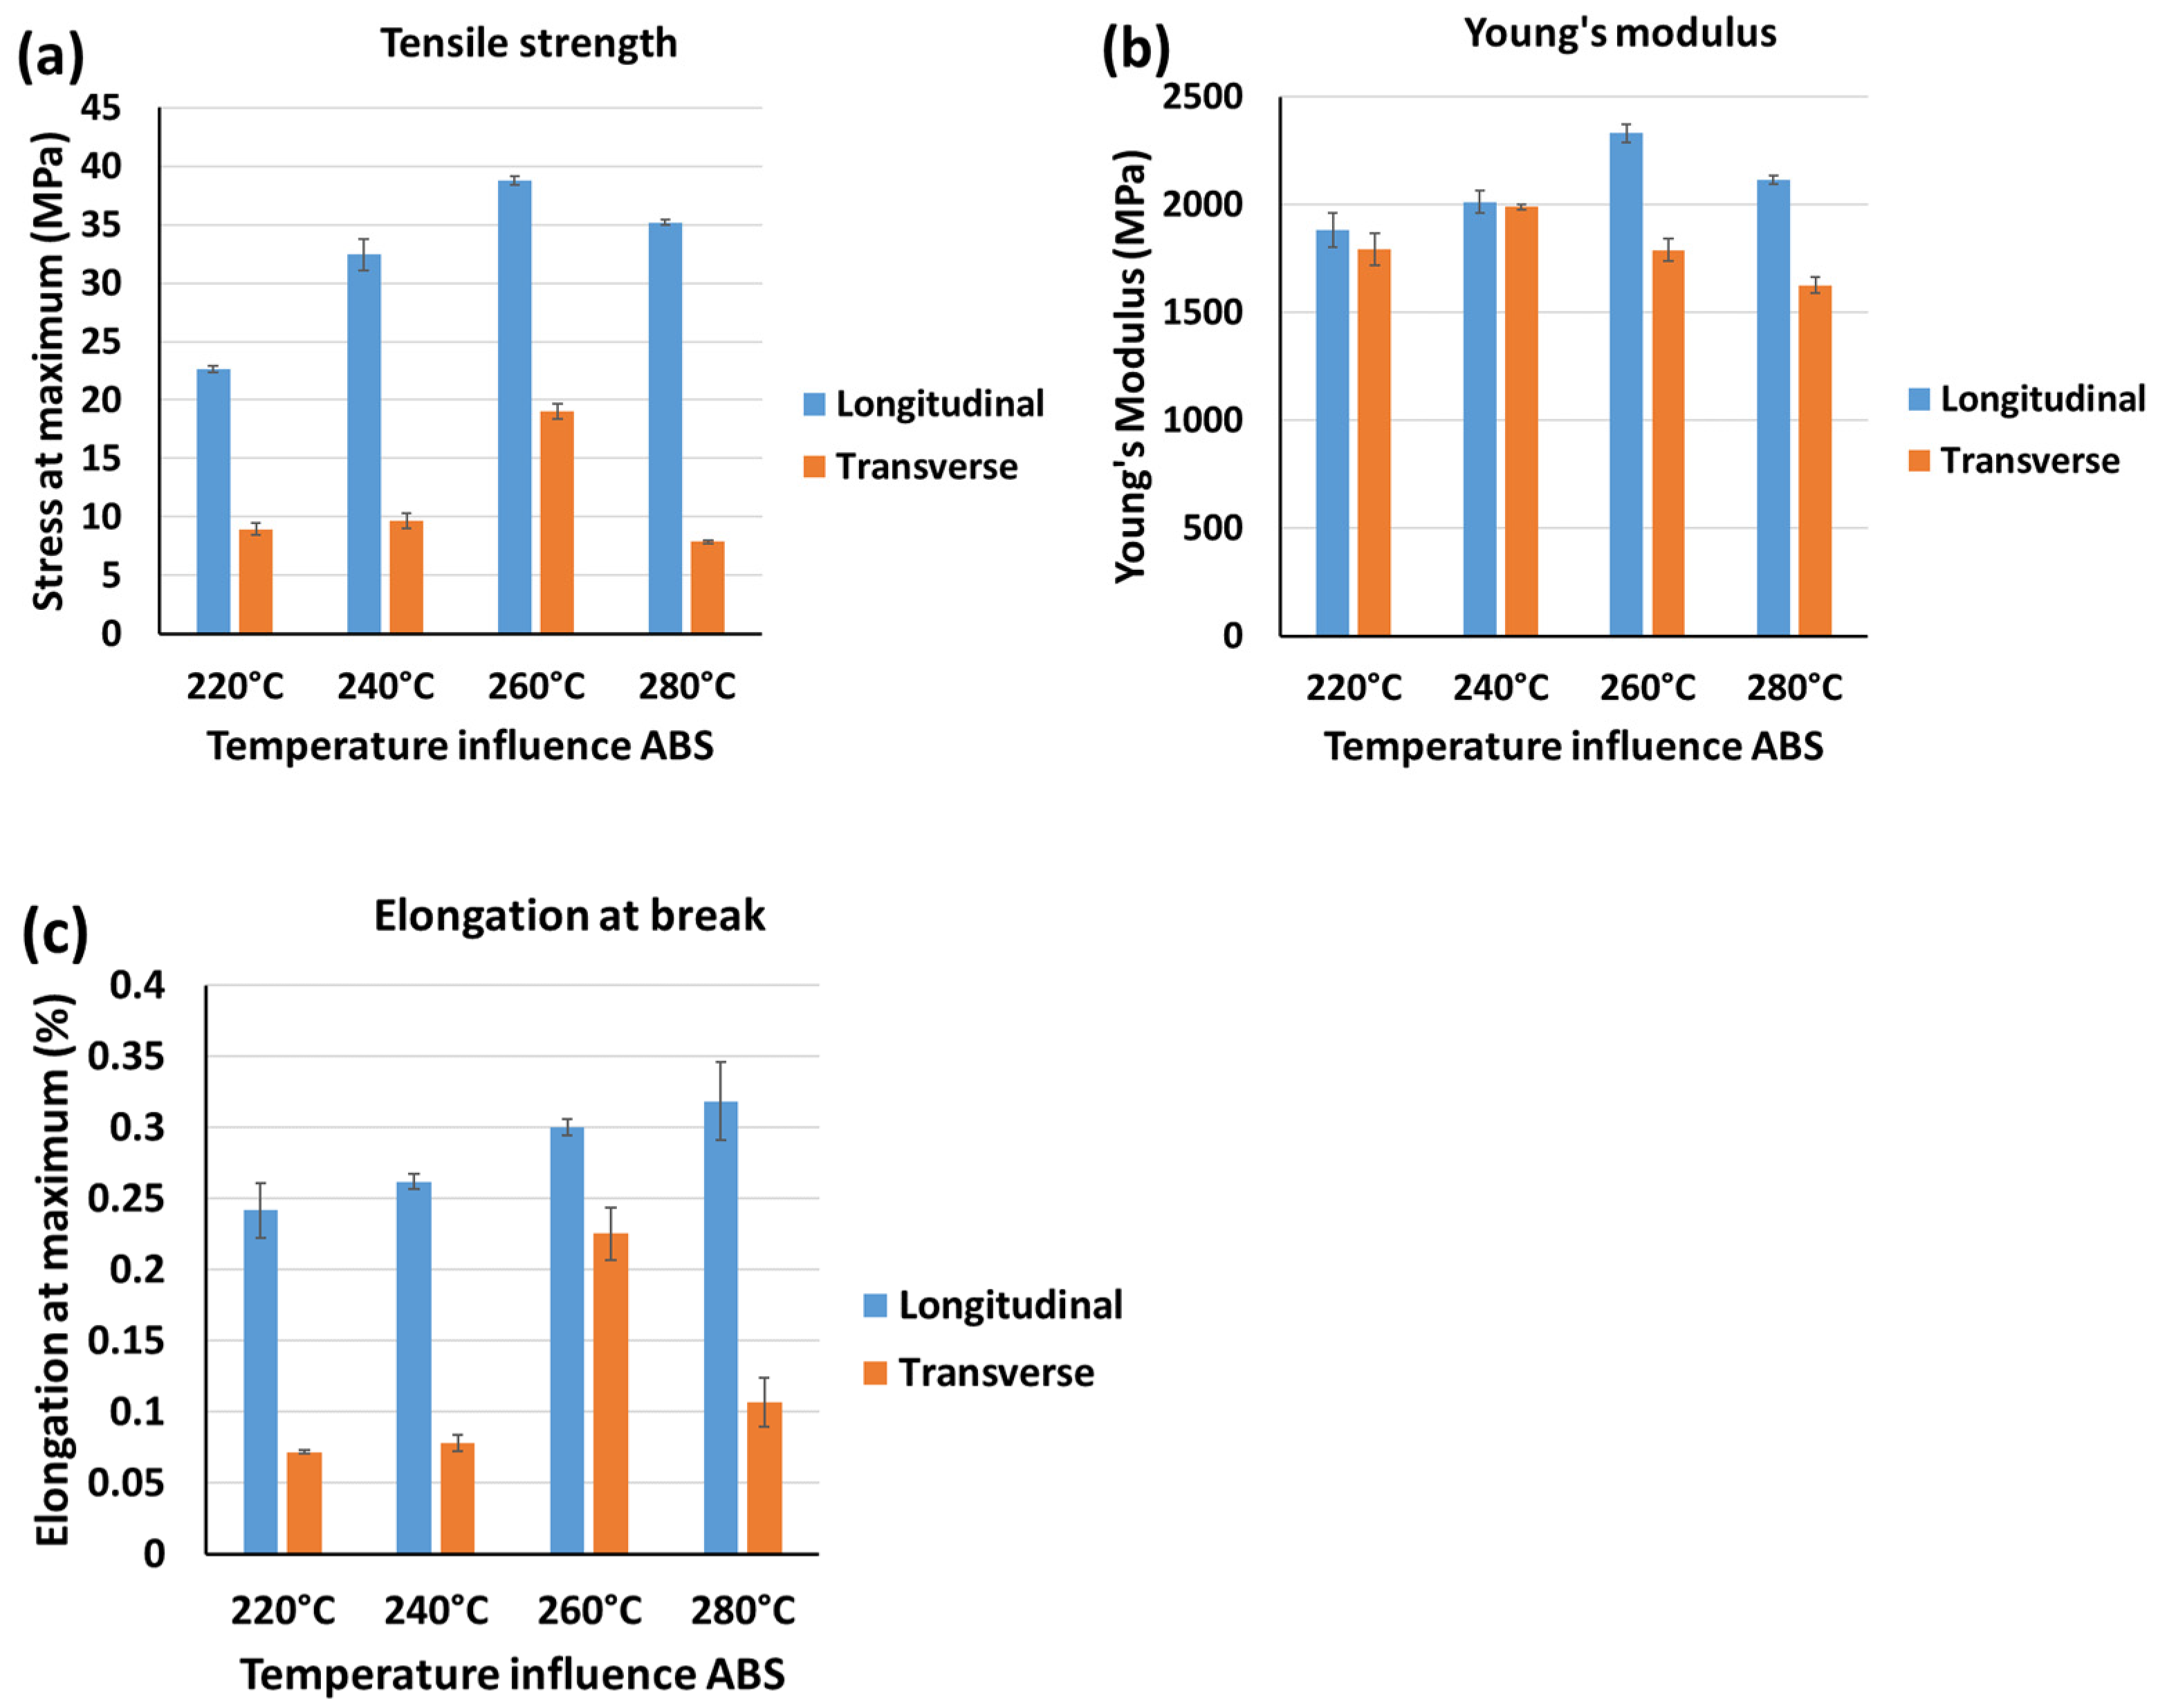
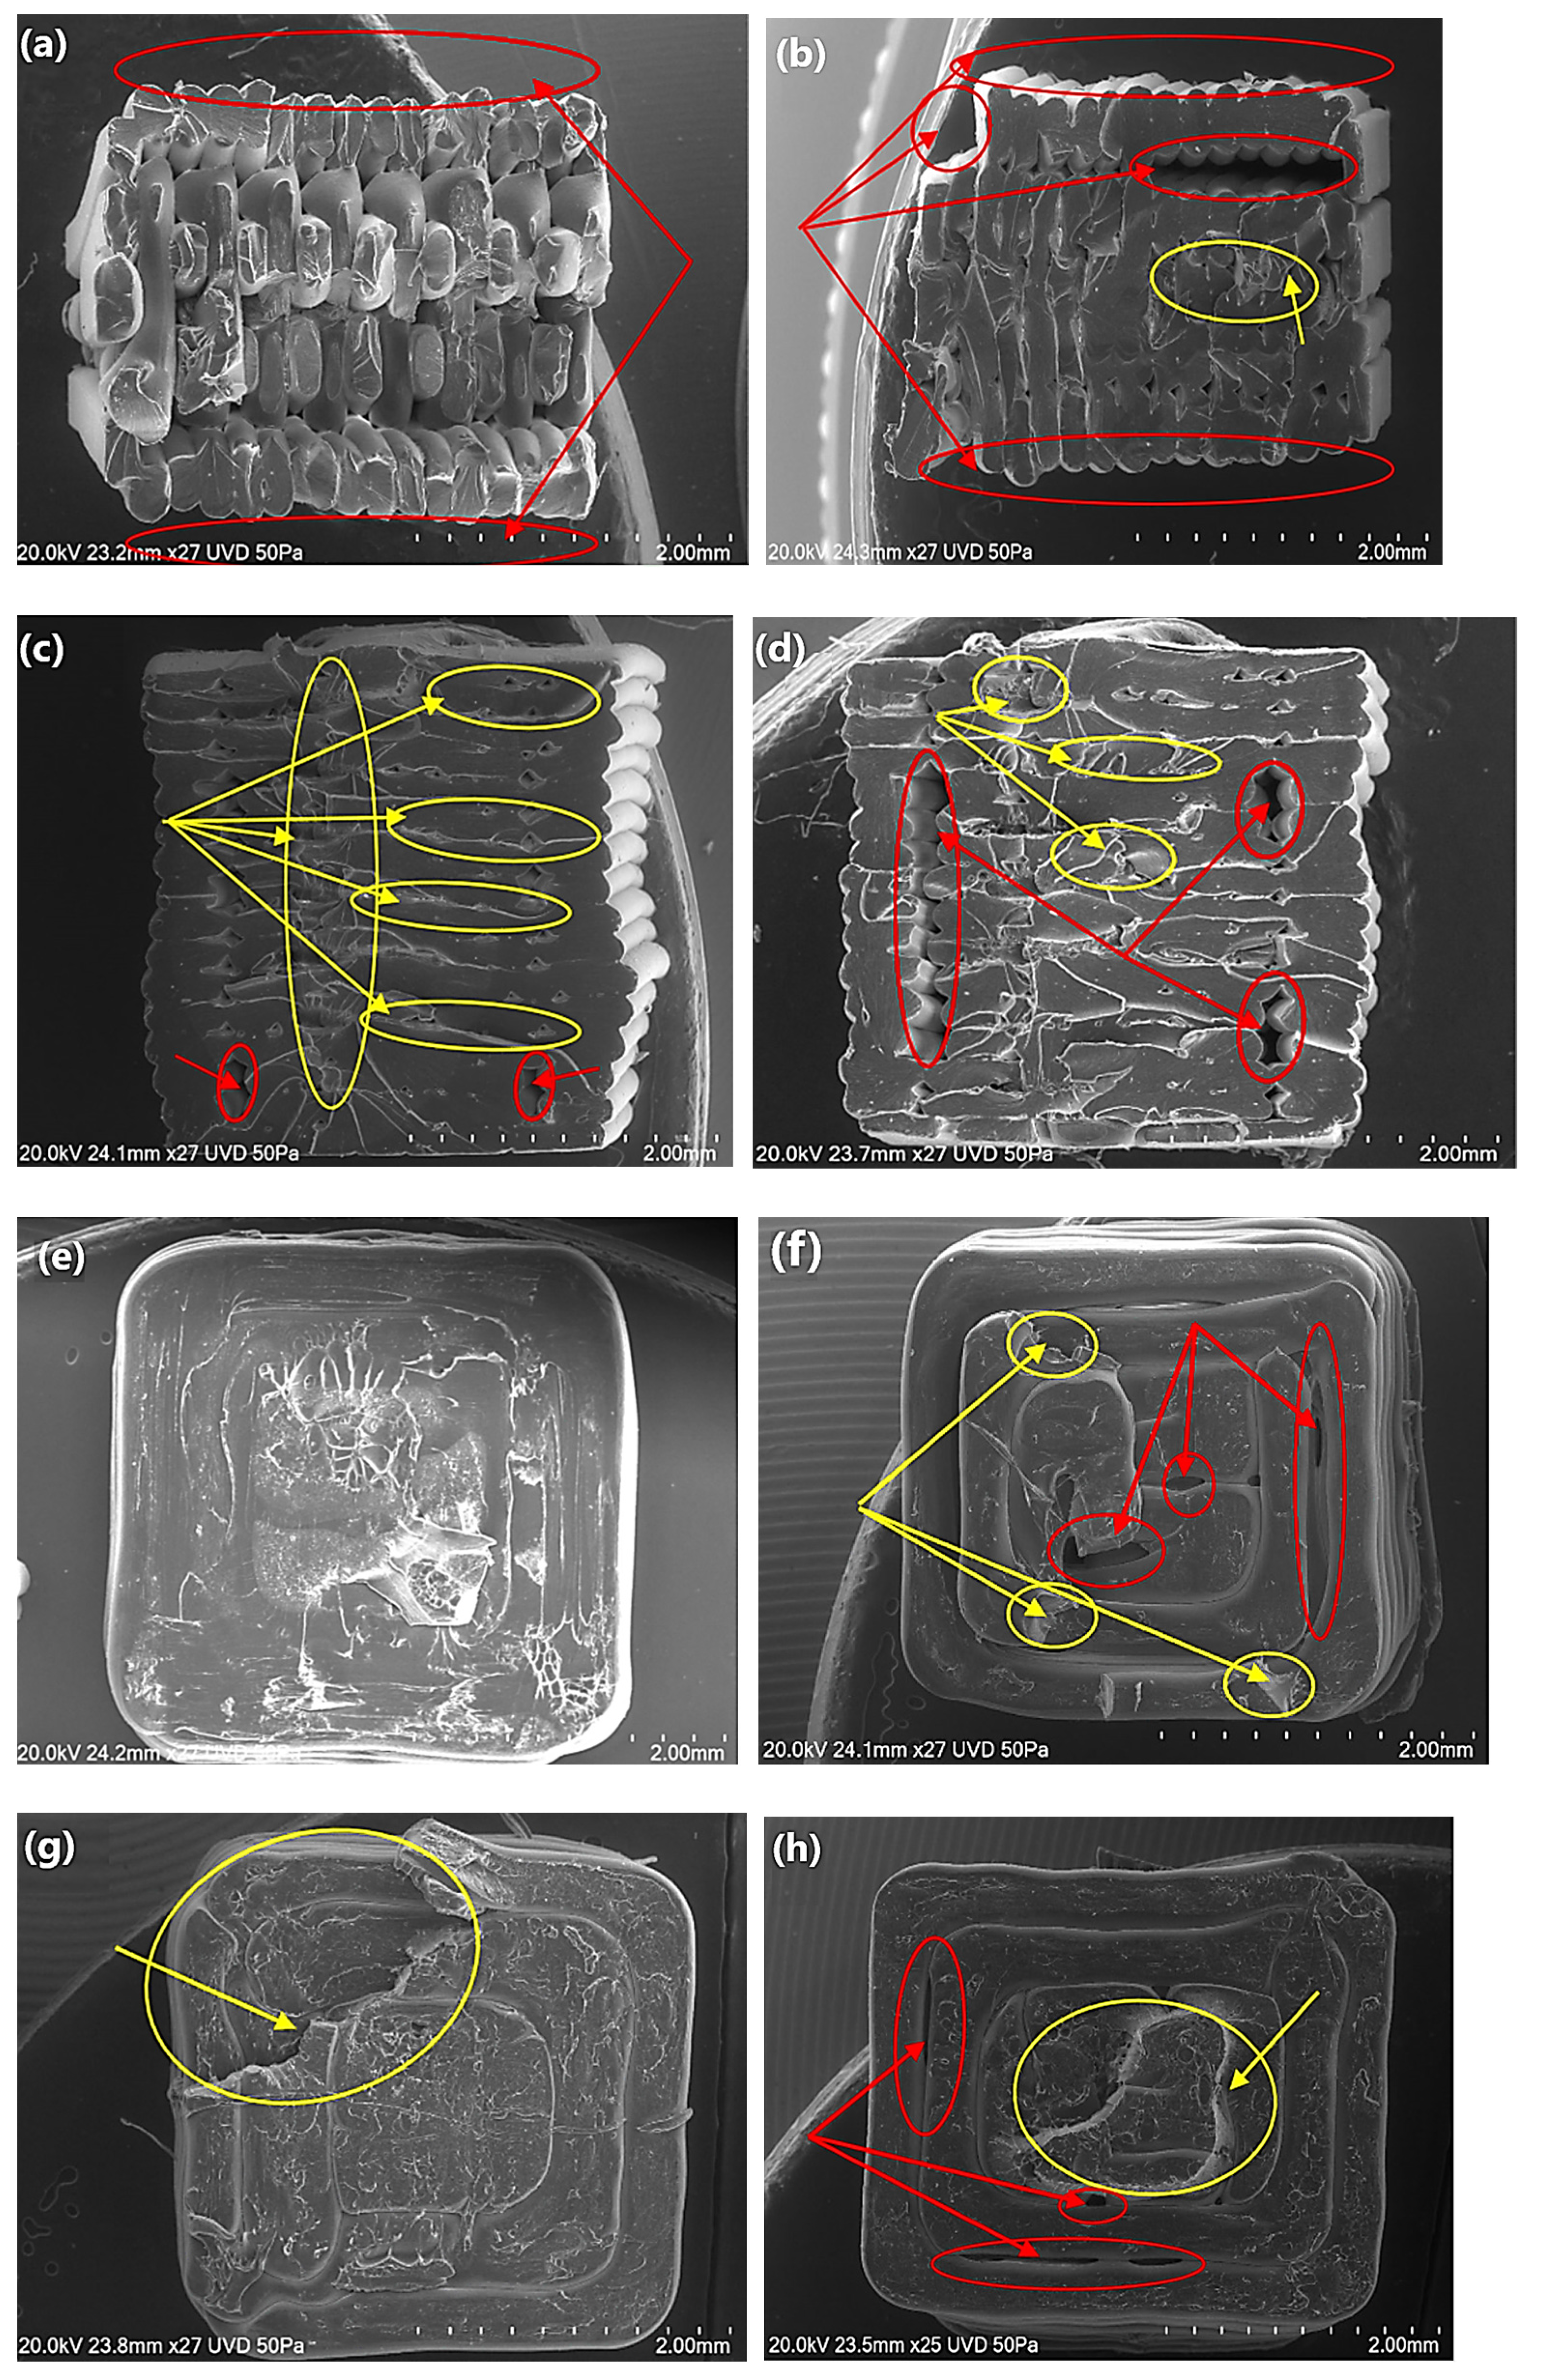
3.1.5. The Effect of Nozzle Temperature Variation on Anisotropy

The effect of the printing temperature or nozzle temperature on material anisotropy is less studied in the literature. In this study, temperatures of 220 °C, 240 °C, 260 °C, and 280 °C were selected as the nozzle temperatures for printing ABS samples in the longitudinal and transverse build orientations.
A good understanding of the nature of the polymer and its behaviour when the temperature changes is the key to generating parts with fewer air voids and, consequently, better structure with maximum resistance to deformation and break. Figure 20a–d show the micro-CT images of the ABS samples at different nozzle temperatures.
The effects of print temperature on ABS samples printed in the longitudinal build orientation suggested an optimum temperature of 260 °C. Tensile strength results show an increase of 43% when nozzle temperature was increased from 220 °C to 240 °C followed by another 19% improvement when the temperature was changed from 240 °C to 260 °C. A drop of 9% was recorded when the temperature increased to 280 °C which suggests that the optimum tensile strength can be achieved at 260 °C. The elongation at break showed an increase by increasing the temperature from 220 °C to 280 °C. Almost the same trend for tensile strength was observed for samples printed in the transverse build orientation. A minimal increase from 220 °C to 240 °C followed by a peak of 19 MPa at 260 °C and a drop of 59% at 280 °C print temperature proves the optimum printing temperature condition can be achieved at 260 °C. Figure 21 represents the measured ultimate tensile strengths, elongation at breaks and Young’s modulus values for ABS samples in two build orientations—transverse and longitudinal—at different nozzle temperatures.
The mechanical behaviours of the printed sample based on the mechanical tests can also be confirmed by SEM images. For the longitudinal build orientation, at 220 °C and 240 °C (Figure 22a and b, respectively), the poor layer adhesion can be confirmed by the missing perimeter layers and massive formed air voids in the structure of the samples. By increasing the temperature to 260 °C, layer adhesion improves enormously and more uneven fractured surfaces with fewer air voids compared to lower nozzle temperatures appear. At 280 °C, structural integrity partially persisted but compared to the 260 °C nozzle temperature, the relatively bigger air voids were the main contributing factors in lowering mechanical properties. For samples printed in the transverse build orientation, the 220 °C nozzle temperature, although there are no obvious air voids in the structure, a flat and smooth fracture surface suggests minimal resistance from the layers towards the axial force. This fracture behaviour was changed in the sample printed at 240 °C with a more uneven fractured surface. However, more air voids between rasters are proof of the lack of proper layer adhesion between rasters. At 260 °C, the fracture surface shows almost no obvious air voids, and the uneven break surface justifies the better tensile strength and elongation at break results. For 280 °C like 240 °C, the air voids in the sample became more prominent and can be the reason for the decrease in mechanical properties compared to the 260 °C nozzle temperature. Figure 22 shows the SEM images comparing the two build orientations—LBO and TBO—for samples made of ABS at different nozzle temperatures.
The effects of temperature changes on the mechanical properties of the printed ABS samples were investigated and the results of the ultimate tensile strength (UTS) strain at break (Δ), elastic modulus (E), and their associated root square error percentages (SQRT error mean) of ABS polymer in two build orientations—longitudinal (LBO) and transverse (TBO)—were mentioned in Table 6.
According to Figure 23, for parts printed at 260 °C in both build orientations, the mechanical anisotropy reaches its minimum. This indicates that at this temperature, optimal mechanical properties can be anticipated. Beyond this temperature, the anisotropy increased significantly for both build orientations. This insight can assist in selecting the appropriate polymer when mechanical anisotropy plays a crucial role in the design of the 3D-printed sample.

3.2. Comparisons of Experimental and Numerical Results

Figure 24a and b represent the UTS comparisons between experimental, ROM, and MROM results for ABS samples and printed in the LBO and TBO, respectively. The details of these graphs along with the error percentages for ROM and MROM are also separately placed in Table 7 and Table 8. As can be seen from Figure 24a, although the MROM is a perfect match with the experimental results, the results were not much affected by the ROM, and they could also show an acceptable range. However, in Figure 24b, the ROM did not show an acceptable fit with the experimental results while the MROM was a very close and perfect match for the UTS results for samples printed in the TBO. This first shows how sensitive the TBO is to the infill changes in the system and shows how effective the MROM was in the modelling results.

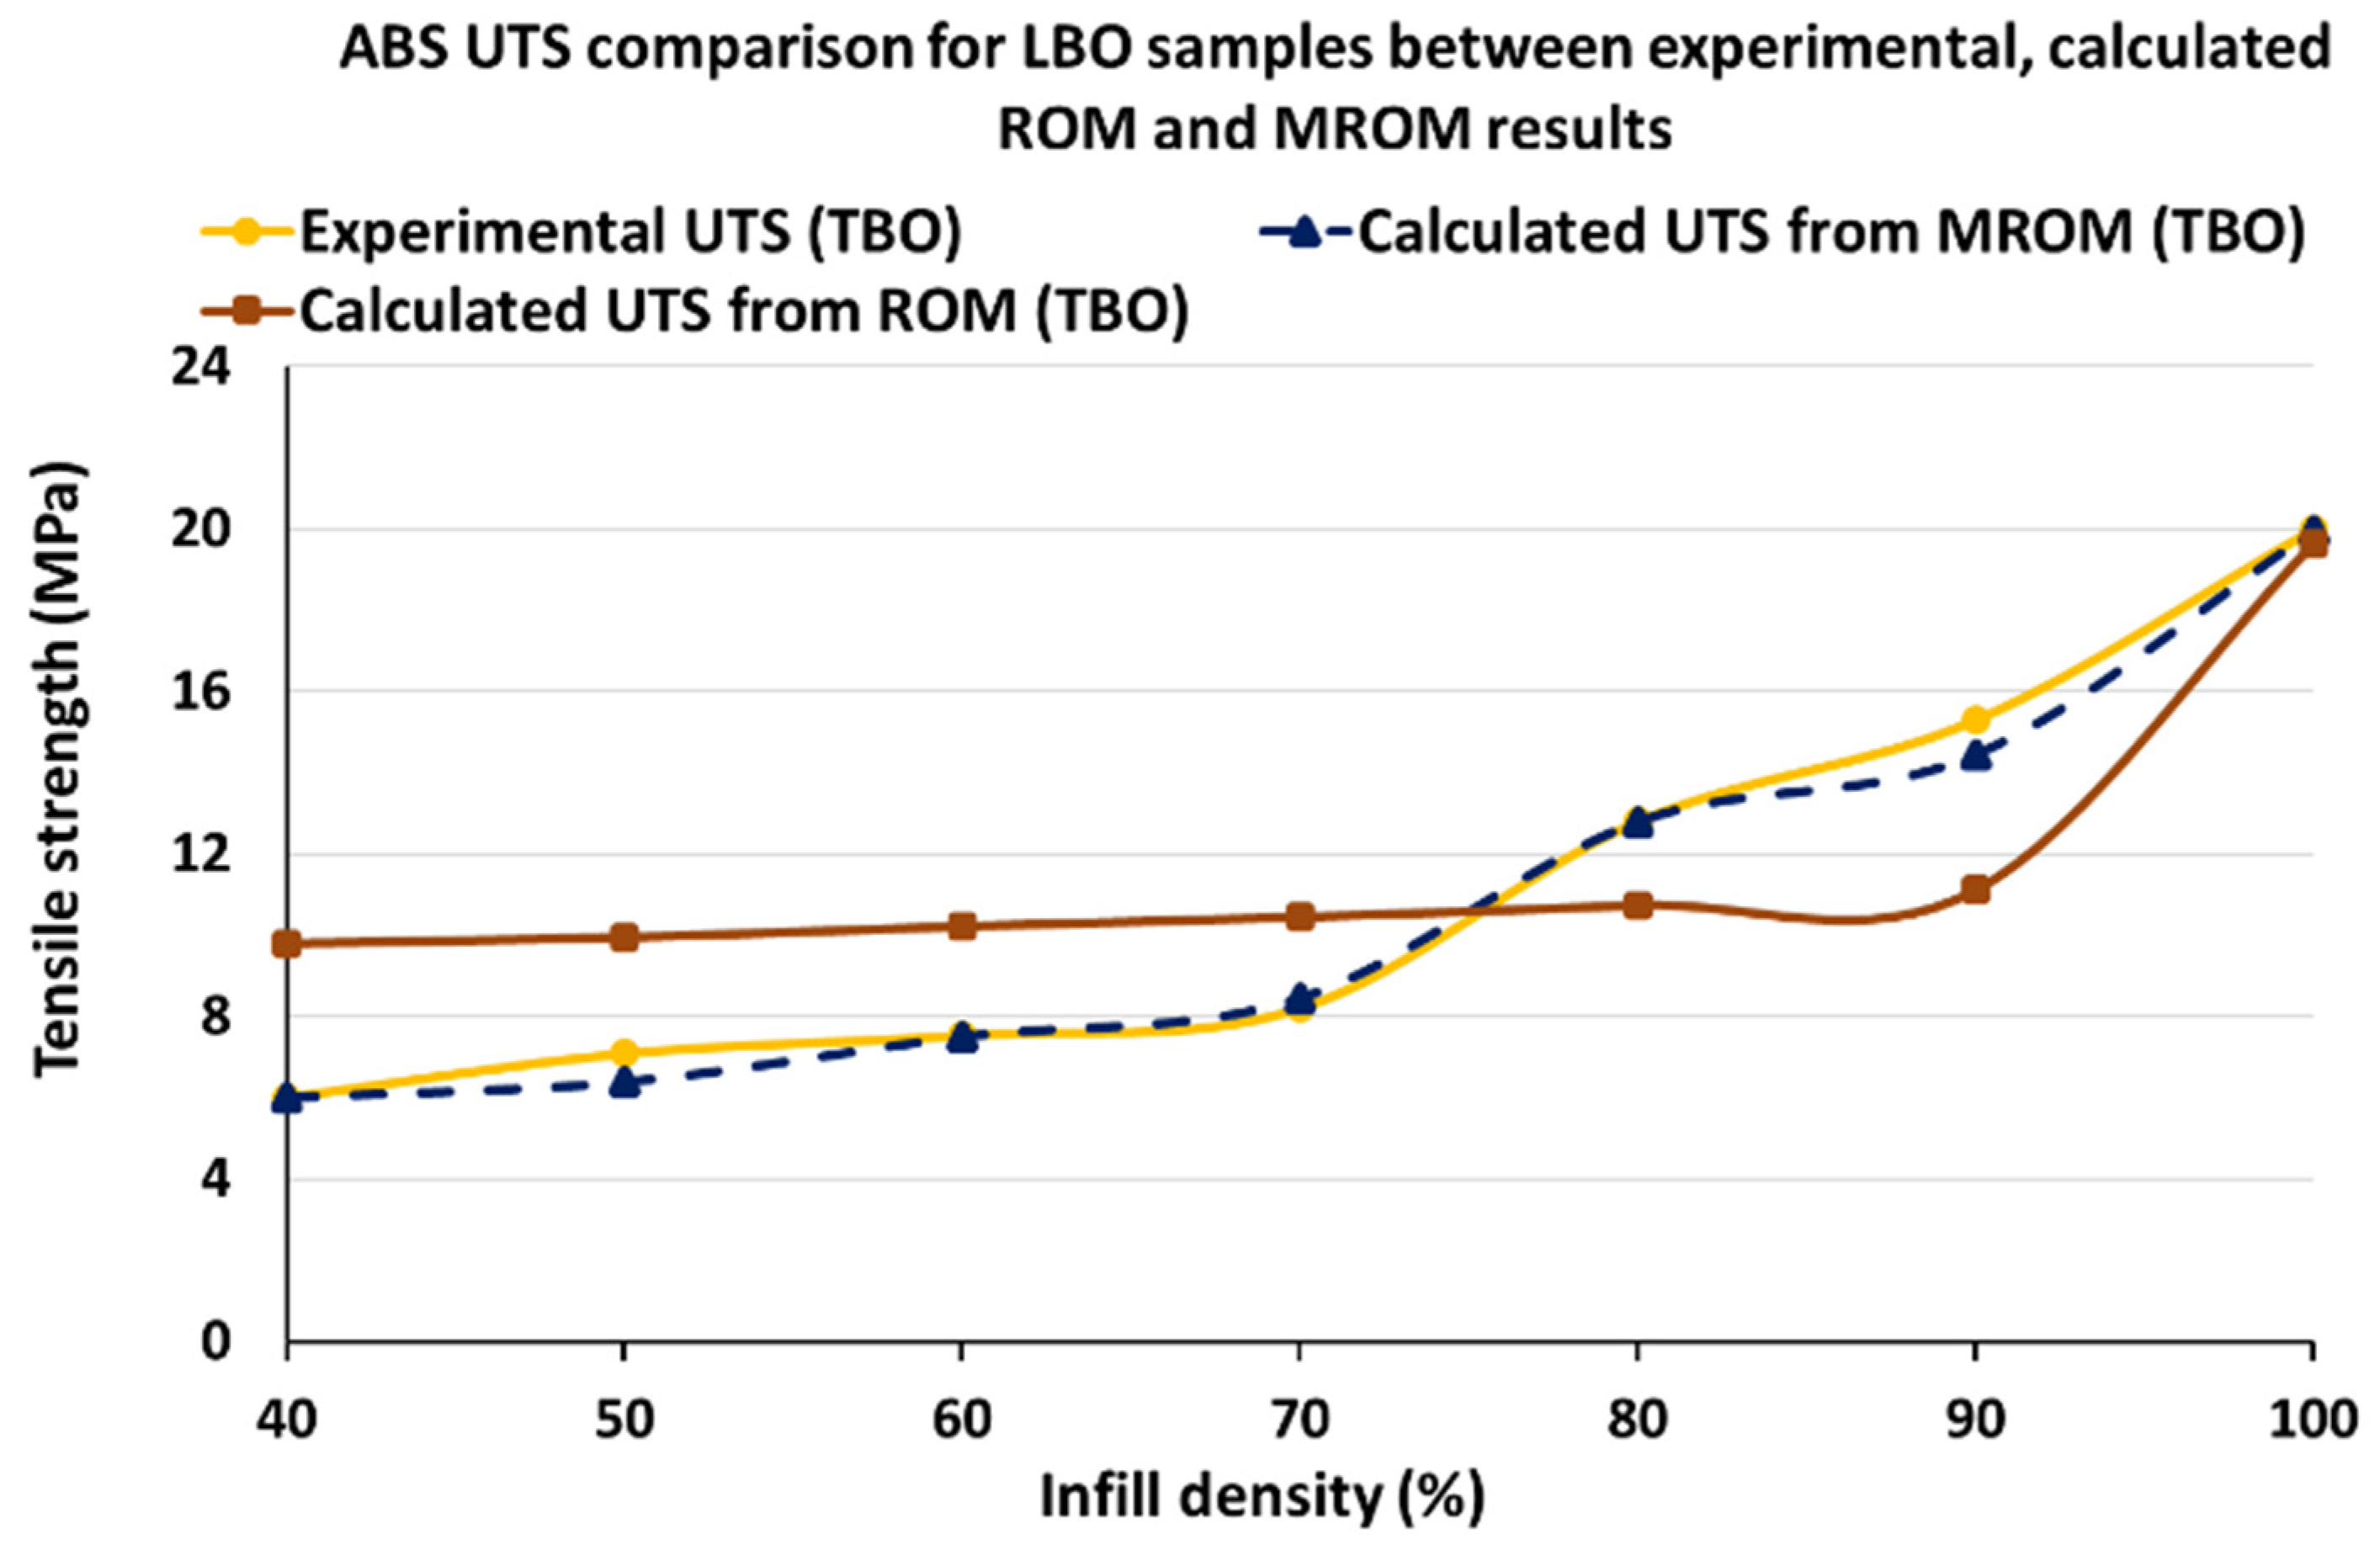
3.3. Extension to the MROM Modelling Investigation for Samples Printed in TBO

To make sure that the MROM is effective to predict the samples printed in the TBO, an additional investigation was conducted by printing samples with different percentages of 50%, 70%, and 90% and performing modelling processes with both ROM and MROM. Figure 25 and Table 9 show the details of this complementary investigation. The MROM generated the error percentages to fall below 10% for all the samples printed in the TBO. The results for the new samples were also very close to the experimental results, showing the high accuracy of the MROM, regardless of the infill percentage. It clearly shows that the MROM is capable of very accurately predicting the mechanical behaviour of the additional samples.

4. Conclusions

In this research, the influences of four main FDM printing process parameters including the infill percentage, printing temperature, layer thickness, and raster angle on the material anisotropy of the ABS material have been investigated systematically, and the obtained experimental and numerical results demonstrated that these four machine parameters proved to be very influential on the degree of mechanical anisotropy for FDM-printed ABS. According to the results obtained, the following conclusions can be drawn:
  • Although the best mechanical properties for the ABS polymer in the LBO and TBO were recorded at the 0.25 mm and 0.15 mm layer thicknesses, respectively, the minimum mechanical anisotropy for this polymer was recorded at 0.15 mm.
  • In terms of raster angle, samples made of ABS and printed with a 0°/90° raster angle showed the best results with lower mechanical anisotropy values compared to the +45°/−45° raster angle.
  • The infill percentage can enormously influence the integrity of the structure of the FDM-printed parts and consequently the degree of mechanical anisotropy. By increasing the infill percentage, ABS showed an improving trend in mechanical properties, as well as a lower degree of mechanical anisotropy to a point that at 100% infill, the values of mechanical anisotropy reached a very similar value.
  • The layer adhesion and mechanical integrity of the FDM-printed parts are very sensitive to print temperature changes and if the proper temperature can be selected, the mechanical anisotropy can be reduced noticeably. For both the LBO and TBO, 260 °C was found to be the best temperature to print samples.
Considering the numerical analysis on the effect of the infill percentage on the UTS of the 3D-printed ABS polymers in the two build orientations—LBO and TBO—the following research finding can be listed as follows:
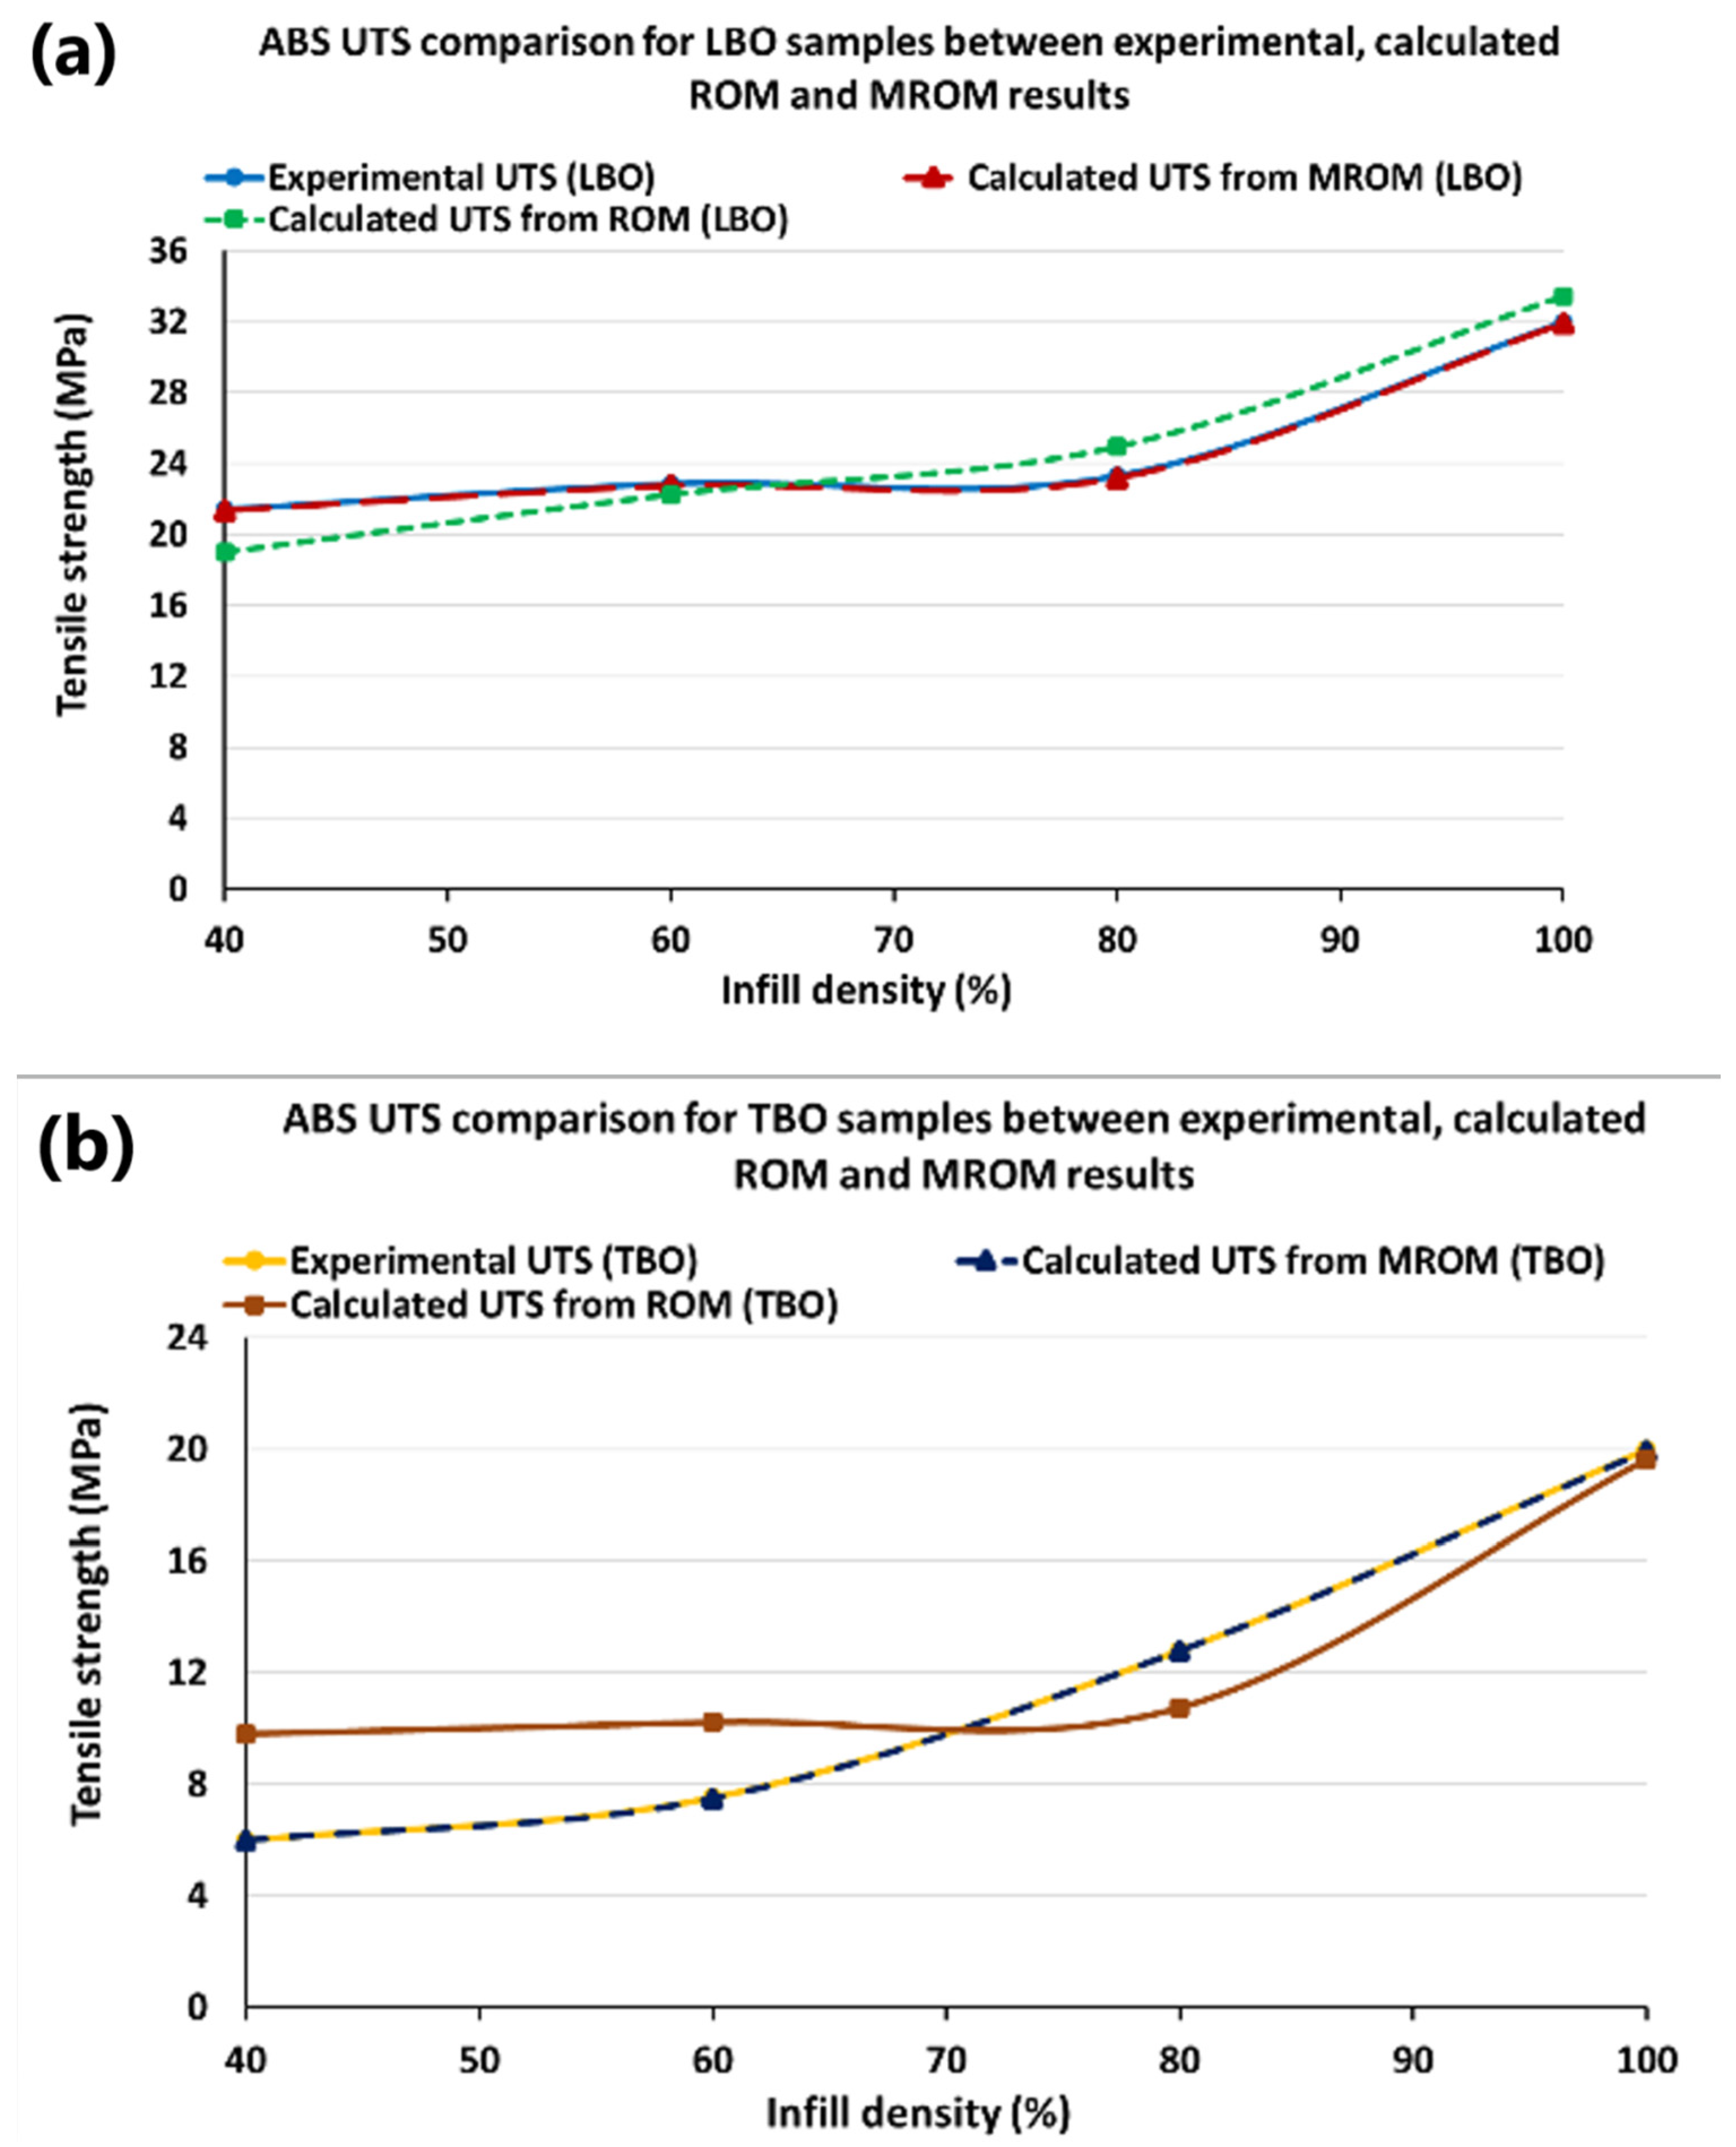
  • The UTS of the samples printed in the LBO can be predicted using the ROM method with very accurate results. By contrast, the UTS of those samples printed in the TBO only can be predicted by introducing additional functions with the modified ROM with an increase of 10% in accuracy.
  • It is worth mentioning that the developed MROM provides an effective tool to predict the material proprieties of FDM-printed ABS compared to the original ROM validated by experimental data.
While the primary goal of this study was to systematically introduce and elaborate on the key influential factors contributing to the generation of anisotropy phenomena, further research is warranted to explore additional FDM printing parameters that may have a significant impact. Investigating other types of polymers other than the ones stated in this study could help to provide a better understanding of the formation of the intrinsic and extrinsic air voids within the printed samples. A further investigation can be conducted by incorporating other monomers into the ABS structures in the form of in situ polymerisation to introduce some of the favourable elements into the ABS polymer to increase mechanical isotropies. As for further future work, in terms of the modelling of the results, the other machine parameters need to be investigated more, and developing an accurate model to represent the results for the parameters not covered in this study is crucial. Until then, the outcome of this research can be extremely useful and can be relied on in terms of the effect of the anisotropy on the mechanical properties of the printed samples and will be useful in the material and process design of the 3D-printed polymeric parts.

Author Contributions

Conceptualisation: R.Y. and N.Z.; methodology: R.Y., N.Z. and P.Q.K.N.; investigation: N.Z. and P.Q.K.N.; writing—original draft and conducting the numerical modelling: N.Z.; conducting the experimental testings and editing: N.Z.; assisting numerical modelling: R.Y. and P.Q.K.N.; visualisation: N.Z.; supervision: R.Y.; project administration: R.Y.; funding acquisition: R.Y. All authors have read and agreed to the published version of the manuscript.

Funding

N.Z. and P.Q.K.N. would like to acknowledge the final support from Western Sydney University via the Postgraduate Scholarship Award for their Ph.D. studies. P.Q.K.N. would also like to show his gratitude for the financial support from Western Sydney University via the Summer Research Program for his undergraduate degree.

Institutional Review Board Statement

Not applicable.

Informed Consent Statement

Not applicable.

Data Availability Statement

The raw data supporting the conclusions of this article will be made available by the authors on request.

Acknowledgments

All the co-authors, N.Z., P.Q.K.N. and R.Y., would like to show their gratitude to the School of Engineering, Design, and Built Environment (SoEDBE), the Built Environment and Engineering Cluster, Teaching & Research Technical Services (TRTS), and the Advanced Material Characterisation Facilities (AMCF), Western Sydney University, for the support and assistance in their research activities.

Conflicts of Interest

The authors declare no conflicts of interest.

References

  1. Freitas, D.; Almeida, H.A.; Bártolo, H.; Bártolo, P.J. Sustainability in extrusion-based additive manufacturing technologies. Prog. Addit. Manuf. 2016, 1, 65–78. [Google Scholar] [CrossRef]
  2. Campana, G.; Mele, M.; Ciotti, M.; Rocchi, A. Environmental impacts of self-replicating three-dimensional printers. Sustain. Mater. Technol. 2021, 30, e00335. [Google Scholar] [CrossRef]
  3. Feng, X.; Yang, Z.; Rostom, S.S.H.; Dadmun, M.; Xie, Y.; Wang, S. Structural, mechanical, and thermal properties of 3D printed L-CNC/acrylonitrile butadiene styrene nanocomposites. J. Appl. Polym. Sci. 2017, 134, 45082. [Google Scholar] [CrossRef]
  4. Syrlybayev, D.; Zharylkassyn, B.; Seisekulova, A.; Akhmetov, M.; Perveen, A.; Talamona, D. Optimisation of Strength Properties of FDM Printed Parts—A Critical Review. Polymers 2021, 13, 1587. [Google Scholar] [CrossRef]
  5. Ngo, T.D.; Kashani, A.; Imbalzano, G.; Nguyen, K.T.Q.; Hui, D. Additive manufacturing (3D printing): A review of materials, methods, applications and challenges. Compos. Part B Eng. 2018, 143, 172–196. [Google Scholar] [CrossRef]
  6. Hull, C.W. Apparatus for Production of Three-Dimensional Objects by Stereolithography. U.S. Patent US4575330A, 19 December 1989. Available online: https://patents.google.com/patent/US4575330A/en (accessed on 20 February 2024).
  7. Campbell, T.A.; Ivanova, O.S. 3D printing of multifunctional nanocomposites. Nano Today 2013, 8, 119–120. [Google Scholar] [CrossRef]
  8. de Leon, A.C.; Chen, Q.; Palaganas, N.B.; Palaganas, J.O.; Manapat, J.; Advincula, R.C. High performance polymer nanocomposites for additive manufacturing applications. React. Funct. Polym. 2016, 103, 141–155. [Google Scholar] [CrossRef]
  9. Zohdi, N.; Yang, R. Material Anisotropy in Additively Manufactured Polymers and Polymer Composites: A Review. Polymers 2021, 13, 3368. [Google Scholar] [CrossRef] [PubMed]
  10. Saroia, J.; Wang, Y.; Wei, Q.; Lei, M.; Li, X.; Guo, Y.; Zhang, K. A review on 3D printed matrix polymer composites: Its potential and future challenges. Int. J. Adv. Manuf. Technol. 2020, 106, 1695–1721. [Google Scholar] [CrossRef]
  11. Wang, P.; Zou, B.; Ding, S.; Li, L.; Huang, C. Effects of FDM-3D printing parameters on mechanical properties and microstructure of CF/PEEK and GF/PEEK. Chin. J. Aeronaut. 2021, 34, 236–246. [Google Scholar] [CrossRef]
  12. Gooch, J.W. Encyclopedic Dictionary of Polymers; Springer: New York, NY, USA, 2011; Available online: https://www.amazon.com.au/Encyclopedic-Dictionary-Polymers-Jan-Gooch/dp/0387310215 (accessed on 20 February 2024).
  13. Sathish Kumar, K.; Soundararajan, R.; Shanthosh, G.; Saravanakumar, P.; Ratteesh, M. Augmenting effect of infill density and annealing on mechanical properties of PETG and CFPETG composites fabricated by FDM. Mater. Today Proc. 2021, 45, 2186–2191. [Google Scholar] [CrossRef]
  14. Gordeev, E.G.; Galushko, A.S.; Ananikov, V.P. Improvement of quality of 3D printed objects by elimination of microscopic structural defects in fused deposition modeling. PLoS ONE 2018, 13, e0198370. [Google Scholar] [CrossRef]
  15. De Bernardez, L.; Campana, G.; Mele, M.; Mur, S. Towards a Comparative Index Assessing Mechanical Performance, Material Consumption and Energy Requirements for Additive Manufactured Parts; Springer International Publishing: Berlin/Heidelberg, Germany, 2023; pp. 302–310. [Google Scholar]
  16. Croccolo, D.; De Agostinis, M.; Fini, S.; Mele, M.; Olmi, G.; Campana, G. Effects of infill temperature on the tensile properties and warping of 3D-printed polylactic acid. Prog. Addit. Manuf. 2023. [Google Scholar] [CrossRef]
  17. De Bernardez, L.; Campana, G.; Mele, M.; Sanguineti, J.; Sandre, C.; Mur, S.M. Effects of infill patterns on part performances and energy consumption in acrylonitrile butadiene styrene fused filament fabrication via industrial-grade machine. Prog. Addit. Manuf. 2023, 8, 117–129. [Google Scholar] [CrossRef]
  18. Samykano, M.; Selvamani, S.K.; Kadirgama, K.; Ngui, W.K.; Kanagaraj, G.; Sudhakar, K. Mechanical property of FDM printed ABS: Influence of printing parameters. Int. J. Adv. Manuf. Technol. 2019, 102, 2779–2796. [Google Scholar] [CrossRef]
  19. Deshwal, S.; Kumar, A.; Chhabra, D. Exercising hybrid statistical tools GA-RSM, GA-ANN and GA-ANFIS to optimize FDM process parameters for tensile strength improvement. CIRP J. Manuf. Sci. Technol. 2020, 31, 189–199. [Google Scholar] [CrossRef]
  20. Wang, S.; Ma, Y.; Deng, Z.; Zhang, S.; Cai, J. Effects of fused deposition modeling process parameters on tensile, dynamic mechanical properties of 3D printed polylactic acid materials. Polym. Test. 2020, 86, 106483. [Google Scholar] [CrossRef]
  21. Trzepieciński, T.; Ryzińska, G.; Biglar, M.; Gromada, M. Modelling of multilayer actuator layers by homogenisation technique using Digimat software. Ceram. Int. 2017, 43, 3259–3266. [Google Scholar] [CrossRef]
  22. Deng, K.; Khakpour, H.; Meneguzzo Pasquali, F.; Amaria, A.; Armstrong, J.; Hall, J. Rule of Mixtures Model to Determine Elastic Modulus and Tensile Strength of 3D Printed Carbon Fiber Reinforced Nylon; 2019. Available online: https://asmedigitalcollection.asme.org/IDETC-CIE/proceedings-abstract/IDETC-CIE2019/59186/V02AT03A039/1069759 (accessed on 20 February 2024).
  23. Luo, Z.; Li, X.; Shang, J.; Zhu, H.; Fang, D. Modified rule of mixtures and Halpin–Tsai model for prediction of tensile strength of micron-sized reinforced composites and Young’s modulus of multiscale reinforced composites for direct extrusion fabrication. Adv. Mech. Eng. 2018, 10, 1687814018785286. [Google Scholar] [CrossRef]
  24. Nguyen, P.Q.K.; Zohdi, N.; Kamlade, P.; Yang, R. Predicting Material Properties of Additively Manufactured Acrylonitrile Butadiene Styrene via a Multiscale Analysis Process. Polymers 2022, 14, 4310. [Google Scholar] [CrossRef] [PubMed]
  25. Goh, G.D.; Yap, Y.L.; Tan, H.K.J.; Sing, S.L.; Goh, G.L.; Yeong, W.Y. Process–Structure–Properties in Polymer Additive Manufacturing via Material Extrusion: A Review. Crit. Rev. Solid State Mater. Sci. 2020, 45, 113–133. [Google Scholar] [CrossRef]
  26. Gao, X.; Qi, S.; Kuang, X.; Su, Y.; Li, J.; Wang, D.J.A.M. Fused filament fabrication of polymer materials: A review of interlayer bond. Addit. Manuf. 2020, 37, 101658. [Google Scholar] [CrossRef]
  27. Baker, A.M.; Mccoy, J.; Majumdar, B.S.; Rumley-Ouellette, B.; Wahry, J.; Marchi, A.N.; Bernardin, J.D.; Spernjak, D. Measurement and Modelling of Thermal and Mechanical Anisotropy of Parts Additively Manufactured using Fused Deposition Modelling (FDM). In Proceedings of the 11th International Workshop on Structural Health Monitoring 2017, Stanford, CA, USA, 12–14 September 2017. [Google Scholar]
  28. Zohdi, N.; Tareq, S.; Yang, C. Investigation on mechanical anisotropy of high impact polystyrene fabricated via fused deposition modelling. In Proceedings of the International Conference on Mechanical and Manufacturing Engineering Research and Practice, Sydney, Australia, 24–28 November 2019; pp. 24–28. [Google Scholar]
  29. Kam, M.; İpekçi, A.; Şengül, Ö. Investigation of the effect of FDM process parameters on mechanical properties of 3D printed PA12 samples using Taguchi method. J. Thermoplast. Compos. Mater. 2021, 36, 89270572110064. [Google Scholar] [CrossRef]
  30. Dev, S.; Srivastava, R. Influence of process variables on mechanical properties and material weight of acrylic butadiene styrene parts produced by fused filament fabrication. Prog. Addit. Manuf. 2022, 8, 143–158. [Google Scholar] [CrossRef]
  31. Bakır, A.A.; Atik, R.; Özerinç, S. Effect of fused deposition modeling process parameters on the mechanical properties of recycled polyethylene terephthalate parts. J. Appl. Polym. Sci. 2021, 138, 49709. [Google Scholar] [CrossRef]
  32. Tura, A.D.; Lemu, H.G.; Mamo, H.B.; Santhosh, A.J. Prediction of tensile strength in fused deposition modeling process using artificial neural network and fuzzy logic. Prog. Addit. Manuf. 2022, 8, 529–539. [Google Scholar] [CrossRef]
Figure 1. Schematic of the FDM process (the components are not to scale).
Applsci 14 01870 g001
Figure 2. Filament extrusion setup.
Applsci 14 01870 g002
Figure 3. (a) ASTM D638 samples geometries (unit: mm) [12], (b) longitudinal build orientation, and (c) transverse build orientation.
Applsci 14 01870 g003aApplsci 14 01870 g003b
Figure 4. Flowchart showing the samples produced for each polymer type.
Applsci 14 01870 g004
Figure 5. SEM image of the cross-section of (a) extruded ABS, (b) as-received ABS filaments.
Applsci 14 01870 g005
Figure 6. (a) TGA and (b) DSC results of the ABS polymer.
Applsci 14 01870 g006
Figure 7. Micro-CT images show different air voids and layer adhesion qualities at different layer thicknesses of 0.15 mm (a), 0.25 mm (b), and 0.35 mm (c) for ABS samples.
Applsci 14 01870 g007
Figure 8. SEM images of ABS samples printed with (a) 0.15 mm layer thickness, (b) 0.25 mm layer thickness, and (c) 0.35 mm layer thickness.
Applsci 14 01870 g008
Figure 9. (a) Tensile strength, (b) elongation, and (c) Young’s modulus values for ABS samples at different layer thicknesses.
Applsci 14 01870 g009
Figure 10. SEM images of 3D-printed ABS samples: (a) (0.15 mm), (b) (0.25 mm), and (c) (0.35 mm) represent LBO, and (d) (0.15 mm), (e) (0.25 mm), and (f) (0.35 mm) represent TBO. Yellow marks show the unevenly fractured surfaces and red marks represent the air voids.
Applsci 14 01870 g010
Figure 11. Mechanical anisotropy (Δ (UTSL) and Δ (UTST)) for parts printed at different layer thicknesses.
Applsci 14 01870 g011
Figure 12. The micro-CT images of the ABS samples printed at (a) a +45°/−45° raster angle and (b) a 90°/0° raster angle.
Applsci 14 01870 g012
Figure 13. (a) Tensile strength, (b) elongation, and (c) Young’s modulus values for ABS samples when the raster angle values change between +45°/−45° and 90°/0°.
Applsci 14 01870 g013
Figure 14. SEM images of ABS polymer printed in (a) the longitudinal build orientation with a +45°/−45° raster angle, (b) the longitudinal build orientation with a 0°/90° raster angle, (c) the transverse build orientation with a +45°/−45° raster angle, and (d) the transverse build orientation with a 0°/90° raster angle.
Applsci 14 01870 g014
Figure 15. Mechanical anisotropy (Δ (UTSL) and Δ (UTST)) for ABS parts printed at different raster angles.
Applsci 14 01870 g015
Figure 16. Micro-CT images of ABS samples showing different air void numbers and sizes when the infill percentage changes; (a) 40%, (b) 60%, (c) 80%, (d) 100%.
Applsci 14 01870 g016
Figure 17. (a) Tensile strength, (b) elongation, and (c) Young’s modulus values for ABS samples when the infill percentages change from 40% to 100% for the two build orientations of the LBO and TBO.
Applsci 14 01870 g017
Figure 18. SEM images of 3D-printed ABS samples. (ad) represent LBO and (eh) represent the TBO at 40%, 60%, 80%, and 100% infills, respectively. Yellow marks show the unevenly fractured surfaces, whereas the red marks represent the unwanted air voids.
Applsci 14 01870 g018aApplsci 14 01870 g018b
Figure 19. Mechanical anisotropy Δ (ABS) for parts printed at infill percentages and build orientations for printed samples.
Applsci 14 01870 g019
Figure 20. Micro-CT images of the ABS polymer when printing in the LBO and at different nozzle temperatures of (a) 220 °C, (b) 240 °C, (c) 260 °C, and (d) 280 °C.
Applsci 14 01870 g020
Figure 21. (a) Tensile strength, (b) elongation and (c) Young’s modulus values for ABS samples when the nozzle temperatures change from 220 °C to 280 °C for the two build orientations—LBO and TBO.
Applsci 14 01870 g021
Figure 22. SEM images of the 3D-printed ABS samples. (ad) represent LBO and (eh) represent the TBO at 220 °C, 240 °C, 260 °C, and 280 °C nozzle temperatures, respectively. Yellow marks show the unevenly fractured surfaces whereas the red marks represent the unwanted formed air voids.
Applsci 14 01870 g022
Figure 23. Mechanical anisotropy (Δ (ABS)) for parts printed with different nozzle temperatures for ABS samples.
Applsci 14 01870 g023
Figure 24. UTS comparison between experimental results with those from ROM and MROM at different infill percentages for ABS samples: (a) samples printed in the LBO, (b) samples printed in the TBO.
Applsci 14 01870 g024
Figure 25. UTS comparison between experimental results with ROM and MROM at different infill percentages from 40% to 100% by 10% increments for ABS samples printed in the TBO.
Applsci 14 01870 g025
Table 1. Extrusion parameters for fabricating ABS filaments.
ParametersValues
Extruder bore diameter 2.5 mm, blank
TemperatureTemperatures (°C)Zone 1Zone 2Zone 3
230240240
Extrusion speed 9–12 rpm
Winding speed 8–11 rpm
Extruded filament diameter 1.75 mm (±0.08 mm)
Room temperature22 °C
Room humidity<55%
Table 2. Printing parameters.
Machine FactorValue
Printing temperature (V)220 °C, 240 °C, 260 °C, and 280 °C
Bed temperature (C)110 °C
Raster angle (V)±45° and ±90°
Infill percentage (V)40%, 60%, 80%, and 100%
Fill pattern (C)Rectilinear
Air gap (C)0
Infill speed (C)70 mm/s
Layer thickness0.15 mm, 0.25 mm, 0.35 mm
Raster width (C)0.5 mm
Nozzle diameter (C)0.4 mm
Build orientation (V)Longitudinal and transverse
V in the round brackets denotes a varied parameter and C denotes a constant parameter.
Table 3. UTS, Δ, and E values for ABS samples printed in the LBO and TBO at different layer thicknesses.
Longitudinal Build Orientation
Layer thicknessUTS(mean)
(MPa)
UTS(SQRT Error Mean)
(MPa)
Δ(mean)
(%)
Δ(SQRT Error Mean)
(%)
E(mean)
(MPa)
E(SQRT Error Mean)
(MPa)
0.15 mm28.341.130.400.029188042.21
0.25 mm33.310.450.590.0621732189.43
0.35 mm31.110.190.510.5191811102.45
Transverse Build Orientation
Layer thicknessUTS(mean)
(MPa)
UTS(SQRT Error Mean)
(MPa)
Δ(mean)
(%)
Δ(SQRT Error Mean)
(%)
E(mean)
(MPa)
E(SQRT Error Mean)
(MPa)
0.15 mm17.120.490.160.02188358.34
0.25 mm12.210.190.120.006164577.61
0.35 mm14.280.360.150.0161649102.19
Table 4. UTS, Δ, and E values for ABS samples printed in the LBO and TBO at different raster angles.
Longitudinal Build Orientation
Raster angleUTS(mean)
(MPa)
UTS(SQRT Error Mean)
(MPa)
Δ(mean)
(%)
Δ(SQRT Error Mean)
(%)
E(mean)
(MPa)
E(SQRT Error Mean)
(MPa)
0°/90°320.710.230.002228528.06
+45/−4525.360.270.320.046166846.49
Transverse Build Orientation
Raster angleUTS(mean)
(MPa)
UTS(SQRT Error Mean)
(MPa)
Δ(mean)
(%)
Δ(SQRT Error Mean)
(%)
E(mean)
(MPa)
E(SQRT Error Mean)
(MPa)
0°/90°19.030.610.220.018178851.02
+45/−4510.650.430.090.005174777.91
Table 5. Infill percentage UTS, Δ, and E values for ABS samples printed in the LBO and TBO at different layer thicknesses for the ABS polymer.
Longitudinal Build Orientation
Infill percentagesUTS(mean)
(MPa)
UTS(SQRT Error Mean)
(MPa)
Δ(mean)
(%)
Δ(SQRT Error Mean)
(%)
E(mean)
(MPa)
E(SQRT Error Mean)
(MPa)
40%21.410.350.450.023104516.82
60%22.860.190.360.021126611.33
80%23.270.470.280.006145529.30
100%320.710.230.002228528.06
Transverse Build Orientation
Infill percentagesUTS(mean)
(MPa)
UTS(SQRT Error Mean)
(MPa)
Δ(mean)
(%)
Δ(SQRT Error Mean)
(%)
E(mean)
(MPa)
E(SQRT Error Mean)
(MPa)
40%60.430.090.004114460.37
60%7.50.400.110.005127149.15
80%12.80.400.160.024151248.07
100%200.610.220.018175051.02
Table 6. Temperature influences UTS, Δ, and E values for ABS samples printed in the LBO and TBO at different layer thicknesses for ABS polymer.
Longitudinal Build Orientation
Nozzle temperatureUTS(mean)
(MPa)
UTS(SQRT Error Mean)
(MPa)
Δ(mean)
(%)
Δ(SQRT Error Mean)
(%)
E(mean)
(MPa)
E(SQRT Error Mean)
(MPa)
220 °C22.60.270.240.019188170.42
240 °C32.421.360.260.005201243.01
260 °C38.750.340.300.005233113.50
280 °C35.190.220.3180.027211390.92
Transverse Build Orientation
Nozzle temperatureUTS(mean)
(MPa)
UTS(SQRT Error Mean)
(MPa)
Δ(mean)
(%)
Δ(SQRT Error Mean)
(%)
E(mean)
(MPa)
E(SQRT Error Mean)
(MPa)
220 °C8.960.510.070.001179374.95
240 °C9.660.620.080.005198813.59
260 °C19.030.610.220.018178851.02
280 °C7.850.130.100.017162635.21
Table 7. Effects of the infill percentage on UTS values obtained from experiments, ROM, and MROM with relative error percentages for ABS samples printed in the LBO.
Infill (%)Experimental UTS (LBO)Calculated UTS from ROM (LBO)Calculated UTS from MROM (LBO)Error (%) ROMError (%) MROM
4021.419.021.411.30.12
6022.922.322.82.70.40
8023.325.023.27.10.40
10032.033.531.94.50.25
Table 8. Effects of the infill percentage on UTS values obtained from experiments, ROM, and MROM with relative error percentages for ABS samples printed in the TBO.
Infill (%)Experimental UTS (TBO)Calculated UTS from ROM (TBO)Calculated UTS from MROM (TBO)Error (%) ROMError (%) MROM
406.09.86.063.30.01
607.510.27.535.70.43
8012.810.712.816.10.04
10020.019.720.01.80.22
Table 9. Effects of the infill percentage on UTS values obtained from experiments, ROM, and MROM with relative error percentages for ABS samples printed in the TBO for infills from 40% to 100% with 10% increments.
Infill (%)Experimental UTS (TBO)Calculated UTS from ROM (TBO)Calculated UTS from MROM (TBO)Error (%) ROMError (%) MROM
406.09.86.063.30.01
507.010.06.440.49.87
607.510.27.535.70.43
708.210.58.527.43.05
8012.810.712.816.10.04
9015.311.114.527.35.55
10020.019.720.01.80.22
Disclaimer/Publisher’s Note: The statements, opinions and data contained in all publications are solely those of the individual author(s) and contributor(s) and not of MDPI and/or the editor(s). MDPI and/or the editor(s) disclaim responsibility for any injury to people or property resulting from any ideas, methods, instructions or products referred to in the content.

