4.1. Experimental Settings
Datasets. To demonstrate the superiority and effectiveness of our proposed tuning-free VTG-GPT framework, we conduct extensive experiments on three publicly available datasets: QVHighlights [
1], Charades-STA [
37], and ActivityNet-Captions [
38], as these datasets encompass diverse types of videos.
QVHighlights consists of 10,148 distinct YouTube videos, each accompanied by human annotations that include a textual query, a temporal segment, and frame-level saliency scores. Here, the saliency scores serve as the output for the highlight detection (HD) task, quantifying the relevance between a query and its corresponding frames. QVHighlights encompasses a wide array of themes, ranging from daily activities and travel in everyday vlogs to social and political events in news videos. For evaluation, Moment-DETR [
1] allocates 15% of the data for validation and another 15% for testing, with consistent data distribution across both sets. Due to limitations on the online test server (
https://codalab.lisn.upsaclay.fr/competitions/6937, accessed on 1 September 2023) allowing a maximum of five submissions, all our ablation studies are conducted on the validation split.
Charades-STA, derived from the original Charades [
39] dataset, includes 9848 videos of human indoor activities, accompanied by 16,128 annotations. For this dataset, a standard split of 3720 annotations is specifically designated for testing.
ActivityNet-Captions, built upon the raw ActivityNet [
40] dataset, comprises 19,994 long YouTube videos from various domains. Since the test split is reserved for competitive evaluation, we follow the setup used in 2D-TAN [
16], utilizing 17,031 annotations for testing.
Metrics. To effectively evaluate performance on VTG, we employ several metrics, including Recall-1 at Intersection over Union (IoU) thresholds (R1@m), mean average precision (mAP), and mean IoU (mIoU). R1@m measures the percentage of queries in the dataset where the highest-scoring predicted segment has an IoU greater than m with the ground truth. mIoU calculates the average IoU across all test samples. For a fair comparison, our results on the QVHighlights dataset report R1@m with m values of 0.5 and 0.7, mAP at IoU thresholds of 0.5 and 0.75, and the average mAP across multiple IoU thresholds [0.5:0.05:0.95]. For the Charades-STA dataset, we report R1@m for m values of 0.3, 0.5, and 0.7, along with mIoU. Finally, we employ mAP and HIT@1 to evaluate the results of HD, thereby measuring the query-frame relevance. Here, HIT@1 represents the accuracy of the highest-scoring frame.
Implementation details. To mitigate video information redundancy, we downsample QVHighlights and Charades-STA datasets to a frame rate of 0.5 per second. Considering the extended duration of videos in the ActivityNet-Captions, we extract one frame every three seconds. In the image captioning stage, we utilize MiniGPT-v2 [
6] based on the LLaMa-2-Chat-7B [
4]. For query debiasing, we employ Baichuan2-7B-Chat [
5], also based on LLaMa-2 [
5], generating five debiased queries (
) per instance. The temperature coefficients for MiniGPT-v2 and Baichuan2 are set at 0.1 and 0.2, respectively. Drawing from the preliminary experiments in
Section 3.4, we select Sentence-BERT [
35] as our similarity model to evaluate query-frame correlations using cosine similarity. The histogram in our proposal generator is configured with ten bins (
), with a selection of the top eight values (
) and a continuity threshold
. During the post-processing phase, the balance coefficient (
) in the proposal scorer is set to 0.5, and the IoU threshold (
) for non-maximum suppression (NMS) is determined at 0.75. All pre-processing and experiments are conducted on eight NVIDIA RTX 3090 GPUs. It is important to note that our VTG-GPT is purely inferential, involving no training phase.
4.2. Comparisons to the State-of-the-Art
In this section, we present a comprehensive comparison of our VTG-GPT with state-of-the-art (SOTA) methods in VTG. Firstly, we disclose results on the QVHighlights validation and test splits, as shown in
Table 2. The approaches are categorized into fully supervised (FS), weakly supervised (WS), unsupervised (US), and zero-shot (ZS) methods. Notably, VTG-GPT significantly outperforms the previous SOTA zero-shot model (Diwan et al. [
2]), demonstrating substantial improvements across five metrics. Specifically,
[email protected] saw an increase of +7.49 and
[email protected] improved by +7.23. Remarkably, VTG-GPT also vastly exceeds all WS methods. Most impressively, our approach surpasses the FS baseline (Moment-DETR [
1]) in most metrics, even achieving competitive performance compared with FS methods. Unlike these methods, VTG-GPT requires only a single inference pass, eliminating the need for training data and resources.
Subsequently, we report the performance on the Charades-STA test set and ActivityNet-Captions test set in
Table 3. In Charades-STA, VTG-GPT surpasses the SOTA zero-shot method (Luo et al. [
23]) with a +5.81 increase in
[email protected] and a +1.89 improvement in mIoU. Furthermore, VTG-GPT significantly outperforms the best US method (Kim et al. [
21]) across all metrics. However, on the ActivityNet-Captions dataset, our method falls slightly behind Luo et al. in two metrics, which we attribute to the high downsampling rate used for this dataset. Moreover, VTG-GPT approaches the performance of the fully supervised Moment-DETR, validating its capacity to handle diverse and complex video contexts without any training or fine-tuning. This underscores the robustness and adaptability of VTG-GPT in zero-shot VTG scenarios, demonstrating its potential as a versatile and efficient tool for video understanding.
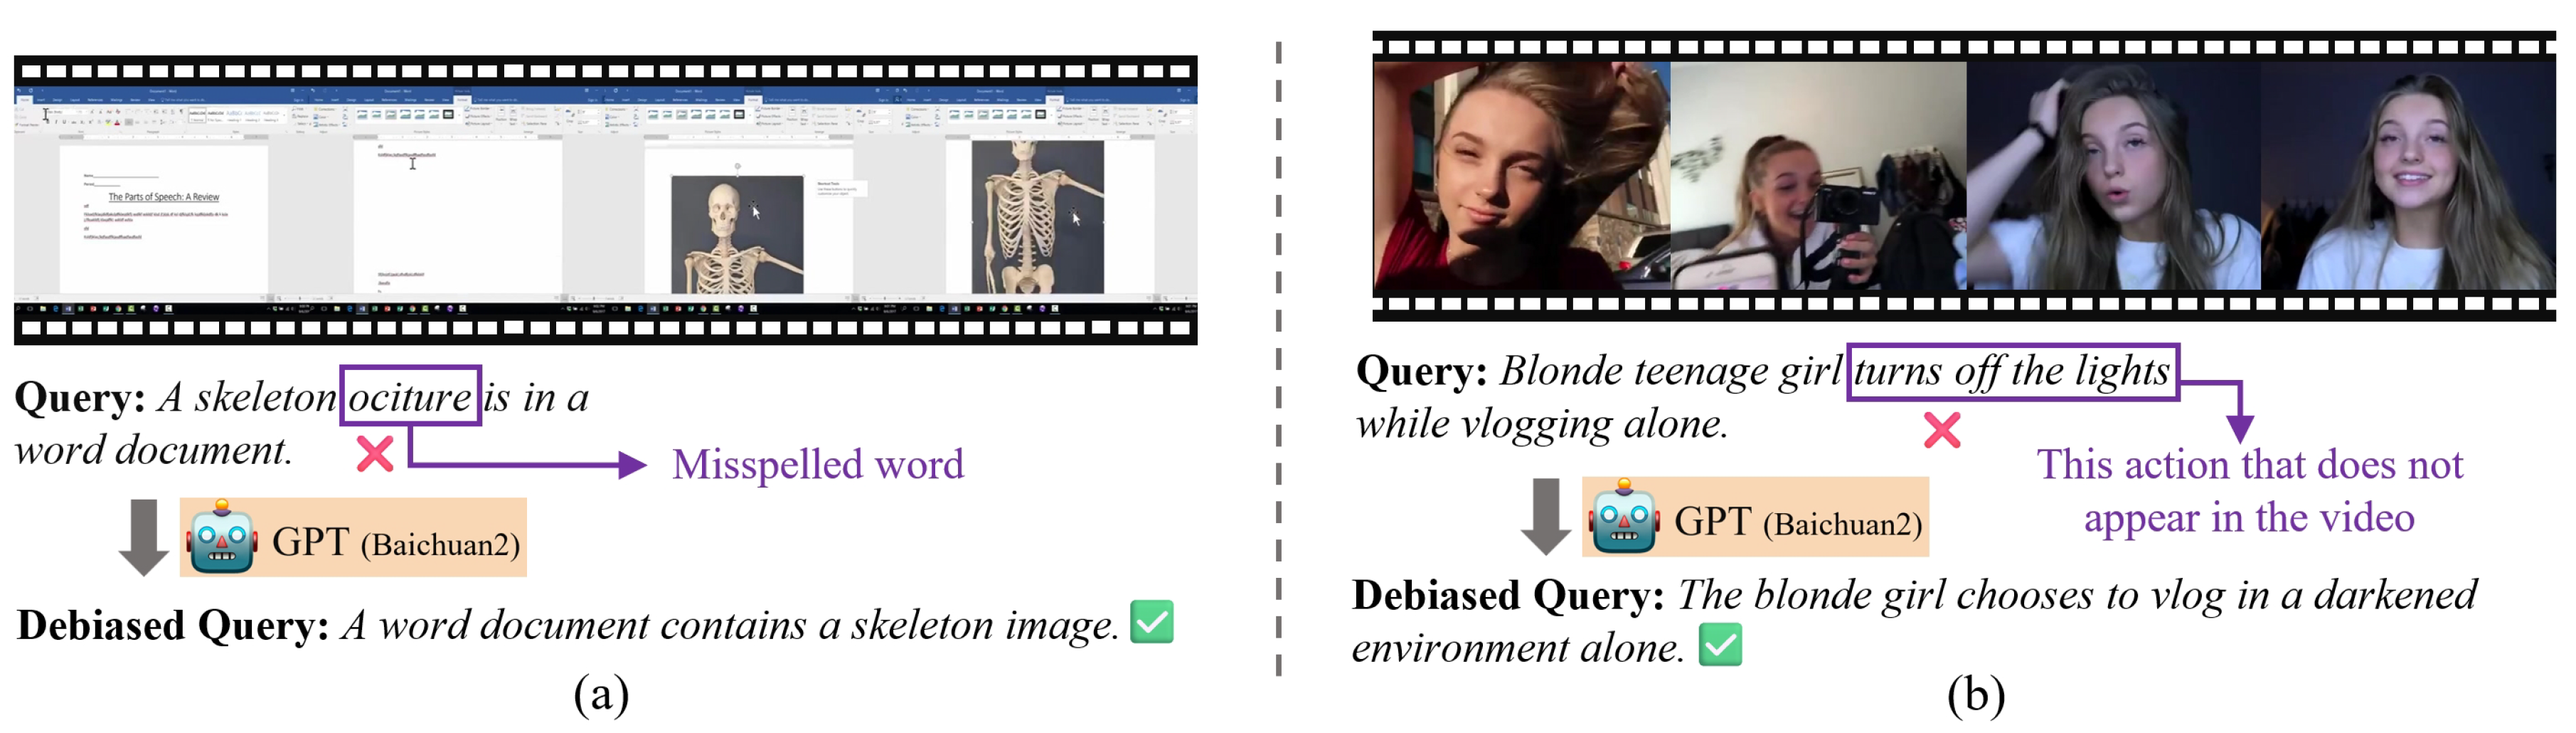
To qualitatively validate the effectiveness of our VTG-GPT model, we present visual comparisons of grounding results from the Ground-Truth (GT), Moment-DETR, and VTG-GPT in
Figure 5. Observations indicate that the tuning-free VTG-GPT achieves more precise localization than the supervised Moment-DETR. The primary reason is that Moment-DETR relies solely on the original queries, which contain human-annotated errors, thus failing to fully align with the video’s semantic information. In contrast, VTG-GPT can correct erroneous queries and reduce the bias introduced by human annotations, leading to more accurate grounding. To be more specific, in
Figure 5a, our model detects a spelling mistake in the query, where “
ociture” is corrected to “
image” or “
picture”. In
Figure 5b, the action “
turns off” is refined to terms more congruent with the video context, such as “
lights off”, “
darkened environment”, and “
no lights”. Additionally, the five rephrasings of each original query, in contrast to the original phrasing, exhibit more flexible grammatical structures, enabling the text encoder to comprehensively capture the semantic information of the original query.
4.3. Ablation Studies
To demonstrate the effectiveness of each module within our VTG-GPT framework, we perform in-depth ablation studies on the QVHighlights dataset.
Effect of debiased query. Firstly, we report saliency scores used to evaluate query-frame correlation. As delineated in
Table 4, row three corresponds to VTG-GPT without debiasing, where we directly employ the similarity generated by Sentence-BERT as the saliency scores. Conversely, row four is VTG-GPT with debiasing, wherein we average the similarity of five debiased queries as saliency scores. The comparison reveals that row four significantly outperforms row three, demonstrating the efficacy of our debiasing strategy in mitigating human biases inherent in the original queries. Furthermore, comparing row two (UMT [
9]) and row four, our VTG-GPT achieves a notable increase in HIT@1, recording a score of 62.29 (+2.3). This enhancement underscores VTG-GPT’s superior reasoning capabilities in discerning challenging cases, affirming the value of our debiasing approach in refining model performance.
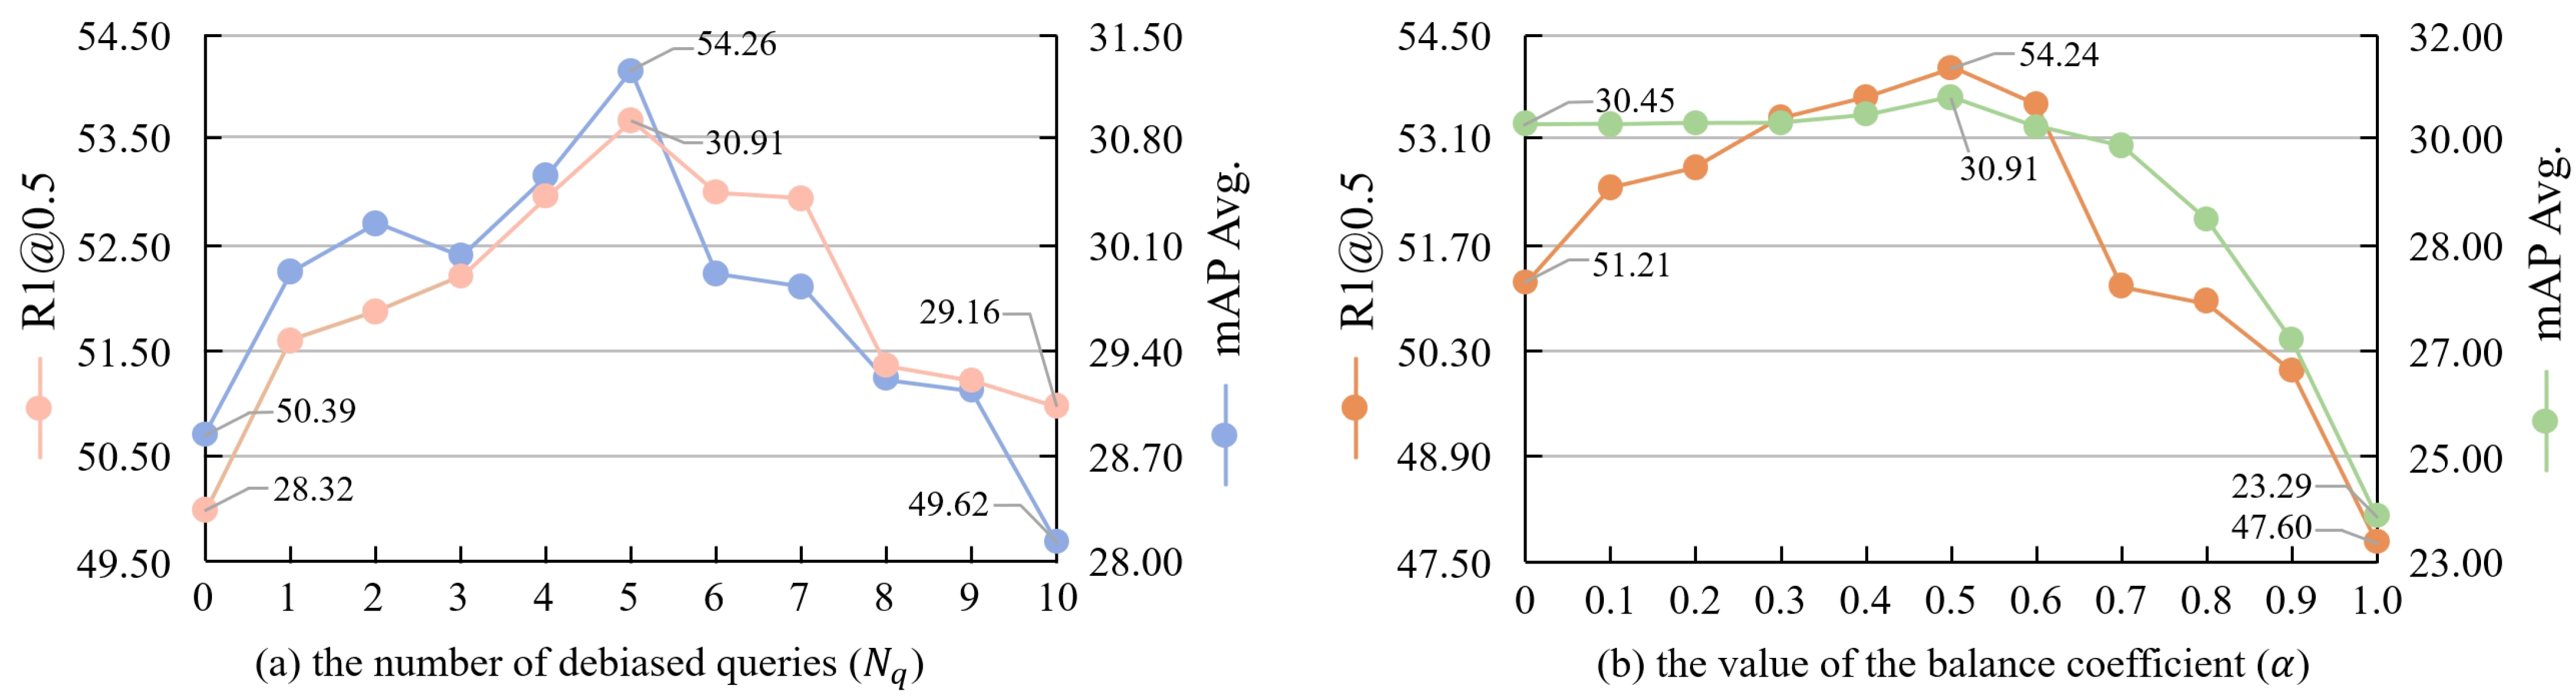
Then, we investigate the impact of different numbers of debiased queries (
) generated by Baichuan2 on the performance of the VTG-GPT model. Our findings, as depicted in
Figure 6a, indicate that the model achieves optimal results when utilizing five debiased queries (
). Compared to using solely the original biased query, implementing five debiased queries resulted in a notable increase in
[email protected] to 54.26 (+3.87) and an improvement in mAP Avg. to 30.91 (+2.59). This evidence suggests that removing bias from queries significantly enhances the model’s accuracy. However, an intriguing observation emerged: the performance metrics decline when
exceeds 5. This pattern suggests that excessive rephrasing does not continually yield improvements, likely due to the finite number of synonymous rewrites and syntactic variations available to maintain the original intent of the query. Over-rephrasing can introduce irrelevant content, deviating from the semantic intent of the raw query, and potentially diminishing model performance. This finding underscores the critical need to balance the number of query rewrites, ensuring that debiased queries capture a spectrum of semantic nuances while retaining the essence of the original query. Future research should focus on developing advanced query debiasing techniques to enhance this equilibrium.
LLMs and LMMs. In
Table 5, we evaluate the capabilities of LLMs (LLaMA-v2 [
4] and Baichuan2 [
5]), alongside LMMs (MiniGPT-4 [
31] and MiniGPT-v2 [
6]) in handling biased queries and generating image captions. A comparison between rows two and five reveals that Baichuan2 outperforms LLaMa-v2, since it is trained on a more diverse dataset and tasks based on LLaMa-v2, enhancing its sentence rewriting capabilities. As illustrated in row three, MiniGPT-v2, also developed on the foundations of LLaMa-v2, shows moderate results in text dialogue. Comparing rows four and five, we observe an improvement in the performance of MiniGPT-v2 over MiniGPT-4. Overall, the results suggest that the integration of Baichuan2 for query debiasing combined with MiniGPT-v2 for image captioning emerges as the most effective strategy. This effectiveness stems from their complementary capabilities: Baichuan2 excels in handling complex multi-turn text dialogues, while MiniGPT-v2 is adept at detailed multimodal dialogues. This synergy maximizes the text comprehension ability of LLMs and the video understanding capacity of LMMs, thereby enhancing the overall performance of our framework.
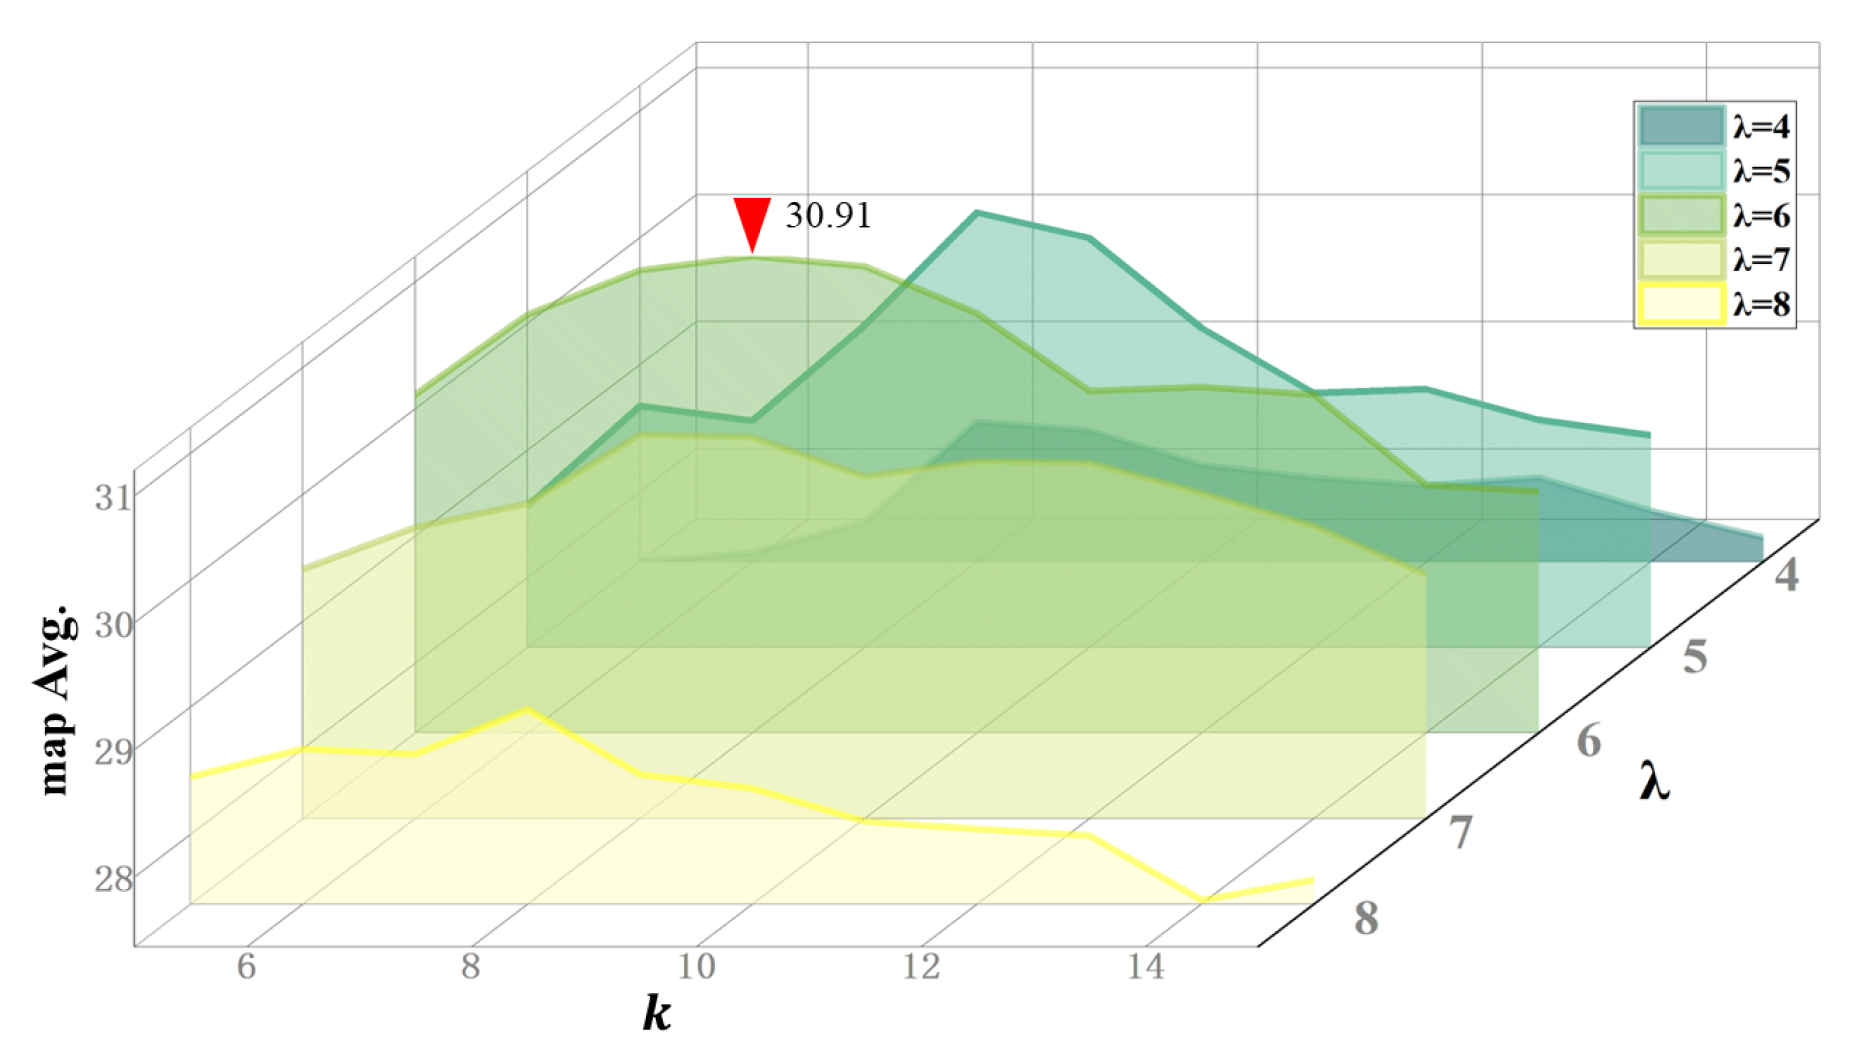
Proposal generator. In our study, top-
k and the continuity threshold
within the proposal generator play a critical role. The parameter
k, acting as a count threshold in our dynamic mechanism, directly influences the identified length of relevant proposals. In contrast,
determines the number of irrelevant consecutive frames. To optimize these parameters, we conducted a series of ablation experiments on the proposal generator, as illustrated in
Figure 7. The visualized results indicate that a combination of
and
yields the most favorable outcomes. This specific pairing strikes a balance between segment length and threshold sensitivity. It skillfully avoids the drawbacks of excessively low thresholds, which could incorporate irrelevant frames into prediction results. Simultaneously, it averts the "tolerance trap" where an overly high number of discontinuous frames makes it difficult to determine when the segment ends.
Proposal scorer. To balance the quality and length of segments, we conduct experiments on our proposal scorer, as shown in
Figure 6b. We explore integrating the length score
into the scoring mechanism. Initially, without including the length score (
), mAP Avg. is 30.45. Upon incorporating
, mAP Avg. peak at 30.91. Similarly,
[email protected] increases from 51.21 to 54.24, indicating that incorporating a length-based scoring mechanism is crucial for generating the final segment scores.
IoU threshold . Finally, we assess the effectiveness of IoU thresholds
in the NMS process, focusing on their role in reducing segment overlap. It is important to note that NMS does not alter the values of
[email protected] and
[email protected]. Therefore, we report only the mAP metrics in
Table 6. As illustrated in
Table 6, setting
to 0.75, compared to not employing NMS (
), results in an increase of +0.53 in mAP Avg. This increment underscores the significance of eliminating excessively overlapping segments, affirming that reducing such overlaps can notably enhance the model’s performance.


