Article

Investigation of Heat and Moisture Transfer during the Drying of Packed-Bed Porous Media in Soybeans

School of Environment and Energy Engineering, Anhui Jianzhu University, Hefei 230009, China
*
Author to whom correspondence should be addressed.
Appl. Sci. 2024, 14(5), 1935; https://doi.org/10.3390/app14051935
Submission received: 6 February 2024 / Revised: 20 February 2024 / Accepted: 22 February 2024 / Published: 27 February 2024

Abstract

:
The research aims to examine the distribution of porosity and the combined heat and moisture movement while grains are being dried. This research concerns the porosity and flow of soybeans with different particle size ratios and the drying of soybeans with varying particle temperatures. Due to the similarity in shape between soybeans and balls, this article adopts a ball shape to study the heat and moisture transfer of soybean particles, which can also be used for the study of grains with similar shapes, such as mung beans and red beans. Random models of soybeans with varying proportions were created using modeling software Edem and UG. UDF programming was added to the preprocessing software Fluent to analyze the porosity, airstream allocation, and the interaction of temperature and moisture transfer in packed beds with various cylinder-to-particle size ratios and particle temperatures. A packed bed of soybeans was created, and the study examined the impact of cylinder-to-particle size ratios of 4.44, 5.6, and 6.25 on porosity. The results show that the radial porosity in the packed bed displays a fluctuating profile, with partial porosity increasing as the cylinder-to-particle size ratio increases. Increasing the ratio of cylinder size to particle size exacerbated the tortuosity of the flow paths within the packed bed. Simultaneously, the particle temperature increases, leading to a rise in the instantaneous heat transfer during the drying process, strengthening the ratio of moisture transfer within the packed bed. The method effectively models during convective heat and mass transfer in the liquid facies, as well as thermal and mass spread in the solid facies. The results of this study have been validated on physical models. The air temperature of 273 K is considered during the simulation process

1. Introduction

In grain storage, local heating and mold often occur in the grain warehouse [1,2,3]. The local temperature and moisture levels of grains vary significantly with the external environment, and stored grains present risks [4,5]. Although global food production has been increasing, improper storage and management methods after harvest result in approximately 9% of food loss each year. Therefore, it is important to prioritize food control [6]. Grain drying refers to the removal of moisture from fresh grains for storage purposes [7]. The phenomenon is related to the heat and mass transfer within the particle packed bed and is also influenced by the drying medium. The drying of particle-packed beds has been widely used in agriculture, chemical processes, and nuclear reactors [8,9]. The porosity of grain piles is a critical factor that influences heat transfer and water movement during the drying process [10]. Furthermore, damaged grains are more vulnerable to insect and mold infestation, which can result in localized heating within the grain pile. The current research primarily focuses on using continuous media to study heat and mass transfer phenomena in porous media, per Mandas et al. [11].
The study aims to investigate the impact of varying cylinder-to-particle size ratios and particle temperatures on heat and moisture transfer during soybean drying. The Discrete Element Method (DEM) was used to simulate three different structures with cylinder-to-particle size ratios of 4.44, 5.6, and 6.25. This study examined the porosity and local flow within a packed bed, and investigated the impact of particle temperature on heat and mass transfer parameters during the drying process. This study takes soybeans as an example, and the same drying method is also applicable to the drying of grains such as wheat, barley, corn, and rice
Due to the use of a spherical soybean model, in order to facilitate better particle filling, a cylindrical stacking bed is used for stacking, making it more compact and space saving. The expected drying method introduces 2 h and 3 h of hot air into the tube and observe its drying effect.

2. Methodology

2.1. Model Building

The randomly packed model was generated using the discrete element method (DEM). To minimize the geometric deviation, we applied the composite particle method of Bai et al. [12]. This approach, which involves the assembly of numerous small spheres into cylindrical particles, was adopted despite its high computational cost and the need to consider actual contact behavior [13]. Precise filling structures can be achieved by using inflexible cylindrical particles that are arbitrarily placed within the tubular fluid domain and settle to the bottom of the tube under the action of gravity. For each particle, a force equilibrium is formulated and solved in consideration of the interplay between gravity and the particle along with the relationship between the particle and the pipe wall. The DEM simulation ended when a stable state was reached, which signified that the particle velocity was nearly zero. In studies of three-dimensional packed beds, it is challenging to develop a reliable spherical filling model to simulate the falling, colliding, and friction processes of spheres. The techniques currently employed to establish packed beds are based on DEM.

2.2. DEM Simulation Parameters

The physical packing model is shown in Figure 1. The DEM simulation parameters were set according to Table 1 and Table 2.

3. Simulation Setup

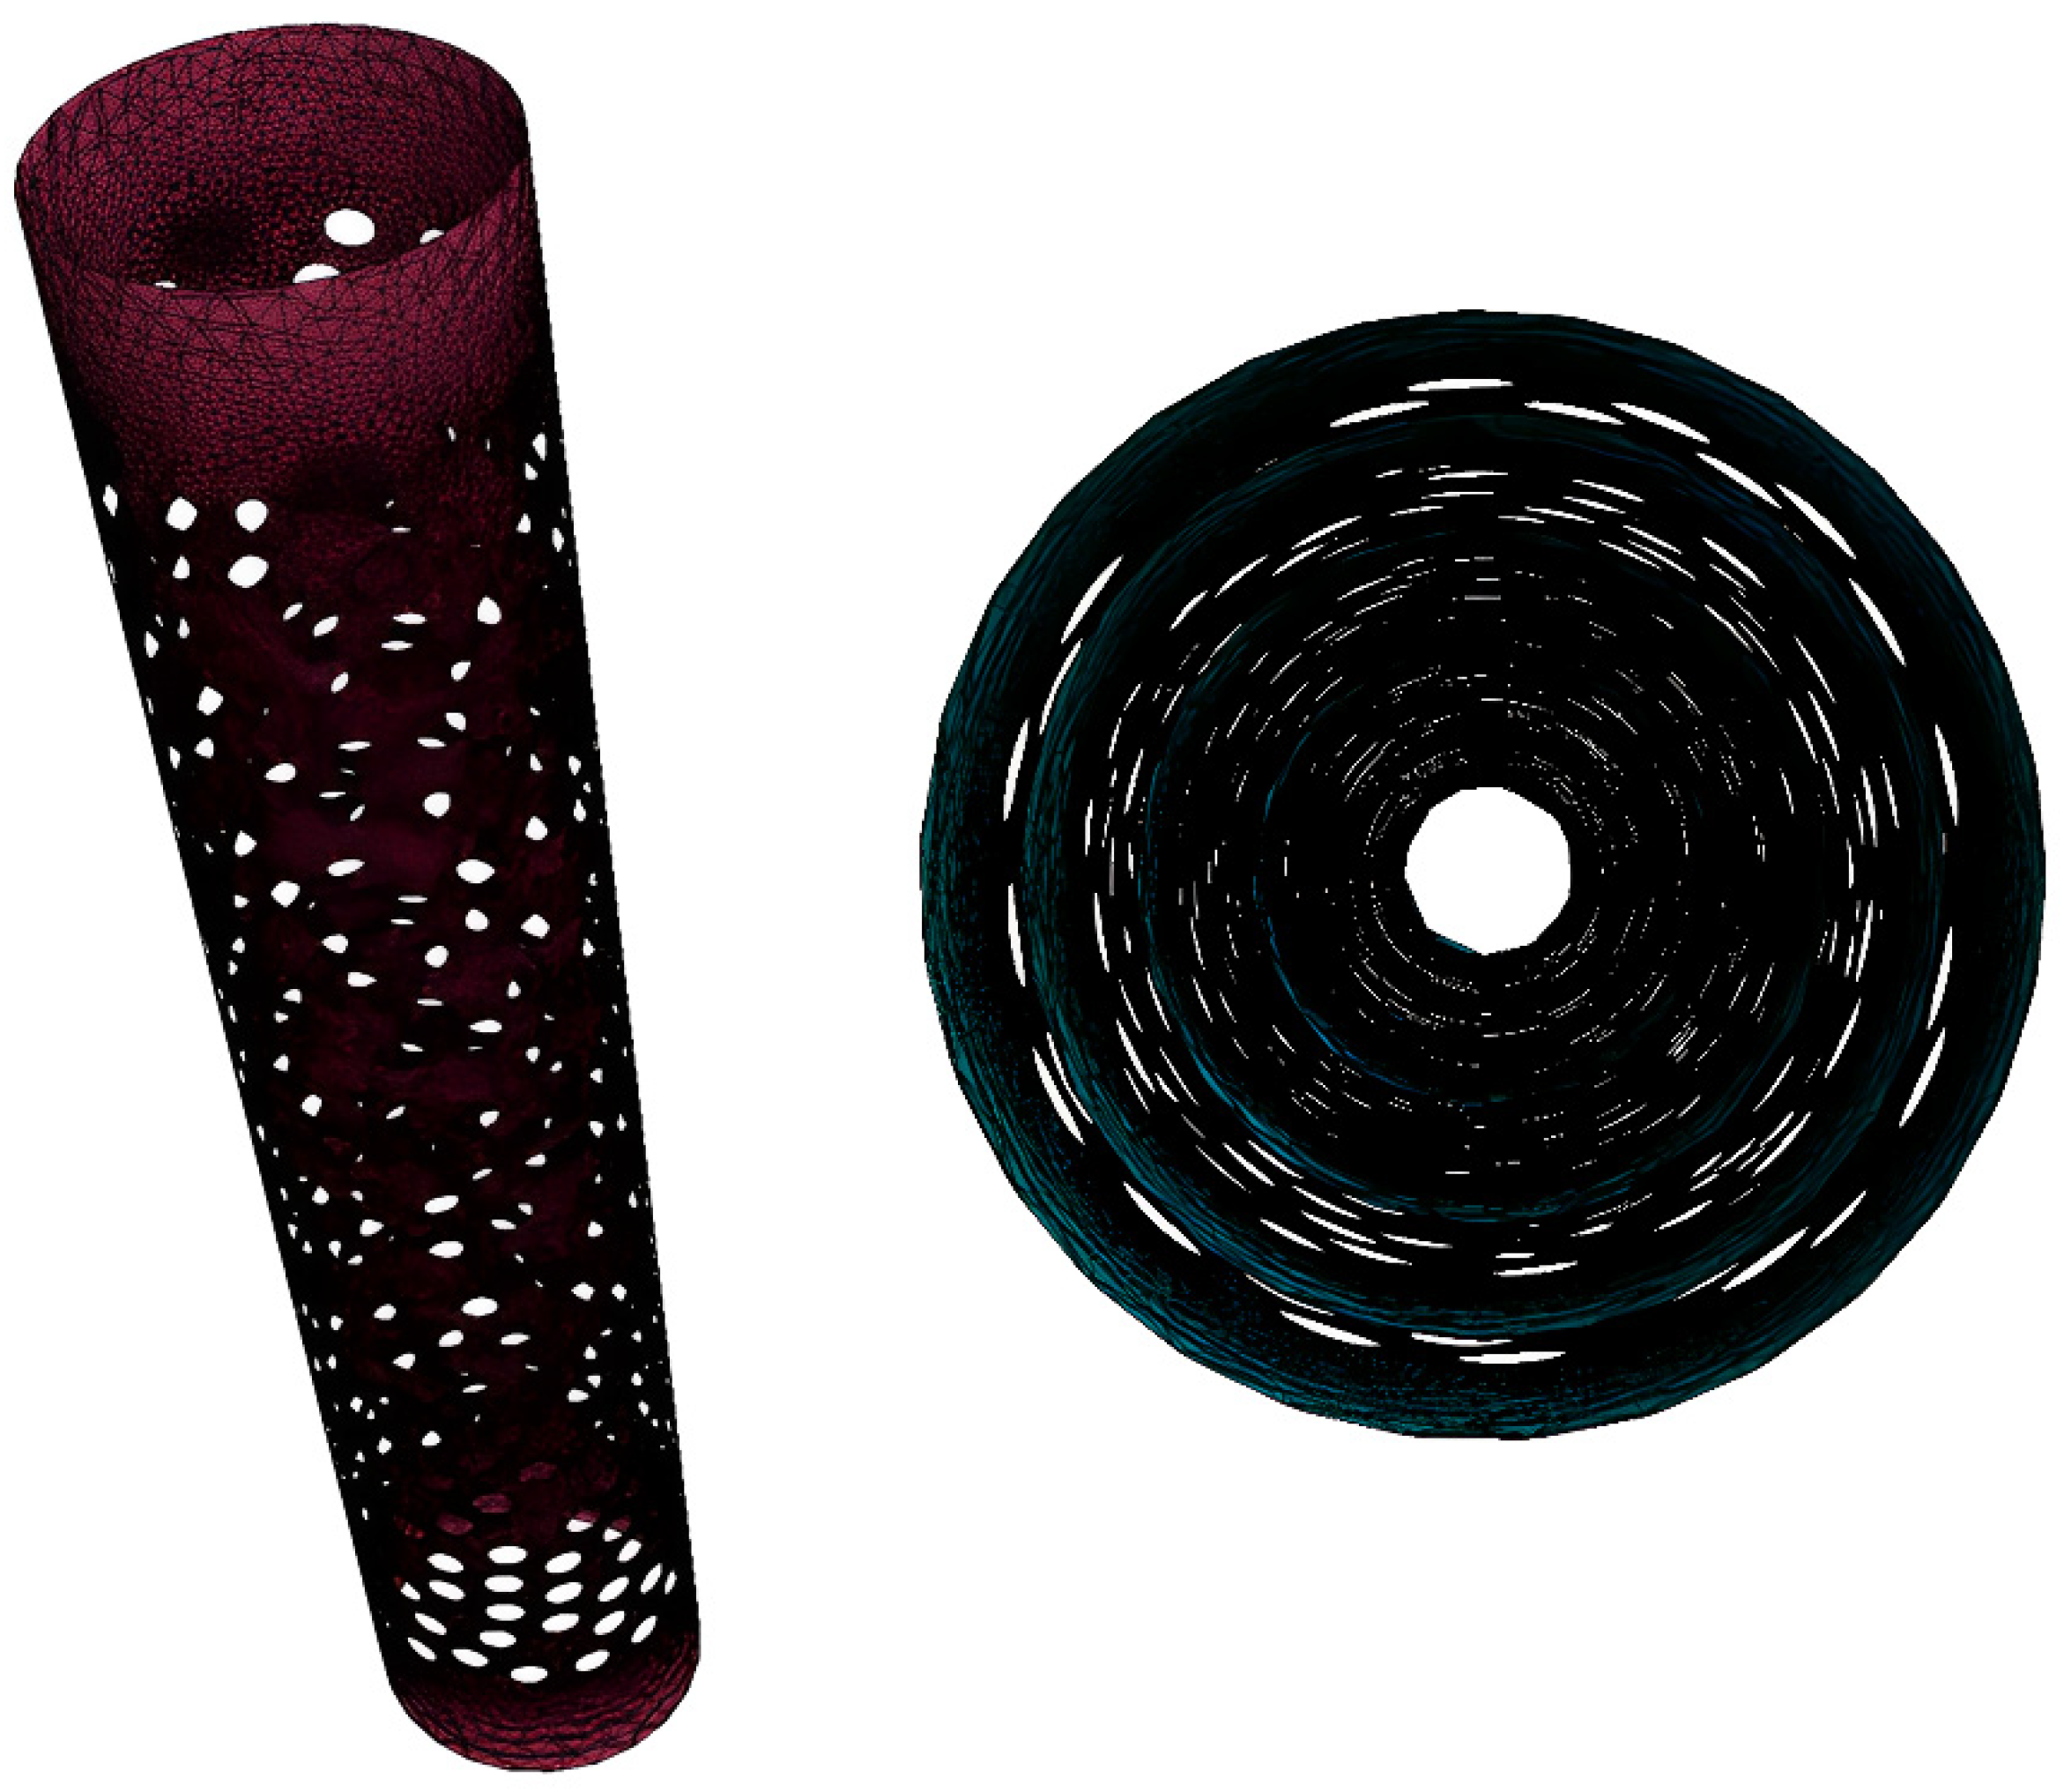
3.1. Geometry and Physical Model

Once the particles have settled, information about the position of each particle (e.g., center of mass, cylinder height, radius, and axial direction) can be extracted. This information was then used to develop a macro-script to create the model of the packed bed; the model consists of the upper reaches section, lower reaches section, and filling section filled with cylindrical particles. As shown in Figure 1, different packing structures are observed for different pipe diameters. In the present study, the tube height was 180 mm, and the values of N were 4.44, 5.6, and 6.25, as illustrated in Figure 1.
The inter-particle and particle–wall surface contact points were processed simultaneously. To determine the porosity distribution within the inner diameter of the stacking bed while accounting for different quantities of particles and methods for treating contact points, the cylindrical radius of the calculation domain was partitioned into 100 segments. Thus, we obtained multiple coaxial cylindrical cross sections, as illustrated in Figure 2. Subsequently, the packed-bed model was computationally meshed to yield grid data.

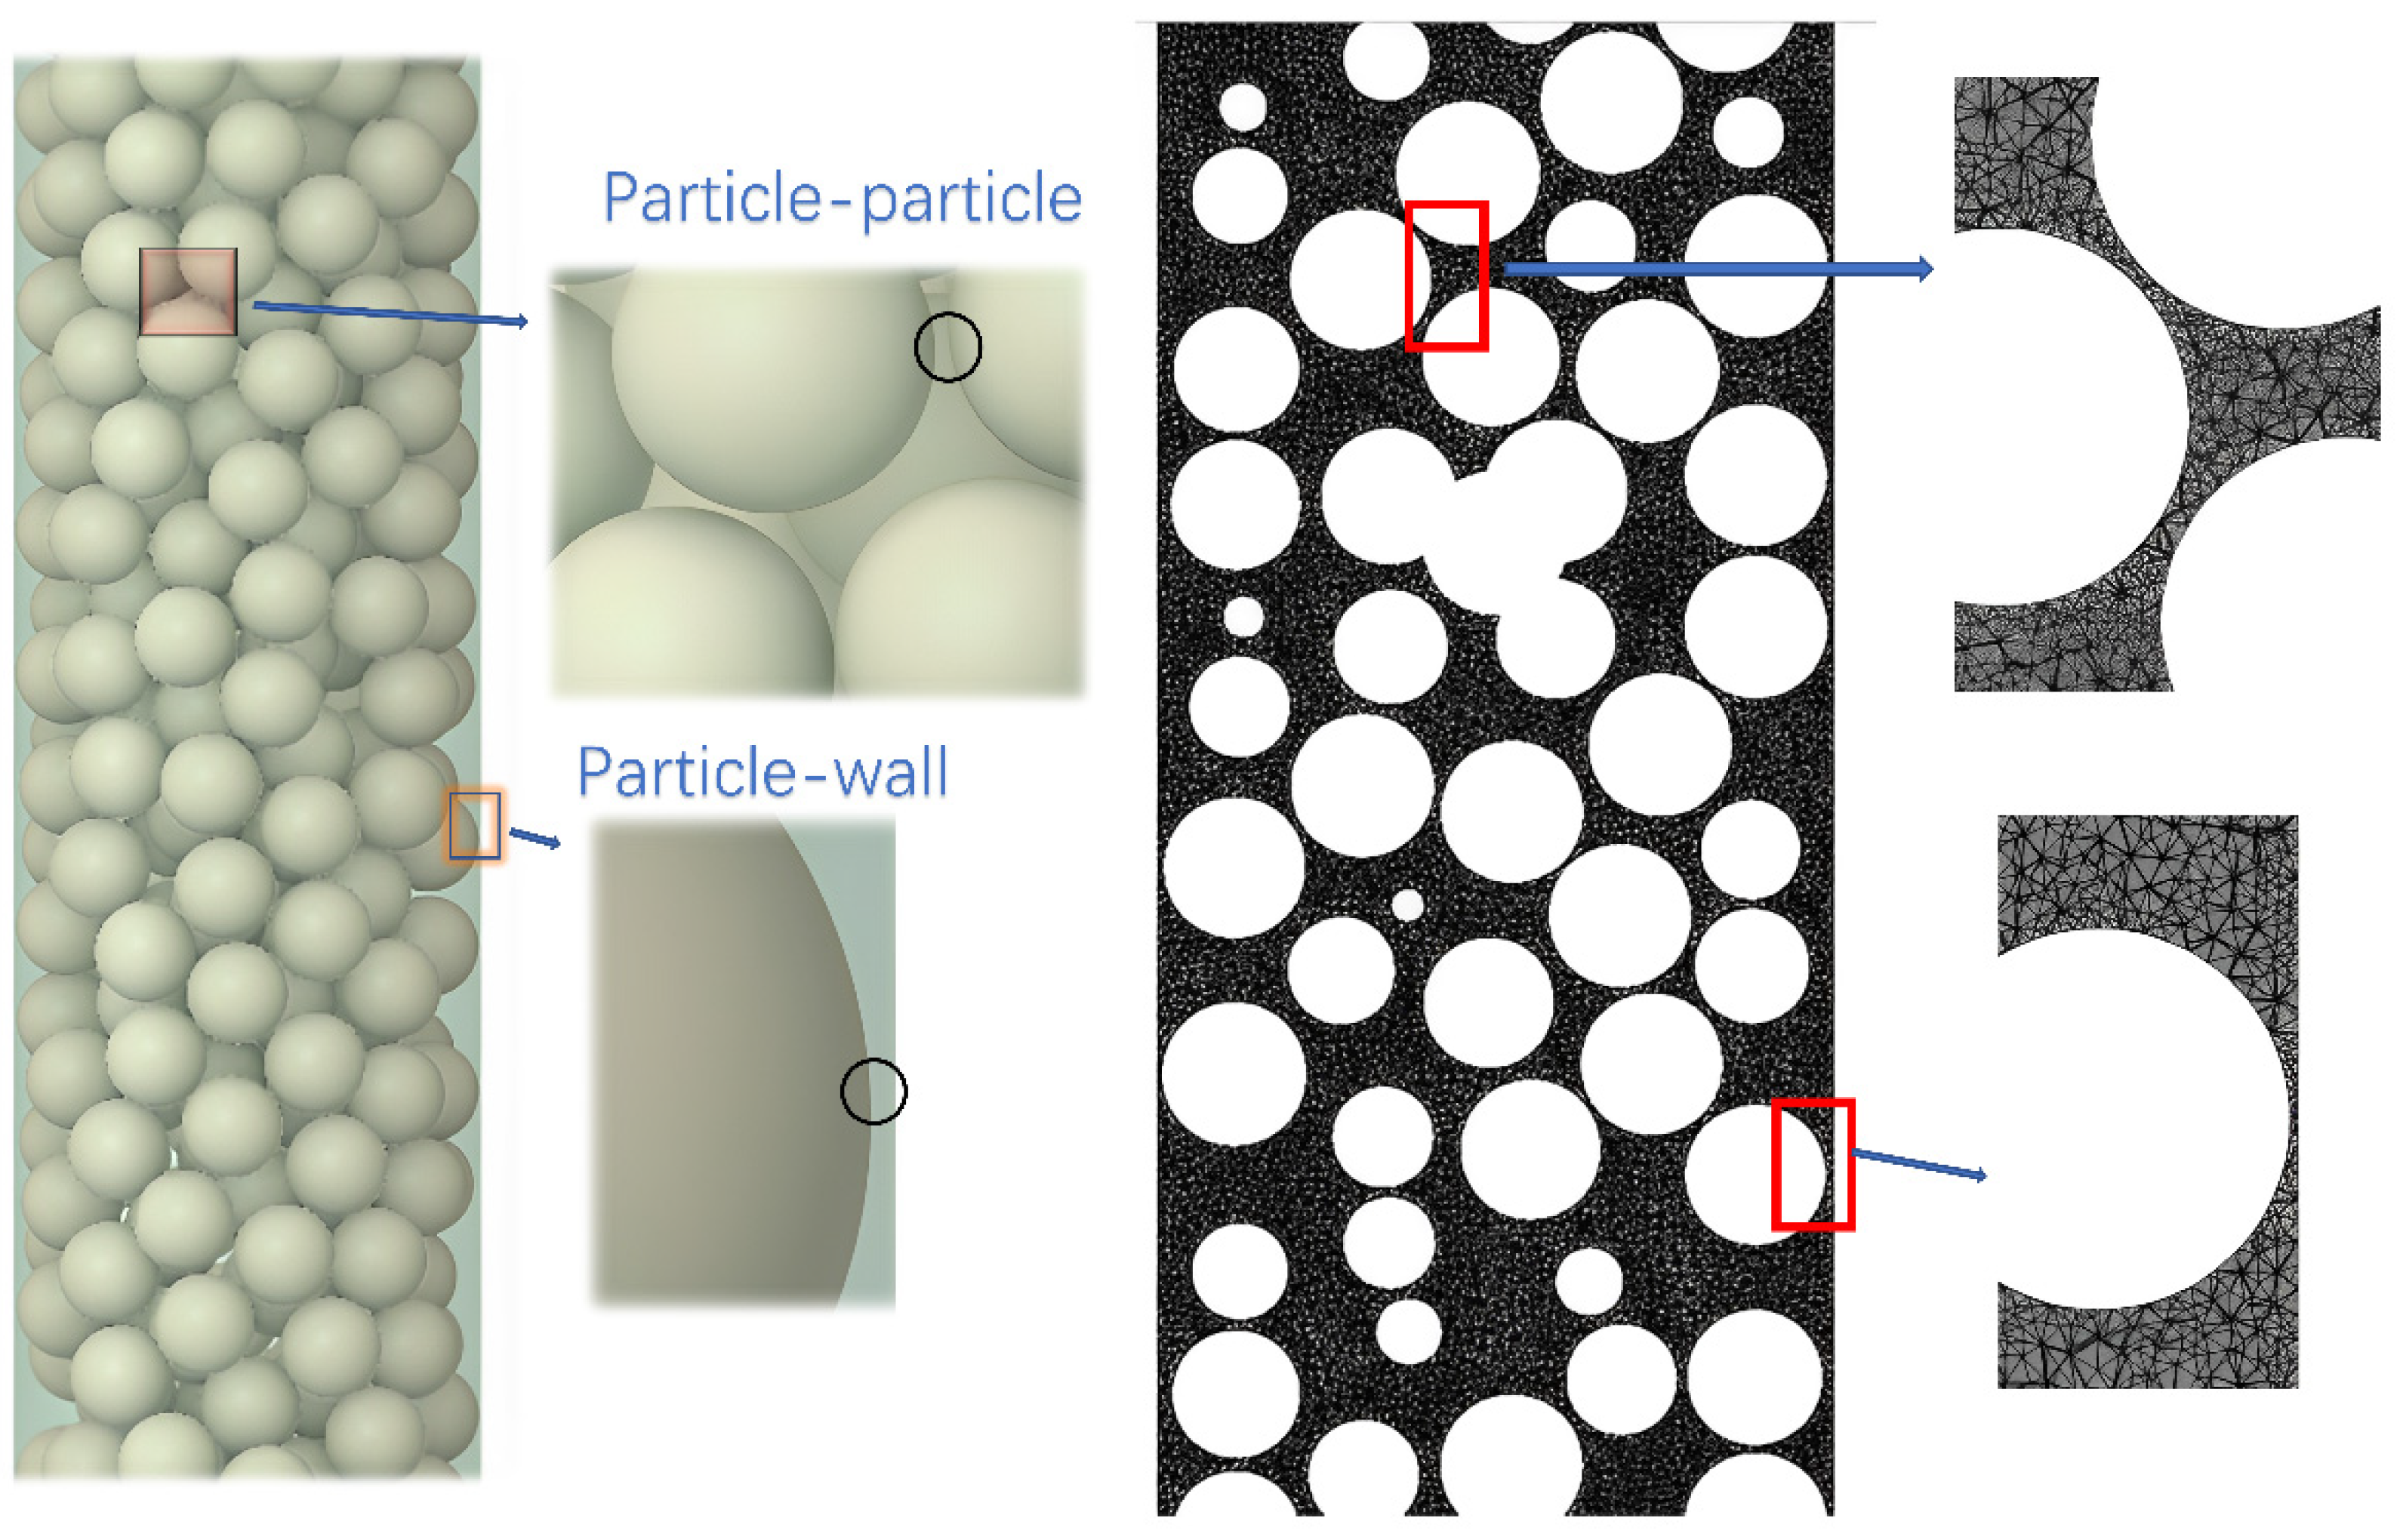
3.2. Accumulation Bed and Particle-to-Particle Contact Point Treatment

Following the creation of a homogeneous mesh covering the complete fluid domain, it became evident that a gradient strategy was necessary. Near the contact points, the pores are very narrow, and the curvature is large, creating voids near the contact points. As a result, direct meshing is insufficient around the contact points and may negatively affect the accuracy of the calculations. Thus, the mesh must be improved to ensure accurate calculation results. The performance around the contact points can be enhanced by using a uniform mesh, although this exponentially increases the computational requirements.
During the random accumulation of particles in the bed, contact occurs between individual particles and also between particles and the surrounding walls. Despite the packed structure of the accumulation bed, it is challenging to generate high-quality meshes in the vicinity of contact points. This difficulty is largely due to the narrow pores and significant curvature near these contact points, which often cause the mesh elements to become highly inclined or even generate negative volumes. Such issues can adversely affect the simulations and compromise the accuracy of the results. Consequently, various strategies have been developed to mitigate the effects of contact points, including the models proposed by Dixon [14,15], Guardo [16], and Kuroki et al. [17]. To minimize the presence of “bridge models”, which refer to the fine and curved calculation meshes that surround contact points, cylindrical contact points can be substituted in those regions. In this study, the “gap model” was used to examine the porosity and flow characteristics in consideration of particle–particle and particle–wall interactions, as illustrated in Figure 3.

4. Results and Discussion

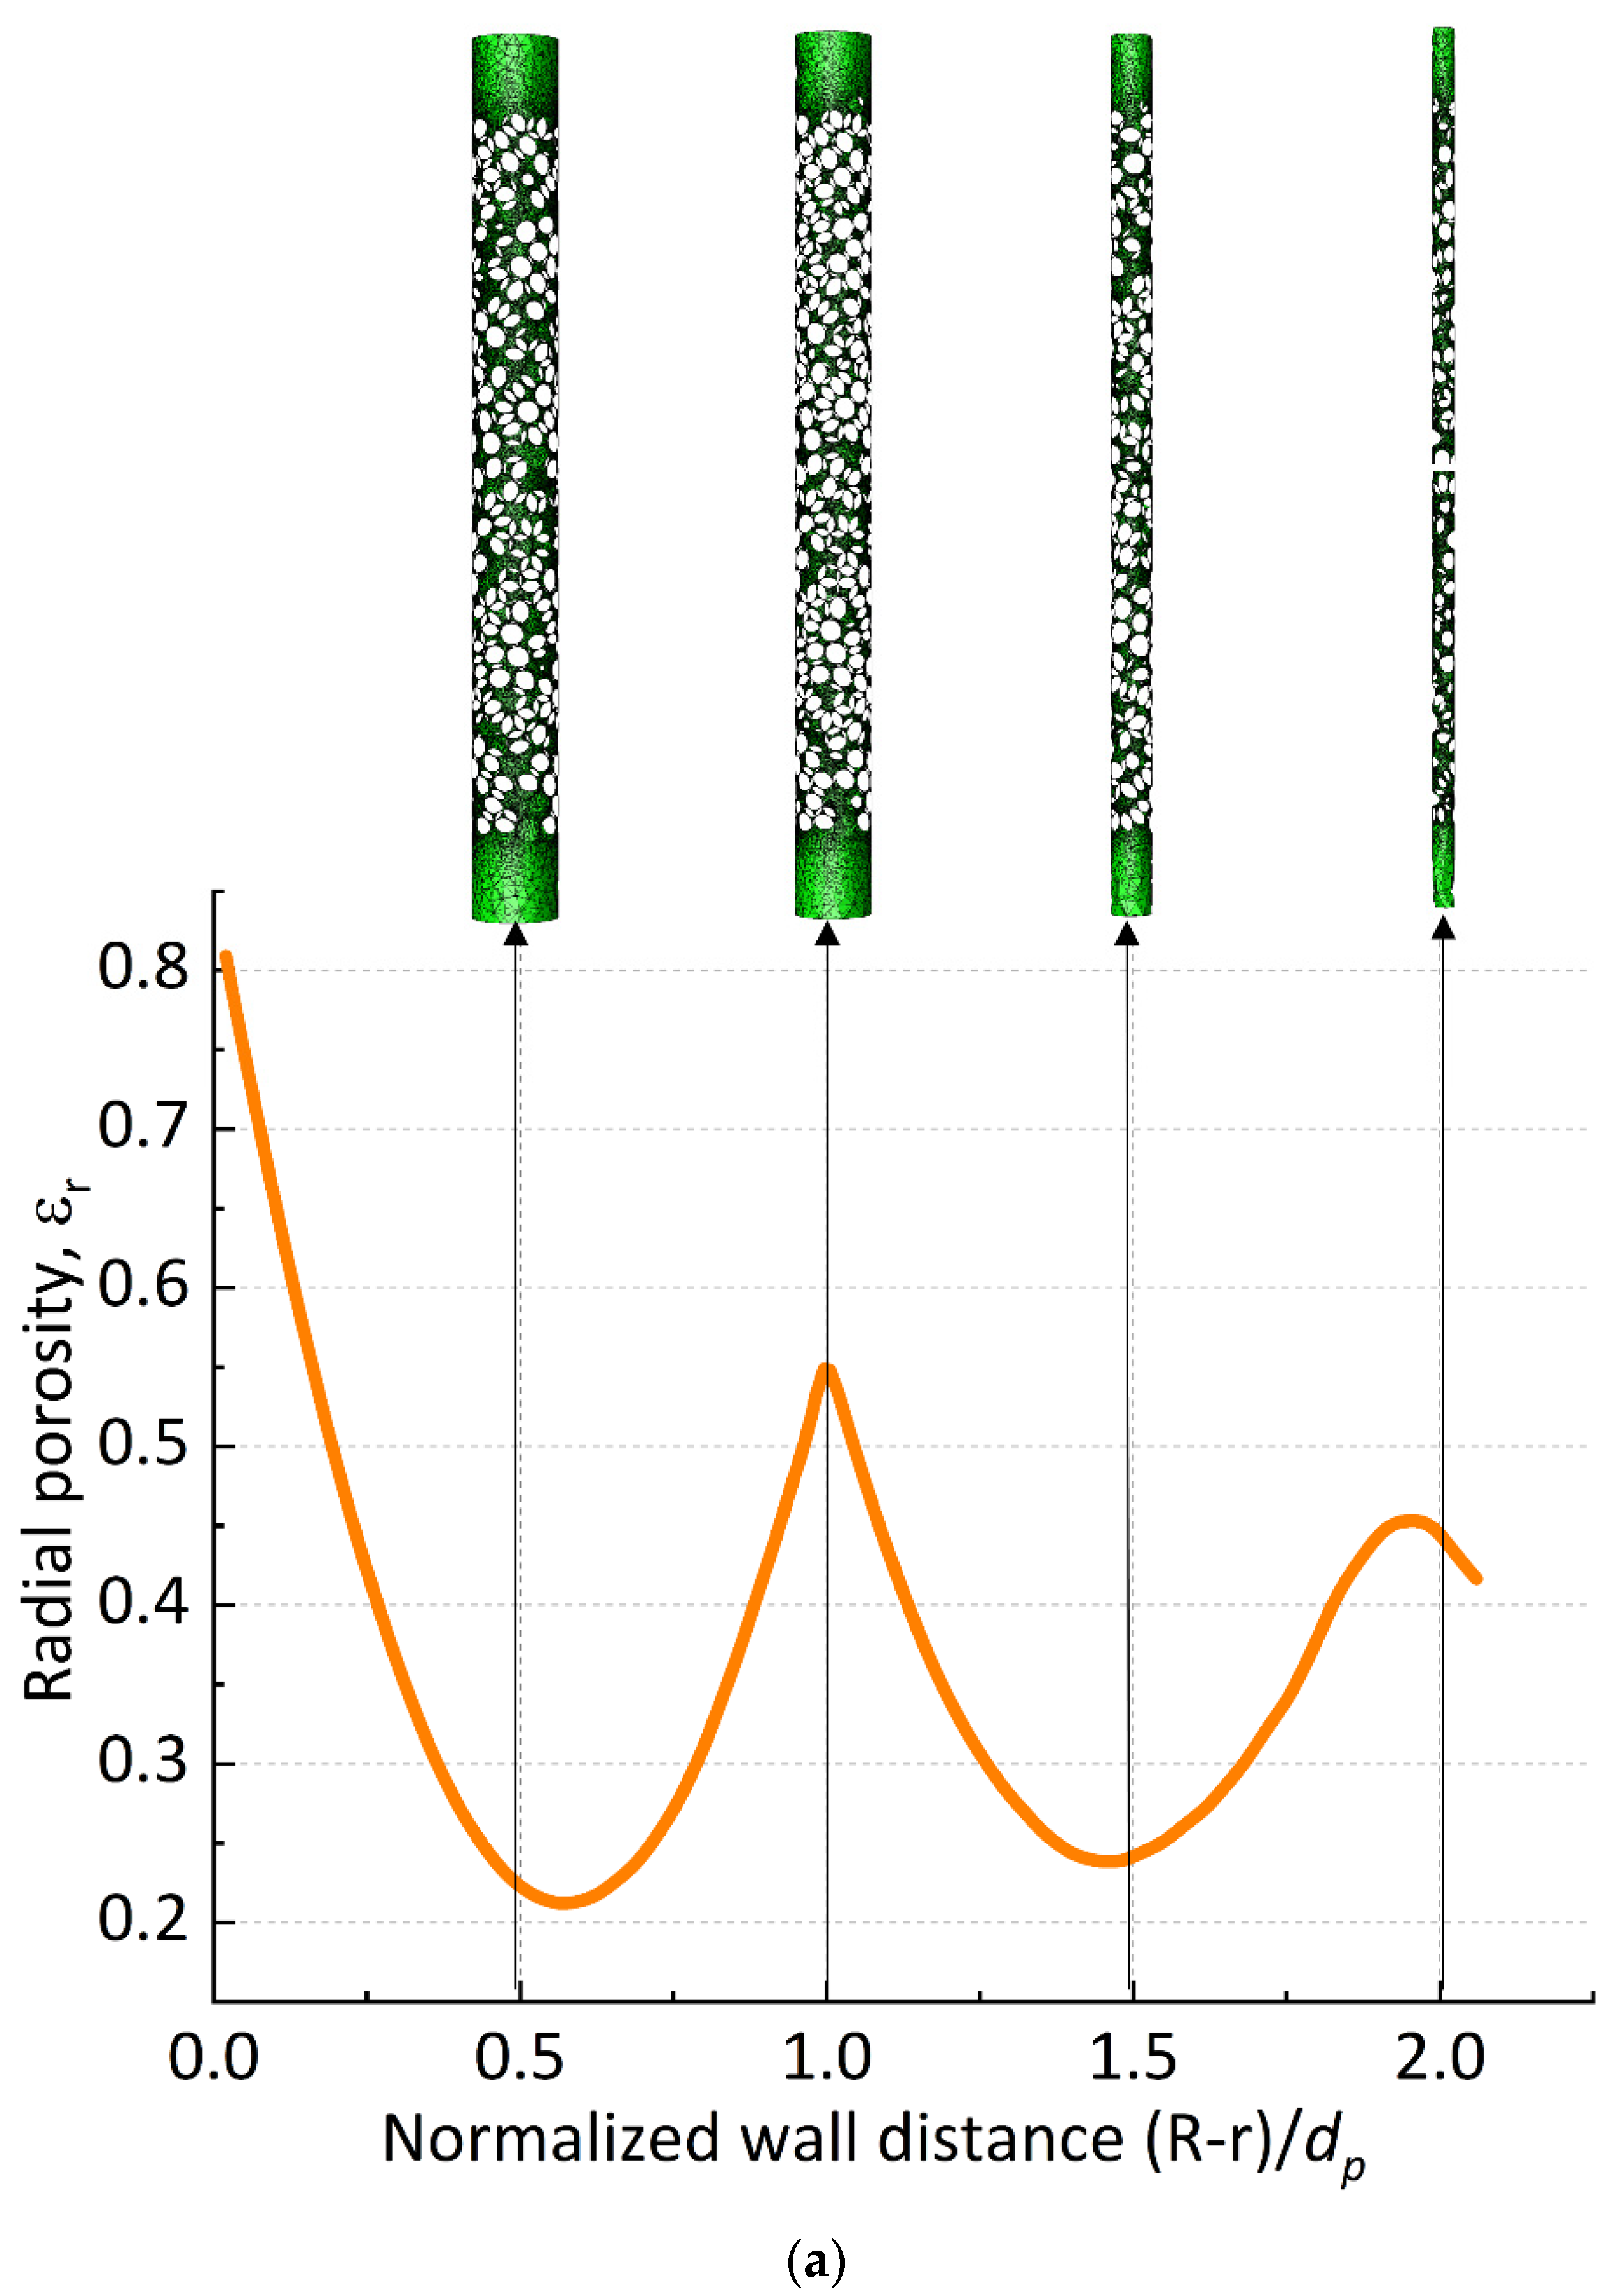
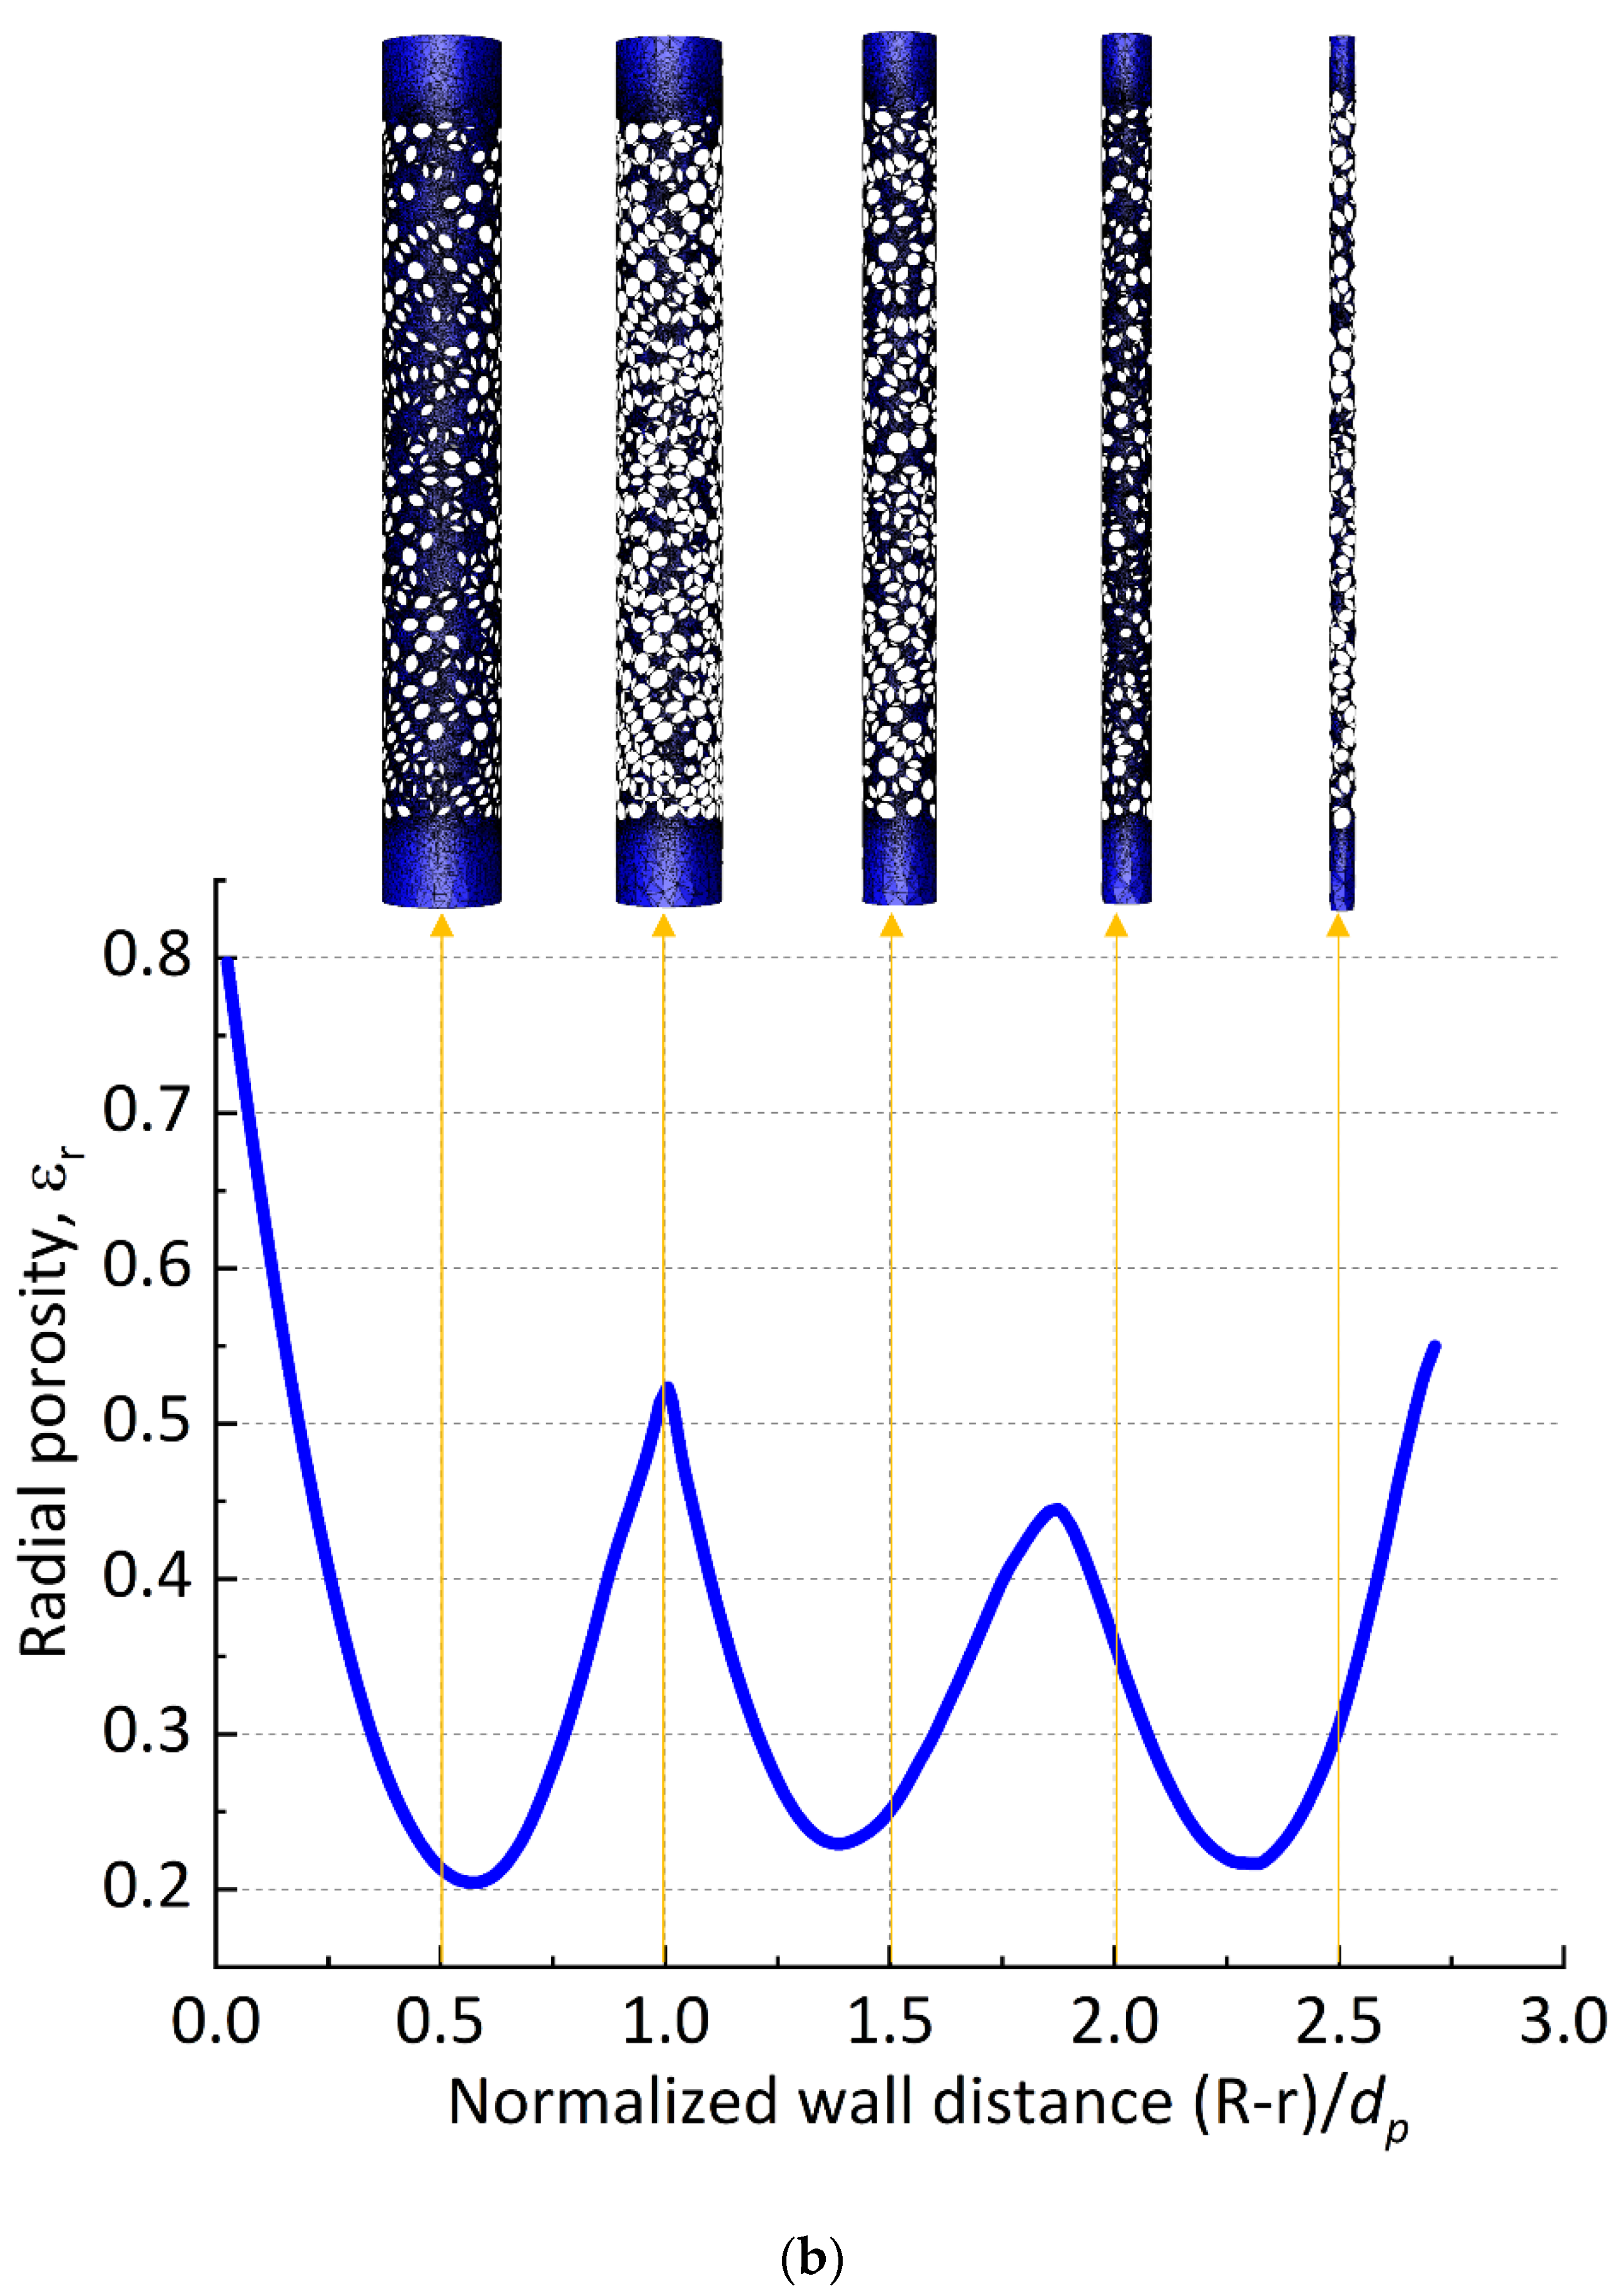
4.1. Radial Porosity Distribution

In the cylindrical area resulting from each cross-sectional area (Afluid), the adequacy of bulk packing is typically assessed by evaluating the radial porosity distribution of the packed bed. The change in the circumferential average radial porosity in the bed can be mathematically expressed to determine the reasonability of the packing [18,19]:
ε ( r ) = A f l u i d ( r ) A c y l ( r ) = A f l u i d ( r ) 2 π r H ,
where ε ( r ) is the radial porosity, A f l u i d ( r ) is each cross-sectional area (m2), and A c y l is the area of the circle on each section (m2).
Figure 4 illustrates the radial porosity distributions of the packed bed models with particle size ratios of 4.44, 5.6, and 6.25. The distributions are based on several cylindrical subsurfaces intercepted at various radial locations within the filled beds, with the distance between the subsurface and tank wall ranging from 0.5 to 2 dp. Based on the surface porosity, the porosities of the subsurfaces located 0, 1, and 2 dp from the wall should be higher than those of other subsurfaces. The oscillation in radial porosity is related to the particle accumulation process and the spherical particle shape. The particles tend to occupy the space near the wall during the packing process before filling the center space [20]. This results in varying subsurface porosity along with a higher density of particles near the wall and a lower density farther from the wall. Specifically, the particles at the wall surface are in point contact with the wall, resulting in a porosity close to 1 and a subsurface distance of approximately 0.5 dp from the wall. The subsurface occupies the majority of the particle, and the porosity is reduced to 0.2. Conversely, at a distance of 1 dp from the wall surface, the particles near the wall are in point contact with internal particles, creating a gap at the point of contact and increasing the porosity to 0.5. As a result of these oscillations, the porosity of the subsurface in the radial direction is variable [21].

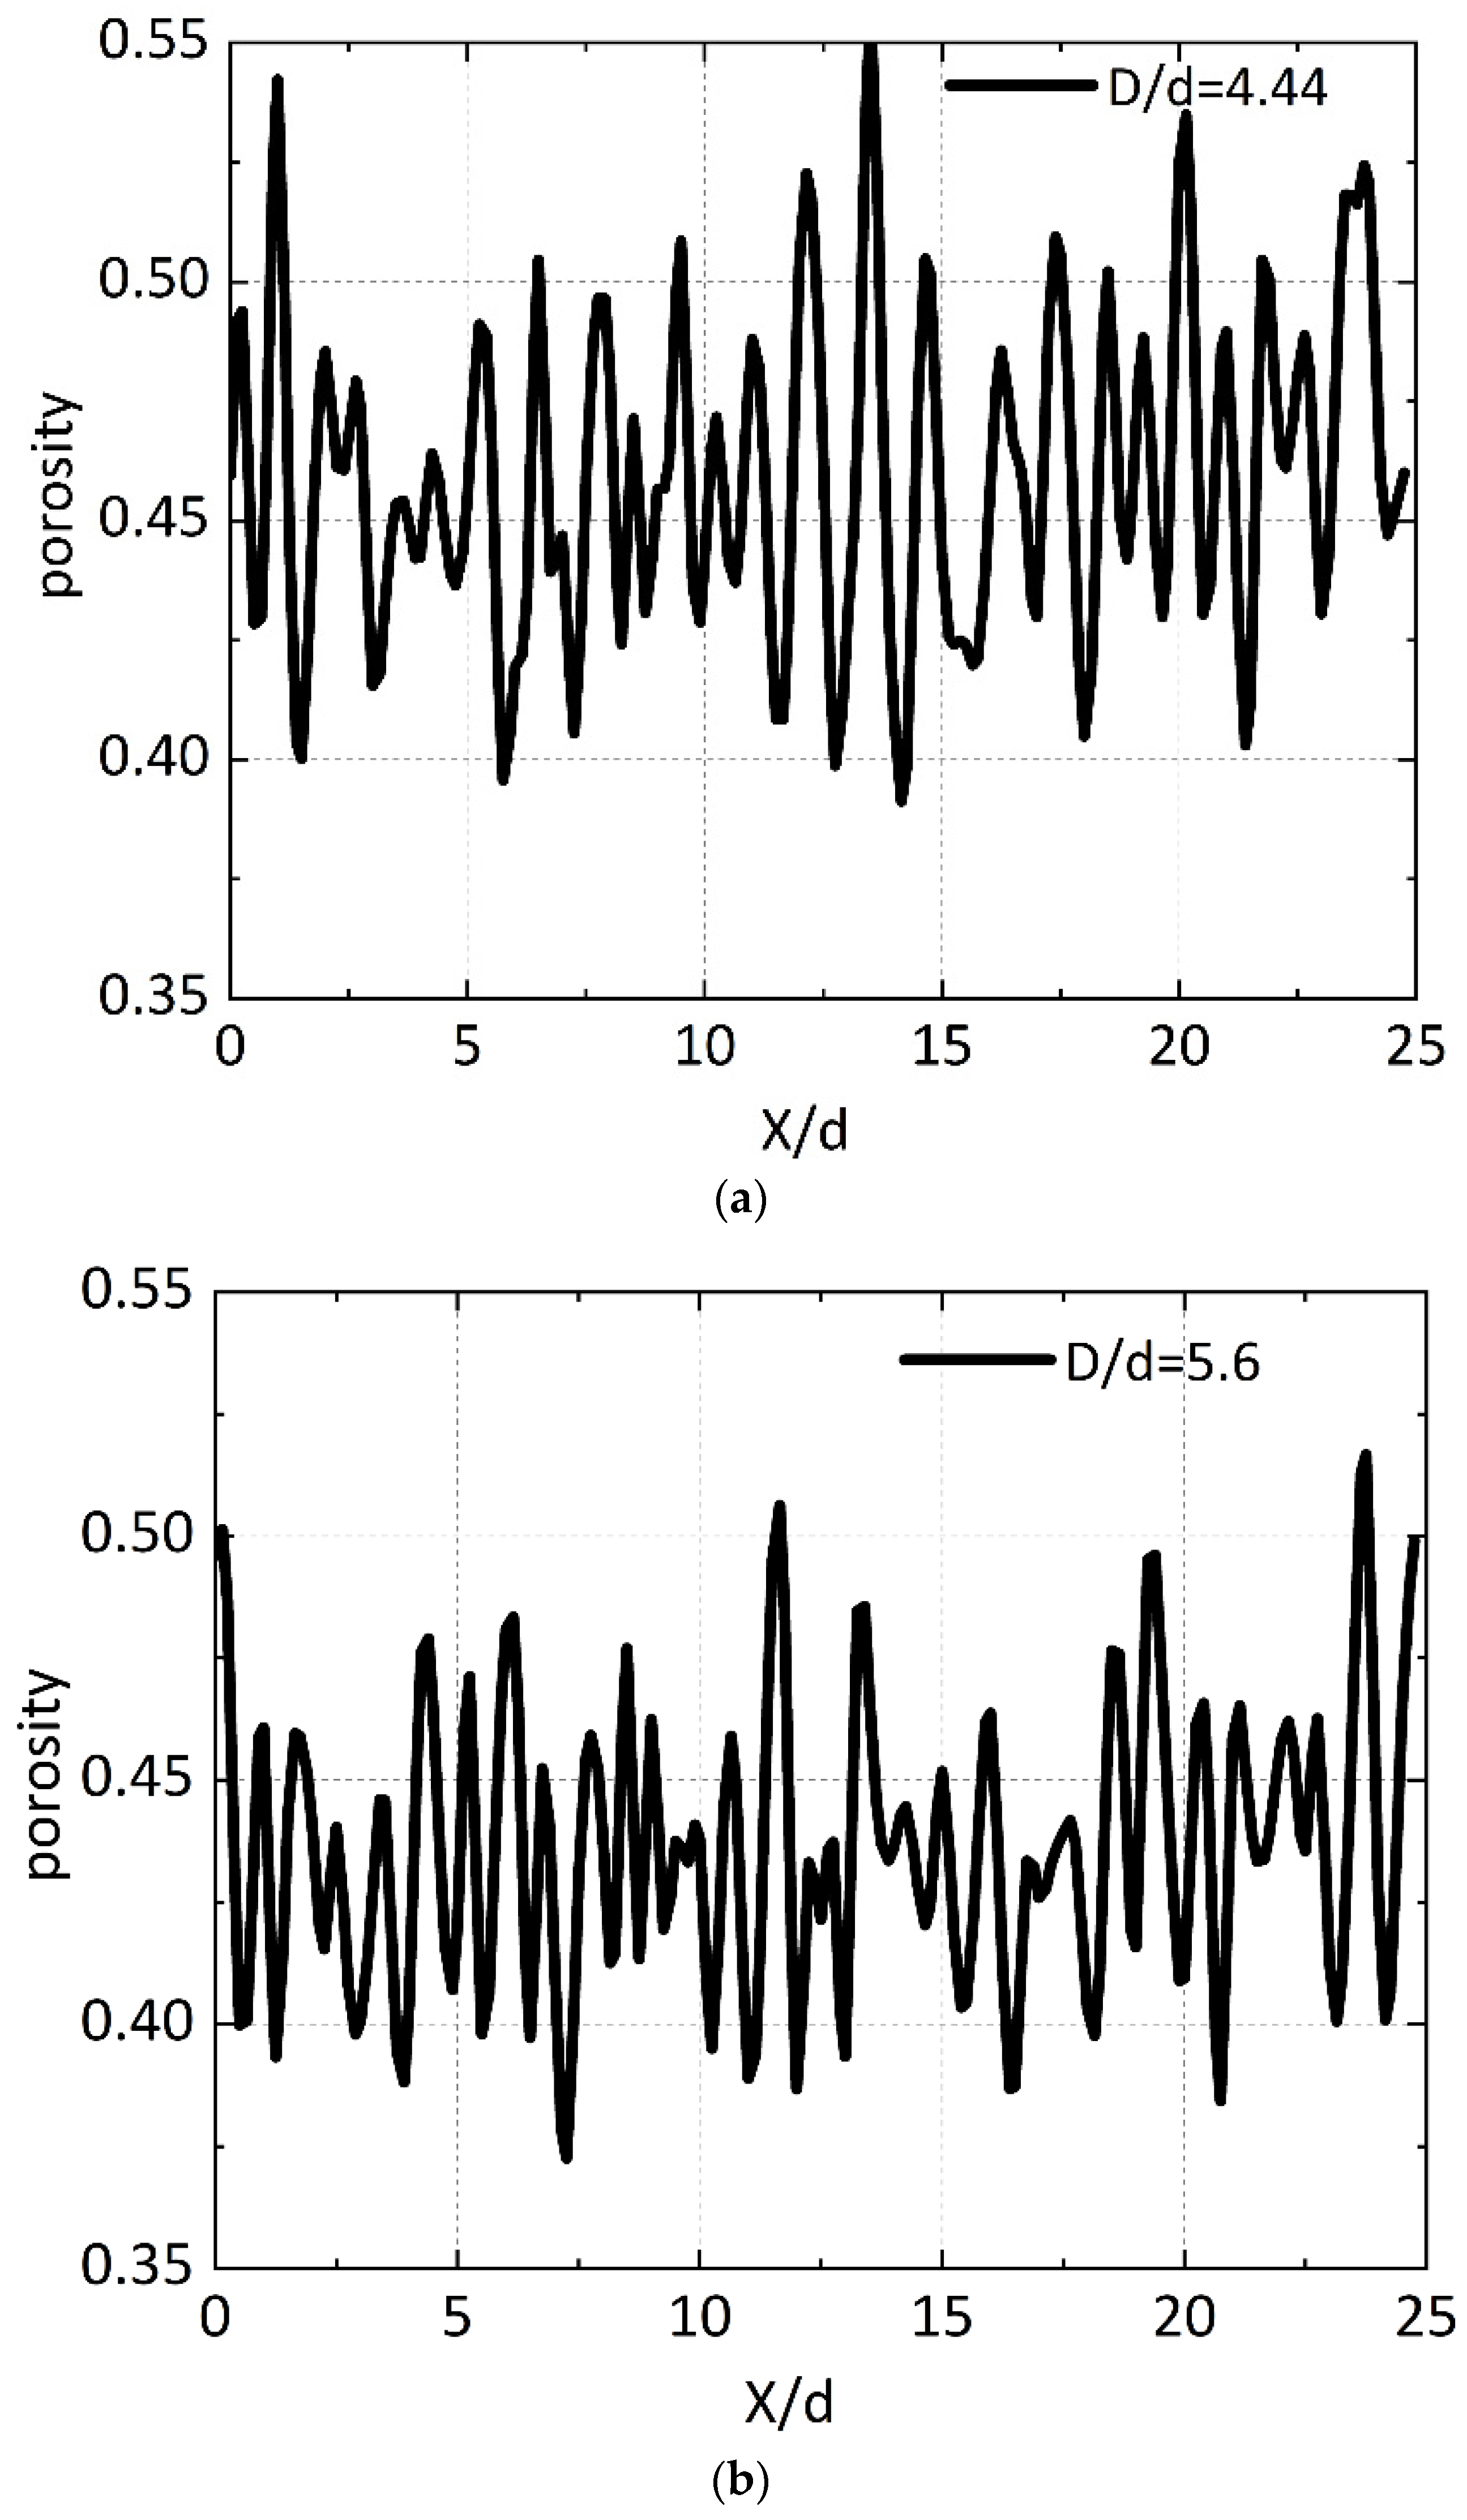
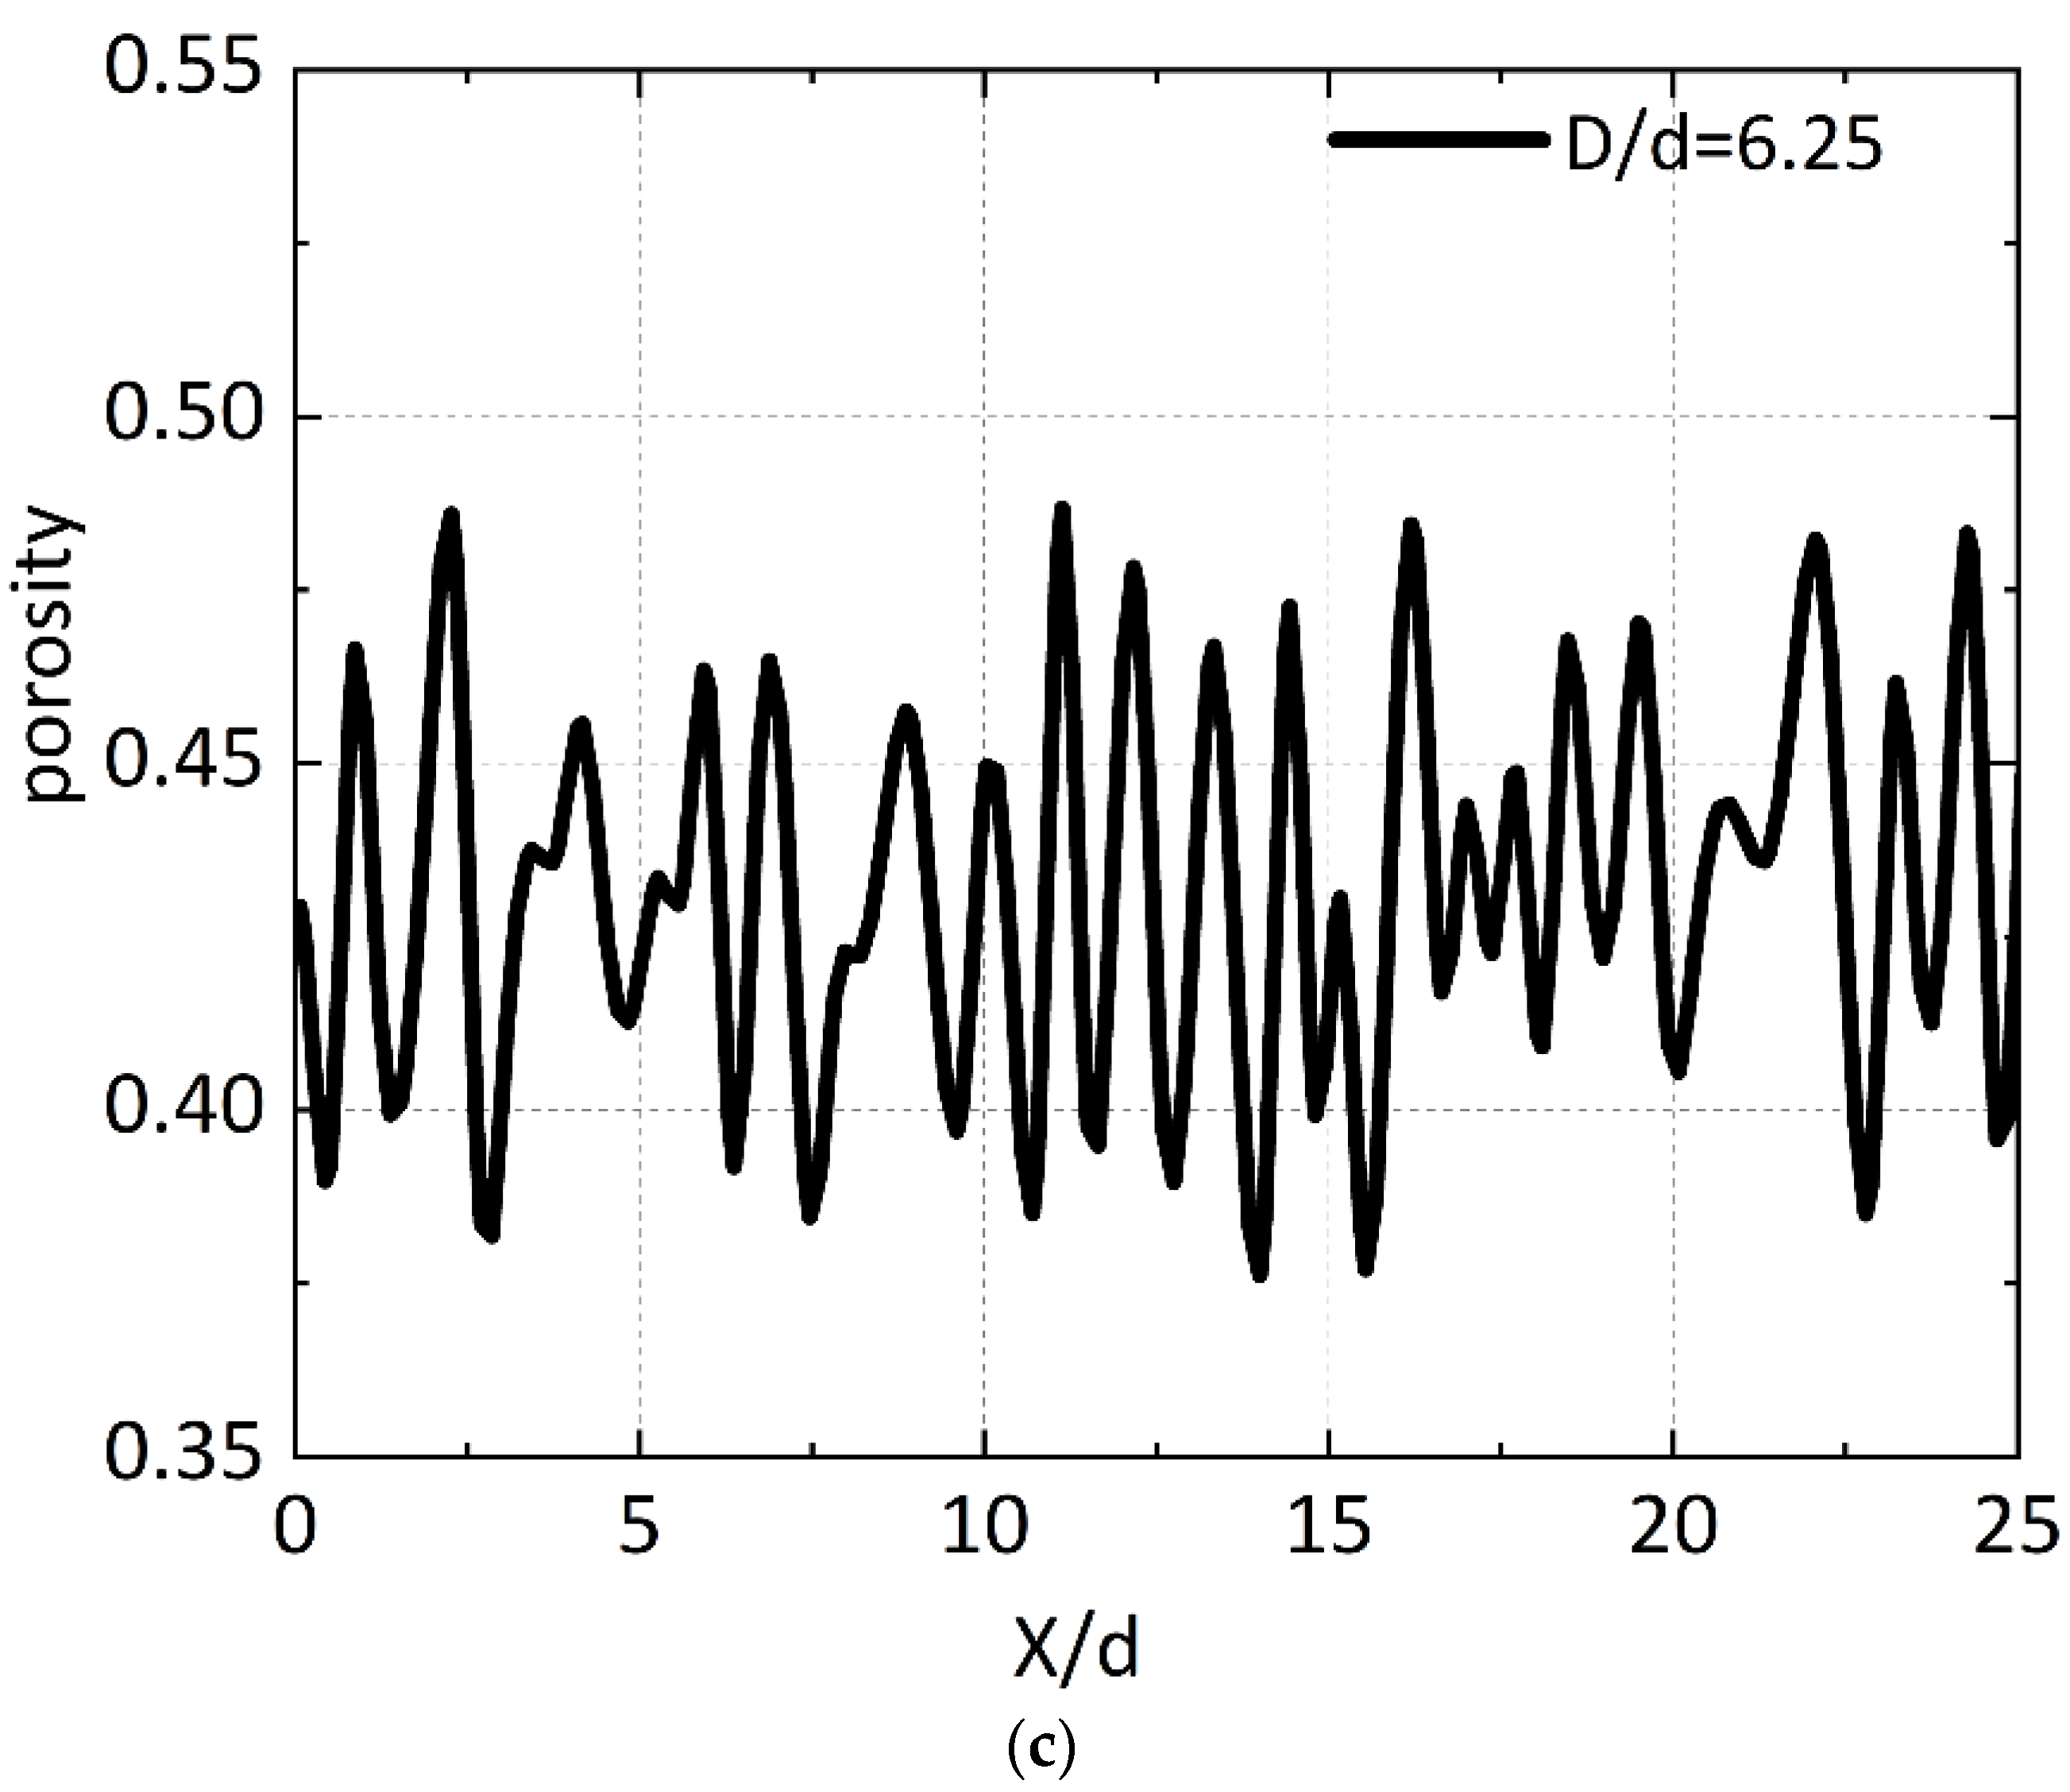
4.2. Axial Porosity Distribution
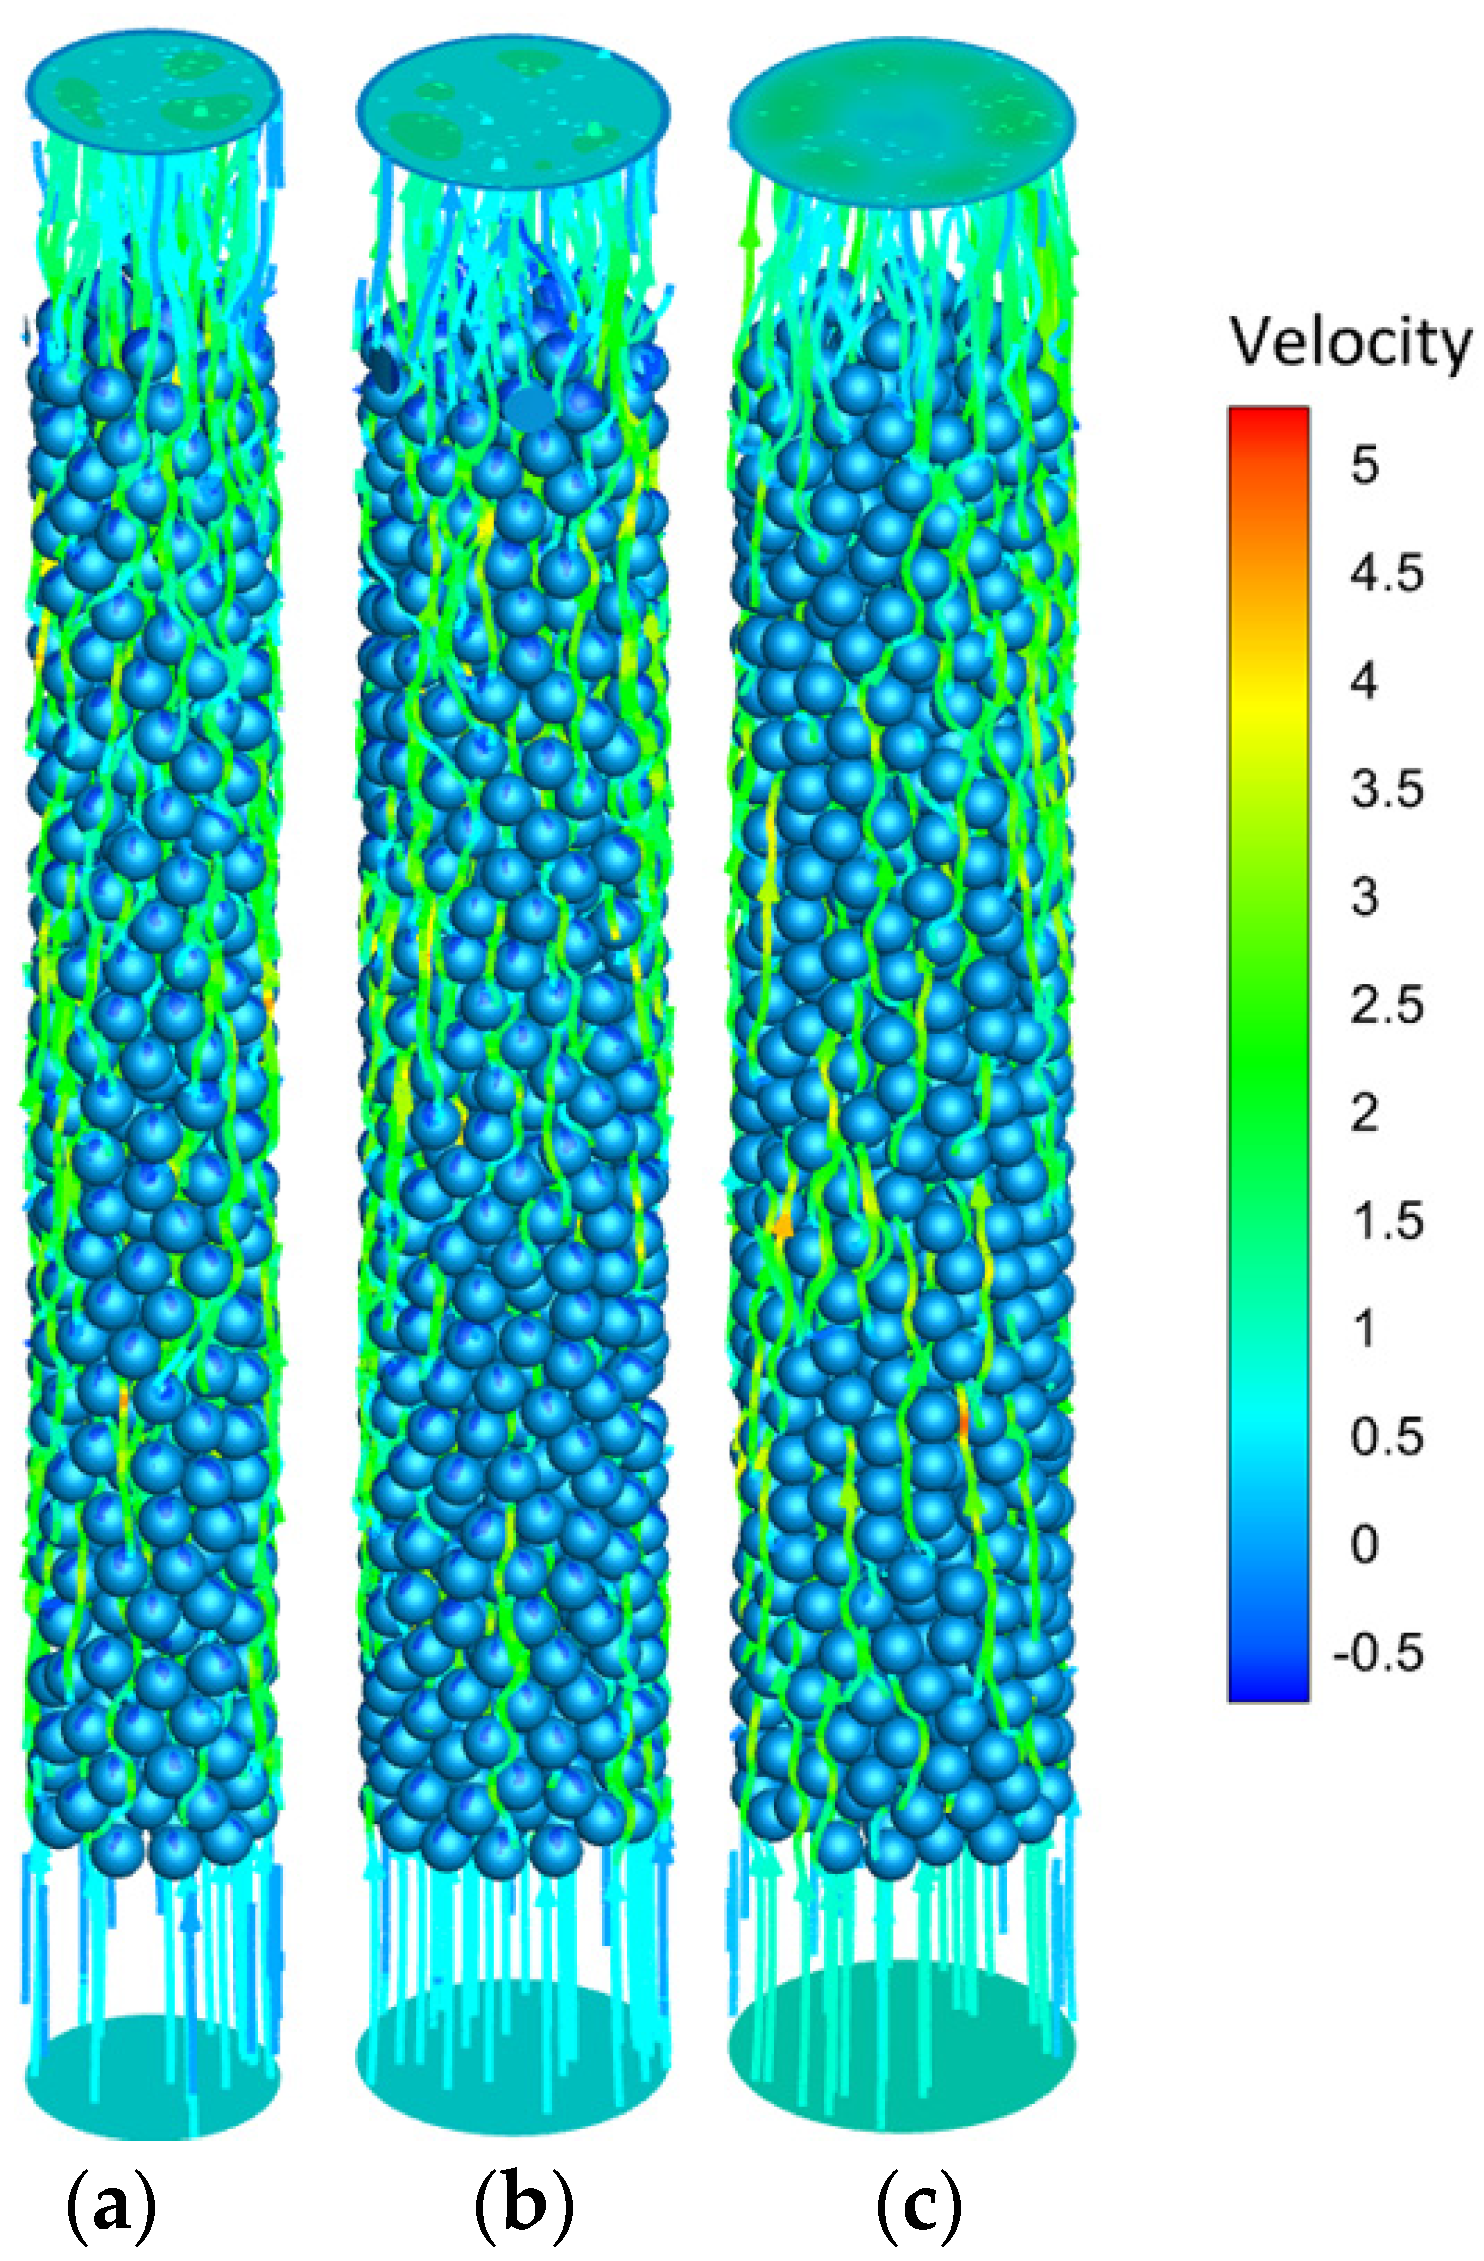
To thoroughly analyze the axial porosity distribution across a range of different particle size ratios within a stack, the particle accumulation model shown in Figure 1 was subdivided into 100 circular segments, each with unique circular voids in the axial direction. These segments were then integrated to determine the corresponding cross-sectional area [17]. The following equation was used to calculate axial porosity, providing us with a comprehensive understanding of the distribution of porosity within the particle stack:
ε ( Z ) = A f l u i d ( Z ) A c i r = A f l u i d ( Z ) 2 π R .
Figure 5 shows the normalized axial porosity distribution averaged over each cross section, demonstrating the oscillations caused by the presence of the bottom wall. It is important to note that this effect is negligible for tall cylinders but can result in inconsistent results when considering averages for shallow columns. To ensure uniform axial porosity throughout the bed, only the middle portion (0 ≤ m ≤ 25) of the filling section from the DEM simulation was exported to the CFD domain. The axial porosity distribution fluctuates around 0.45 under different particle size ratios, reflecting the randomness of the stacking structure generated by DEM.

4.3. Hydrodynamics

4.3.1. Control Equations and Boundary Conditions

In general, the pore Reynolds number (Re) can be used to assess the flow dynamics of fluids within the accumulation bed. When Re < 100, the fluid exhibits laminar flow. When 100 < Re < 300, the fluid undergoes a transition from laminar to turbulent flow. At Re > 300, the fluid displays high instability and irregularity, resulting in an overall turbulent flow state. In this study, the pore Re of the calculation model was determined using the corresponding equation. For fully developed turbulent flow on a solid wall, it is possible to categorize the flow into a wall zone and a core zone in relation to the perpendicular direction of the wall. The core zone is universally regarded as having fully turbulent flow, while the wall zone is partitioned into viscous, transition, and mathematical layers. As a result, the standard wall function was used for calculations. Additionally, for simplicity, we assumed that the gas was an incompressible ideal gas. Within this simulation, the three-dimensional control equation was resolved across the x, y, and z directions.
The continuity equation is expressed as
( ρ g ) t + ( ρ g v ¯ ) = 0 ,
where ρ g is the gas density (kg/m3), v ¯ is the gas velocity vector (m/s), and t is the time (s).
The momentum equation is expressed as
ρ ( u j u i ¯ x j ) = p ¯ x j + [ μ + μ i ( u i ¯ x j + u j ¯ x j ) ] .
The k−ε equation is expressed as
ρ u j k ¯ x j = [ x j ( μ + μ i σ k ) k x j ] + μ i ( u i ¯ x j + u j ¯ x j i ) u i ¯ x j ρ ε ,
ρ u j ¯ ε x j = [ x j ( μ + μ i σ ε ) ε x j ] + C 1 ε ε k μ i ( u i ¯ x j + u j ¯ x i ) u i ¯ x j C 2 ε ρ ε 2 k .
According to Equations (5) and (6), we have the following values:
μ = c μ ρ k 2 ε , c μ = 0.09 , C 1 ε = 1.44 , C 2 ε = 1.92 , σ k = 1.0 ,   a n d   σ ε = 1.3 .
The boundary equations for the entrance, exit, and walls are, respectively, expressed as
z = z i n , u ¯ = v ¯ = 0 , w ¯ = w 0 ,
z = z o u t , u z = v z = 0 ,
and
u ¯ = v ¯ = w ¯ = 0 .
The fluid medium was air with a density of 1.205 kg/s and a viscosity of 1.8189 × 10⁵ kg∙(m/s).

4.3.2. Model Validation

At low Reynolds numbers, specifically in the Darcy or creeping flow regimes, the pressure drop is offset solely by the shear stress exerted on both the cylindrical wall and the particle surfaces. Upon increasing the Reynolds number and entering the Forchheimer regime, flow inertia becomes a factor, resulting in a total pressure drop comprised of both viscous and inertial elements. It is worth noting that in some instances in the literature, the terminology used to refer to these two flow regimes as laminar, and turbulent flow may be misleading [22].
To ensure accuracy and reliability in the modeling process, it is imperative to address the particle–particle and particle–pipe wall contact points within the packed bed structure prior to meshing the overall structure. An irrelevance test was also conducted for bed pressure drop under different grid sizes using the aforementioned treatment method (i.e., the shrinking ball model method shown in Figure 3) for the contact points. To validate the irregularity of the grid for the particle accumulation segment, we tested grid sizes of 1/20, 1/22, 1/24, and 1/26 dp. The results indicate that a grid size of 1/24 dp yields a mesh-independent solution in which the pressure drop of the entire bed remains constant (Figure 6).

4.3.3. Packed-Bed Pressure Drop

The pressure drop of the stacking arrangement in the particle bed was investigated in detail. The porosity and bed lamination drop were measured in a cylindrical device filled with air as the working fluid. Numerous variables can influence the pressure drop in a filled bed. The pressure drop was quantified as follows [23]:
f p = Δ P d p L ρ v 2 ,
where v is the apparent velocity. This velocity is usually related to the bed void ε, tube-to-particle size ratio N, and dimensionless Reynolds number:
Re = ρ v d p μ ,
where dp is the hydraulic radius. The model gives the form of the dependence of pressure drop on porosity; if the hydraulic radius model is used, the coefficient of friction fk is defined as
f k = Δ P d p L ρ v 2 ε 3 ( 1 ε ) .
The corrected Reynolds number (Rem) is defined as
Re m = ρ v d p μ ( 1 ε ) = Re ( 1 ε ) .
The coefficient of friction fk is useful when Rem ≥ 20. However, when Rem decreases below 20, fk increases by orders of magnitude. For low Rem, Ergun [24] introduced a second friction factor defined as
f v = Δ P d p 2 μ v L ε 3 ( 1 ε ) = f k Re m .
In contrast to fk, fv exhibits only a modest increase with Re; its value only doubles when Rem increases from 0.01 to 100.
The method of calculating fk, Rem, and fv shown in Equations (12)–(14) was used to determine the relationship between the coefficient of friction and Re, and the results were compared with those obtained by Erdim et al. [23] using the well-known KTA equation:
f k = 160 Re m + 3.0 Re m 0.1 .
The asymptotic correlation for the middle range depicted in Figure 7 exhibits good alignment with that derived from the KTA equation while also agreeing with the range of data from nine previous studies. Thus, the obtained correlation can be used to describe the pressure drop in porous media within this specific KTA flow rate range. However, the data accuracy is rapidly compromised at higher Reynolds numbers. It is worth mentioning that this compromised accuracy is not attributed to wall effects or shape effects; rather, it is due to the improper identification of high Reynolds numbers. Thus, this method is restricted to low Reynolds numbers [25].
As shown in Figure 7, when the particle size ratio increases from 4.44 to 6.25, the coefficient of friction decreases within increasing Re and remains close to the KTA curve.

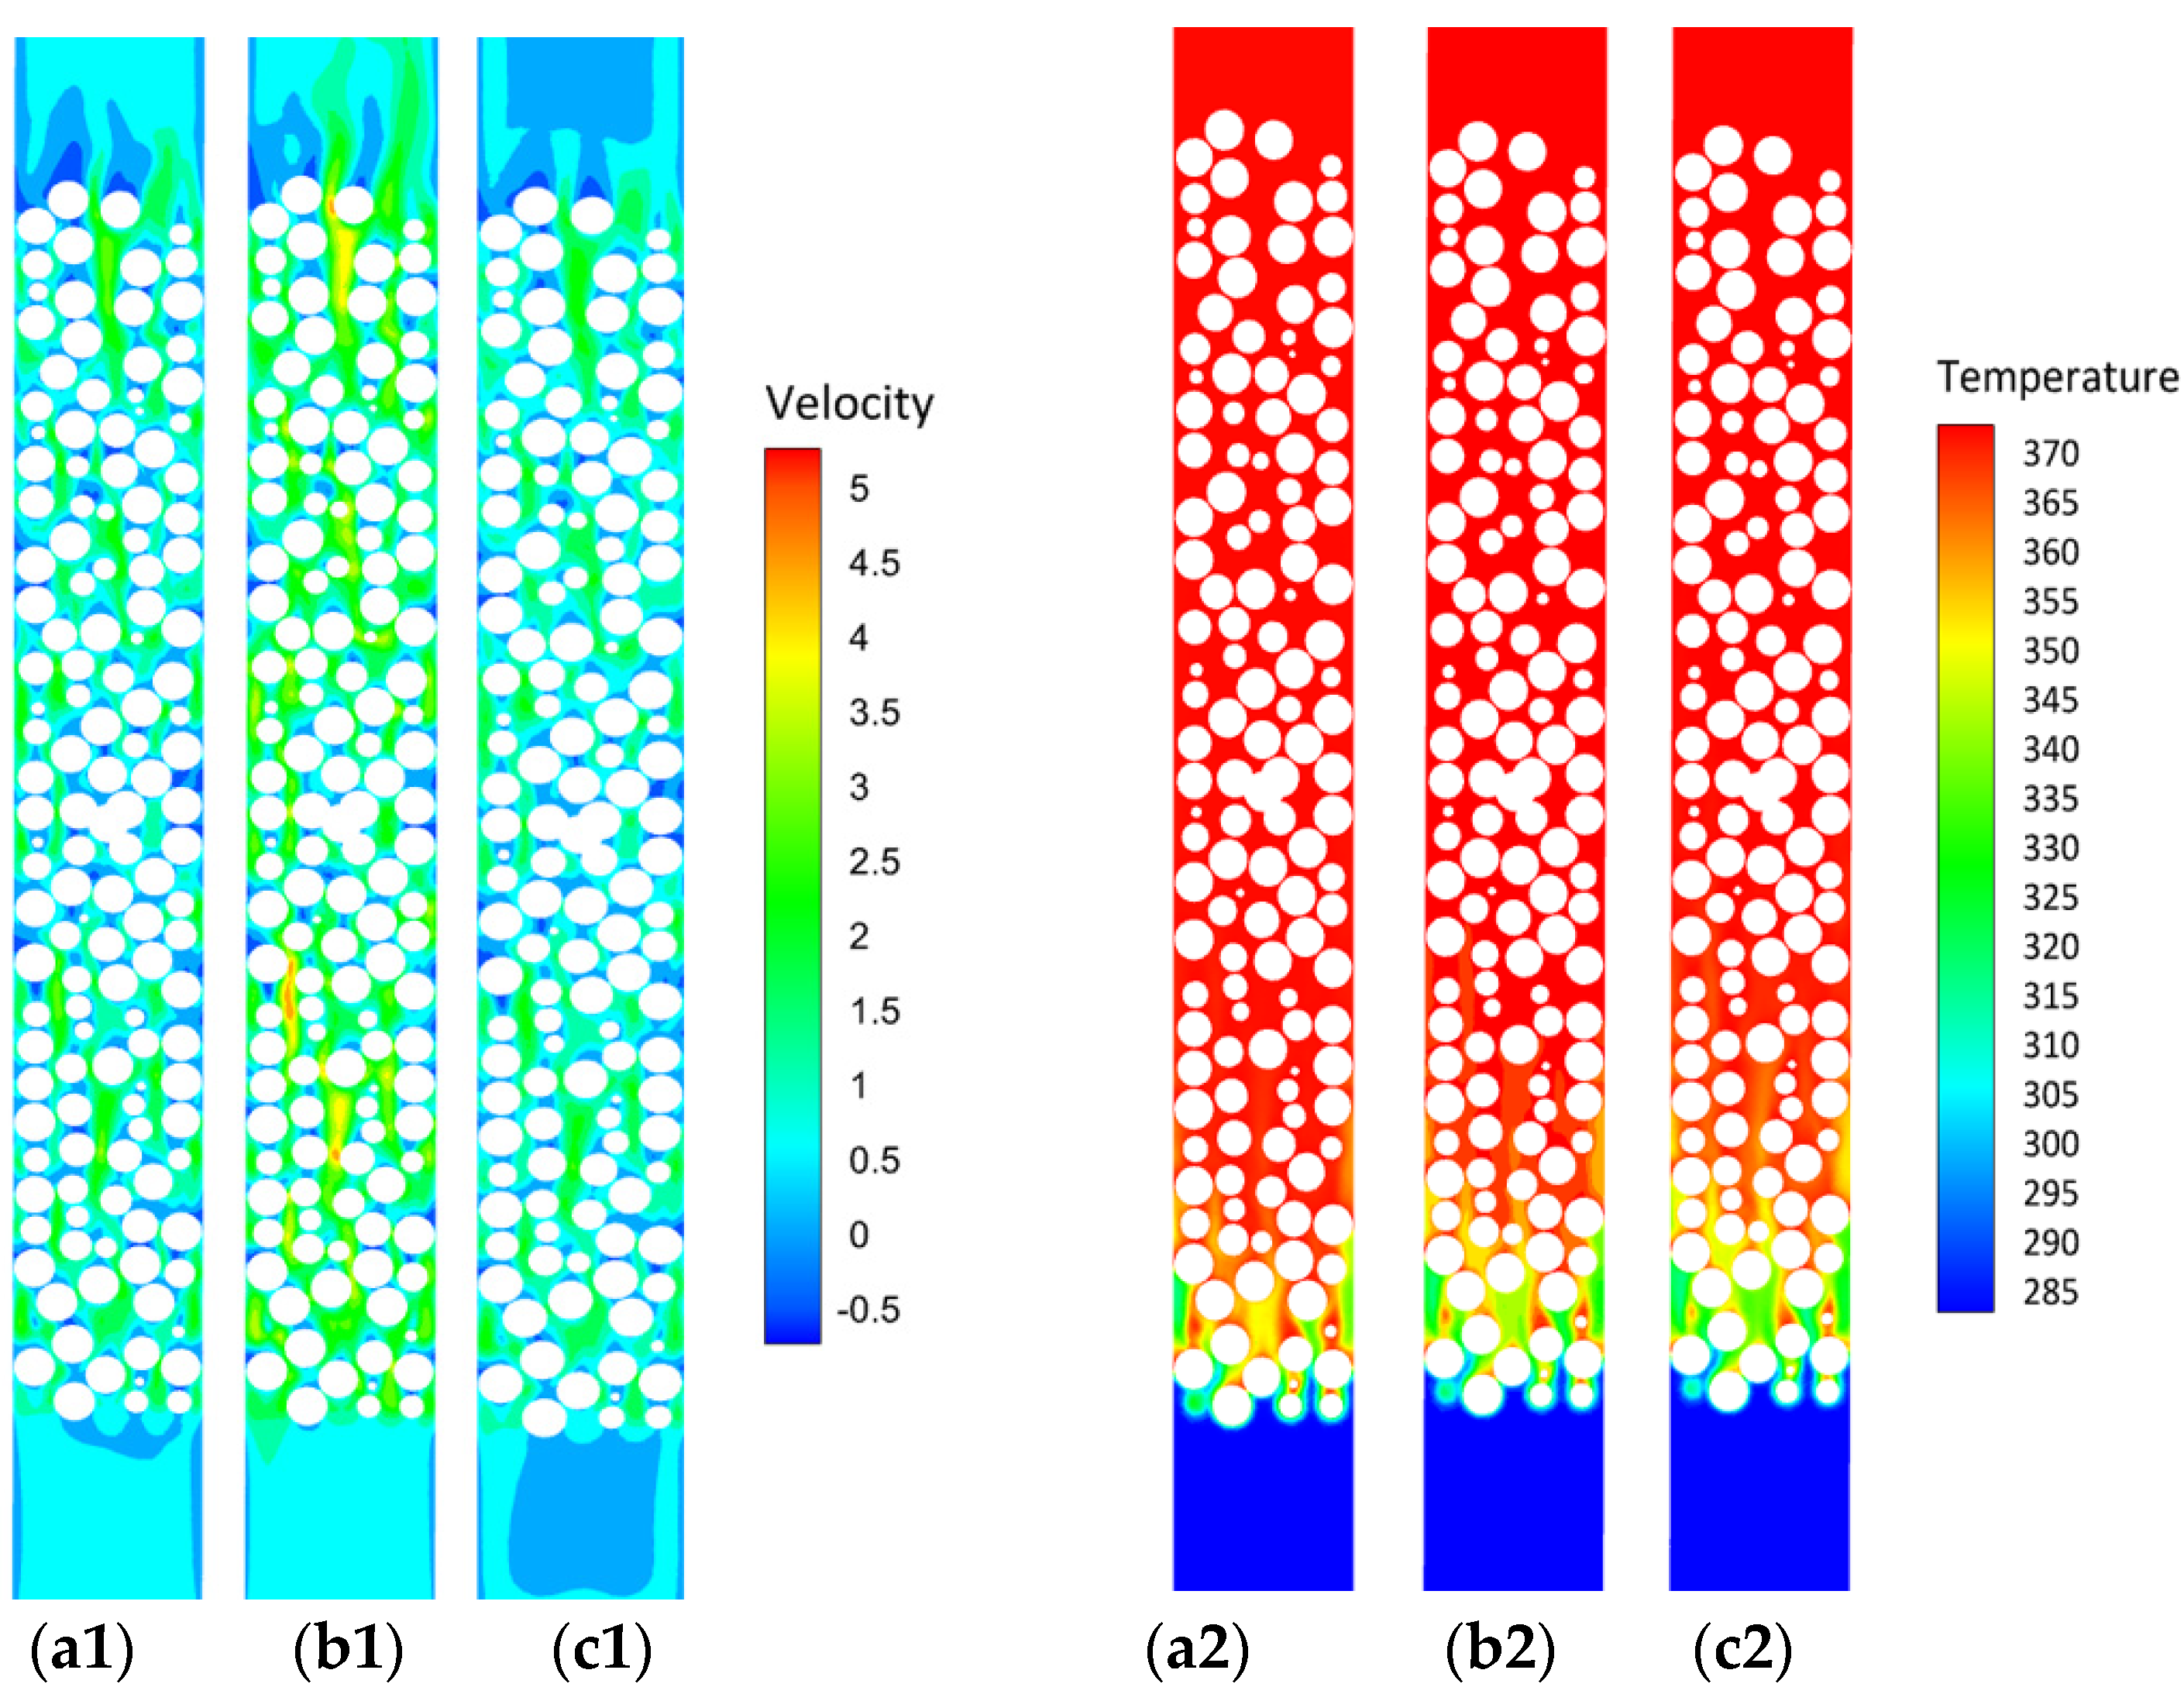
4.4. Localized Fluid Flow and Steady Temperature

Sophisticated bed structures with intricate stacking exhibit intricate flow behavior. The velocity distribution is a crucial attribute that describes how the fluid flows through the packed bed. Figure 8 shows the local velocity streamline distributions in beds with different particle size ratios. The fluid flows from the bottom of each bed toward the top. In all beds, a distinctly three-dimensional flow field is formed around the particles, resulting in axial and radial disparities. The local velocity can be amplified to nearly 10 times the initial inlet speed. Fluid velocity and temperature distribution in packed beds with a particle size ratio of 4.44, as shown in Figure 9. Various characteristic regions can be observed, including wakes and eddies trailing behind particles, acceleration and deceleration, and channels in the void region, particularly in the near-wall region. Channels or bypasses are situated in proximity to walls and loosely filled areas. Notably, a detectable decrease in velocity or even zero velocity is observed in the particle wake region. At the same time, the temperature reaches the inlet temperature value. These findings are typical of flow in a packed bed with small D/dp [19,26,27]. In particle-bed reactors, the wall effect is strong, and the flow velocity is stronger in the internal region than at the side wall [28]. Special features are frequently disregarded in two-dimensional homogeneous models. In-depth analyses of the flow characteristics around cylindrical particles are beneficial for better comprehending the complex flow behavior in three-dimensional systems [29].
Figure 10 shows the axial velocity distribution as a function of dimensional wall distance, showing that the axial velocity follows the trend in local porosity depicted in Figure 4. Notably, high velocities are observed in regions of high porosity, indicating greater mass flux. However, the velocity decreases near the reactor wall due to the no-slip condition at the boundary layer and wall. Interestingly, the axial velocity curves for different particle size ratios exhibit troughs and peaks at the same locations. Specifically, peaks are observed around an abscissa value of 1, while the highest velocity occurs around an ordinate value of 2.5. Minor variation in the axial velocity of the gap was noted across the different particle size ratios in the vicinity of the wall. These findings emphasize the significance of the radial and circumferential velocity components in achieving a consistent velocity distribution under turbulent conditions. It is important to acknowledge that the reflow region remains undetected due to the averaging of the axial velocities. The circumferential average of the axial velocity distribution reflects the typical flow characteristics and can be leveraged in two-dimensional homogenous models.

4.5. Factors Influencing Flow and Steady Temperature Characteristics

Examining Figure 7 reveals that changing the inlet velocity can affect the coefficient of friction, as indicated by changes in reaction pressure. In addition, Figure 10 demonstrates that different inlet velocities result in distinct configurations and dimensions in the low-speed region, with larger pore sizes resulting in a larger low-speed area. These observations highlight the stochastic nature of the DEM approach used to assemble the particle structure. As the inlet speed increases, the size of the low-speed zone of the fluidized bed is proportionally reduced due to the effect of the fluid on the particles in the accumulation area, causing fluid redistribution. With increasing inlet speed, the lateral flow in the bed increases, resulting in a decrease in the area of the low-speed zone.
The temperature distribution of the fluid in each packed bed is shown in Figure 11. Compared with the fluid velocity distribution in Figure 10, a roughly opposite relationship can be observed: high-temperature fluids occur in areas with low fluid velocities, and vice versa. To achieve a higher inlet fluid velocity, the contour moves downward and becomes flattened in each packed bed. The increased flow rate reduces the overall fluid temperature and facilitates lateral fluid mixing. Furthermore, as a result of the packing structure and variations in fluid velocity distribution mentioned earlier, variations in fluid temperature distribution can be observed among the three types of packing beds. In a packed bed with a D/dp ratio of 6.25, the fluid near the wall has the lowest temperature, and there is a significant increasing trend from the wall to the center of the bed. As the diameter-to-depth ratio (D/d ratio) decreases, the upward trend gradually disappears. Finally, in D/dp = 4.44, the contour exhibits oscillations with approximately equal amplitudes from the wall to the center.

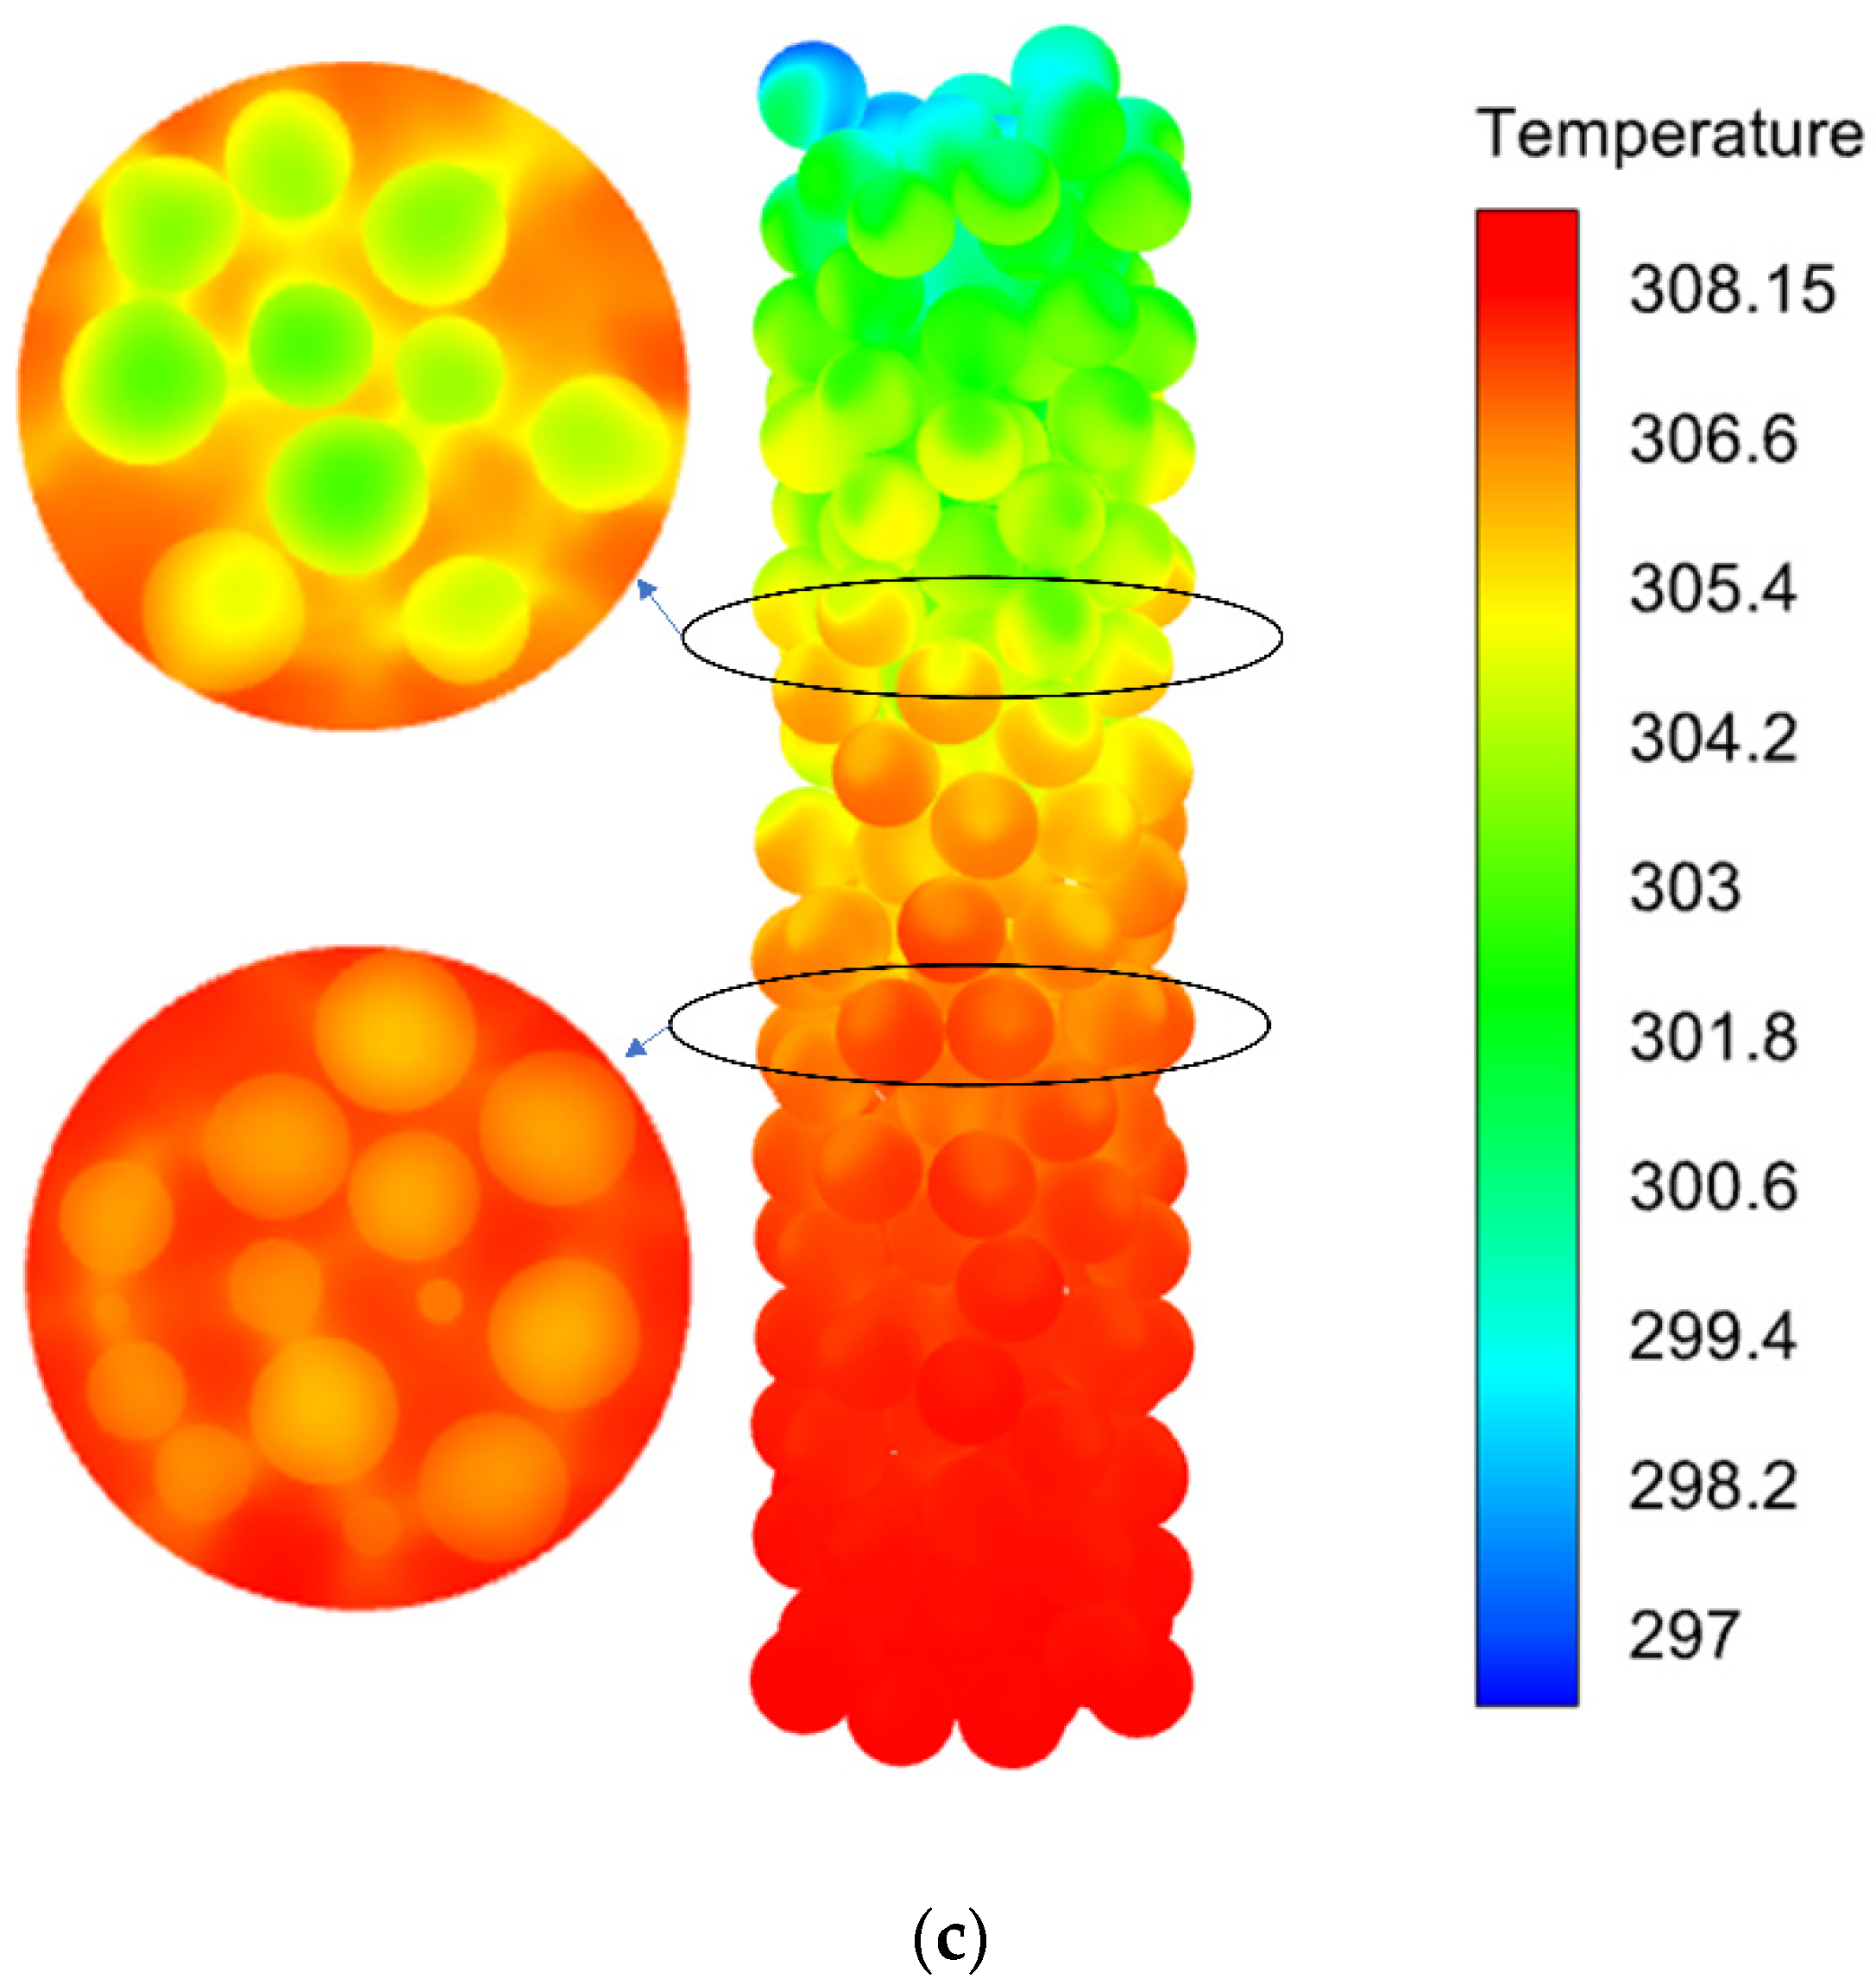
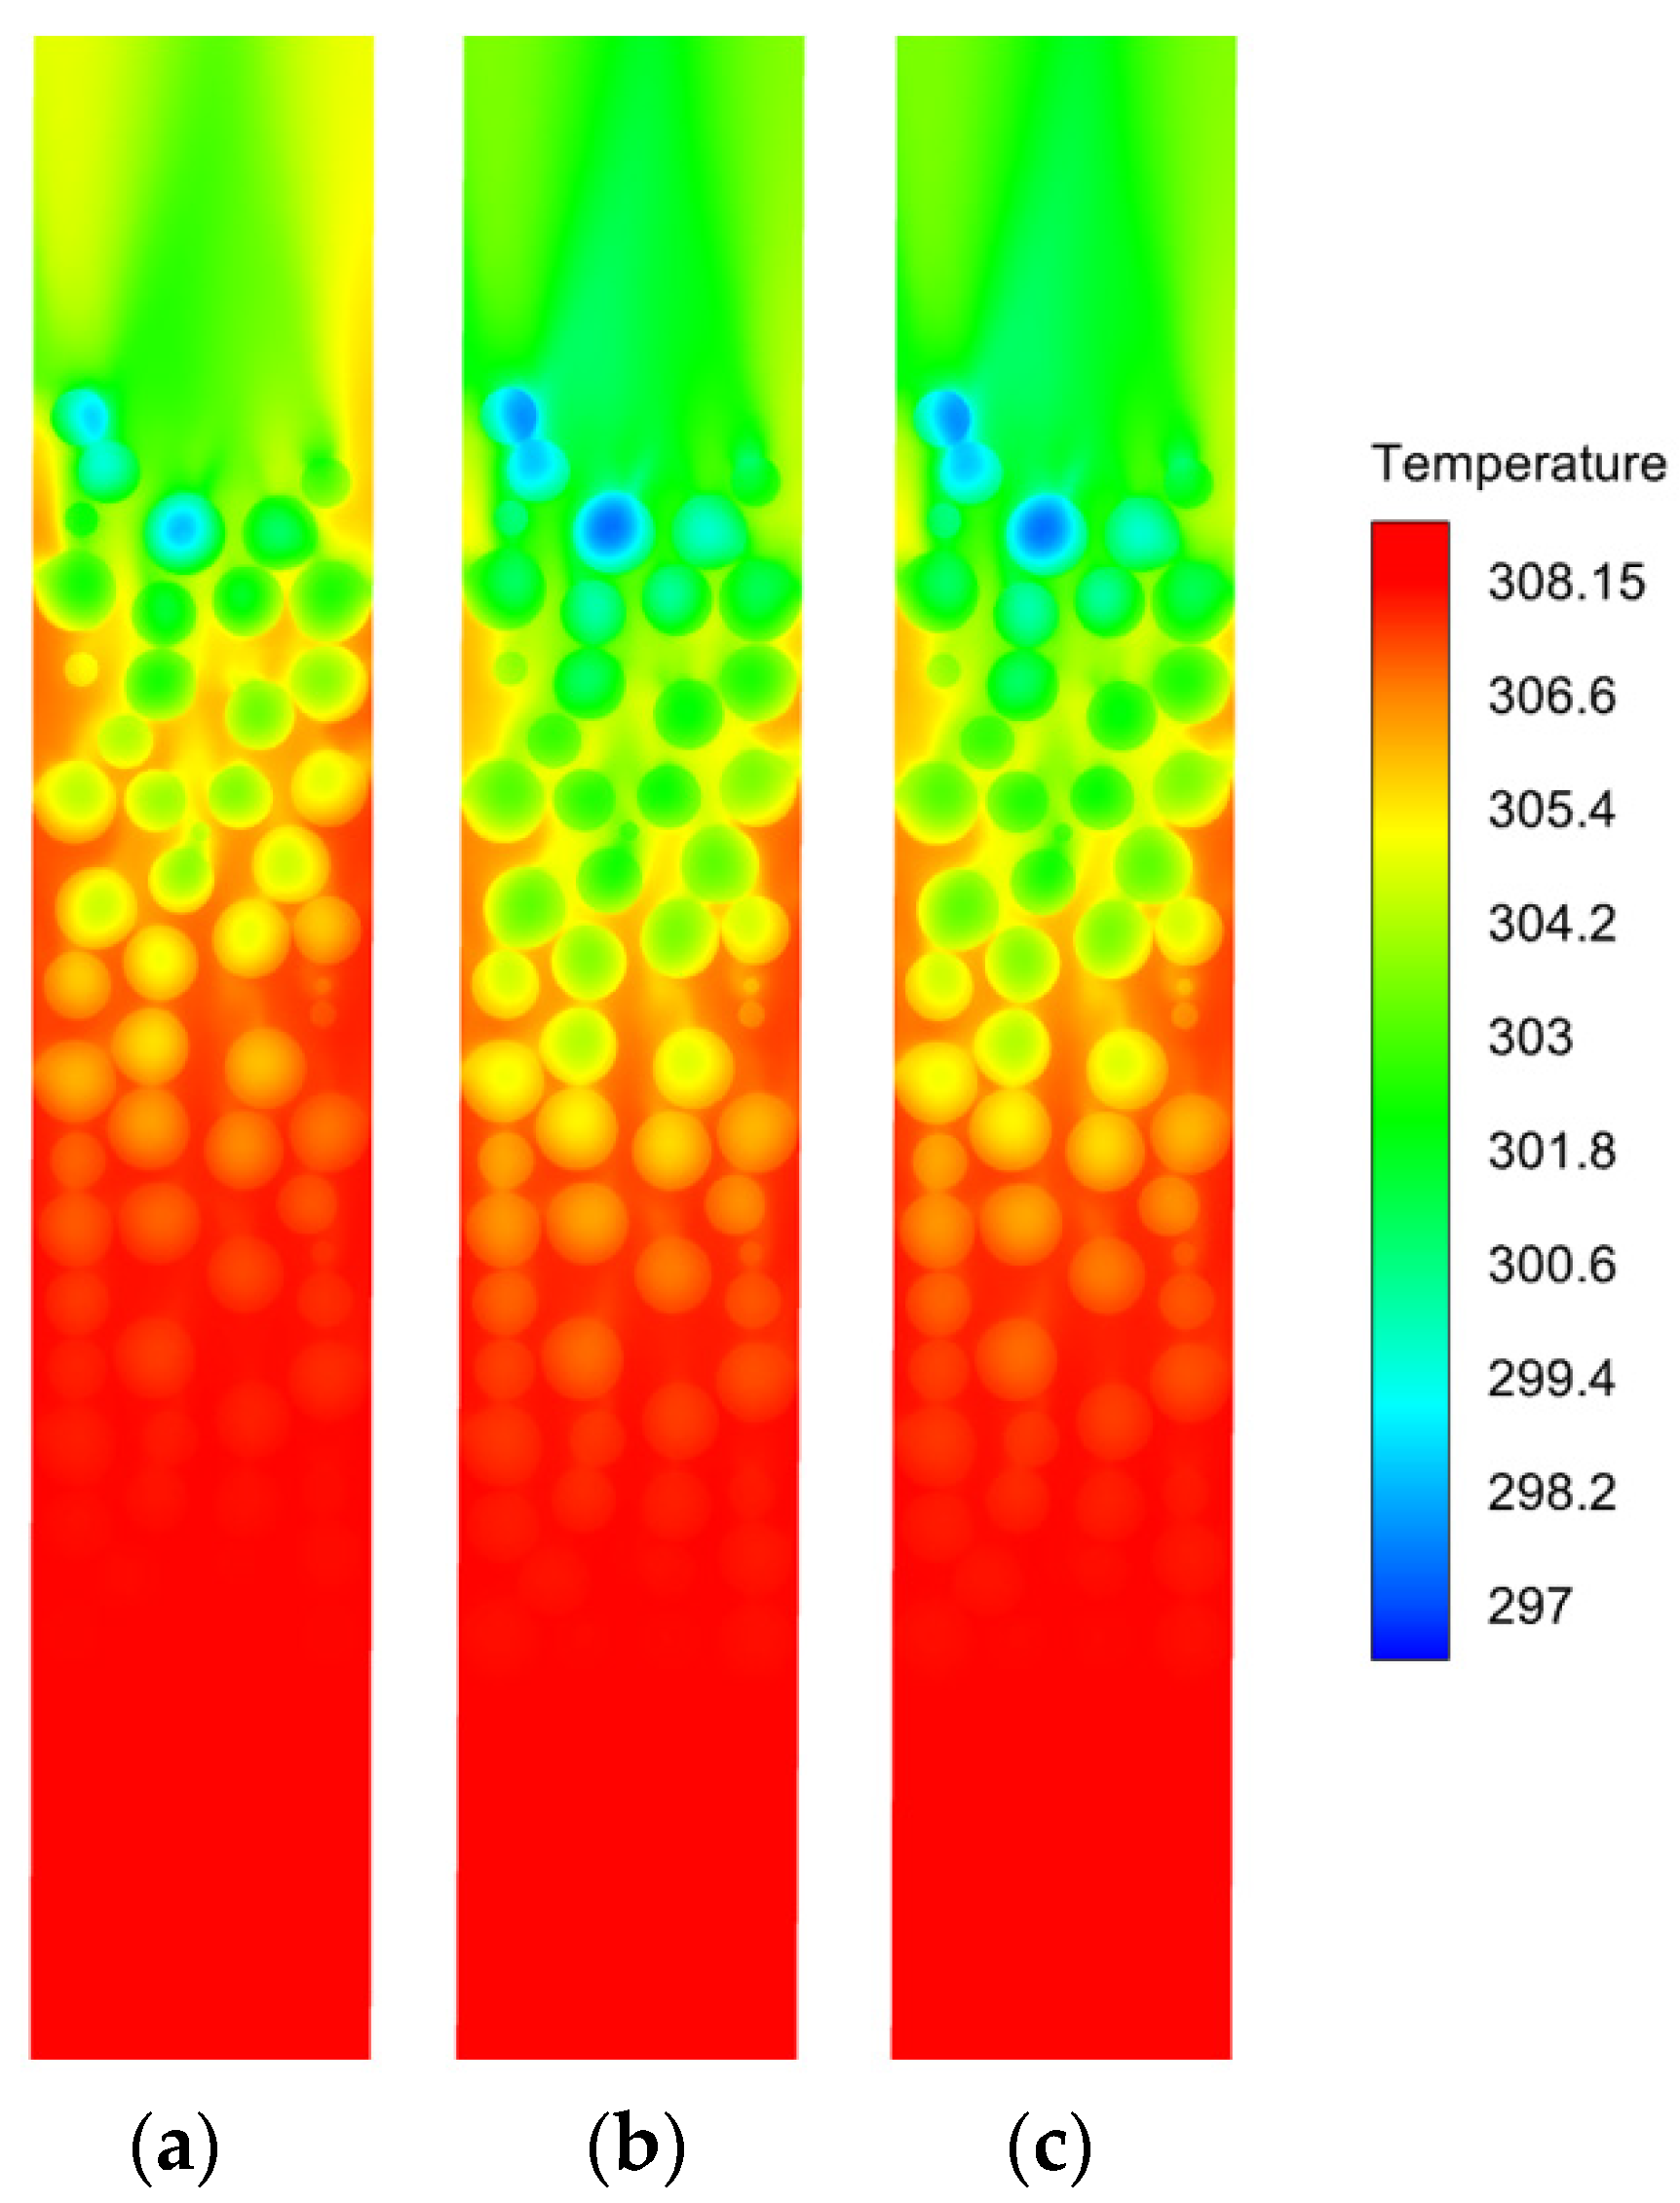
4.6. Transient Temperature Distribution

By choosing an inlet velocity of ν0 = 0.8 m/s and a drying temperature of T = 308.15 K, we examined the temperature distribution pattern in packed beds. Figure 12 displays the temperature contour at the plane of Z = 10 mm and −10 mm in packed beds after 300 s of drying at different particle temperatures. There is a clear temperature stratification along the axial direction of the packed bed, with higher temperatures observed at the bottom, in contrast to the top. After hot air enters the packed bed, it interacts with the particles at the bottom, causing their temperature to rapidly rise. In the upper region of the packed bed, hot air not only diffuses through intricate pore pathways but also transfers heat to low-temperature particles, leading to a slower increase in temperature.
Figure 13 illustrates the contour map of the temperature distribution in the Y = X plane after 300 s of drying, showing the bed temperature distribution levels at different initial particle temperatures. There is an irregular temperature distribution between the fluid and solid particles in the radial direction of the bed at various initial particle temperatures. This uneven distribution is caused by changes in particle temperature, leading to wall temperatures that are higher than those in the central region.
The temperature of packed beds with different particle temperatures over time is shown in Figure 14. When the initial temperature of the particles is 278 K, the filling bed has the fastest overall temperature change of the particles and the highest heating rate. The packed bed reaches the steady-state phase earlier at a particle temperature of 288 K.

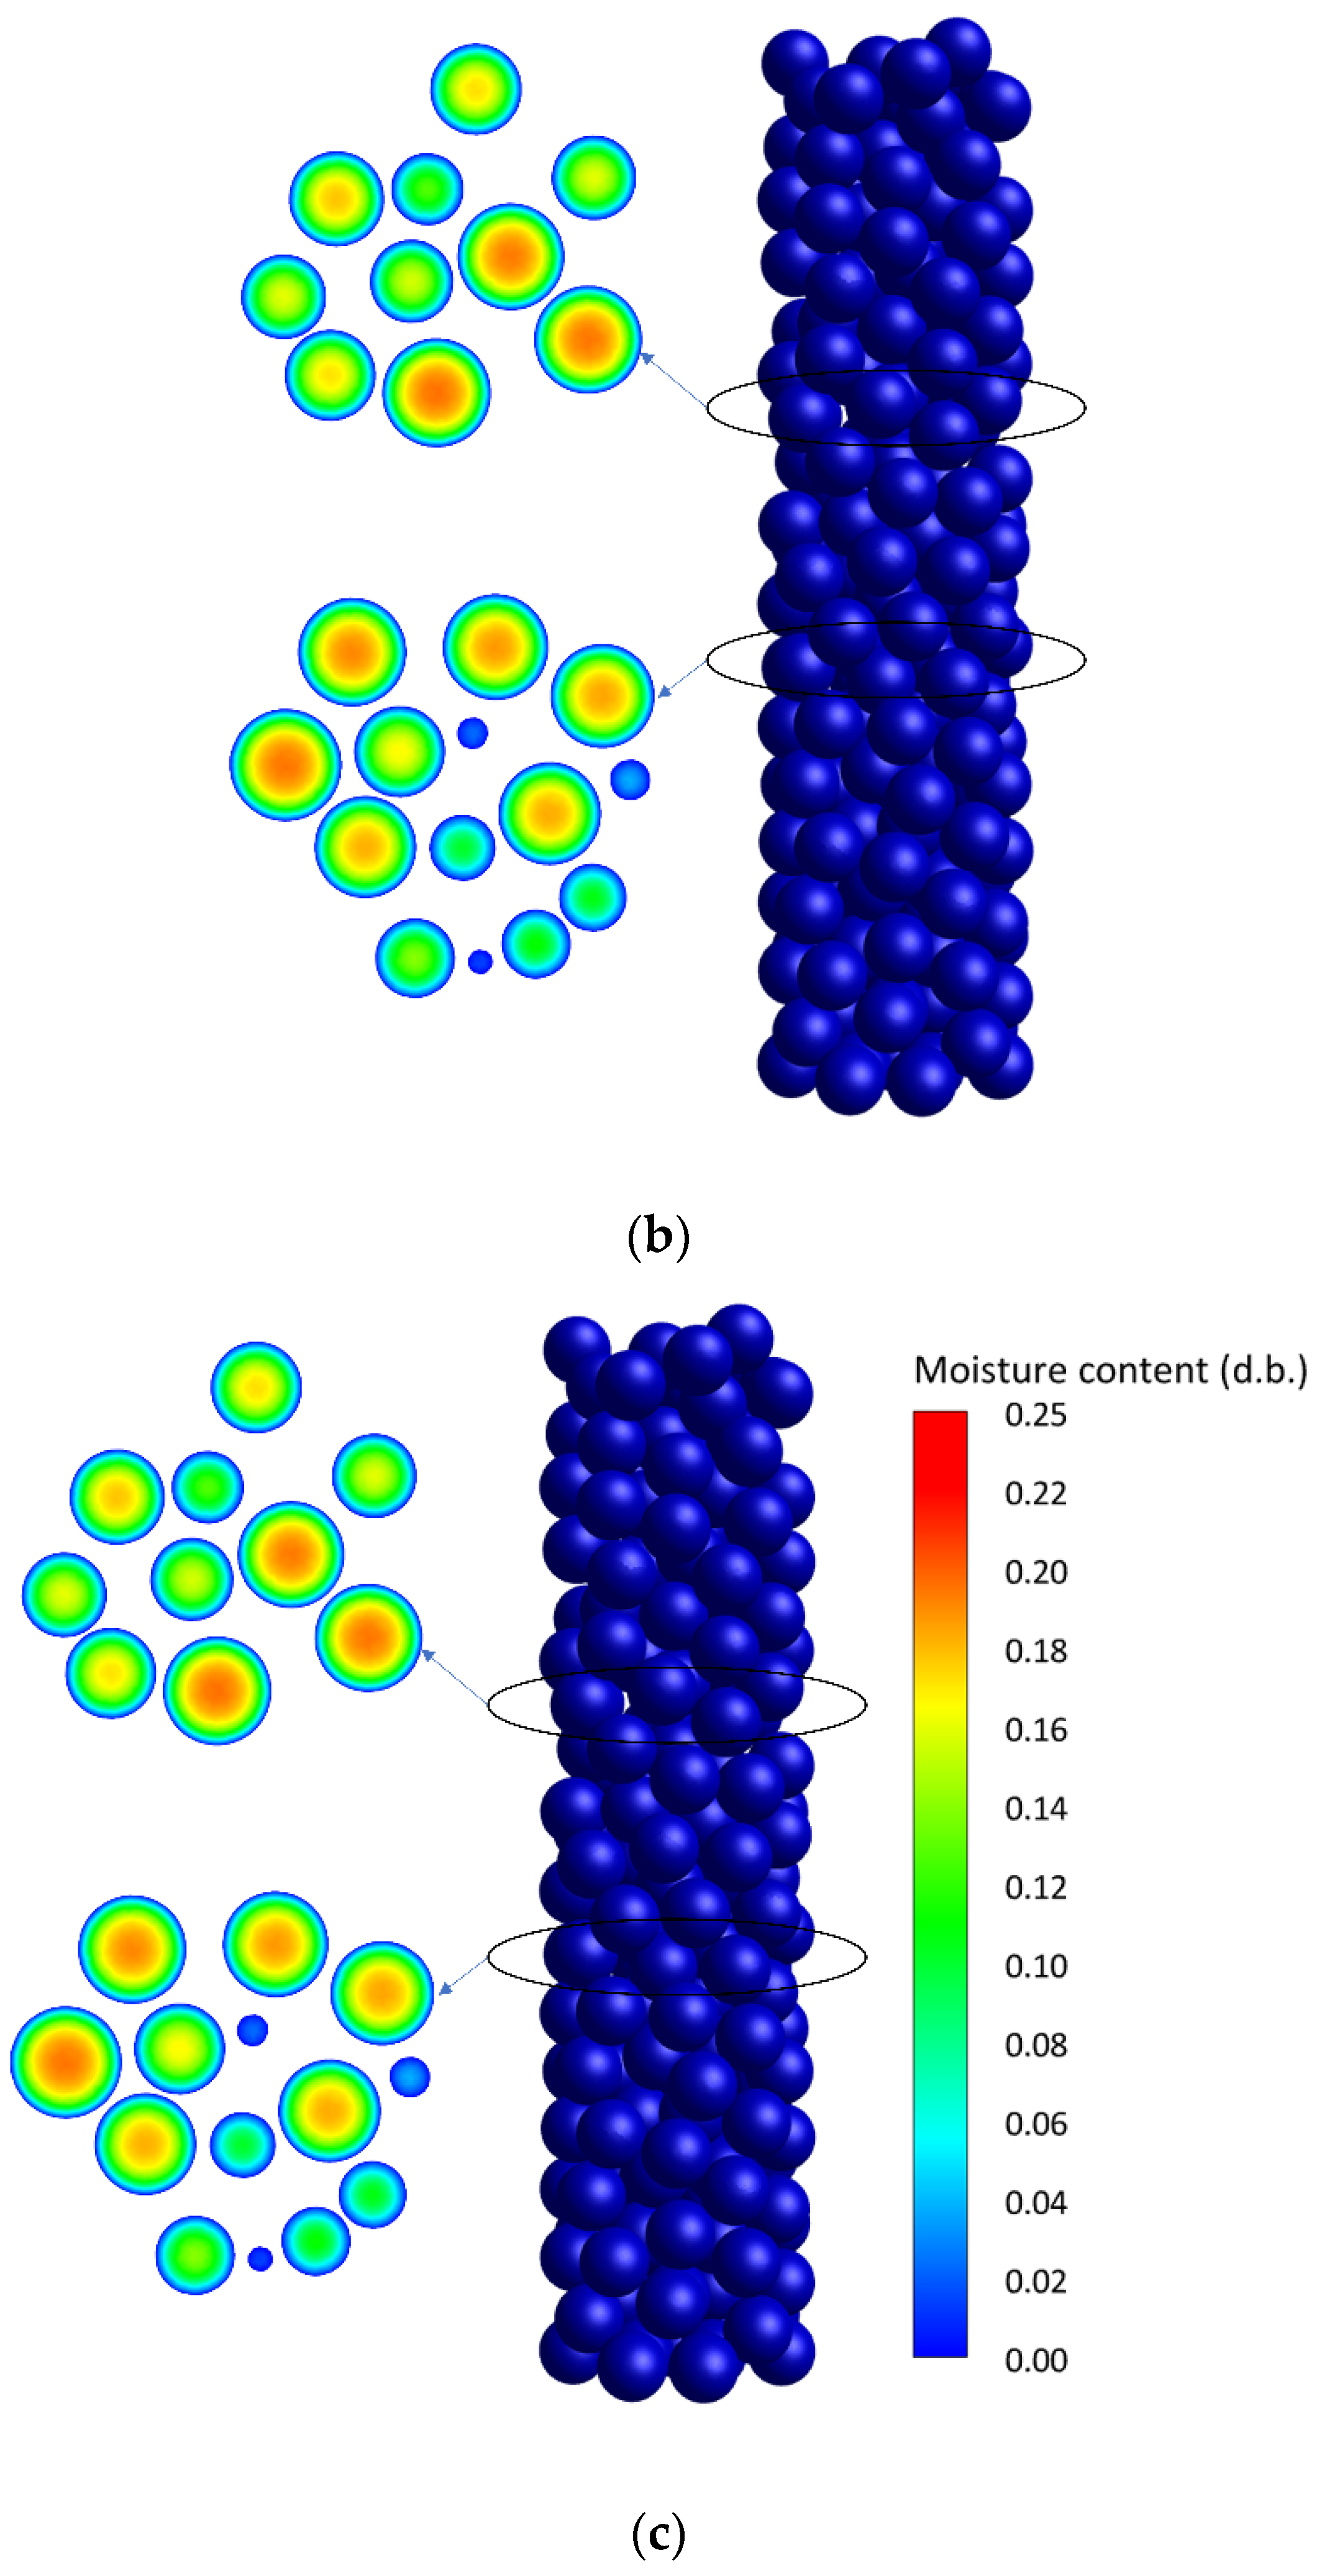
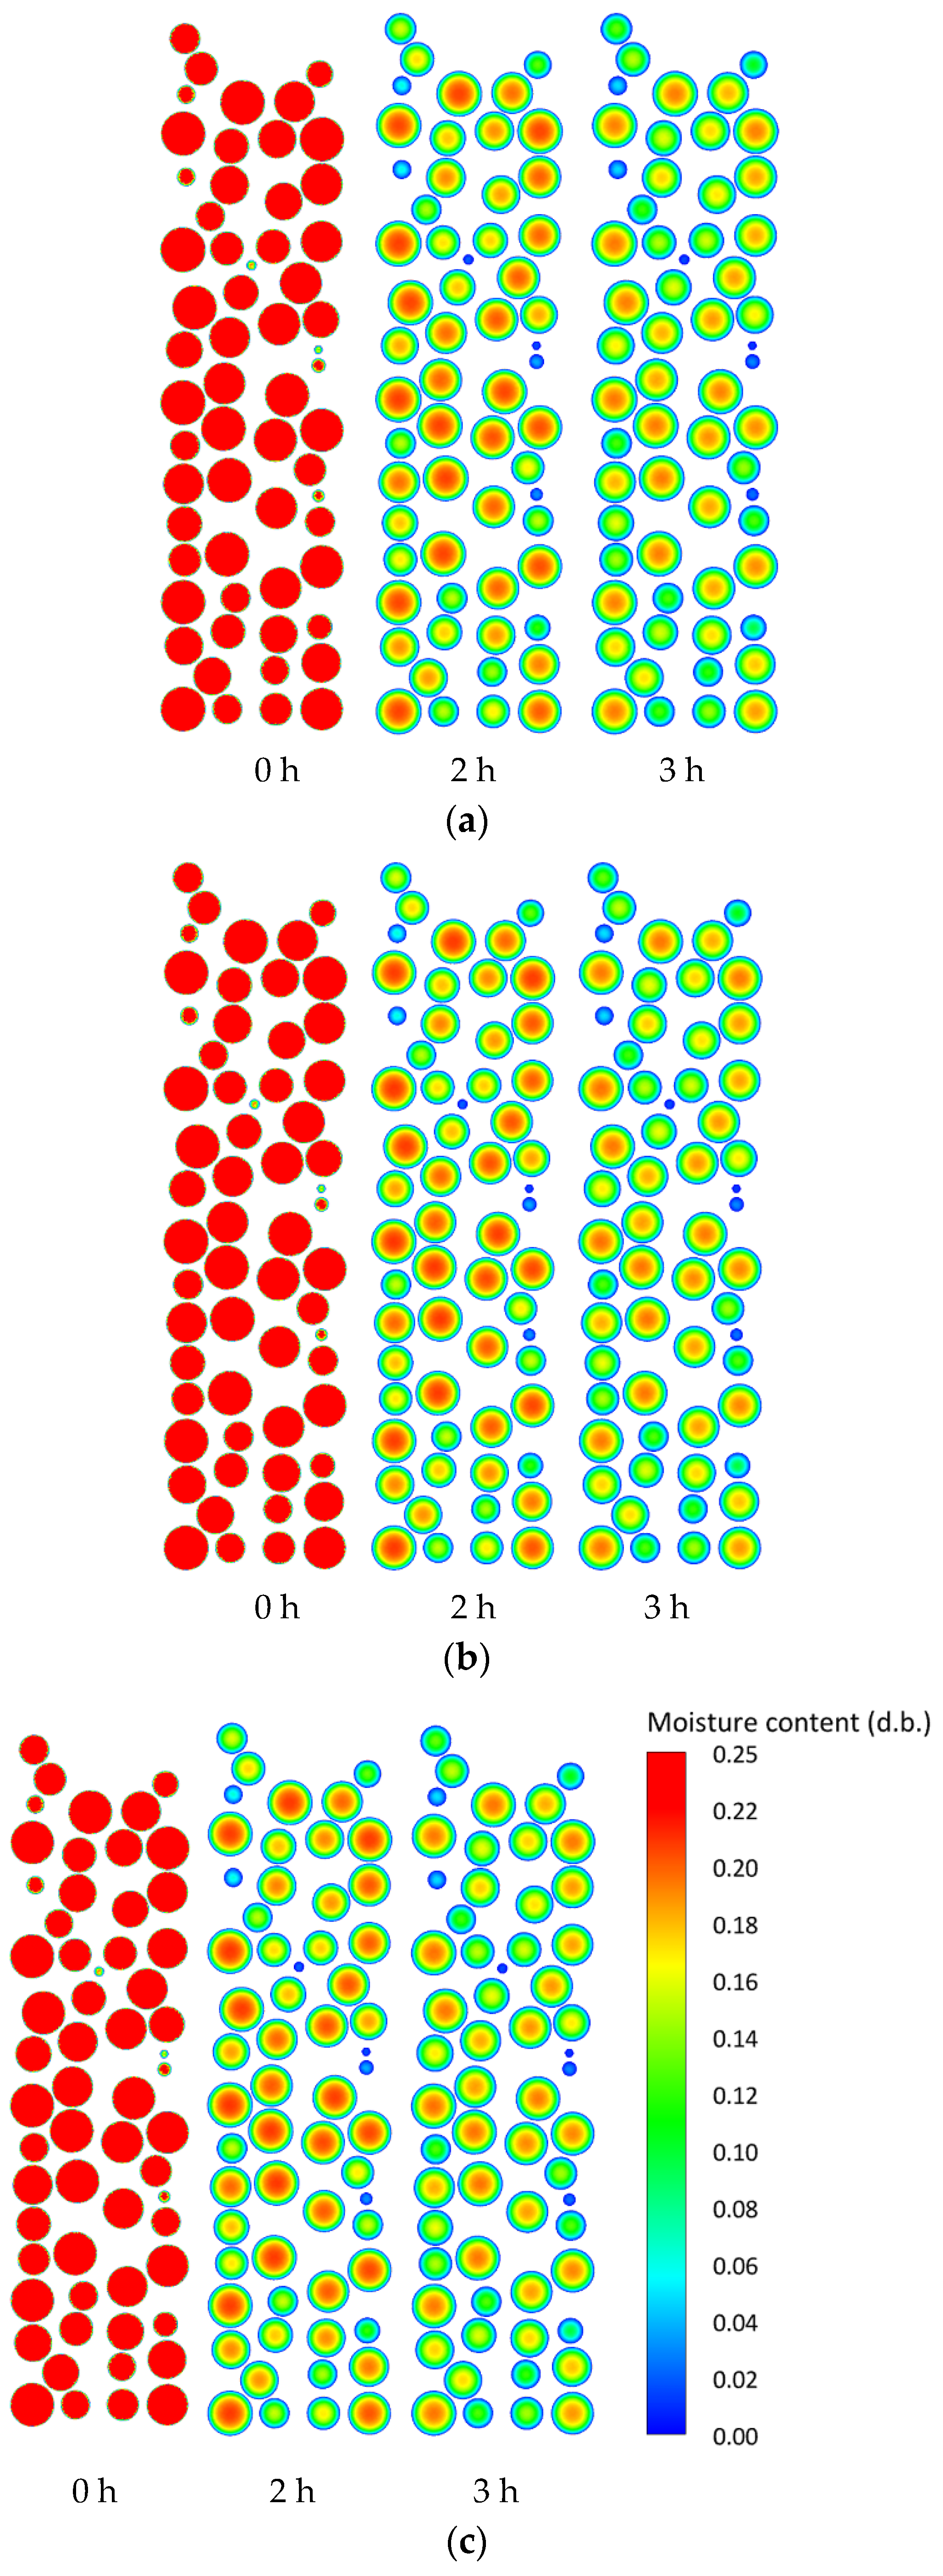
4.7. Moisture Distribution

The study of moisture distribution aims to examine the water distribution patterns at various initial particle packed bed temperatures using an inlet velocity of ν0 = 0.8 m/s and a ventilation temperature of T = 308.15 K. Figure 15 illustrates the water distribution in the packed bed at different heights Z = 10 mm and −10 mm relative to the center point of the bed after 3 h of drying. The uniformity of axial drying in the packed bed is excellent. As the drying time increases, the moisture gradient in the packed bed decreases.
Figure 16 illustrates the moisture distribution at different times on the Y = X plane. During the drying process, water is transferred from the interior of the soybean to the surface, which is contrary to the heat transfer process. The convective mass transfer near the particle surface is significant, while the diffusion of water decelerates as it moves towards the central region. After drying for 2 h, there is still high moisture inside the soybean. After drying for 3 h, the moisture content in the packed bed decreases significantly. The drying effect is effective.
Figure 17 illustrates the variation of moisture content over time in a stacked bed at different particle temperatures. It is evident that when the particle temperature reaches 288 K, the moisture content of soybean particles changes the fastest. This phenomenon further illustrates the perspective that an increase in particle temperature will enhance the water transfer rate in the packed bed. Due to the consideration of the interaction between particles and fluid media, as well as the relative flow mass transfer and solid-phase water diffusion processes, it is expected that the particle temperature in the range of 283 K to 288 K can improve the water transfer rate. Experimental research has shown that it supports the research results [30,31,32].

5. Conclusions

This study examined the porosity, flow dynamics, and heat and moisture transfer within a packed bed of soybeans. The structural characteristics and flow parameters of the packed bed were comprehensively analyzed across various particle size ratios ranging from 4.44 to 6.25. The heat and moisture transfer within a packed bed of soybeans at various particle temperatures were examined, yielding the following research conclusions:
(1)
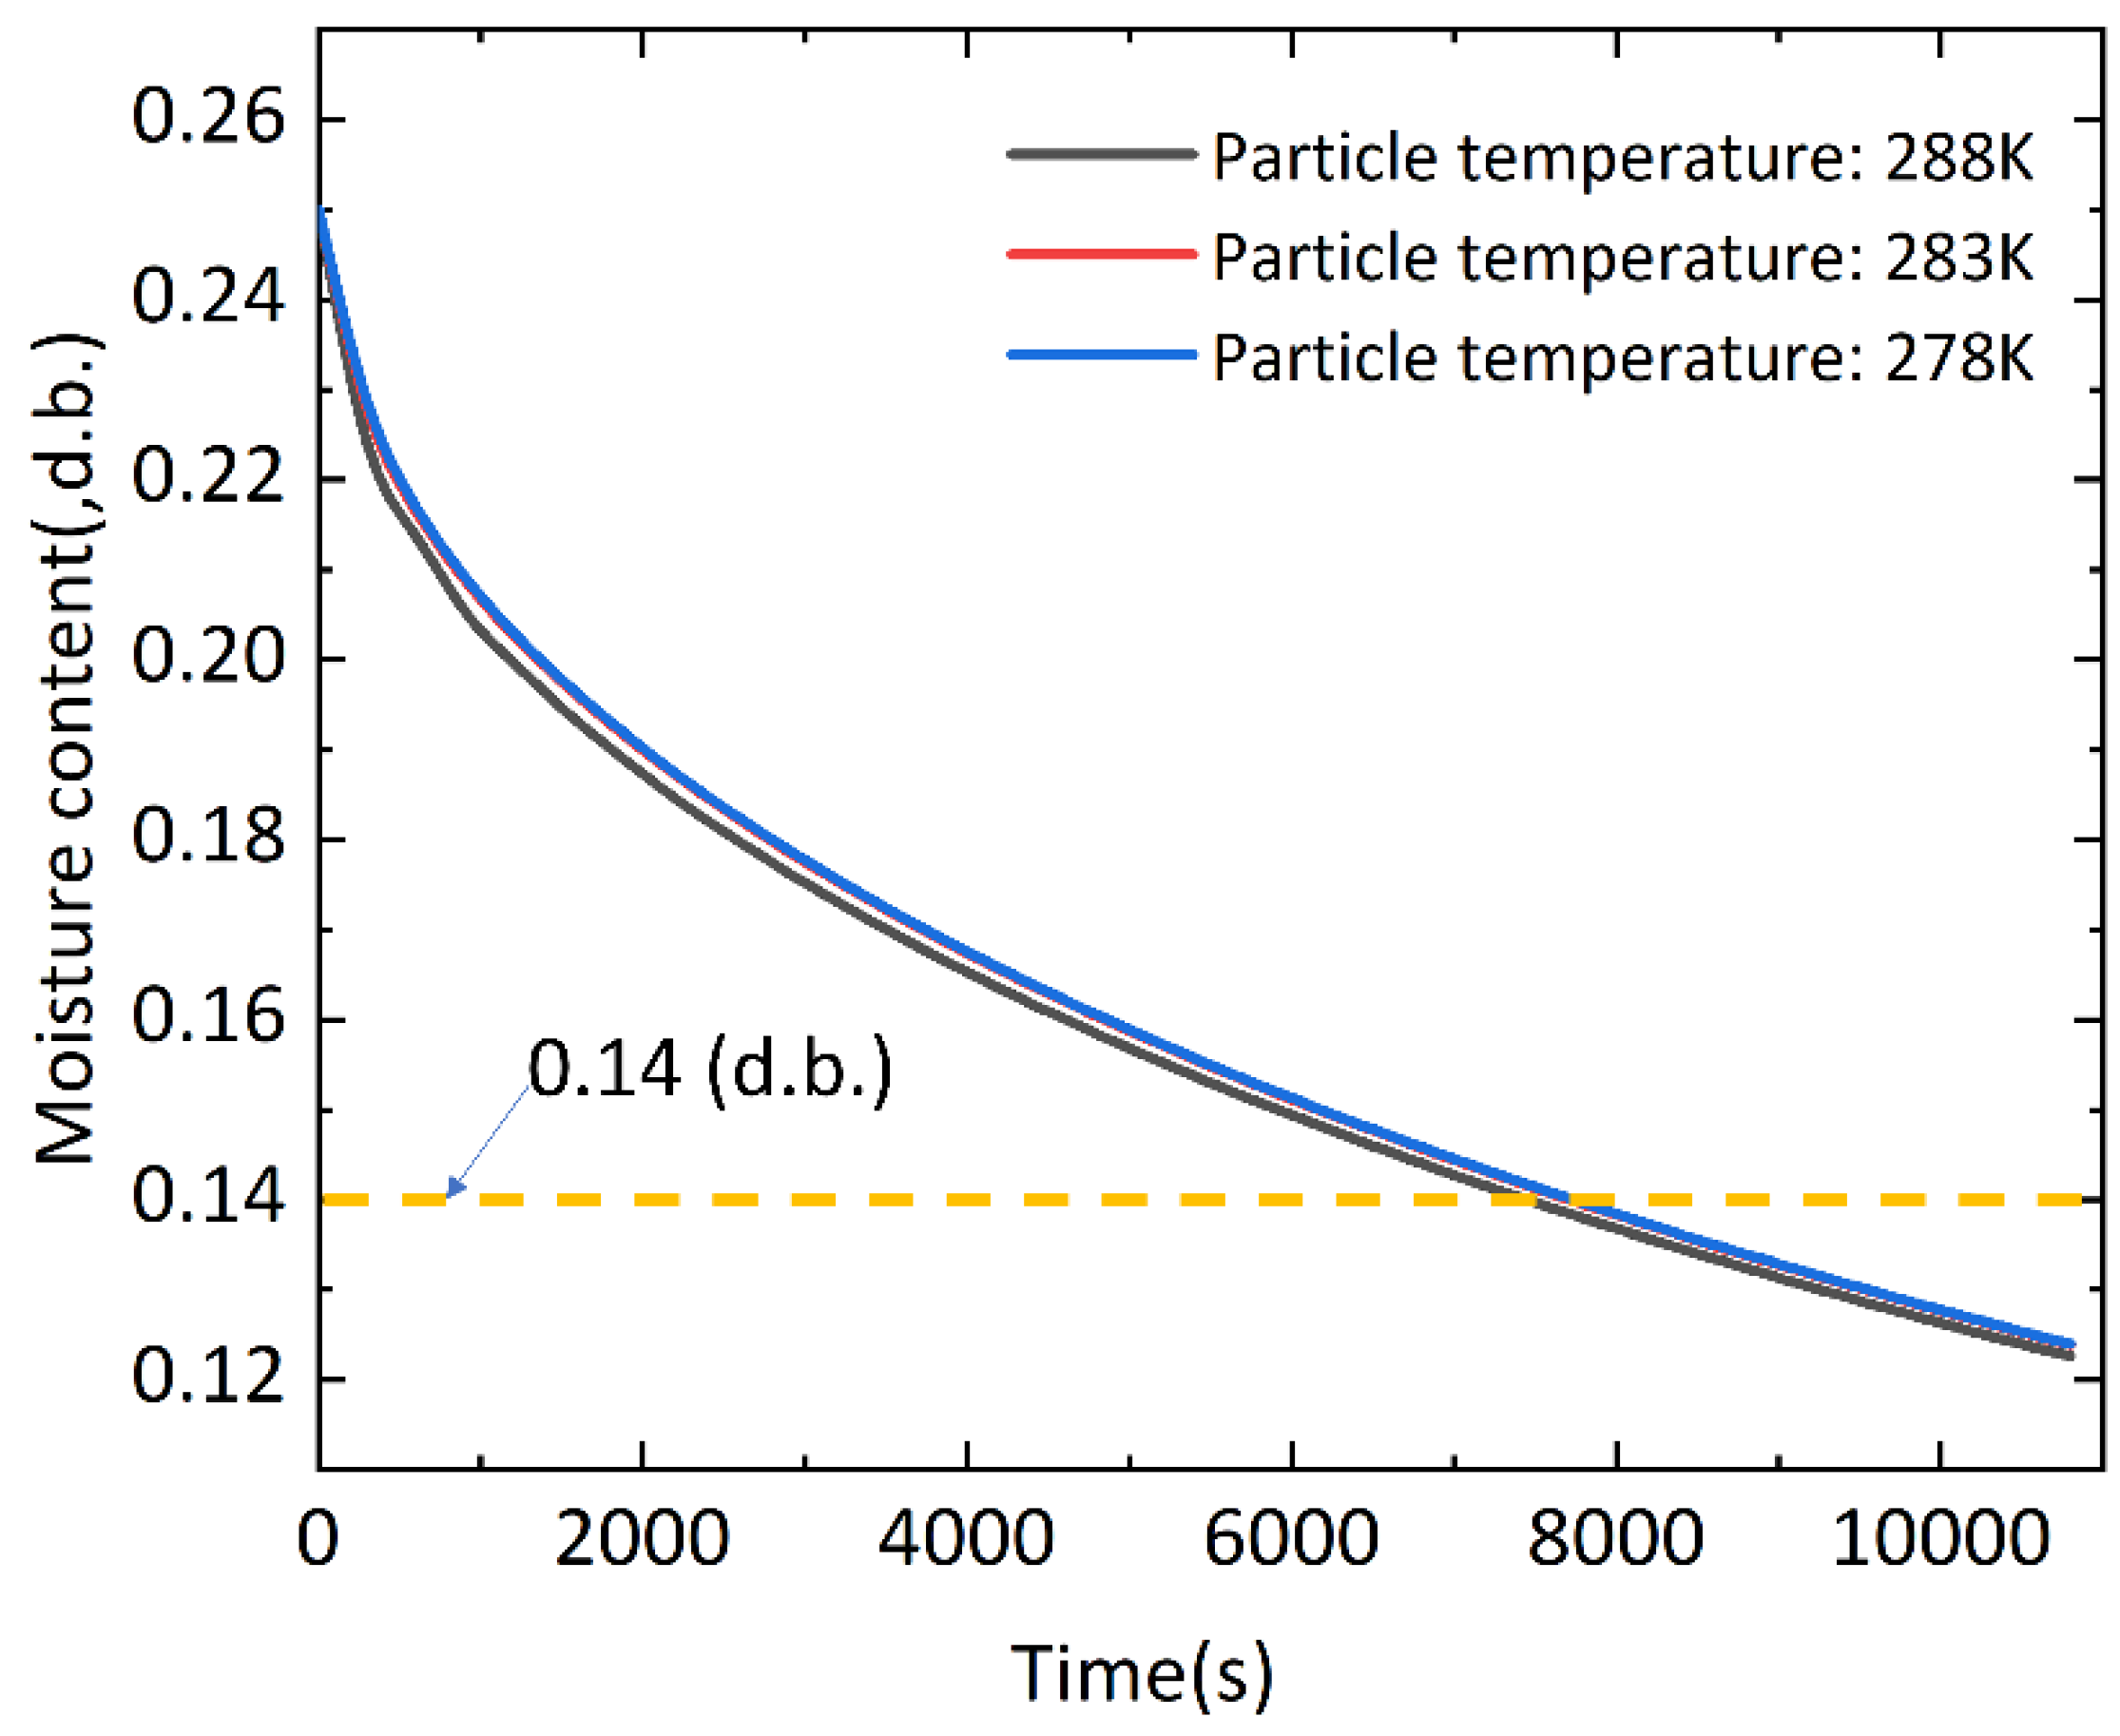
The results indicate that the impact of the tube wall is minimal when the particle size ratio is low. The structural characteristics of the bed have a significant influence on the flow characteristics. Stagnation or backflow can occur in the wakes of the particles, while high velocities are present in areas with high porosity. Furthermore, altering the temperature of soybean particles changes the parameters of transient heat transfer, thereby affecting the convective heat transfer process. As the temperature of soybean granules increases, the water transfer rate in the packed bed also increases, along with the mass transfer rate.
(2)
The temperature distribution of the packed bed is uniformly distributed in steps. The temperature of the hot air gradually increases and the drying rate is accelerated, so the elapsed time to reach safe moisture becomes increasingly less. The molecular diffusion is incomplete, and the temperature uniformity becomes worse.
(3)
Analysis of ventilated drying of soybean pellets reveals that the temperature and moisture of the pellets in the front of the vented inlet change the fastest, while the pellet’s interior remains high in moisture. The moisture differential between the interior and surface of the particles decreases as drying time increases. The local non-equilibrium heat and moisture transfer model proposed in this study correctly predicts soybean particle temperature and moisture fluctuations at various scales.

Author Contributions

Conceptualization, Z.N. and X.L.; methodology, Z.N.; software, Z.N.; validation, Z.N., X.L. and Z.L.; formal analysis, Z.N.; investigation, Z.N.; resources, Z.N.; data curation, Z.N.; writing—original draft preparation, Z.N.; writing—review and editing, Z.N.; visualization, Z.N.; supervision, X.L.; project administration, X.L.; funding acquisition, X.L. All authors have read and agreed to the published version of the manuscript.

Funding

This study was supported by the National Natural Science Foundation of China (Grant No. 51406123) and the University Synergy Innovation Program of Anhui Province (Grant No. GXXT-2022-017), and the Education Revitalization Project of Anhui Province (CN), China (Grand No. 2021cyxy023).

Institutional Review Board Statement

Not applicable.

Informed Consent Statement

Not applicable.

Data Availability Statement

Data are contained within the article.

Conflicts of Interest

The authors declare no conflict of interest.

Nomenclature

fkfriction factor
Remmodified Reynolds number
εrmean porosity of packed bed
Rpacked bed radius
rparticle radius
dpparticle diameter
xpacked bed length
ΔPpressure drop of packed bed
Zaxial height from the center of the packed bed as the origin
Nparticle diameter ratio

References

  1. Fleurat-Lessard, F. Integrated management of the risks of stored grain spoilage by seedborne fungi and contamination by storage mould mycotoxins—An update. J. Stored Prod. Res. 2017, 71, 22–40. [Google Scholar] [CrossRef]
  2. Jian, F.; Jayas, D.S. The Ecosystem Approach to Grain Storage. Agric. Res. 2012, 1, 148–156. [Google Scholar] [CrossRef]
  3. Flinn, P.W.; Subramanyam, B.; Arthur, F.H. Comparison of Aeration and Spinosad for Suppressing Insects in Stored Wheat. J. Econ. Entomol. 2004, 4, 1465–1473. [Google Scholar] [CrossRef]
  4. Manandhar, A.; Milindi, P.; Shah, A. An Overview of the Post-Harvest Grain Storage Practices of Smallholder Farmers in Developing Countries. Agriculture 2018, 8, 57. [Google Scholar] [CrossRef]
  5. Lawrence, J.; Maier, D.E.; Stroshine, R.L. Three-Dimensional Transient Heat, Mass, Momentum, and Species Transfer in the Stored Grain Ecosystem: Part I. Model Development and Evaluation. Trans. ASABE 2013, 56, 179–188. [Google Scholar] [CrossRef]
  6. Subrot Panigrahi, S.; Singh, C.B.; Fielke, J.; Zare, D. Modeling of heat and mass transfer within the grain storage ecosystem using numerical methods: A review. Dry. Technol. 2019, 38, 1677–1697. [Google Scholar] [CrossRef]
  7. Godfray, H.C.J.; Beddington, J.R.; Crute, I.R.; Haddad, L.; Lawrence, D.; Muir, J.F.; Pretty, J.; Robinson, S.; Thomas, S.M.; Toulmin, C. Food Security: The Challenge of Feeding 9 Billion People. Science 2010, 327, 812–818. [Google Scholar] [CrossRef] [PubMed]
  8. Mohseni, M.; Peters, B.; Baniasadi, M. Conversion analysis of a cylindrical biomass particle with a DEM-CFD coupling approach. Case Stud. Therm. Eng. 2017, 10, 343–356. [Google Scholar] [CrossRef]
  9. Niu, Q.; Wang, N.-X. Study of heat transfer by using DEM–CFD method in a randomly packed pebble-bed reactor. Nucl. Sci. Tech. 2019, 30, 28. [Google Scholar] [CrossRef]
  10. Nourmohamadi-Moghadami, A.; Zare, D.; Singh, C.B.; Stroshine, R.L. Filling of a grain silo. Part 1: Investigation of fine material distribution in a small scale centre-filled silo. Biosyst. Eng. 2020, 191, 145–156. [Google Scholar] [CrossRef]
  11. Mandas, N.; Habte, M. PH—Postharvest Technology: Numerical Simulation Static-Bed Drying of Barley. Biosyst. Eng. 2002, 82, 313–319. [Google Scholar] [CrossRef]
  12. Bai, H.; Theuerkauf, J.; Gillis, P.A.; Witt, P.M. A Coupled DEM and CFD Simulation of Flow Field and Pressure Drop in Fixed Bed Reactor with Randomly Packed Catalyst Particles. Ind. Eng. Chem. Res. 2009, 48, 4060–4074. [Google Scholar] [CrossRef]
  13. Wehinger, G.D.; Fütterer, C.; Kraume, M. Contact Modifications for CFD Simulations of Fixed-Bed Reactors: Cylindrical Particles. Ind. Eng. Chem. Res. 2017, 56, 87–99. [Google Scholar] [CrossRef]
  14. Dixon, A.G.; Nijemeisland, M.; Stitt, E.H. Systematic mesh development for 3D CFD simulation of fixed beds: Contact points study. Comput. Chem. Eng. 2013, 48, 135–153. [Google Scholar] [CrossRef]
  15. Dixon, A.G.; Nijemeisland, M.; Stitt, H. CFD Simulation of Reaction and Heat Transfer Near the Wall of a Fixed Bed. Int. J. Chem. React. Eng. 2003, 1, 20121029. [Google Scholar] [CrossRef]
  16. Guardo, A.; Coussirat, M.; Larrayoz, M.A.; Recasens, F.; Egusquiza, E. CFD Flow and Heat Transfer in Nonregular Packings for Fixed Bed Equipment Design. Ind. Eng. Chem. Res. 2004, 43, 7049–7056. [Google Scholar] [CrossRef]
  17. Kuroki, M.; Ookawara, S.; Ogawa, K. A High-Fidelity CFD Model of Methane Steam Reforming in a Packed Bed Reactor. J. Chem. Eng. Jpn. 2009, 42, s73–s78. [Google Scholar] [CrossRef]
  18. Guo, Z.; Sun, Z.; Zhang, N.; Ding, M.; Cao, X. Radial porosity peak at the centerline of packed beds with small tube to particle diameter ratios. Powder Technol. 2017, 319, 445–451. [Google Scholar] [CrossRef]
  19. Eppinger, T.; Seidler, K.; Kraume, M. DEM-CFD simulations of fixed bed reactors with small tube to particle diameter ratios. Chem. Eng. J. 2011, 166, 324–331. [Google Scholar] [CrossRef]
  20. Mueller, G.E. Radial porosity in packed beds of spheres. Powder Technol. 2010, 203, 626–633. [Google Scholar] [CrossRef]
  21. Liu, H.B.; Zhao, C.Y. Effect of Radial porosity oscillation on the thermal performance of packed bed latent heat storage. Engineering 2020, 7, 515–525. [Google Scholar] [CrossRef]
  22. Niven, R.K. Reply to the comments by D. Stevenson on “Physical insight into the Ergun and Wen and Yu equations for fluid flow in packed and fluidised beds” by R.K. Niven [Chemical Engineering Science, 57 (2002), 527–534]. Chem. Eng. Sci. 2005, 60, 299–300. [Google Scholar] [CrossRef]
  23. Erdim, E.; Akgiray, Ö.; Demir, İ. A revisit of pressure drop-flow rate correlations for packed beds of spheres. Powder Technol. 2015, 283, 488–504. [Google Scholar] [CrossRef]
  24. Ergun, S.; Orning, A.A. Fluid Flow through Randomly Packed Columns and Fluidized Beds. Ind. Eng. Chem. 1949, 41, 1179–1184. [Google Scholar] [CrossRef]
  25. Anthony, G.D. General correlation for pressure drop through randomly-packed beds of spheres with negligible wall effects. AIChE J. 2023, 69, e18035. [Google Scholar] [CrossRef]
  26. Dixon, A.G.; Walls, G.; Stanness, H.; Nijemeisland, M.; Stitt, E.H. Experimental validation of high Reynolds number CFD simulations of heat transfer in a pilot-scale fixed bed tube. Chem. Eng. J. 2012, 200–202, 344–356. [Google Scholar] [CrossRef]
  27. Wehinger, G.D.; Eppinger, T.; Kraume, M. Evaluating Catalytic Fixed-Bed Reactors for Dry Reforming of Methane with Detailed CFD. Chem. Ing. Tech. 2015, 87, 734–745. [Google Scholar] [CrossRef]
  28. Winterberg, M.; Tsotsas, E.; Krischke, A.; Vortmeyer, D. A simple and coherent set of coefficients for modelling of heat and mass transport with and without chemical reaction in tubes filled with spheres. Chem. Eng. Sci. 2000, 55, 967–979. [Google Scholar] [CrossRef]
  29. Wang, L.-B.; Tao, W.-Q.; Wang, Q.-W.; Wong, T.T. Experimental study of developing turbulent flow and heat transfer in ribbed convergent/divergent square ducts. Int. J. Heat Fluid Flow 2001, 22, 603–613. [Google Scholar] [CrossRef]
  30. Hasan, M.D.M.; Hu, X.; Gunawan, R.; Li, C.-Z. Pyrolysis of large mallee wood particles: Temperature gradients within a pyrolysing particle and effects of moisture content. Fuel Process. Technol. 2017, 158, 163–171. [Google Scholar] [CrossRef]
  31. Obeng, G.Y.; Adjaloo, M.K.; Donkor, P. Effect of Temperature, Moisture Content, Particle Size and Roasting on Shea Butter Extraction Efficiency. Int. J. Food Eng. 2010, 6. [Google Scholar] [CrossRef]
  32. Ishii, K.; Furuichi, T. Influence of moisture content, particle size and forming temperature on productivity and quality of rice straw pellets. Waste Manag. 2014, 34, 2621–2626. [Google Scholar] [CrossRef] [PubMed]
Figure 1. Physical models used to simulate a randomly packed bed: (a) D/dp = 4.44; (b) D/dp = 5.6; and (c) D/dp = 6.25.
Applsci 14 01935 g001
Figure 2. Graphical representation of a coaxial cylindrical surface.
Applsci 14 01935 g002
Figure 3. Schematic diagram of the gap model and grid division of D/dp = 4.44.
Applsci 14 01935 g003
Figure 4. Radial porosity distribution and subsurfaces along the radial direction: (a) D/dp = 4.44; (b) D/dp = 5.6; and (c) D/dp = 6.25.
Applsci 14 01935 g004aApplsci 14 01935 g004bApplsci 14 01935 g004c
Figure 5. Comparison of axial porosity under different particle size ratios: (a) D/dp = 4.44; (b) D/dp = 5.6; and (c) D/dp = 6.25.
Applsci 14 01935 g005aApplsci 14 01935 g005b
Figure 6. Effect of grid size on particle bed pressure drop.
Applsci 14 01935 g006
Figure 7. Relationship between the Reynolds number and friction coefficient under different particle size ratios.
Applsci 14 01935 g007
Figure 8. Velocity streamlines in beds with different particle size ratios at the inlet velocity v = 0.8 m/s: (a) D/dp = 4.44; (b) D/dp = 5.6; and (c) D/dp = 6.25.
Applsci 14 01935 g008
Figure 9. Fluid velocity and temperature distribution in a 180 mm packed beds with a particle size ratio of 4.44: (a) vinlet = 0.5 m/s; (b) vinlet = 0.8 m/s; and (c) vinlet = 1.0 m/s.
Applsci 14 01935 g009
Figure 10. Radial distribution of fluid velocity at different inlet velocities: (a) D/dp = 4.44; (b) D/dp = 5.6; and (c) D/dp = 6.25.
Applsci 14 01935 g010aApplsci 14 01935 g010b
Figure 11. Radial distribution of fluid temperature in a 180mm packed beds with different inlet velocities: (a) D/dp = 4.44; (b) D/dp = 5.6; and (c) D/dp = 6.25.
Applsci 14 01935 g011aApplsci 14 01935 g011b
Figure 12. The temperature distribution contour at the Z = 10 mm, and −10 mm plane after 300 s of drying at different particle temperature: (a) 288 K; (b) 283 K; (c) 278 K.
Applsci 14 01935 g012aApplsci 14 01935 g012b
Figure 13. The temperature distribution contour at the Y = X plane after 300 s of drying at different particle temperature: (a) 288 K; (b) 283 K; (c) 278 K.
Applsci 14 01935 g013
Figure 14. Average temperature of particles in packed beds at different times.
Applsci 14 01935 g014
Figure 15. The moisture distribution at the Z = 10 mm and −10 mm plane after 3 h of drying at different particle temperature: (a) 288 K; (b) 283 K; (c) 278 K.
Applsci 14 01935 g015aApplsci 14 01935 g015b
Figure 16. The moisture distribution at different times at the Y = X plane at different particle temperature: (a) 288 K; (b) 283 K; (c) 278 K.
Applsci 14 01935 g016
Figure 17. Average moisture of particles in packed beds at different times.
Applsci 14 01935 g017
Table 1. Particle parameters used in the DEM simulation.
ParameterSymbolUnitValue
Cylinder radiusDmm26.64/33.6/37.5
Particle radiusdpmm6
Cylinder-to-particle size ratioD/dp 4.44/5.6/6.25
Particle densityρpkg/m31257
Shear modulusGPa2.71 × 108
Young’s modulusEPa7.588 × 108
Poisson’s ratioν 0.4
Restitution coefficientepp 0.627
Static friction coefficientμst 0.2
Rolling friction coefficientμr 0.02
Table 2. Thermal-property parameters of soybean kernels and hot air.
MaterialSymbolValue
Soybeanρs, kg/m31257
ks, W/(m·K)0.136
cs, J/(kg·K)cs = 2000 + 35.5(Ys,db/1 + Ys,db)
Airρf, kg/m3ρf = 8.666 × 10⁻⁶Tf2 − 4.318 × 10⁻³Tf + 1.228
µf, kg/(m·s)µf = 1.691 × 10⁻⁵ + 4.984 × 10⁻⁸Tf
cf, J/(kg·K)cf = 1002.9 + 0.0054Tf
kf, W/(m·K)kf = −2.401 × 10⁻⁸Tf 2 + 7.554 × 10⁻⁵Tf + 2.364 × 10⁻²
Disclaimer/Publisher’s Note: The statements, opinions and data contained in all publications are solely those of the individual author(s) and contributor(s) and not of MDPI and/or the editor(s). MDPI and/or the editor(s) disclaim responsibility for any injury to people or property resulting from any ideas, methods, instructions or products referred to in the content.

