Article

Advanced Deep Learning Model for Predicting the Academic Performances of Students in Educational Institutions

by
Laith H. Baniata
1,*,
Sangwoo Kang
1,*,
Mohammad A. Alsharaiah
2,† and
Mohammad H. Baniata
3
1
School of Computing, Gachon University, Seongnam 13120, Republic of Korea
2
Department of Data Science and Artificial Intelligence, Al-Ahliyya Amman University, Amman 19111, Jordan
3
Ubion, Seoul 08378, Republic of Korea
*
Authors to whom correspondence should be addressed.
This Author is designated as a co-first author and he does not share correspondence.
Appl. Sci. 2024, 14(5), 1963; https://doi.org/10.3390/app14051963
Submission received: 9 February 2024 / Revised: 22 February 2024 / Accepted: 23 February 2024 / Published: 28 February 2024
(This article belongs to the Special Issue Deep Learning and Technology-Assisted Education)

Abstract

:
Educational institutions are increasingly focused on supporting students who may be facing academic challenges, aiming to enhance their educational outcomes through targeted interventions. Within this framework, leveraging advanced deep learning techniques to develop recommendation systems becomes essential. These systems are designed to identify students at risk of underperforming by analyzing patterns in their historical academic data, thereby facilitating personalized support strategies. This research introduces an innovative deep learning model tailored for pinpointing students in need of academic assistance. Utilizing a Gated Recurrent Neural Network (GRU) architecture, the model is rich with features such as a dense layer, max-pooling layer, and the ADAM optimization method used to optimize performance. The effectiveness of this model was tested using a comprehensive dataset containing 15,165 records of student assessments collected across several academic institutions. A comparative analysis with existing educational recommendation models, like Recurrent Neural Network (RNN), AdaBoost, and Artificial Immune Recognition System v2, highlights the superior accuracy of the proposed GRU model, which achieved an impressive overall accuracy of 99.70%. This breakthrough underscores the model’s potential in aiding educational institutions to proactively support students, thereby mitigating the risks of underachievement and dropout.

1. Introduction

Educational institutions are treasure troves of data, comprising detailed information about the institutions and their student body, notably academic performances. Harnessing this wealth of data is pivotal for these institutions, as it holds the key to unlocking actionable insights. For instance, a sophisticated predictive model that can accurately interpret this data is indispensable for fostering students’ academic success. The goal is to leverage the rich data on student performance [1] to drive educational improvements. It is important to recognize that student performance is influenced by a myriad of factors, a concept visually represented in Figure 1 [2]. The objectives of learning analysis are multifaceted, as thoroughly detailed in [3]. Central to these objectives is the role of educational institutions in monitoring and evaluating the learning process. This encompasses predicting student outcomes, providing effective mentorship, and overseeing advisory services. A paramount goal is to offer meaningful feedback to both educators and learners, gauging the efficacy and impact of the learning process. Based on these insights, strategic alterations to the educational framework are advised. Empowering students with autonomy in their learning endeavors is highly recommended, as is encouraging self-reflection based on previous experiences and accomplishments.
As time progresses, the data repositories of educational organizations have expanded, transforming into massive pools of latent knowledge. This hidden information is brimming with potential yet poses significant challenges in terms of storage, capture, analysis, and representation. These complexities have necessitated the reclassification of these databases as big data [4,5,6]. Faced with this paradigm shift, educational institutions are now seeking advanced analytical tools capable of deciphering both student and institutional performances [7]. Data centers in educational settings often exhibit big data characteristics and apply specific data mining methods to extract hidden insights. The synergy between data mining and educational systems, as illustrated in Figure 2, reveals the advantageous impact these insights can have on students, enriching their educational experience with knowledge gleaned from expansive and complex datasets.
This research contributes significantly by employing a Gated Recurrent Neural Network (GRU). The GRU model excels in identifying crucial hidden patterns—the key features within learner records at educational institutions. Given the typically large and intricate nature of these datasets, the GRU model serves as an ideal foundation for learning recommendation systems, which aim to boost student performance through in-depth internal assessments, moving beyond the scope of conventional statistical models. The GRU is particularly proficient in handling non-stationary sequences and effectively assessing student performance. Its comparative advantage over other deep learning models, such as RNNs, and various machine learning algorithms lies in its ability to bypass long-term dependency challenges and offer superior interpretability.
This study aimed to unveil and assess a cutting-edge deep learning model engineered to identify students who are not meeting academic expectations in educational environments. By incorporating a sophisticated Gated Recurrent Neural Network (GRU) complemented with features such as dense layers, max-pooling layers, and the ADAM optimization algorithm, the objective was to enable educational institutions to pinpoint students in need of additional academic support. The validation of this model’s efficacy was performed using a dataset with 15,165 student assessment records across various academic institutions. The goal was to showcase the model’s unparalleled accuracy in classifying academically at-risk students compared to other educational recommendation systems, thus providing a valuable resource for enhancing the educational trajectories of students through the strategic analysis of their academic history. Based on the aim of the paper to evaluate the effectiveness of a Gated Recurrent Neural Network (GRU) model on identifying and classifying academically underperforming students, here are the proposed research hypotheses:
Hypothesis 1 (H1):
The GRU-based deep learning model significantly outperforms traditional educational recommendation systems in accurately identifying academically underperforming students within educational institutions.
Hypothesis 2 (H2):
The use of dense layers, max-pooling layers, and the ADAM optimization algorithm within the GRU model contributes to a higher accuracy rate in classifying student performance compared to models that do not utilize these advanced neural network features.
Hypothesis 3 (H3):
The GRU model’s performance, as measured in terms of accuracy, precision, recall, and F1-score, is robust across diverse datasets comprising student assessment records from various academic institutions.
The structure of this research paper is organized into various sections. Section 2 outlines the related works. This is followed by Section 3, which details the methods used in this research. Section 4 delves into the datasets utilized and the classification methods employed. Section 5 is dedicated to presenting the experimental results. Finally, Section 6 concludes the paper and discusses potential future work.

2. Related Works

Deep learning algorithms have recently become prevalent in solving problems across various domains. They have found applications in the medical sector for disease prediction [8,9], in understanding complex behaviors in systems such as in biology [10], and in many other areas impacting daily life [11], including customer service, sport forecasting, autonomous vehicles, and weather prediction [12]. This research aims to explore the application of deep learning methods to datasets in educational institutions. With students increasingly engaging in online learning through specialized educational software, there is a rise in educational big data [13]. To extract meaningful patterns from this data, a variety of techniques are employed. Educational machine learning and deep learning tools are utilized in data mining to uncover hidden insights and patterns within educational settings [14]. Additionally, these techniques are applied to assess the effectiveness of learning systems, such as Moodle [15]. Machine learning (ML) and deep learning (DL) are also employed for the classification and analysis of useful patterns that can be pivotal in predicting various educational outcomes [16]. These methods are instrumental in shaping a framework to optimize the learning process of students, ensuring a more effective educational journey [17]. The study in [18] explored how students’ approaches to learning correlate with measurable learning outcomes, focusing on problem-solving skills evaluated through multiple-choice exams. It delved into the cognitive aspects of problem solving to better understand processes and principles. Machine learning has been crucial in identifying learners’ styles and pinpointing areas where students may face difficulties [19], as well as in organizing educational content effectively and suggesting learning pathways [20]. In the realm of educational institutions, machine learning algorithms have been instrumental in categorizing students. For example, Ref. [21] examined several machine learning algorithms, including J48, Random Forest, PART, and Bayes Network, for classification purposes. The primary objective of this research was to boost students’ academic performances and reduce course dropout rates. The findings from [21] indicate that the Random Forest algorithm outperformed the others in achieving these goals.
Ref. [22] employed data log files from Moodle to create a model capable of predicting final course grades in an educational institution. Ref. [23] developed a recommendation system for a programming tutoring system, designed to automatically adjust to students’ interests and knowledge levels. Additionally, ref. [24] used machine learning (ML) techniques to study students’ learning behaviors, focusing on insights derived from the educational environment, particularly from mid-term and final exams. Their model aimed to help teachers reduce dropout rates and improve student performance. Ref. [25] suggested a model for categorizing learners based on demographics and average course attendance. Ref. [26] applied artificial intelligence and machine learning algorithms to track students in e-learning environments. They created a model to gather and process data related to e-learning courses on the Moodle platform. Finally, ref. [27] introduced a framework to analyze the characteristics of learning behavior, particularly during problem-solving activities on online learning platforms. This framework was designed to function effectively while students are actively engaged in these online environments.
In his study, ref. [28] examined the relationship between absenteeism and academic performance across five years of a degree at a European university, where attending classes is mandatory. In analyzing data from 694 students over an academic year, the study revealed that absenteeism’s negative impact on grades diminishes over the years, most notably affecting first-year students. Additionally, through cluster analysis, three distinct attendance behaviors emerged: consistent attenders, strategic absentees aligning with policy requirements, and frequent absentees unaffected by the policy. This research highlights the varying effectiveness of compulsory attendance on different student groups. In Addition, ref. [29] developed an artificial neural network designed to predict a student’s likelihood of passing a specific course, importantly, without relying on personal or sensitive information that could infringe on student privacy. The model was trained using data from 32,000 students at The Open University in the United Kingdom, incorporating details such as the number of attempts at the course, the average number of assessments, the course pass rate, the average engagement with online materials, and the total number of clicks within the virtual learning environment. The key metrics for the model’s performance include an accuracy of 93.81%, a precision of 94.15%, a recall rate of 95.13%, and an F1-score of 94.64%. These promising results offer educational authorities valuable insights for implementing strategies that mitigate dropout rates and enhance student achievement. Ref [30] introduced a composite deep learning framework that merges the capabilities of Convolutional Neural Networks (CNN) and Recurrent Neural Networks (RNN) into a CNN-RNN model. This model leverages a CNN to identify and prioritize local key features while mitigating the curse of dimensionality and employs an RNN to capture the semantic relationships among these features. Experimental outcomes reveal that this integrated CNN-RNN model surpasses traditional deep learning models by a margin of 3.16%, elevating the accuracy from 73.07% in a standalone Artificial Neural Network (ANN) to 79.23% in the combined CNN-RNN approach.

3. Background

3.1. Artificial Immune Recognition System v2.0

Numerous studies have been inspired by the capabilities of the Artificial Immune Recognition System (AIRS), with several applications successfully incorporating this method. AIRS2, in particular, has garnered significant attention from researchers aiming to develop models based on immune system methodologies to provide solutions to complex problems [31]. The fundamental principle of AIRS2 is to create a central data point that forms a tailored space for each distinct class, thereby clarifying and enriching the learning process. This method primarily focuses on primary data points selectively identified by the AIS system. While AIS is known for generating memory cells, AIRS2 and other similar methods use these points primarily for making predictive configurations. AIRS2 is commonly used in supervised learning for classification tasks. AIRS2 is an adaptive technique inspired by the biological immune system, deemed effective for challenging tasks such as classification [32]. A key advantage of AIRS2 is its ability to reduce the memory cell pool, addressing the challenges of assigning class membership to each cell. As a supervised learning algorithm, AIRS2 incorporates mechanisms like resource competition, affinity maturation, clonal selection, and memory cell generation [32]. These features make AIRS2 a robust tool in the realm of artificial immune systems, offering efficient solutions in various supervised learning scenarios.

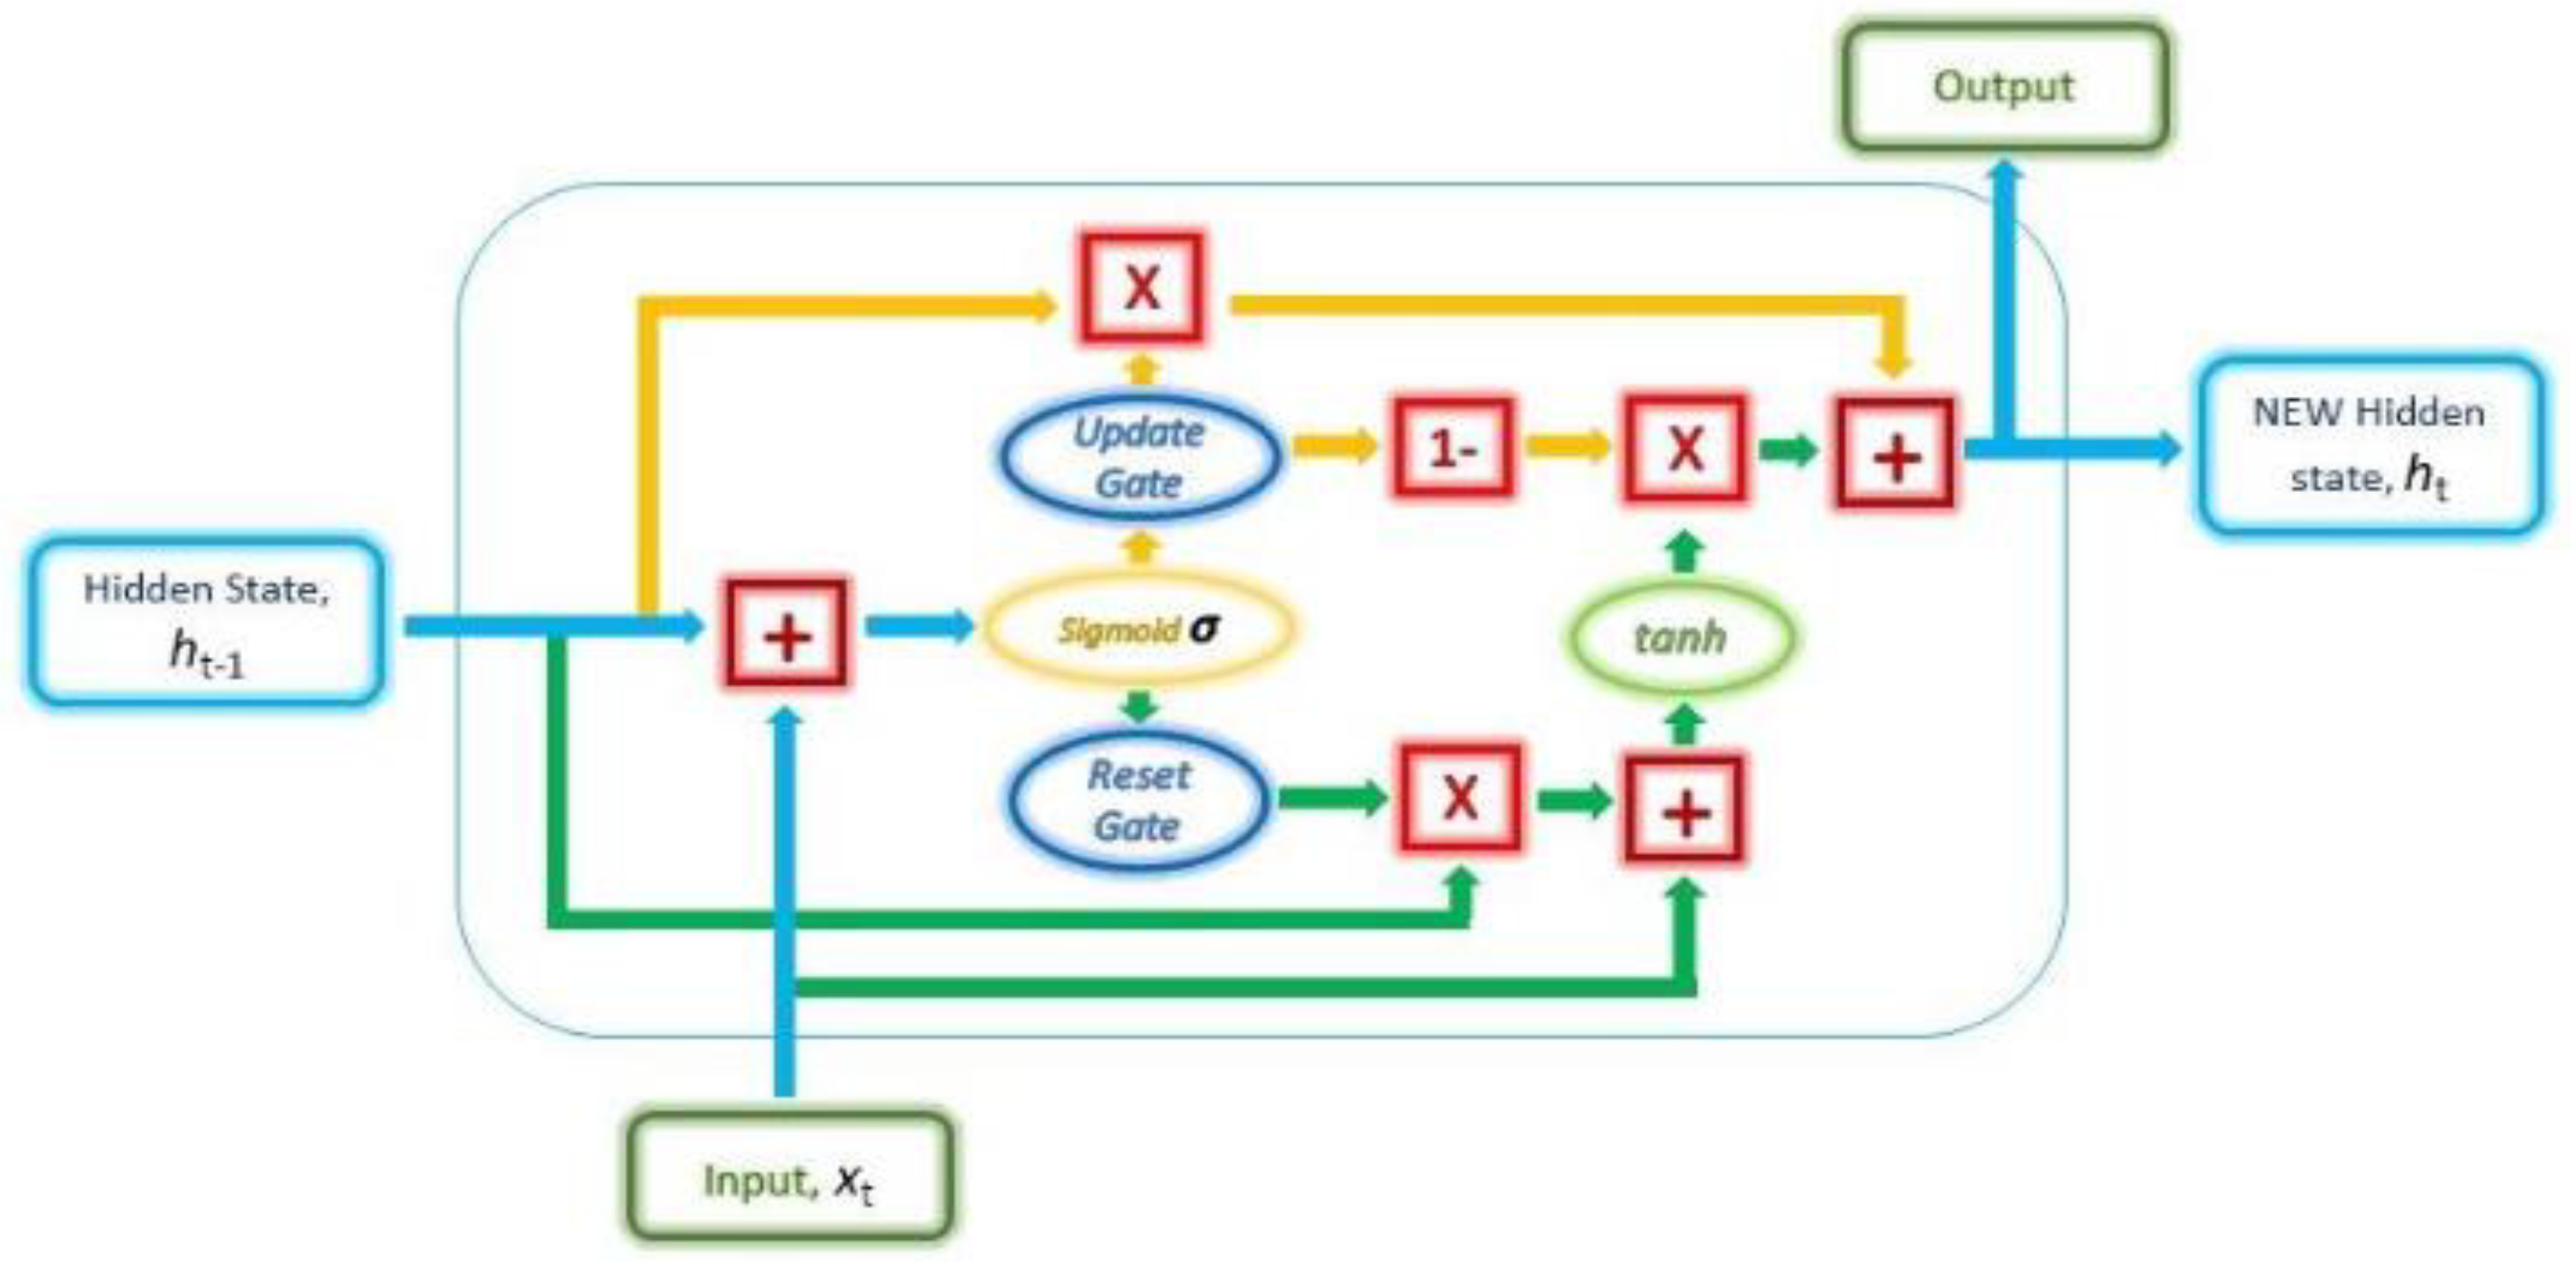
3.2. Recurrent Neural Netwrk (RNN)

Recurrent Neural Networks (RNNs) are a sophisticated class of artificial neural networks uniquely designed to process sequences of data by leveraging their inherent ability to maintain a ‘memory’ of previous inputs. This capability distinguishes RNNs from traditional neural networks, which treat each input independently, without regard for order or sequence. The core idea behind RNNs is their internal state, or memory, which captures information about what has been processed so far, allowing them to exhibit dynamic temporal behavior. This makes them exceptionally well-suited for applications involving sequential data, such as natural language processing, speech recognition, and time series prediction. RNNs operate by looping through each element in a sequence, updating their internal state based on both the current input and the previously acquired knowledge. This process enables them to make informed predictions about future elements in the sequence: essentially, learning patterns and dependencies within the data. For instance, in language modeling, an RNN can predict the next word in a sentence based on the words it has seen so far, capturing the grammatical and contextual nuances of the language.
Despite their powerful capabilities, RNNs are not without challenges. One of the main issues they encounter is the difficulty in learning long-term dependencies, known as the vanishing and exploding gradient problems. These problems arise due to the nature of backpropagation through time (BPTT), the algorithm used for training RNNs, which can lead to gradients becoming too small or too large, making it hard for the RNN to learn correlations between distant elements in a sequence. To overcome these challenges, several variants of RNNs have been developed, including Long Short-Term Memory (LSTM) networks and Gated Recurrent Units (GRU). These architectures introduce mechanisms to better control the flow of information, allowing them to retain important long-term dependencies while forgetting irrelevant data, thereby mitigating the issues of vanishing and exploding gradients. LSTMs, for example, incorporate gates that regulate the addition and removal of information to the cell state, making them highly effective for tasks requiring the understanding of long-range temporal dependencies. In recent years, RNNs and their variants have been at the heart of numerous breakthroughs in fields requiring the analysis of sequential data. From generating coherent text in natural language generation tasks to providing real-time translations in machine translation systems, and even enabling sophisticated voice recognition and synthesis in virtual assistants, RNNs have demonstrated their versatility and power. As the research continues to evolve, it is likely that we will see further advancements in RNN architectures and their applications, solidifying their role as a cornerstone of sequential data analysis in artificial intelligence.

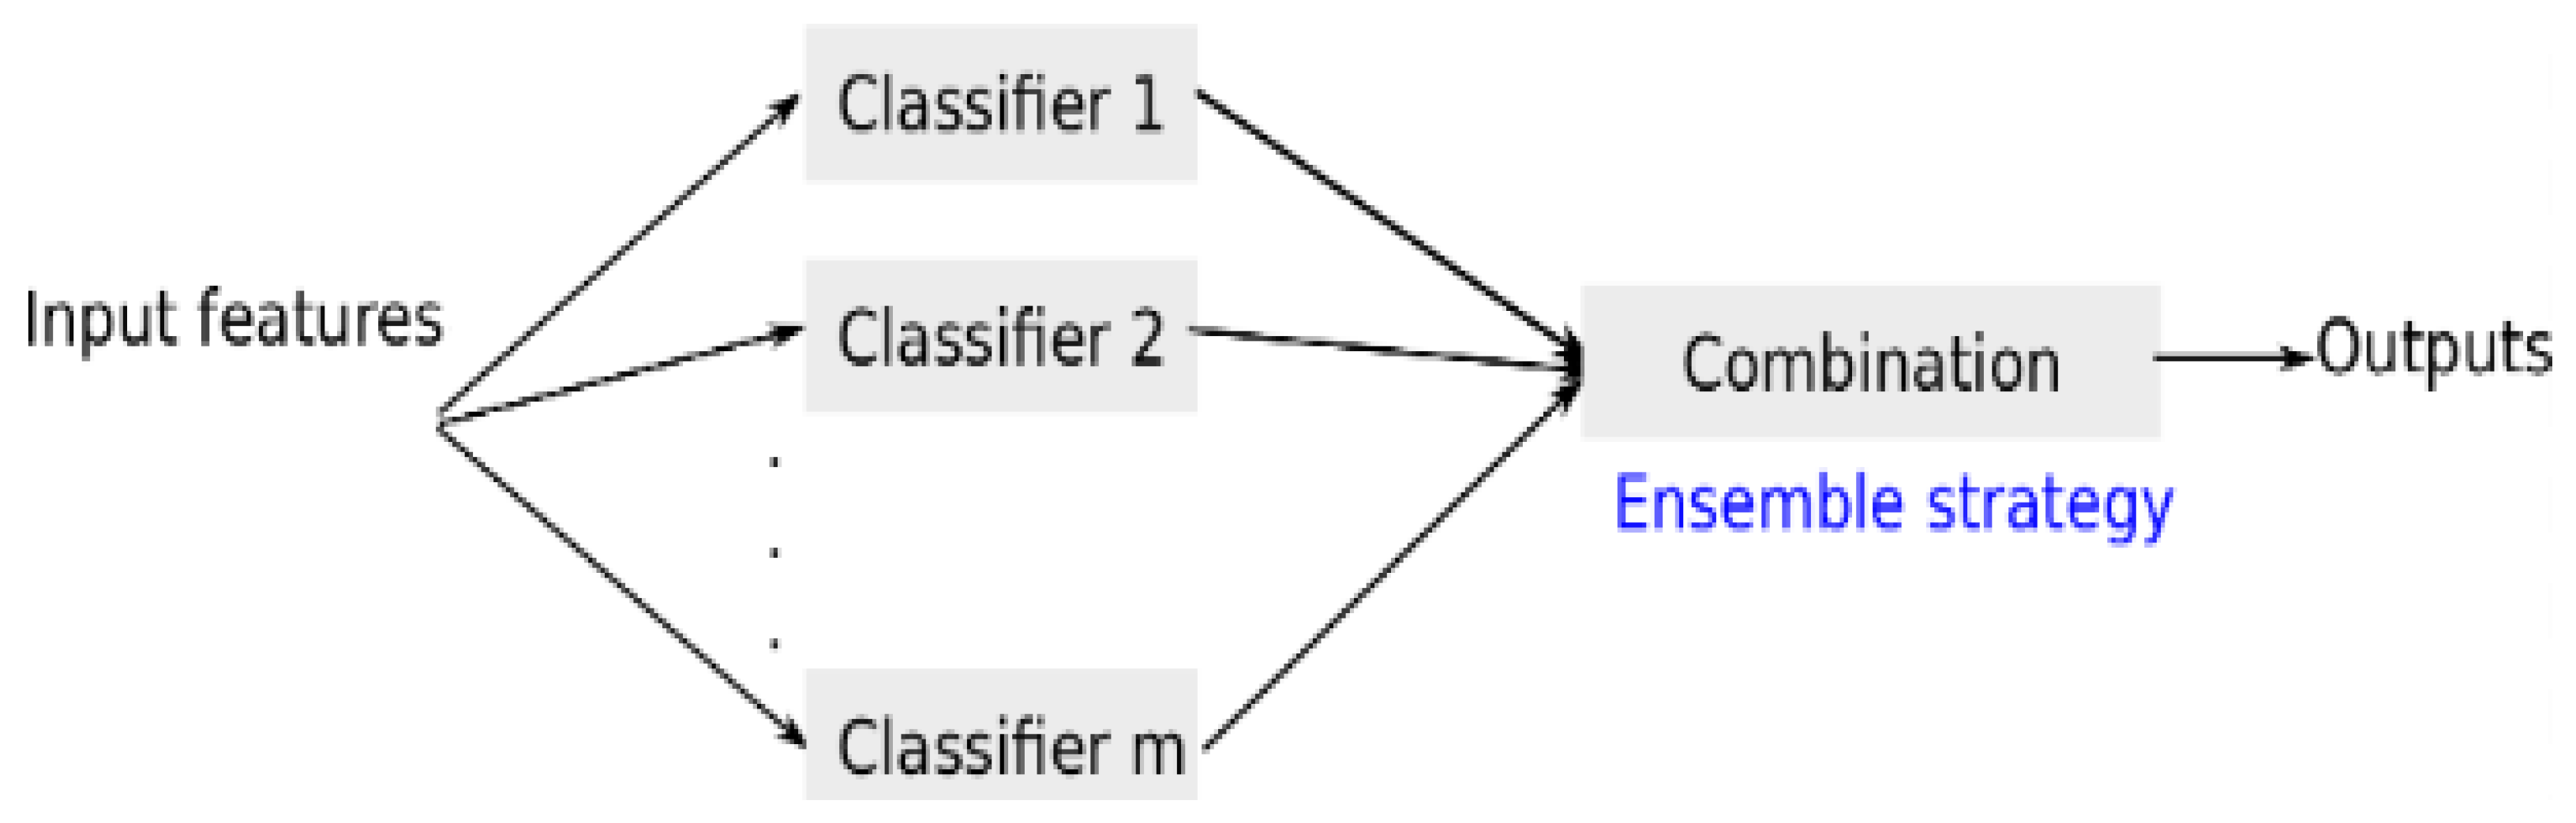
3.3. AdaBoost Classification Techniques

The AdaBoost classifier is a type of Ensemble classifier, a method that amalgamates multiple classifiers to create a more effective one. Known also as a Meta learning approach, it operates by integrating various weak classifiers—each with limited accuracy—to construct a collective of classifiers aiming for a stronger predictive performance. Essentially, AdaBoost as illustrated by Figure 3 works by evolving a composite strong classifier out of an assembly of weaker ones. It achieves this by continuously learning from the outcomes of previous classifications and adjusting the weights of individual classifiers based on this feedback. The strength of AdaBoost lies in its ability to progressively diminish the training errors and enhance the overall model performance through several iterations. This process has garnered recognition for its effectiveness in reducing errors and improving results across various domains, including learning analytics. Learning analytics involve the collection, analysis, and interpretation of data about learners and their contexts, with the goal of understanding and optimizing learning and the environments in which it occurs.

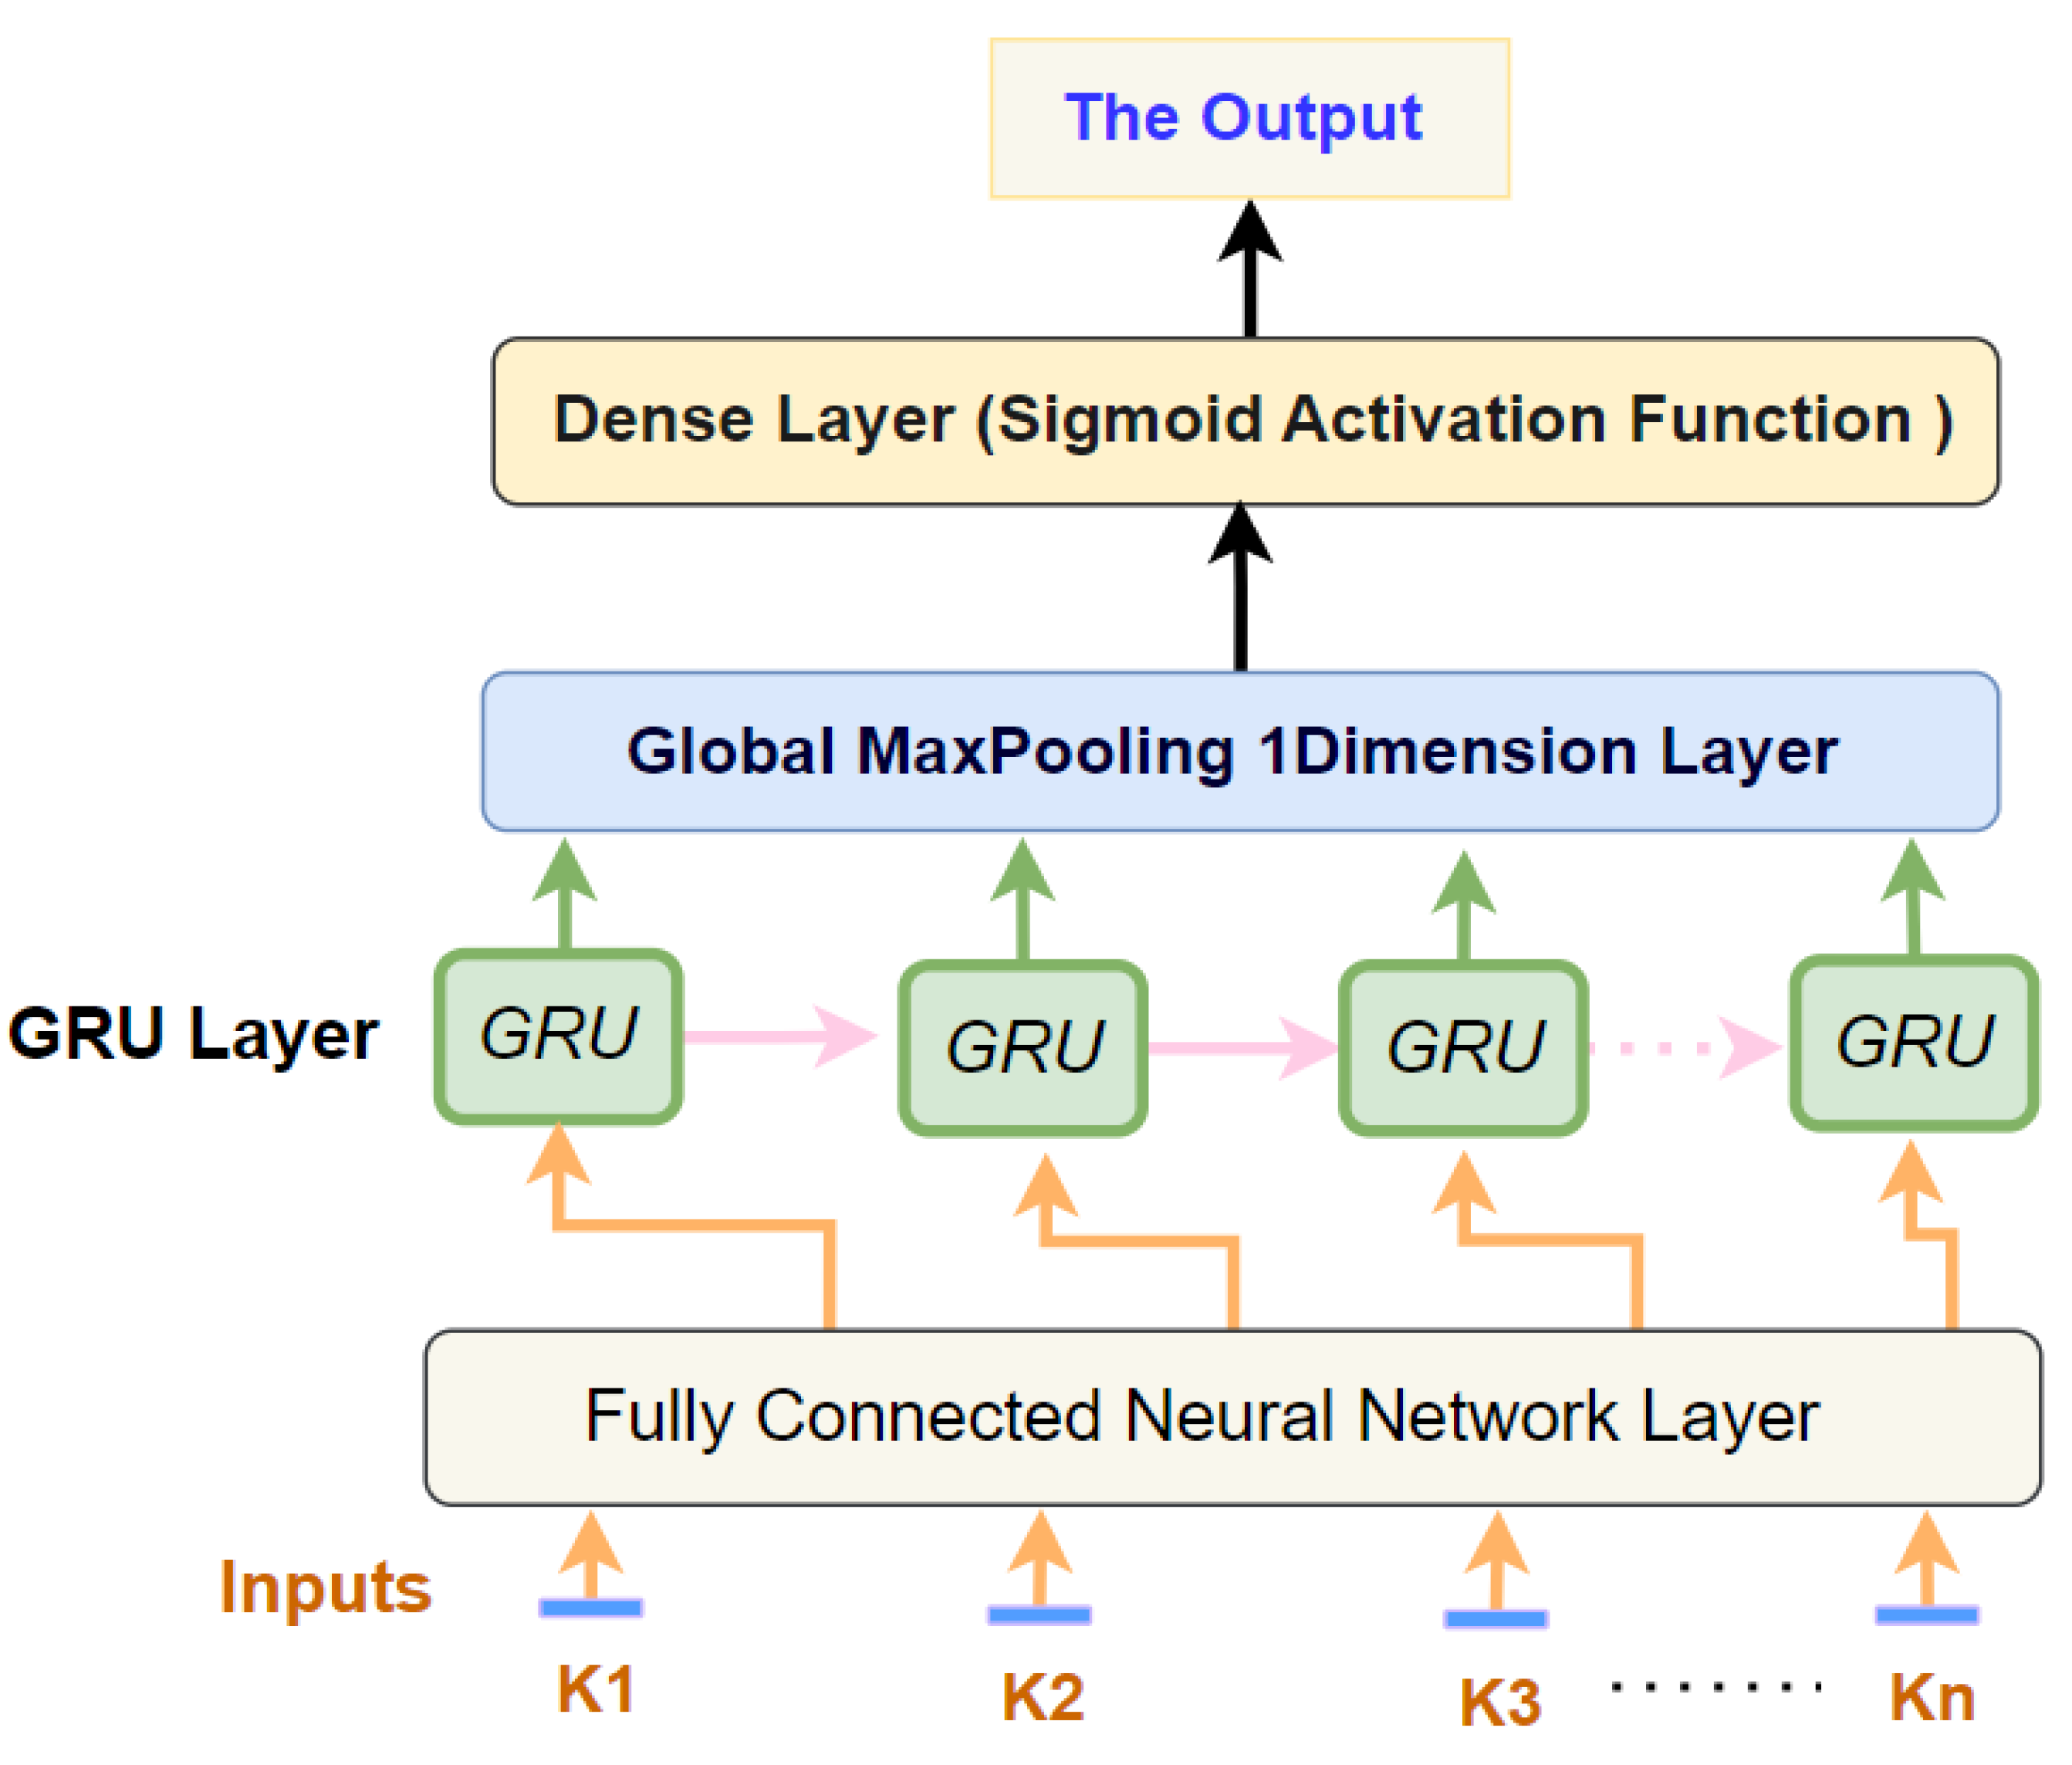
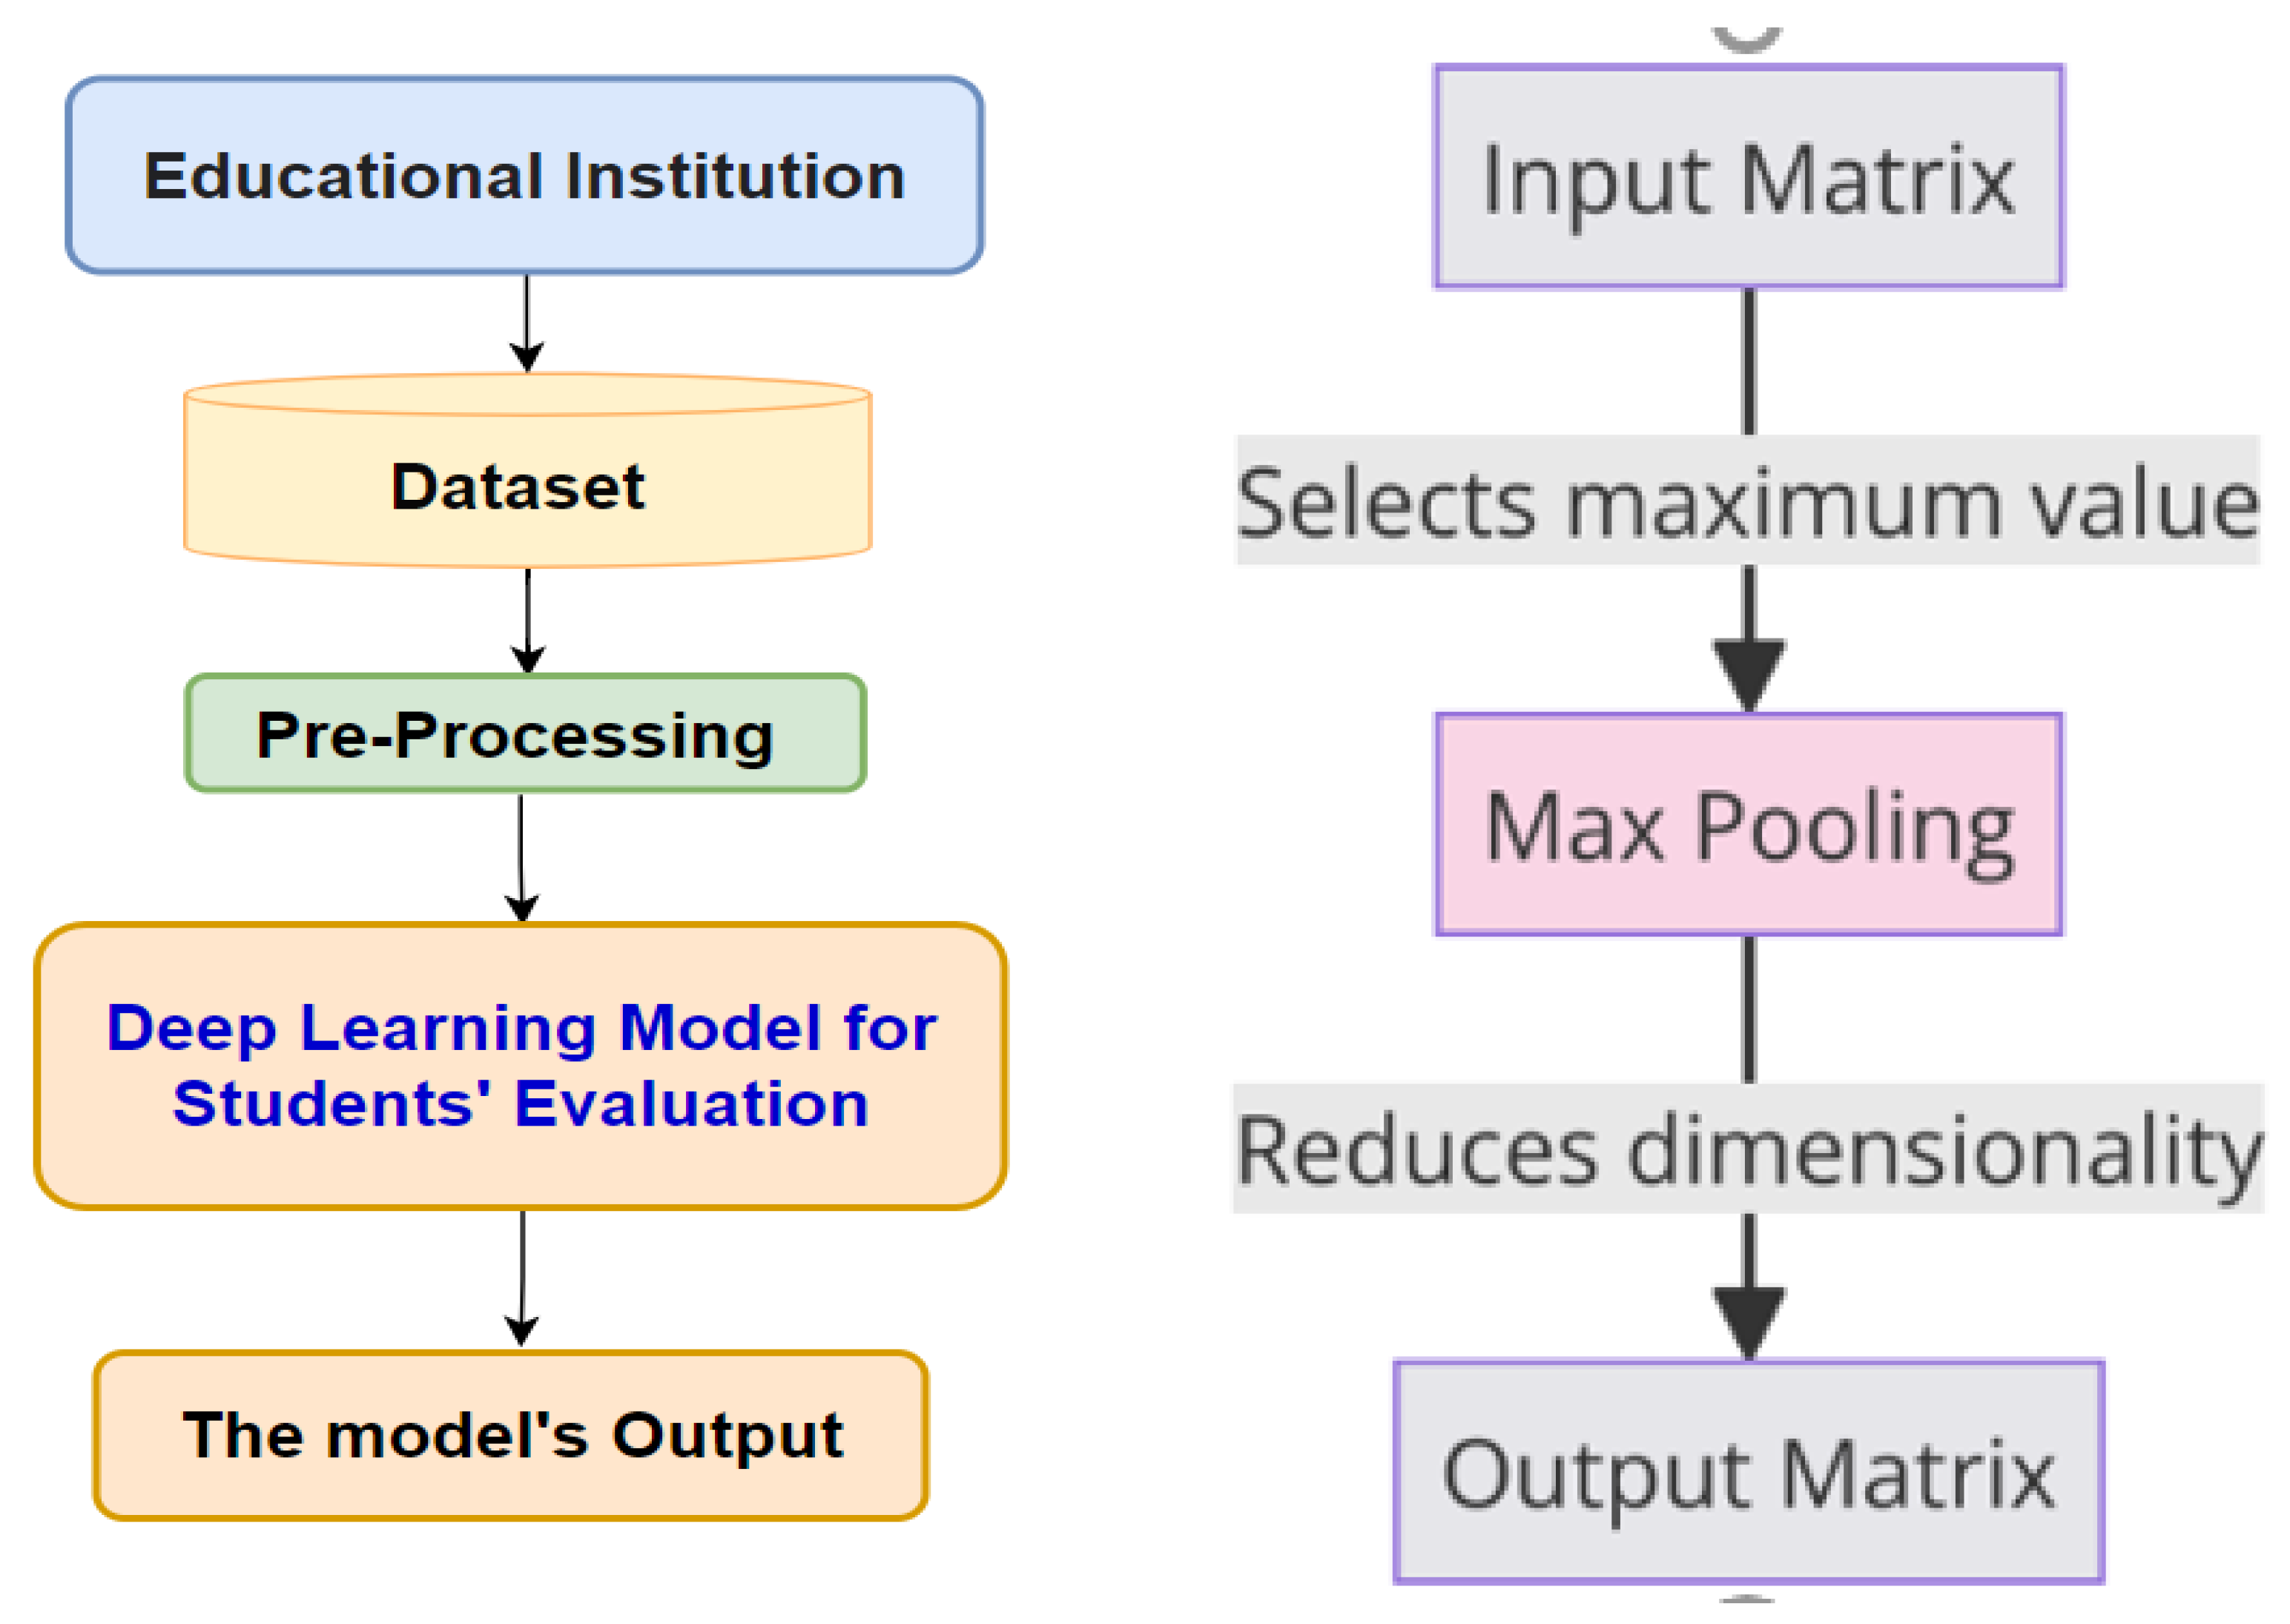
4. The Architecture of the Proposed Deep Learning Model for the Prediction of Students’ Performance in Educational Institutions

In our discussion, we elaborate on the key methodologies implemented in our proposed model, specifically focusing on the configurations of the proposed Gated Recurrent Unit (GRU) model. Additionally, we compare the GRU model with other techniques to highlight its effectiveness. Thus, this section also introduces the fundamental concepts of other classifiers, including the Artificial Immune Recognition System v2, Recurrent Neural Network (RNN), and AdaBoost. These classifiers have been utilized in creating a predictive model for educational institutions. Educational institutions have recently begun utilizing Deep Neural Network (NN) algorithms on their datasets for purposes such as making future predictions [33]. Deep Neural Networks function similarly to the human brain in terms of thinking and problem-solving capabilities. As such, NNs can interpret complex patterns that might be challenging for human analysis or conventional learning algorithms. The architectures of NNs vary, with nodes supporting different processes like forward or backward sequencing, often referred to as sequential or convolutional operations. The Gated Recurrent Neural Network (GRU) is a variant of neural network algorithms, akin to the Recurrent Neural Network (RNN). It plays a critical role in managing information flow between nodes [34]. GRU, an advanced form of the standard RNN, features update and reset gates. These gates, as illustrated in Figure 4, decide which information (vectors) should be passed to the output [35]. During training, these gates have the capability to learn which crucial information should be retained or disregarded for effective prediction [36].
Additionally, Equations (1)–(4) govern the operations of the gates mentioned earlier. Specifically, Equation (1) demonstrates how vectors for the update and reset gates are formulated. In this process, distinct weights (denoted as W_) are applied to both the input and the hidden state, resulting in unique vectors for each gate. This differentiation enables the gates to perform their specific roles effectively.
gate update =   σ W input update .   x t + W hidden update .   h t 1
gate reset = σ ( W input update .   x t + W hidden reset .   h t 1 )  
Equation (2) describes the process in which the sigmoid function takes the previous hidden state and the current input   x t , along with their respective weights, and performs a summation of these values. The sigmoid function then converts these values into a range between 0 and 1. This transformation allows the gate to filter information, distinguishing between less important and more critical information for future steps. Equation (3) represents the current memory content during the training process, whereas Equation (4) depicts the final output in the memory at the current time step.
h t = t a n t   ( W x t + r t     U h t 1 )  
h t = r     1 g a t e u p d a t e + u
The proposed GRU model simplifies the understanding of how sequential data inputs impact the final sequence generated as the model’s output. This capability is key in unraveling the internal operational mechanisms of the model and fine-tuning specific input–output correlations. Additionally, experimental evaluations using students’ internal assessment datasets have demonstrated that the GRU model surpasses the performance of traditional models. Deep learning models often train with noisy data, necessitating the use of specialized stochastic optimization methods like the ADAM algorithm [37]. Renowned for its effectiveness in deep learning contexts, the ADAM algorithm is favored for its ease of implementation and low memory requirements, contributing to computational efficiency. It is particularly adept at handling large datasets and numerous parameters. The ADAM algorithm combines elements of stochastic gradient descent and root mean square propagation, incorporating adaptive gradients. During training, it utilizes a randomly selected data subset, rather than the entire dataset, to calculate the actual gradient. This approach is reflected in the workings of the algorithm, as detailed in Equations (5) and (6) [38]:
m t = β 1   m t 1 + ( 1 β 1 ) t
v t = β 2 / v t 1 + ( 1 β 2 ) t 2
where m t and v t must approximate the instant of the gradients, where they are adjusted as vectors of 0’s, and β1 and β2 are close to zero. These biases are emulated through the computation of bias-adjusted moment estimations, as delineated in Equations (7)–(9).
m t = m t 1 β 1 t
v t = v t 1 β 2 t
Subsequently, the update rule is applied.
θ t + 1 = θ t h v t + m t
The default values are as follows: β1 = 0.9, β2 = 0.999, and ∈ = 10−8. The proposed model includes a max-pooling layer, which serves to reduce the number of coefficients in the feature map for processing. This layer facilitates the development of spatial filter hierarchies by generating successive convolutional layers with increasingly larger windows relative to the original input’s proportion [39]. Furthermore, the proposed GRU model incorporates a dense layer. This layer is fully connected to its preceding layer, meaning every neuron in the dense layer is linked to every neuron in the layer before it. The dense layer receives outputs from all neurons of its preceding layer and performs matrix–vector multiplication. In this context, the matrix’s row vector, representing the output from the preceding layer, corresponds to the column vector of the dense layer [40]. Figure 5 visually presents the primary configurations of the proposed GRU model, while Figure 5 depicts the model’s development process. The importance of utilizing GRU-powered recommendation systems within educational frameworks lies in their profound ability to discern students facing academic difficulties. These advanced systems, through their analytical prowess, are essential for educational institutions aiming to proactively identify and support students who are not achieving their full academic potential. By analyzing vast amounts of academic data, the proposed GRU model reveals patterns and insights that enable tailored interventions for students at risk, thereby fostering an environment where every student has the opportunity to succeed. This strategic approach not only optimizes educational resources but also personalizes the learning experience, making it a pivotal tool in the quest to enhance academic outcomes and support student success in an increasingly complex educational landscape.

4.1. Max Pooling

Max pooling is a significant technique in deep learning models, particularly in the realm of Convolutional Neural Networks (CNNs). It functions as a down-sampling strategy, effectively reducing the spatial dimensions of input feature maps. The process involves scanning the input with a fixed-size window, typically 2 × 2, and outputting the maximum value within each window. This approach not only reduces the computational load for the network by decreasing the number of parameters, but also helps in extracting robust features by retaining the most prominent elements within each window. Max pooling contributes to the model’s translational invariance, meaning the network becomes less sensitive to the exact location of features in the input space. This property is particularly useful in tasks like image and speech recognition, where the precise location of a feature is less important than its presence. By simplifying the input data and focusing on key features, max pooling enhances the efficiency and performance of deep learning models, making them more effective in recognizing patterns and identifying key characteristics in complex datasets. Max pooling plays a crucial role in predicting student performance, especially when these models process complex input data like patterns in student interaction, engagement metrics, and learning behaviors. In the context of educational data analysis, max pooling helps in effectively reducing the dimensionality of input features, which might include various student performance indicators. In segmenting these indicators into non-overlapping sets and extracting the maximum value from each, max pooling focuses on the most prominent features that are indicative of student performance trends. This process not only simplifies the computational demands of the model, but also accentuates key features that are crucial for accurate predictions. For instance, in a model analyzing students’ online learning patterns, max pooling can help highlight the most significant engagement metrics while discarding redundant or less informative data. This aids in creating a more efficient and focused predictive model, enabling educational institutions to derive meaningful insights into student performance and potentially identify areas requiring intervention or support.

4.2. Dense Layer

In the context of a deep learning model aimed at predicting the academic performances of students in educational institutions, a dense layer plays a crucial role in interpreting and processing the vast array of data related to student assessments and academic records. A dense layer, also known as a fully connected layer, is a foundational element in neural networks where every input node is connected to every output node, facilitating the complex pattern recognition necessary for such a predictive analysis. When incorporated into a model designed to assess academic performance, a dense layer functions by taking the high-dimensional data—representing various attributes of student performance, such as grades, attendance, participation, and more—and transforming it through weighted connections and biases. This process enables the model to learn the nuanced relationships between different academic factors and their impact on student success. The application of dense layers in predicting academic performance is pivotal for several reasons. Firstly, it allows the model to integrate and analyze data from disparate sources, providing a comprehensive overview of a student’s academic journey. Secondly, through the training process, dense layers adjust their weights and biases to minimize the difference between the model’s predictions and the actual outcomes, thereby enhancing the model’s predictive accuracy. Moreover, in an educational setting, where the goal is to identify students who may be struggling and to offer timely interventions, the interpretability of dense layers becomes an asset. The weights of the connections can offer insights into which factors are most predictive of academic performance, guiding educators and administrators in developing targeted support strategies. To ensure the model remains generalizable and effective across different institutions and student populations, it is crucial to carefully design the dense layer architecture, including the number of layers and the number of nodes within each layer. This design must strike a balance between complexity, to capture the intricate patterns within the data, and simplicity, to avoid overfitting and ensure the model’s predictions are reliable and applicable in real-world scenarios. The inclusion of dense layers in a deep learning model for predicting student academic performance is instrumental in decoding the complex relationships within educational data. It transforms raw data into actionable insights, enabling institutions to foster an environment where every student has the opportunity to achieve their academic potential.

4.3. ADAM Optimization Algorithim

The ADAM optimization algorithm represents a significant advancement in the realm of stochastic optimization for training neural networks. Standing for Adaptive Moment Estimation, ADAM is renowned for its efficiency and adaptability, making it a popular choice in the field of deep learning. The algorithm incorporates adaptive learning rates, dynamically adjusting the rate for each parameter based on past gradients. It utilizes two moving averages, capturing the trend and variance of the gradients, and includes bias correction mechanisms to ensure accurate parameter updates, particularly during the initial stages of optimization. Mathematically, ADAM computes moments and updates parameters, demonstrating its adaptive nature. The algorithm’s advantages include its adaptability to various tasks, efficient convergence, and robustness to noisy gradients. However, effective hyperparameter tuning is crucial for optimal performance. Despite its additional memory requirements, ADAM’s widespread adoption underscores its effectiveness in optimizing neural network parameters and its pivotal role in contemporary machine learning applications.

5. Experiments

5.1. Datasets

The GRU model in question was developed using a specific educational dataset, cited in reference [41], which was compiled from three distinct educational institutions in India: Duliajan College, Digboi College, and Doomdooma College. This dataset is large and complex, encompassing internal assessment records of 15,165 students across 10 different attributes. Despite its extensive size, the dataset did present challenges, notably in the form of missing data entries. These missing values were ultimately excluded from consideration in the analysis. Table 1 provides a detailed breakdown of the dataset’s attributes, including the range and nature of the data collected. Additionally, Figure 6 (left) offer visual representations of the dataset, highlighting the diversity and scale of the educational data gathered from these institutions.

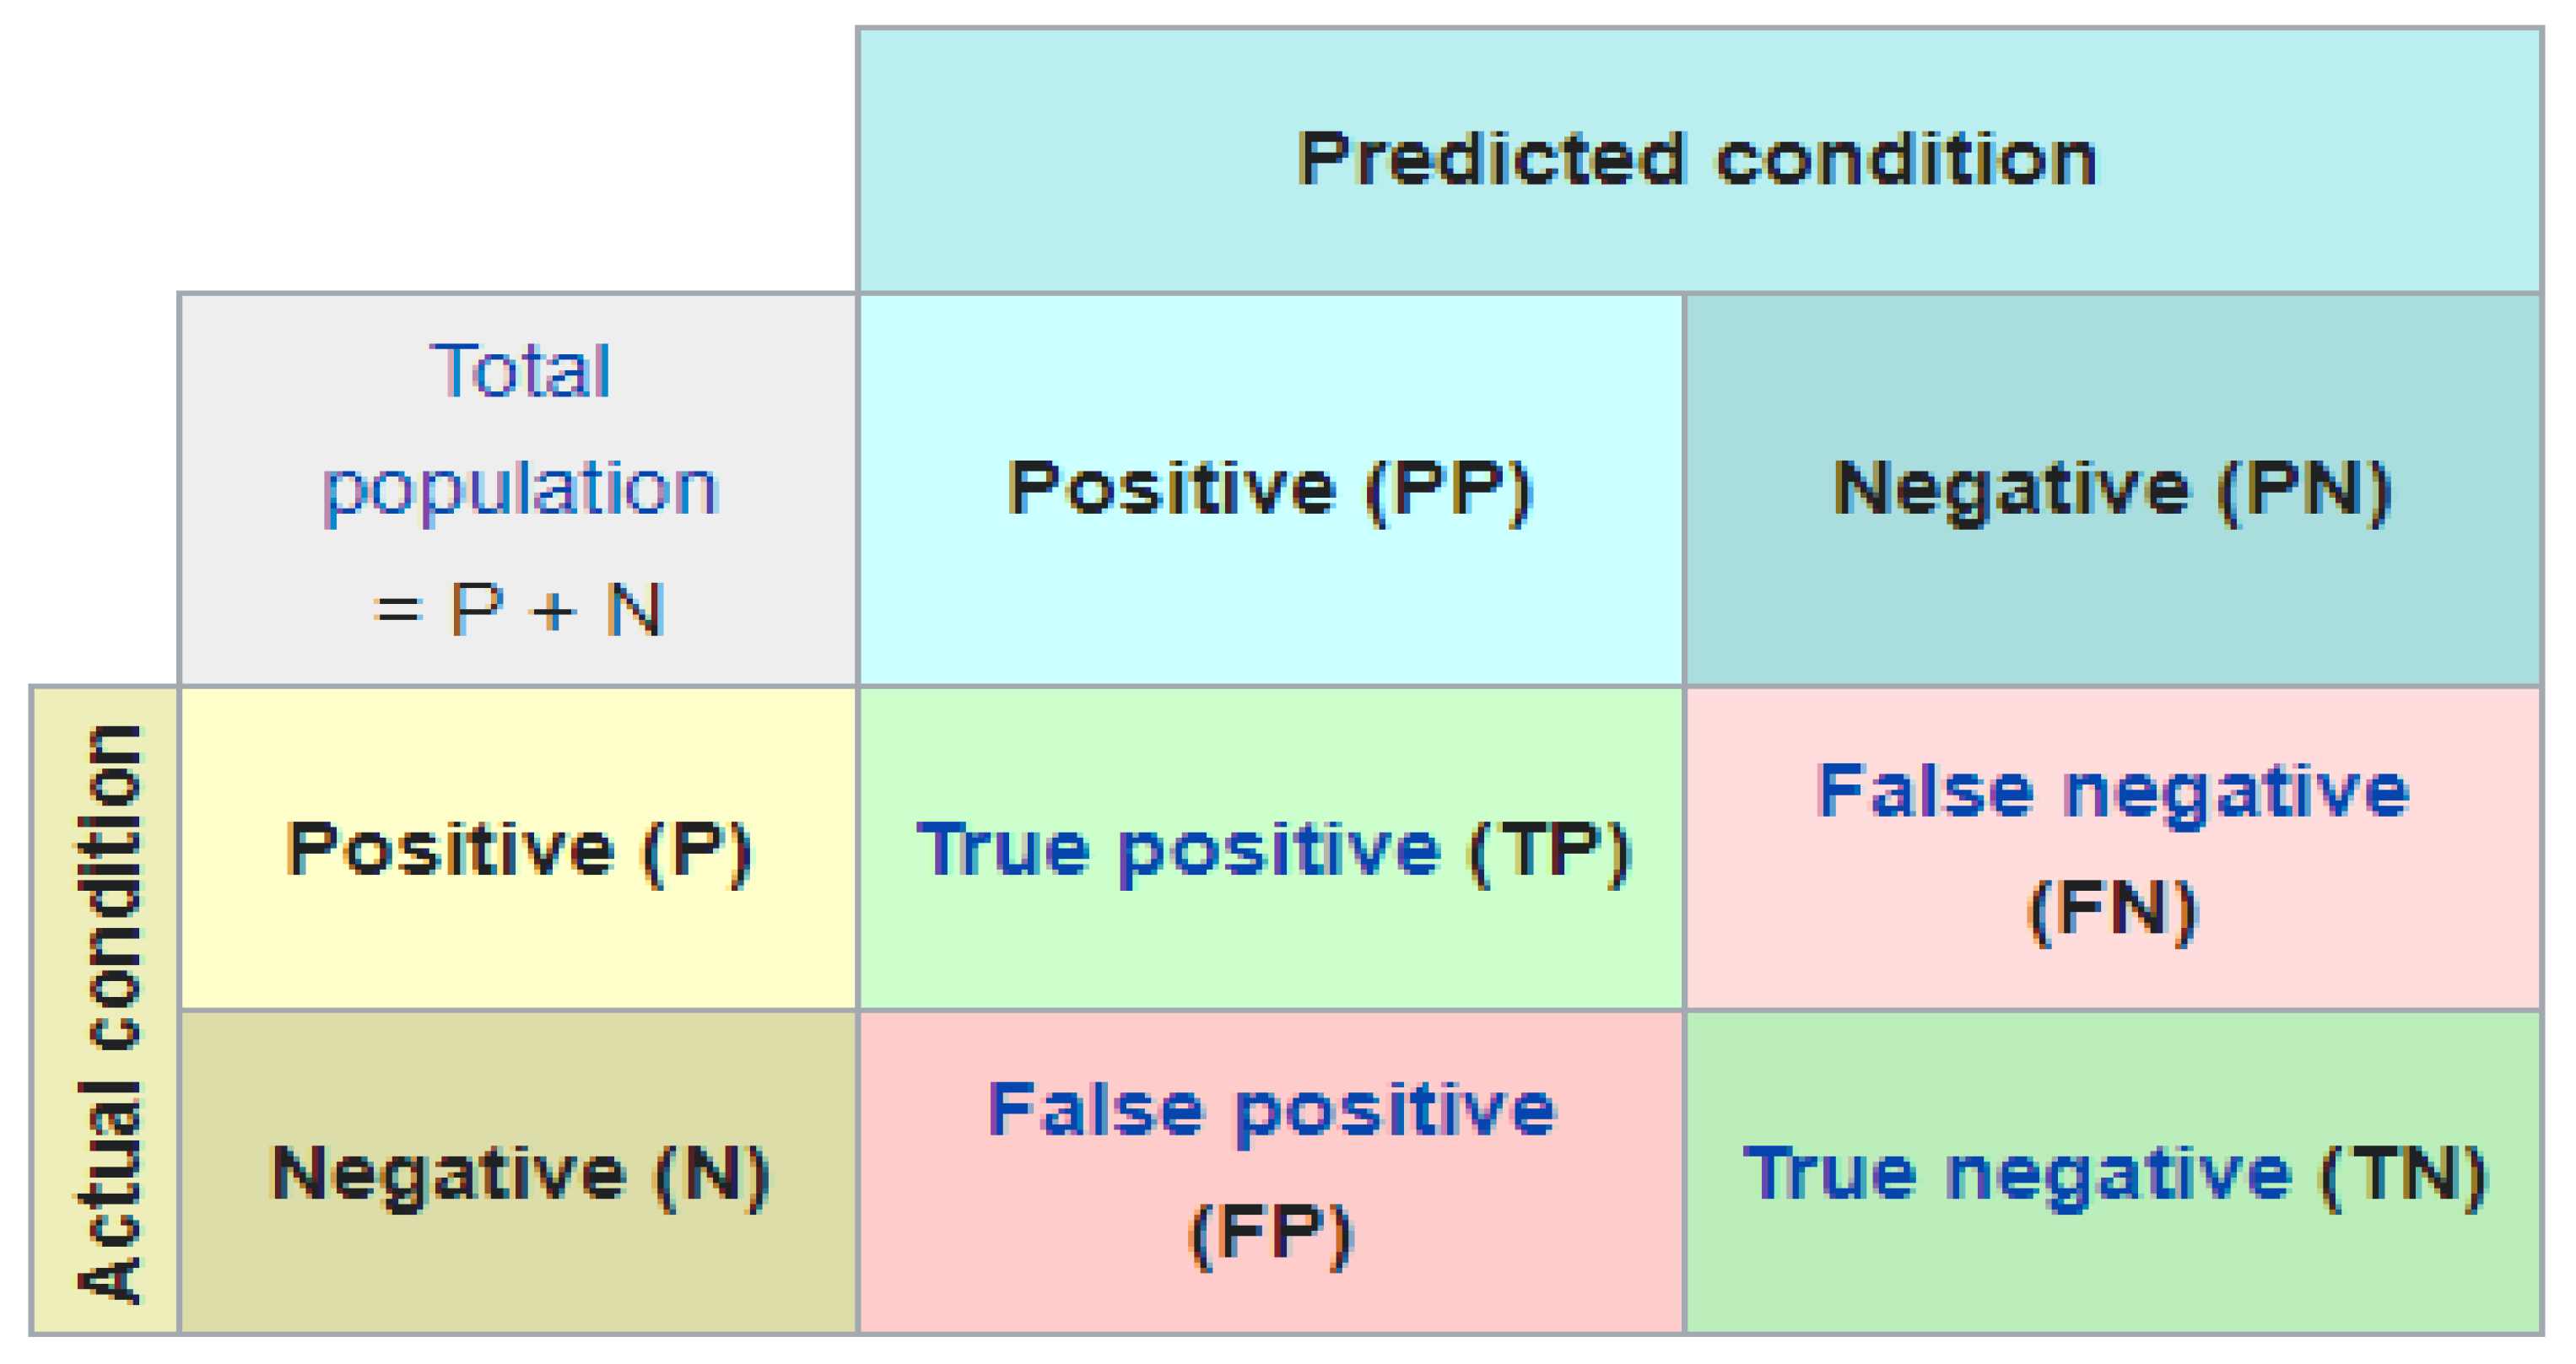
5.2. Evaluation Metrics

The evaluation of the GRU model’s effectiveness was conducted using a variety of widely recognized evaluation techniques. These included the use of a confusion matrix, as well as metrics such as accuracy, recall, precision, and F-score, as referenced in [42]. The confusion matrix, also known as error matrix, serves as a tool for statistical classification, visually representing the model’s performance, as shown in Figure 7. This figure illustrates a binary classification scenario, distinguishing between two categories: a positive (P) class and a negative (N) class. The matrix is structured to highlight several key types of outcomes: true positive (TP), which indicates accurate predictions of positive instances, meaning the predictions and actual values both are positive; and false positive (FP) refers to instances falsely identified as positive when they are actually negative. True negative (TN) points to correct predictions of negative instances, where both the predicted and actual values are negative. Lastly, false negative (FN) describes instances where positive values are mistakenly identified as negative [42]. In addition, the accuracy for the model indicates the ratio among the numbers of correctly predicted samples to the total number of input samples. This is shown in Equation (10).
Accuracy = Sum of TruePositive + Sum of True Negative/Total population
The recall represents the amount of correct positive results divided by the amount of all relevant samples. This is represented in Equation (11).
Recall = TruePositives/(TruePositives + FalseNegatives)
The precession metric estimates the number of accurate positive results divided by the number of positive results expected through the classifier. This is represented in Equation (12).
Precision = TruePositives/(TruePositives + FalsePositives)
Finally, the F-score is calculated using Equation (13). This equation illustrates just one score of the equilibrium, reflecting the recall and precision in a single value. The F-score denotes a balance between two metrics: recall and precision. It is a balanced mean of two different scores; a product of 2 will become a score of 1 when both of the recall and precision equal 1.
F-Measure = 2 × [(Precision × Recall)/(Precision + Recall)]

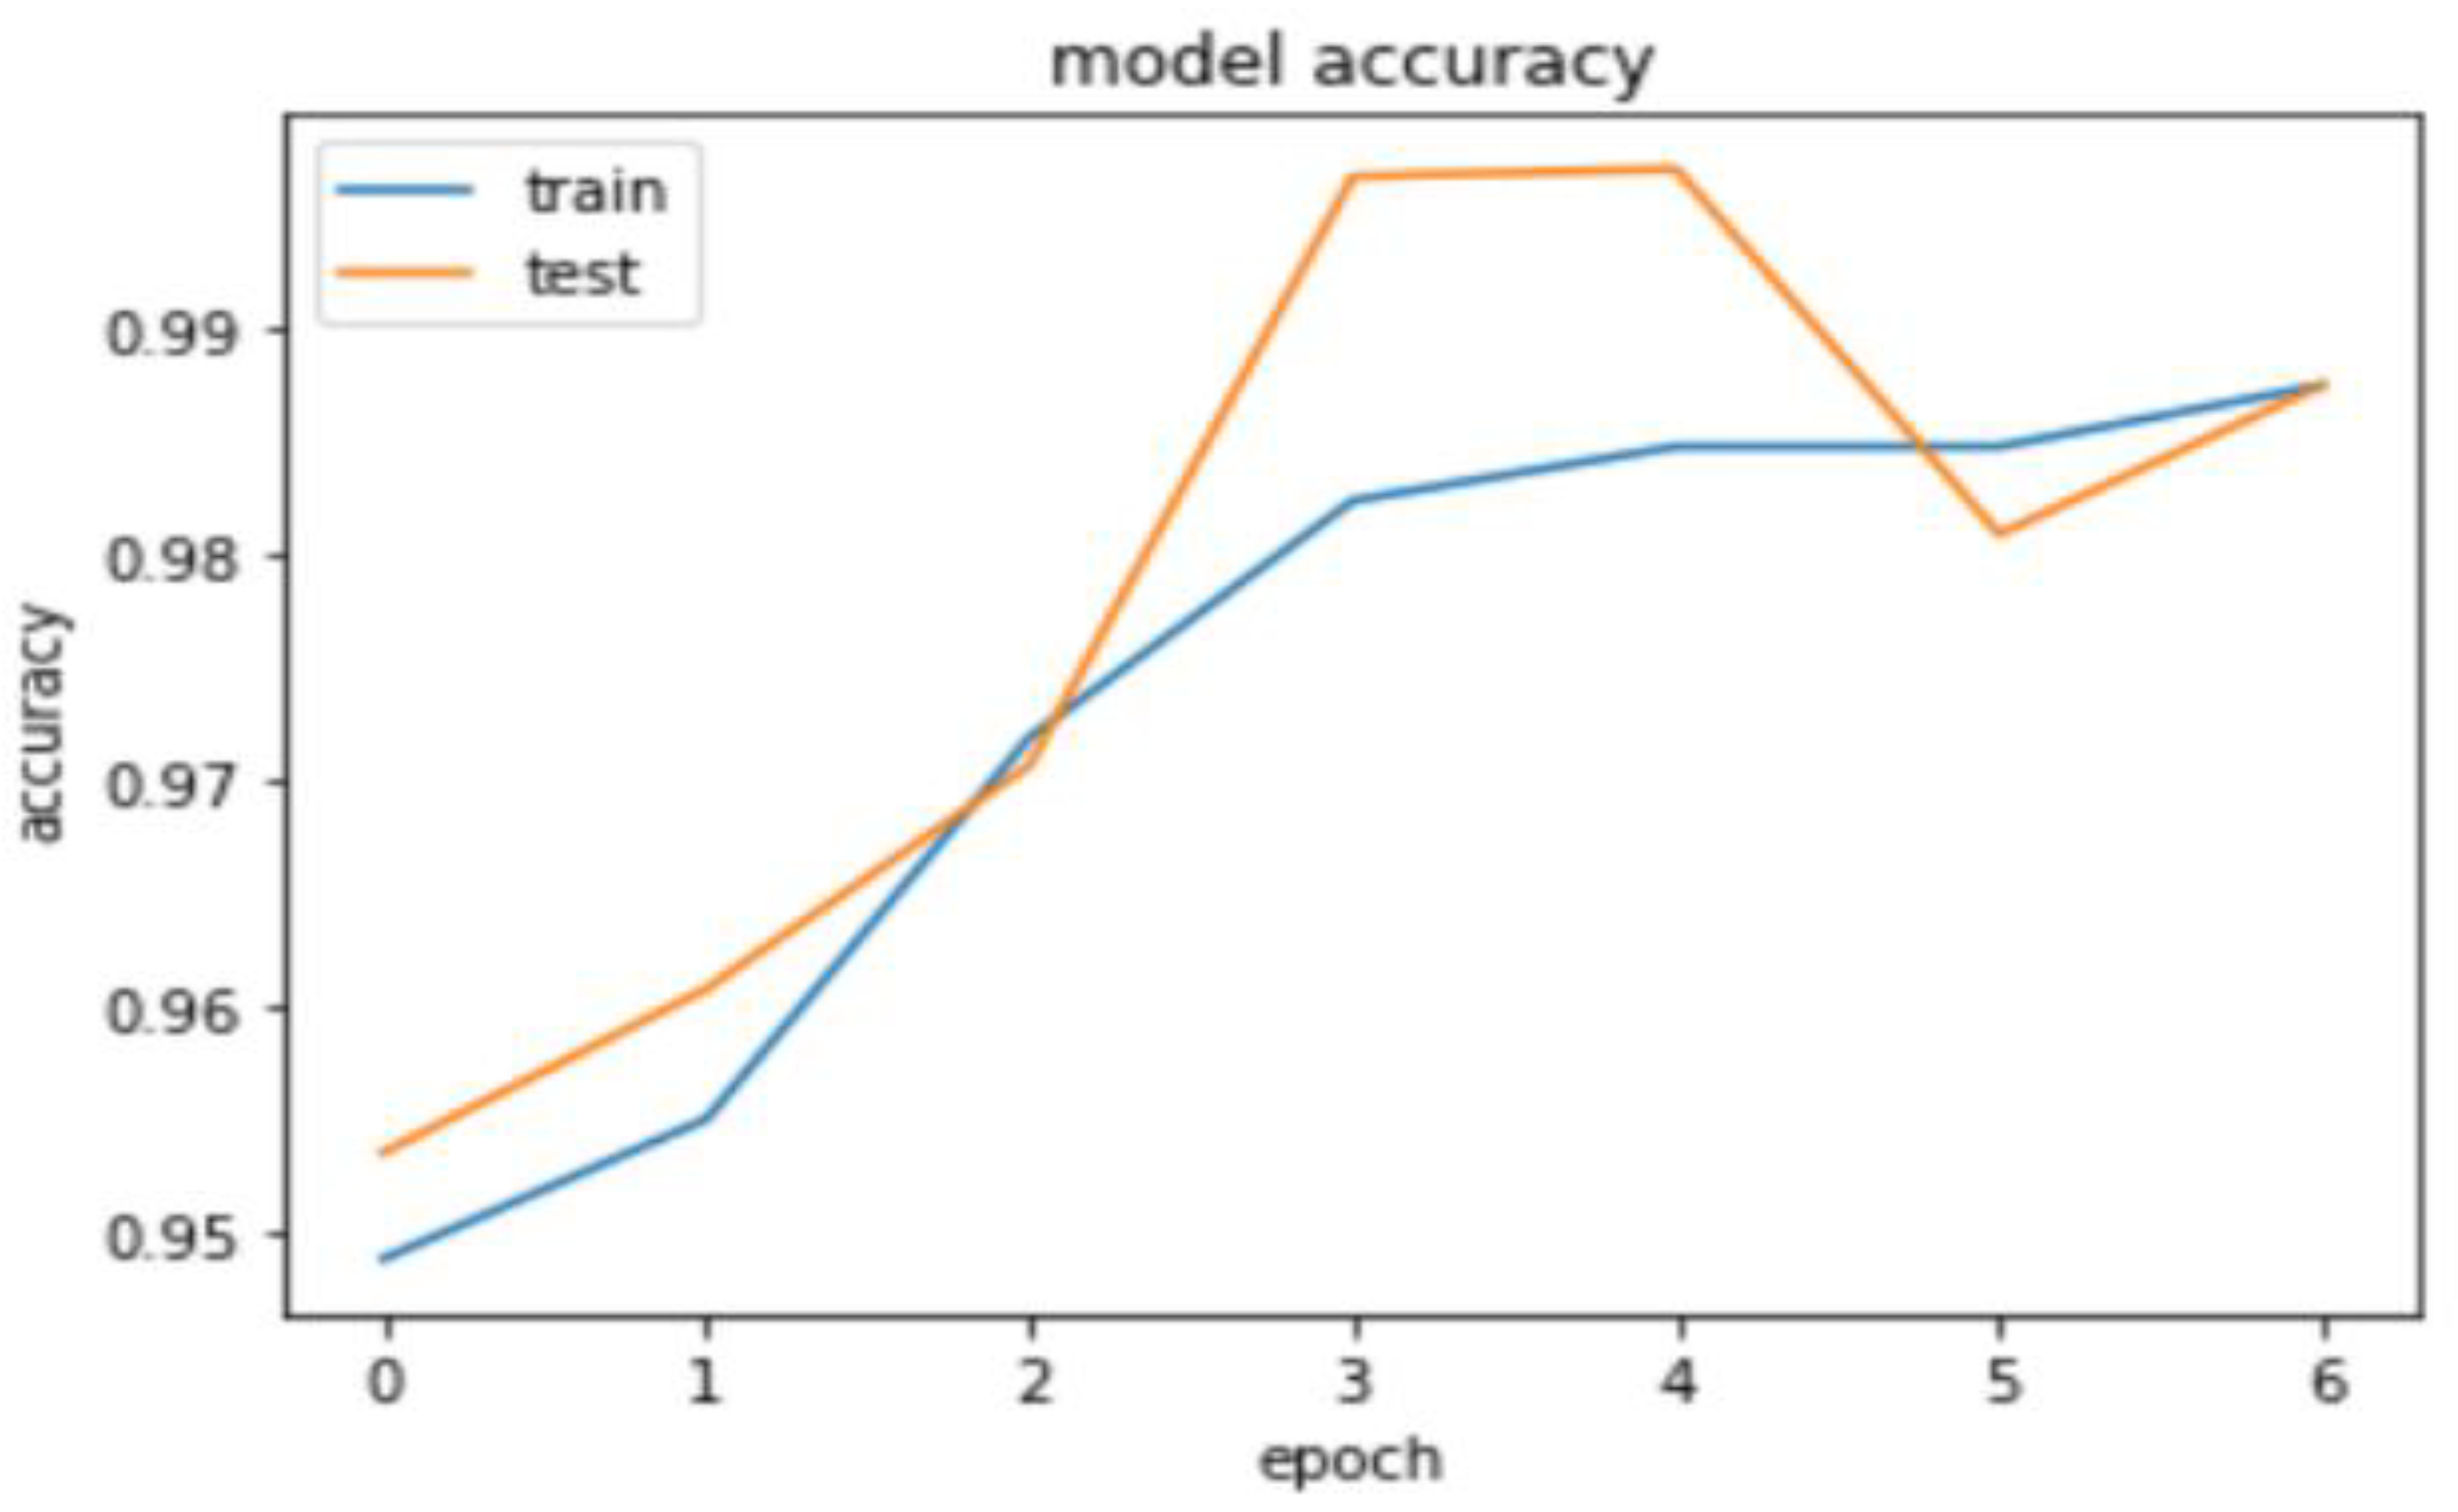
5.3. Results and the Proposed Model Hyperparameters

The GRU classifier model was developed using an educational dataset for both its training and testing phases. This model incorporated a sequential architecture featuring a max-pooling layer, a dense layer, and utilized the ADAM optimizer to enhance its performance. The chosen loss function for the model was binary cross entropy, suitable for binary classification tasks. For validating the model’s effectiveness, the K-fold cross-validation method was employed, specifically with a single fold (k = 1), effectively creating a straightforward training/test split. The model’s architecture included a Fully Connected Neural Network (FCNN) layer with 100 neurons and nine input variables, adopting the ReLU activation function for non-linear processing. The design also incorporated two hidden layers: the initial layer being a GRU layer equipped with 256 units and a recurrent dropout of 0.23 to mitigate overfitting, and the subsequent layer, a one-dimensional global max-pooling layer for feature down-sampling. The output layer activated by a sigmoid function reflects the binary nature of the dataset’s classification challenge. The implementation was carried out using Keras and Python, harnessing the ADAM optimizer’s capabilities with a learning rate set at 0.01 and a momentum of 0.0, aiming for efficient training dynamics. The model’s training was configured with a batch size of 90 and planned for 300 epochs, although an early stopping mechanism was introduced after just 7 epochs to prevent overfitting, with a patience setting of 2 epochs. Initially, the model comprised 275,658 parameters, highlighting its complexity and capacity for learning. Regarding the classification task, the model demonstrated a requirement of approximately 16 s per epoch, with each epoch involving a random shuffle of the training data to ensure varied exposure. The overarching goal in training this model was to minimize validation loss as measured using binary cross entropy, indicating a focused effort on enhancing the predictive accuracy for student assessments.
Extensive testing and experimentation were conducted to fine-tune the proposed model, involving various configurations and hyperparameter adjustments to achieve optimal performance. This effort was aimed at accurately predicting student assessments within educational settings. The effectiveness of the model, as detailed in Figure 8, is evidenced by its high accuracy scores for the prediction task. The data presented in Figure 9 highlights the model’s capability in accurately forecasting student assessments, particularly noting the significant impact of integrating the GRU layer and a fully connected neural network. Specifically, the model attained an impressive accuracy rate of 99.70%, showcasing its precision in evaluation predictions. The inclusion of a global max-pooling layer played a crucial role in bolstering the model’s predictive accuracy concerning student evaluations. When compared to existing models documented in the literature, this model demonstrated a superior performance. For example, it outpaced an RNN model, which recorded an accuracy rate of 95.34%, a discrepancy attributed to the RNN’s challenges with vanishing gradients, as indicated in Table 2. Additionally, the model showcased an enhanced performance compared with the ARD V.2 and AdaBoost models, which achieved accuracy rates of 93.18% and 94.57%, respectively. The successful application of GRU alongside max-pooling layers over the neural network layer underscores the model’s comprehensive capability and effectiveness in autonomously predicting student assessments. Figure 9 offers a glimpse into the model’s experimental evaluation for predicting student performance, while Table 2 consolidates the advantages offered by the GRU model in this context.
Figure 9 illustrates the prediction model’s error rates throughout the simulation process, demonstrating a consistent decrease in error for both the training and actual validation datasets as the learning progressed. This simultaneous reduction in error rates during training indicates that the GRU model effectively avoids the issue of overfitting, showcasing its ability to generalize well to new, unseen data while improving its accuracy on the training data over time.
Additionally, the accuracy of the student performance predictions is graphically depicted in Figure 8. This demonstrates that the proposed GRU model has been effectively trained. There is a noticeable increase in accuracy for both the training and testing phases within educational datasets, starting from epoch number 1 and continuing up to epoch number 4. This upward trend in accuracy highlights the GRU model’s ability to perform and classify with precision.
Moreover, an additional metric was employed to evaluate the performance of the proposed GRU model, as depicted in Figure 10 through a confusion matrix. This matrix effectively highlights the number of true positives, accurately predicted and correctly classified samples, alongside true negatives, which were correctly identified as belonging to the alternate class in the context of student performance classification. According to Figure 10, the model successfully identified 2885 samples as true positives and 110 samples as true negatives. Conversely, the confusion matrix also reveals instances of incorrect predictions, classified as false positives and false negatives. Specifically, the model incorrectly classified 38 samples as false positives, while no instances were recorded as false negatives. The data presented in Figure 10 underscores the model’s high accuracy and proficiency in predicting student assessments, with a minimal error margin. During the development and evaluation of the proposed GRU model for predicting student academic performance, the research team encountered several challenges, including the following:
  • The complexity of educational data, characterized by large datasets with missing entries, necessitated meticulous preprocessing to maintain data integrity.
  • The risk of overfitting was significant due to the model’s complexity. Strategies like dropout and early stopping were implemented to mitigate this risk.
  • Optimizing the model involved intricate parameter tuning to identify the ideal learning rates and layer configurations amidst a vast parameter space.
  • The training process demanded substantial computational resources to manage the extensive dataset and intricate model architecture efficiently.
  • Ensuring the model’s generalization capability across different educational institutions required thorough testing and validation to confirm its efficacy on unseen data.
These challenges were systematically addressed through targeted data preprocessing, regularization techniques, exhaustive hyperparameter optimization, the strategic allocation of computational resources, and rigorous validation procedures to enhance the model’s performance and applicability.
Furthermore, the GRU model offers a deeper analysis and insights into the educational dataset. For example, Figure 11 showcases the model’s capability to discern and illustrate the relationship between two critical variables: the internal evaluation grades from the BA/BSc 5th Semester Examination (IN_Sem5) and those from the BA/BSc 6th Semester Examination (IN_Sem6). This demonstrates the model’s effectiveness in identifying significant correlations within the educational data. Additionally, Table 3 presents a comparative analysis of various techniques, including ARD V.2, the RNN model, and AdaBoost, in their ability to classify student performance. It is evident from this comparison that the GRU model outperforms the other methodologies, indicating its superior accuracy and effectiveness in predicting student outcomes.
This research paper presents a significant advancement in educational technology and deep learning by demonstrating the effectiveness of a Gated Recurrent Unit (GRU)-based model for predicting student academic performance. This research contributes to the field by showcasing a novel application of GRU models within educational settings, providing a more accurate and efficient method for identifying students at risk of underperforming. In addition, it offers a practical solution for educational institutions to enhance student support and intervention strategies based on predictive analytics. This study extends the capabilities of deep learning in processing and analyzing complex, large-scale educational data, further bridging the gap between advanced technology and practical educational needs. In setting a new benchmark for accuracy in academic performance prediction, this will encourage the further exploration and adoption of deep learning techniques in educational research and applications. This work not only underscores the potential of deep learning models in improving educational outcomes, but also opens new avenues for research and development in the convergence of artificial intelligence and education.

5.4. Key Findings

This paper presents an advanced GRU-based model for predicting student academic performance, with the key findings summarized as follows:
  • A new deep learning model utilizing a GRU to classify academically underperforming students was introduced.
  • Specific neural network features including dense layers, max-pooling layers, and ADAM optimization were incorporated.
  • Training was conducted on a dataset of 15,165 student records from various academic institutions.
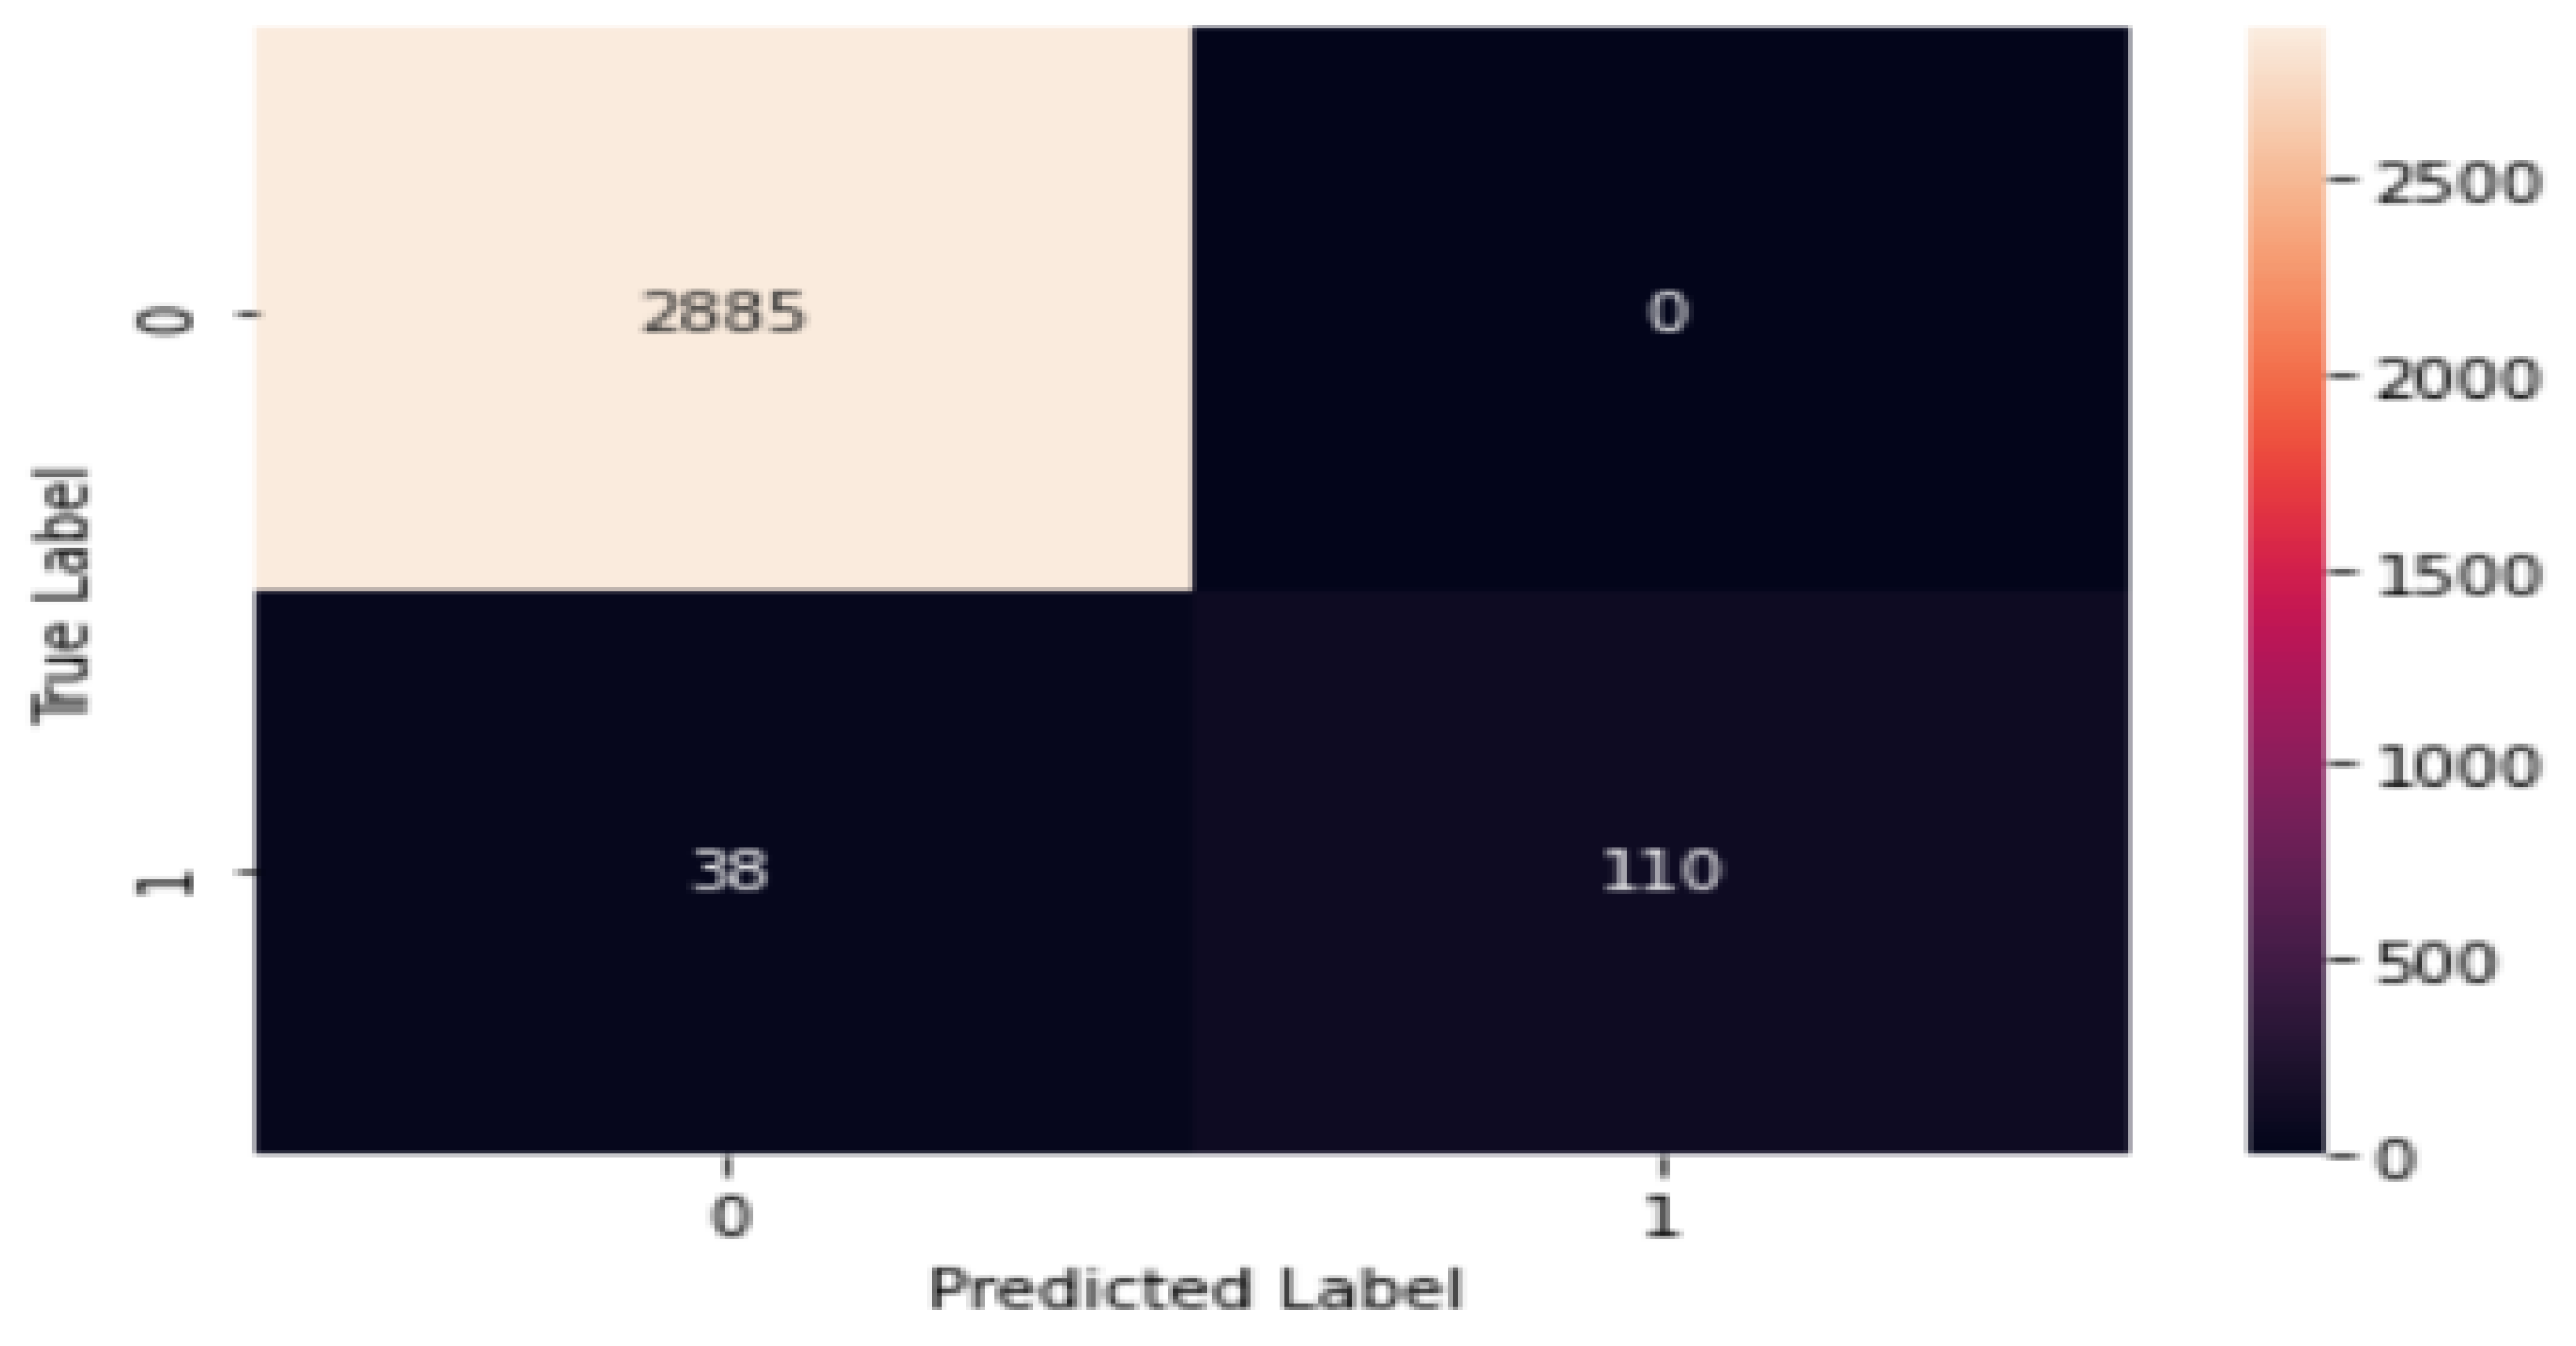
  • A remarkable accuracy of 99.70% was achieved, surpassing other educational recommendation systems.
  • Benchmarked against RNN models, AdaBoost, and Artificial Immune Recognition System v2, the proposed model showcased a superior performance.
  • The model’s potential in educational settings was emphasized for the identification of students needing additional academic support early.
  • The efficiency and computational advantages of the GRU model in handling large datasets were highlighted.
  • The practical application of deep learning was demonstrated in enhancing educational outcomes through data-driven insights.
  • The strategic use of this model by educational institutions for timely intervention and support was advocated for.
  • Avenues for future research in predictive analytics within education to further improve student success rates were opened.

6. Conclusions

Advancing research within higher education systems can significantly boost both the performance and the prestige of educational institutions. Implementing advanced predictive techniques to forecast student success enables these institutions to accurately assess student performance, thereby enhancing the institution’s own effectiveness based on empirical evidence. Through the strategic use of internal assessment data, institutions can predict future student outcomes. This study introduced an innovative GRU-based prediction model tailored to educational data gathered from various institutions, demonstrating significantly more precise outcomes compared to established models used on the same dataset. The GRU model specifically utilizes data from students’ previous semester assessments to provide targeted support for those identified as at-risk. Consequently, students with lower internal assessment scores can be given additional opportunities to enhance their performance before final exams, and potentially be grouped into categories for focused support. This predictive approach enables timely communication with both parents and students, ensuring awareness and facilitating opportunities for academic improvement. Moreover, the GRU model allows educators to intervene proactively, using early-semester assessment data to extend extra support to students who need it most. Such early intervention strategies empower instructors to make informed decisions that can positively impact students’ academic trajectories, particularly those who are at risk, by offering tailored assistance and support mechanisms. The study’s findings pave the way for future exploration into utilizing Transformer models in educational technology. This involves conducting comparative analyses to evaluate their predictive accuracy against GRU models, adaptations across various educational domains to identify generalizable success predictors, and the integration of diverse data, including textual analysis, to obtain a richer understanding of student performance. Additionally, focusing on the interpretability of Transformer models ensures actionable insights for educators, while pilot implementations in real-world settings will assess their practical impact on educational outcomes. This approach promises to advance personalized learning through cutting-edge AI technologies. This research significantly contributes to the educational technology field by introducing a Gated Recurrent Unit (GRU)-based deep learning model aimed at accurately predicting academic performance among students. In leveraging a comprehensive dataset from various educational institutions, the model showcases remarkable precision, outperforming traditional models with a 99.70% accuracy rate. This achievement underscores the potential of advanced AI technologies in enhancing personalized learning experiences. This study not only demonstrated the GRU model’s effectiveness in identifying students requiring additional support, but also set a new standard in predictive analytics within education. This opens up avenues for future research, including the exploration of Transformer models and the integration of diverse data for a more nuanced understanding of student performance. Through rigorous experimentation and analysis, this work illustrates the profound impact of deep learning on improving educational outcomes, offering a forward-looking approach to educational research and applications.

Author Contributions

L.H.B., S.K. and M.A.A. conceived and designed the methodology and experiments; L.H.B. performed the experiments; L.H.B. analyzed the results; L.H.B., S.K. and M.H.B. analyzed the data; L.H.B. wrote the paper. S.K. reviewed the manuscript. All authors have read and agreed to the published version of the manuscript.

Funding

This work was supported by the Basic Science Research Program through the National Research Foundation of Korea (NRF), funded by the Ministry of Science and ICT under Grant NRF-2022R1A2C1005316.

Institutional Review Board Statement

Not applicable.

Informed Consent Statement

Not applicable.

Data Availability Statement

The dataset generated during the current study is available from the [ADL-PSF-EI] repository (https://github.come/laith85) (accessed on 15 February 2024).

Conflicts of Interest

Author Mohammad H. Baniata was employed by the company Ubion. The remaining authors declare that the research was conducted in the absence of any commercial or financial relationships that could be construed as a potential conflict of interest.

References

  1. Agrawal, R.S.; Pandya, M.H. Survey of papers for Data Mining with Neural Networksto Predict the Student’s Academic Achievements. Int. J. Comput. Sci. Trends Technol. (IJCST) 2015, 3, 15. [Google Scholar]
  2. Beikzadeh, M.R.; Delavari, N. A New Analysis Model for Data Mining Processes in Higher Educational Systems. In Proceedings of the 6th Information Technology Based Higher Education and Training, Istanbul, Turkey, 7–9 July 2005. [Google Scholar]
  3. Steiner, C.; Kickmeier-Rust, M.; Albert, D. Learning Analytics and Educational Data Mining: An Overview of Recent Techniques. Learn. Anal. Serious Games 2014, 6, 6–15. [Google Scholar]
  4. Khan, S.; Alqahtani, S. Big Data Application and its Impact on Education. Int. J. Emerg. Technol. Learn. (iJET) 2020, 15, 36–46. [Google Scholar] [CrossRef]
  5. Ouatik, F.; Erritali, M.; Ouatik, F.; Jourhmane, M. Predicting Student Success Using Big Data and Machine Learning Algorithms. Int. J. Emerg. Technol. Learn. (iJET) 2022, 17, 236. [Google Scholar] [CrossRef]
  6. Chen, C.P.; Zhang, C.Y. Data-intensive applications, challenges, techniques, and technologies: A survey on Big Data. Inf. Sci. 2014, 275, 314–347. [Google Scholar] [CrossRef]
  7. Huan, S.; Yang, C. Learners’ Autonomous Learning Behavior in Distance Reading Based on Big Data. Int. J. Emerg. Technol. Learn. (Online) 2022, 17, 273. [Google Scholar] [CrossRef]
  8. Alsharaiah, M.A.; Baniata, L.H.; Aladwan, O.; AbuaAlghanam, O.; Abushareha, A.A.; Abuaalhaj, M.; Sharayah, Q.; Baniata, M. Soft Voting Machine Learning Classification Model to Predict and Expose Liver Disorder for Human Patients. J. Theor. Appl. Inf. Technol. 2022, 100, 4554–4564. [Google Scholar]
  9. Alsharaiah, M.A.; Baniata, L.H.; Adwan, O.; Abu-Shareha, A.A.; Abuaalhaj, M.; Kharma, Q.; Hussein, A.; Abualghanam, O.; Alassaf, N.; Baniata, M. Attention-based Long Short Term Memory Model for DNA Damage Prediction in Mammalian Cells. Int. J. Adv. Comput. Sci. Appl. 2022, 13, 91–99. [Google Scholar] [CrossRef]
  10. Alsharaiah, M.A.; Baniata, L.H.; Al Adwan, O.; Abuaalghanam, O.; Abu-Shareha, A.A.; Alzboon, L.; Mustafa, N.; Baniata, M. Neural Network Prediction Model to Explore Complex Nonlinear Behavior in Dynamic Biological Network. Int. J. Interact. Mob. Technol. 2022, 16, 32–51. [Google Scholar] [CrossRef]
  11. Krish, K. Data-Driven Architecture for Big Data. In Data Warehousing in the Age of Big Data; MK of Big Data-MK Series on Business Intelligence; Elsevier: Amsterdam, The Netherlands, 2013. [Google Scholar]
  12. Kastranis, A. Artificial Intelligence for People and Business; O’ Reily Media Inc.: Sebastopol, CA, USA, 2019. [Google Scholar]
  13. Siemens, G.; Baker, R.S. Learning analytics and educational data mining: Towards communication and collaboration. In Proceedings of the 2nd International Conference on Learning Analytics and Knowledge, Vancouver, BC, Canada, 29 April–2 May 2012. [Google Scholar]
  14. Aher, S.B. Data Mining in Educational System using WEKA. In Proceedings of the International Conference on Emerging Technology Trends (ICETT), Nagercoil, India, 23–24 March 2011. [Google Scholar]
  15. Aher, S.B.; Lobo, L.M.R.J. Mining Association Rule in Classified Data for Course Recommender System in E-Learning. Int. J. Comput. Appl. 2012, 39, 1–7. [Google Scholar]
  16. Felix, I.M.; Ambrosio, A.P.; Neves, P.S.; Siqueira, J.; Brancher, J.D. Moodle Predicta: A Data Mining Tool for Student Follow Up. In Proceedings of the International Conference on Computer Supported Education, Porto, Portugal, 21–23 April 2017. [Google Scholar]
  17. International Educational Data Mining Society. Available online: www.educationaldatamining.org (accessed on 25 January 2024).
  18. Gijbels, D.; Van de Watering, G.; Dochy, F.; Van den Bossche, P. The relationship between students’ approaches to learning and the assessment of learning outcomes. Eur. J. Psychol. Educ. 2005, 20, 327–341. [Google Scholar] [CrossRef]
  19. Onyema, E.M.; Elhaj, M.A.E.; Bashir, S.G.; Abdullahi, I.; Hauwa, A.A.; Hayatu, A.S.; Edeh, M.O.; Abdullahi, I. Evaluation of the Performance of K-Nearest Neighbor Algorithm in Determining Student Learning Style. Int. J. Innov. Sci. Eng. Technol. 2020, 7, 2348–7968. [Google Scholar]
  20. Anjali, J. A Review of Machine Learning in Education. J. Emerg. Technol. Innov. Res. (JETIR) 2019, 6, 384–386. Available online: http://www.jetir.org/papers/JETIR1905658.pdf (accessed on 25 January 2024).
  21. Hussain, S.; Dahan, N.A.; Ba-Alwib, F.M.; Najoua, R. Educational Data Mining and Analysis of Students’ Academic Performance Using WEKA. Indones. J. Electr. Eng. Comput. Sci. 2018, 9, 447–459. [Google Scholar] [CrossRef]
  22. López, M. Classification via clustering for predicting final marks based on student participation in forums. In Proceedings of the 5th International Conference on Educational Data Mining, Chania, Greece, 19–21 June 2012. [Google Scholar]
  23. Klašnja-Milićević, A. E-Learning personalization based on hybrid recommen recommendation strategy and learning style identification. Comput. Educ. 2011, 56, 885–899. [Google Scholar] [CrossRef]
  24. Ayesha, S. Data Mining Model for Higher Education System. Eur. J. Sci. Res. 2010, 43, 24–29. [Google Scholar]
  25. Alfiani, A.P.; Wulandari, F.A. Mapping Student’s Performance Based on the Data Mining Approach (A Case Study). Agric. Agric. Sci. Procedia 2015, 3, 173–177. [Google Scholar]
  26. Bovo, A. Clustering moodles data as a tool for profiling students. In Proceedings of the International Conference on E-Learning and E-Technologies in Education (ICEEE), Lodz, Poland, 23–25 September 2013; pp. 121–126. [Google Scholar]
  27. Antonenko, P.D.; Toy, S.; Niederhauser, D.S. Using cluster analysis for data mining in educational technology research. Educ. Technol. Res. Dev. 2012, 60, 383–398. [Google Scholar] [CrossRef]
  28. Méndez Suárez, M.; Crespo Tejero, N. Impact of absenteeism on academic performance under compulsory attendance policies in first to fifth year university students. Rev. Complut. Educ. 2021, 32, 627–637. [Google Scholar] [CrossRef]
  29. Chavez, H.; Chavez-Arias, B.; Contreras-Rosas, S.; Alvarez-Rodríguez, J.M.; Raymundo, C. Artificial neural network model to predict student performa. Front. Educ. 2023, 8. [Google Scholar] [CrossRef]
  30. Xiong, S.Y.; Gasim, E.F.M.; Xin Ying, C.; Wah, K.K.; Ha, L.M. A Proposed Hybrid CNN-RNN Architecture for Student Performance Prediction. Int. J. Intell. Syst. Appl. Eng. 2022, 10, 347–355. [Google Scholar]
  31. Peng, Y.; Lu, B. Hybrid learning clonal selection algorithm. Inf. Sci. 2015, 296, 128–146. [Google Scholar] [CrossRef]
  32. Saidi, M.; Chikh, A.; Settouti, N. Automatic Identification of Diabetes Diseases using an Artificial Immune Recognition System2 (AIRS2) with a Fuzzy K-Nearest Neighbor. In Proceedings of the Conférence Internationale sur l’Informatique et ses Applications, Saida, Algeria, 13–15 December 2011. [Google Scholar]
  33. Bendangnuksung, P.P. Students’ Performance Prediction Using Deep Neural Network. Int. J. Appl. Eng. Res. 2018, 13, 1171–1176. [Google Scholar]
  34. Dey, R.; Salem, F.M. Gate-Variants of Gated Recurrent Unit (GRU) Neural Networks. In Proceedings of the 2017 IEEE 60th International Midwest Symposium on Circuits and Systems (MWSCAS), Boston, MA, USA, 6–9 August 2017. [Google Scholar]
  35. Cho, K.; Van Merriënboer, B.; Bahdanau, D.; Bengio, Y. On the Properties of Neural Machine Translation: Encoder-Decoder Approaches. arXiv 2014, arXiv:1409.1259. [Google Scholar]
  36. Ravanelli, M.; Brakel, P.; Omologo, M.; Bengio, Y. Light Gated Recurrent Units for Speech Recognition. IEEE Trans. Emerg. Top. Comput. Intell. 2018, 2, 92–102. [Google Scholar] [CrossRef]
  37. Pomerat, J.; Segev, A.; Datta, R. On Neural Network Activation Functions and Optimizers in Relation to Polynomial Regression. In Proceedings of the IEEE International Conference on Big Data (Big Data), Los Angeles, CA, USA, 9–12 December 2019. [Google Scholar]
  38. Zhang, Z. Improved Adam Optimizer for Deep Neural Networks. In Proceedings of the 2018 IEEE/ACM 26th International Symposium on Quality of Service (IWQoS), Banff, AB, Canada, 4–6 June 2018. [Google Scholar]
  39. K. Document. Available online: https://keras.io/search.html?query=maxpooling (accessed on 20 December 2023).
  40. Dense Layer. Keras. Available online: https://keras.io/api/layers/core_layers/dense/ (accessed on 15 January 2024).
  41. Sadiq, H.; Zahraa, F.M.; Yass, K.S. Prediction Model on Student Performance based on Internal Assessment using Deep Learning. Int. J. Emerg. Technol. Learn. 2019, 14, 4–22. [Google Scholar]
  42. Tharwat, A. Classification assessment methods. Appl. Comput. Inform. 2018, 17, 168–192. [Google Scholar] [CrossRef]
Figure 1. Student performance factors.
Applsci 14 01963 g001
Figure 2. The relationship between an educational system and data mining techniques.
Applsci 14 01963 g002
Figure 3. AdaBoost classification techniques—the AdaBoost classifier.
Applsci 14 01963 g003
Figure 4. The architecture of a Gated Recurrent Unit (GRU).
Applsci 14 01963 g004
Figure 5. The architecture of the proposed GRU model.
Applsci 14 01963 g005
Figure 6. The process for the GRU Model (left); max-pooling operation (right).
Applsci 14 01963 g006
Figure 7. General structure of confusion matrix.
Applsci 14 01963 g007
Figure 8. Accuracy analysis for the proposed GRU model.
Applsci 14 01963 g008
Figure 9. Relationship between model loss (error) with epoch during the training and testing of the model using the educational dataset.
Applsci 14 01963 g009
Figure 10. Confusion matrix for the GRU model.
Applsci 14 01963 g010
Figure 11. Correlation between the BA/BSc 5th Semester Examination (IN_Sem5) and the internal evaluation grades obtained from the BA/BSc 6th Semester Examination (IN_Sem6).
Applsci 14 01963 g011
Table 1. Features’ explanation with their values.
FeatureExplanationValues
ExamThree-Year Degree Six-Semester Examinations{‘BA’, ‘BSC’}
Two tests are listed in the account, i.e., BA and BSc
IN_Sem1Major/Honours Topics
Of Bachelor and Master Programs
{‘ENGM’, ’PHYM’, etc.}
ENGM- Major/Honours in English
PHYM- Major/Honours in Physics
IN_Sem2Internal Evaluation Grades
Acquired in the BA/BSc 1st
Semester Examination
Maximum marks: 20
Marks achieved by the students in the range of 1 to 20.
Mean: 15.66257
Standard deviation, SD: 2.593816
IN_Sem3Internal Evaluation Grades
Obtained in the BA/BSc 3rd
Semester Examination
Maximum marks: 40
Marks achieved by the students in the range of 1 to 40.
Mean: 31.95765
Standard deviation, SD: 5.101312
IN_Sem4Internal Evaluation Grades
Obtained in the BA/BSc 4th
Semester Examination
Maximum marks: 40
Marks achieved by the students in the range of 1 to 40.
Mean: 30.80859
Standard deviation: 5.43647
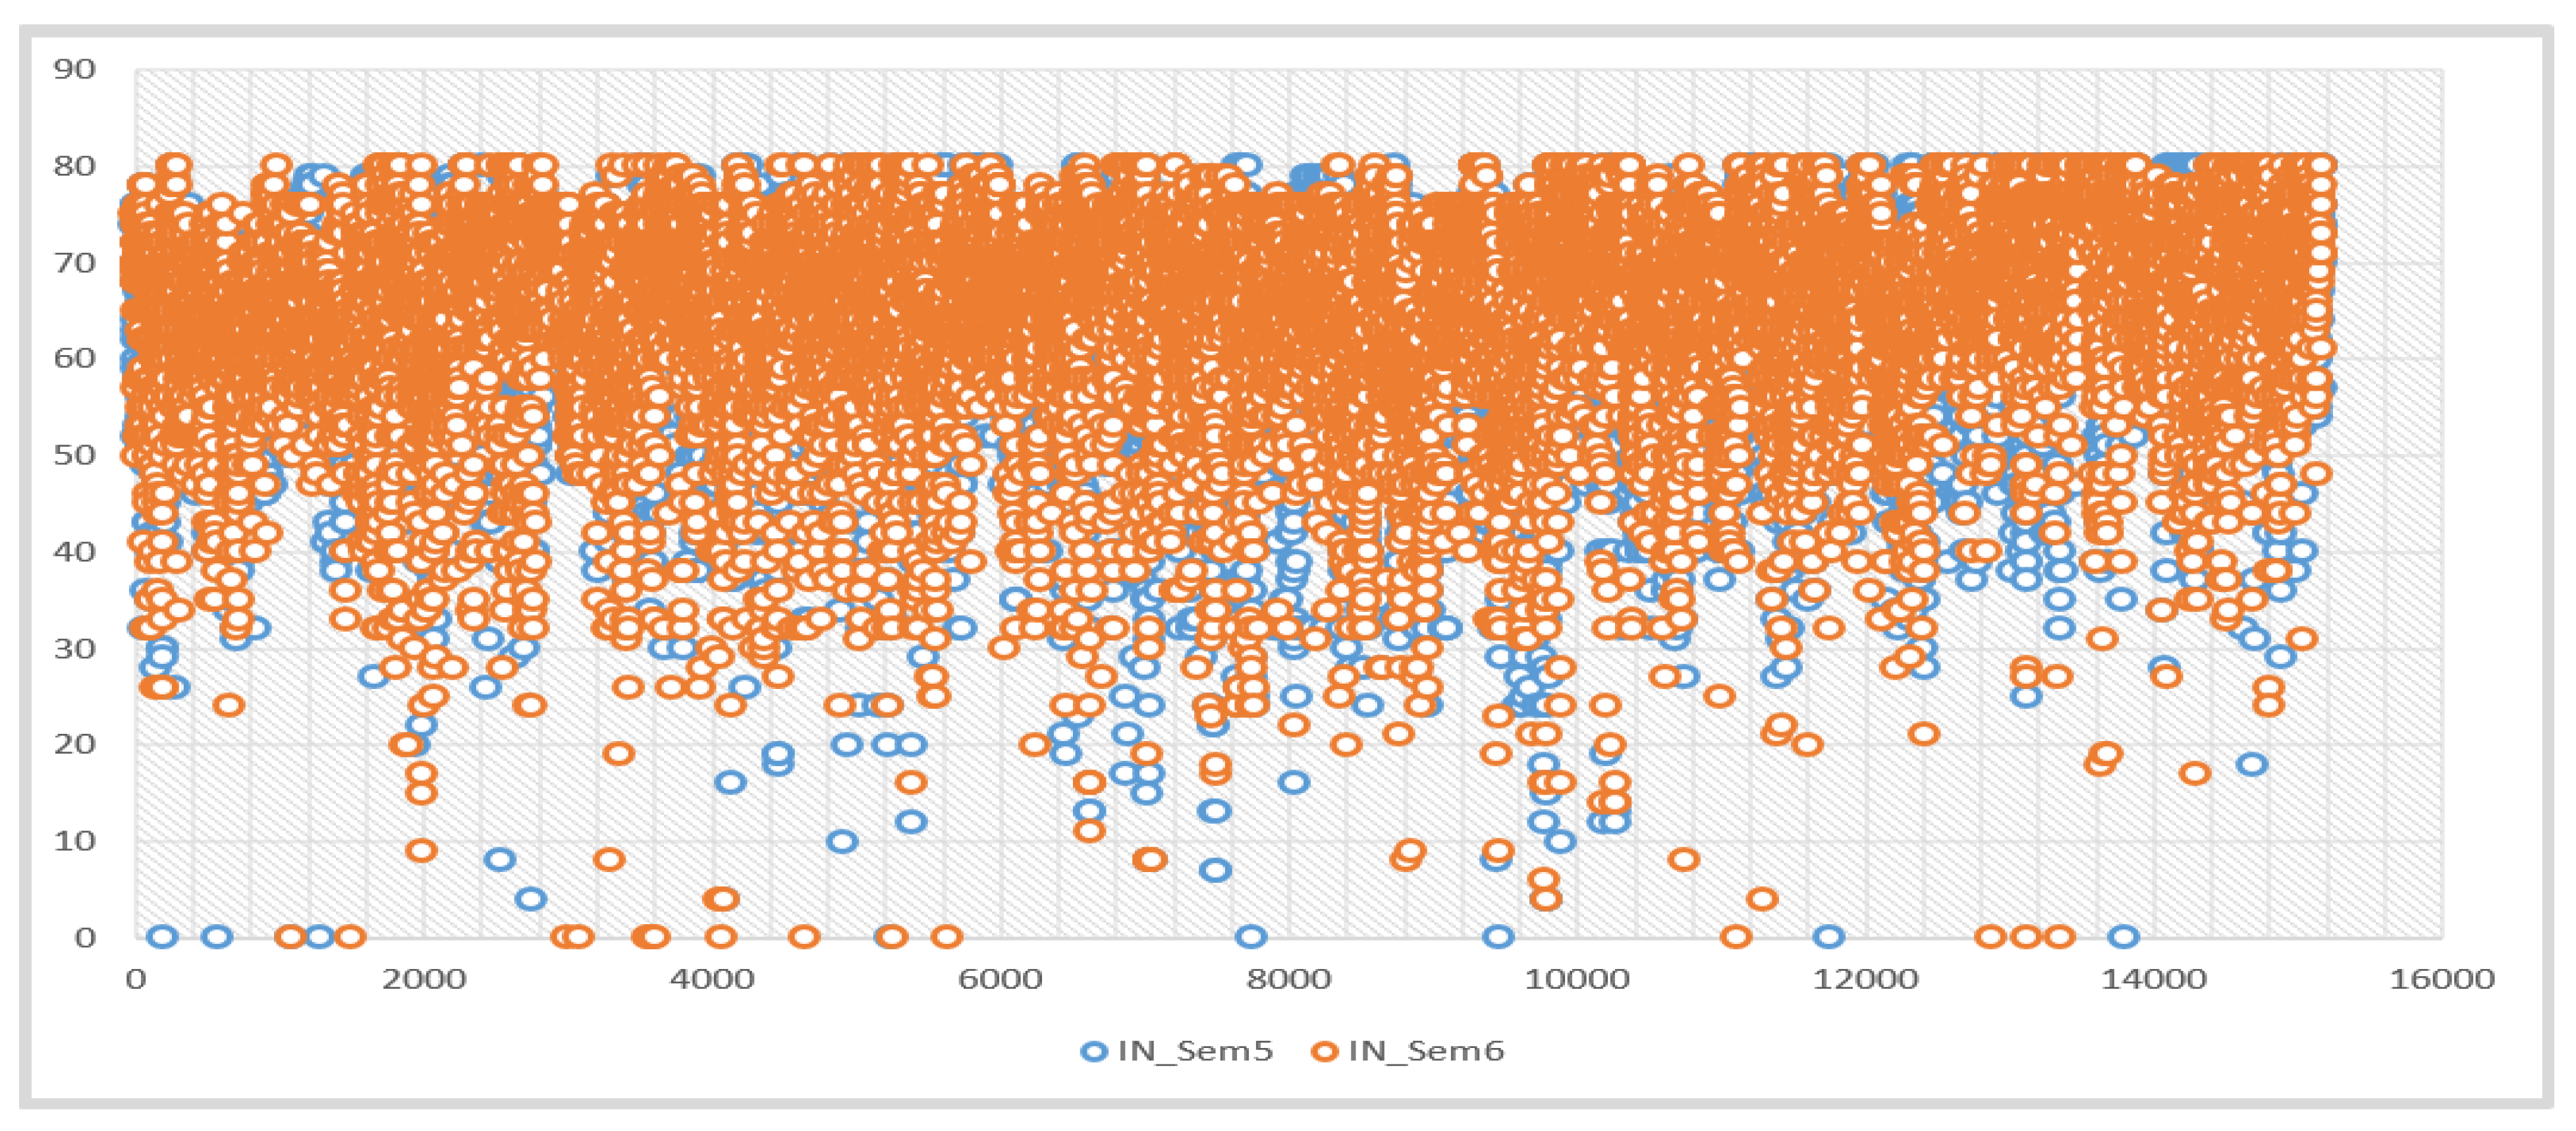
IN_Sem5Internal Evaluation Grades
Obtained in the BA/BSc 5th
Semester Examination
Maximum marks: 80
Marks achieved by the students in the range of 1 to 80.
Mean: 64.71536
Standard deviation: 10.18944
IN_Sem6Internal Evaluation Grades
Obtained in the BA/BSc 6th
Semester Examination
Maximum marks: 80
Marks achieved by the students in the range of 1 to 80.
Mean: 64.79921
Standard deviation: 10.3252
InPcOverall Percentage Secured
by the Candidate in all
Six Semesters in the Internal
Assessments
Mean: 80.44676
Standard deviation: 11.01706
ResultOverall result of the
Applicant Established in all Six
Semesters: Theory and Interior
Assessment
{‘Pass’, ‘Fail’}
If a student secures 40% or over, they are termed as ‘Pass’;
else, ‘Fail’
Table 2. Summary of the proposed GRU model.
No. of ParametersOutput ShapeLayer (Type)
0(None, 10, 1)Input_1 (inputLayer)
200(None, 10, 100)Word_dense (Dense)
274,944(None, 10, 256)Gru (GRU)
0(None, 256)Global_max_pooling (Global MaxpoolingID)
514(None, 2)Dense
Total Parameters: 275,658
Trainable Parameters: 275,658
Non-Trainable Parameters: 275,658
Table 3. Comparison between diverse classification approaches.
ClassifierPrecisionRecallF-ScoreAccuracy
RNN model0.960.990.9895.34
ARD V.20.9260.9320.93993.18
AdaBoost0.9340.9460.93994.57
The proposed model0.9860.9630.97499.70
Disclaimer/Publisher’s Note: The statements, opinions and data contained in all publications are solely those of the individual author(s) and contributor(s) and not of MDPI and/or the editor(s). MDPI and/or the editor(s) disclaim responsibility for any injury to people or property resulting from any ideas, methods, instructions or products referred to in the content.

