
Model Tests on Jacked Pile Penetration Characteristics Considering a Static Press-in Piling Machine


Abstract
1. Introduction
2. Model Test
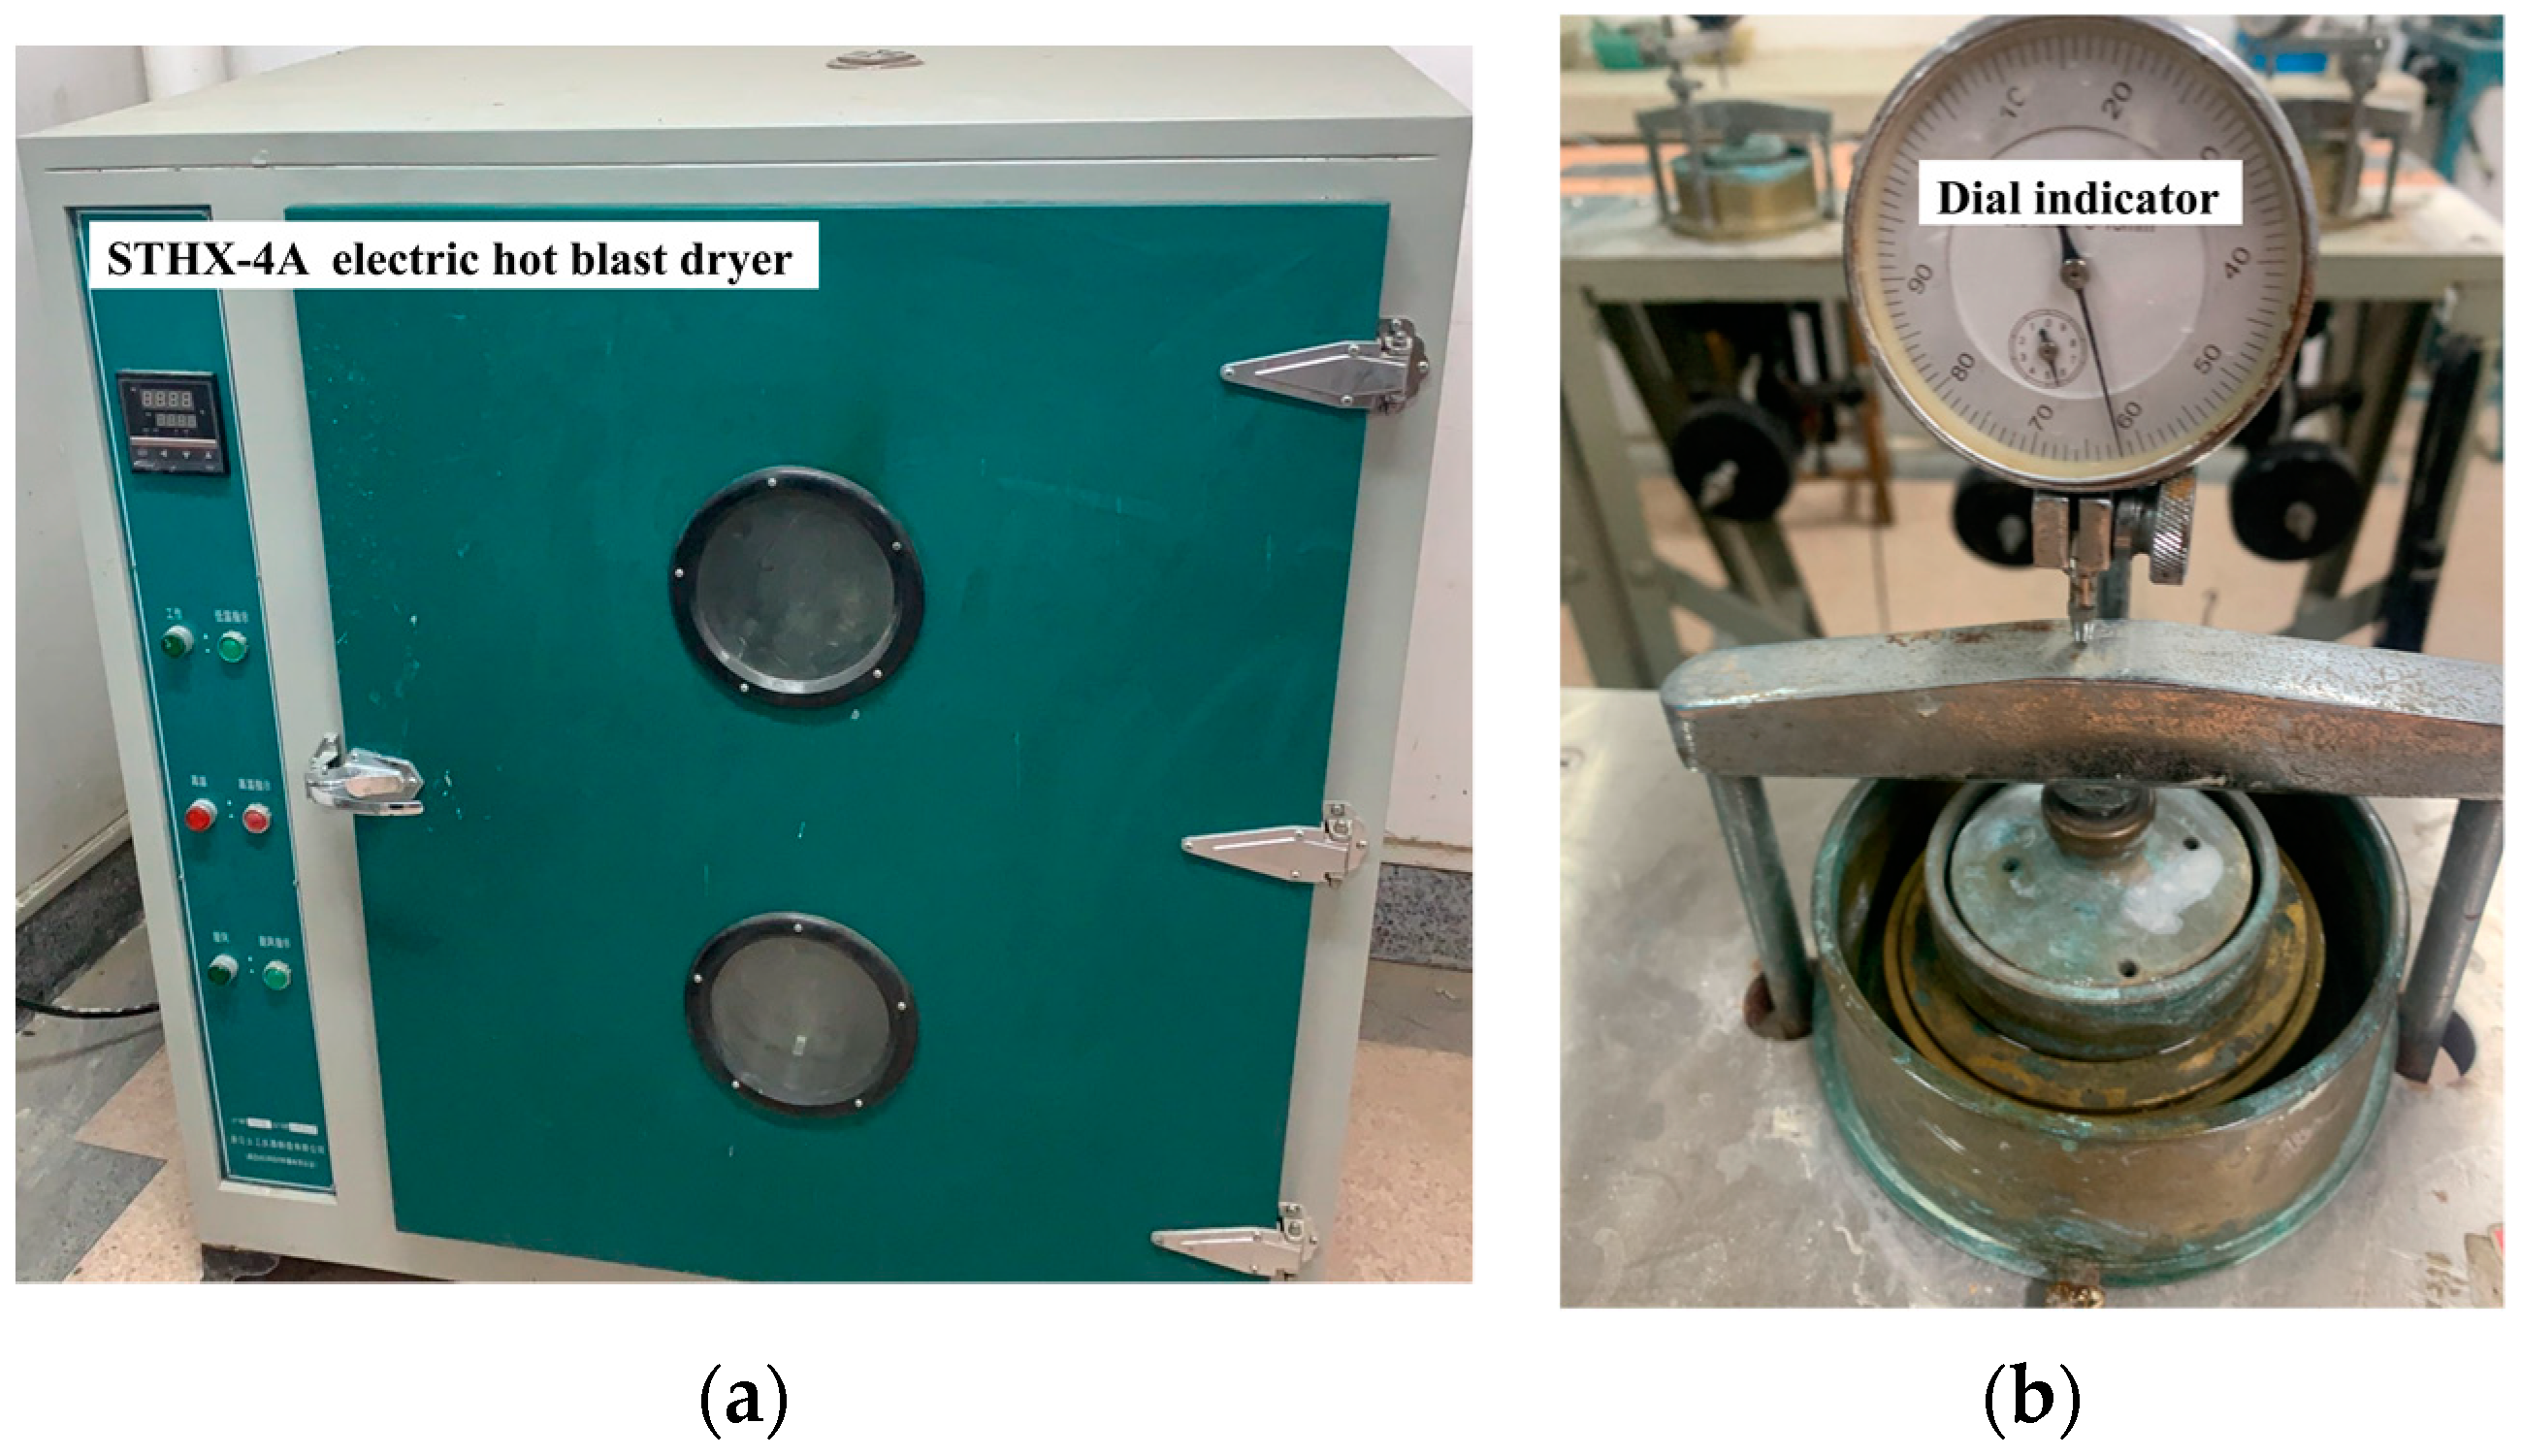
2.1. Soil Samples
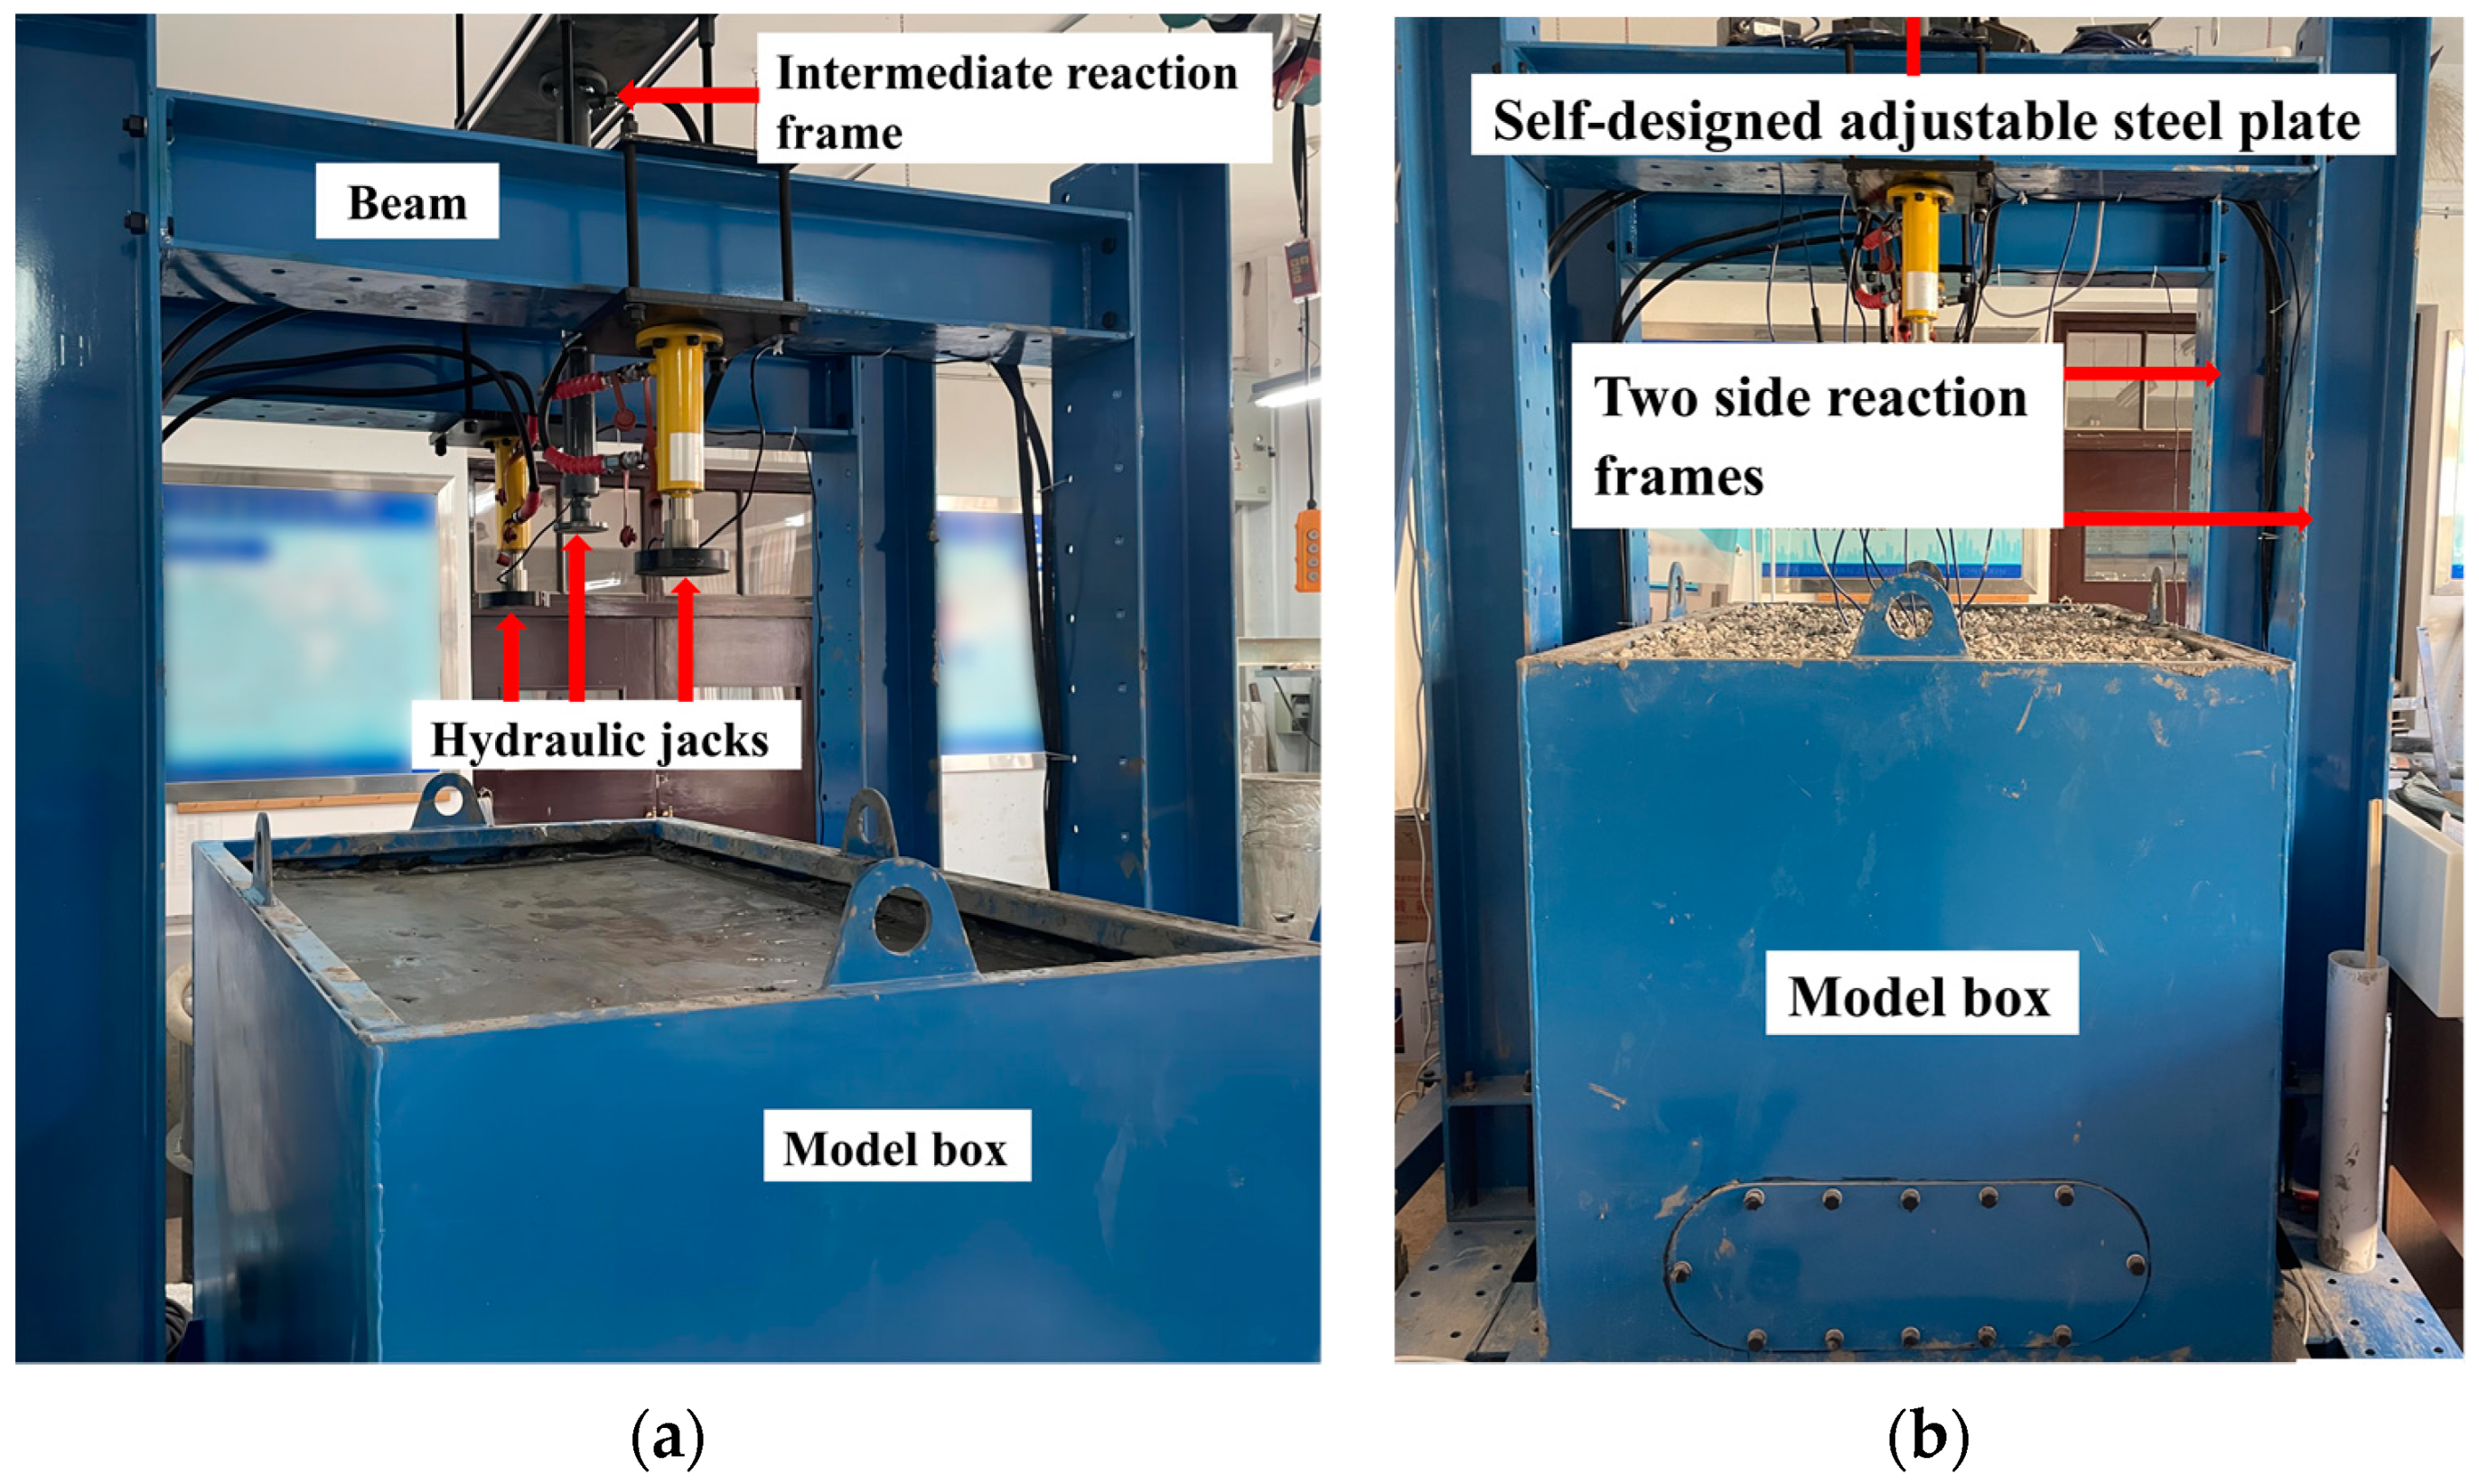
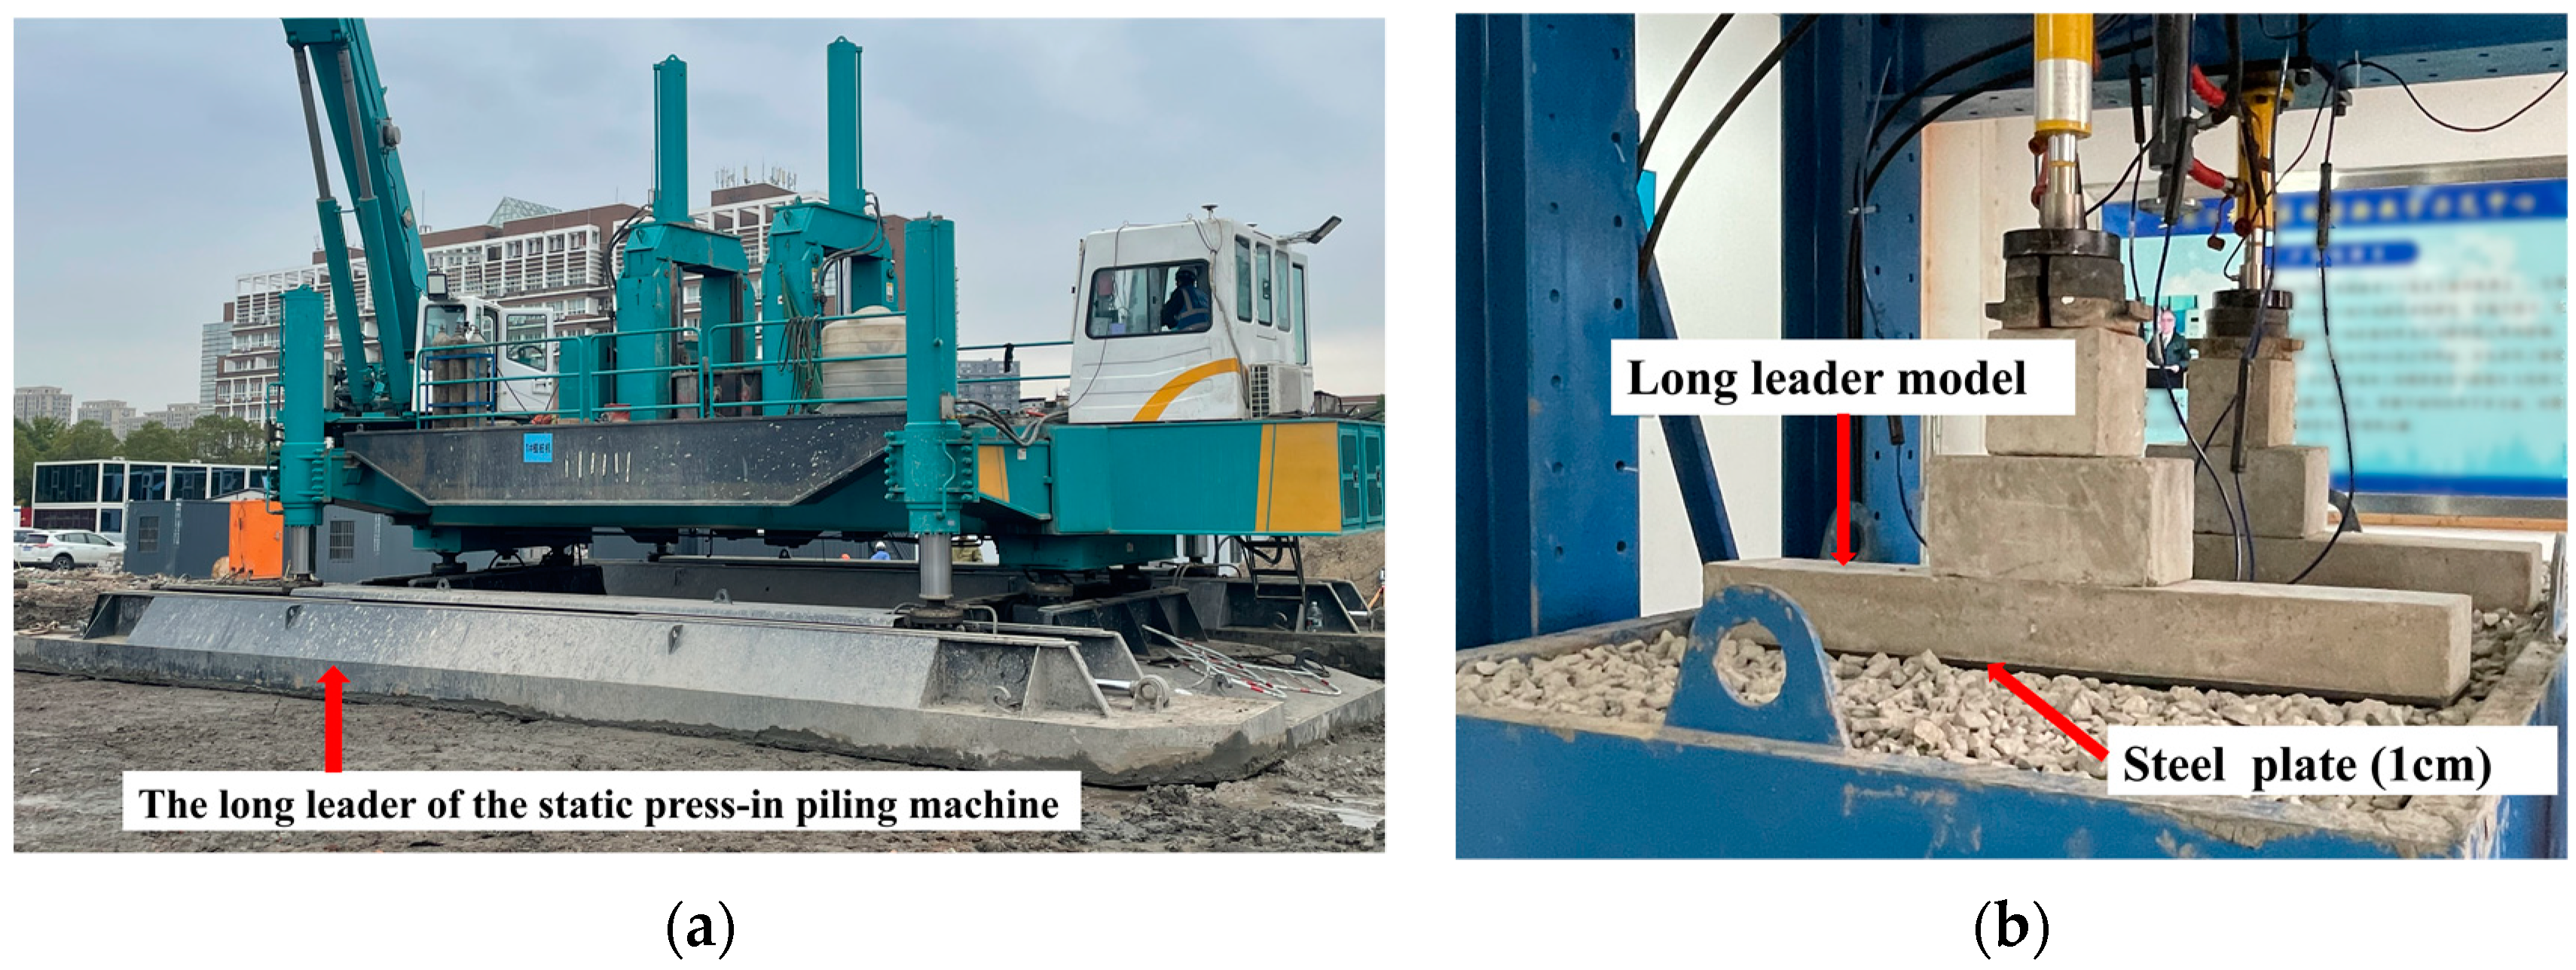
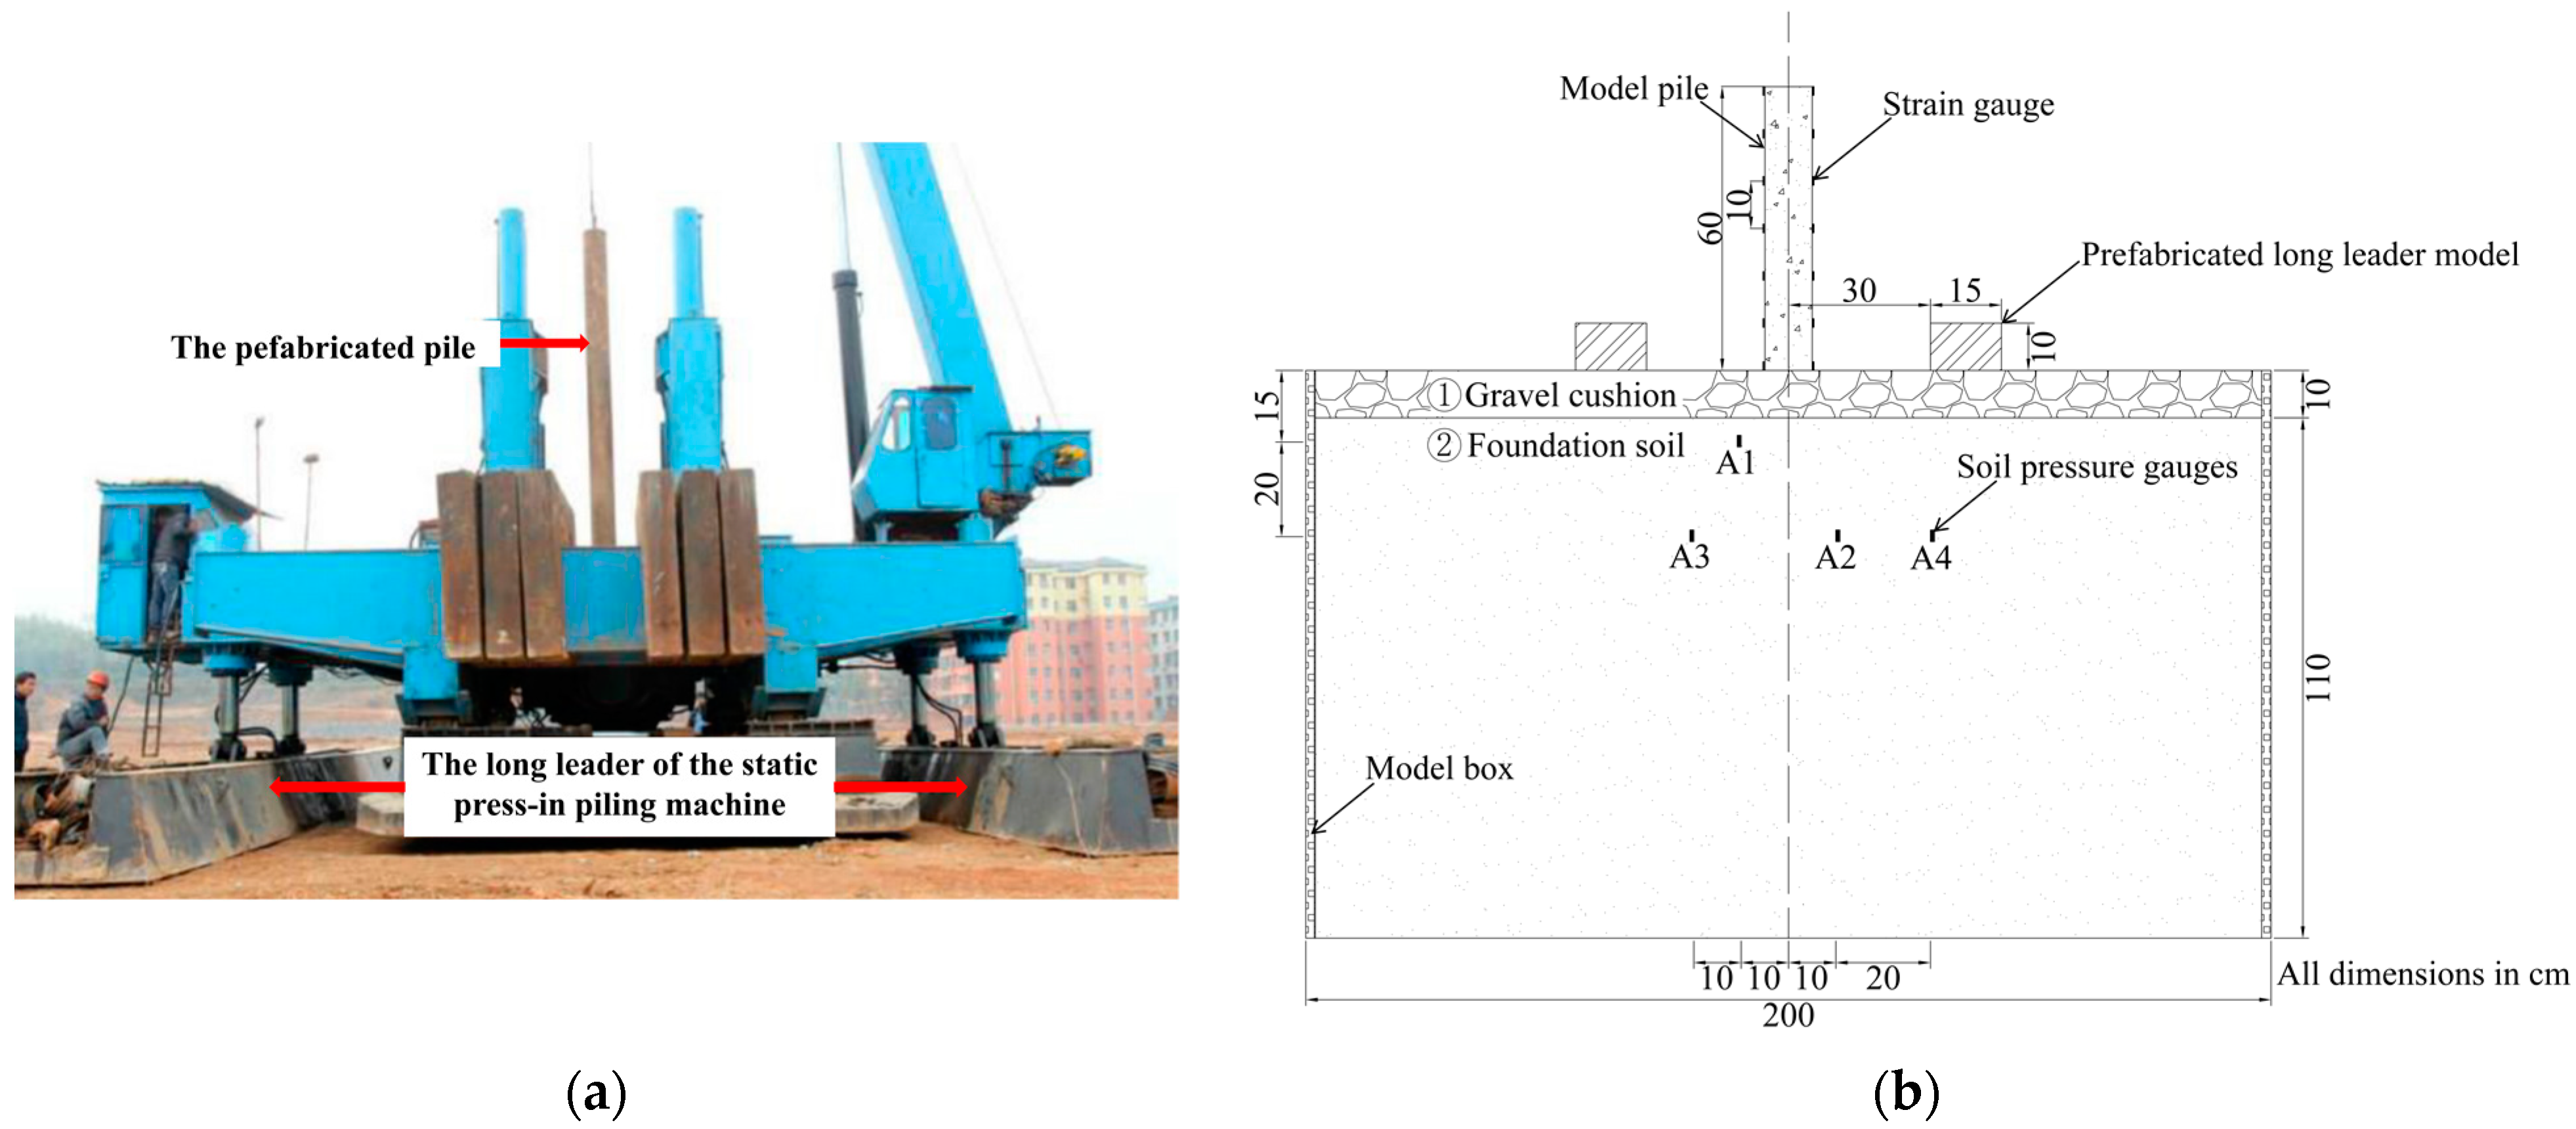
2.2. Testing Equipment
2.3. Test Scheme
2.4. Test Process
2.4.1. Model Foundation Soil
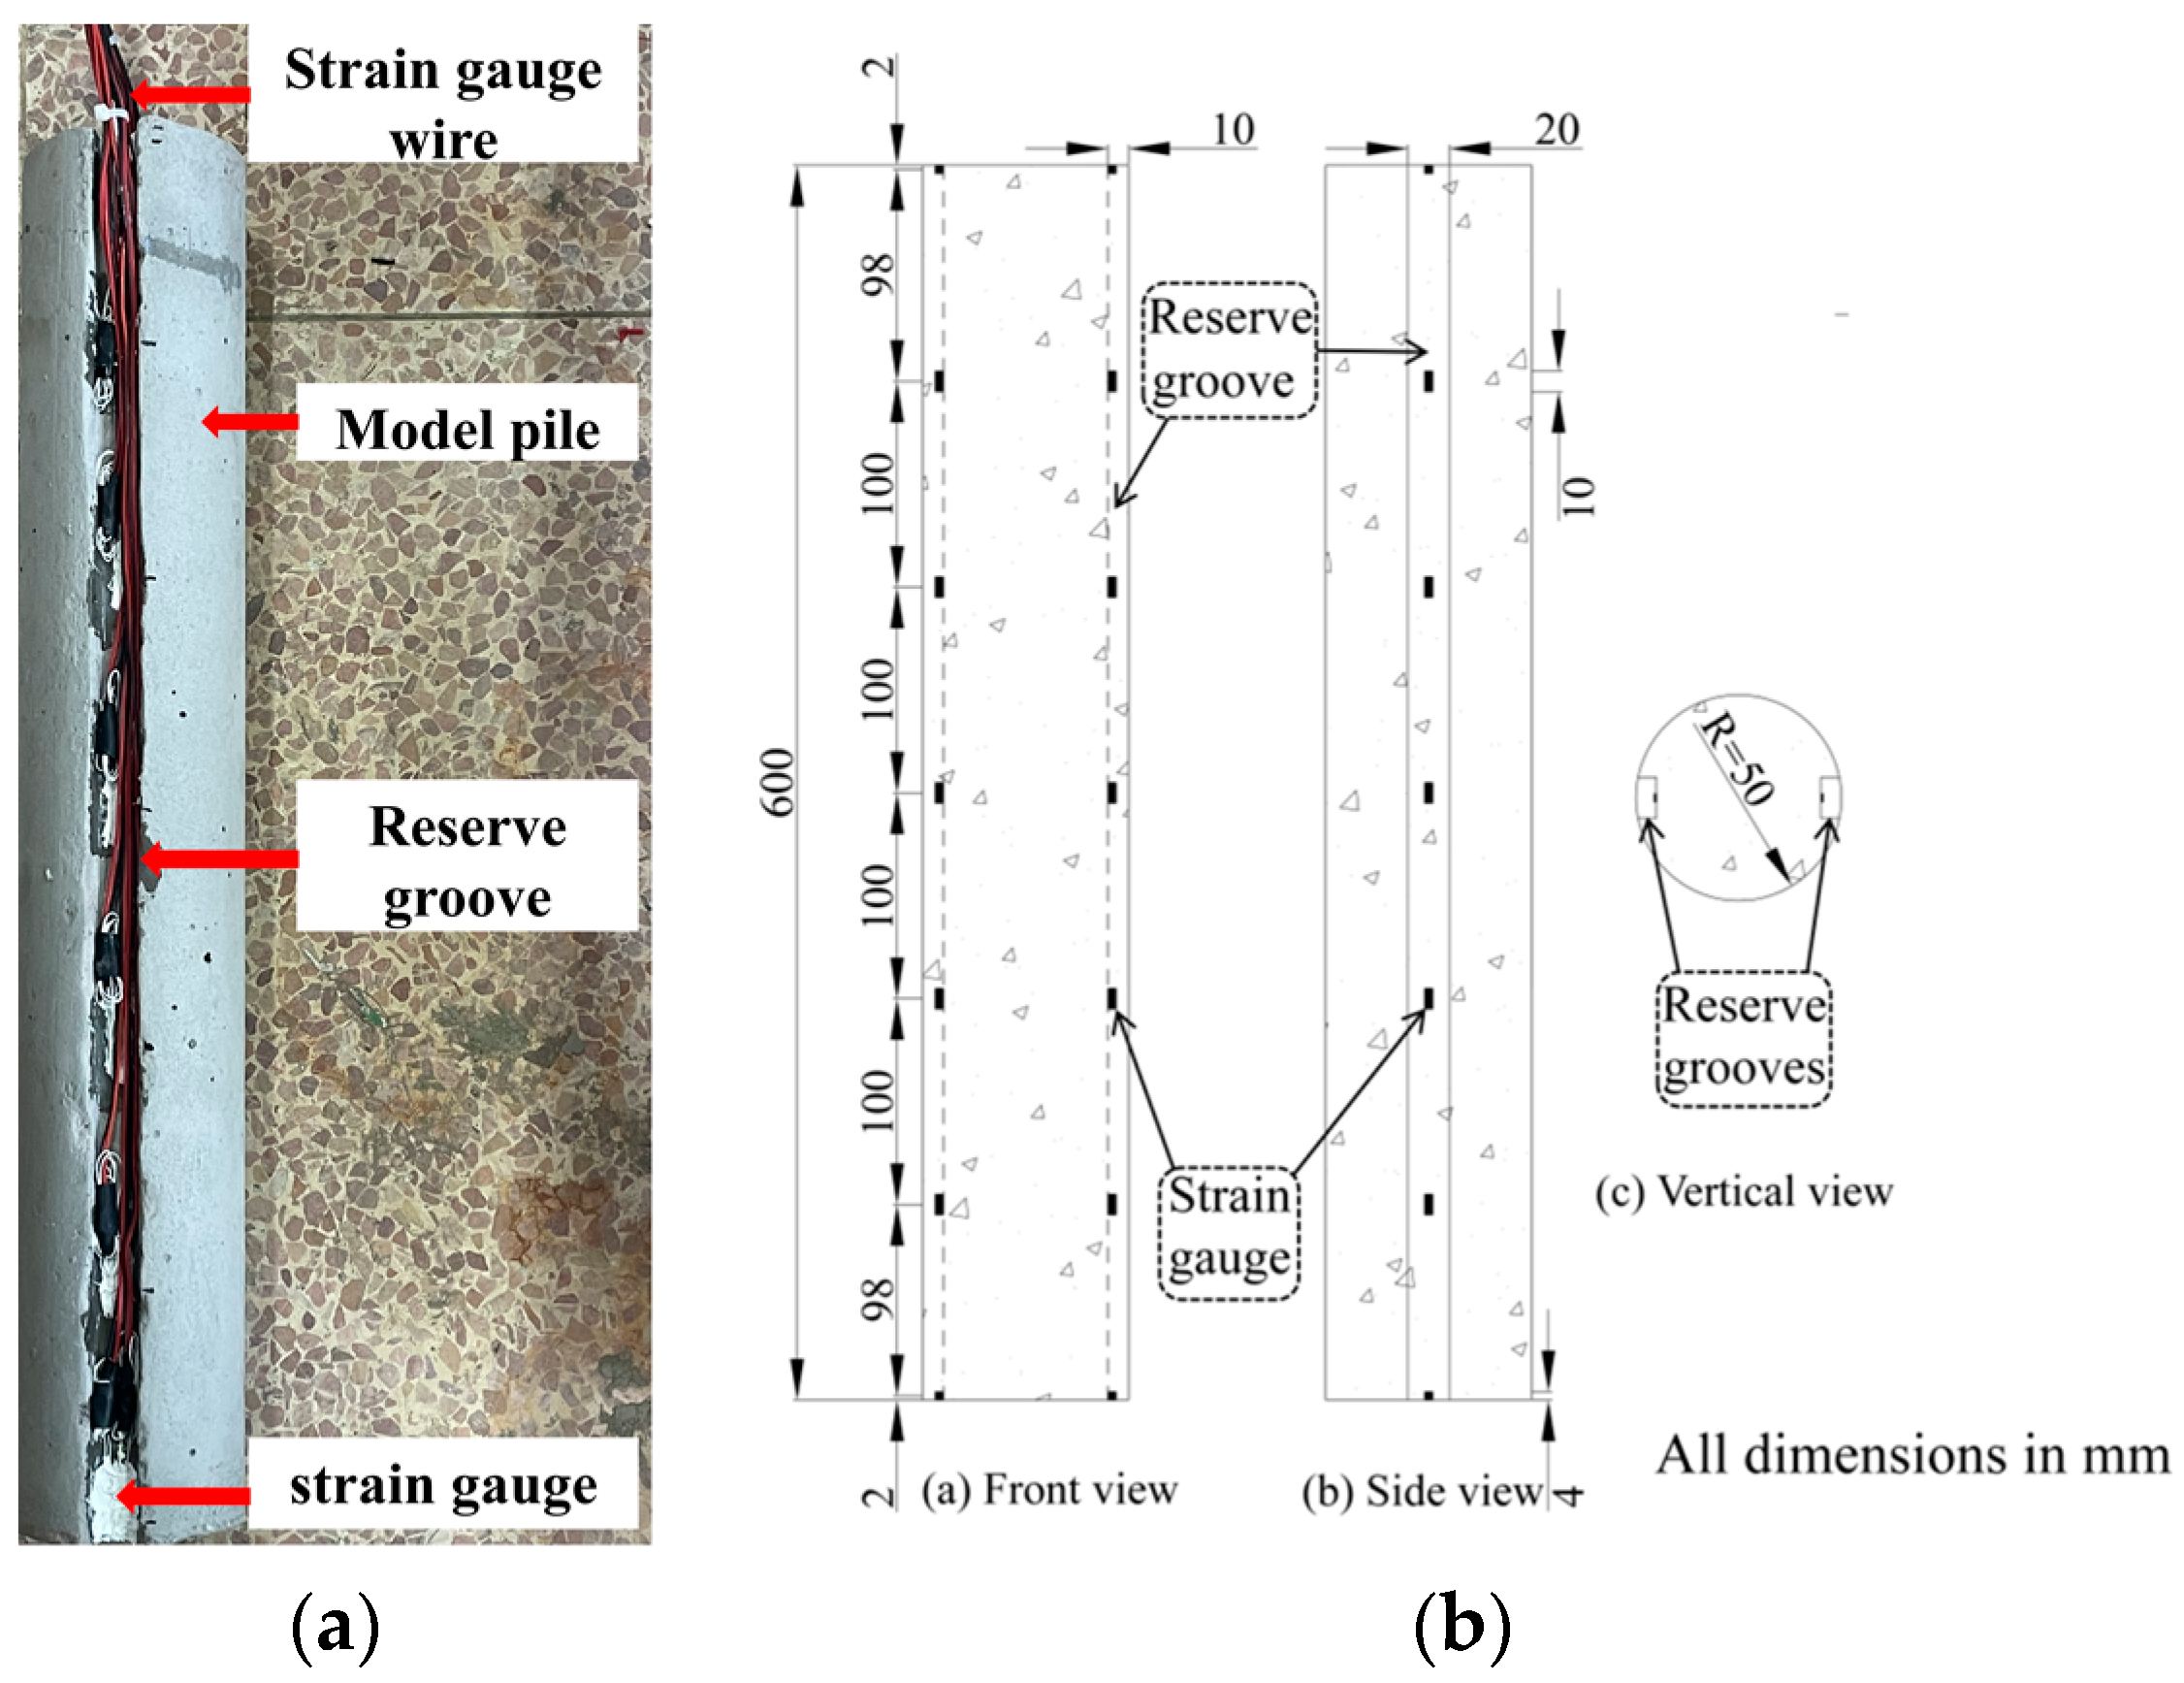
2.4.2. Sensor Layout
2.4.3. Experimental Scheme
3. Test Results and Analysis
3.1. Test Data Processing and Analysis
3.1.1. Pile Axial Force Calculation
3.1.2. Pile End Resistance and Pile Side Friction Resistance Calculation
3.1.3. Theoretical Introduction
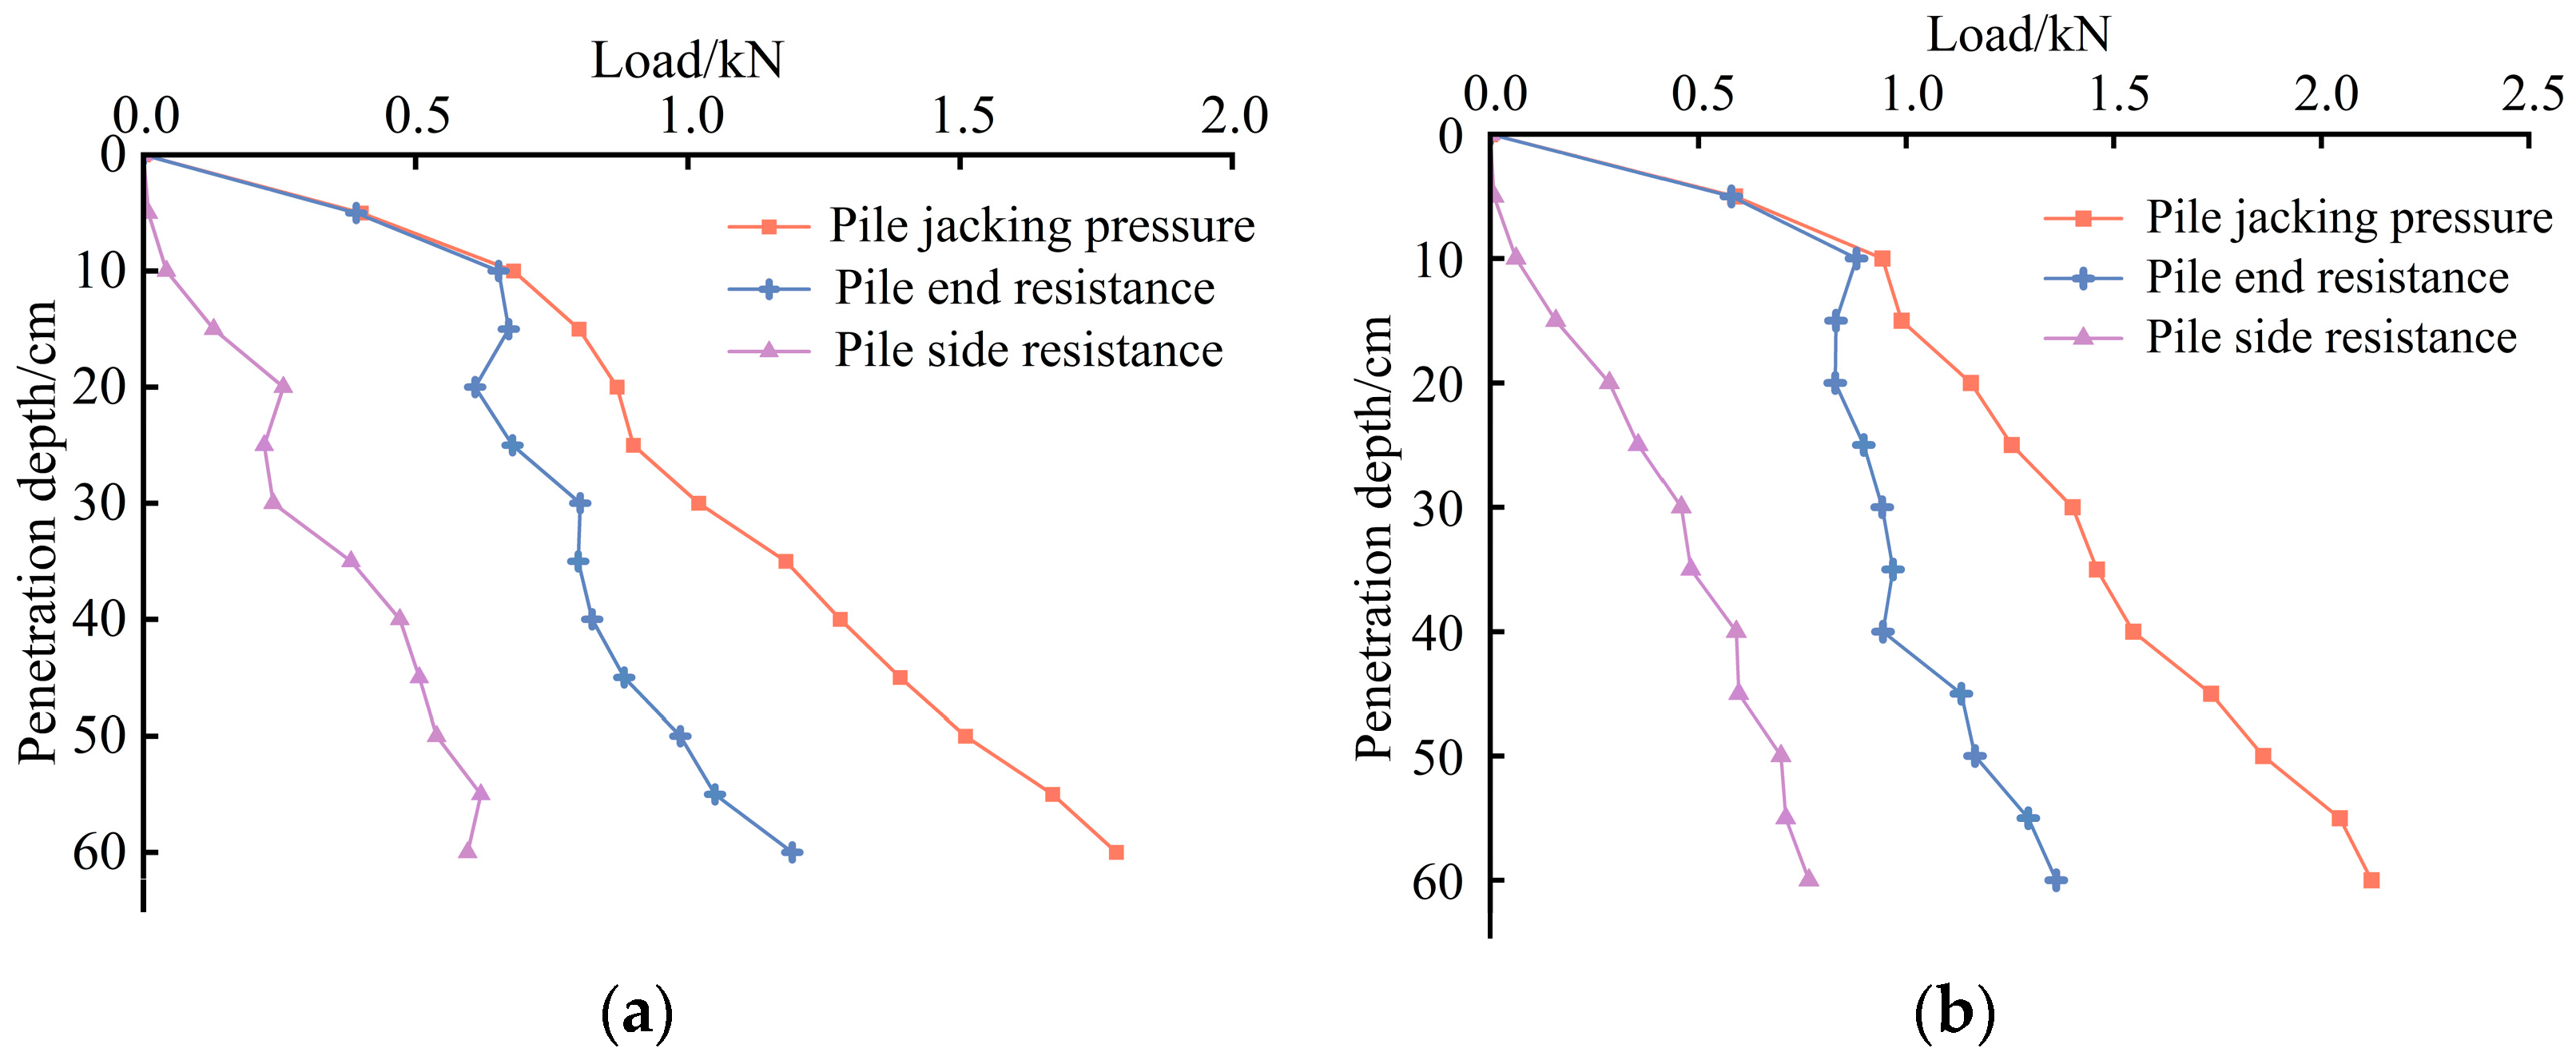
3.2. Pile Stress Properties
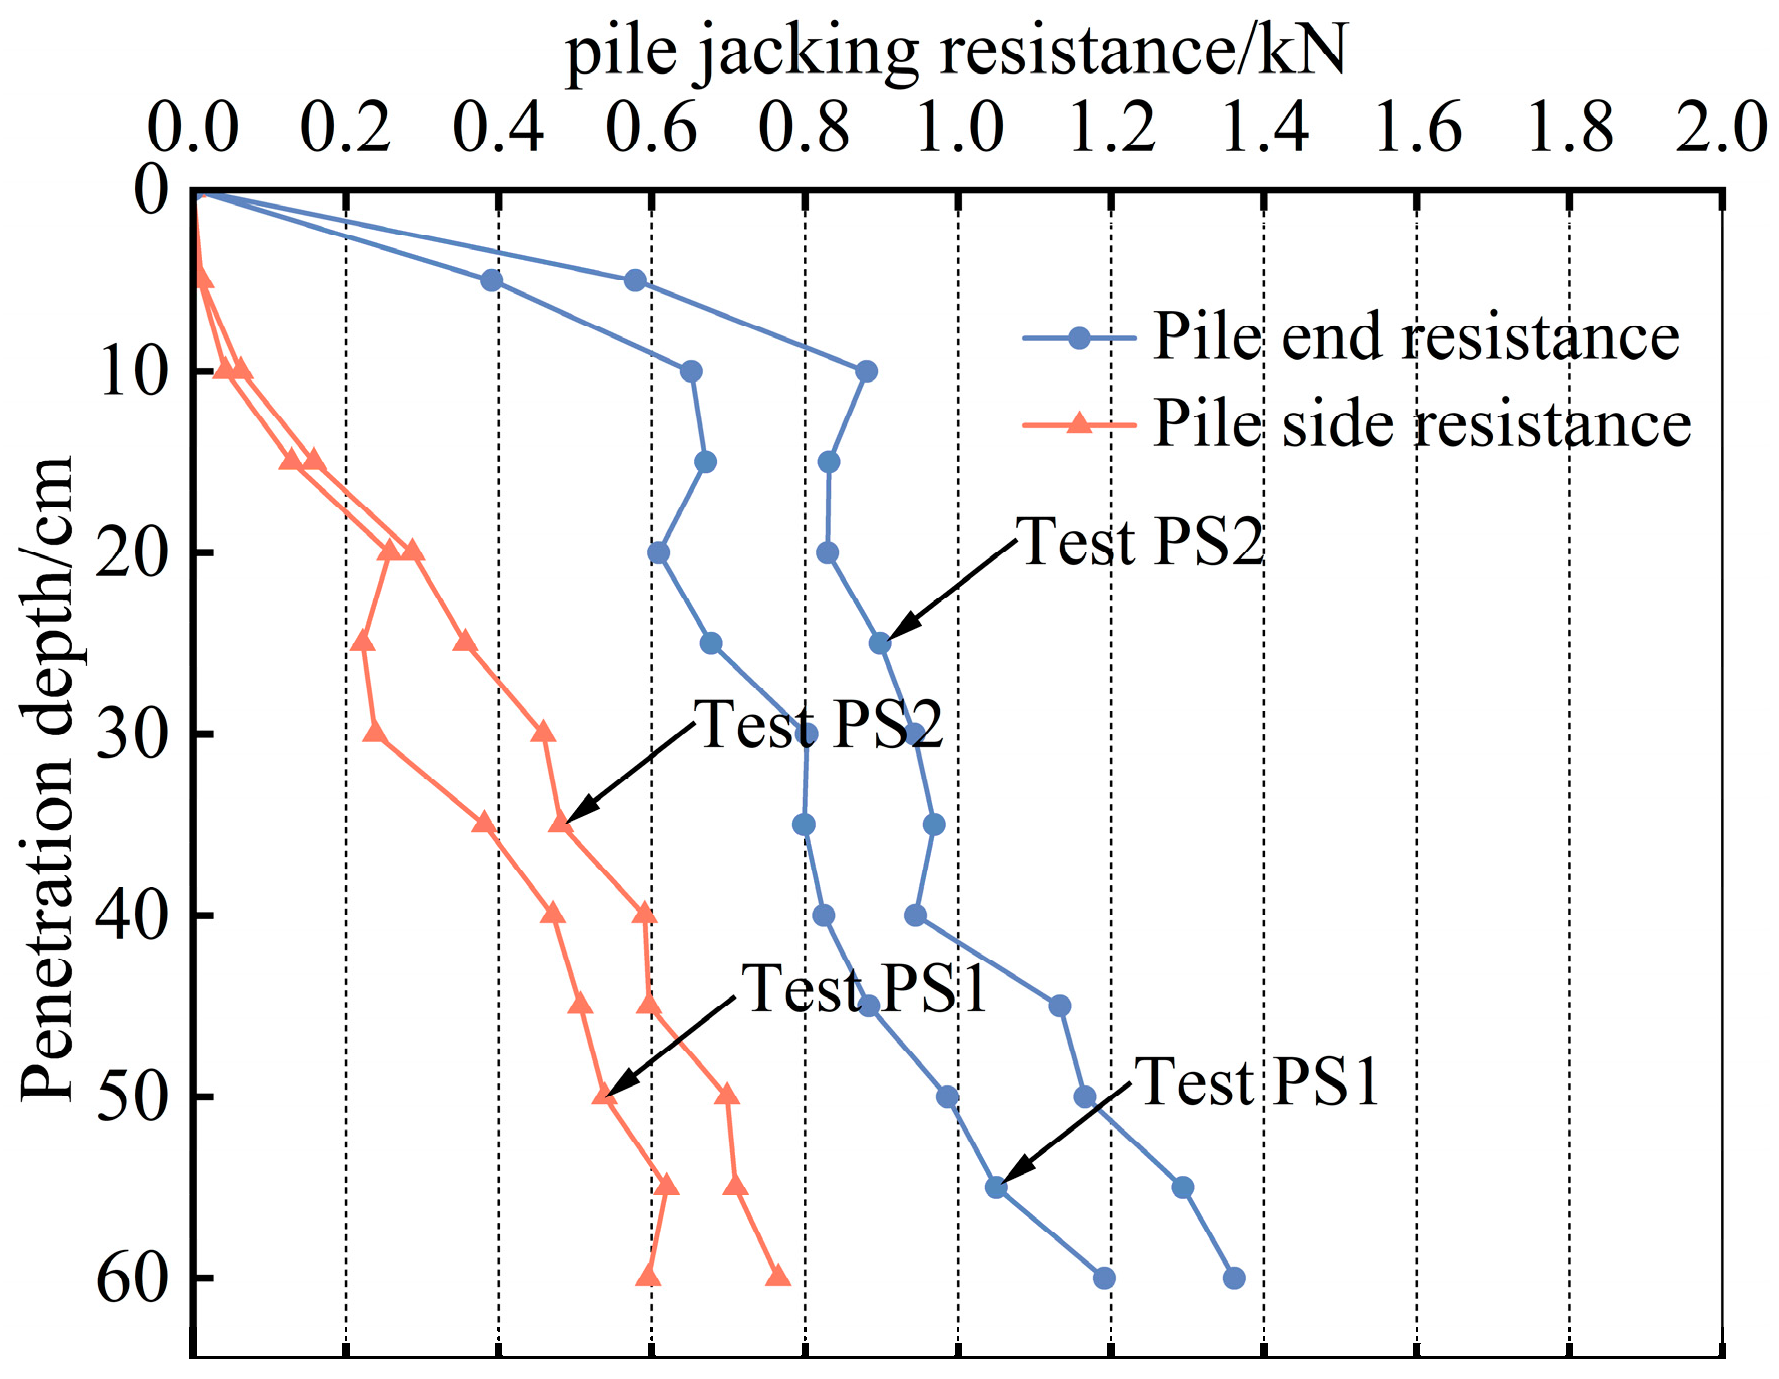
3.3. Pile Jacking Resistance
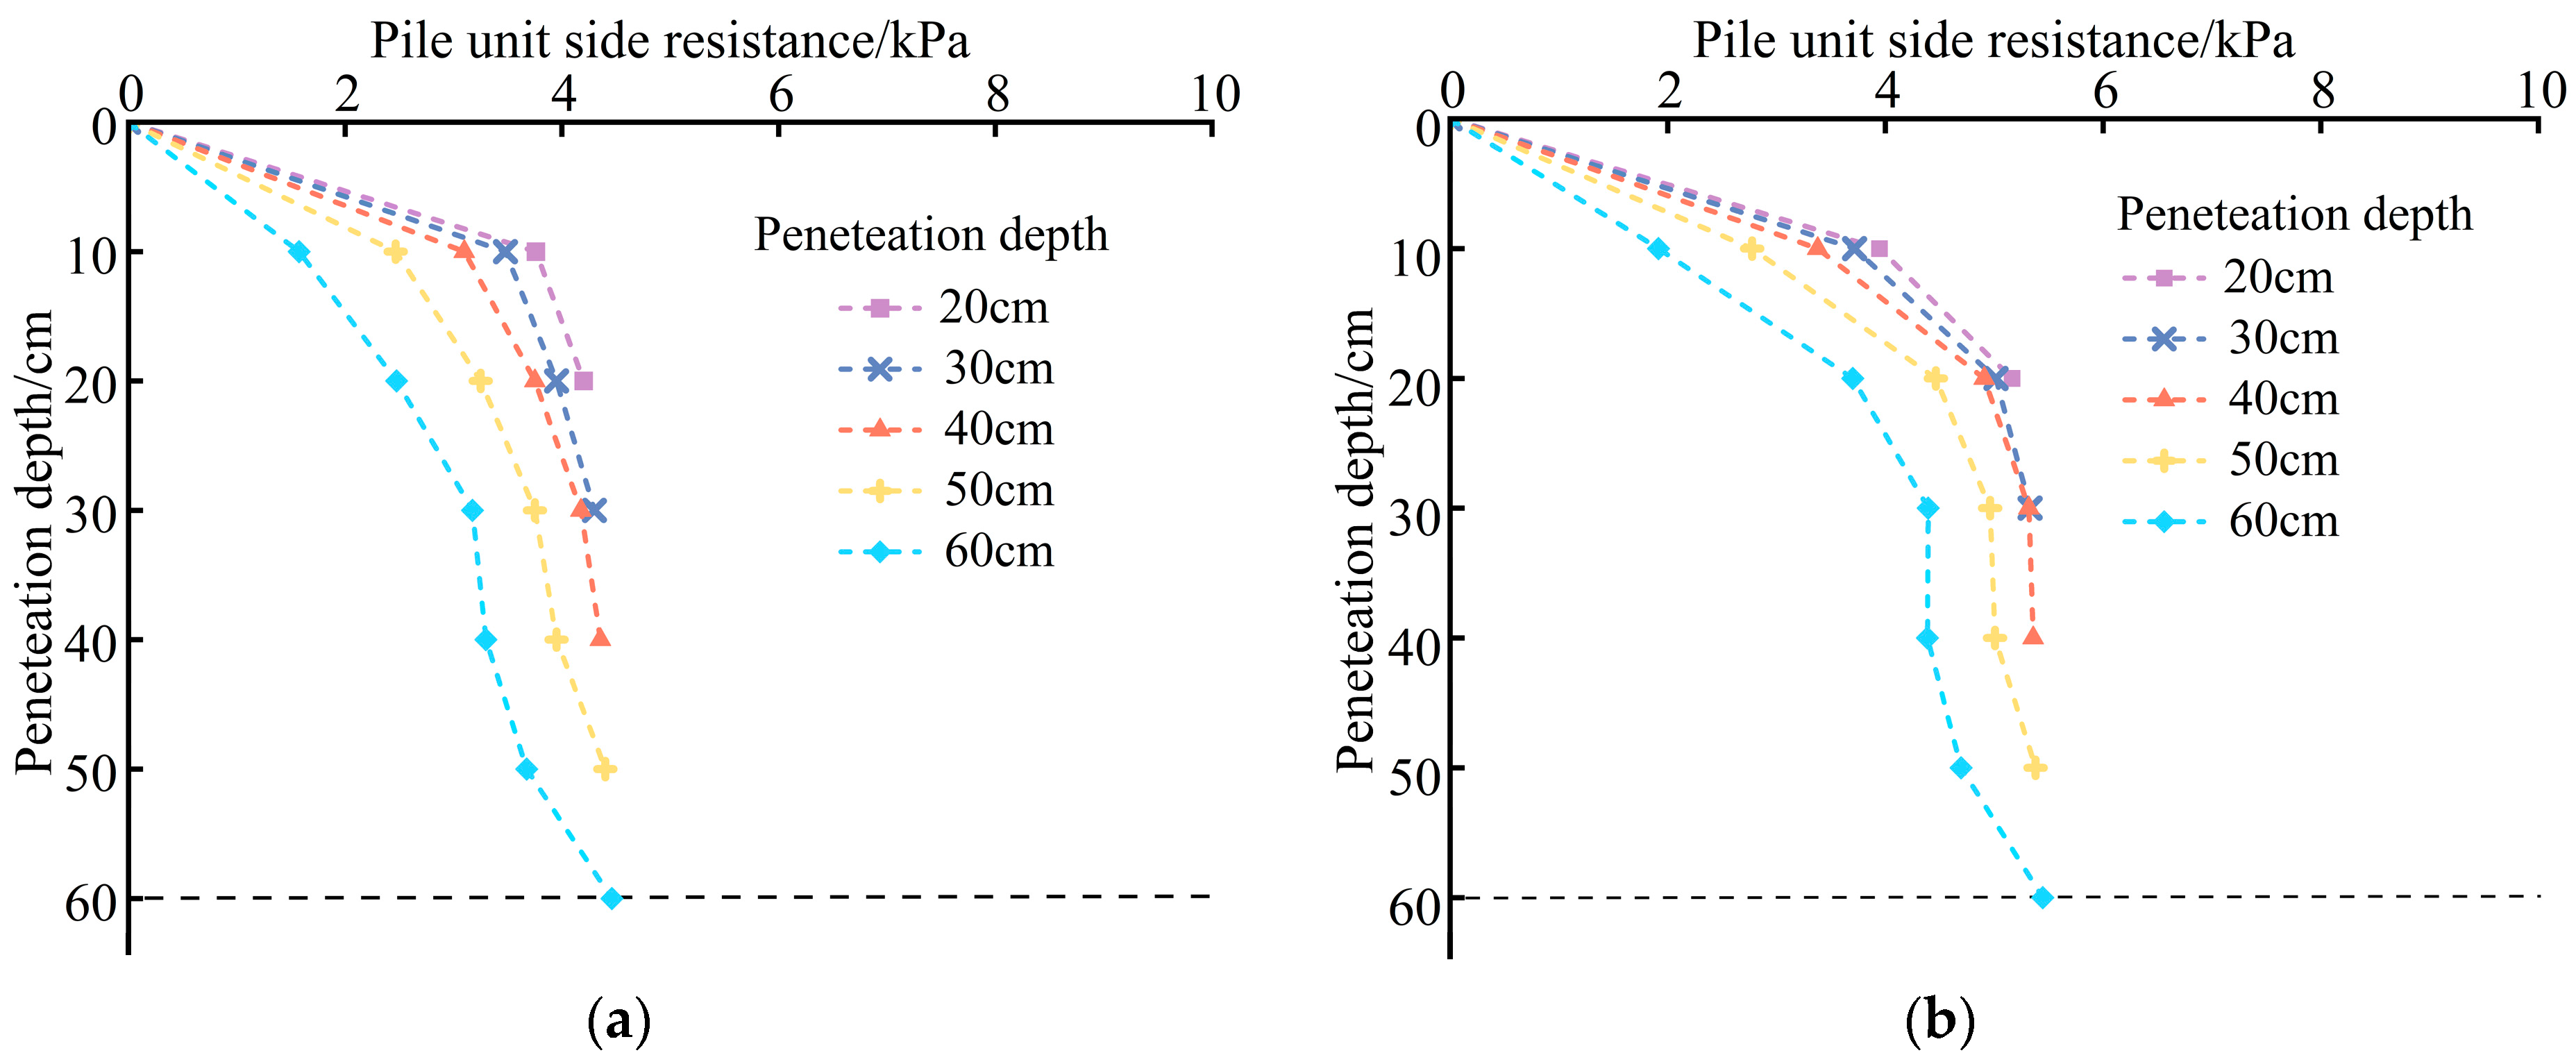
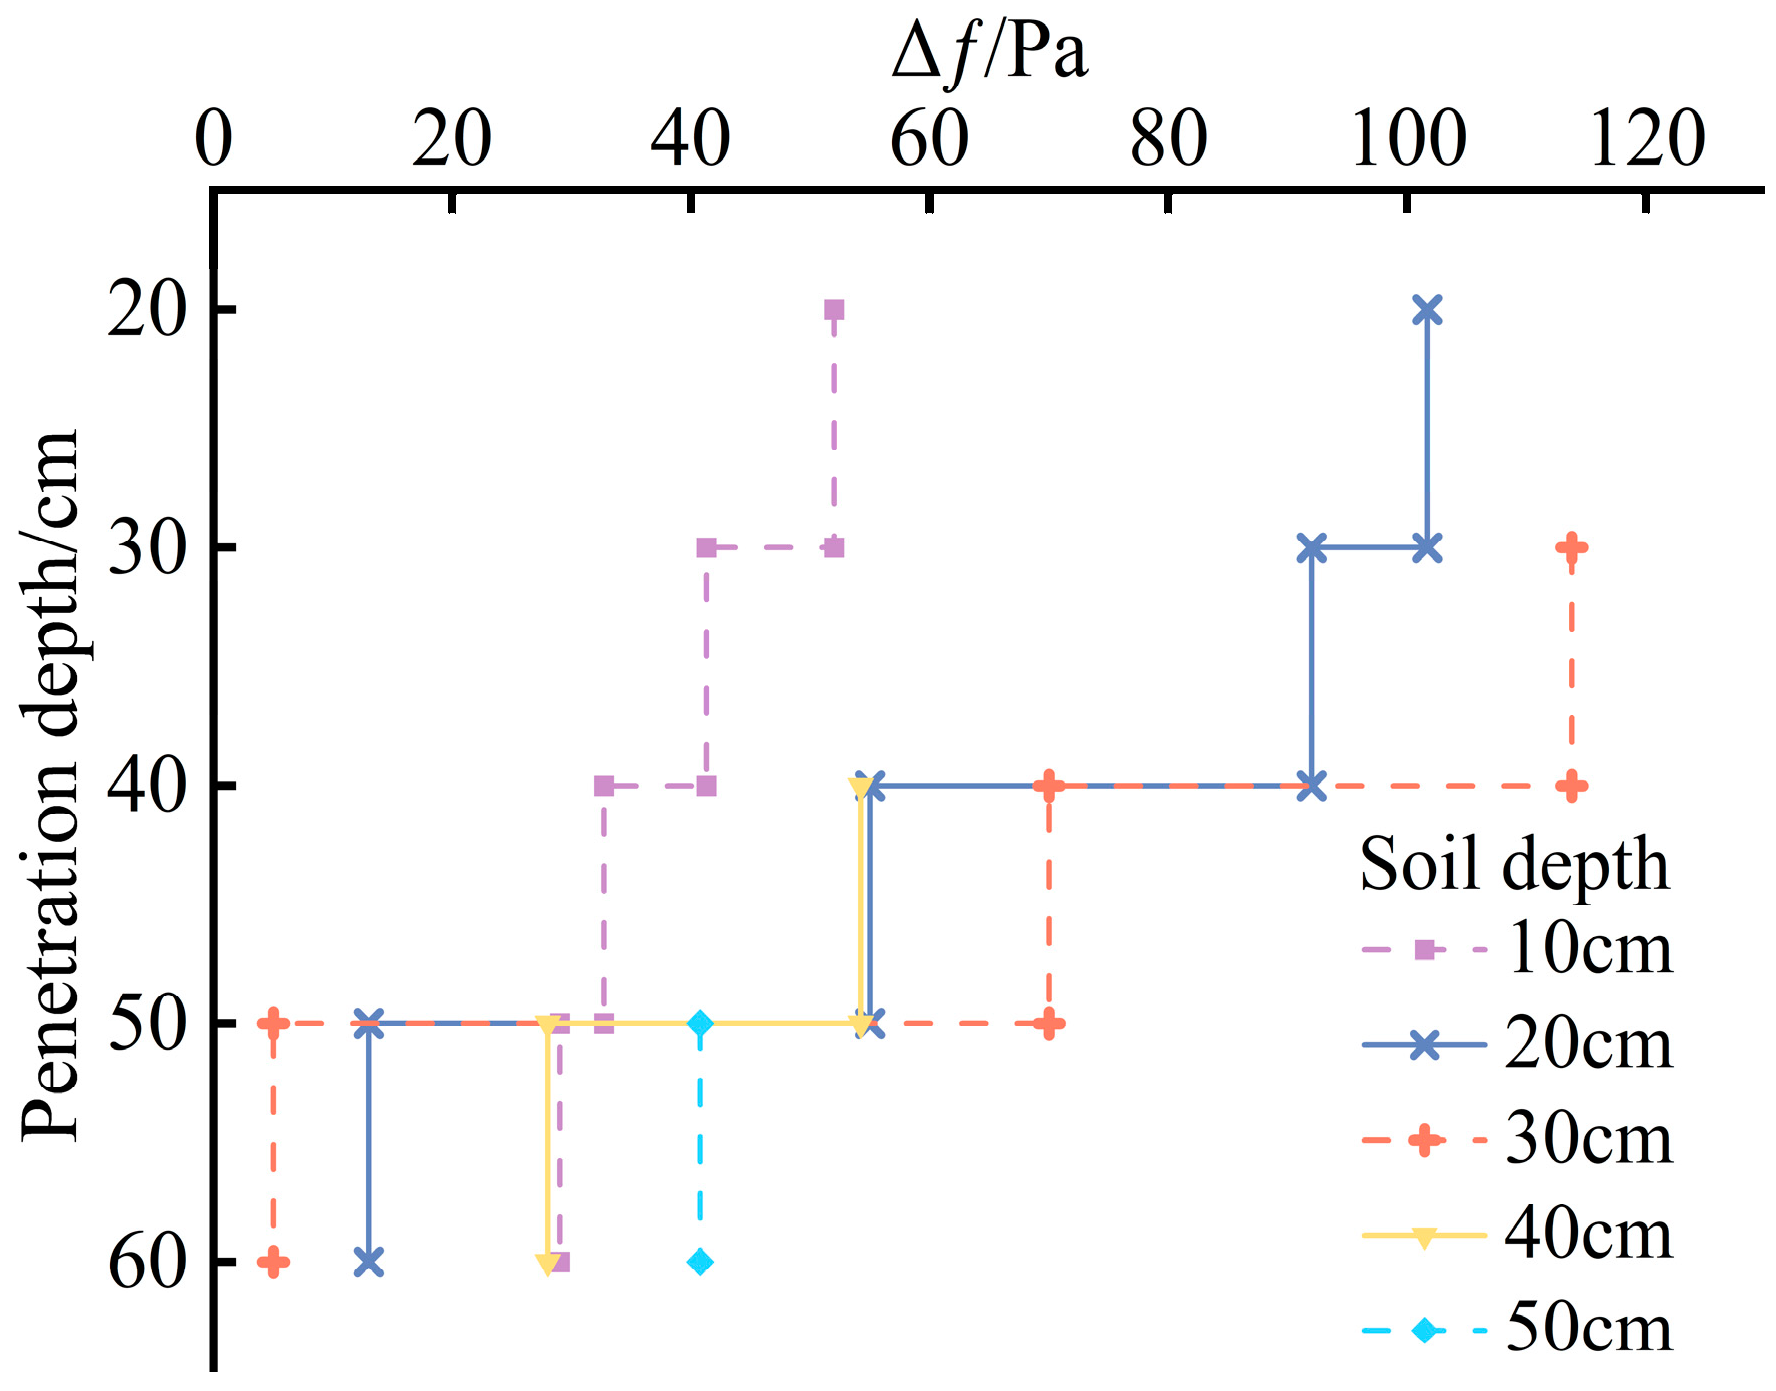
3.4. Pile Shaft Unit Side Friction Resistance
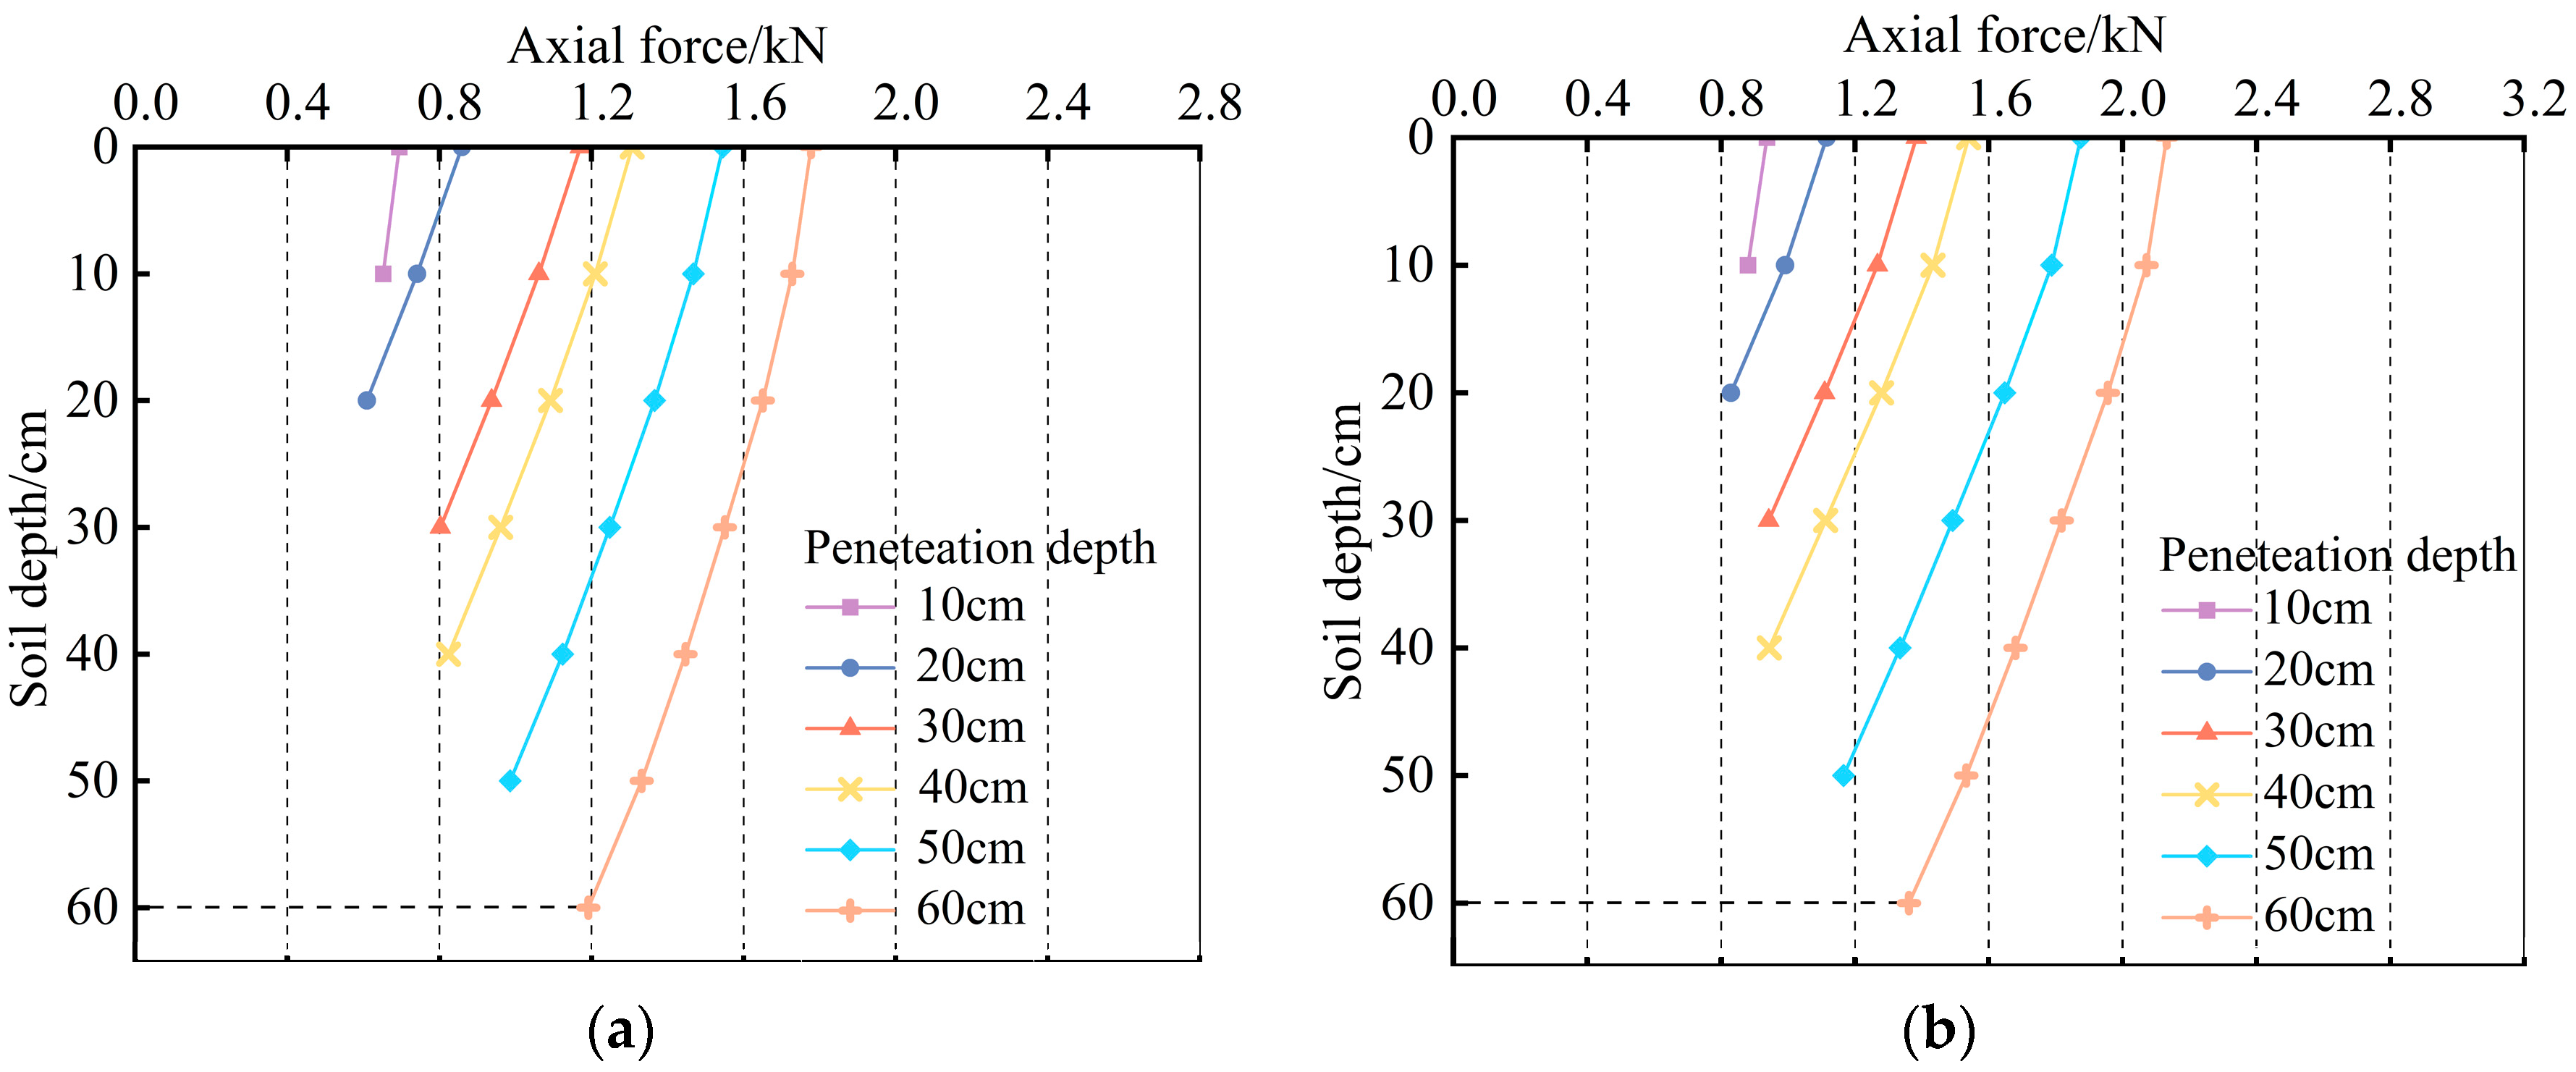
3.5. Pile Shaft Axial Force
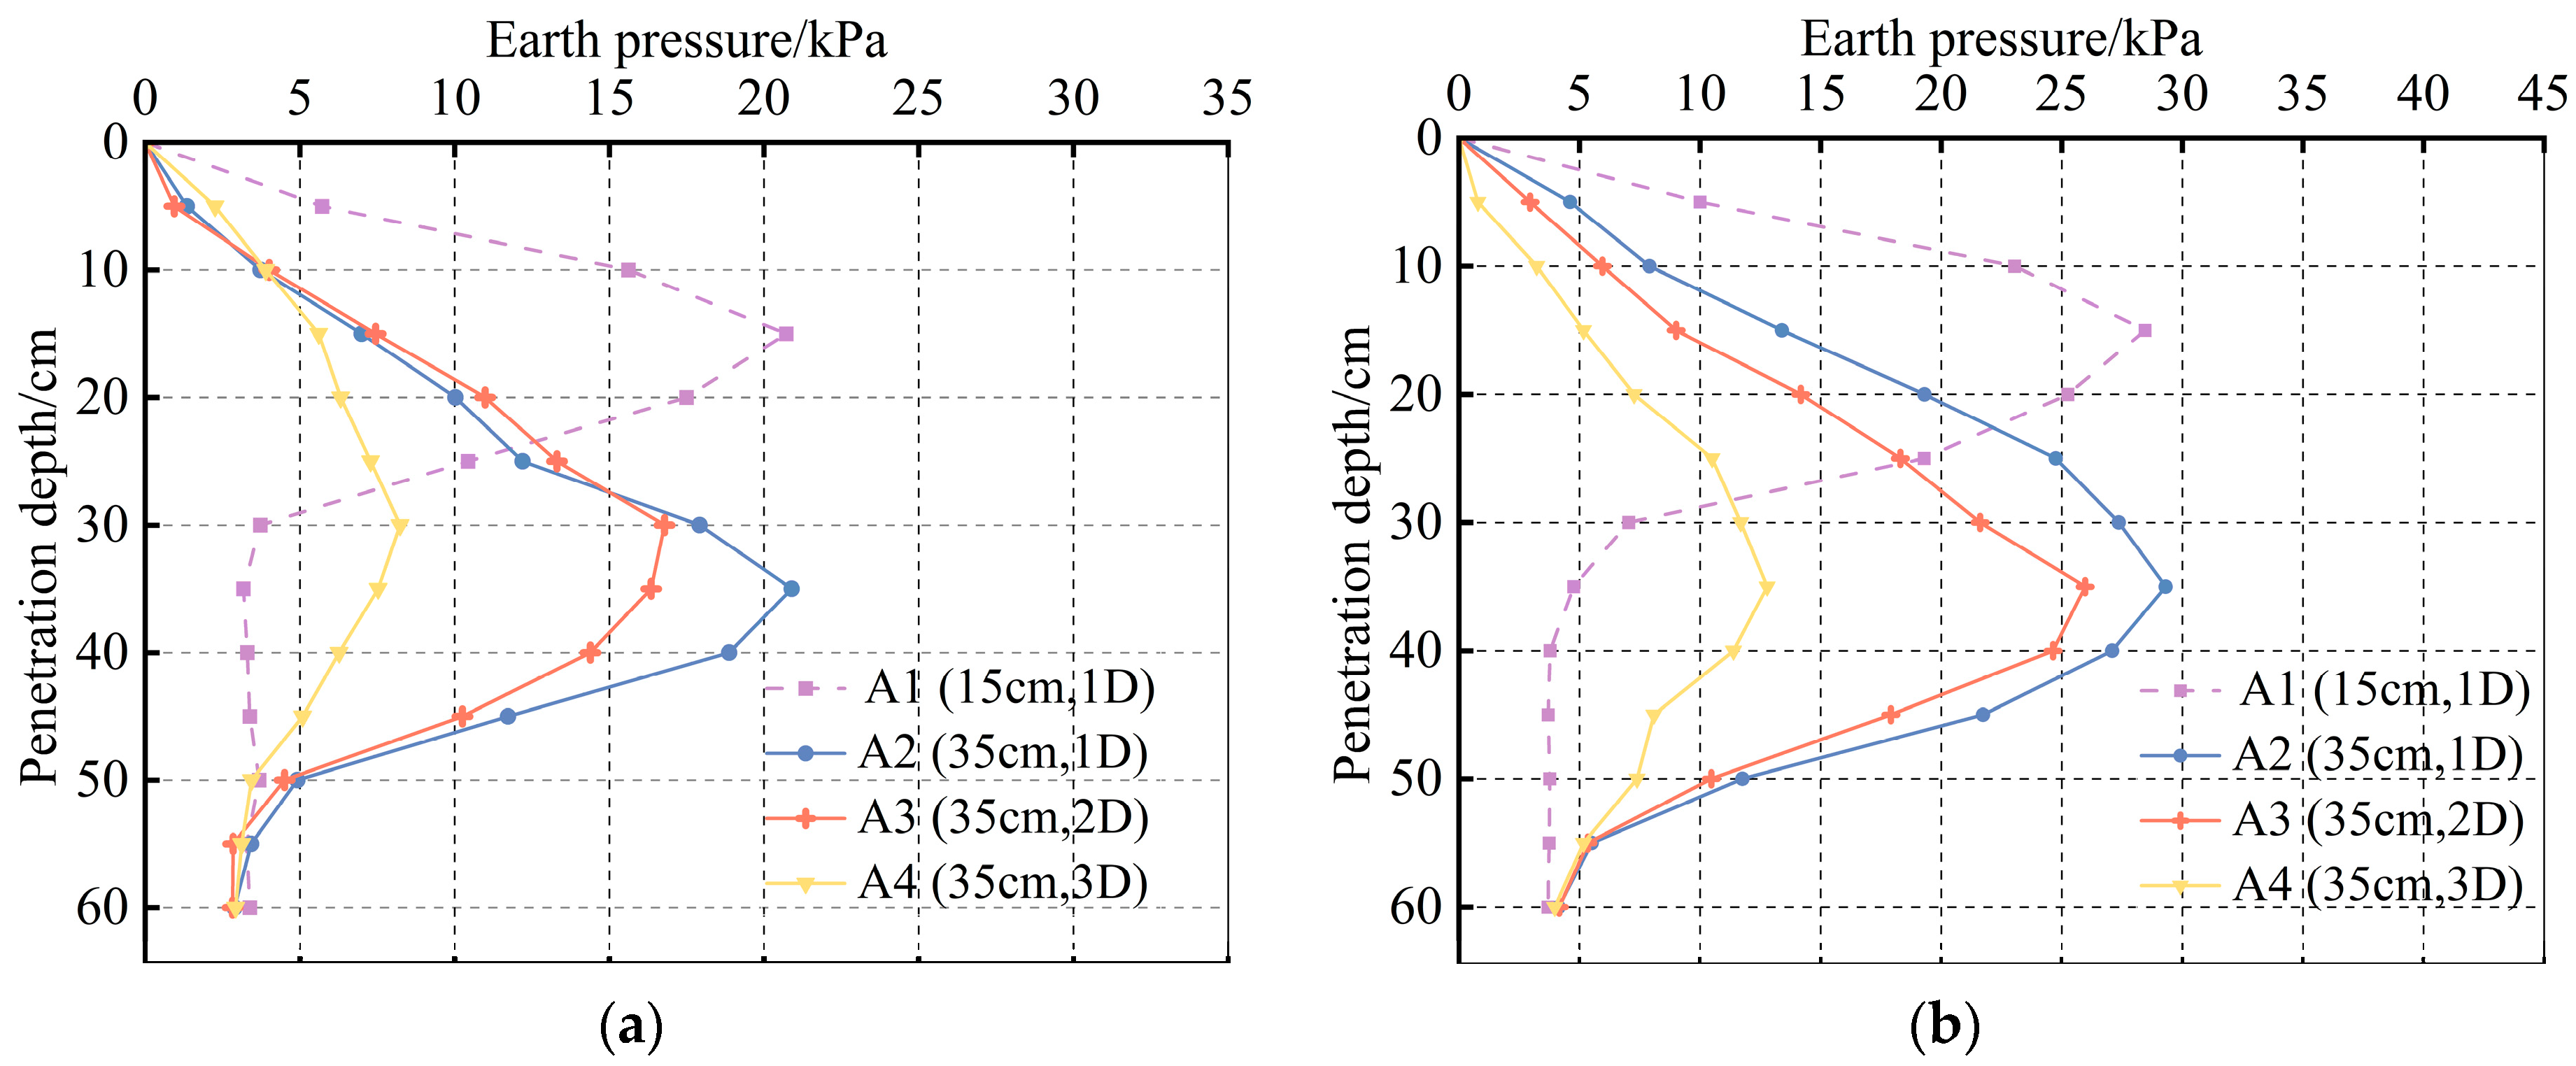
3.6. Soil Pressure around the Pile
4. Conclusions
- (1)
- The overall distribution law of the stress characteristics of the pile during the pile jacking process is basically the same. However, under the effect of the static press-in piling machine, the results are different from the conventional model test. When compared with the test that only considers the pile, the pile pressing force, the pile end resistance, and the total side friction resistance of the pile are relatively high. Additionally, the proportion of the total side friction resistance to the pile pressing force increases when the piling machine is considered.
- (2)
- The pile jacking resistance is also affected by the static press-in piling machine. Under the influence of the piling machine, the pile end resistance and the pile side resistance have been increased to varying degrees. Although it is uneven, the growth rate of the total side friction resistance is accelerated when the pile sinking depth is 20 to 30 cm.
- (3)
- The distribution trend of the axial force of the two piles is also basically the same. When considering the influence of the static press-in piling machine, the axial force of the pile exhibits an increasing trend in conjunction with its decreasing rate.
- (4)
- When analyzing the influence of the static press-in piling machine on the unit side friction resistance of the pile body, it is found that the resistance relatively increases when the piling machine is considered. However, the phenomenon of “side resistance degradation” decreases. The reduction in “side resistance degradation” is the greatest at a depth of 20 cm to 30 cm, and this reduction gradually diminishes with increasing soil depth.
- (5)
- The soil pressure around the pile generally increases first and then decreases. When the pile sinking depth reaches the buried depth of the soil pressure gauge, the soil pressure value is the largest. The farther away from the pile, the smaller the earth pressure, showing a linear decreasing trend. At the same time, the soil pressure around the pile also increases when the static press-in piling machine is considered.
- (6)
- According to the theory of “adhesion-plough” proposed from the perspective of tribology, it can effectively explain the reasons for the change in experimental data under the action of a static press-in piling machine compared to the static pressure single pile and provide a theoretical basis for the test data.
Author Contributions
Funding
Institutional Review Board Statement
Informed Consent Statement
Data Availability Statement
Conflicts of Interest
References
- Zhang, L.M.; Wang, H. Field study of construction effects in jacked and driven steel H-piles. Géotechnique 2009, 59, 63–69. [Google Scholar] [CrossRef]
- Yang, J.; Tham, L.G.; Lee, P.K.K.; Chan, S.T.; Yu, F. Behaviour of jacked and driven piles in sandy soil. Géotechnique 2006, 56, 245–259. [Google Scholar] [CrossRef]
- Wang, Z.; Miao, L.; Wang, F. Theoretical and numerical analysis of jacked pile in sand. In Proceedings of the 2012 GeoCongress, State of the Art and Practice in Geotechnical Engineering, Oakland, CA, USA, 25–29 March 2012; pp. 245–254. [Google Scholar]
- Goncharov, B.V.; Karev, V.M.; Troyanovskii, Y.V. Results of comparative tests of mobile machines for driving piles. Soil Mech. Found. Eng. 1964, 1, 36–39. [Google Scholar] [CrossRef]
- Eskişar, T.; Akboğa Kale, Ö. Evaluation of pile driving accidents in geotechnical engineering. Int. J. Occup. Saf. Ergon. 2022, 28, 625–634. [Google Scholar] [CrossRef] [PubMed]
- Doherty, P.; Gavin, K. Shaft capacity of open-ended piles in clay. J. Geotech. Geoenviron. Eng. 2011, 137, 1090–1102. [Google Scholar] [CrossRef]
- Kou, H.L.; Yu, F.; Liu, T. Strain monitoring on PHC pipe piles based on fiber bragg grating sensors. J. Perform. Constr. Facil. 2019, 33, 04019003. [Google Scholar] [CrossRef]
- Wang, Y.; Sang, S.; Zhang, M.; Liu, X.; Yang, S. Field test of earth pressure at pile-soil interface by single pile penetration in silty soil and silty clay. Soil Dyn. Earthq. Eng. 2021, 145, 106666. [Google Scholar] [CrossRef]
- Wang, Y.; Sang, S.; Zhang, M.; Bai, X.; Su, L. Investigation on in-situ test of penetration characteristics of open and closed PHC pipe piles. Soils Found. 2021, 61, 960–973. [Google Scholar] [CrossRef]
- Paik, K.; Salgado, R.; Lee, J.; Kim, B. Behavior of open-and closed-ended piles driven into sands. J. Geotech. Geoenviron. Eng. 2003, 129, 296–306. [Google Scholar] [CrossRef]
- Ding, X.; Shi, Y.; Chen, R.; Zhou, M. Friction anlysis of large diameter steel cylinder penetration process using 3D-DEM. Granul. Matter 2021, 23, 24. [Google Scholar] [CrossRef]
- Jin, Y.F.; Yin, Z.Y.; Wu, Z.X.; Daouadji, A. Numerical modeling of pile penetration in silica sands considering the effect of grain breakage. Finite Elem. Anal. Des. 2018, 144, 15–29. [Google Scholar] [CrossRef]
- Zhou, J.; Jian, Q.W.; Zhang, J.; Guo, J.J. Coupled 3D discrete-continuum numerical modeling of pile penetration in sand. J. Zhejiang Univ. Sci. A 2012, 13, 44–55. [Google Scholar] [CrossRef]
- Zhang, M.Y.; Deng, A.F.; Gan, T.J. Displacement penetration method used for numerical simulation to jacked pile. Rock Soil Mech. 2003, 24, 113–117. [Google Scholar]
- Abendroth, R.E.; Greimann, L.F. Pile behavior established from model tests. J. Geotech. Eng. 1990, 116, 571–587. [Google Scholar] [CrossRef]
- Altaee, A.; Fellenius, B.H.; Evgin, E. Load transfer for piles in sand and the critical depth. Can. Geotech. J. 1993, 30, 455–463. [Google Scholar] [CrossRef]
- Lehane, B.M.; Gavin, K.G. Base resistance of jacked pipe piles in sand. J. Geotech. Geoenviron. Eng. 2001, 127, 473–480. [Google Scholar] [CrossRef]
- Gong, W.; Li, J.; Li, L.; Zhang, S. Evolution of mechanical properties of soils subsequent to a pile jacked in natural saturated clays. Ocean Eng. 2017, 136, 209–217. [Google Scholar] [CrossRef]
- Zhang, Y.; Wang, Y.; Liu, X.; Sang, S. Research of jacked pile penetration test based on airbag loading. Soil Dyn. Earthq. Eng. 2023, 164, 107407. [Google Scholar] [CrossRef]
- Wang, Y.Y.; Sang, S.K.; Zhang, M.Y.; Jeng, D.S.; Yuan, B.X.; Chen, Z.X. Laboratory study on pile jacking resistance of jacked pile. Soil Dyn. Earthq. Eng. 2022, 154, 107070. [Google Scholar] [CrossRef]
- Wang, Y.; Sang, S.; Liu, X.; Huang, Y.; Zhang, M.; Miao, D. Model test of jacked pile penetration process considering influence of pile diameter. Front. Phys. 2021, 9, 616410. [Google Scholar] [CrossRef]
- Wang, Y.; Wang, X.; Li, S.; Wang, J.; Zhang, C.; Li, Y. Field testing study on jacked pile penetration characteristics in laminated clay based on FBG sensing technology. Soil Dyn. Earthq. Eng. 2023, 168, 107848. [Google Scholar] [CrossRef]
- Lu, Q.; Gong, X.; Ma, M. Squeezing effects of jacked pile considering static pile press machine’s action. J. Zhejiang Univ. Eng. Sci. 2007, 41, 1132. [Google Scholar]
- Wang, H.; Wei, D.D. Numerical simulation research of the effect of squeezing soil due to pile driven in soft clay restrained on surface. Rock Soil Mech. 2002, 23, 107–110. [Google Scholar]
- Toma, S.; Seto, K.; Chen, W.F. Comparisons of Static and Dynamic Analyses on Toppling Behaviors of Pile Driving Machinery, etc., on Soft Foundation. Arch. Adv. Eng. Sci. 2023, 1–15. [Google Scholar] [CrossRef]
- GB/T 50123-2019; Geotechnical Test Method Standards. People’s Republic of China Industry Standards Writing Group: Beijing, China, 2019.
- Hu, Y.Q.; Tang, L.S.; Li, Z.Y. Mechanism of sliding friction at pile-soil interface of jacked pile. Rock Soil Mech. 2015, 36, 1288–1294. [Google Scholar]
- Komvopoulos, K.; Saka, N.; Suh, N.P. The mechanism of friction in boundary lubrication. J. Tribol. 1985, 107, 452–462. [Google Scholar] [CrossRef]
- Zeng, Z.; Wang, L.; Chen, L.; Zhang, J. The correlation between the hardness and tribological behaviour of electroplated chromium coatings sliding against ceramic and steel counterparts. Surf. Coat. Technol. 2006, 201, 2282–2288. [Google Scholar] [CrossRef]
- Gavin, K.G.; Lehane, B.M. The shaft capacity of pipe piles in sand. Can. Geotech. J. 2003, 40, 36–45. [Google Scholar] [CrossRef]


| Test Number | Pile Length (mm) | Pile Diameter (mm) | Pile Driving Speed (mm/s) | Longitudinal Spacing between Long Leaders (mm) | Vertical Load of the Static Press-in Piling Machine (kPa) |
|---|---|---|---|---|---|
| PS 1 | 600 | 100 | 1 | ||
| PS 2 | 600 | 100 | 1 | 600 | 45 |
| Density ρ (kg/m3) | Severe Γ (kN/m3) | Moisture Content W (%) | Liquid Limit wL (%) | Plastic Limit wp (%) | Cohesion c (kPa) | Internal Friction Angle φ (°) | Compression Modulus Es1–2 (MPa) |
|---|---|---|---|---|---|---|---|
| 1730 | 16.84 | 35 | 34.8 | 21.2 | 14.4 | 8.6 | 2.54 |
| Test Number | Pile Jacking Pressure (kN) | Pile End Resistance (kN) | Percentage (%) | Pile Side Resistance (kN) | Percentage (%) |
|---|---|---|---|---|---|
| PS1 | 1.787 | 1.192 | 66.7 | 0.595 | 33.3 |
| PS2 | 2.126 | 1.411 | 66.3 | 0.715 | 33.7 |
| Test Number | Pile Penetration Depth (cm) | Pile Head Axial Force (kN) | Pile End Axial Force (kN) | Axial Force Decline Rate (%) |
|---|---|---|---|---|
| PS1 | 60 | 1.79 | 1.19 | 34 |
| PS2 | 60 | 2.13 | 1.36 | 36 |
Disclaimer/Publisher’s Note: The statements, opinions and data contained in all publications are solely those of the individual author(s) and contributor(s) and not of MDPI and/or the editor(s). MDPI and/or the editor(s) disclaim responsibility for any injury to people or property resulting from any ideas, methods, instructions or products referred to in the content. |
© 2024 by the authors. Licensee MDPI, Basel, Switzerland. This article is an open access article distributed under the terms and conditions of the Creative Commons Attribution (CC BY) license (https://creativecommons.org/licenses/by/4.0/).
Share and Cite
Li, Y.; Zheng, R.; Deng, Y. Model Tests on Jacked Pile Penetration Characteristics Considering a Static Press-in Piling Machine. Appl. Sci. 2024, 14, 1985. https://doi.org/10.3390/app14051985
Li Y, Zheng R, Deng Y. Model Tests on Jacked Pile Penetration Characteristics Considering a Static Press-in Piling Machine. Applied Sciences. 2024; 14(5):1985. https://doi.org/10.3390/app14051985
Chicago/Turabian StyleLi, Yinan, Rongyue Zheng, and Yuebao Deng. 2024. "Model Tests on Jacked Pile Penetration Characteristics Considering a Static Press-in Piling Machine" Applied Sciences 14, no. 5: 1985. https://doi.org/10.3390/app14051985
APA StyleLi, Y., Zheng, R., & Deng, Y. (2024). Model Tests on Jacked Pile Penetration Characteristics Considering a Static Press-in Piling Machine. Applied Sciences, 14(5), 1985. https://doi.org/10.3390/app14051985