
Multi-Dimensional Extraction of Ice Shape and an Investigation of Its Aerodynamic Characteristics on Iced Wind Turbine Blades
Abstract
:1. Introduction
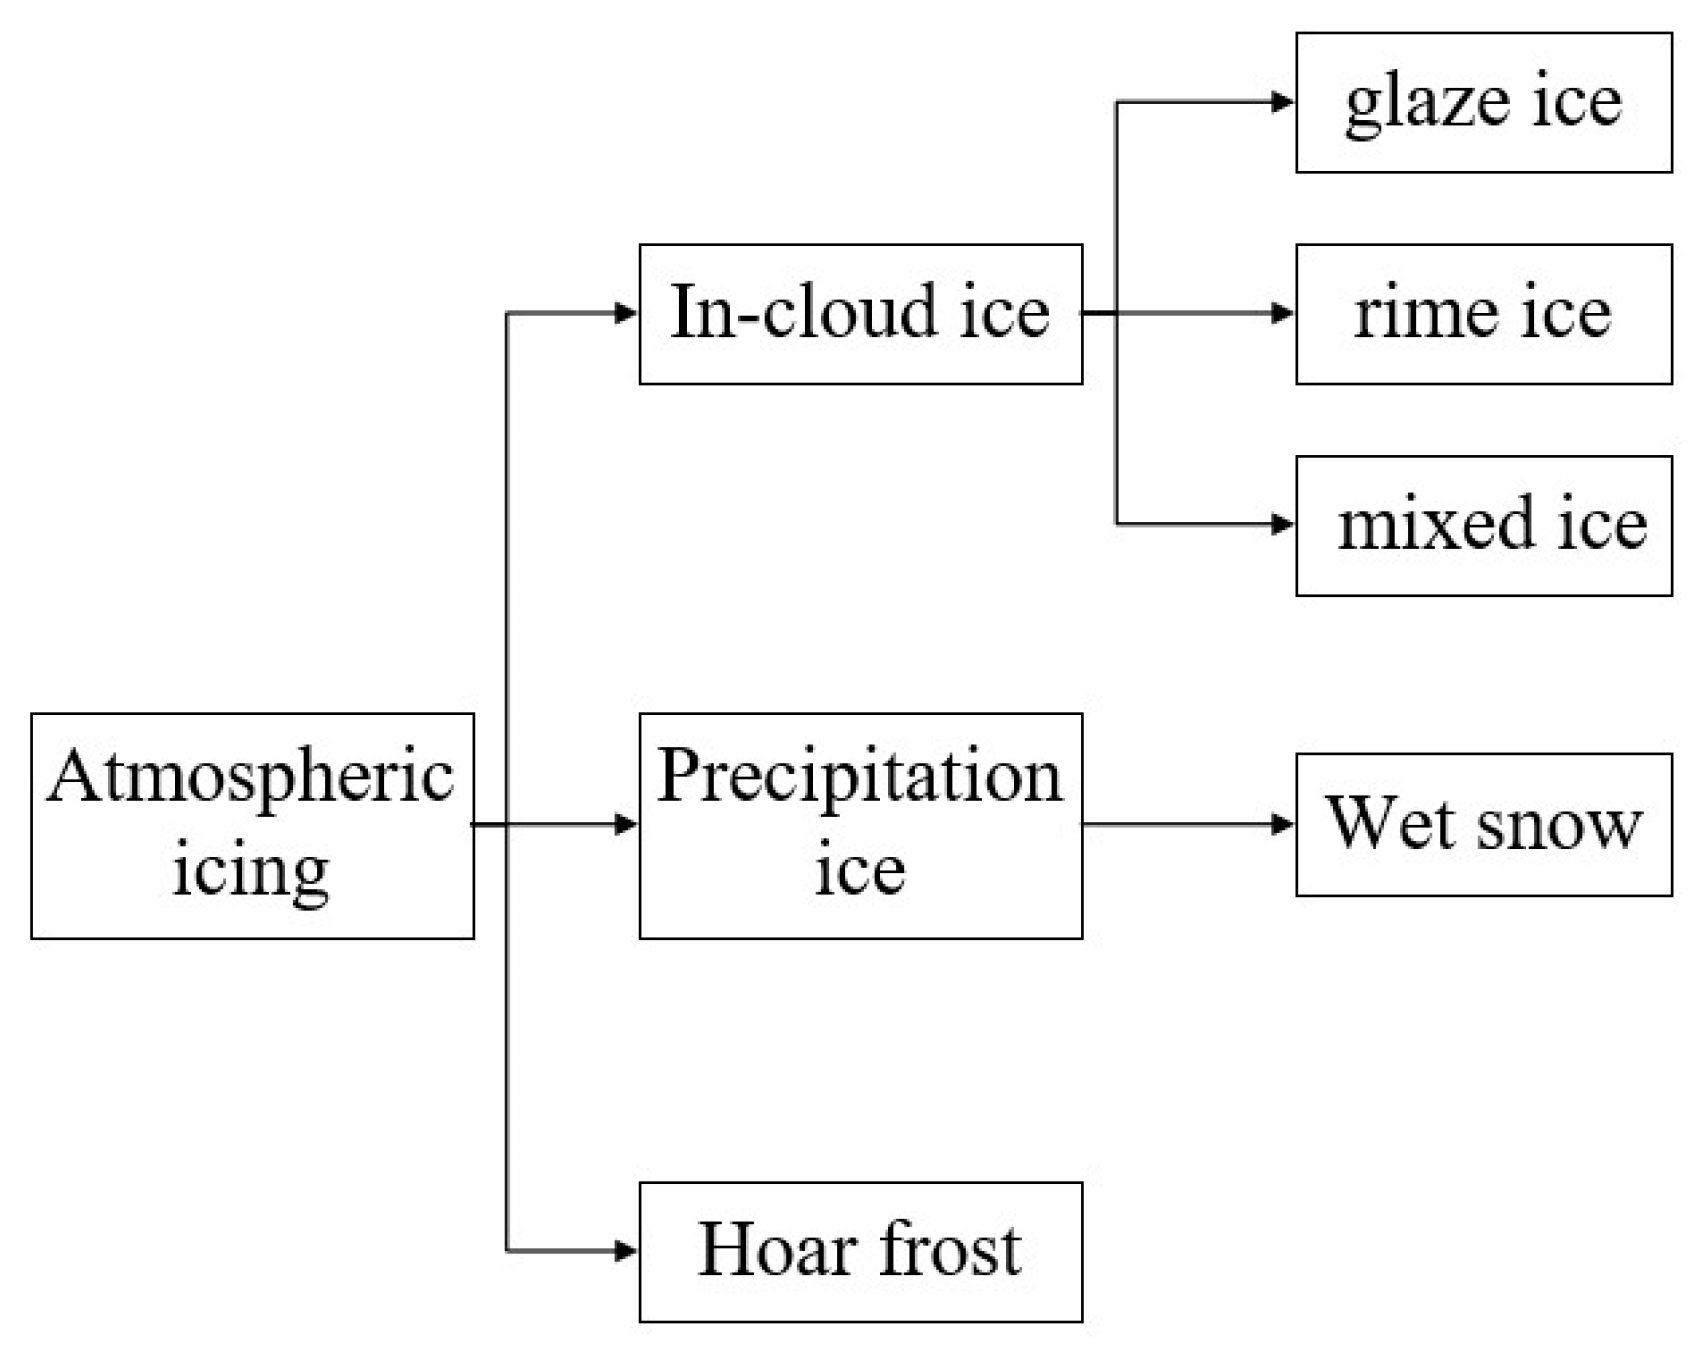
2. Icing Theory
Wind Turbine Icing Types
3. Icing Experiment Device and Three-Dimensional Scanning of Blade
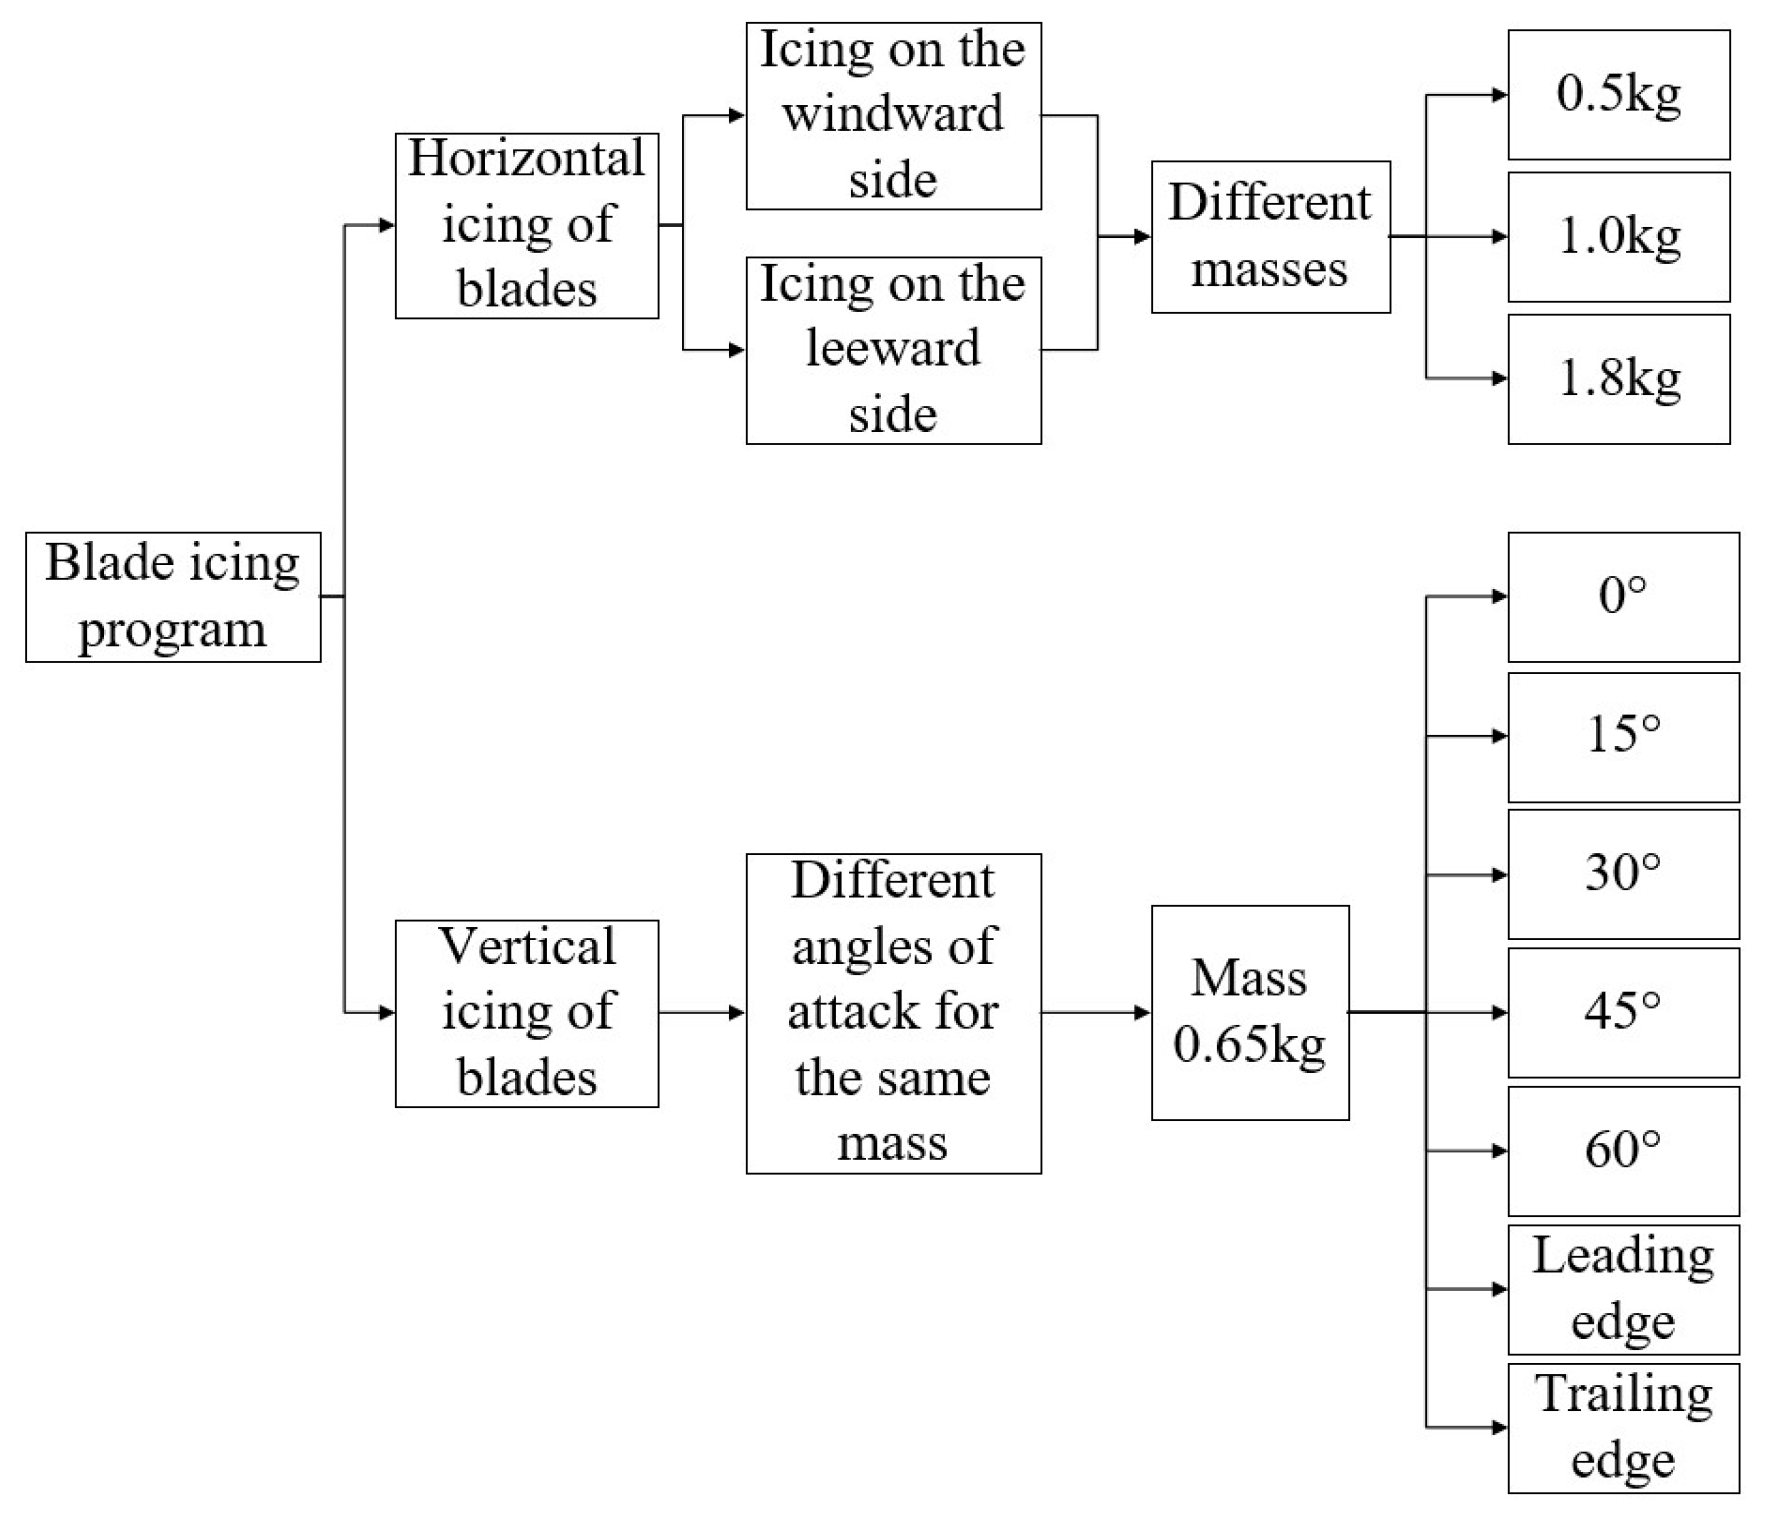
3.1. Blade Icing Test
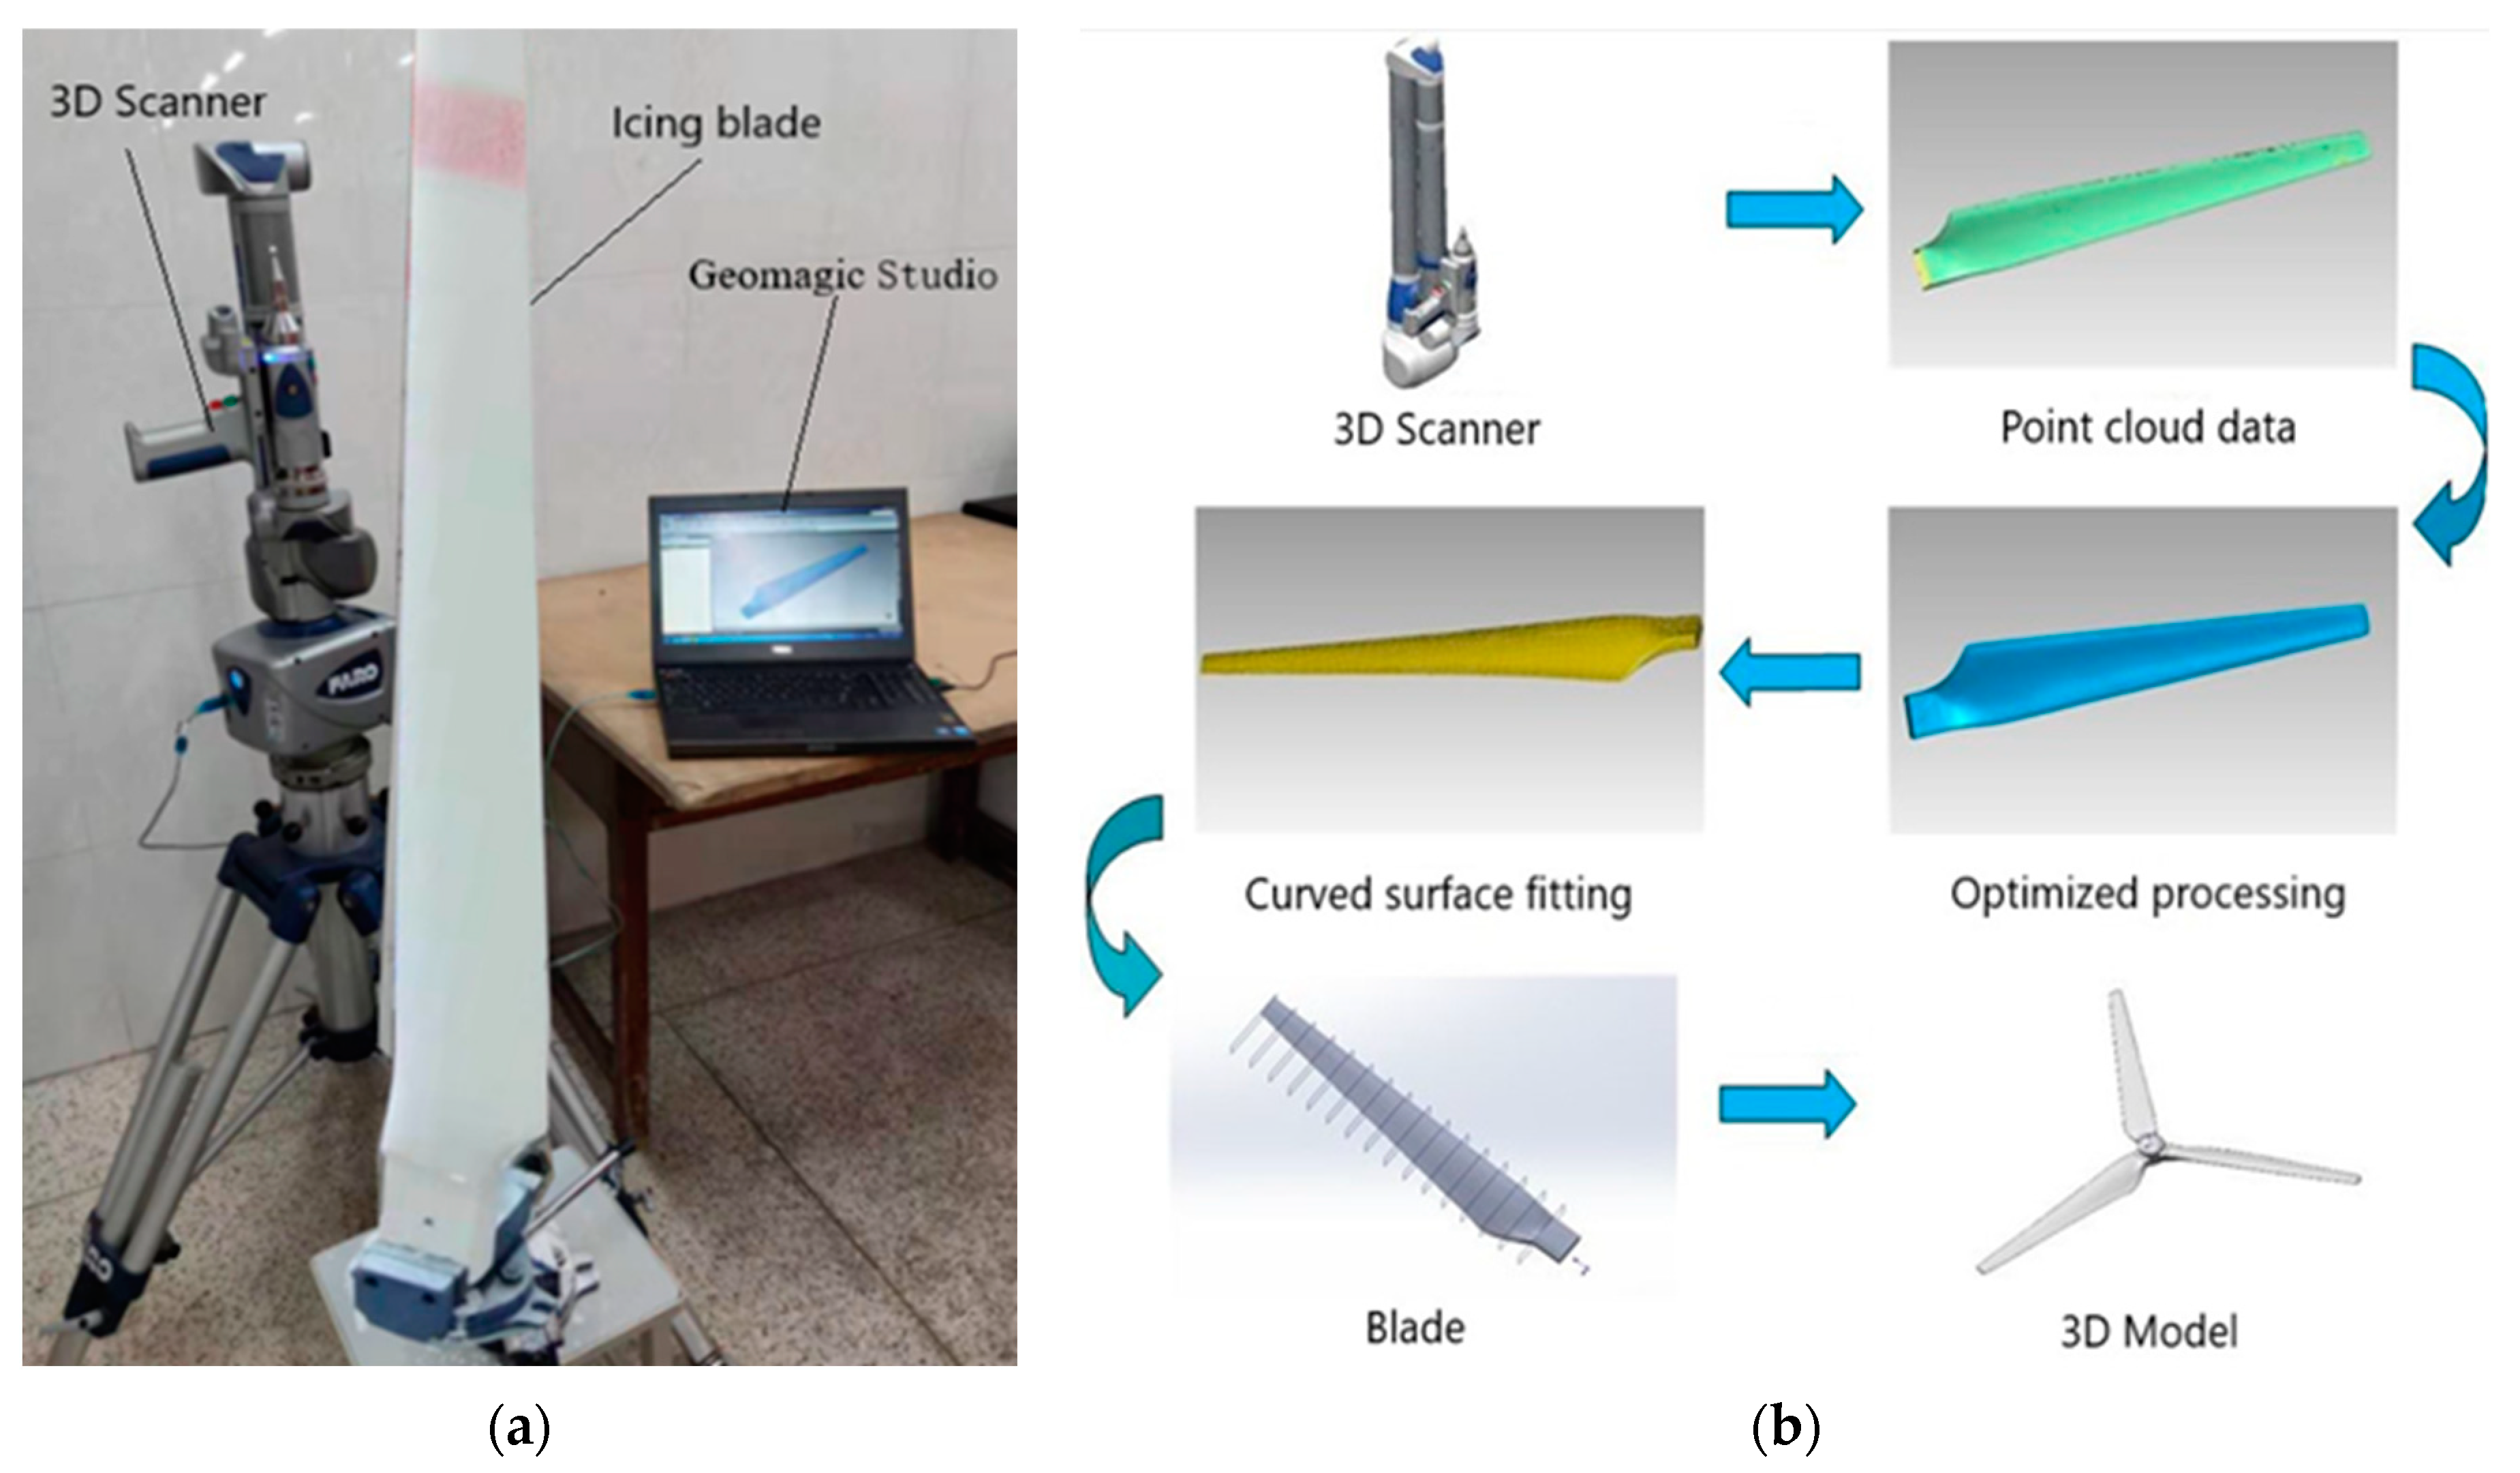
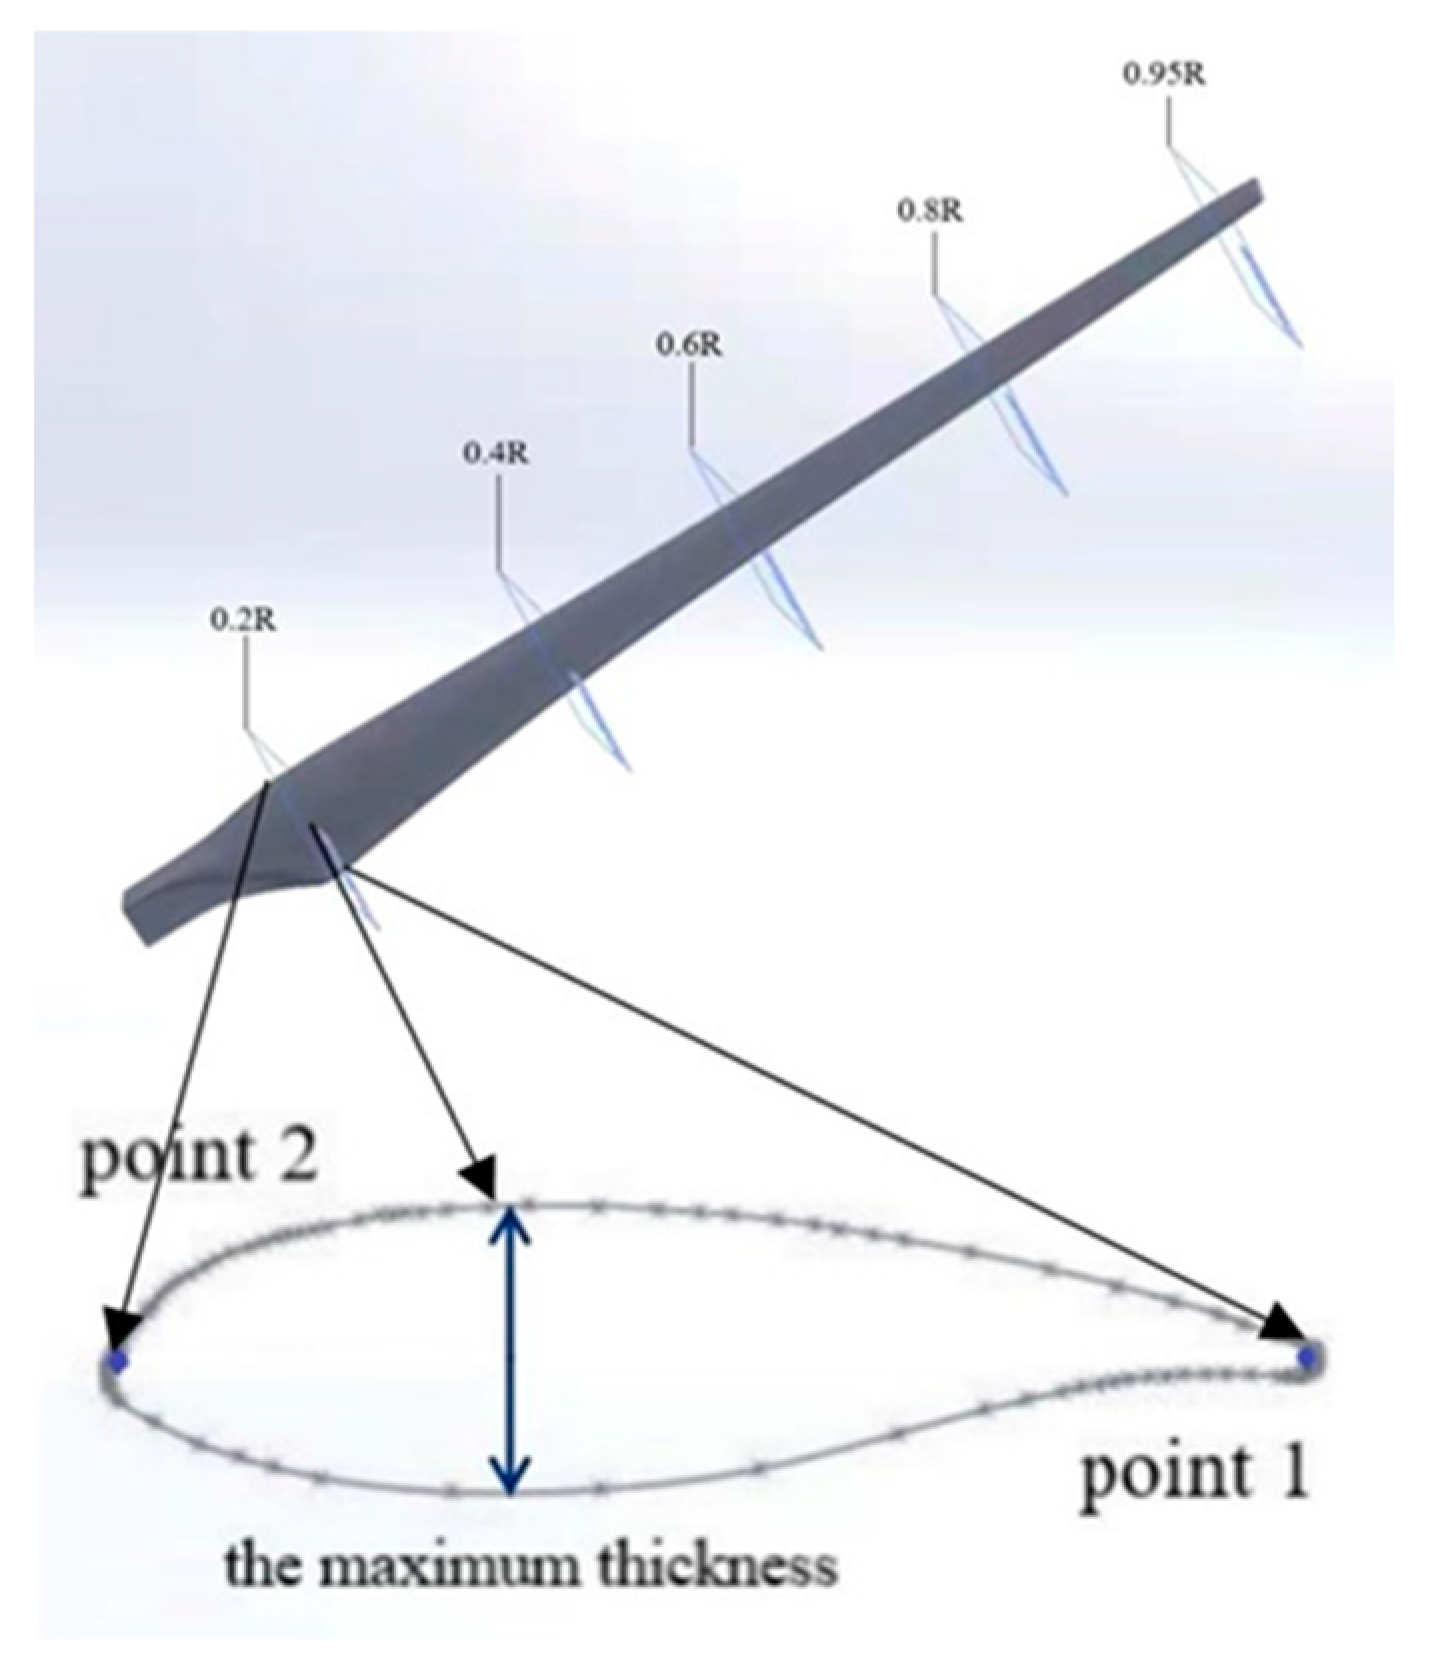
3.2. The 3D Scanning of Icing Blades
The 3D Scanning Test
4. Results and Discussion
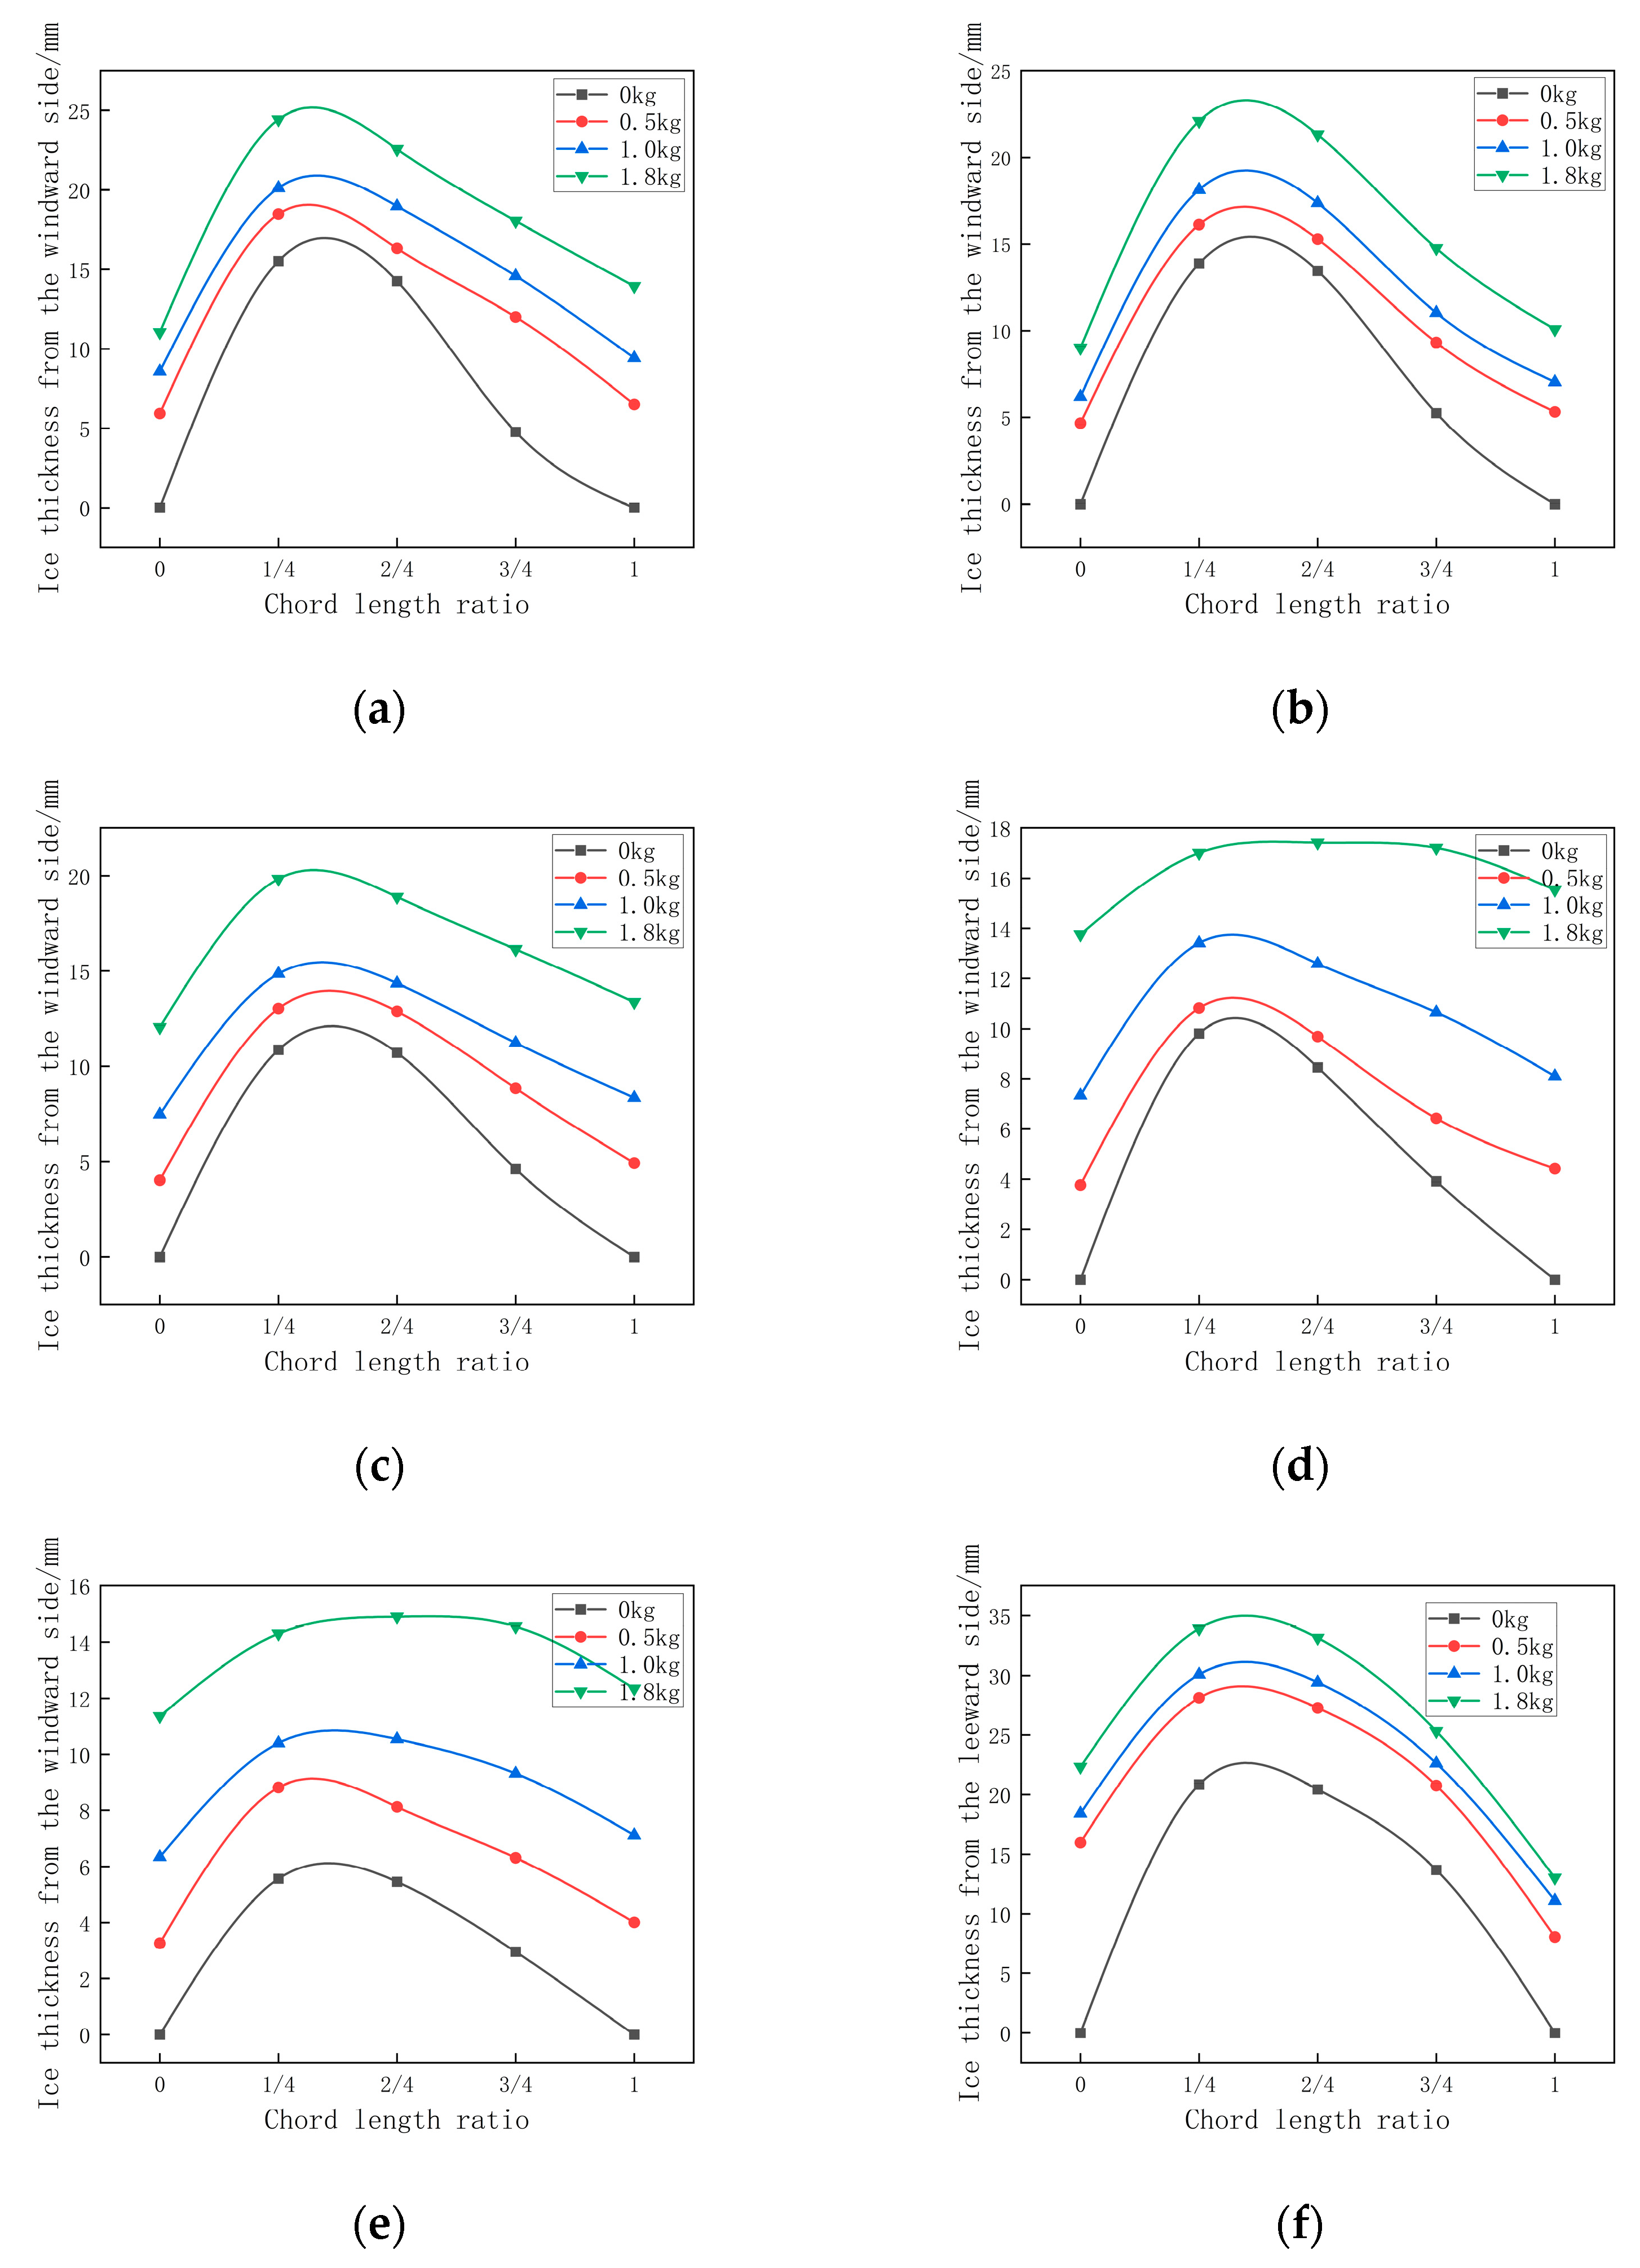
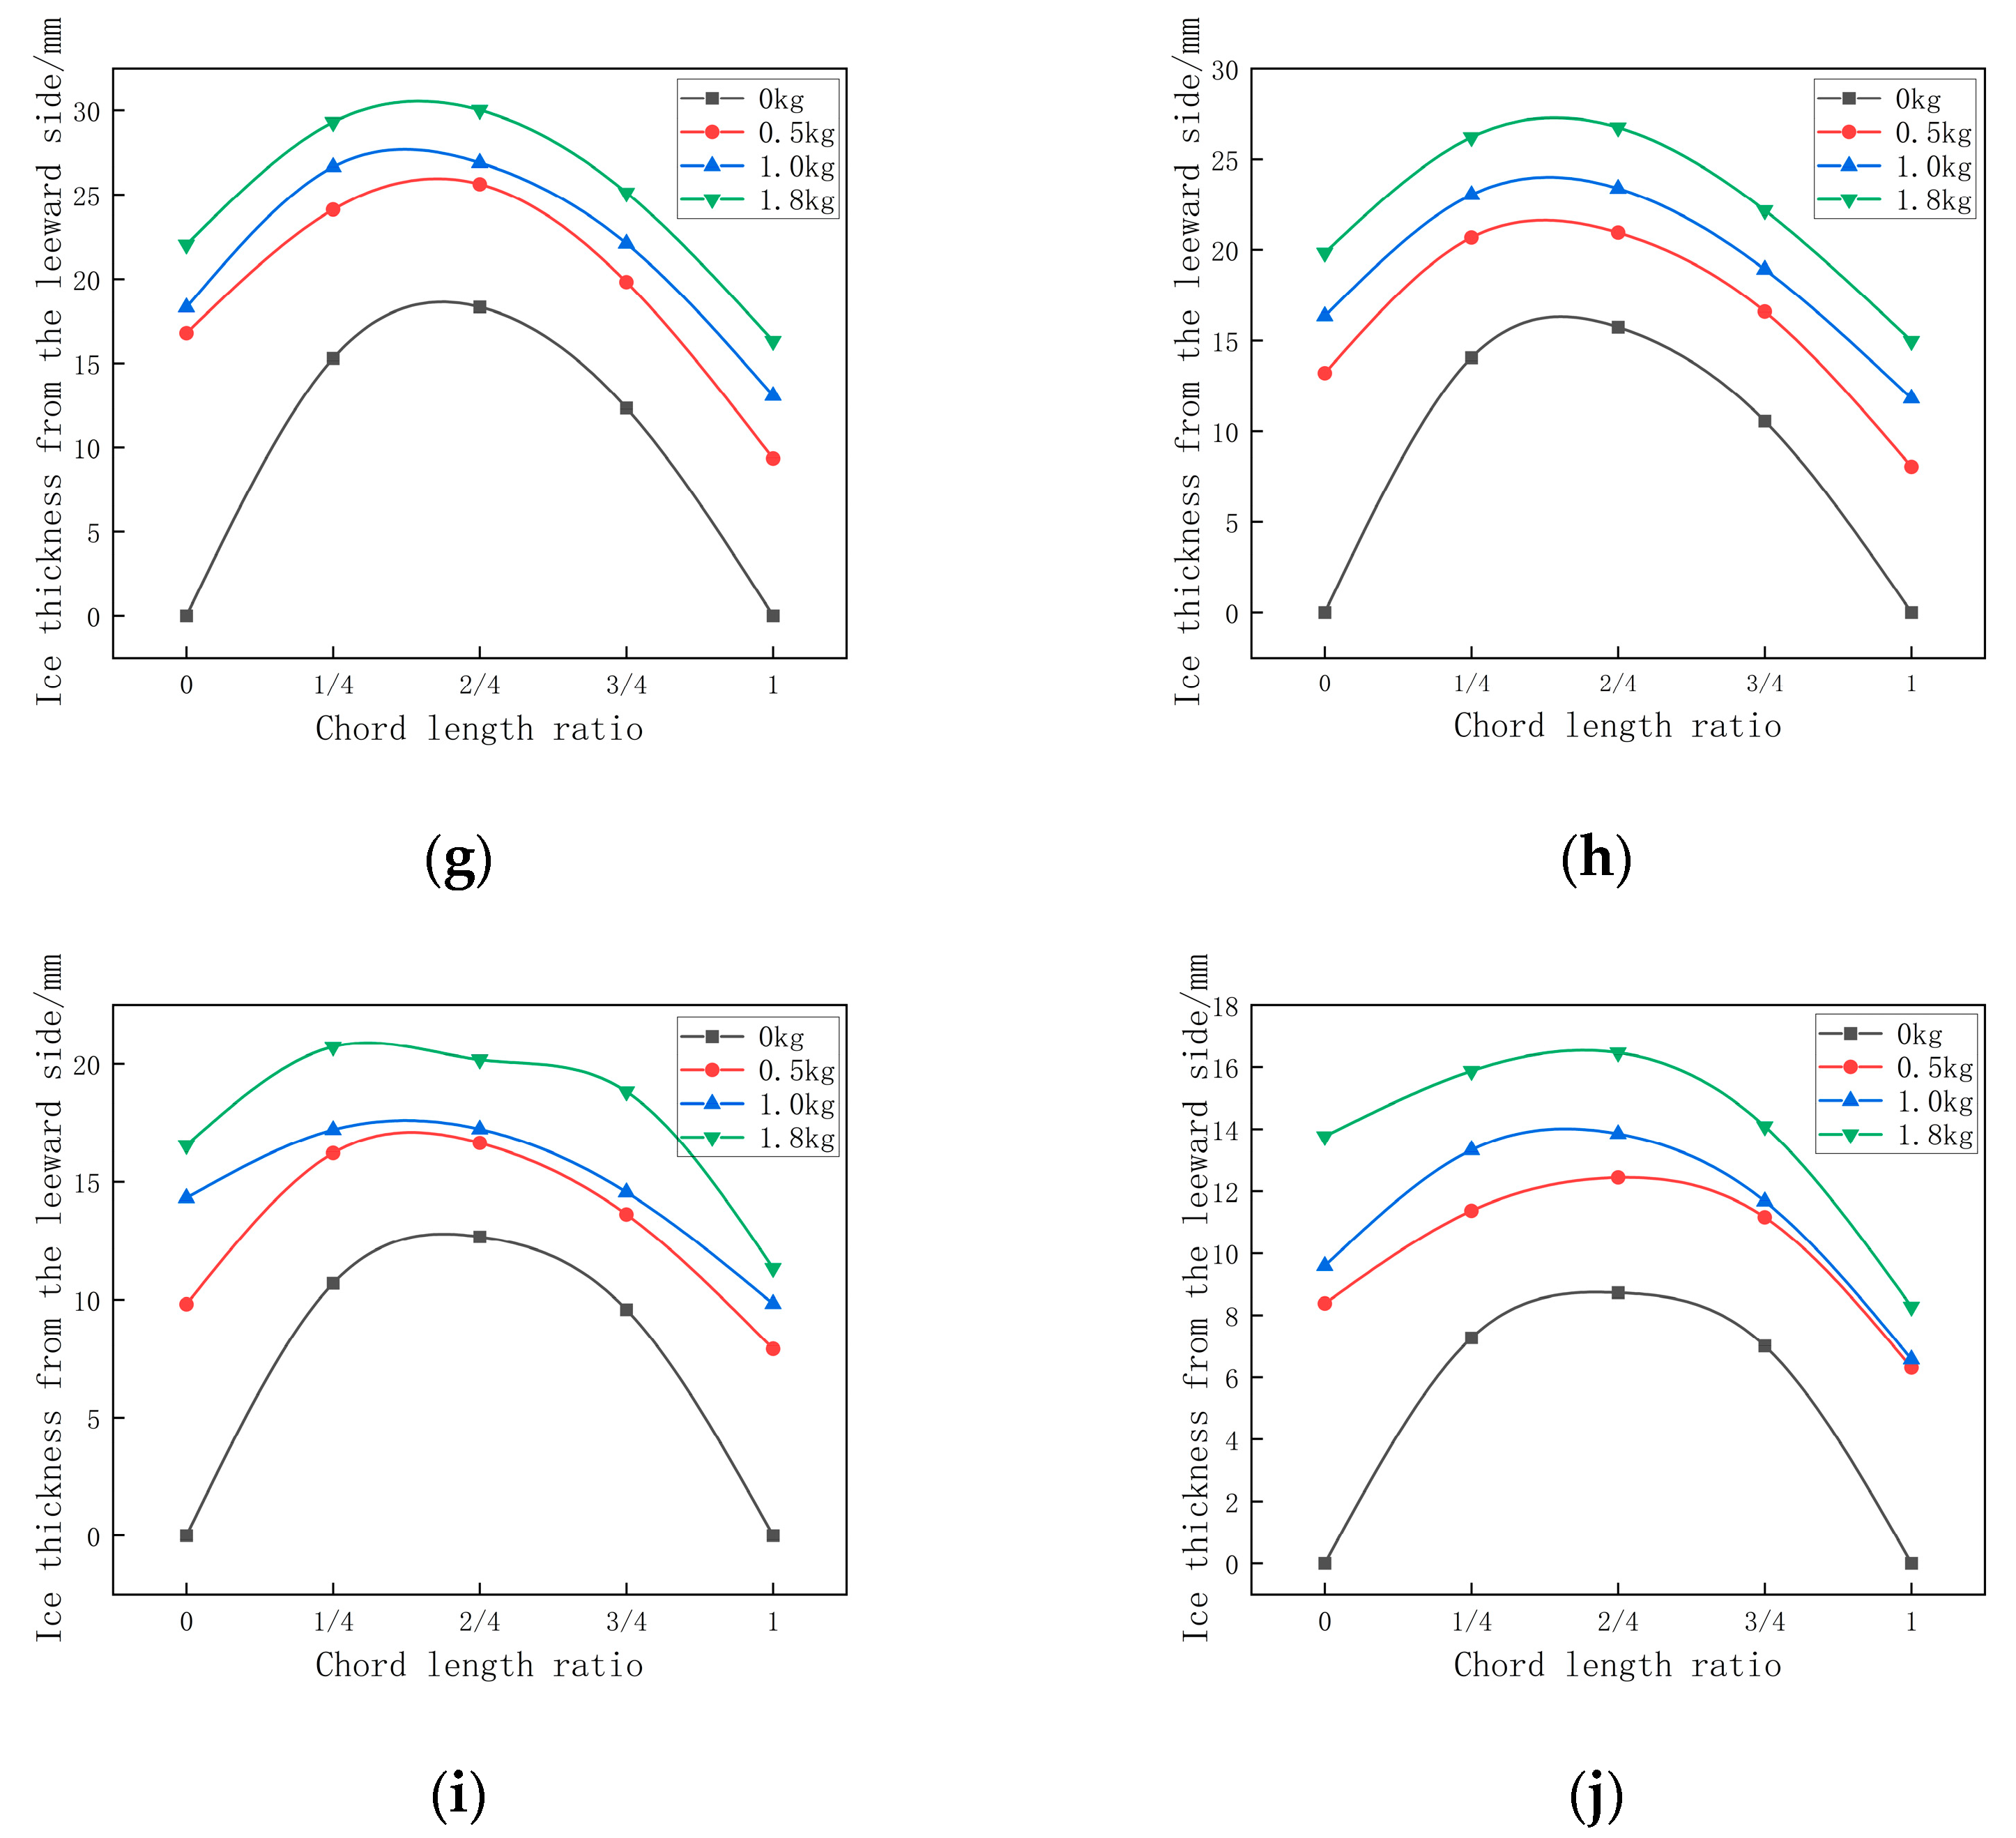
4.1. Icing Blade Airfoil Thickness Change
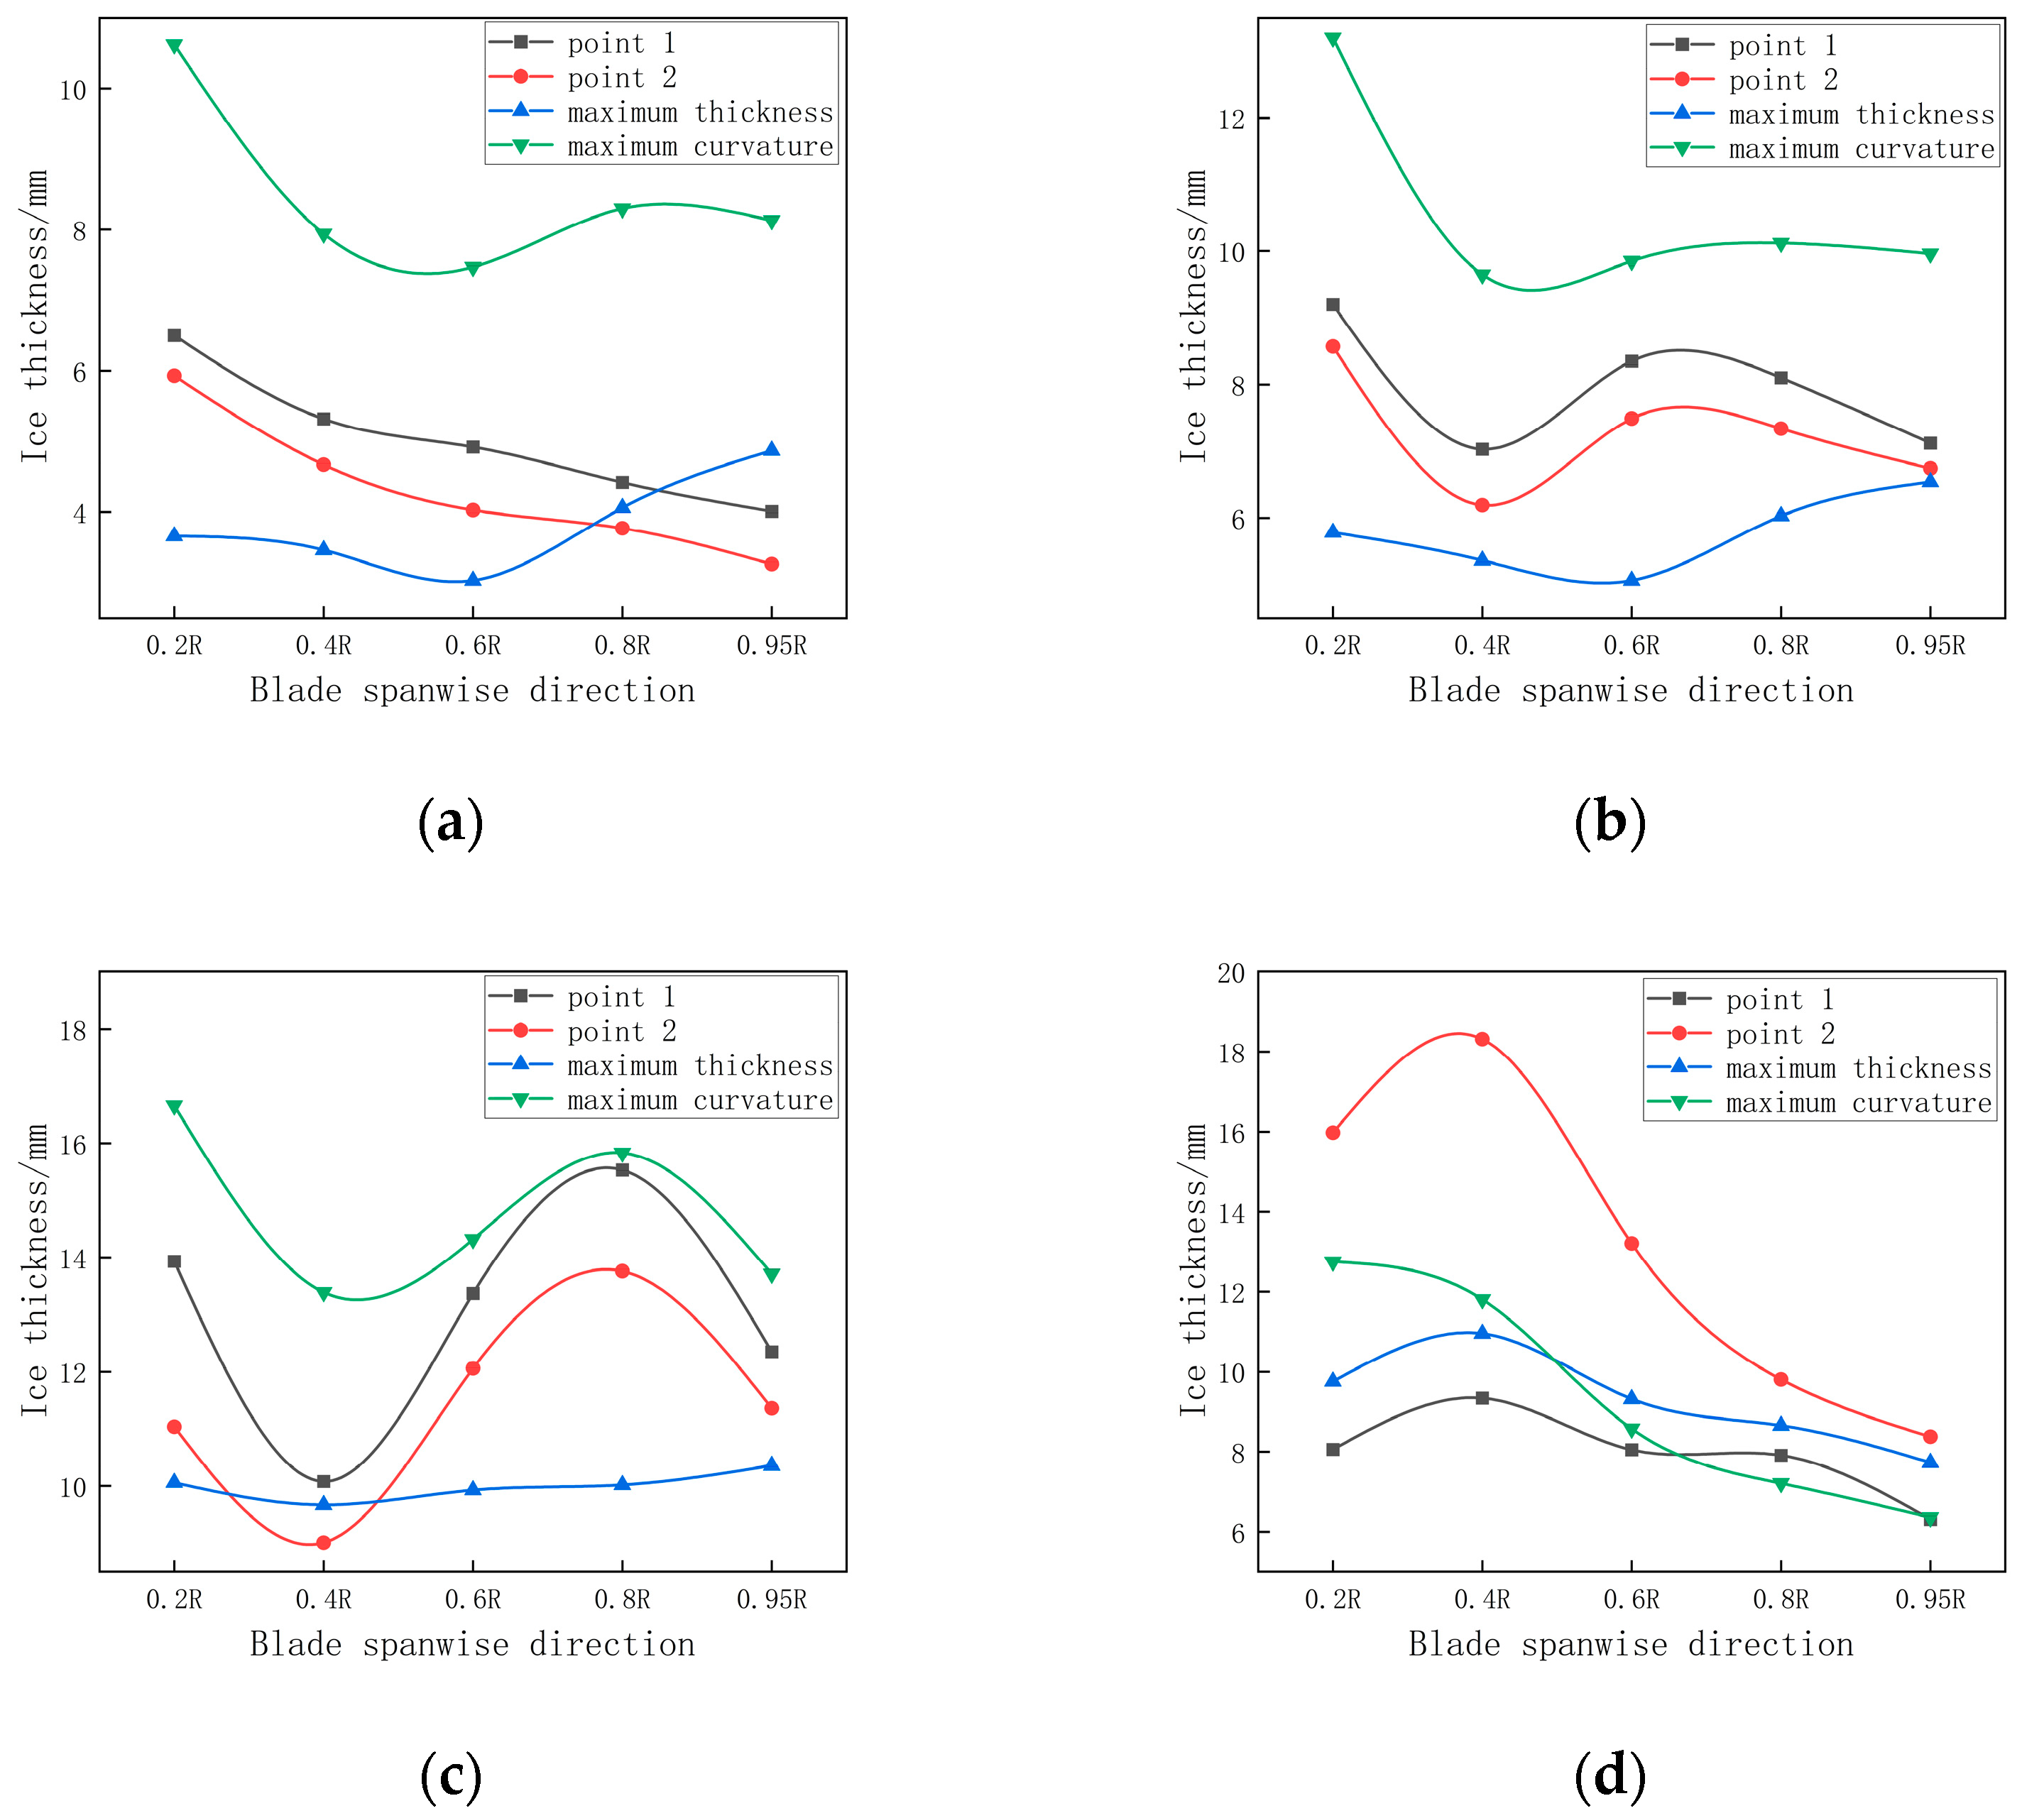
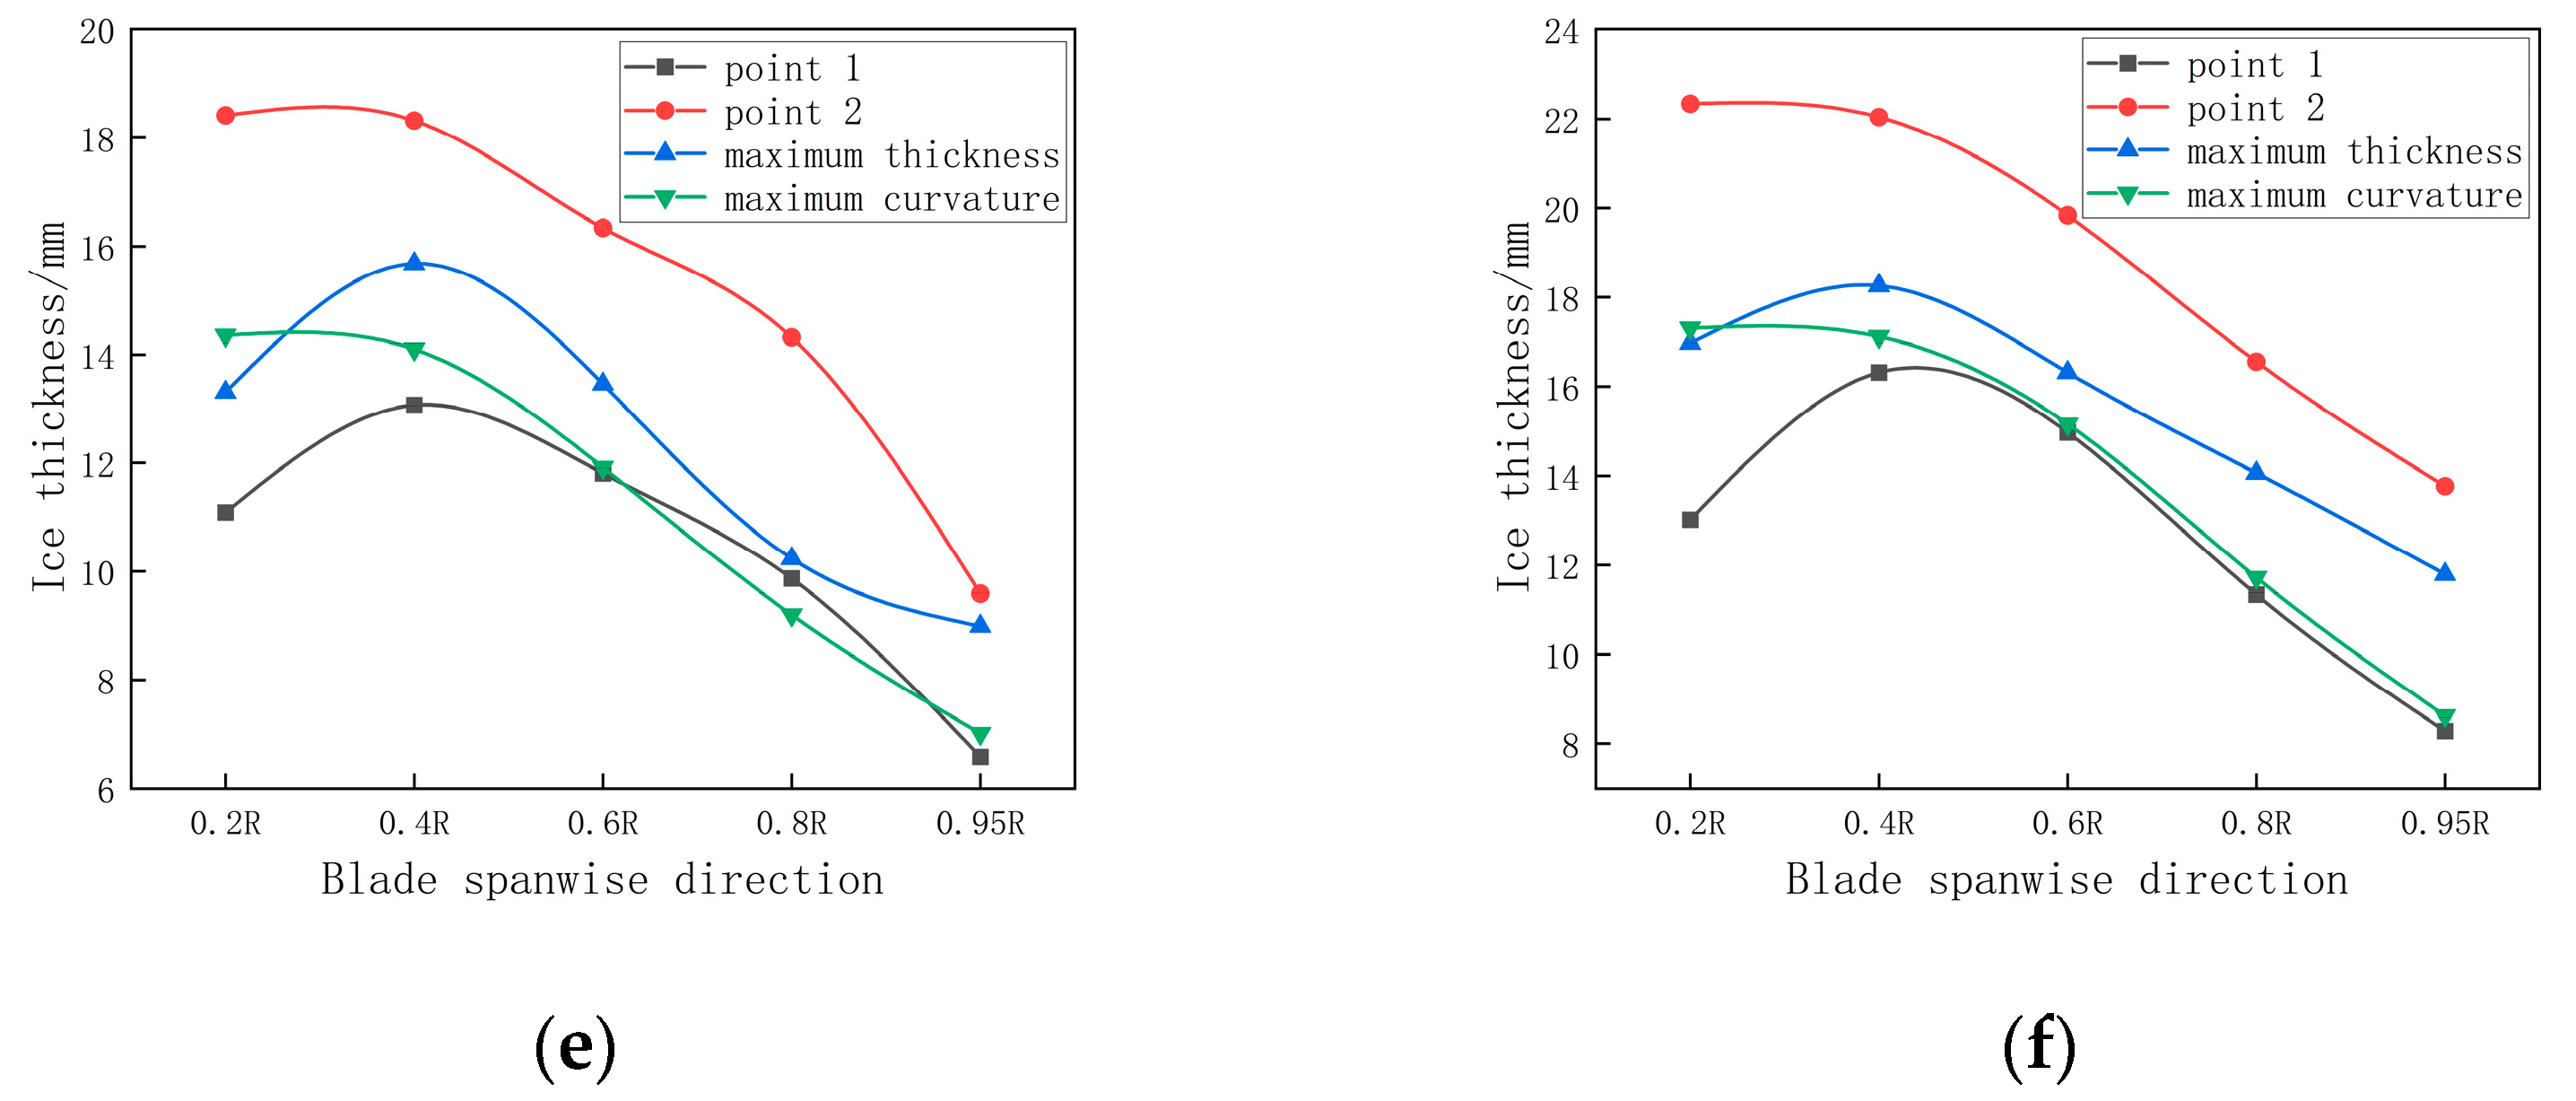
4.2. Ice Thickness Analysis along the Blade Spanwise Direction
5. Numerical Simulation Study of the Iced Wind Turbine Flow Field
5.1. Calculation Settings
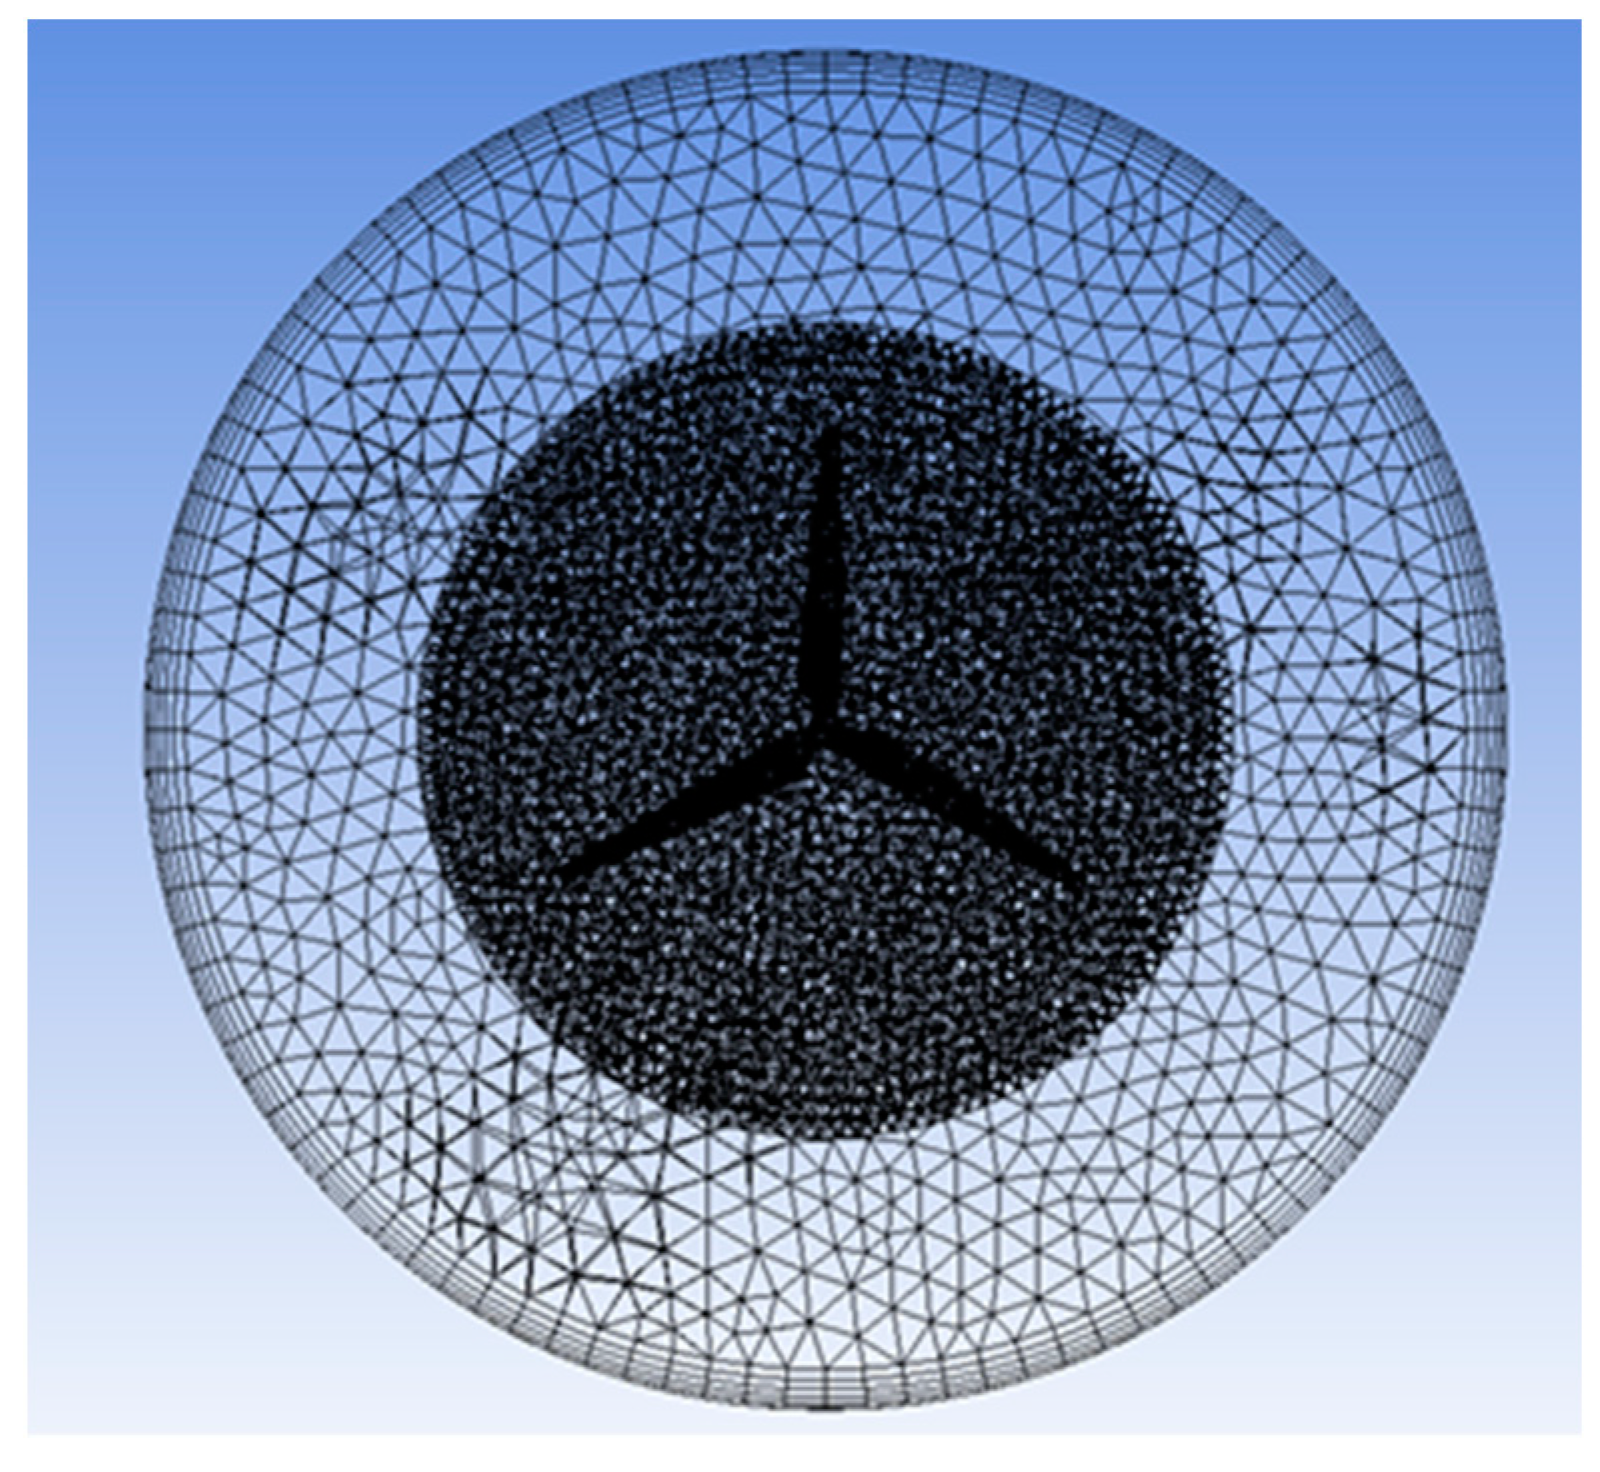
5.1.1. Numerical Model and Grid
5.1.2. Simulation Solution
5.2. Analysis of Results
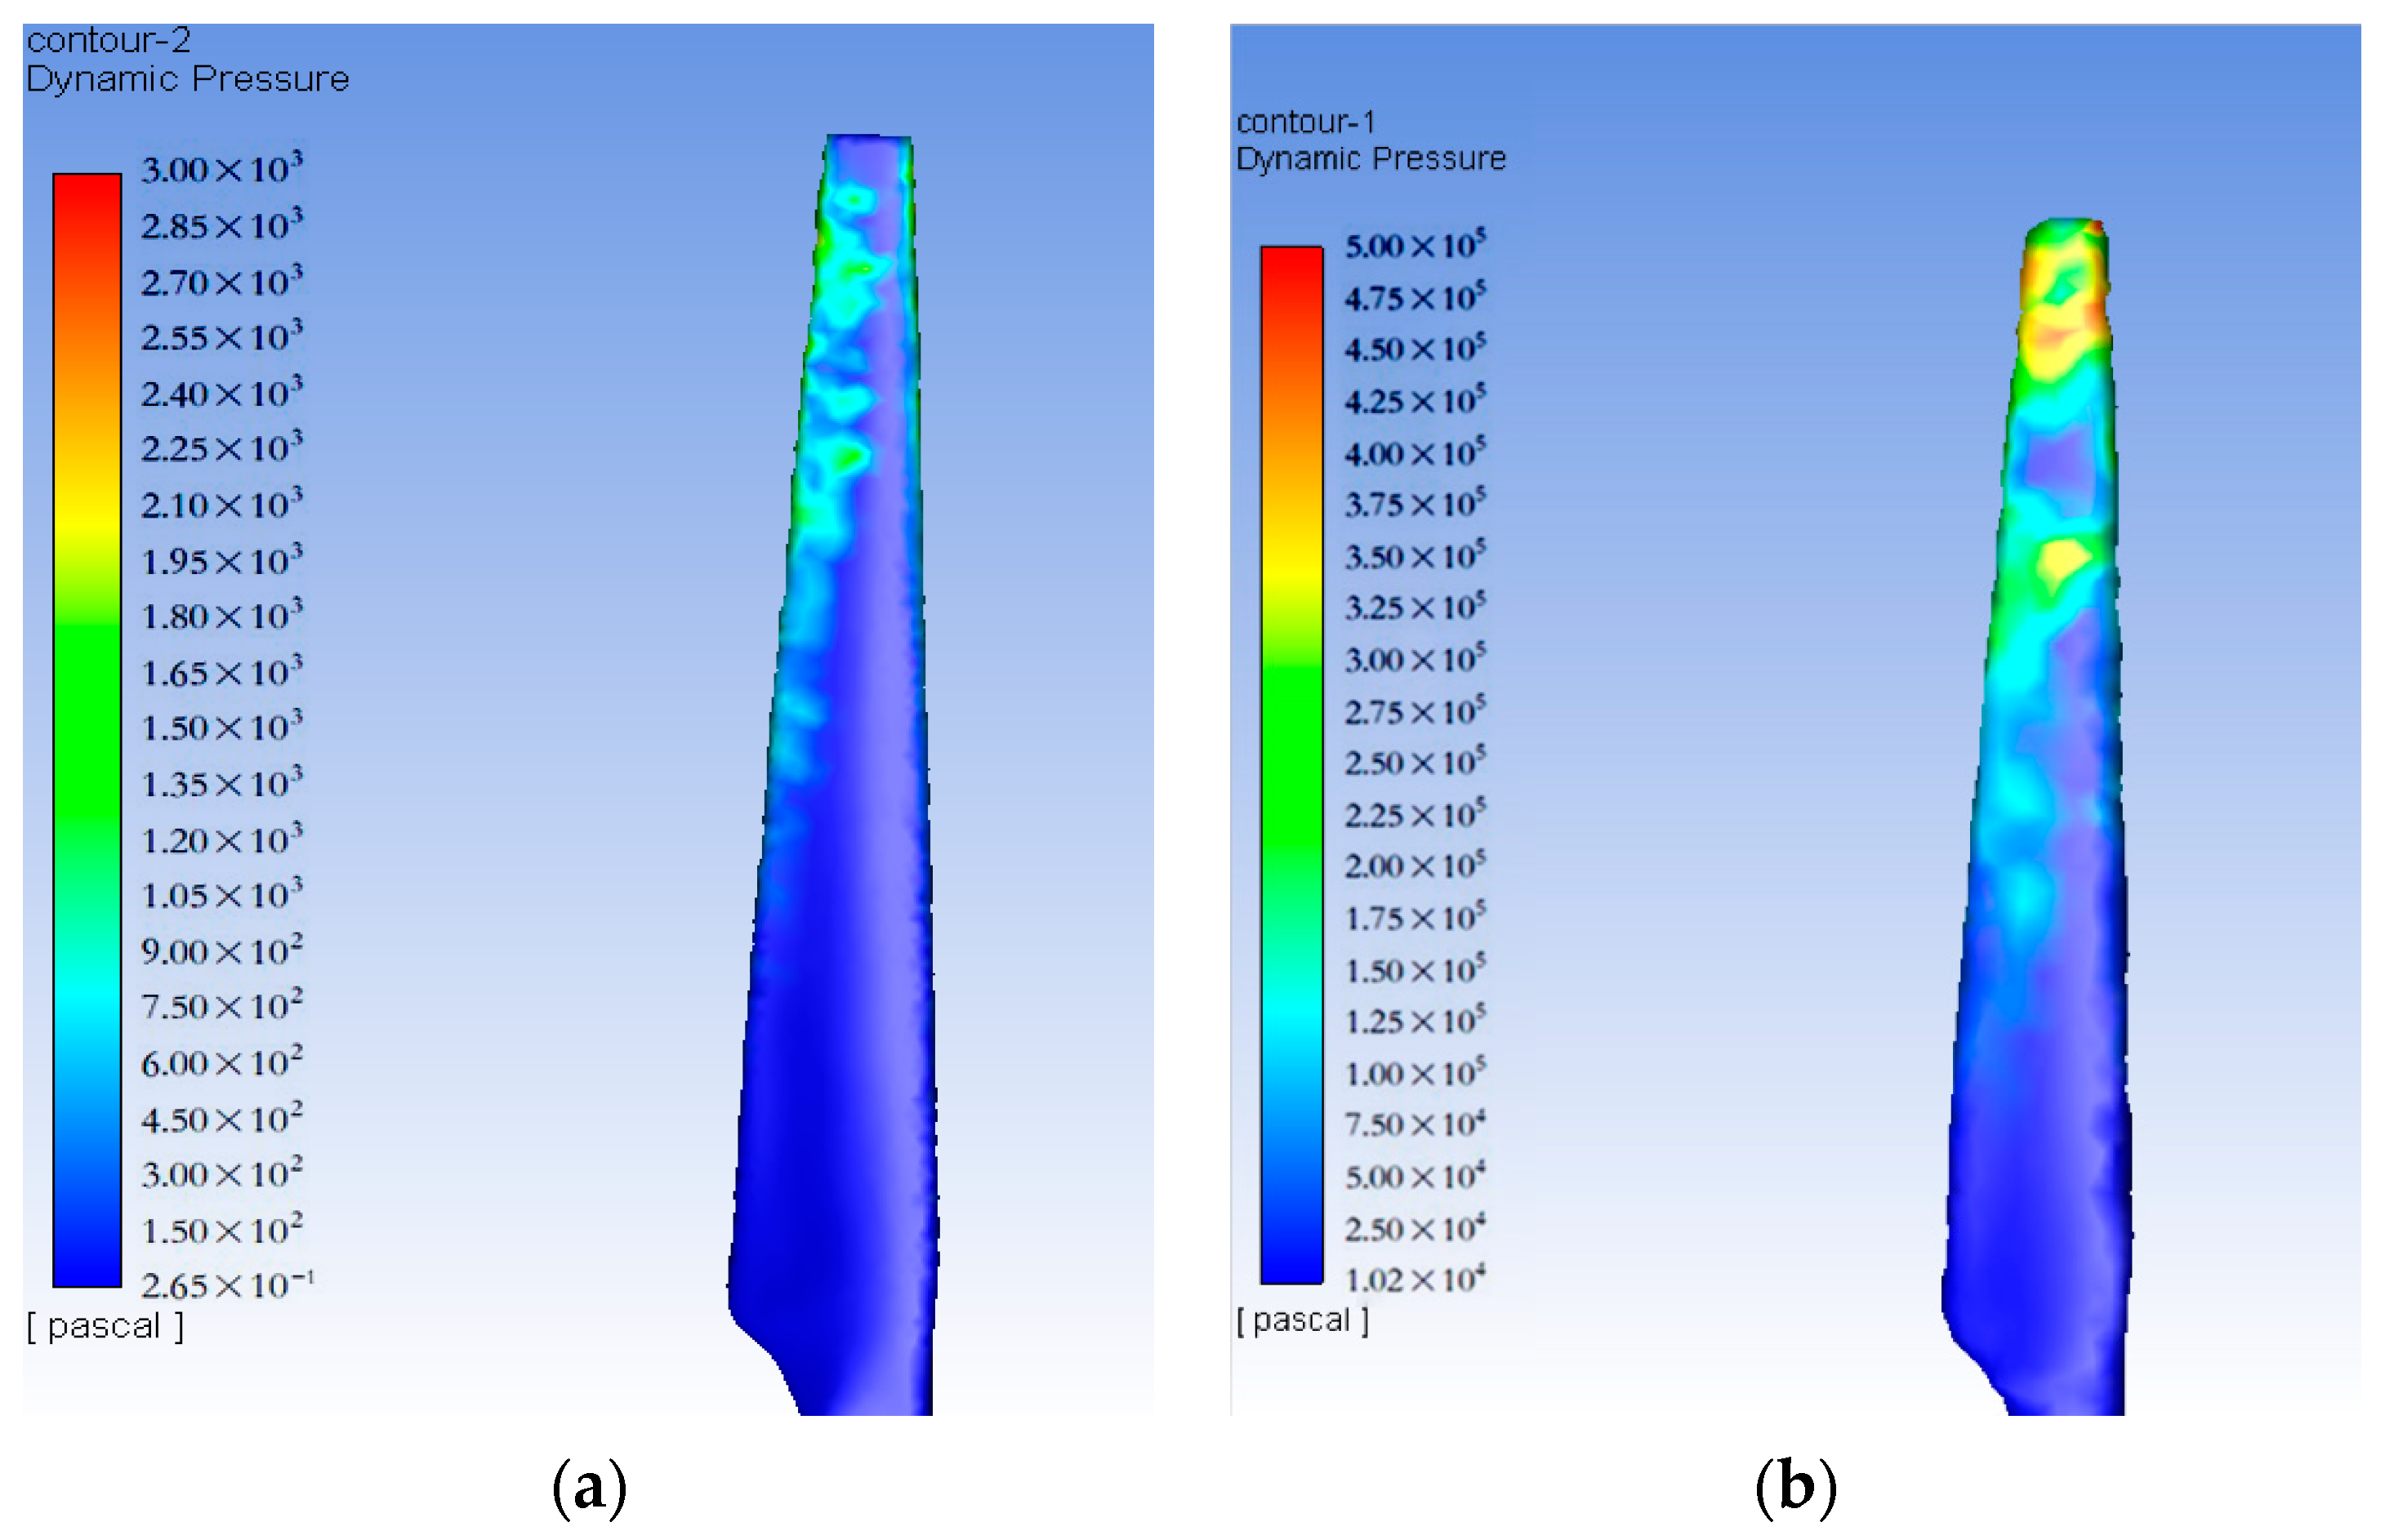
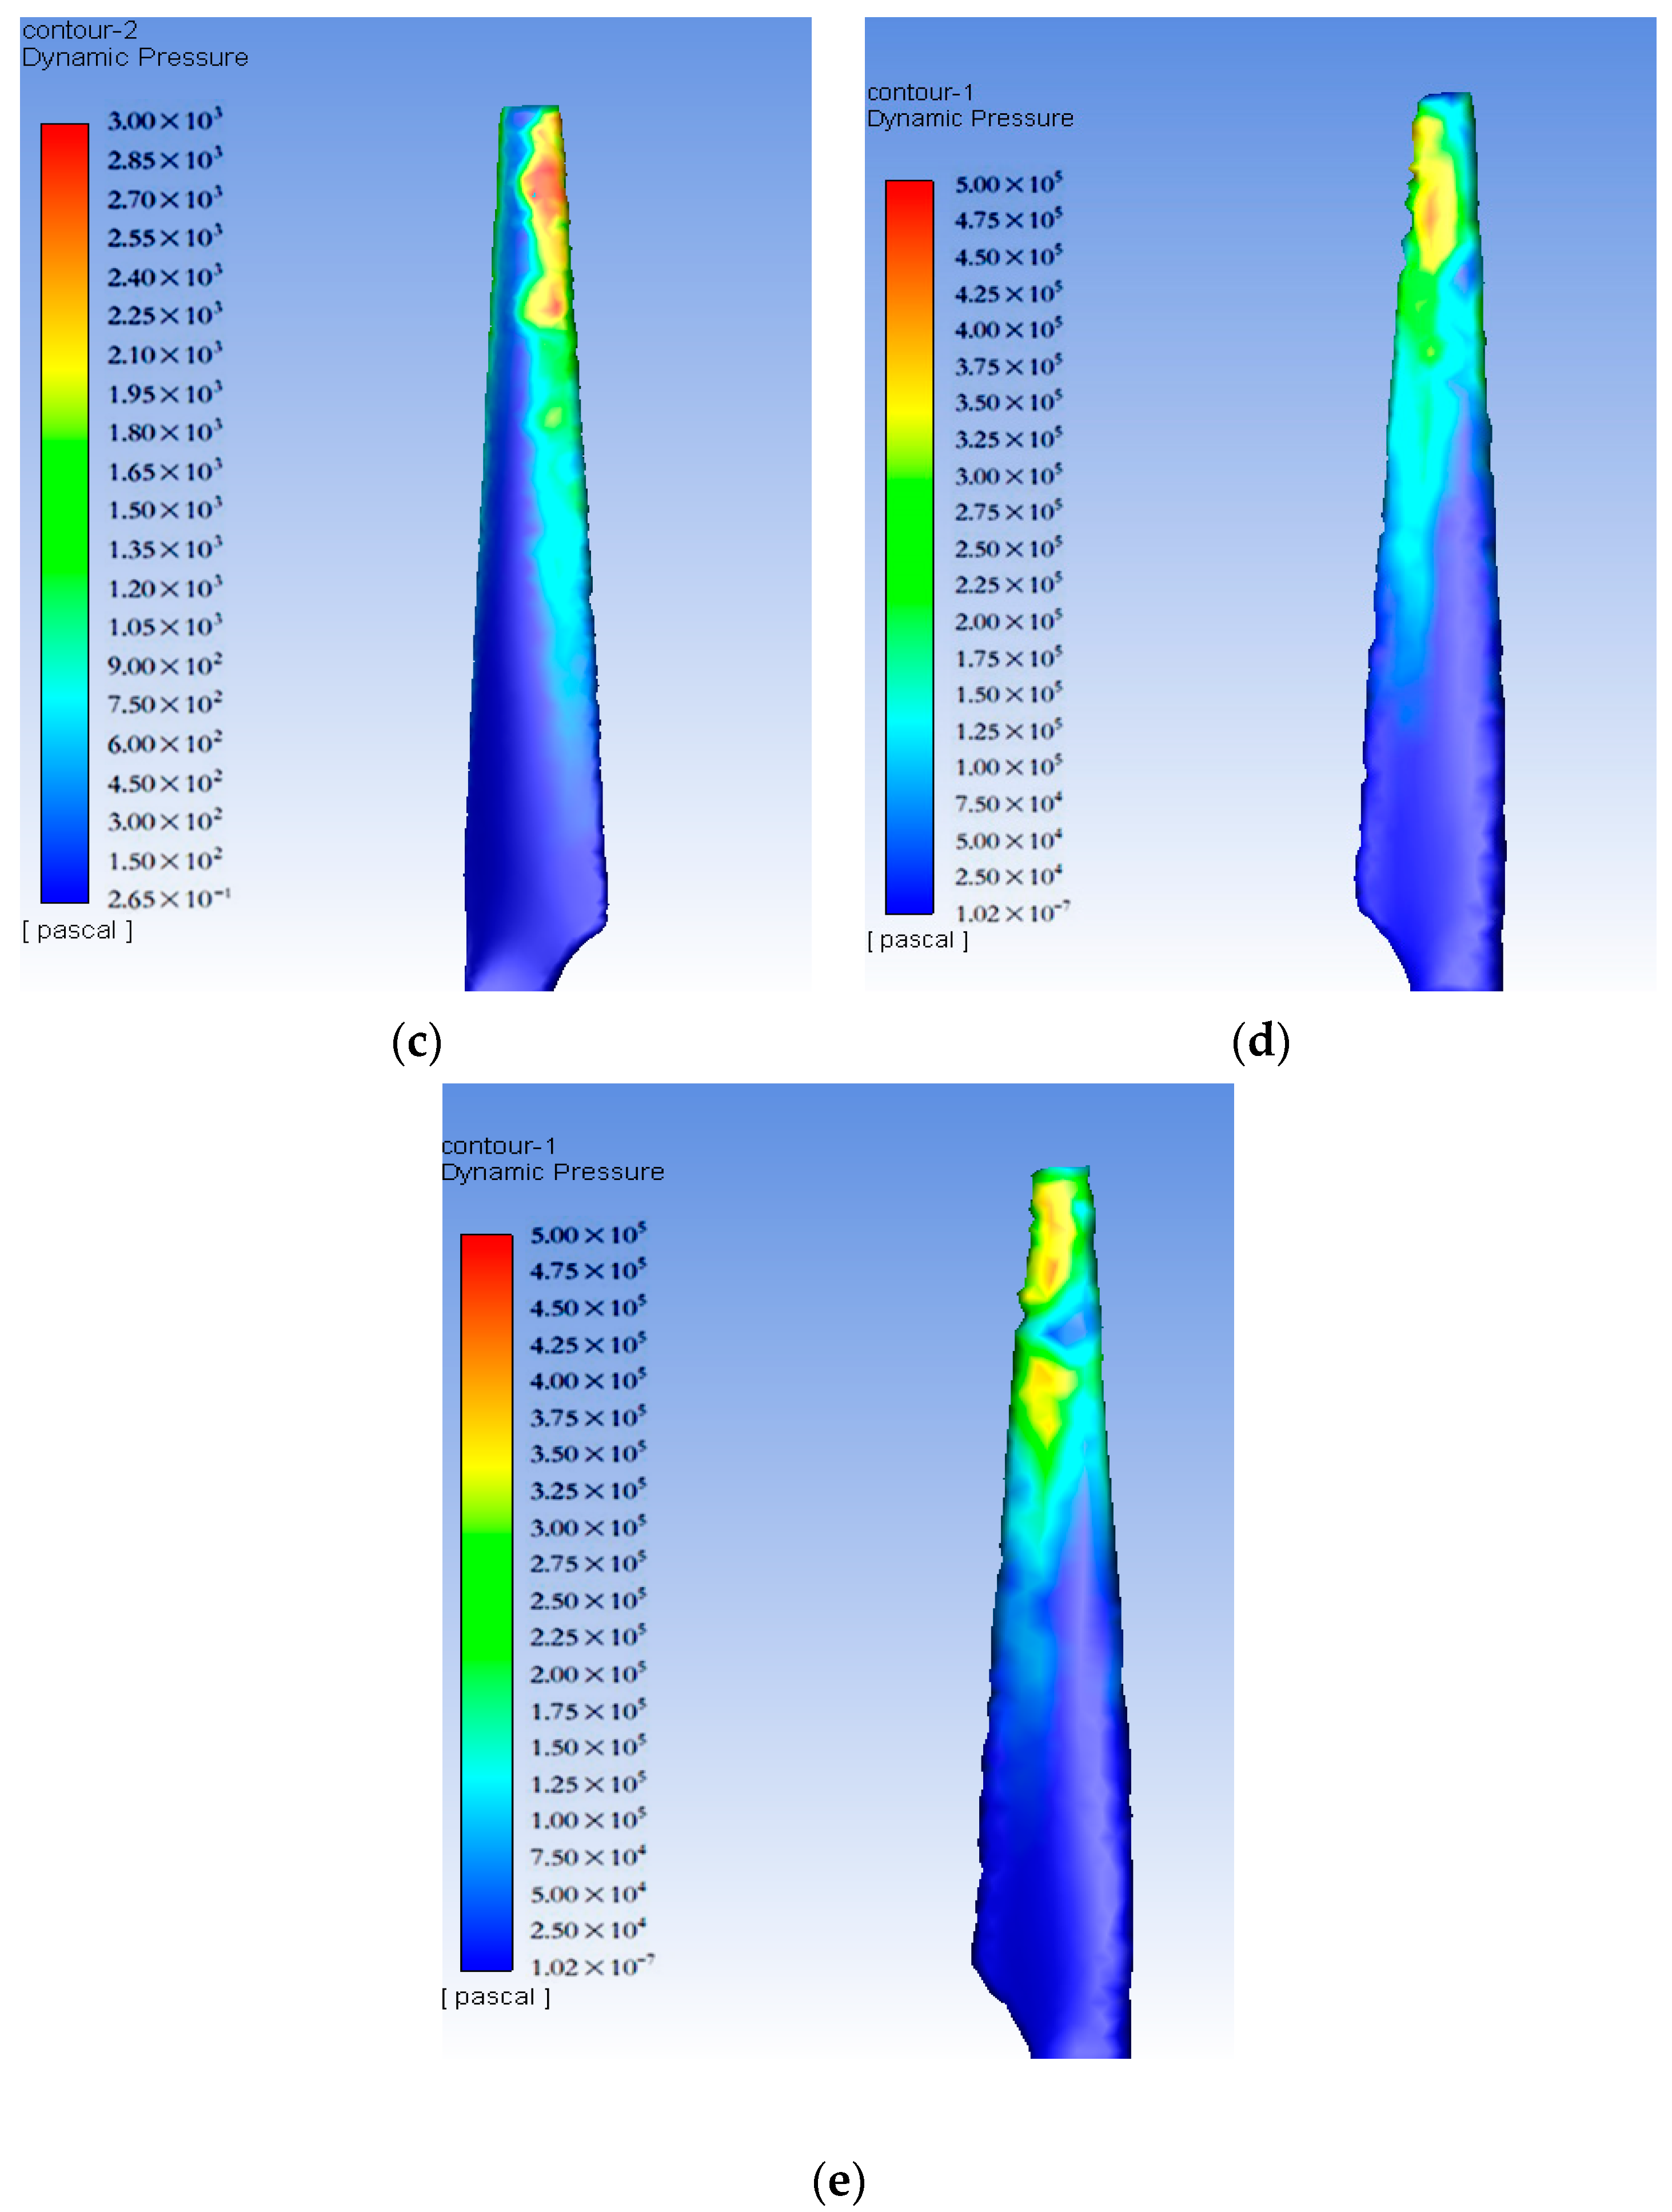
5.2.1. Flow Field Pressure Analysis on the Icing Blade Surface
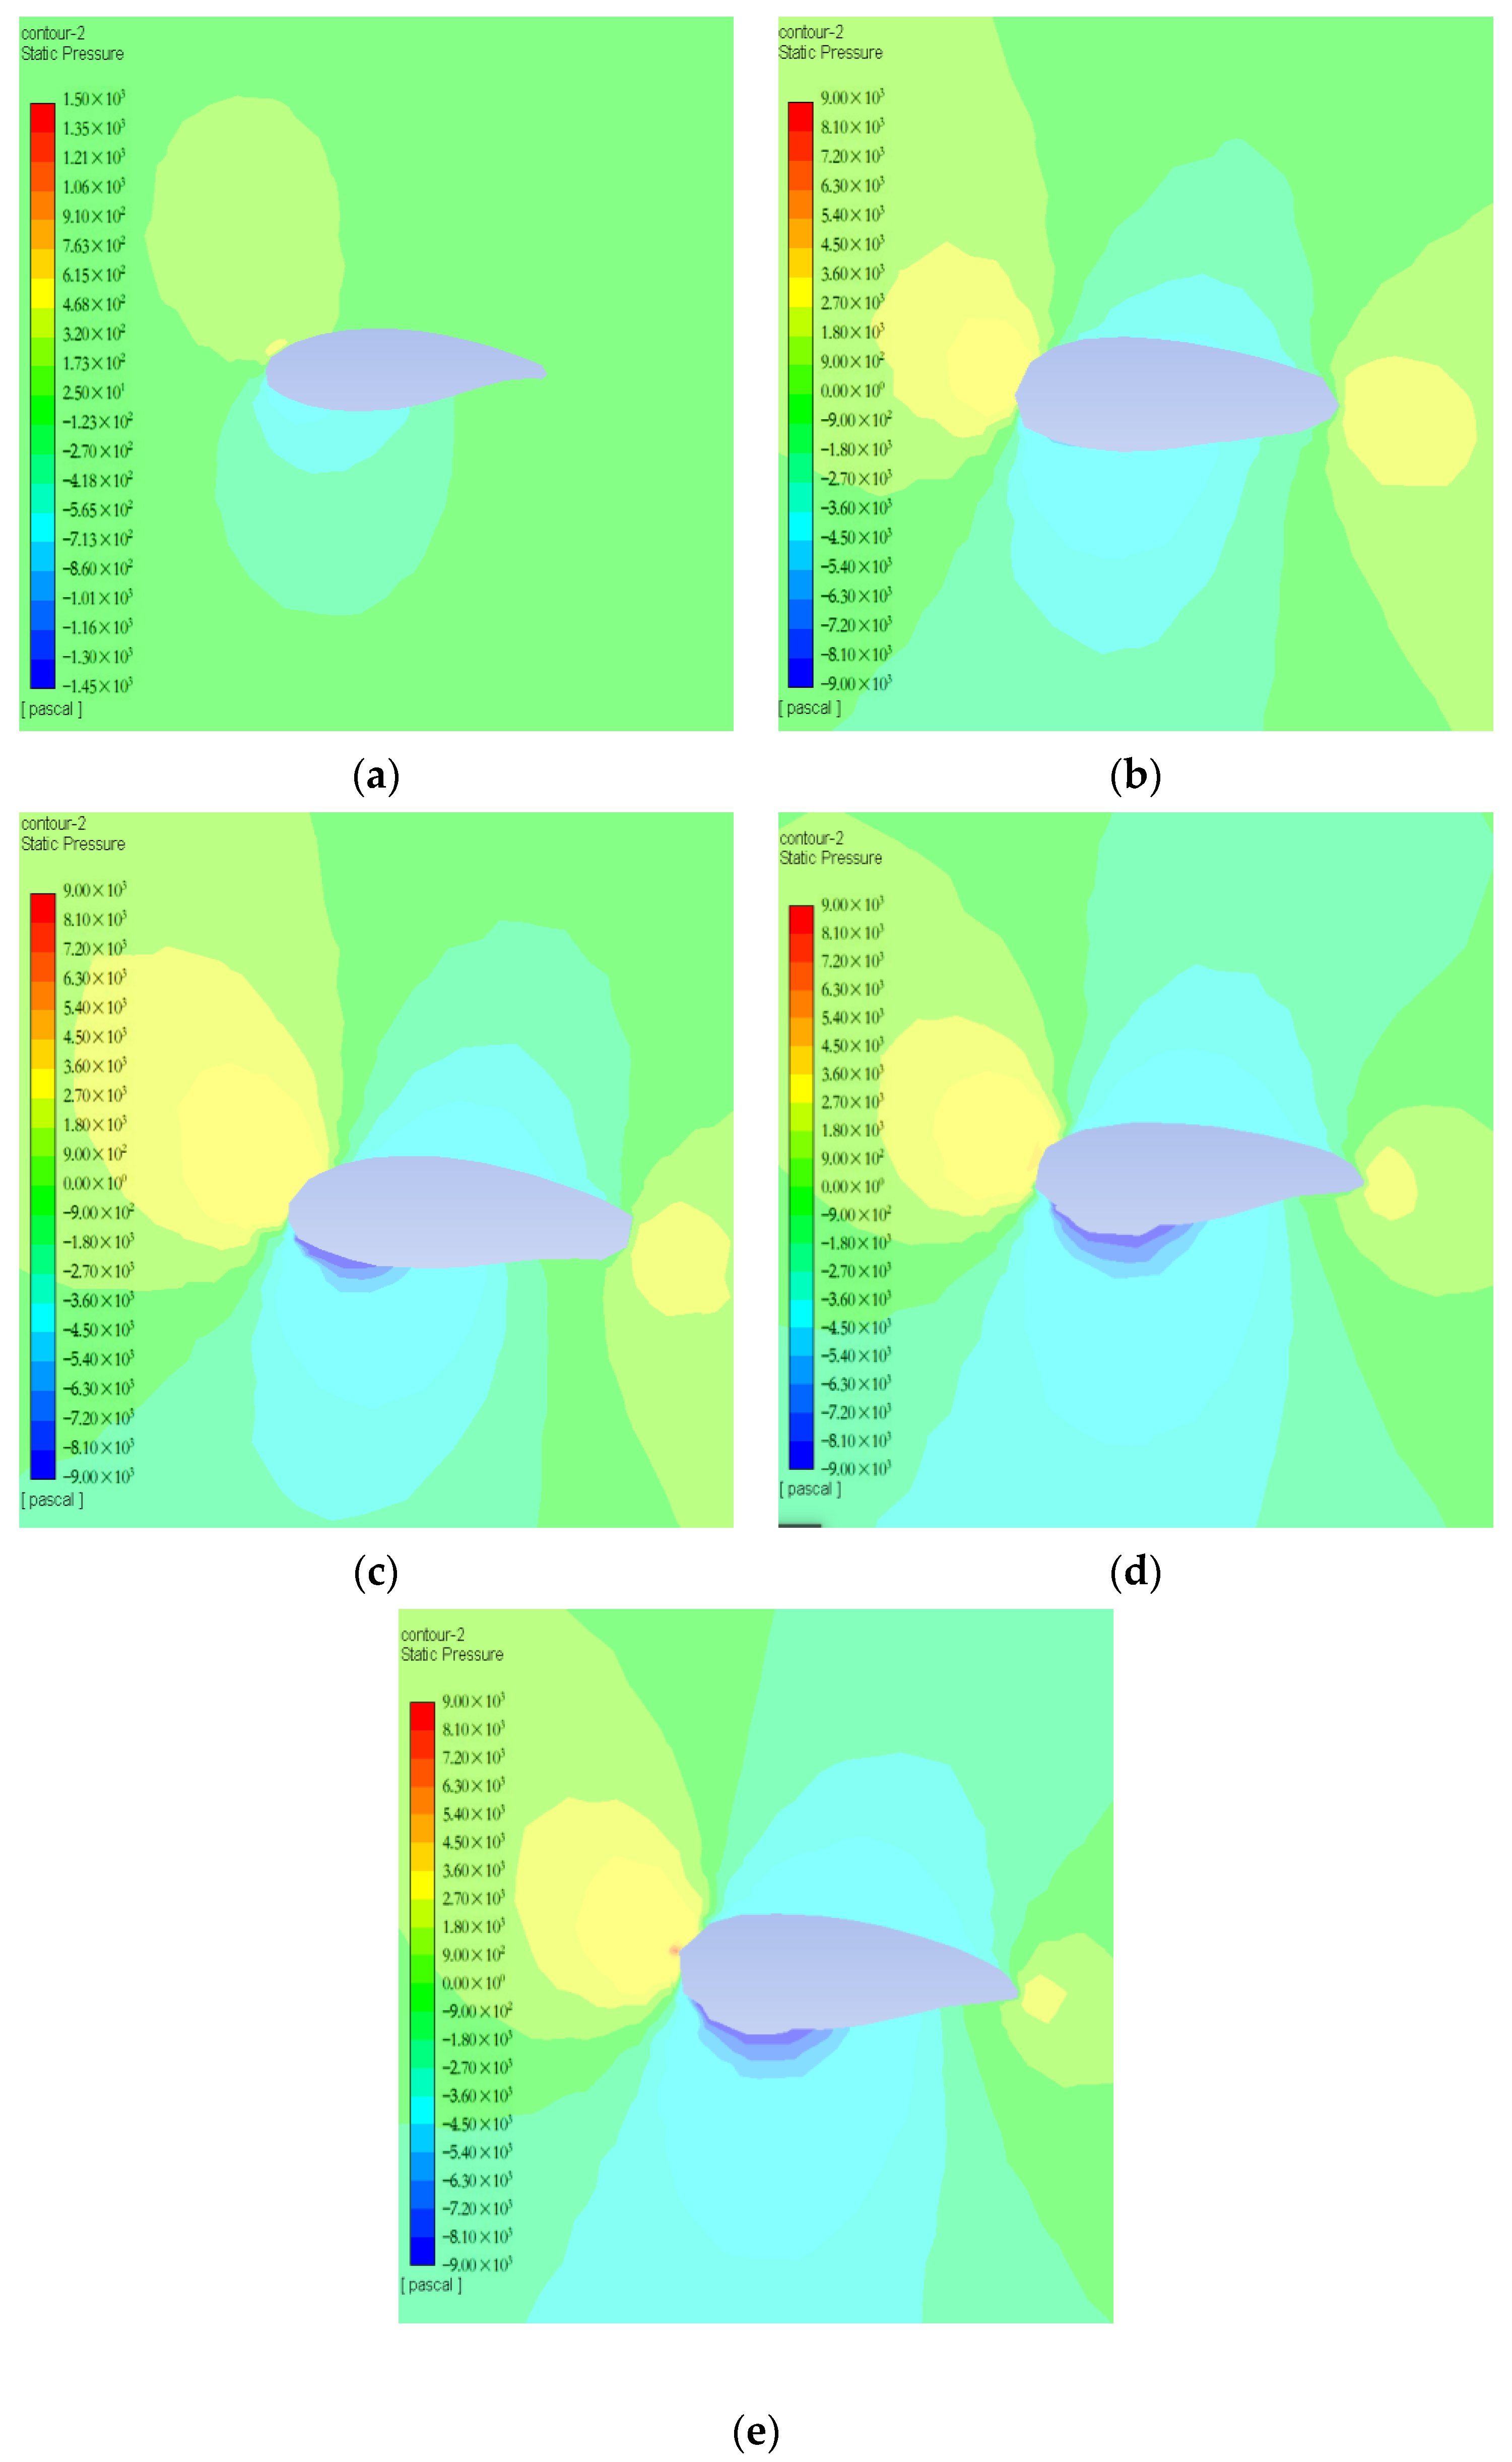
5.2.2. Static Pressure Analysis of Two-Dimensional Airfoil Sections
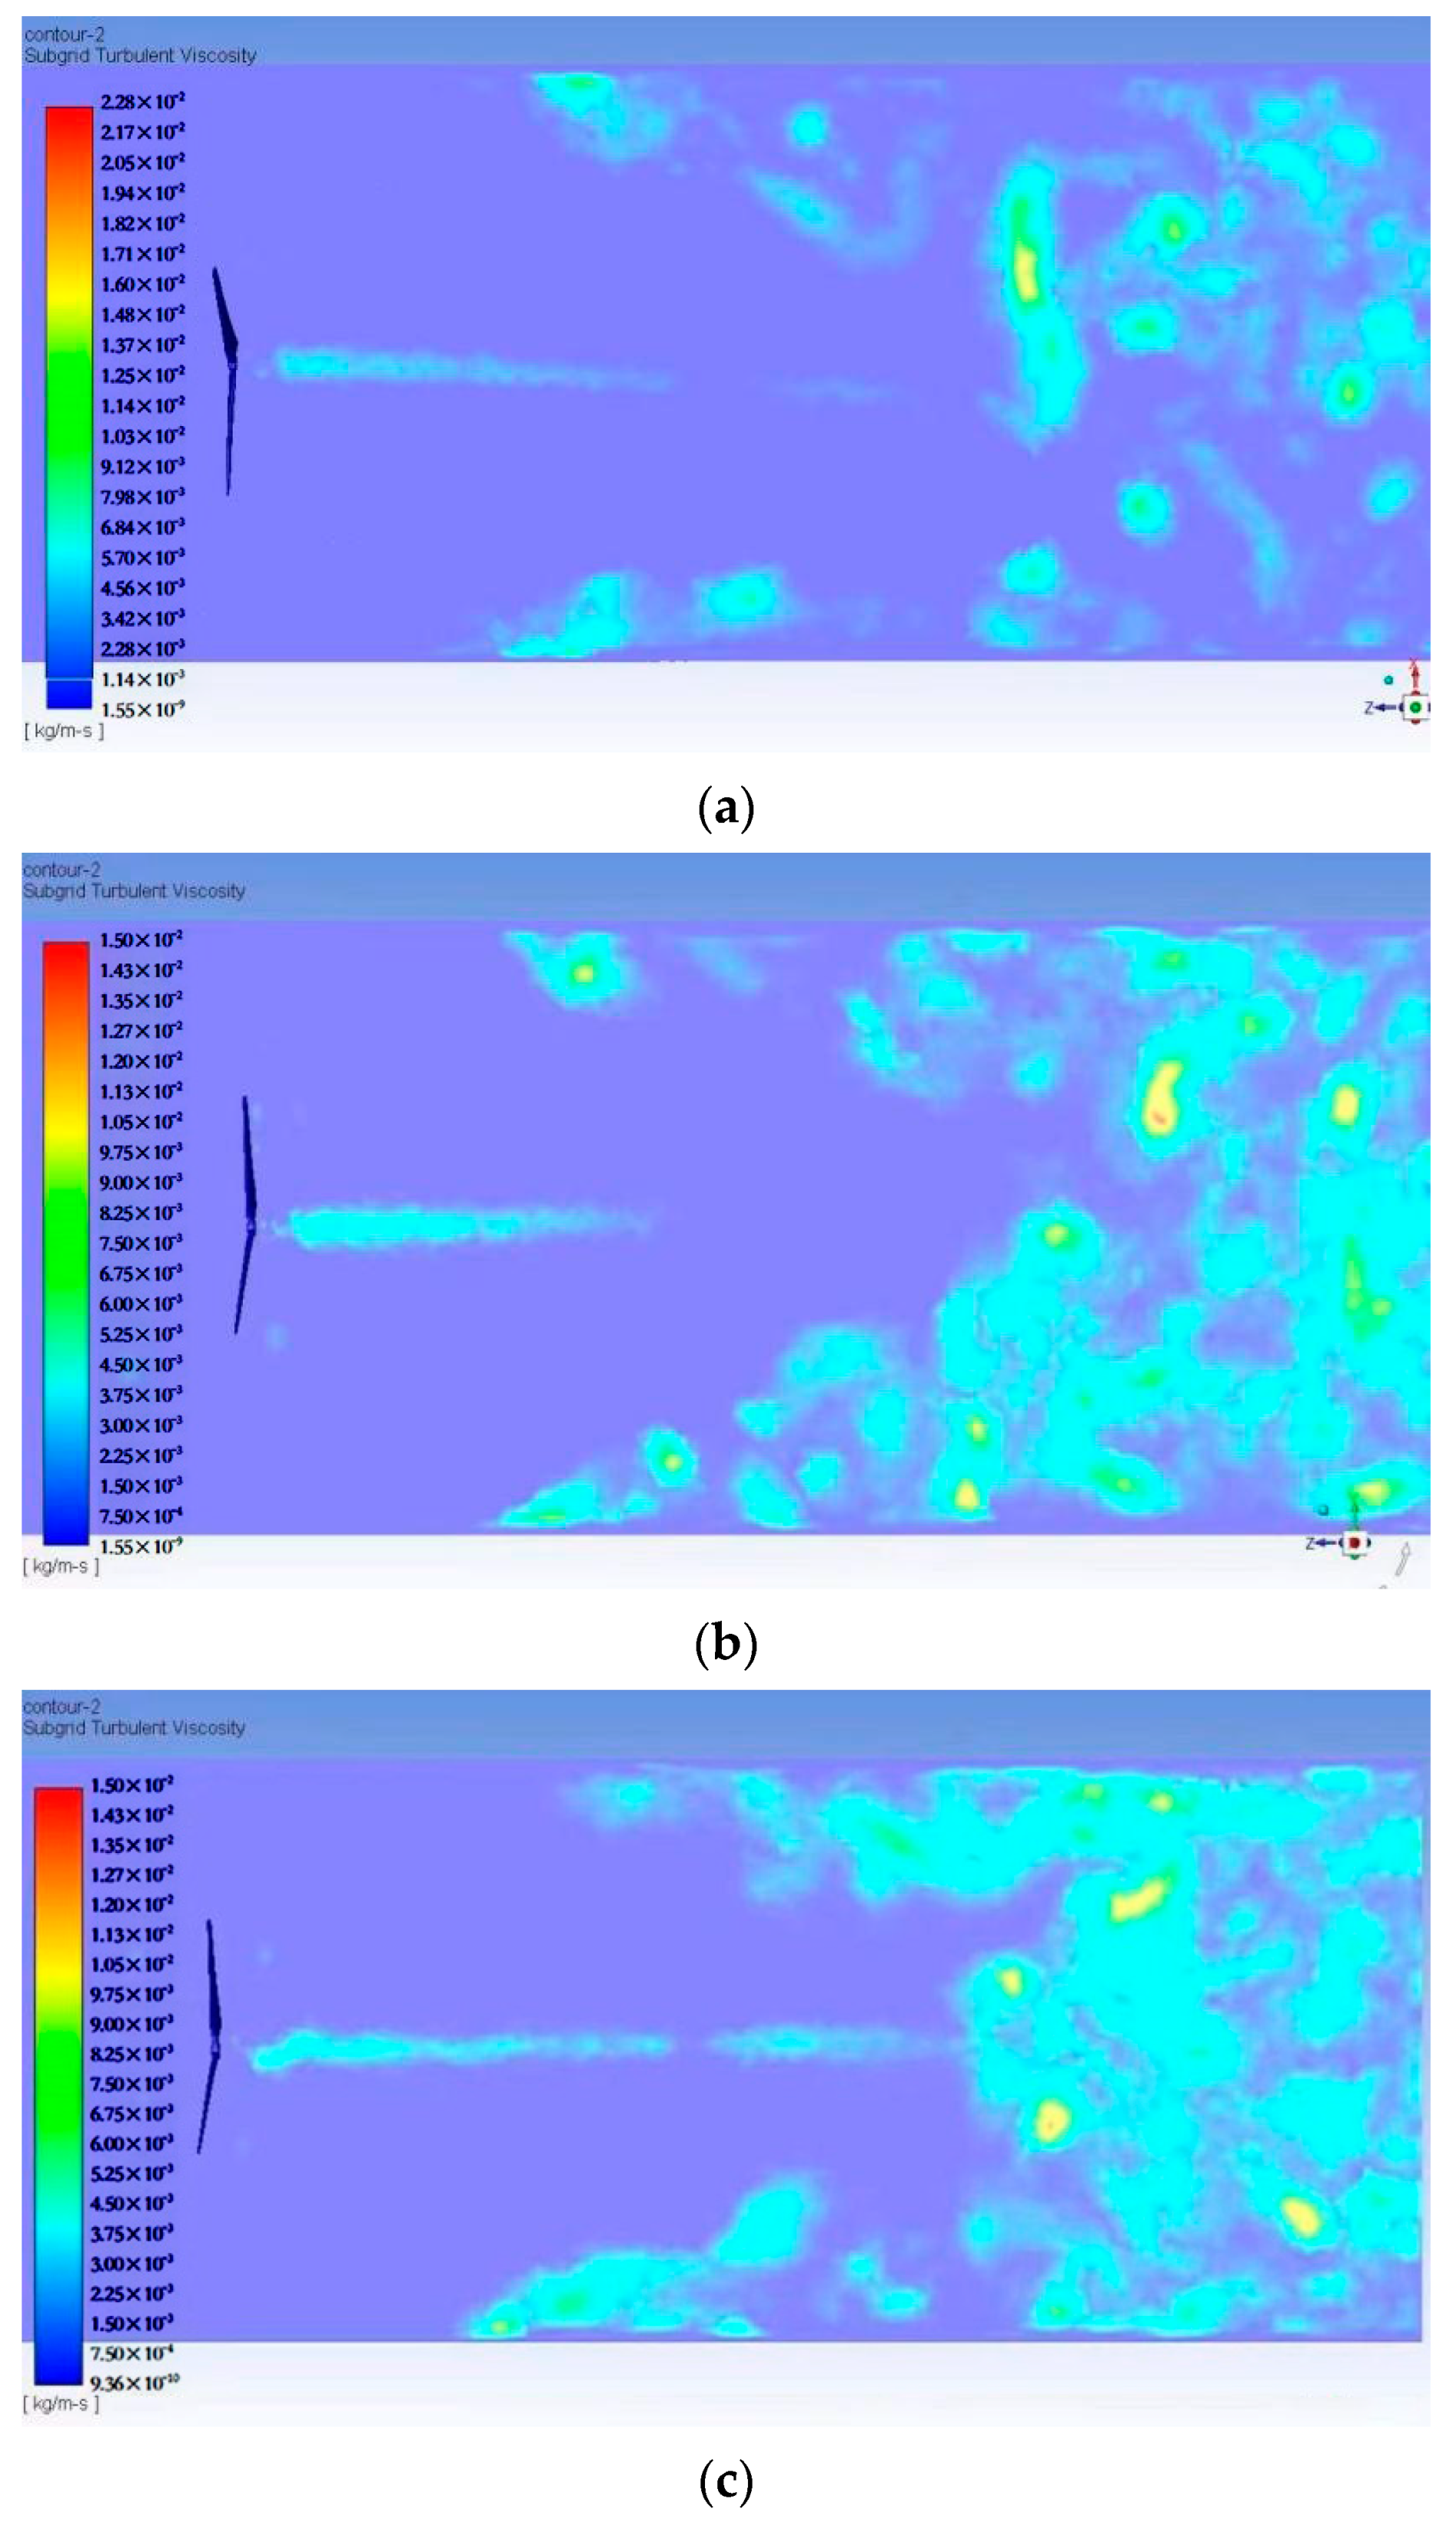
5.2.3. Flow Field Analysis
6. Conclusions
Author Contributions
Funding
Institutional Review Board Statement
Informed Consent Statement
Data Availability Statement
Acknowledgments
Conflicts of Interest
References
- Aizpuruaetxezarreta, M.; Carrenomadinabeitia, S.; Ulazia, A. Long-Term Freezing Temperatures Frequency Change Effect on Wind Energy Gain (Eurasia and North America, 1950–2019). Sustainability 2022, 14, 5630. [Google Scholar] [CrossRef]
- U.S. Department of Energy. Wind Technologies Market Report (2018) 1e98. Available online: https://www.energy.gov/eere/wind/articles/2018-wind-technologies-market-report (accessed on 20 October 2022).
- Tautz-Weinert, J.; Yurusen, N.Y.; Melero, J.J.; Watson, S.J. Sensitivity study of a wind farm maintenance decision-a performance and revenue analysis. Renew. Energy 2019, 132, 93–105. [Google Scholar] [CrossRef]
- Zanon, A.; De Gennaro, M. Wind energy harnessing of the nrel 5mw reference wind turbine in icing conditions under different operational strategies. Renew. Energy 2018, 115, 760–772. [Google Scholar] [CrossRef]
- Kraj, A.G.; Bibeau, E.L. Phases of icing on wind turbine blades characterized by ice accumulation. Renew. Energy 2010, 35, 966–972. [Google Scholar] [CrossRef]
- Fakorede, O.; Feger, Z.; Ibrahim, H.; Ilinca, A.; Perron, J.; Masson, C. Ice protection systems for wind turbines in cold climate: Characteristics, comparisons and analysis. Renew. Sustain. Energy Rev. 2016, 65, 662–675. [Google Scholar] [CrossRef]
- Bose, N. Icing on a small horizontal-axis wind turbine—Part 1: Glaze ice profiles. J. Wind. Eng. Ind. Aerodyn. 1992, 45, 75–85. [Google Scholar] [CrossRef]
- Shin, J.; Bond, T.H. Results of an icing test on a NACA 0012 airfoil in the NASA Lewis Icing Research Tunnel. In Proceedings of the 30th Aerospace Sciences Meeting and Exhibit, Reno, NV, USA, 6–9 January 1992. [Google Scholar]
- Hu, L.; Zhu, X.; Hu, C.; Chen, J.; Du, Z. Wind turbines ice distribution and load response under icing conditions. Renew. Energy 2017, 113, 608–619. [Google Scholar] [CrossRef]
- Hu, L.; Zhu, X.; Chen, J.; Shen, X.; Du, Z. Numerical simulation of rime ice on nrel phase vi blade. J. Wind. Eng. Ind. Aerodyn. 2018, 178, 57–68. [Google Scholar] [CrossRef]
- Drapalik, M.; Zajicek, L.; Purker, S. Ice aggregation and ice throw from small wind turbines. Cold Reg. Sci. Technol. 2021, 192, 103399. [Google Scholar] [CrossRef]
- Shu, L.; Li, H.; Hu, Q.; Jiang, X.; Qiu, G.; Mcclure, G. Study of ice accretion feature and power characteristics of wind turbines at natural icing environment. Cold Reg. Ence Technol. 2018, 147, 45–54. [Google Scholar] [CrossRef]
- Shu, L.; Liang, J.; Hu, Q.; Jiang, X.; Ren, X.; Qiu, G. Study on small wind turbine icing and its performance. Cold Reg. Sci. Technol. 2017, 134, 11–19. [Google Scholar] [CrossRef]
- Cao, H.Q.; Bai, X.; Ma, X.D.; Yin, Q.; Yang, X.Y. Numerical simulation of icing on nrel 5-mw reference offshore wind turbine blades under different icing conditions. China Ocean. Eng. 2022, 36, 767–780. [Google Scholar] [CrossRef]
- Homola, M.C.; Virk, M.S.; Wallenius, T.; Nicklasson, P.J.; Sundsb, P.A. Effect of atmospheric temperature and droplet size variation on ice accretion of wind turbine blades. J. Wind. Eng. Ind. Aerodyn. 2010, 98, 724–729. [Google Scholar] [CrossRef]
- Virk, M.S. Effect of wind turbine blade profile symmetry on ice accretion. Appl. Mech. Mater. 2017, 863, 229–234. [Google Scholar] [CrossRef]
- Guo, W.; Shen, H.; Li, Y.; Feng, F.; Tagawa, K. Wind tunnel tests of the rime icing characteristics of a straight-bladed vertical axis wind turbine. Renew. Energy 2021, 179, 116–132. [Google Scholar] [CrossRef]
- Li, Y.; Tagawa, K.; Feng, F.; Li, Q.; He, Q. A wind tunnel experimental study of icing on wind turbine blade airfoil. Energy Convers. Manag. 2014, 85, 591–595. [Google Scholar] [CrossRef]
- Ren, C. Blade Ice Shape and Performance Influence of VAWT at Different Tip Speed Ratios. Model. Simul. 2022, 11, 279–287. [Google Scholar] [CrossRef]
- Gao, L.; Liu, Y.; Zhou, W.; Hu, H. An experimental study on the aerodynamic performance degradation of a wind turbine blade model induced by ice accretion process. Renew. Energy 2019, 133, 663–675. [Google Scholar] [CrossRef]
- Oumnia, L.; Mourad, N.; Mourad, T.; Houda, L. A numerical investigation of the effects of ice accretion on the aerodynamic and structural behavior of offshore wind turbine blade. Wind. Eng. 2021, 45, 1433–1446. [Google Scholar]
- Kangash, A.I.; Pankratov, E.V.; Kosarev, I.A.; Maryandyshev, P.A.; Virk, M.S. Investigation of ice accretion effect on the aerodynamic characteristics of a wind turbine blade tip after a short icing event. Earth Environ. Sci. 2023, 1154, 012079. [Google Scholar] [CrossRef]
- Jin, J.; Virk, M. Experimental study of ice accretion on S826 & S832 wind turbine blade profiles. Cold Reg. Sci. Technol. 2020, 169, 102913. [Google Scholar]
- Aakhash, S.; Arunvinthan, S.; Pasha, A. Effect of Ice accretion on the aerodynamic characteristics of wind turbine blades. Wind. Struct. 2021, 32, 205–217. [Google Scholar]
- Li, Y.; Shi, L.; Guo, W.; Tagawa, K.; Zhao, B. Numerical simulation of icing effect on aerodynamic characteristics of a wind turbine blade. Therm. Sci. 2021, 25, 4643–4650. [Google Scholar] [CrossRef]
- Wang, Q.; Liu, Y.; Li, W.; Ren, J.; Yi, X. Study on Aerodynamic Performance of Ice Accreted Wind Turbine Under Yaw Condition. J. Eng. Thermophys. 2022, 43, 918–928. [Google Scholar]
- Sean, G.; Sheikh, Z.; Cameron, G.; Ghazi, D.; Taimoor, A. The Impact of Ice Formation on Vertical Axis Wind Turbine Performance and Aerodynamics. Wind 2023, 3, 16–34. [Google Scholar]
- Sahin, M.; Farsadi, T. The impacts of atmospheric icing on performance and behavior of a controlled large-scale wind turbine. J. Renew. Sustain. Energy 2023, 15, 063307. [Google Scholar] [CrossRef]
- Kangash, A.; Virk, M.S.; Maryandyshev, P. Numerical study of icing impact on the performance of pitch-regulated large wind turbine. Wind. Eng. 2023, 47, 334–346. [Google Scholar] [CrossRef]
- Kostinski, A.; Cantrell, W. Entropic aspects of supercooled droplet freezing. J. Atmos. Sci. 2008, 65, 2961–2971. [Google Scholar] [CrossRef]
- Han, Y.; Palacios, J.; Schmitz, S. Scaled ice accretion experiments on a rotating wind turbine blade. J. Wind. Eng. Ind. Aerodyn. 2012, 109, 55–67. [Google Scholar] [CrossRef]


| Type | Density/(kg·m−3) | Color | Adhesion |
|---|---|---|---|
| Glaze ice | 900 | Transparent | Strong |
| Heavy rime ice | 600~900 | Nontransparent | Strong |
| Mild rime ice | 200~600 | White | Medium |
| Mixed ice | 600~800 | Strong | Semi-transparent |
| Instrument | Parameters | Value |
|---|---|---|
| Temperature and relative humidity detector | Temperature range | −40–80 °C |
| Temperature accuracy | ±0.2 °C | |
| Humidity range | 0–100% RH | |
| Humidity accuracy | ±2% RH | |
| Electric nebulizer | Flow rate | 3 L/min |
| Precision electronic platform | Range | 0–10 kg |
| scale | Accuracy | 0.1 g |
Disclaimer/Publisher’s Note: The statements, opinions and data contained in all publications are solely those of the individual author(s) and contributor(s) and not of MDPI and/or the editor(s). MDPI and/or the editor(s) disclaim responsibility for any injury to people or property resulting from any ideas, methods, instructions or products referred to in the content. |
© 2024 by the authors. Licensee MDPI, Basel, Switzerland. This article is an open access article distributed under the terms and conditions of the Creative Commons Attribution (CC BY) license (https://creativecommons.org/licenses/by/4.0/).
Share and Cite
Cui, H.; Li, Y.; Fan, T.; Fu, Y.; Su, L.; Wang, X. Multi-Dimensional Extraction of Ice Shape and an Investigation of Its Aerodynamic Characteristics on Iced Wind Turbine Blades. Appl. Sci. 2024, 14, 2109. https://doi.org/10.3390/app14052109
Cui H, Li Y, Fan T, Fu Y, Su L, Wang X. Multi-Dimensional Extraction of Ice Shape and an Investigation of Its Aerodynamic Characteristics on Iced Wind Turbine Blades. Applied Sciences. 2024; 14(5):2109. https://doi.org/10.3390/app14052109
Chicago/Turabian StyleCui, Hongmei, Yonghao Li, Teng Fan, Yangxu Fu, Linchao Su, and Xinkai Wang. 2024. "Multi-Dimensional Extraction of Ice Shape and an Investigation of Its Aerodynamic Characteristics on Iced Wind Turbine Blades" Applied Sciences 14, no. 5: 2109. https://doi.org/10.3390/app14052109