Abstract
As there is a lack of public mark samples of Tibetan historical document image characters at present, this paper proposes an unsupervised Tibetan historical document character recognition method based on deep learning (UD-CNN). Firstly, using the Tibetan historical document character component, the Tibetan historical document character sample data set is constructed for model-aided training. Then, the character baseline information is introduced, and a fine-grained feature learning strategy is proposed. For the samples above and below the baseline, the Up-CNN recognition model and Down-CNN recognition model are established. The convolution neural network model is trained and optimized for the samples above and below the baseline, respectively, to improve the recognition accuracy. The experimental results show that the proposed method obviously affects the unmarked character classification and recognition of real Tibetan historical document images. The recognition rate of Top5 can reach 92.94%, and the recognition rate of Top1 can be increased from 82.25% to 87.27% using the CNN model only.
1. Introduction
In China, the number of Tibetan classics is second only to Chinese classics, and now, there are more than one million volumes of various Tibetan classics existing in Tibetan areas alone. Starting from the creation of the Tibetan script by Tunya Sambuzha in the 7th century AD, Tibetan historical and cultural documents have been recorded in Tibetan for more than a thousand years without interruption. They rank China’s ethnic minority ancient literature for its abundance, depth of content, and breadth of coverage. It is an organic part of Chinese culture and a valuable cultural heritage shared by all human beings [1].
The research on text recognition technology of Tibetan historical documents is of great practical significance to inherit and promote the outstanding culture of the nation, enhance cultural exchanges, serve the national cultural strategies and promote the social, economic, educational and cultural development of Tibetan areas in China. The digital preservation and use of ancient Tibetan literature resources is a hot research topic in the field of literature digitization at home and abroad. However, due to the immaturity of text detection and text recognition technologies, many precious documents and easily damaged paper documents cannot be digitized. The data from digitized Tibetan antiquarian literature resources are mainly image information, which leads to a lack of data support for document content mining, knowledge base construction and retrieval technology development. In addition, the ancient texts preserved in image form are not easy to retrieve and re-learn at a later stage, so the images need to be converted into textual internal codes for preservation. The vast majority of digitized Tibetan texts are currently available for full-text searching, which are entered manually, and this process is costly in terms of time and labor. For the preservation of ancient Tibetan texts, it is now the trend to analyze and recognize the images and convert them into internal codes in an automated way.
Deep learning techniques have been successfully used in various text recognition [2,3], essentially revolutionizing research in the field of Tibetan character recognition [4,5,6,7]. In recent years, these methods have been initially used with some success in Tibetan online handwritten character recognition, Tibetan printed character recognition, Tibetan offline handwritten character recognition and Tibetan character recognition in natural scenes. However, existing deep learning recognition techniques rely on a large amount of annotated data, and it is very easy to overfit the deep model by using a small number of annotated samples directly. Moreover, it requires a huge annotation cost to obtain a large number of annotated images, and it is currently impossible to obtain many annotated images of the characters in Tibetan documents. Therefore, it is an important research problem to study how to use a small amount of annotated data or for zero-sample character recognition of ancient Tibetan documents.
To address the above problems, this paper proposed a deep learning-based unsupervised recognition method for Tibetan ancient text character images. Firstly, a sample of Tibetan historical document character images is synthesized based on Tibetan character parts, and the synthesized sample assists in training a CNN classifier model; secondly, character baseline information is introduced to extract fine-grained features of the character images; then, the recognition process is optimized based on proportional and probability thresholds. The proposed method has significantly improved the recognition rate of unlabeled samples of Tibetan ancient Ugandan script character images. The specific work and innovation points are as follows:
(1) At present, there is no publicly available sample set of ancient Tibetan Chinese characters in the Ugandan script. For commonly used Tibetan ancient Chinese characters, a sample set of Tibetan ancient Chinese character images is synthesized using Tibetan character components, and the sample set is divided into 519 categories, with 1000 of each category and a total of 519,000.
(2) With the introduction of character baseline information, this paper synthesizes the image samples above the baseline and below the baseline of ancient Tibetan characters. There are 13 categories of synthesized samples above the baseline, 70 of each category, totaling 910; 273 categories of synthesized samples below the baseline, 300 of each category, totaling 81,900.
(3) This paper proposed a deep learning-based unsupervised recognition algorithm for ancient Tibetan text character images, and this method is effective in recognizing unlabeled samples of ancient Tibetan Chinese characters in Ugandan script. The recognition rate is significantly improved after the introduction of the baseline feature optimization model.
2. Related Work
Research on the identification of Tibetan documents began in the 1980s when Masami Kojima at Tohoku University of Technology in Japan began his research on the identification of woodcut Tibetan documents in 1991. A method based on logical inference is proposed for slicing and recognizing characters in documents [8], and research is carried out on feature extraction [9] and recognition of similar characters in documents [10]. In 2011, Hedayati at the University of California, Berkeley, proposed a complete scheme for recognizing engraved Tibetan texts, addressing the baseline detection, line character slicing and various problems faced in the recognition process [11]. Since 2017, Wang Weilan’s team from Northwest University for Nationalities and Duan Lijuan’s team from Beijing University of Technology have been studying the recognition of Tibetan characters in Tibetan historical documents with the woodcut version of the Ugandan script Tibetan characters, and have made some research results in image pre-processing [12], layout analysis [13,14], text line slicing [15,16,17,18], character slicing [19] and data set construction [20] for the characters of Tibetan historical documents.
Deep learning-based recognition of Tibetan characters has been rapidly developed in recent years and is superior to traditional recognition methods, with significant recognition results. The authors of [21] carried out a study on the recognition of Tibetan handwritten digits based on convolutional neural networks, using CNN models for training Tibetan handwritten digit samples. One study [7] carried out a study on the design and analysis of a Tibetan recognition system based on an improved algorithm of convolutional neural network and proposed a handwritten Tibetan recognition method based on an improved convolutional neural network. This paper integrated the functions of feature extraction and classifier and reduced the uncertainty factors influenced by the outside world in the feature extraction process.
In [22], a deep neural network based on residual network and bi-directional long- and short-term memory recurrent neural network was constructed, and a deep neural network-based recognition method was proposed for image text recognition of Tibetan ancient woodcuts; those solved the problem of poor image quality, serious adhesion of adjacent text and large overlap of upper and lower lines in the recognition of ancient texts. In [23], a convolutional neural network CovNet was constructed for recognition, and a recognition algorithm based on the baseline features of the Ugandan script and migration learning was proposed. In order to enhance the expressiveness of the features and reduce the resolution loss during pooling, the convolutional network contained six convolutional layers, and a pooling layer was added after every two convolutional layers to improve the recognition accuracy. However, the quality and size of samples in deep learning methods have a great impact on recognition results. In Tibetan recognition, constructing a data set with complete categories and sufficient samples is a priority. There are no publicly available marked samples for images of ancient Tibetan characters, and the above methods for Tibetan character recognition all require marked samples.
To address the above problems, this paper uses a component-based sample construction method to synthesize Tibetan ancient text character image samples using Tibetan character components. It also constructs a Tibetan antique character image dataset containing 519 categories of Tibetan characters, with 1000 samples for each category. It introduces character baseline information and synthesis image samples of the part of Tibetan antique characters above the baseline and image samples below the baseline. There are 910 samples above the baseline and 81,900 samples below the baseline. The proposed deep learning-based unsupervised recognition method for Tibetan historical document character images by training CNN classifier models with the aid of synthetic samples is effective in classifying and recognizing unmarked characters in real Tibetan historical document images.
3. The Proposed Method
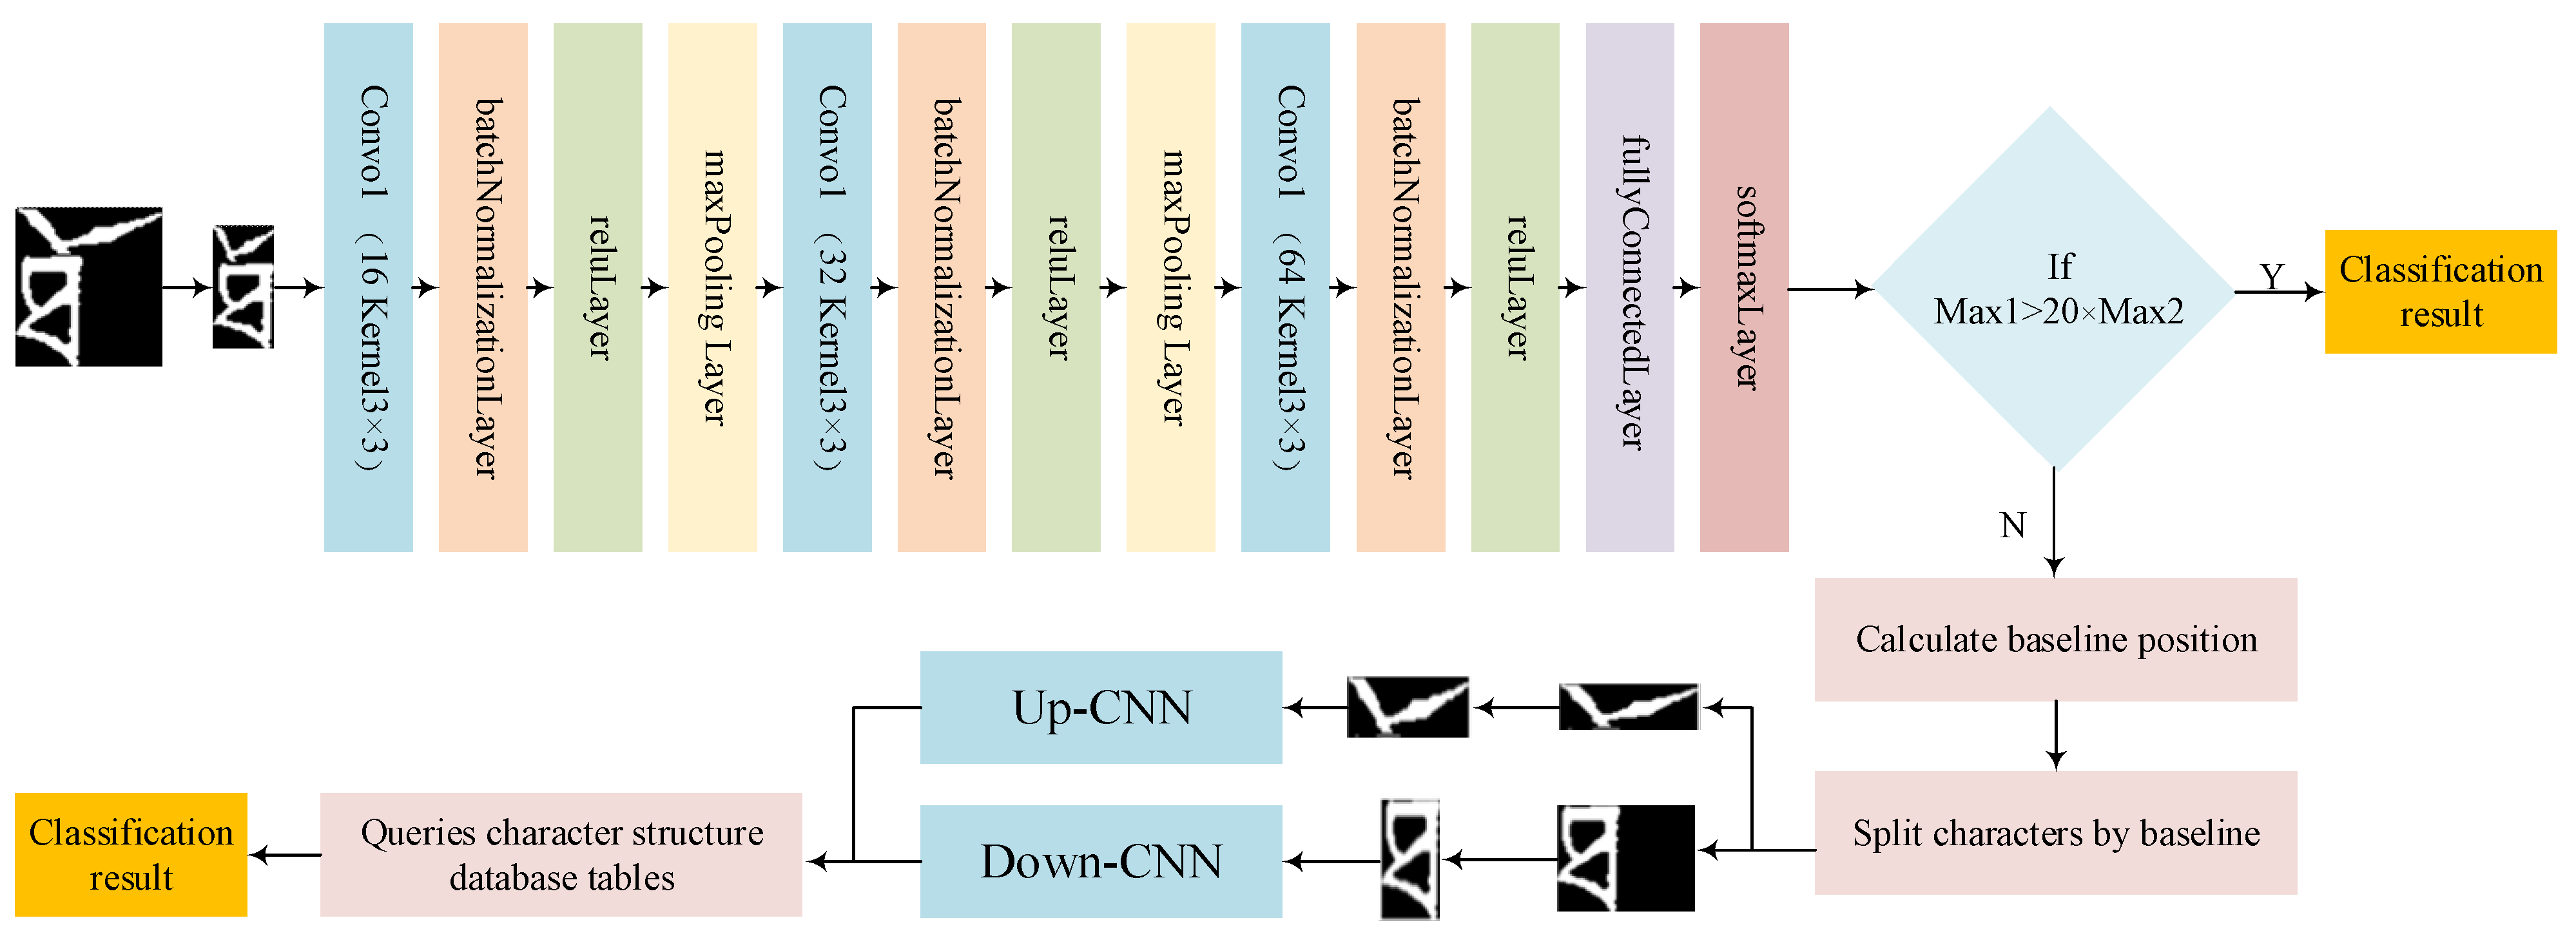
A deep learning-based unsupervised recognition method for Tibetan historical document character images is proposed. Using Tibetan character components, a sample data set of Tibetan historical document character images is constructed. The sample data set is first processed, then a 15-layer convolutional neural network model is constructed for feature extraction. The feature extraction recognition process introduced character baseline information, proposed a fine-grained feature learning strategy, and built Up-CNN recognition models and Down-CNN recognition models for samples above the baseline and samples below the baseline, respectively, to achieve the classification and recognition of unmarked characters in the images of ancient Tibetan documents. Figure 1 shows the general framework of the proposed method.
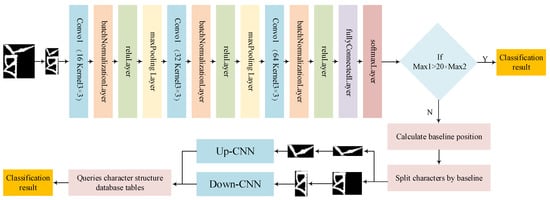
Figure 1.
A general framework for identification.
The model can obtain a higher recognition rate through a relatively simple network structure. According to the particularity of Tibetan characters, the model is improved based on the simple structure of LeNet5. Specifically, the feature acquisition structure in the network is improved. The number of network layers is deepened, and the number of convolution cores is increased while the batch standardization layer is also added. The number of layers in the network and the number of convolutional nuclei were determined by several experiments. The purpose of deepening the number of network layers and increasing the number of convolution cores is to accurately extract the features of Tibetan characters and obtain details to distinguish more similar characters. Batch-standardized layers accelerate convergence and prevent overfitting.
3.1. Component-Based Character Image Composition
The “Tibetan-Sanskrit” large character set contains 7238 categories of characters, and they are split into parts. Each Tibetan character may consist of one or more components superimposed above and below each other, and each character must contain a base character component, which consists of the Tibetan consonant characters. Zero, one or more upper vowel parts and upper word parts can be superimposed on top of the base character parts, while zero, one or more lower vowel parts and lower word parts can be superimposed below the base character parts, as shown in Figure 2.
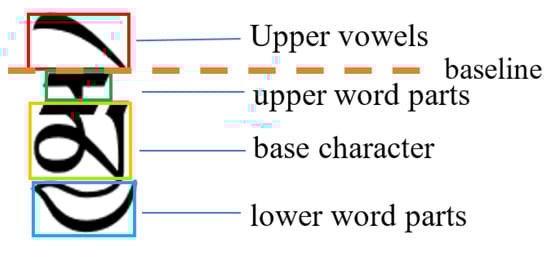
Figure 2.
A diagram of the rules for the construction of Tibetan characters.
A sample of some of the components constructed based on the rules for constructing Tibetan characters is shown in Table 1. The number in the first column of Table 1 represents the starting number of the Tibetan character part in the row, and the number of each part is the sum of the starting number and the column number.

Table 1.
Sample list of selected components.
At present, there is no publicly available sample set of Tibetan ancient Chinese characters in Ugandan script images. In this paper, we use the image samples synthesized from Tibetan historical document characters to assist in training the model and use the obtained model to perform unsupervised recognition of unmarked real Tibetan historical document images. The main idea of the sample synthesis is, firstly, the components in the above table are manually selected from the images of the Tibetan antique documents and saved. Each component is saved as an image file, and each image file can be used as a character component sample. In practice, the number of character parts is unevenly distributed, with some parts appearing extremely frequently, and it is very easy to obtain a sufficient number of character part images, while others appear very infrequently and a small number of parts require data augmentation by randomly rotating the character part images by an angle of less than 10 degrees. In addition, there were a few parts that did not appear in the selected Tibetan document images, and in this case, they were copied by hand by copying and drawing the character parts in the drawing software. Secondly, the components obtained in the first step were stacked in the desired order to obtain a composite sample image of the Tibetan characters. In order to make the composite characters more closely resemble the characters of the Tibetan document image, we also extracted the location information of each Tibetan character component from the printed Tibetan character images, which are the coordinates of the upper left and lower right corners of the character component in the overall character image. Finally, according to the number of synthesized samples required, all characters in the “Tibetan-Sanskrit” large character set are loaded with information on the split structure and position of the components, and the corresponding character components are selected, randomly rotated by less than 5 degrees and output to a rectangular area in the corresponding position of the character component image. This character synthesis method was successfully applied in the literature [23,24]. In this paper, 519 types of samples were synthesized, 1000 for each type. A partial demonstration of the synthesis sample is shown in Figure 3.
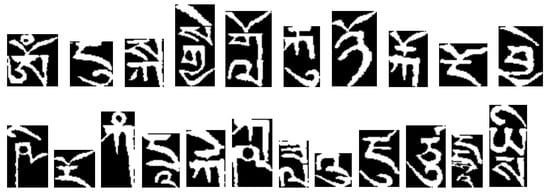
Figure 3.
Selected synthetic samples.
For example, the first character image  in Figure 3 is stacked from top to bottom with three component images

 in accordance with the position information of each component. Compared with real character images
  and
and  —they are basically the same. This also shows that our synthesis method is correct.
in Figure 3 is stacked from top to bottom with three component images in accordance with the position information of each component. Compared with real character images and —they are basically the same. This also shows that our synthesis method is correct.3.2. Baseline-Based Image Sample Composition
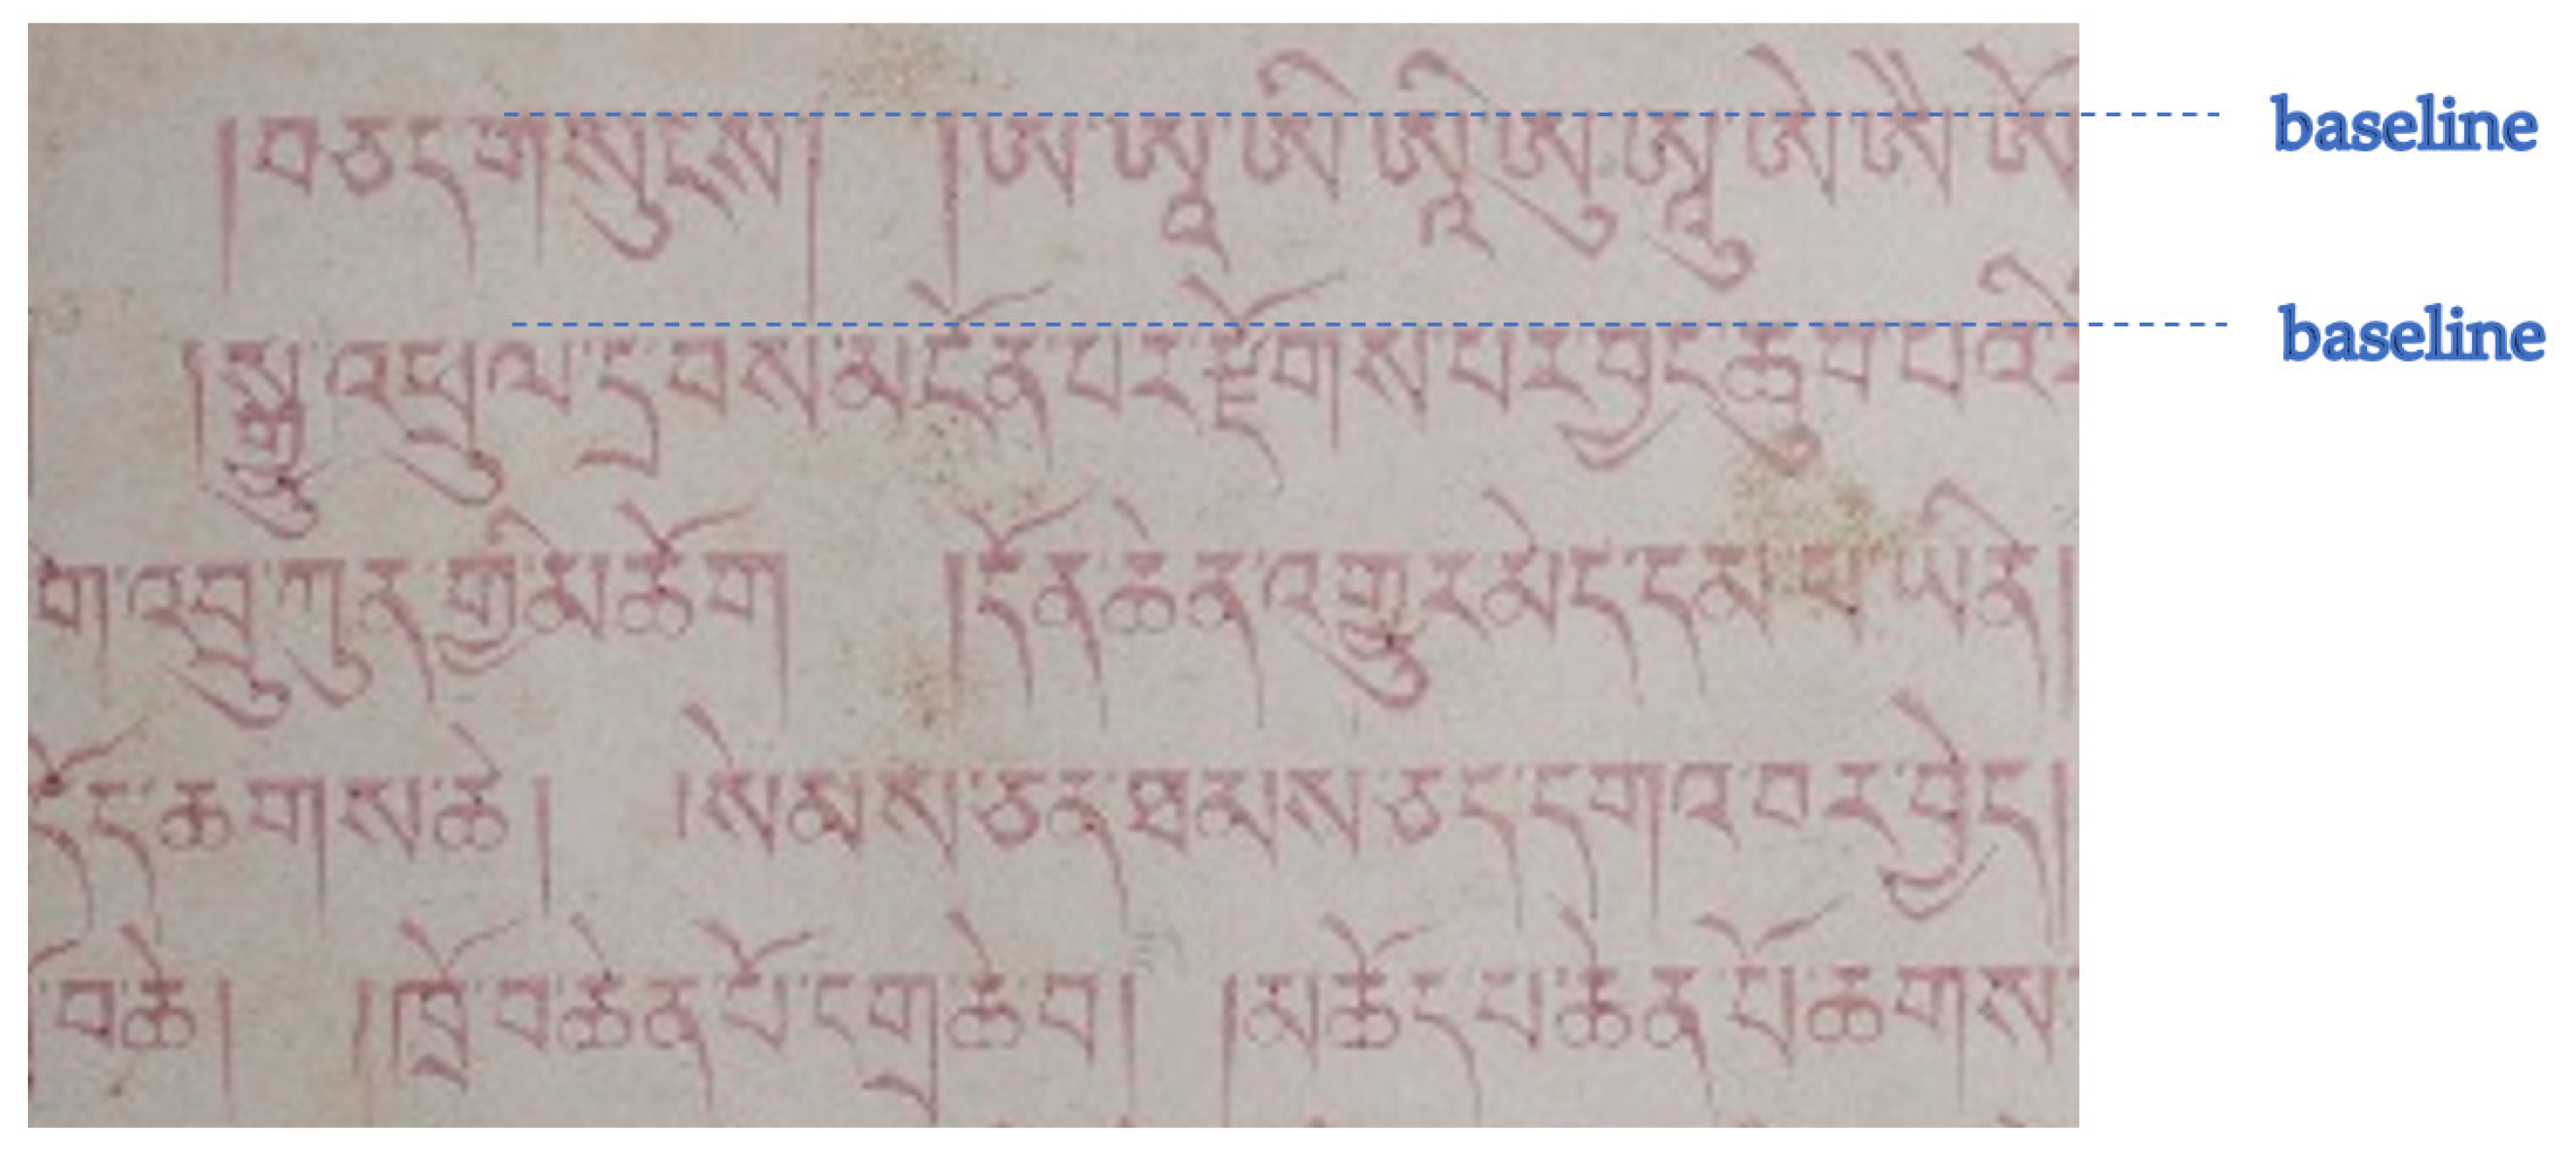
If the top of the base character of a Tibetan character without a superscript is called the head, while for cases with a superscript, the head of the character is the top of the superscript. The ancient Tibetan characters are written horizontally with the heads of each line of characters aligned in the vertical direction, which is shown by the fact that the head of each character is almost always aligned in a straight line, calling this straight line the baseline, as shown in Figure 4.
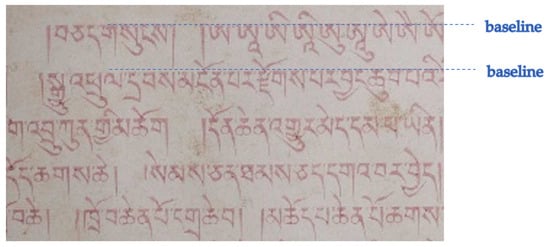
Figure 4.
Images and baseline illustrations of some of the ancient Tibetan documents.
Considering that the baseline is a distinctive feature of the characters, the synthesis of characters was done by dividing the characters above and below the baseline. There are 13 categories of samples above the synthetic baseline, with 70 samples in each category; some samples are shown in Figure 5; there are 273 categories of samples below the synthetic baseline, with 300 samples in each category; some samples are shown in Figure 6.
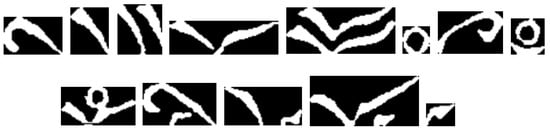
Figure 5.
Selected samples synthesized above baseline.
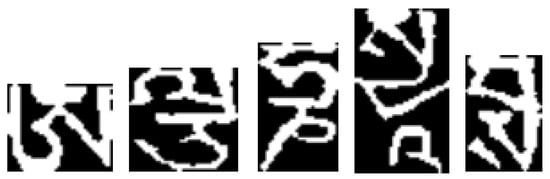
Figure 6.
Selected samples were synthesized below the baseline.
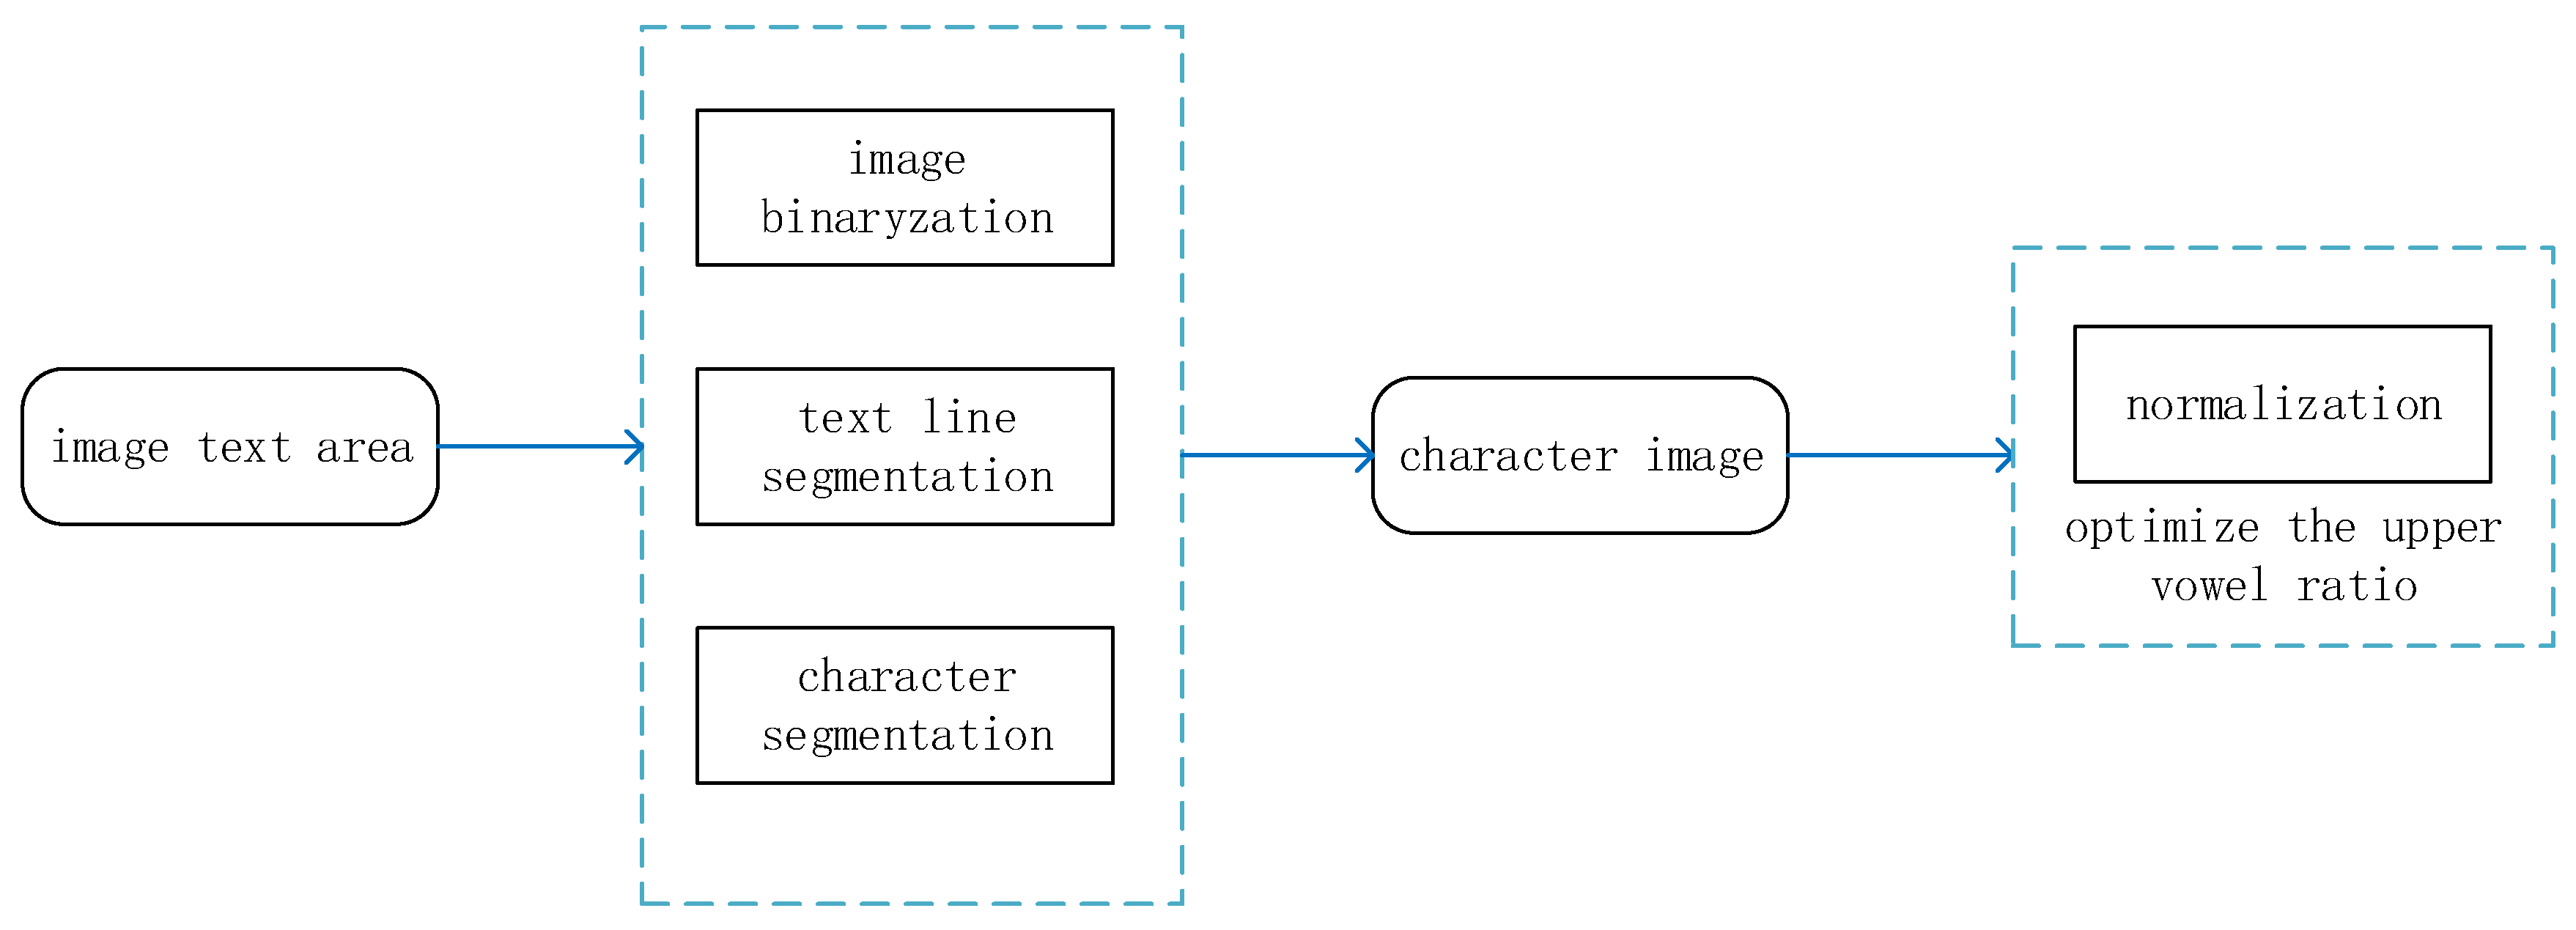
3.3. True Markerless Image Sample Processing
The images of ancient Tibetan documents are binarized, line-sliced and word-sliced to obtain character images. Then, the character image is normalized by optimizing the ratio of the upper vowel. The processing flow is shown in Figure 7.
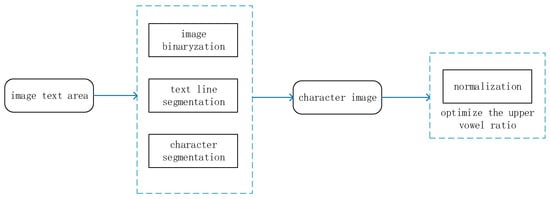
Figure 7.
Sample processing process for Tibetan antiquarian documents.
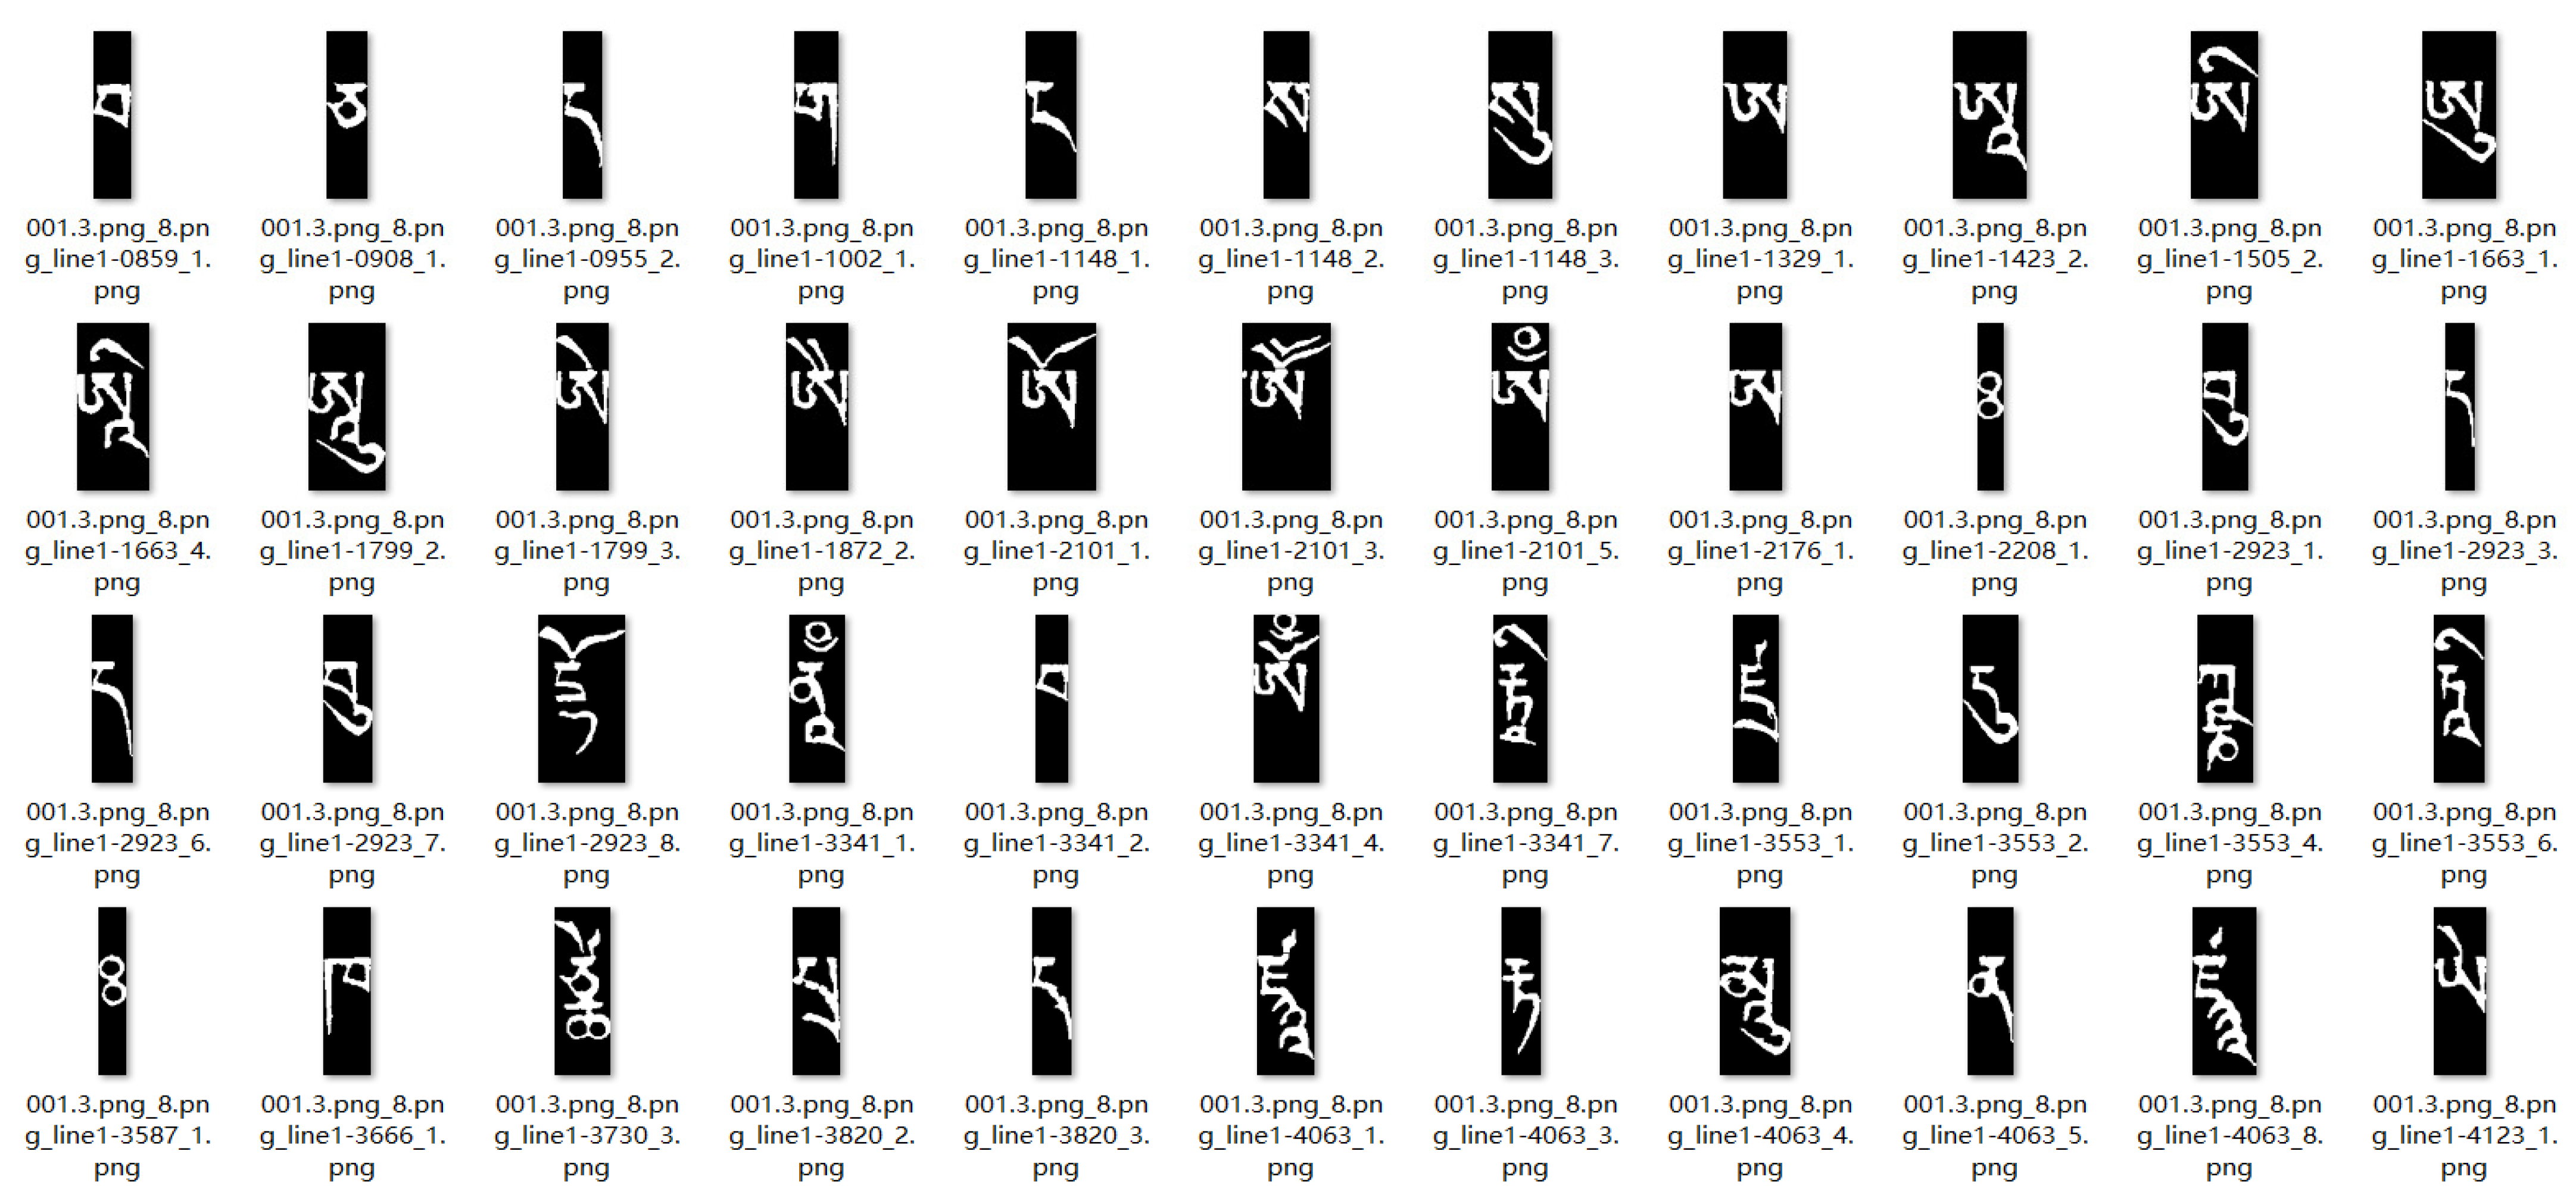
Sample images of authentic ancient Tibetan characters used are from the Beijing edition of The Tripitaka-Kanjur, which contains 106 letters. The project team randomly selected 212 of the pre-processed document images and obtained a total of 1696 lines of text through image pre-processing and line-slicing algorithms. The text line images were then cut to remove special characters such as syllables, full stops and paragraph marks, which are obvious and easy to recognize, and a total of 111,932 correctly cut characters were selected. The images of some of the ancient Tibetan characters after the slice and dice process are shown in Figure 8.
Figure 8.
Sliced images of ancient Tibetan characters.
3.4. Character Image Feature Recognition Methods
In a convolutional neural network, the extraction of features from the data relies heavily on a convolutional layer, and it is the key layer in the overall CNN network structure. The pre-processed character image data is convolved with the input data using a two-dimensional convolution layer and a pooling layer to convolve the convolution kernel. The character images are processed by the convolutional layer with the convolution formula:
where is the character feature after convolution, and is the sequence of convolution kernel functions. The process of CNN processing character images is mainly as follows: input normalized Tibetan character image can extract the feature sequence of different Tibetan characters, using the kernel function sequence to do convolution operation with . The pooling layer reduces the dimensionality of the data, and the fully-connected layer prevents the loss of feature information after data training. The classification layer, on the other hand, classifies the feature data into categories. Using the Relu function as the excitation function, the expression is:
The computational process for the classification layer uses the Softmax layer and is computed as follows:
where is the number of types classified. The output of the classification layer indicates the probability of the character being classified to the corresponding type. Stochastic Gradient Descent (SGD) is used as the training method for CNN.
In this paper, we use a 15-layer CNN structure: the first layer is the image input layer (32 × 64 × 1), the second layer is the convolutional layer (16 3 × 3 convolutional kernels), the third layer is the batch normalization layer, the fourth layer is the ReLU layer, the fifth layer is the maximum pooling layer (2 × 2), the sixth layer is the convolutional layer (32 3 × 3 convolutional kernels), the seventh layer is the batch normalization layer, the eighth layer is the ReLU layer, the ninth layer is the maximum pooling layer (2 × 2), the tenth layer is a convolutional layer (64 3 × 3 convolutional kernels), the eleventh layer is a batch normalization layer, the twelfth layer is a ReLU layer, the thirteenth layer is a fully connected layer, the fourteenth layer is a Softmax layer, and the fifteenth layer is the output layer of classification results. The classified samples are sorted from largest to smallest according to the probability of the classified Softmax layer.
By processing the sample dataset and convolutional neural network model for feature extraction, Up-CNN and Down-CNN recognition models are built for above-baseline samples and below-baseline samples and trained and optimized for above-baseline samples and below-baseline samples, respectively, to achieve classification and recognition of unmarked characters in images of Tibetan ancient documents. The input layer of the Up-CNN is 64 × 32 × 1. The output of the thirteenth to fifteenth layers are all 13-dimensional, corresponding to the 13 classes of the upper vowel category, and the rest of the layer structure is similar to the aforementioned 15-layer CNN structure; The output of the thirteenth to fifteenth layers of the Down-CNN are all 273-dimensional, corresponding to the 273 classes of the below-baseline category, and the rest of the layer structure is the same as the aforementioned 15-layer CNN structure.
4. Experiments
4.1. Experimental Data Set and Experimental Environment
The experimental data set includes two parts: a synthetic image sample data set obtained through component synthesis and a real sample data set obtained by segmenting Tibetan ancient manuscript document images. For commonly used Tibetan ancient manuscript characters, a Tibetan character component synthesis data set was created. The sample set consists of 519 classes, with 1000 samples per class, totaling 519,000 synthetic samples. Based on the character baseline information, synthetic image samples were generated for the parts above and below the baseline of Tibetan ancient manuscript characters. Above the baseline, there are 13 classes of synthetic samples, with 70 samples per class, totaling 910 samples. Below the baseline, there are 273 classes of synthetic samples, with 300 samples per class, totaling 81,900 samples.
Additionally, 111,932 real-character image samples were obtained through segmentation. In the training process, only synthetic samples are used to train the model parameters, and real unlabeled samples are used to test the final model performance. Among these samples, the 519-class samples are used for training the whole-word CNN model. The 13-class samples are used for training the Up-CNN model, and the 273-class samples are used for training the Down-CNN model. These three models are employed for classifying and recognizing the real image samples.
All experiments were conducted in the following software and hardware environment: The CPU used was Intel(R) i9-10885H, with 32 GB of RAM, and the graphics card was NVIDIA GeForce GTX 1650. The operating system was Windows 10 Professional Edition and the software used was MATLAB 2020b.
4.2. Synthetic Sample Identification Performance Analysis
The data set includes real samples obtained from ancient documents and synthesized samples based on components. These two types of samples have similar glyphs but exhibit differences. The real samples have highly imbalanced categories, with significant variations in sample numbers across different categories. In contrast, the synthesized samples have balanced categories with consistent sample numbers. The model is trained using synthetic samples. The trained model is then used to identify unlabeled real samples, obtaining category information for classifying labeled samples. Introducing baseline information effectively improves the accuracy of real sample identification. In order to train the optimized model as well as analyze the sample data for performance, training, experiments and analysis are performed for the synthetic sample set, the above-baseline sample set and the below-baseline sample set. The parameter setting in the experiment is to select an initial value based on the team’s previous research and get it after several parameter adjustment experiments. Under the final parameters, the network convergence is faster, and the recognition rate of Tibetan characters is higher.
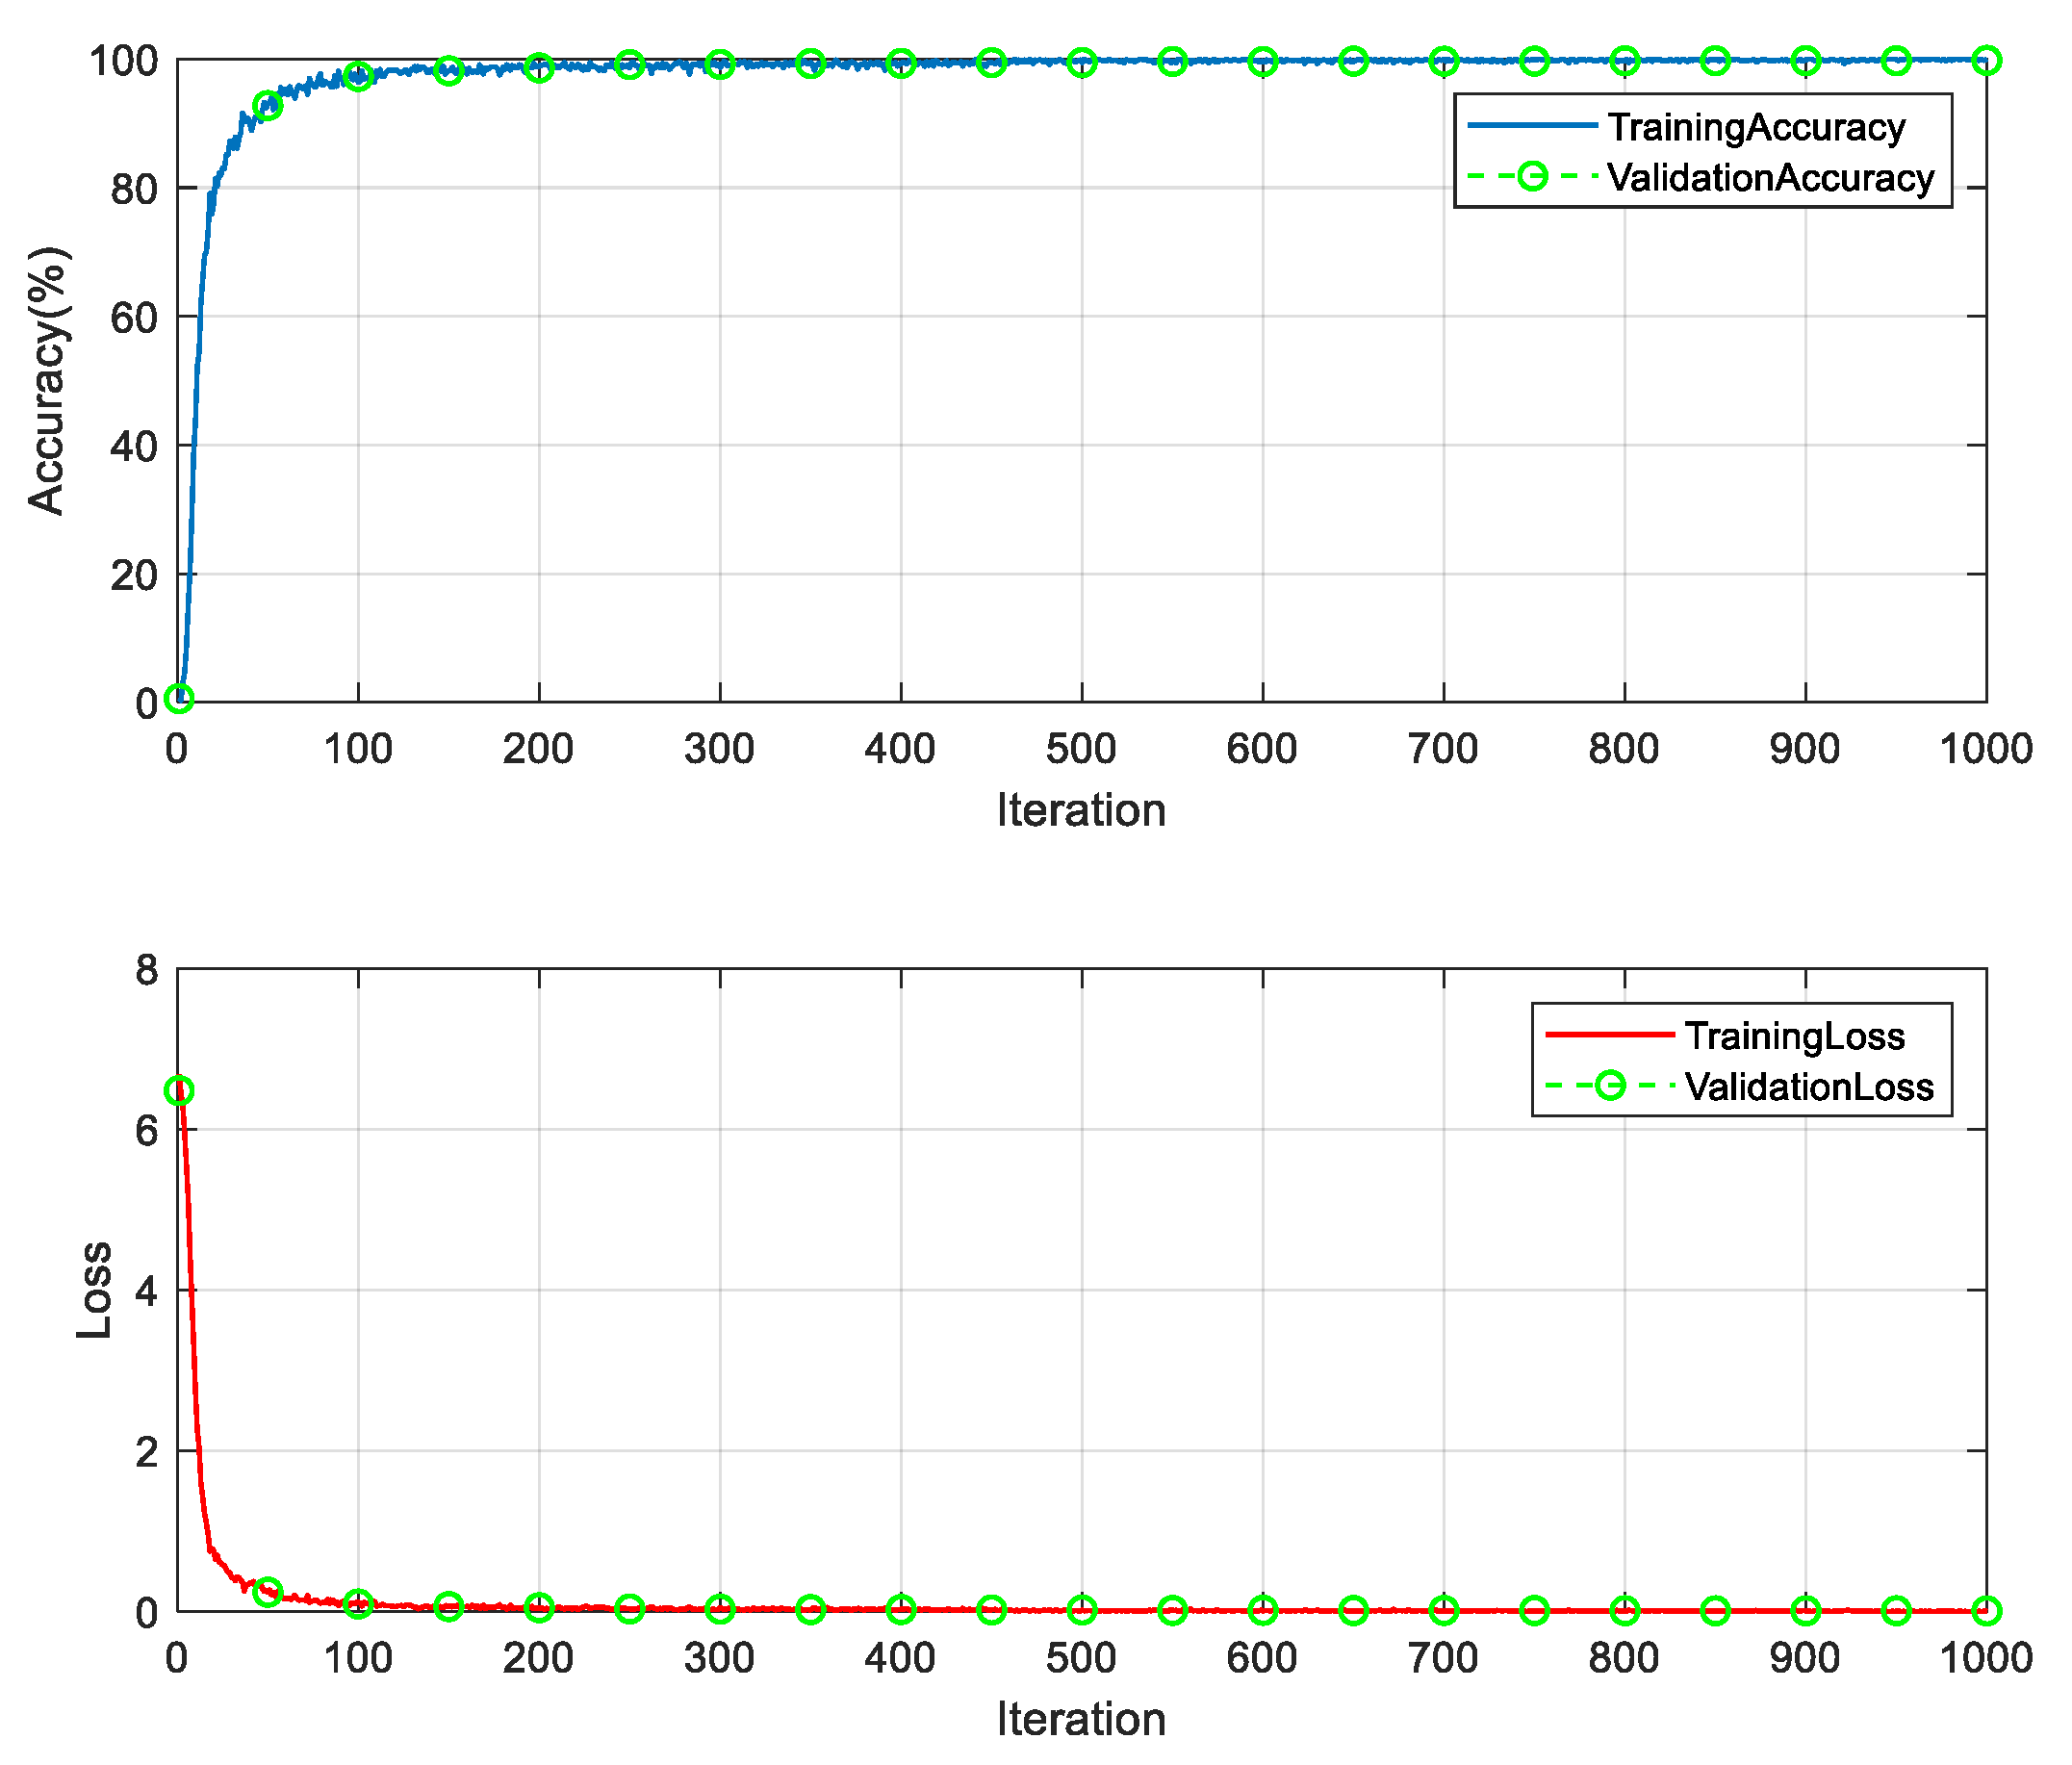
(1) A total of 519 classes of labeled synthetic samples with a high frequency of occurrence are selected. There are 1000 samples in each class. These labeled synthetic samples are used to train the CNN model. The training samples are randomly divided into training, validation, and test sets. The proportions for the division are 70%, 10% and 20% respectively. The following parameter settings were experimentally obtained for better model performance. The optimizer adopts the stochastic gradient descent method. The number of training samples per batch is 800. The initial learning rate is 0.1. The maximum number of training rounds is 10 rounds. In order for the model to converge better to the minimal value point, the dynamic learning rate change method is used. After every two training rounds, the learning rate is adjusted as follows: the learning rate for the current round equals the learning rate from the previous round multiplied by 0.1. The training took 22 min and 22 s; the experimental results are shown in Figure 9.
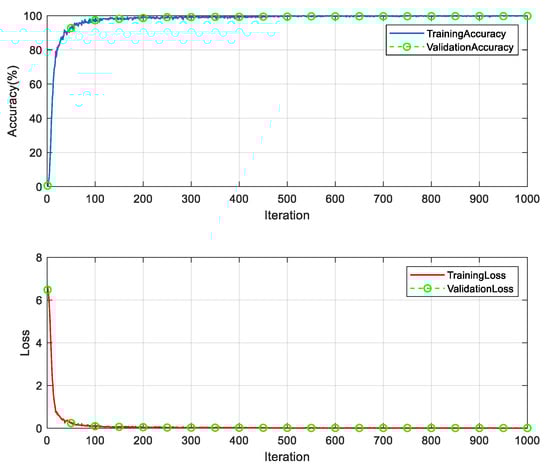
Figure 9.
CNN model training process.
It can be seen from Figure 9 that the proposed model performs well on the synthetic sample set. It reaches stability at about 500 iterations, and the accuracy of the training set is 99.375%. The accuracy of the validation set is 99.458% at the 500th iteration, with a loss of 0.0210 for the training set and 0.0207 for the validation set. The accuracy of the validation set is 99.84%, the accuracy of the test set is 99.80%, and the overall recognition rate of the synthetic data set is 99.93%.
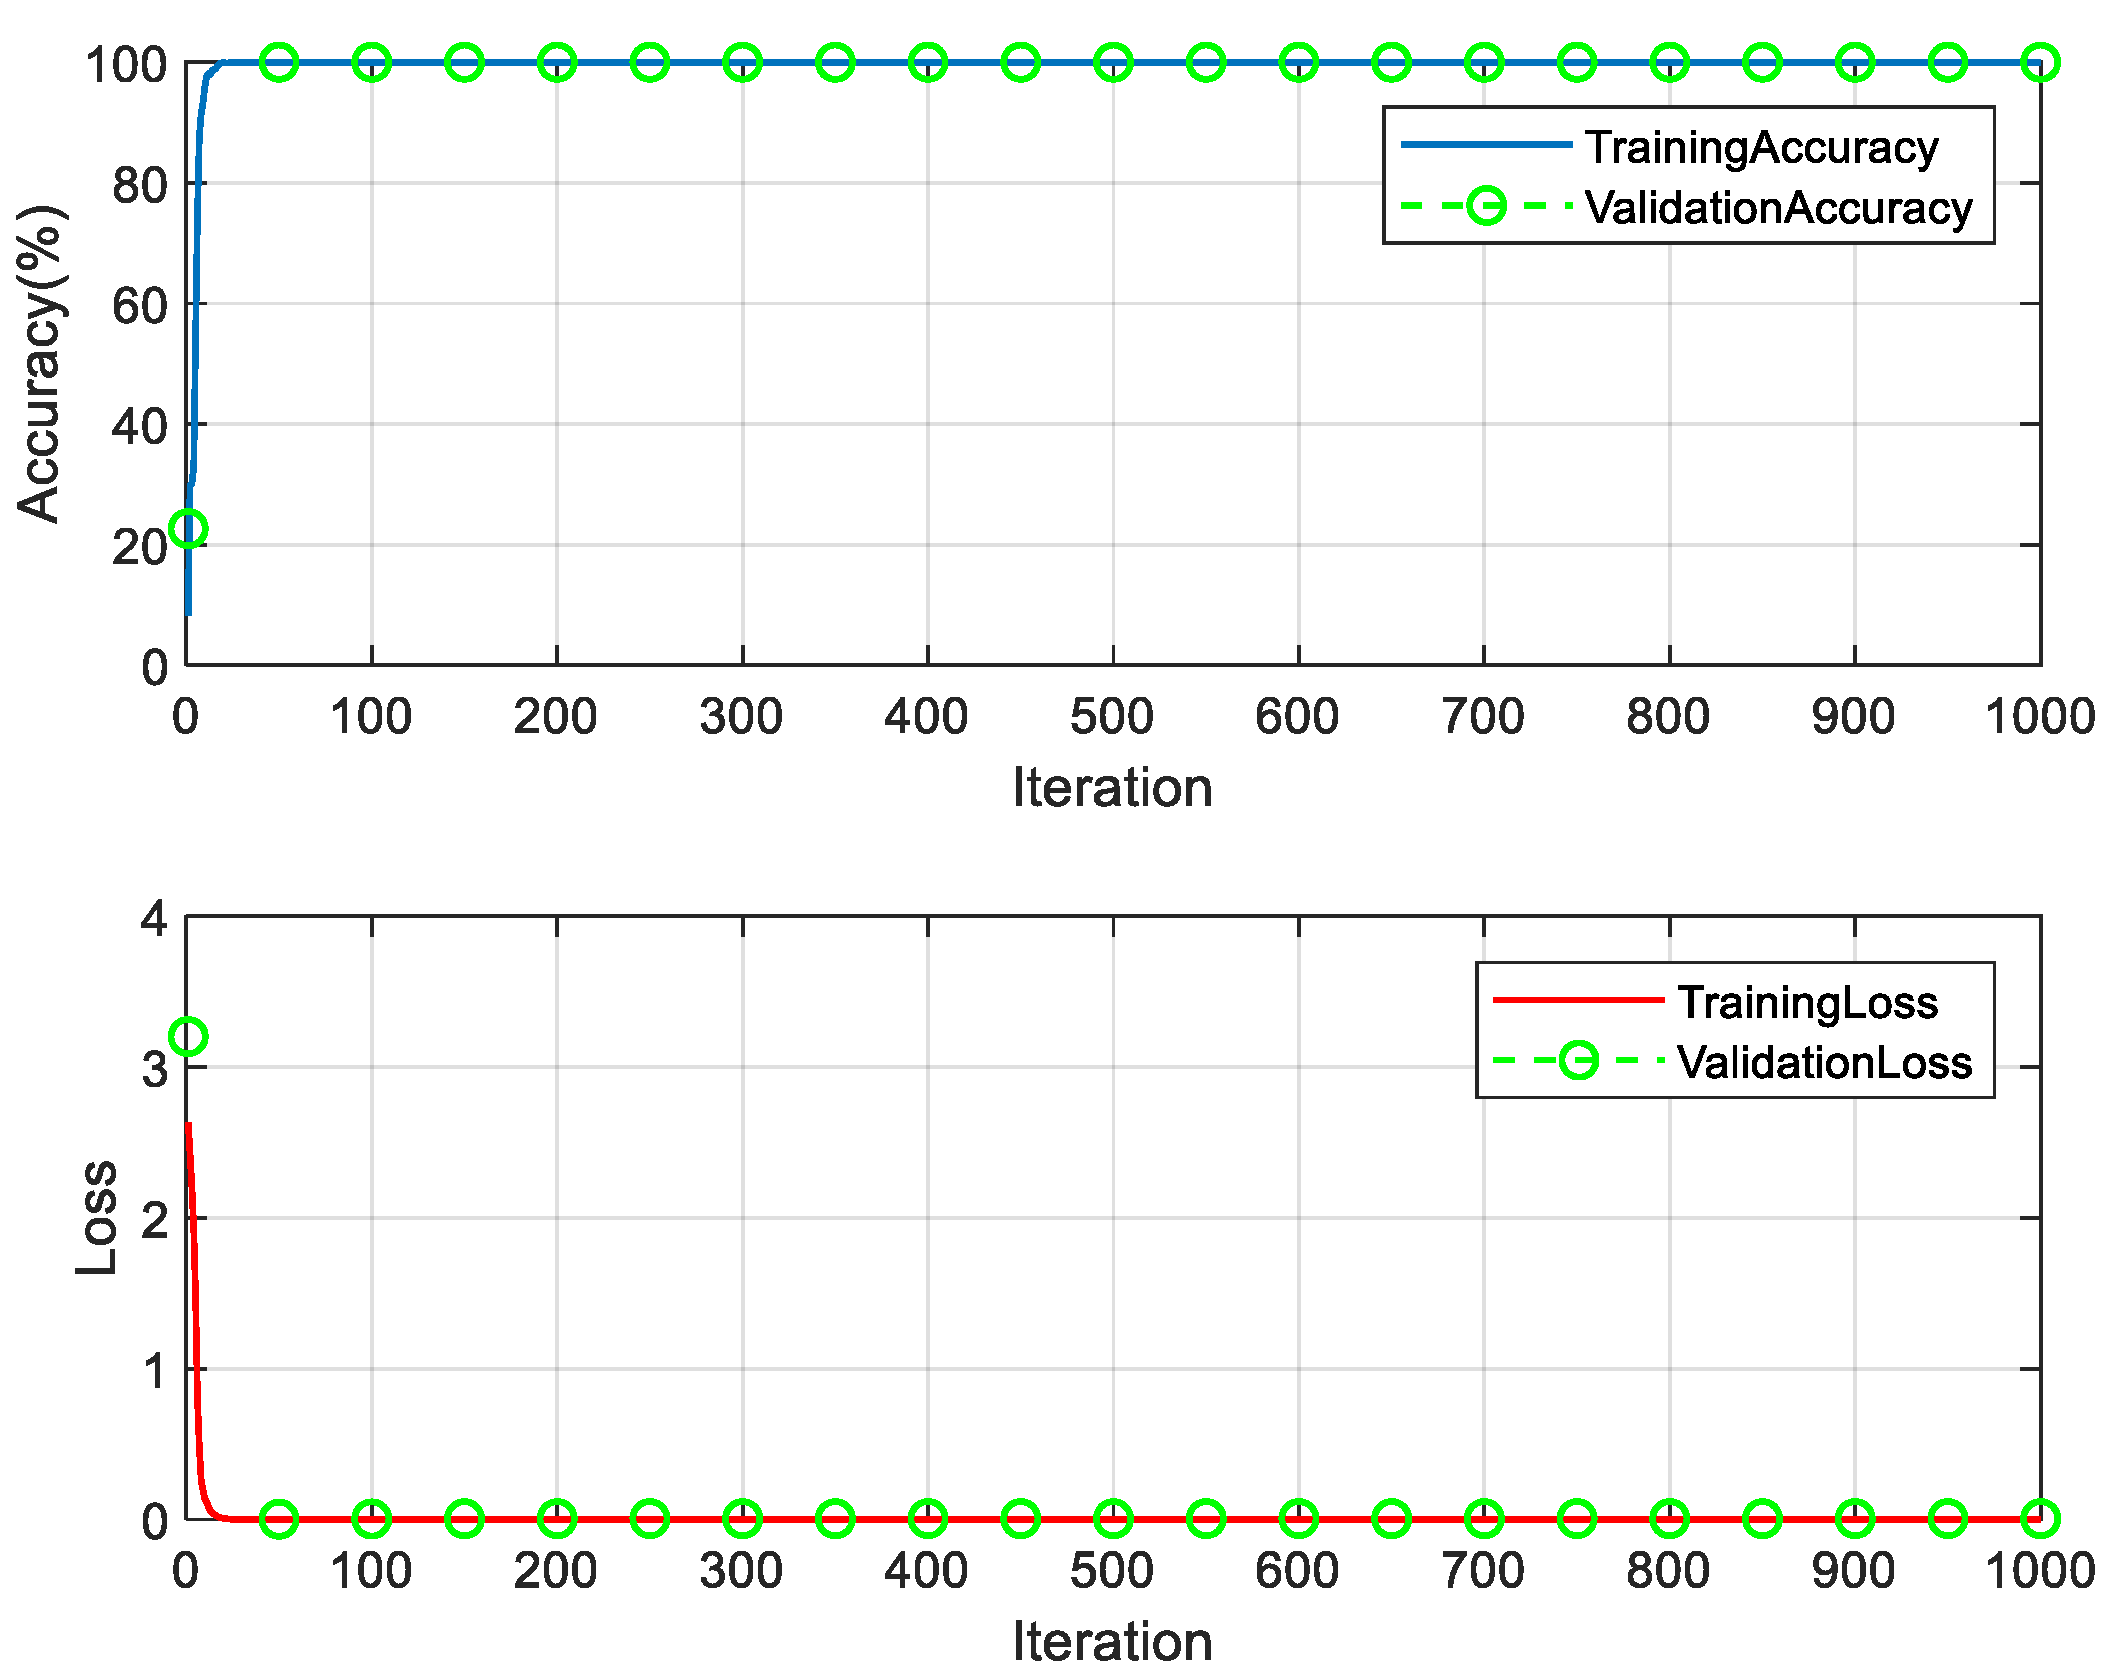
(2) There are 13 classes of above-baseline synthetic samples, 70 of each class, totaling 910, and the recognition model of above-baseline characters (Up-CNN) is trained by the synthetic above-baseline samples. The samples were randomly divided into training, validation and test sets with the proportions of 70%, 10% and 20%, respectively. The experimental parameters are set as follows: random gradient descent, the number of samples per batch is 1000, the initial learning rate is 0.1, the maximum number of rounds is 1000, and the learning rate changes with the number of iterations in segments. The specific variation rule is used for every 150 rounds of training, and the learning rate = learning rate of the previous round * 0.1. The training took 3 min and 15 s, and the experimental results are shown in Figure 10.
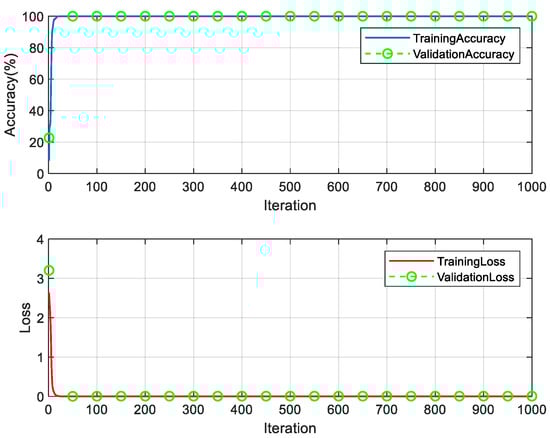
Figure 10.
Up-CNN model training process.
It can be seen from Figure 10 that it stabilizes at about 24 iterations, the recognition accuracy of the training set of the 24th iteration is 100%, the recognition rate of the validation set is 100%, the loss of the training set is 0.0021, and the loss of the validation set is 0.0032. For synthetic samples above baseline, the validation set recognition accuracy of the Up-CNN model was 100%, and the recognition rate of the test set was 98.43%. The overall recognition rate of synthetic datasets above baseline was 99.69%.
(3) There are 273 classes of synthetic samples below baseline, 300 of each class, a total of 81,900, and the recognition model of characters below baseline (Down-CNN model) is trained by the synthesized below-baseline samples. The samples were randomly divided into a training, validation and test sets with proportions of 70%, 10% and 20%, respectively. The experimental parameters are set to: stochastic gradient descent, the number of samples per batch is 800, the initial learning rate is 0.1, the maximum number of rounds is 10 rounds, and after each two rounds of training, the learning rate = the previous round of learning rate * 0.1. The training took 5 min and 31 s, and the experimental results are shown in Figure 11.
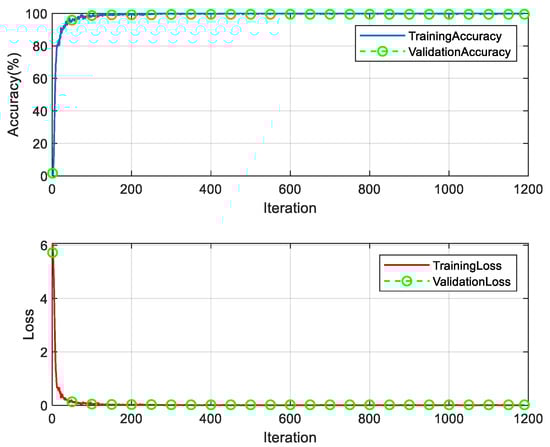
Figure 11.
Down-CNN model training process.
It can be seen in Figure 1 that the stability is reached at about 300 iterations, the recognition accuracy of the training set is 99.875%, and the recognition accuracy of the validation set is 99.3773% at the 300th iteration. The loss in the training set is 0.0073, and the loss in the validation set is 0.0217. The recognition accuracy of the Down-CNN model is 99.48% in the validation set and 99.45% in the test set. The overall recognition accuracy of the synthetic dataset below the baseline is 99.77%.
4.3. Effect and Analysis of Character Vowel Size
In the process of writing a Tibetan historical document, it is not completely written by a single person but by multiple people working together. Everyone’s writing style is different, and there are a large number of Tibetan characters whose upper vowel part of the image is wider than the part below the baseline. Experiments show that, in this case, the recognition rate is not high because the samples are directly fed into the model for recognition, and it is necessary to normalize the upper vowel (as shown in Figure 12) to improve the recognition rate.
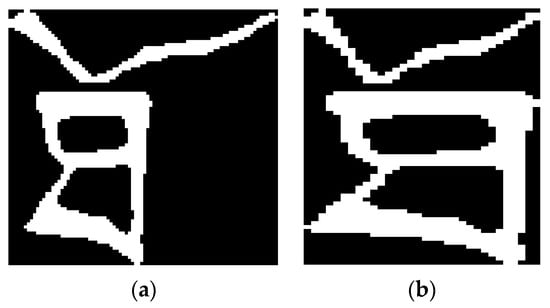
Figure 12.
ཐོ diagram of comparison before and after vowel normalization on character samples. (a) Before normalization. (b) After normalization.
When size normalization is performed for upper vowels, the proportion of upper vowels significantly affects the recognition rate. We first performed an experimental analysis for the ‘ཐོ’ character sample in Figure 12; the results are shown in Table 2.
Table 2.
Comparison of recognition before and after normalization of vowels on ‘ཐོ’ characters.
From Table 2, we can see that the vowel of the ‘ཐོ’ character sample was incorrectly identified as ‘ཇོ’ before normalization with a Top1 probability of 84.6%, and correctly identified after normalization with a Top1 probability of 87.49% were identified as ‘ཐོ’. The information entropy of the image before normalization is 0.71, and the information entropy of the image after normalization is increased to 0.93. Since the character images used are white as the foreground color and black as the background color, the information of the characters is expressed as white pixels, and for the images without upper vowel normalization, there is a larger part of the area that is background color, and this area does not carry the information features of the characters. This part of the image, through the convolutional neural network when training recognition, consumes more operations and storage. However, this part of the calculation and the results do not obtain the character feature information. Through the normalization of the upper vowel size, it can reduce the background information in the image, representing the character white detail information amplified. In this way, the calculation can obtain more information related to the character features. The experiment shows that the recognition accuracy will be higher if the ratio of upper vowels is reduced and the information entropy of the image is increased.
In order to determine under what conditions the normalization of the upper vowel leads to the highest recognition rate of the recognition system, experiments were performed with different upper vowel proportions. For all character sample data sets, the upper vowel normalization experiment was carried out on the character images with the upper vowel above and below the baseline. In order to obtain the character upper and lower ratio thresholds that make the best recognition rate, this paper selects different proportion threshold values for normalization training recognition and analyzes the recognition rate. The results are shown in Table 3.
Table 3.
Recognition rates correspond to different proportional thresholds.
As can be seen from Table 3, with the increase of the selected proportion threshold, the recognition rate decreases gradually. When the selected proportion threshold is 1, the recognition rate is the highest. The overall recognition rate is 84.88%, 2.63% higher than the original CNN network. It is analyzed that the normalization of the upper vowel can increase the entropy of character information on the image. It helps to improve the recognition rate. On the other hand, in the synthesis process, the position coordinates and component sizes of the synthesized samples as training sets refer to the printed character images. The size of each part of the printed image is more uniform, and the upper vowel will not be too large. Through the reduction and normalization of the vowel part on the real Tibetan historical document character image, the real character image is more like the synthetic character image. Specifically, it is to make the real character image closer to the composite character image from the internal component structure characteristics. The classification results are closer to the correct classification, thus improving the recognition rate of unlabeled real samples.
4.4. Overall Performance Analysis
There are two factors that affect the overall performance of the model. On the one hand, although the synthetic and real samples are similar, they are not completely consistent. Because the synthesis process of the synthetic sample itself is the result of the stacking of the images of the upper and lower parts, the location information of each part of the real sample is not completely consistent with the location information of the synthetic sample. In order to reduce this inconsistency, the character image can be divided into the upper and lower parts and identified separately. On the other hand, there are great similarities between different Tibetan characters, which also poses challenges for recognition models. The model determines the classification according to the calculated probability. If the probability corresponding to the preferred character is close to the probability of the second-selected character, it indicates that the characteristics of the preferred character and the second-selected character are close and the font is similar. If the identification result is based on the preferred character, it will likely be wrong. At this time, fine-grained features need to be further extracted before recognition; that is, the characters are divided into upper and lower parts for feature extraction.
However, the experiment also shows that the recognition rate is not the highest when all the character images are recognized by splitting up and down. To determine when to split a character image, we use a probability threshold to control whether to split or not. The probability threshold is defined as the ratio of the probability corresponding to the preferred character (denoted as Max1) to the probability corresponding to the second selected character (denoted as Max2). In order to improve the overall recognition performance, the influence of proportional threshold parameters on the recognition rate is analyzed in the experiment. In order to obtain a suitable probability threshold, we first roughly selected probability thresholds of different orders of magnitude for the experiment. Initially, the threshold range is determined. Then, this threshold range is subdivided to finally determine the appropriate threshold. The initial selection of probability thresholds includes 2, 10, 50, 100, 200, 500 and 1000. The results are shown in Table 4.
Table 4.
Top1 recognition rates corresponding to different proportional thresholds and probability thresholds.
As can be seen from Table 4, the recognition rate is higher for different probability threshold cases with upper vowel ratio thresholds of 1 and 1.1. The recognition rate is higher for probability thresholds between 10 and 100 under different upper vowel proportion thresholds. This determines the range in which the optimal threshold is located. In order to get the accurate optimal threshold, the experiment is carried out after further subdividing the threshold range. Further experimental calculations lead to optimal probability thresholds: First, the proportional thresholds are fixed to the two values that make the preferred accuracy higher, i.e., an upper vowel proportional threshold of 1.0 and an upper vowel proportional of 1.1. Then, eight values are selected between 10 and 100, which are 10, 15, 18, 20, 30, 40, 50 and 60 in order. Finally, the model was used to identify and compare the preferred recognition rate of 11,1932 real Tibetan historical document character image sample sets under the corresponding proportional threshold and probability threshold.
Through the experimental analysis, it can be seen from Table 5 that the Top1 accuracy reaches the highest value of 87.27% when the proportional threshold is 1.0 and the probability threshold takes the value of 20.
Table 5.
Top1 recognition rates corresponding to probability thresholds 10–60 for proportional thresholds of 1.0 and 1.1.
To further illustrate the performance of the method in this paper, we compared it with SVM and single CNN methods and analyzed the performance of the method in this paper under different parameter environments. In the experiment, the model cross-validation method is the method of sample random division. The samples are randomly divided into training, verification and test sets. The comparison results of the three methods are shown in Table 6.
Table 6.
The recognition accuracy of different methods.
As can be seen from Table 6, the Top1, Top5 and Top10 recognition rates of the model method (UD-CNN) in this paper are higher than those of other methods. The method introduces a proportional threshold and probability threshold in the recognition process. This enables the extraction of features from the Tibetan character images as a whole, above the baseline and part of the images below the baseline. It improves the recognition rate of the sample set of authentic Tibetan ancient character images.
In order to show the recognition effect of the proposed model, the recognition results of three-character images by different algorithms are given, as shown in Table 7.
Table 7.
Identification results of different methods.
As can be seen from Table 7, the recognition results of the proposed model for the three character images are correct, while the recognition results of the SVM and Single CNN models are wrong. The wrong result is similar to the correct result font. The proposed algorithm can obtain finer-grained distinguishing features of character images by splitting them up and down so that the final recognition result is correct.
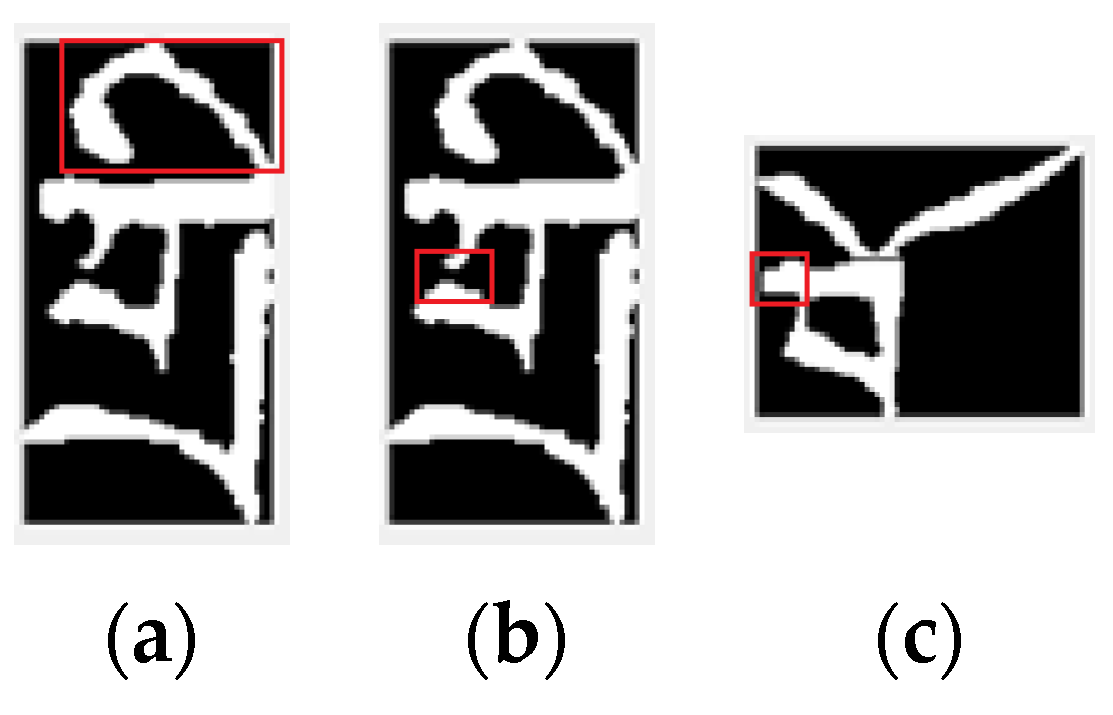
In addition, the real images of Tibetan characters are segmented from the images of historical documents. Due to the influence of noise and binarization algorithm, the real Tibetan character image itself contains noise information, including the edge of the stroke is not smooth, some strokes are missing, redundant strokes, etc., and some characters and images are mixed in a variety of situations, as shown in Figure 13.

Figure 13.
Some Tibetan character images contain noise. (a) The edges of the strokes are not smooth. (b) some strokes are missing. (c) the strokes are redundant.
This noise phenomenon is inevitable. The above recognition rate of the model is obtained on the real images containing noise, which also shows that our proposed model has strong anti-noise ability. In order to further illustrate the anti-noise ability of the proposed algorithm, we added Gaussian noise (mean 0, variance 0.01) to the real images, and the recognition rate of the proposed model for the character images with the new noise only decreased a little, and the Top1 only decreased by 0.25%. This shows that our algorithm has good anti-noise ability.
The above experiments show that for Tibetan characters that can be split up and down, the recognition rate will be improved if some characters are divided above and below the baseline. Although the UD-CNN network is proposed for the special properties of Tibetan characters, we also believe that it can be enlightening for other recognition methods that can be separated up and down or left and right of the characters.
5. Summary and Outlook
At present, there are no public, marked samples of images of Tibetan historical document characters. This paper proposed an unsupervised recognition method of Tibetan historical document character images based on deep learning. Based on the Tibetan historical document character components, the sample data of Tibetan historical document character images are constructed. The character baseline information is introduced so as to propose a fine-grained feature learning strategy. Up-CNN recognition models and Down-CNN recognition models are built for above-baseline samples and below-baseline samples. Both models converge well on the experimental data set. The network model parameters are obtained by training the network with multiple auxiliary sample sets. In the absence of real labeled samples, the preferred recognition accuracy of the proposed method reaches 87.27%, which can meet the practical application requirements. Using this model, the classification tagging of real character images cut from ancient Tibetan documents was completed, and a dataset containing a total of 111,932 real character images of 409 classes of ancient Tibetan documents was built. These works provide the data basis for improving the recognition rate by building a supervised model at a later stage. There are a large number of similar characters in the Tibetan historical document, which will affect the recognition effect. It is necessary to study the feature extraction and recognition methods of Tibetan similar characters in the later stage. This can further improve the recognition rate of Tibetan historical document character images.
Author Contributions
Conceptualization, X.W. and W.W.; methodology, X.W.; software, X.W.; validation, X.W.; formal analysis, X.W.; resources, X.W. and W.W.; data curation, X.W.; writing—original draft preparation, X.W. and W.W.; writing—review and editing, X.W.; visualization, X.W.; supervision, X.W. and W.W. All authors have read and agreed to the published version of the manuscript.
Funding
This research was funded by Gansu Provincial Science and Technology Plan Natural Science Foundation grant number 22JR5RA187, Gansu Provincial Science and Technology Plan Foundation grant number 23YFGA0072, and the Fundamental Research Funds for the Central Universities of Northwest Minzu University grant number 31920230065.
Institutional Review Board Statement
Not applicable.
Informed Consent Statement
Not applicable.
Data Availability Statement
The data presented in this study are available on request from the corresponding author. The data are not publicly available due to privacy.
Conflicts of Interest
The authors declare no conflicts of interest.
References
- A’gui, D. Review of Inheriting, Preserving and Digitization of Tibetan Classics. Tibet. Stud. 2017, 4, 137–145. [Google Scholar]
- Tamhankar, P.A.; Masalkar, K.D. A novel approach for character segmentation of offline handwritten Marathi documents written in MODI script. Procedia Comput. Sci. 2020, 171, 179–187. [Google Scholar] [CrossRef]
- Lyu, P.; Liao, M.; Yao, C.; Wu, W.; Bai, X. Mask textspotter: An end-to-end trainable neural network for spotting text with arbitrary shapes. In Proceedings of the European Conference on Computer Vision (ECCV), Munich, Germany, 8–14 September 2018; pp. 67–83. [Google Scholar]
- Hilin, Y. The Recognition and Detection of Chinese Characters in Historical Document Based on Deep Learning; South China University of Technology: Guangzhou, China, 2019. [Google Scholar]
- Brodt, K.; Rinchinov, O.; Bazarov, A.; Okunev, A. Deep learning for the development of an OCR for old Tibetan books. In Proceedings of the Bioinformatics of Genome Regulation and Structure/Systems Biology (BGRS/SB-2022), Novosibirsk, Russia, 4–8 July 2022; p. 1086. [Google Scholar]
- Cairangdangzhi. Research on Tibetan Ugin Printing Recognition Technology Based on Syllable Segmentation; Qinghai Normal University: Qinghai, China, 2020. [Google Scholar]
- Ying, Z. Design and Analysis of Tibetan Recognition System Based on the Improved Algorithm of Convolution Neural Network; Jilin University: Changchun, China, 2018. [Google Scholar]
- Kojima, M.; Kawazoe, Y.; Kimura, M. Automatic Character Recognition for Tibetan Script using Logic Analysis. J. Indian Buddh. Stud. (Indogaku Bukkyogaku Kenkyu) 1992, 41, 380–383. [Google Scholar] [CrossRef]
- Kojima, M.; Akiyama, Y.; Kawazoe, Y.; Kimura, M. Extraction of characteristic features in Tibetan wood-block editions. J. Indian Buddh. Stud. (Indogaku Bukkyogaku Kenkyu) 1994, 42, 866–869. [Google Scholar] [CrossRef]
- Masami, K.; Chikako, N.; Takanobu, K.; Yoko, A.; Yoshiyuki, K. Recognition of similar characters by using object oriented design printed Tibetan dictionary. Trans-Actions IPSJ 1995, 36, 23042307. [Google Scholar]
- Hedayati, F.; Chong, J.; Keutzer, K. Recognition of Tibetan wood block prints with generalized hidden Markov and kernelized modified quadratic distance function. In Proceedings of the 2011 Joint Workshop on Multilingual OCR and Analytics for Noisy Unstructured Text Data, Beijing, China, 17 September 2011; pp. 1–14. [Google Scholar]
- Li, Z.; Wang, W.; Cai, Z. Historical document image binarization based on edge contrast information. In Advances in Computer Vision: Proceedings of the 2019 Computer Vision Conference (CVC), Las Vegas, NV, USA, 2–3 May 2019; Springer International Publishing: Cham, Switzerland, 2020; Volume 11, pp. 614–628. [Google Scholar]
- Duan, L.; Zhang, X.; Ma, L.; Wu, J. Text extraction method for historical Tibetan document images based on block projections. Optoelectron. Lett. 2017, 13, 457–461. [Google Scholar] [CrossRef]
- Zhang, X.Q.; Ma, L.L.; Duan, L.J.; Liu, Z.Y.; Wu, J. Layout analysis for historical Tibetan documents based on convolutional denoising autoencoder. J. Chin. Inf. Process. 2018, 32, 67–73. [Google Scholar] [CrossRef]
- Ma, L.; Long, C.; Duan, L.; Zhang, X.; Li, Y.; Zhao, Q. Segmentation and recognition for historical Tibetan document images. IEEE Access 2020, 8, 52641–52651. [Google Scholar] [CrossRef]
- Zhou, F.; Wang, W.; Lin, Q. A novel text line segmentation method based on contour curve tracking for Tibetan historical documents. Int. J. Pattern Recognit. Artif. Intell. 2018, 32, 1854025. [Google Scholar] [CrossRef]
- Hu, P.; Wang, W.; Li, Q.; Wang, T. Touching text line segmentation combined local baseline and connected component for Uchen Tibetan historical documents. Inf. Process. Manag. 2021, 58, 102689. [Google Scholar] [CrossRef]
- Li, Z.; Wang, W.; Chen, Y.; Hao, Y. A novel method of text line segmentation for historical document image of the uchen Tibetan. J. Vis. Commun. Image Represent. 2019, 61, 23–32. [Google Scholar] [CrossRef]
- Zhao, Q.; Ma, L.; Duan, L. A touching character database from Tibetan historical documents to evaluate the segmentation algorithm. In Pattern Recognition and Computer Vision: First Chinese Conference, PRCV 2018, Guangzhou, China, 23–26 November 2018; Proceedings, Part IV 1; Springer International Publishing: Cham, Switzerland, 2018; pp. 309–321. [Google Scholar]
- Li, Z.; Wang, W.; Wang, Y.; Zhang, Q. Character recognition of Tibetan Historical document in Uchen font: Dataset and bench mark. J. Comput. Methods Sci. Eng. 2022, 22, 1779–1794. [Google Scholar] [CrossRef]
- Xia, W.; Kha, S.; Ji, Z. Tibetan handwritten numeral recognition based on convolutional neural network. Mod. Electron. Tech. 2019, 42, 79–82+86. [Google Scholar]
- Renqingdongzhu. Tibetan Ancient Book Woodcut Character Recognition Based on Deep Learning; Tibet University: Lhasa, China, 2021. [Google Scholar]
- Zhenjiang, L. Research on Wood Blocked Tibetan Historical Document Analysis and Recognition in Uchen Font; Northwest Minzu University: Lanzhou, China, 2019. [Google Scholar]
- Ji, F. Study on the Construction of Online Handwritten Sanskrit Tibetan Sample Database and Related Problems; Northwest Minzu University: Lanzhou, China, 2016. [Google Scholar]


Disclaimer/Publisher’s Note: The statements, opinions and data contained in all publications are solely those of the individual author(s) and contributor(s) and not of MDPI and/or the editor(s). MDPI and/or the editor(s) disclaim responsibility for any injury to people or property resulting from any ideas, methods, instructions or products referred to in the content. |
© 2024 by the authors. Licensee MDPI, Basel, Switzerland. This article is an open access article distributed under the terms and conditions of the Creative Commons Attribution (CC BY) license (https://creativecommons.org/licenses/by/4.0/).