
Ultra-Short-Term Photovoltaic Power Generation Prediction Based on Hunter–Prey Optimized K-Nearest Neighbors and Simple Recurrent Unit

Abstract
1. Introduction
- In the process of data anomalies, KNN is proposed to be used to process outliers in the data, and the HPO algorithm is used to optimize the KNN parameters. The ablation experiment proves that KNN can solve the problem of the data anomaly and improve the accuracy of prediction.
- Utilizing the preprocessed data, relevant prior knowledge and the efficient, parallel-computable network SRU, we construct and train the HPO-KNN-SRU prediction model for photovoltaic power prediction. By comparing with SVR, LSTM, the TCN and the SRU, this method can achieve higher prediction accuracy.
- The ablation experiments confirm that the advanced intelligent optimization algorithm HPO, applied to optimize KNN parameters and SRU parameters, not only improves the accuracy but also solves the randomness and subjectivity in parameter setting.
2. Materials and Methods
2.1. Data Description and Preprocessing
2.2. Sliding Time Window Selection
2.3. Feature Selection
2.4. HPO Optimization Algorithm
2.5. HPO-KNN Outlier Detection
- Collect historical photovoltaic power data and perform corresponding preprocessing.
- Parameter initialization: Initialize the parameters of the HPO algorithm, including the number of search agents N and the maximum number of iterations T, and set the upper and lower boundaries of the HPO algorithm and mapping them to the upper and lower bounds of the KNN parameters n_neighbors and contamination.
- Obtain the initial optimal fitness value through SRU training and prediction.
- Adjust the positions of the hunters and prey according to the rules of the HPO, simultaneously updating the fitness values of members whose positions have been adjusted.
- Obtain the best solution to the problem and output the optimal parameters for the KNN. Use these optimal parameters for outlier detection.
2.6. HPO-SRU Training
- Standardize the data processed with outliers, normalize the entire dataset to [0, 1], and divide it into a training set and a test set according to the ratio of 8:2.
- Parameter initialization: Initialize the parameters of the HPO algorithm, including the number of search agents N and the maximum number of iterations T, and set the upper and lower boundaries of the HPO algorithm and map them to the upper and lower bounds of the SRU parameters’ hidden size, learning rate, network layers, and batch size.
- Obtain the initial optimal fitness value through SRU training and prediction.
- Adjust the positions of the hunters and prey according to the rules of the HPO, simultaneously updating the fitness values of members whose positions have been adjusted.
- Obtain the best solution to the problem and output the optimal parameters of the SRU. Build a model using the optimal parameters for prediction.
2.7. HPO-KNN-SRU Construction of the Predictive Model
- Initialize the HPO algorithm population.
- Determine the n_neighbors and contamination of the KNN and the hidden size, learning rate, network layers, and batch size of the SRU, which need to be solved by the HPO algorithm.
- Train and test the HPO-KNN, use different parameters to process the data as outliers. The SRU model is used as the control experiment, and the Mean Absolute Error (MAE) is returned to the HPO to update the optimal solution of the population. Finally, obtain the minimum fitness value achieved by the HPO-optimized model and process the data as outliers.
- Train and test the HPO-SRU model, and use different parameters to train and validate the exception processed data. MAE is returned to the HPO as the fitness value to update the best solution to the population. Finally, under the HPO, the optimization model is obtained and the optimal parameter combination model is obtained.
- Construct the HPO-KNN-SRU model for final prediction.
2.8. Parameter Configuration
- SVR: c = 10, gamma = 0.01, kernel = rbf
- LSTM: learn rate = 0.005, hidden size = 32, batch size = 128, number of layers = 1, optimizer = adam, loss function = MSE
- TCN: channels = [32, 64, 8], kernel sizes = 3, dilation = [1, 2, 4], optimizer = adam, loss function = MSE
- SRU: learn rate = 0.001, hidden size = 64, batch size = 64, number of layers = 1, optimizer = adam, loss function = MSE
2.9. Evaluation Metrics
2.10. Experimental Environment
3. Results and Discussion
3.1. Experimental Results
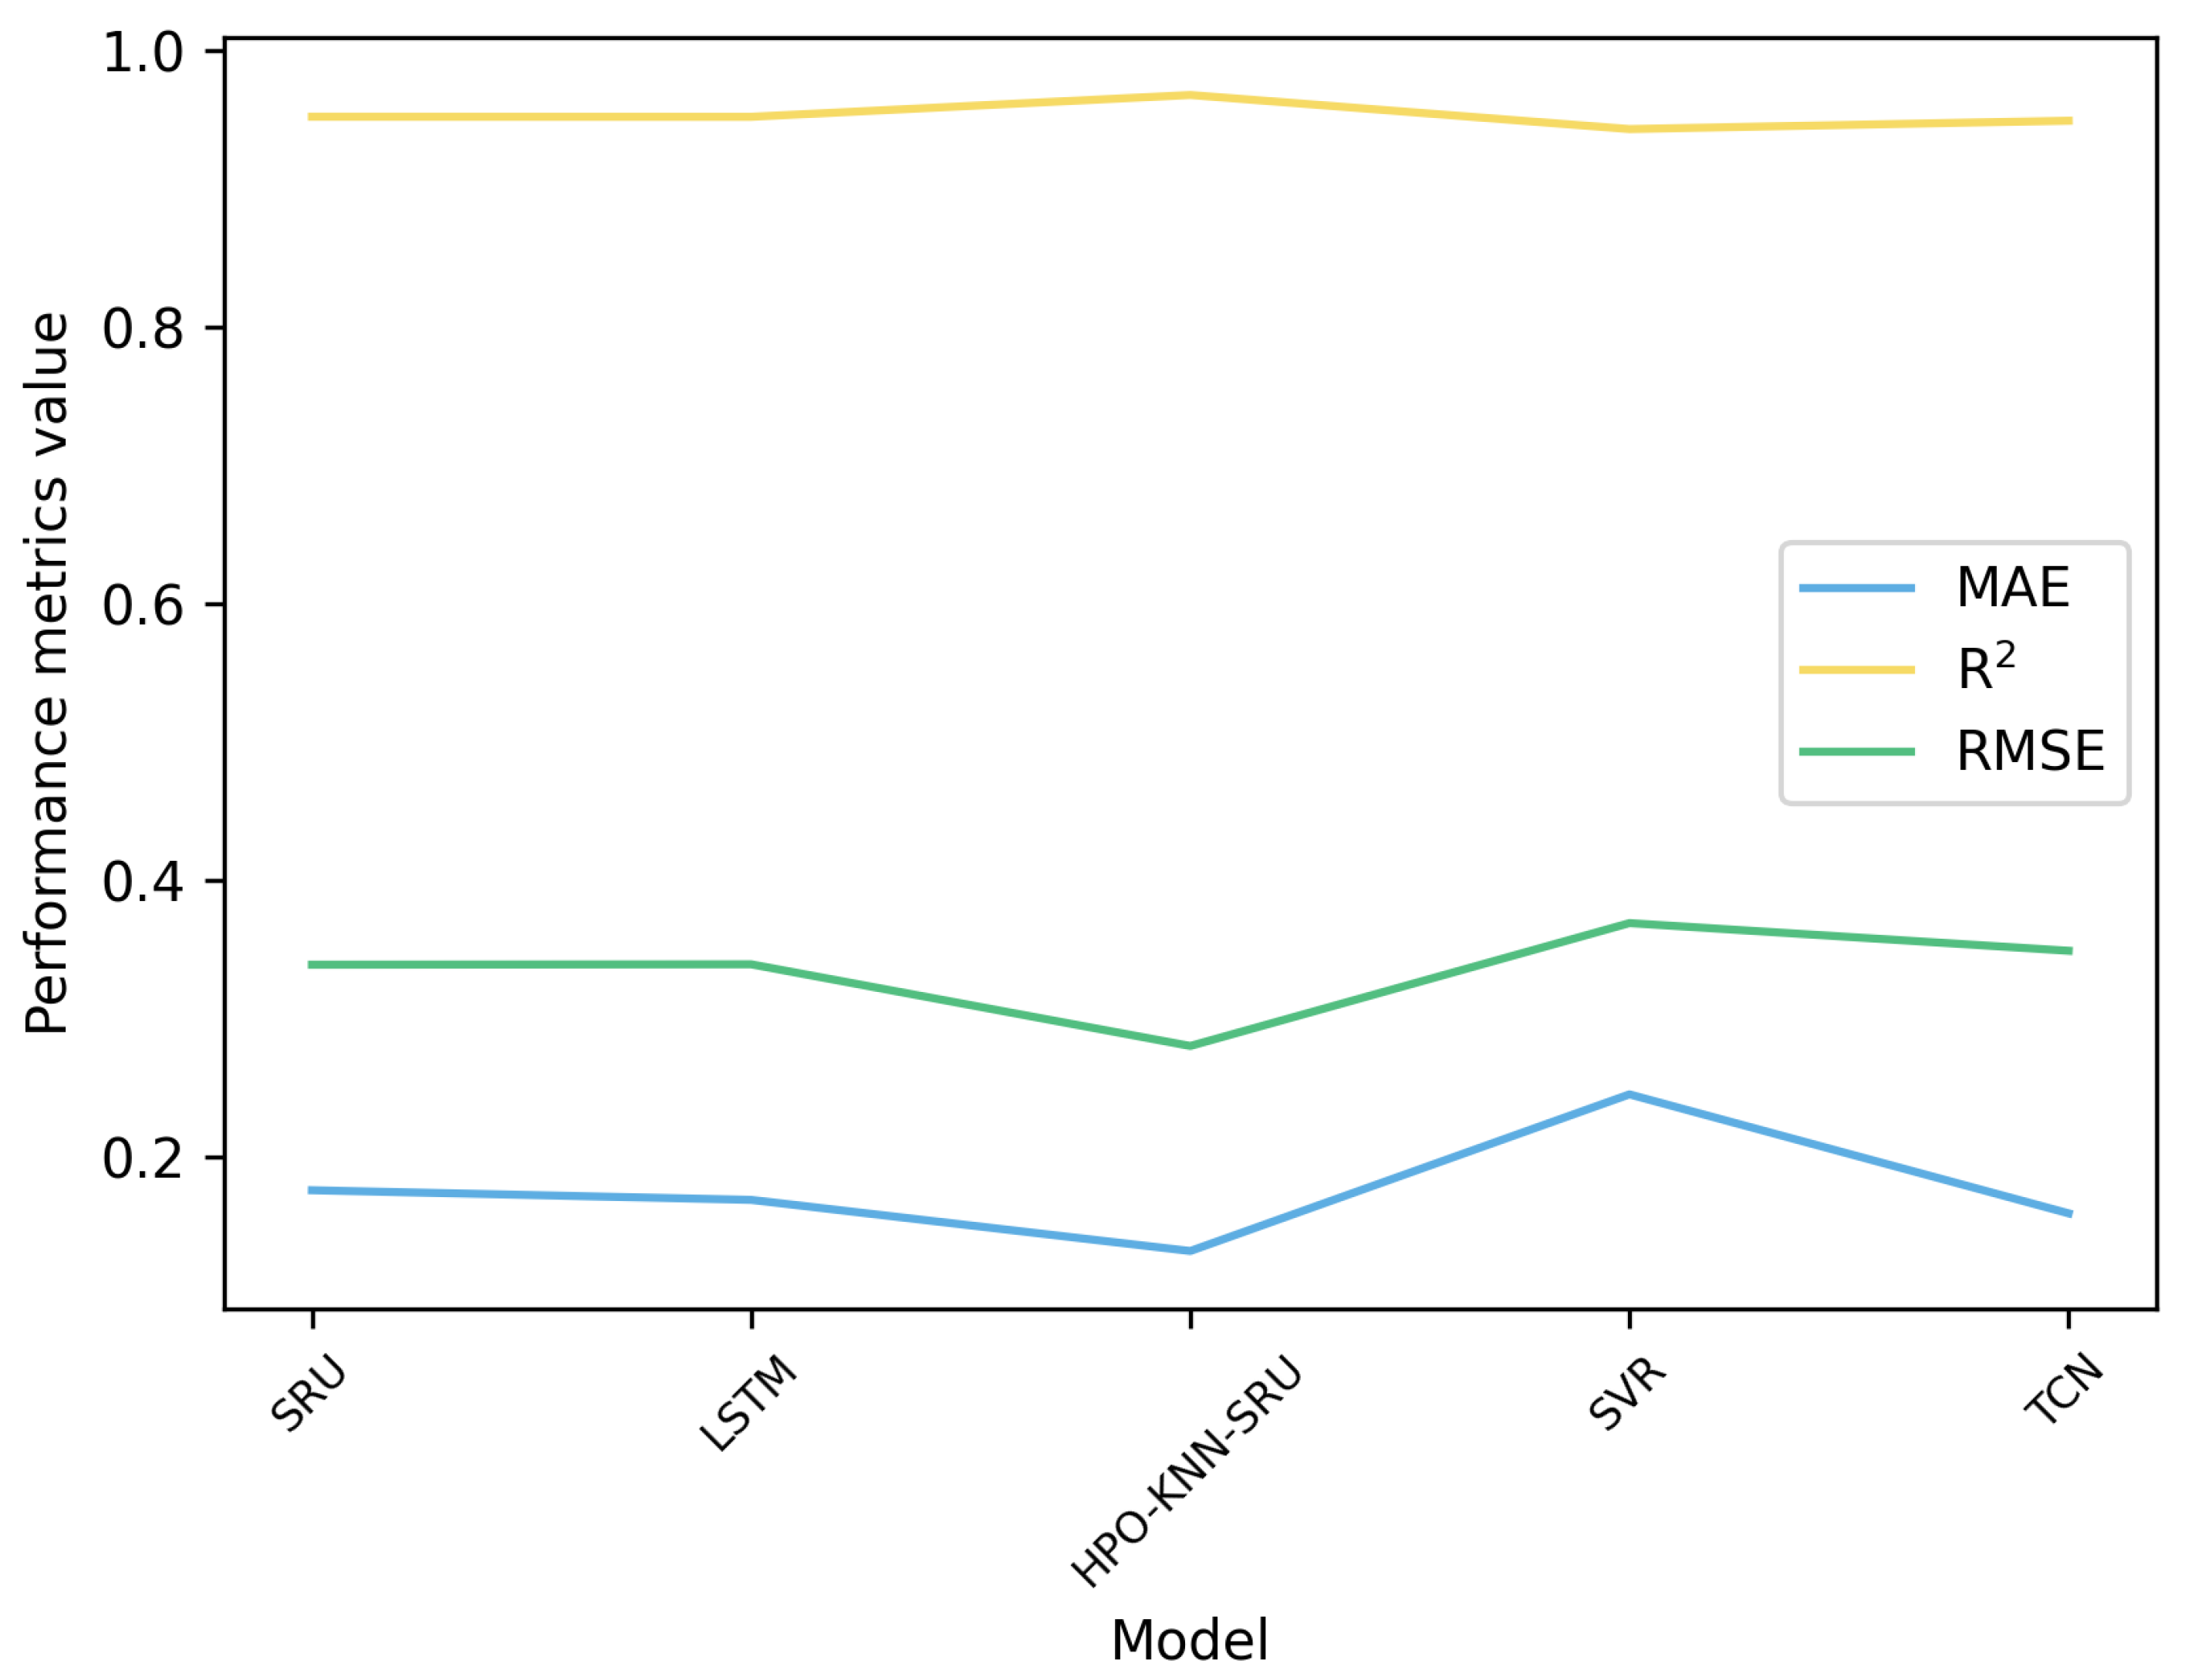
- It is obvious that the proposed HPO-KNN-SRU model has the lowest RMSE and MAE and the largest . The RMSE, MAE and of HPO-KNN-SRU are 0.280064 KW, 0.131874 KW, 0.967414. Compared with other comparison models, the RMSE of the HPO-KNN-SRU is reduced by 19.63% on average, the MAE is reduced by 27.54% on average, and the is increased by 1.96% on average.
- From the analysis of the experimental results of the SRU, SVR, LSTM and TCN, the SRU takes the least time to verify when the accuracy is not much different.
- Comparison of the experimental results of the KNN-SRU, KNN-SVR with SRU, and SVR shows that the KNN can handle outliers in photovoltaic power data well so as to improve prediction accuracy.
- From the comparison between the HPO-KNN-SRU and HPO-KNN-SRU (only optimizing the KNN), HPO-KNN-SRU (only optimizing the KNN), and KNN-SRU, it is proved that the HPO algorithm can be used as an effective method for SRU and KNN model parameter optimization.
3.2. Discussion on the Effectiveness of KNN in Handling Anomalies
3.3. Discussion on the Effectiveness of HPO Algorithm in Optimizing KNN and SRU
4. Conclusions
- The HPO-KNN-SRU model obtained the smallest RMSE and MAE and the largest R2, which shows that the HPO-KNN-SRU model has predictive ability.
- The prediction accuracy of the dataset model training after KNN outlier processing is further improved, proving the effectiveness of the KNN in processing outliers in photovoltaic power time series data.
- The HPO algorithm applied to optimize the KNN and SRU models can enhance the outlier processing performance of the KNN and the predictive performance of the SRU model.
Author Contributions
Funding
Institutional Review Board Statement
Informed Consent Statement
Data Availability Statement
Conflicts of Interest
References
- Mohsin, M.; Abbas, Q.; Zhang, J.; Ikram, M.; Iqbal, N. Integrated effect of energy consumption, economic development, and population growth on CO2 based environmental degradation: A case of transport sector. Environ. Sci. Pollut. Res. 2019, 26, 32824–32835. [Google Scholar] [CrossRef] [PubMed]
- Ahmad, T.; Zhang, D. A critical review of comparative global historical energy consumption and future demand: The story told so far. Energy Rep. 2020, 6, 1973–1991. [Google Scholar] [CrossRef]
- Ebhota, W.S.; Jen, T.C. Fossil fuels environmental challenges and the role of solar photovoltaic technology advances in fast tracking hybrid renewable energy system. Int. J. Precis. Eng.-Manuf.-Green Technol. 2020, 7, 97–117. [Google Scholar] [CrossRef]
- Kalair, A.; Abas, N.; Saleem, M.S.; Kalair, A.R.; Khan, N. Role of energy storage systems in energy transition from fossil fuels to renewables. Energy Storage 2021, 3, e135. [Google Scholar] [CrossRef]
- Pursiheimo, E.; Holttinen, H.; Koljonen, T. Inter-sectoral effects of high renewable energy share in global energy system. Renew. Energy 2019, 136, 1119–1129. [Google Scholar] [CrossRef]
- Victoria, M.; Haegel, N.; Peters, I.M.; Sinton, R.; Jäger-Waldau, A.; del Cañizo, C.; Breyer, C.; Stocks, M.; Blakers, A.; Kaizuka, I.; et al. Solar photovoltaics is ready to power a sustainable future. Joule 2021, 5, 1041–1056. [Google Scholar] [CrossRef]
- Shivashankar, S.; Mekhilef, S.; Mokhlis, H.; Karimi, M. Mitigating methods of power fluctuation of photovoltaic (PV) sources—A review. Renew. Sustain. Energy Rev. 2016, 59, 1170–1184. [Google Scholar] [CrossRef]
- Wan, C.; Zhao, J.; Song, Y.; Xu, Z.; Lin, J.; Hu, Z. Photovoltaic and solar power forecasting for smart grid energy management. CSEE J. Power Energy Syst. 2015, 1, 38–46. [Google Scholar] [CrossRef]
- Zhang, S.; Wang, J.; Liu, H.; Tong, J.; Sun, Z. Prediction of energy photovoltaic power generation based on artificial intelligence algorithm. Neural Comput. Appl. 2021, 33, 821–835. [Google Scholar] [CrossRef]
- Akhter, M.N.; Mekhilef, S.; Mokhlis, H.; Shah, N.M. Review on forecasting of photovoltaic power generation based on machine learning and metaheuristic techniques. IET Renew. Power Gener. 2019, 13, 1009–1023. [Google Scholar] [CrossRef]
- Cervone, G.; Clemente-Harding, L.; Alessandrini, S.; Monache, L.D. Short-term photovoltaic power forecasting using Artificial Neural Networks and an Analog Ensemble. Renew. Energy 2017, 108, 274–286. [Google Scholar] [CrossRef]
- Massaoudi, M.; Chihi, I.; Abu-Rub, H.; Refaat, S.S.; Oueslati, F.S. Convergence of photovoltaic power forecasting and deep learning: State-of-art review. IEEE Access 2021, 9, 136593–136615. [Google Scholar] [CrossRef]
- Hong, T.; Pinson, P.; Wang, Y.; Weron, R.; Yang, D.; Zareipour, H. Energy forecasting: A review and outlook. IEEE Open Access J. Power Energy 2020, 7, 376–388. [Google Scholar] [CrossRef]
- Zhang, D.; Han, X.; Deng, C. Review on the research and practice of deep learning and reinforcement learning in smart grids. CSEE J. Power Energy Syst. 2018, 4, 362–370. [Google Scholar] [CrossRef]
- Massaoudi, M.; Refaat, S.S.; Chihi, I.; Trabelsi, M.; Oueslati, F.S.; Abu-Rub, H. A novel stacked generalization ensemble-based hybrid LGBM-XGB-MLP model for Short-Term Load Forecasting. Energy 2021, 214, 118874. [Google Scholar] [CrossRef]
- Adhikari, R.; Agrawal, R.K. An introductory study on time series modeling and forecasting. arXiv 2013, arXiv:1302.6613. [Google Scholar]
- Han, S.; Qiao, Y.-h.; Yan, J.; Liu, Y.-Q.; Li, L.; Wang, Z. Mid-to-long term wind and photovoltaic power generation prediction based on copula function and long short term memory network. Appl. Energy 2019, 239, 181–191. [Google Scholar] [CrossRef]
- Barman, M.; Choudhury, N.B.D.; Sutradhar, S. A regional hybrid GOA-SVM model based on similar day approach for short-term load forecasting in Assam, India. Energy 2018, 145, 710–720. [Google Scholar] [CrossRef]
- Niu, D.; Wang, K.; Sun, L.; Wu, J.; Xu, X. Short-term photovoltaic power generation forecasting based on random forest feature selection and CEEMD: A case study. Appl. Soft Comput. 2020, 93, 106389. [Google Scholar] [CrossRef]
- Alam, S. Prediction of direct and global solar irradiance using broadband models: Validation of REST model. Renew. Energy 2006, 31, 1253–1263. [Google Scholar] [CrossRef]
- Lorenz, E.; Hurka, J.; Karampela, G.; Heinemann, D.; Beyer, H.G.; Schneider, M. Qualified forecast of ensemble power production by spatially dispersed grid-connected PV systems. In Proceedings of the European Photovoltaic Solar Energy Conference, Valencia, Spain, 1–5 September 2008. [Google Scholar]
- Li, Y.; Su, Y.; Shu, L. An ARMAX model for forecasting the power output of a grid connected photovoltaic system. Renew. Energy 2014, 66, 78–89. [Google Scholar] [CrossRef]
- Persson, C.; Bacher, P.; Shiga, T.; Madsen, H. Multi-site solar power forecasting using gradient boosted regression trees. Sol. Energy 2017, 150, 423–436. [Google Scholar] [CrossRef]
- Bourhnane, S.; Abid, M.R.; Lghoul, R.; Zine-Dine, K.; Elkamoun, N.; Benhaddou, D. Machine learning for energy consumption prediction and scheduling in smart buildings. SN Appl. Sci. 2020, 2, 297. [Google Scholar] [CrossRef]
- Alfadda, A.; Adhikari, R.; Kuzlu, M.; Rahman, S. Hour-ahead solar PV power forecasting using SVR based approach. In Proceedings of the 2017 IEEE Power & Energy Society Innovative Smart Grid Technologies Conference (ISGT), Washington, DC, USA, 23–26 April 2017; IEEE: Piscataway, NJ, USA, 2017; pp. 1–5. [Google Scholar]
- Hinton, G.E.; Salakhutdinov, R.R. Reducing the dimensionality of data with neural networks. Science 2006, 313, 504–507. [Google Scholar] [CrossRef] [PubMed]
- Li, C.; Tang, G.; Xue, X.; Chen, X.; Wang, R.; Zhang, C. The short-term interval prediction of wind power using the deep learning model with gradient descend optimization. Renew. Energy 2020, 155, 197–211. [Google Scholar] [CrossRef]
- Hossain, M.S.; Mahmood, H. Short-Term Photovoltaic Power Forecasting Using an LSTM Neural Network and Synthetic Weather Forecast. IEEE Access 2020, 8, 172524–172533. [Google Scholar] [CrossRef]
- Zhu, R.; Liao, W.; Wang, Y. Short-term prediction for wind power based on temporal convolutional network. Energy Rep. 2020, 6, 424–429. [Google Scholar] [CrossRef]
- Elizabeth Michael, N.; Mishra, M.; Hasan, S.; Al-Durra, A. Short-term solar power predicting model based on multi-step CNN stacked LSTM technique. Energies 2022, 15, 2150. [Google Scholar] [CrossRef]
- Limouni, T.; Yaagoubi, R.; Bouziane, K.; Guissi, K.; Baali, E.H. Accurate one step and multistep forecasting of very short-term PV power using LSTM-TCN model. Renew. Energy 2023, 205, 1010–1024. [Google Scholar] [CrossRef]
- Chen, Z.; Hu, Z.; Xu, L.; Zhao, Y.; Zhou, X. DA-Bi-SRU for water quality prediction in smart mariculture. Comput. Electron. Agric. 2022, 200, 107219. [Google Scholar] [CrossRef]
- Chen, Y.; Fan, M.; Hassan, S.G.; Lv, J.; Zhou, B.; Fan, W.; Li, J.; Liu, T.; Liu, S.; Wu, H.; et al. Waterfowl breeding environment humidity prediction based on the SRU-based sequence to sequence model. Comput. Electron. Agric. 2022, 201, 107271. [Google Scholar] [CrossRef]
- Yao, D.; Li, B.; Liu, H.; Yang, J.; Jia, L. Remaining useful life prediction of roller bearings based on improved 1D-CNN and simple recurrent unit. Measurement 2021, 175, 109166. [Google Scholar] [CrossRef]
- Mi, X.; Yu, C.; Liu, X.; Yan, G.; Yu, F.; Shang, P. A dynamic ensemble deep deterministic policy gradient recursive network for spatiotemporal traffic speed forecasting in an urban road network. Digit. Signal Process. 2022, 129, 103643. [Google Scholar] [CrossRef]
- Alimohammadi, H.; Chen, S.N. Performance evaluation of outlier detection techniques in production timeseries: A systematic review and meta-analysis. Expert Syst. Appl. 2022, 191, 116371. [Google Scholar] [CrossRef]
- Chen, Y.; Shi, G.; Jiang, H.; Zheng, T. Research on the prediction of insertion resistance of wheel loader based on pso-lstm. Appl. Sci. 2023, 13, 1372. [Google Scholar] [CrossRef]
- Qiu, S.; Wang, Y.; Lv, Y.; Chen, F.; Zhao, J. Optimizing BiLSTM Network Attack Prediction Based on Improved Gray Wolf Algorithm. Appl. Sci. 2023, 13, 6871. [Google Scholar] [CrossRef]
- Tikkiwal, V.A.; Singh, S.V.; Gupta, H.O. Day-ahead forecasting of solar irradiance using hybrid improved cuckoo search-lstm approach. In Proceedings of the 2020 2nd International Conference on Advances in Computing, Communication Control and Networking (ICACCCN), Greater Noida, India, 18–19 December 2020; IEEE: Piscataway, NJ, USA, 2020; pp. 84–88. [Google Scholar]
- Krishnan, H.; Islam, M.S.; Ahmad, M.A.; Rashid, M.I.M. Parameter identification of solar cells using improved Archimedes Optimization Algorithm. Optik 2023, 295, 171465. [Google Scholar] [CrossRef]
- Beşkirli, A.; Dağ, İ. Parameter extraction for photovoltaic models with tree seed algorithm. Energy Rep. 2023, 9, 174–185. [Google Scholar] [CrossRef]
- Abd El-Mageed, A.A.; Abohany, A.A.; Saad, H.M.H.; Sallam, K.M. Parameter extraction of solar photovoltaic models using queuing search optimization and differential evolution. Appl. Soft Comput. 2023, 134, 110032. [Google Scholar] [CrossRef]
- Naruei, I.; Keynia, F.; Sabbagh Molahosseini, A. Hunter–prey optimization: Algorithm and applications. Soft Comput. 2022, 26, 1279–1314. [Google Scholar] [CrossRef]
- Cai, J.; Li, Q.; Cheng, Z.; Wang, R. Short-Term Power Load Forecasting Method Based on HPO-LSTM Model. In Proceedings of the 2023 Panda Forum on Power and Energy (PandaFPE), Chengdu, China, 27–30 April 2023; IEEE: Piscataway, NJ, USA, 2023; pp. 1198–1202. [Google Scholar]
- Ji, P.; Shi, S.; Shi, X. Research on early warning of coal and gas outburst based on HPO-BiLSTM. IEEE Trans. Instrum. Meas. 2023, 72, 2529808. [Google Scholar] [CrossRef]
- Guo, L.; Duan, Z.; Guo, W.; Ding, K.; Lee, C.; Chan, F.T.S. Machine vision-based recognition of elastic abrasive tool wear and its influence on machining performance. J. Intell. Manuf. 2023, 1–16. [Google Scholar] [CrossRef]
- Benesty, J.; Chen, J.; Huang, Y.; Cohen, I. Pearson correlation coefficient. In Noise Reduction in Speech Processing; Springer: Berlin/Heidelberg, Germany, 2009; pp. 1–4. [Google Scholar]
- Ratner, B. The correlation coefficient: Its values range between +1/-1, or do they? J. Target. Meas. Anal. Mark. 2009, 17, 139–142. [Google Scholar] [CrossRef]
- Chen, Y.; Miao, D.; Zhang, H. Neighborhood outlier detection. Expert Syst. Appl. 2010, 37, 8745–8749. [Google Scholar] [CrossRef]
- Lei, T.; Zhang, Y.; Artzi, Y. Training Rnns as Fast as CNNs. 2018. Available online: https://openreview.net/forum?id=rJBiunlAW (accessed on 16 February 2024).


| Mean | Minimum | Maximum | Standard Deviation | Skewness | Kurtosis |
|---|---|---|---|---|---|
| 2.40 | 5.47 | 1.51 | −0.16 | −1.39 |
| Meteorological Feature Factor | Absolute Pearson Value |
|---|---|
| Current_Phase_Average | 1 |
| Performance_Ratio | 0.46 |
| Weather_Relative_Humidity | 0.36 |
| Global_Horizontal_Radiation | 0.95 |
| Radiation_Global_Tilted | 0.99 |
| Model | RMSE | MAE | Prediction Time (s) | |
|---|---|---|---|---|
| SVR [25] | 0.368872 | 0.245083 | 0.942776 | 12.89 |
| LSTM [28] | 0.3391 | 0.168834 | 0.951644 | 2.17 |
| TCN [29] | 0.348872 | 0.159059 | 0.948817 | 130.70 |
| SRU | 0.338814 | 0.175804 | 0.951726 | 1.99 |
| KNN-SVR | 0.322538 | 0.225872 | 0.956677 | 7.81 |
| KNN-SRU | 0.28257 | 0.137469 | 0.966773 | 1.48 |
| HPO-KNN-SRU (Only optimize knn) | 0.280128 | 0.135529 | 0.967399 | 1.48 |
| HPO-KNN-SRU | 0.280064 | 0.131874 | 0.967414 | 1.45 |
| Model | (%) | (%) | (%) |
|---|---|---|---|
| HPO-KNN-SRU vs. SVR | 24.07 | 46.19 | 2.61 |
| HPO-KNN-SRU vs. LSTM | 17.40 | 21.89 | 1.65 |
| HPO-KNN-SRU vs. TCN | 19.72 | 17.11 | 1.96 |
| HPO-KNN-SRU vs. SRU | 17.33 | 24.98 | 1.64 |
| Model | (%) | (%) | (%) |
|---|---|---|---|
| KNN-SRU vs. SRU | 16.60 | 21.80 | 1.58 |
| KNN-SVR vs. SVR | 12.56 | 7.83 | 1.47 |
| Model | (%) | (%) | (%) |
|---|---|---|---|
| HPO-KNN-SRU vs. HPO-KNN-SRU (Only optimize knn) | 0.023 | 2.697 | 0.002 |
| HPO-KNN-SRU (Only optimize knn) vs. KNN-SRU | 0.864 | 1.411 | 0.064 |
Disclaimer/Publisher’s Note: The statements, opinions and data contained in all publications are solely those of the individual author(s) and contributor(s) and not of MDPI and/or the editor(s). MDPI and/or the editor(s) disclaim responsibility for any injury to people or property resulting from any ideas, methods, instructions or products referred to in the content. |
© 2024 by the authors. Licensee MDPI, Basel, Switzerland. This article is an open access article distributed under the terms and conditions of the Creative Commons Attribution (CC BY) license (https://creativecommons.org/licenses/by/4.0/).
Share and Cite
Tang, Y.; Zhang, L.; Huang, D.; Yang, S.; Kuang, Y. Ultra-Short-Term Photovoltaic Power Generation Prediction Based on Hunter–Prey Optimized K-Nearest Neighbors and Simple Recurrent Unit. Appl. Sci. 2024, 14, 2159. https://doi.org/10.3390/app14052159
Tang Y, Zhang L, Huang D, Yang S, Kuang Y. Ultra-Short-Term Photovoltaic Power Generation Prediction Based on Hunter–Prey Optimized K-Nearest Neighbors and Simple Recurrent Unit. Applied Sciences. 2024; 14(5):2159. https://doi.org/10.3390/app14052159
Chicago/Turabian StyleTang, Yin, Lizhuo Zhang, Dan Huang, Sha Yang, and Yingchun Kuang. 2024. "Ultra-Short-Term Photovoltaic Power Generation Prediction Based on Hunter–Prey Optimized K-Nearest Neighbors and Simple Recurrent Unit" Applied Sciences 14, no. 5: 2159. https://doi.org/10.3390/app14052159
APA StyleTang, Y., Zhang, L., Huang, D., Yang, S., & Kuang, Y. (2024). Ultra-Short-Term Photovoltaic Power Generation Prediction Based on Hunter–Prey Optimized K-Nearest Neighbors and Simple Recurrent Unit. Applied Sciences, 14(5), 2159. https://doi.org/10.3390/app14052159