

Integration of Sensors for Enhanced Condition Monitoring in Polymer Gears: A Comparative Study of Acceleration and Temperature Sensors

Abstract
:1. Introduction
1.1. Sensors
1.2. Polymer Gears
1.3. Vibration Analysis
1.4. Aim of the Contribution
- Can integrated acceleration sensors provide more sensitive condition monitoring of POM gears than external acceleration sensors?
- Can integrated temperature sensors into the POM gear provide reliable data that correlate with the wear of the gear?
2. Materials and Methods
- Comparison of state-of-the-art condition monitoring using external acceleration sensors and sensors integrated onto a polymer gearwheel.
- Comparative measurements using a temperature sensor integrated into a polymer gear and correlating the measurement data with the wear of the gear.
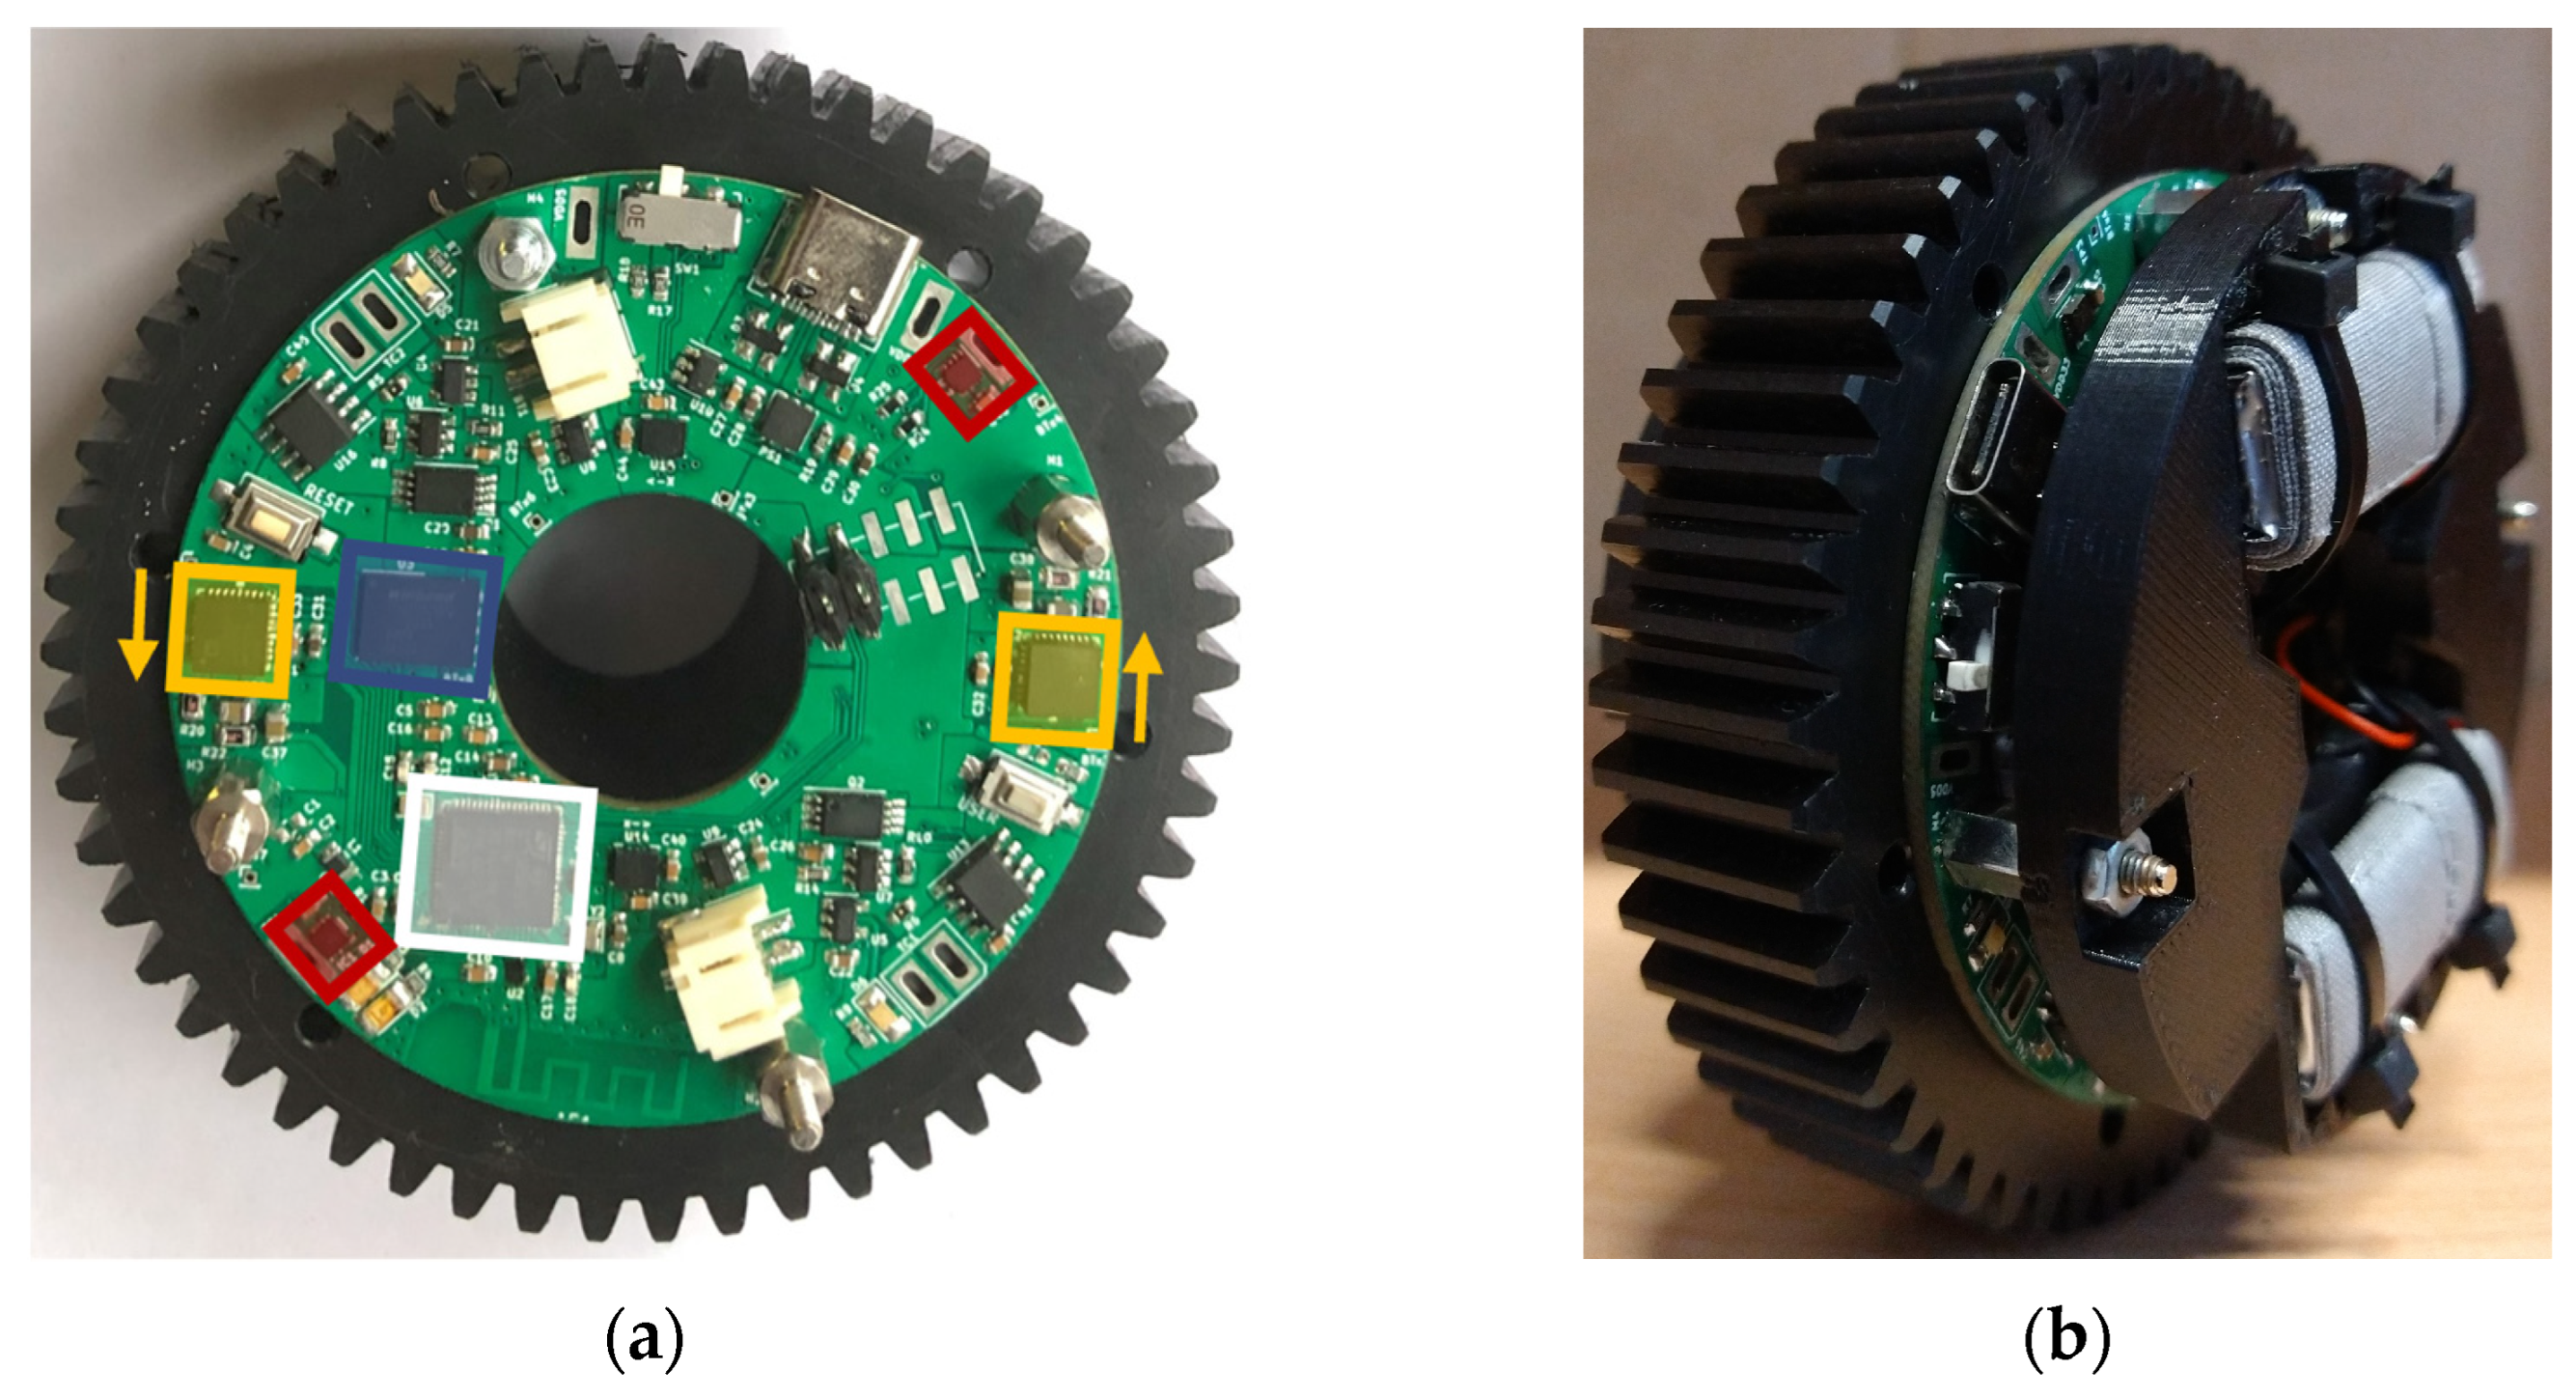
2.1. In Situ Sensor Module
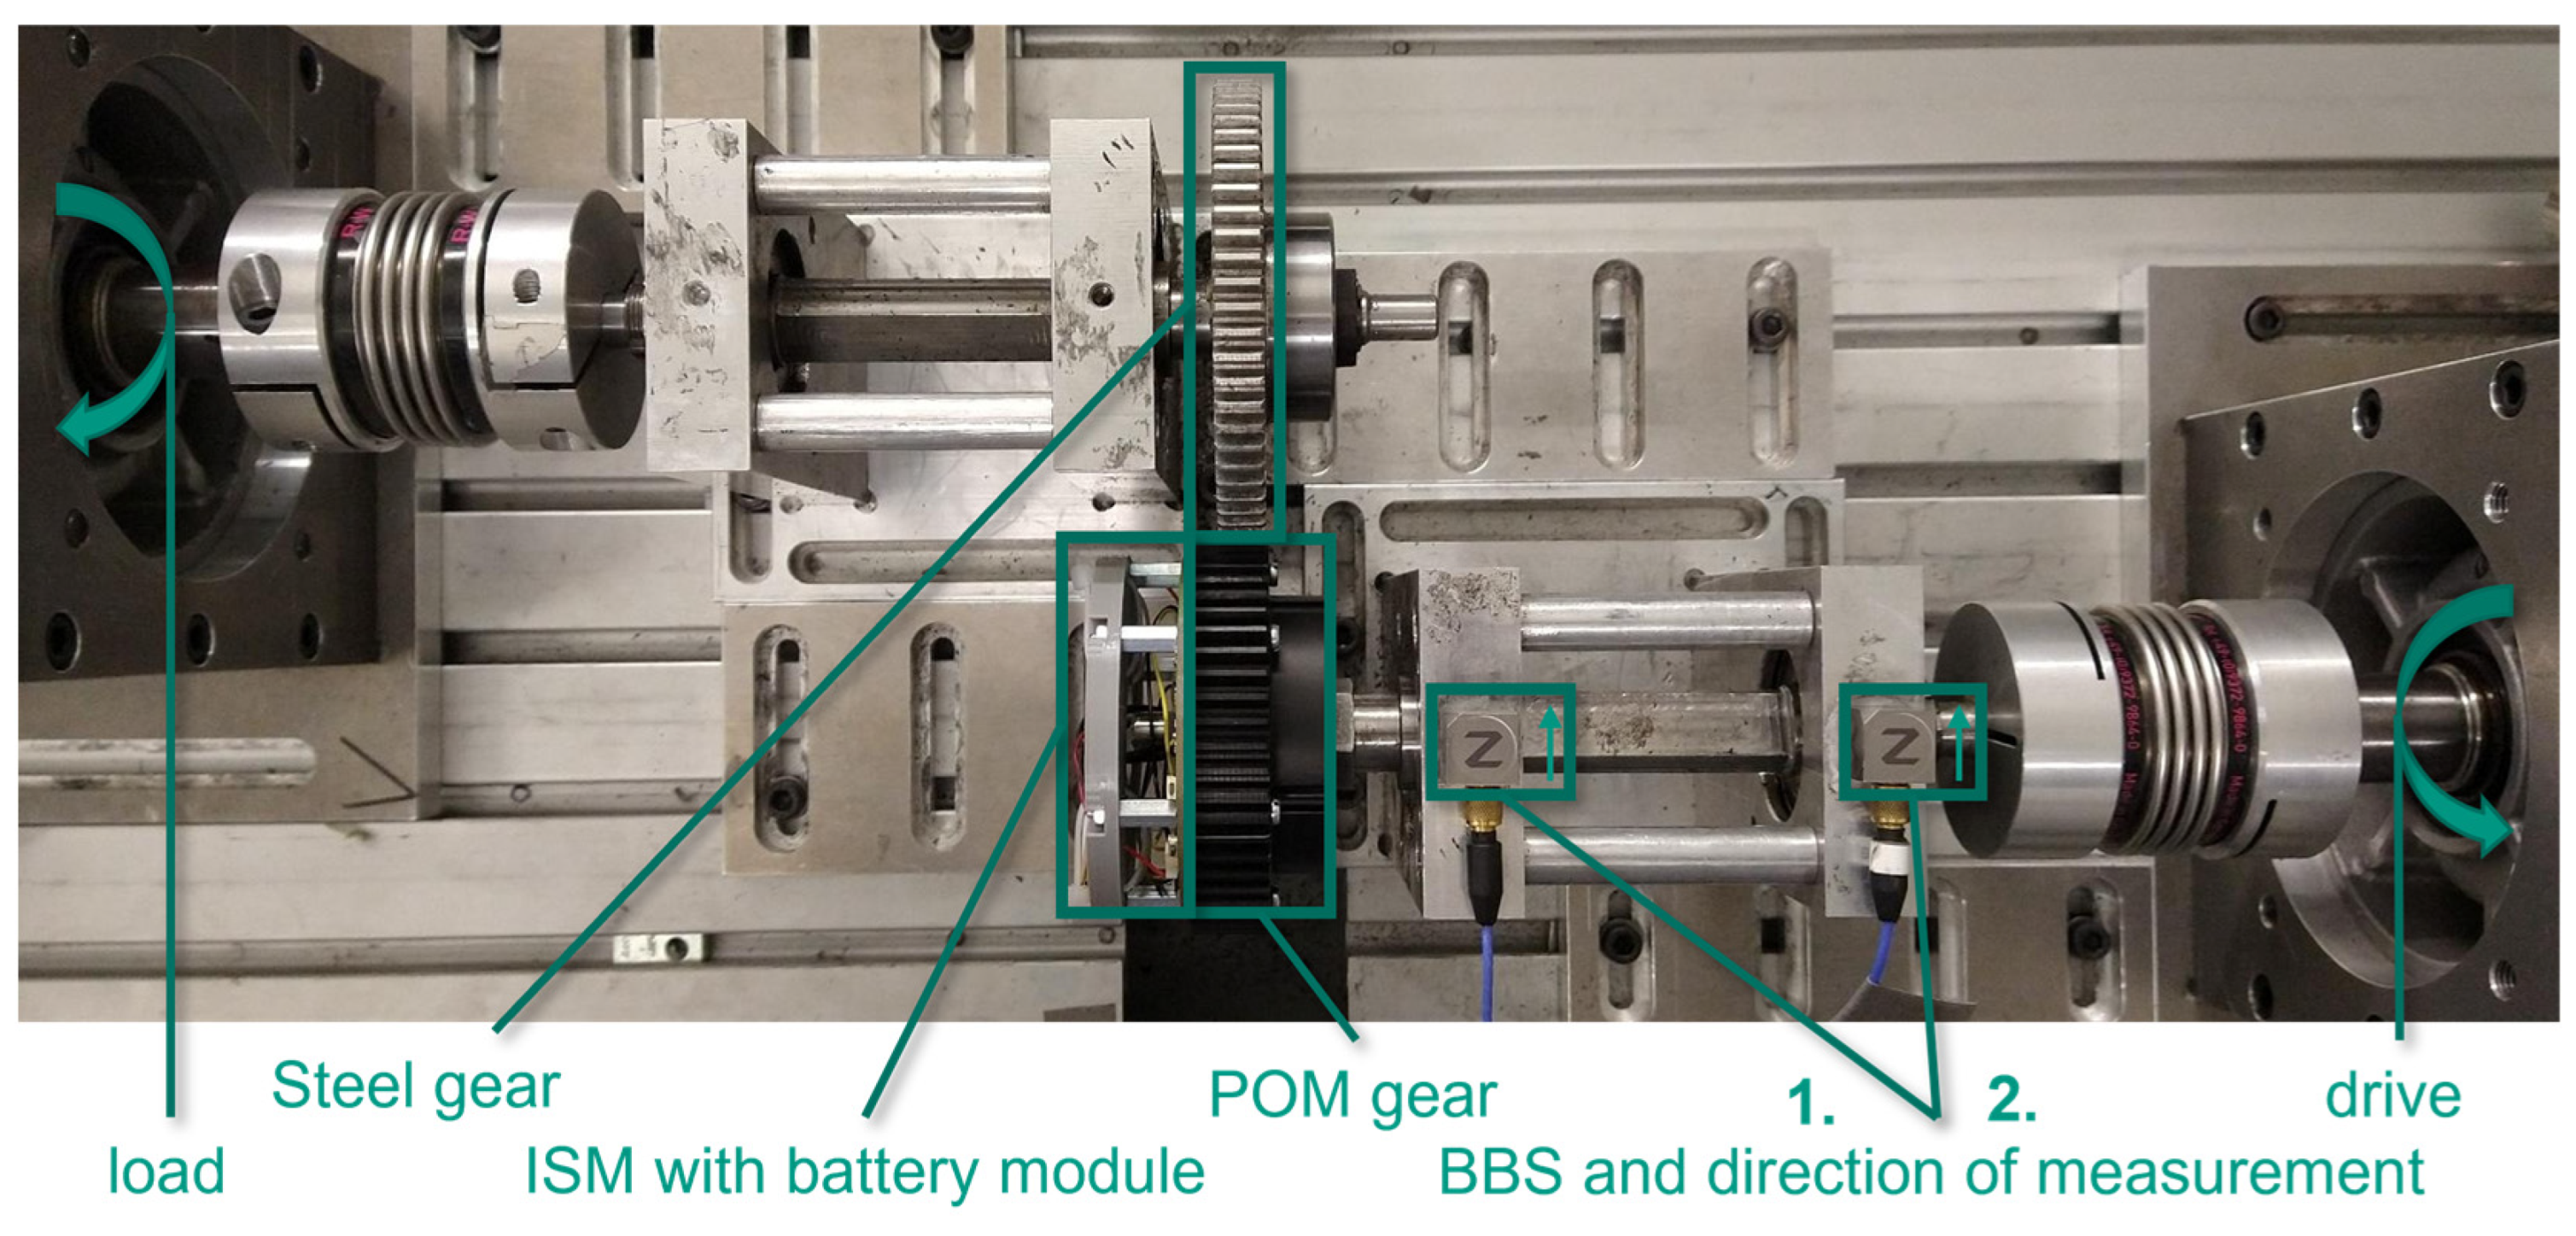
2.2. Test Bench Setup
2.3. Test Procedure
2.4. Data Processing
3. Results
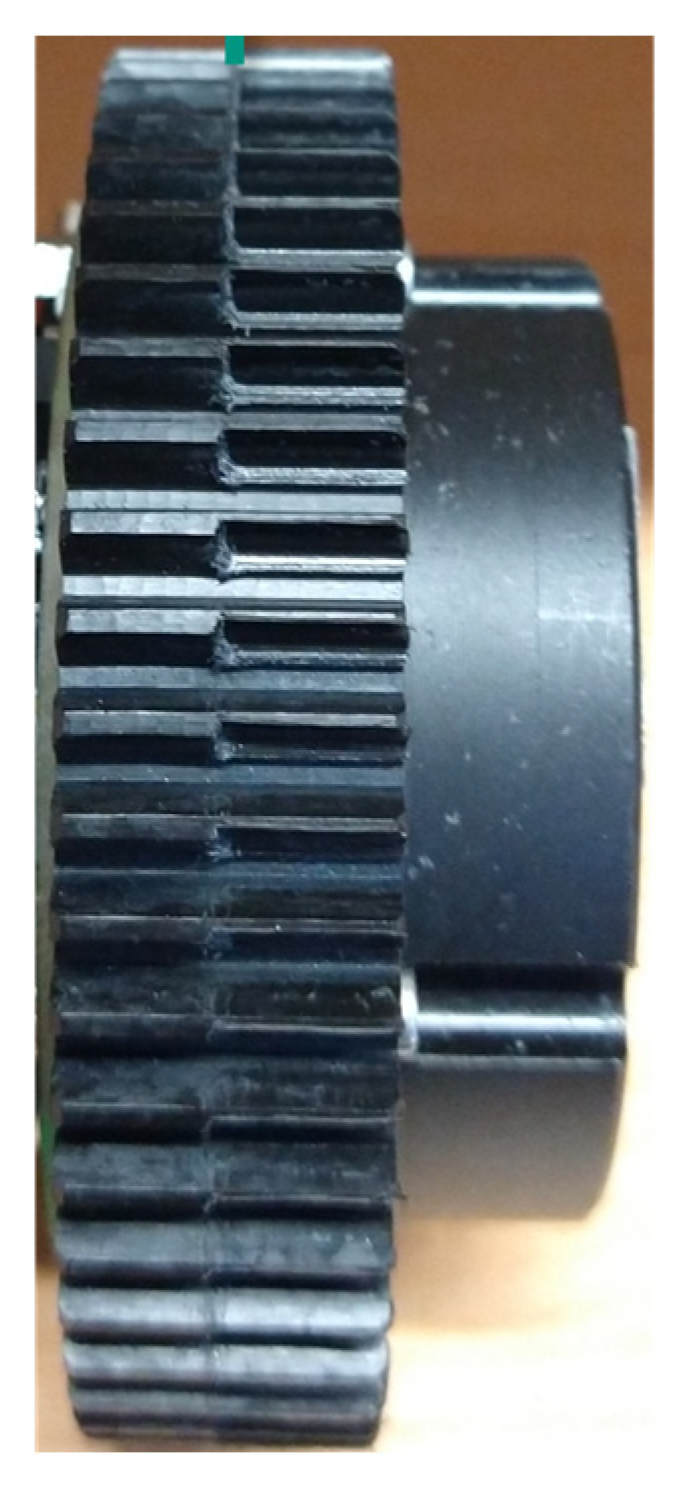
3.1. Wear
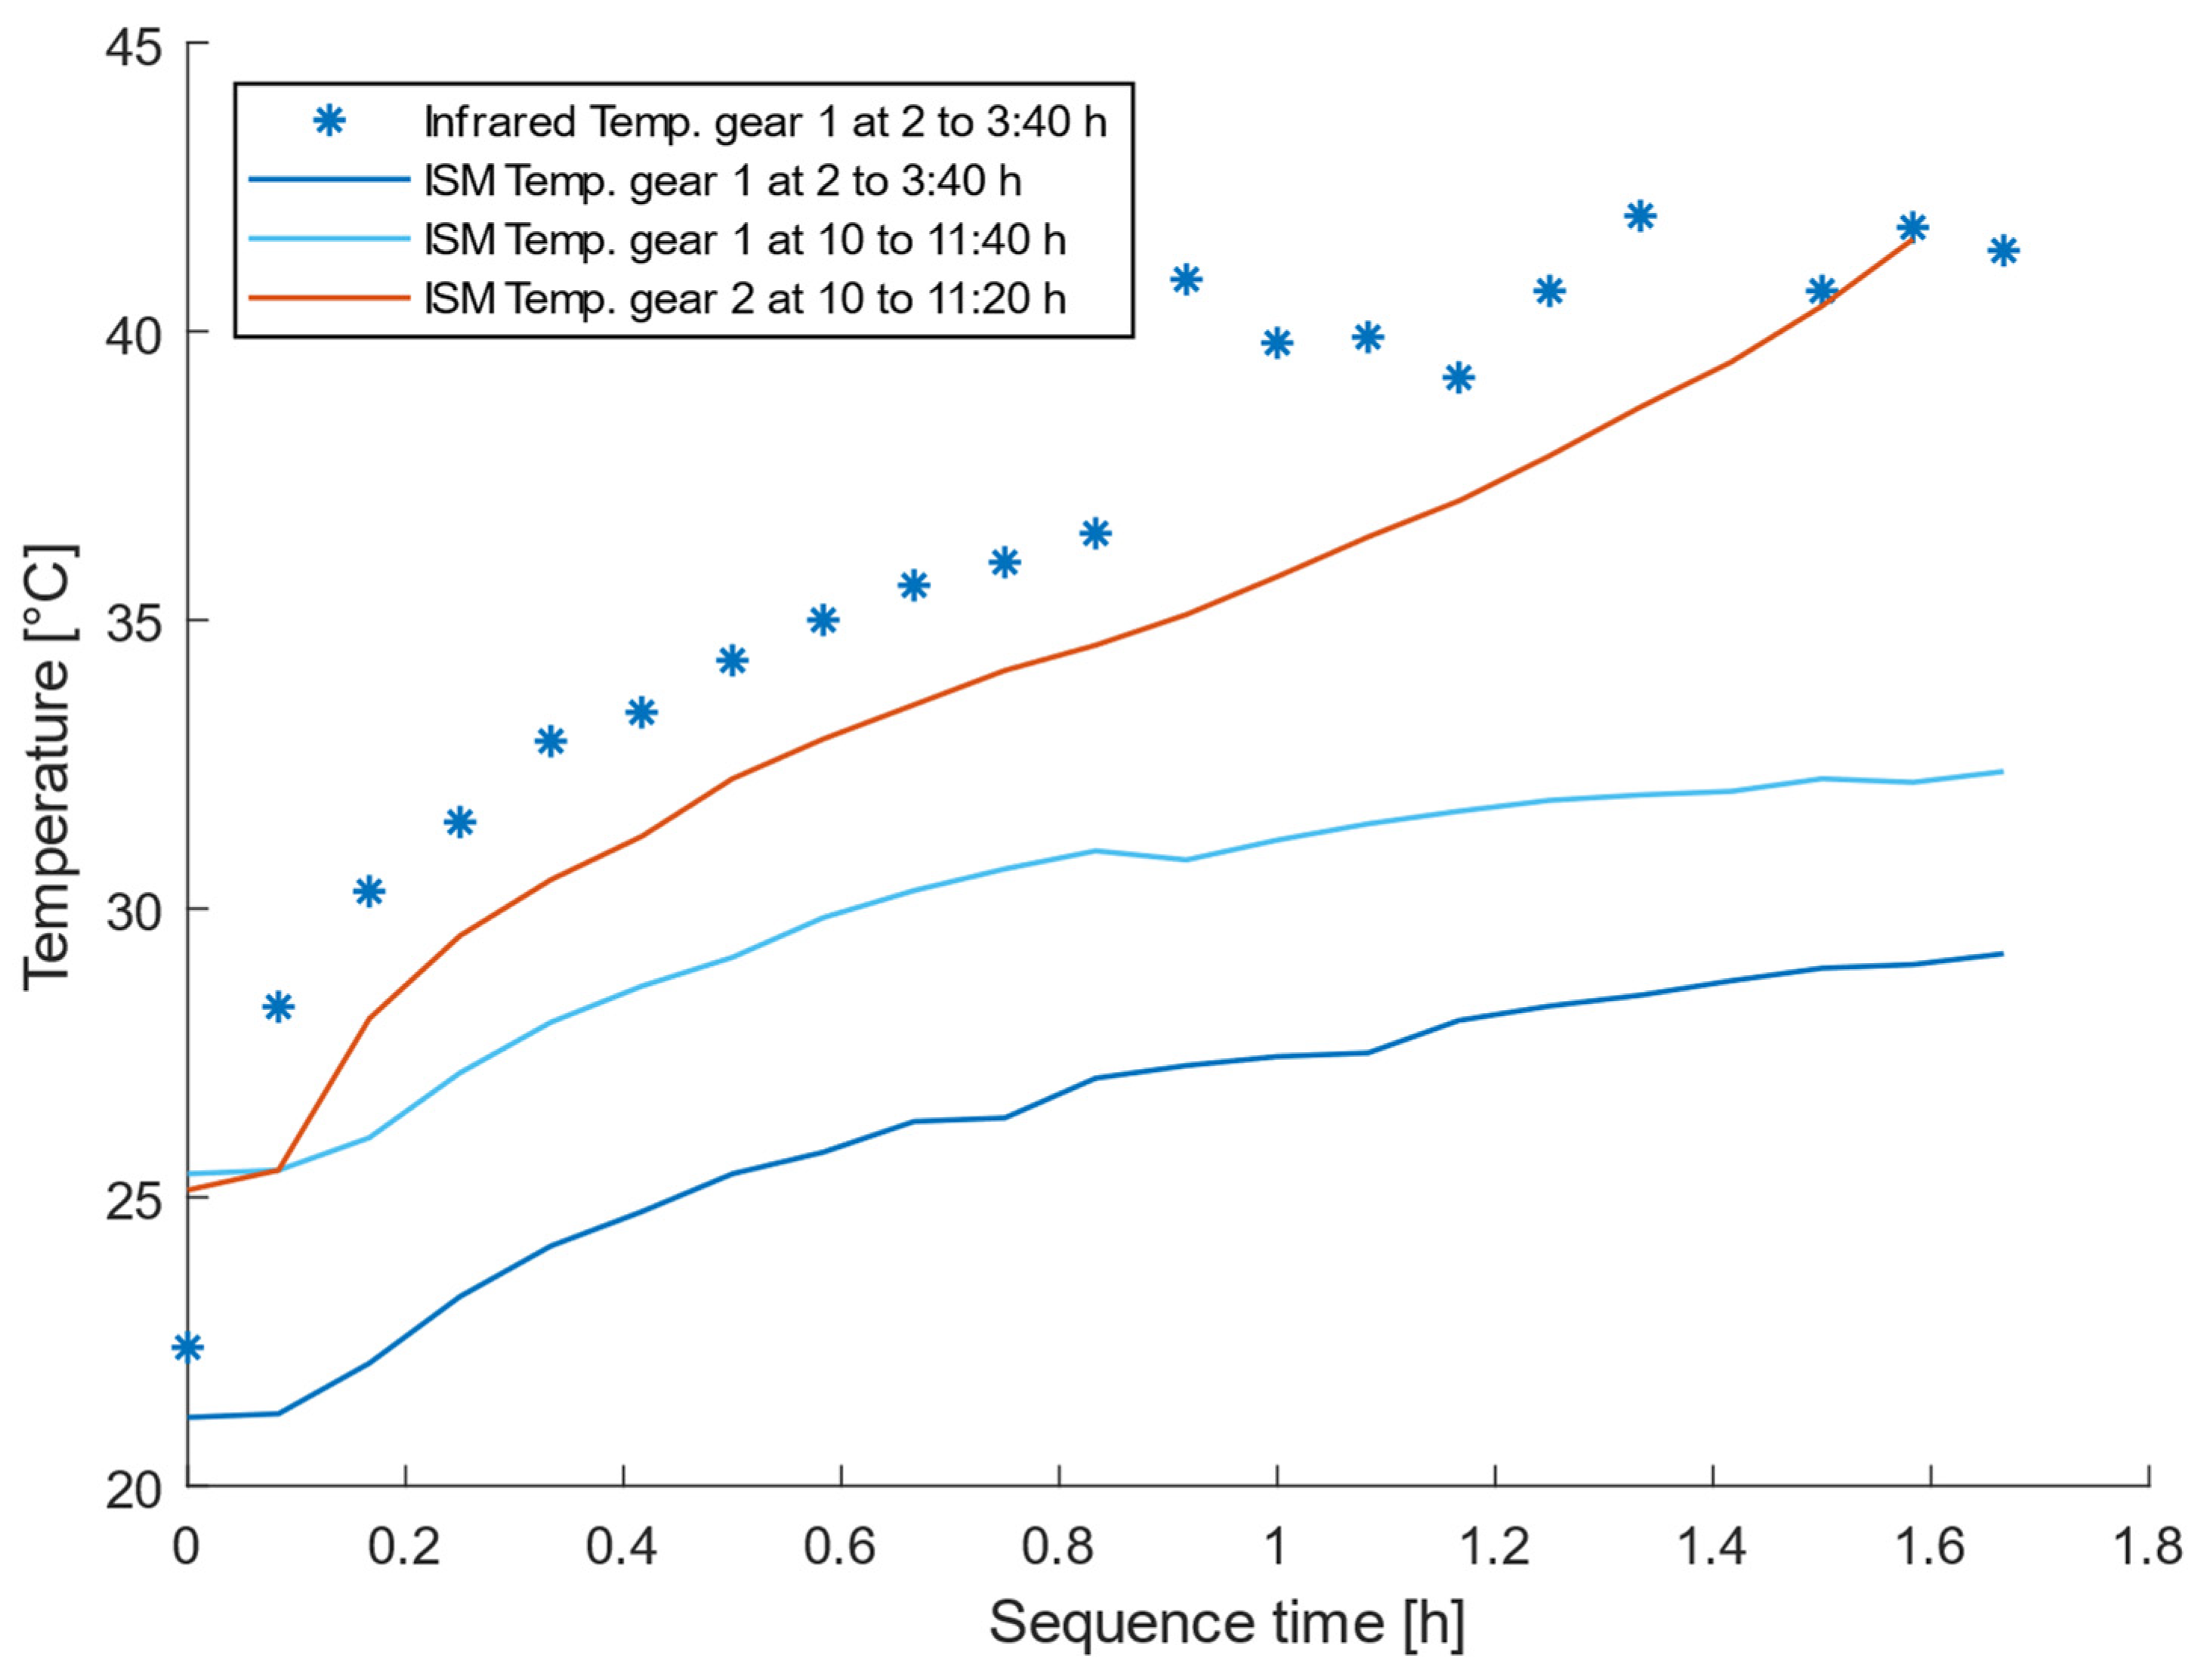
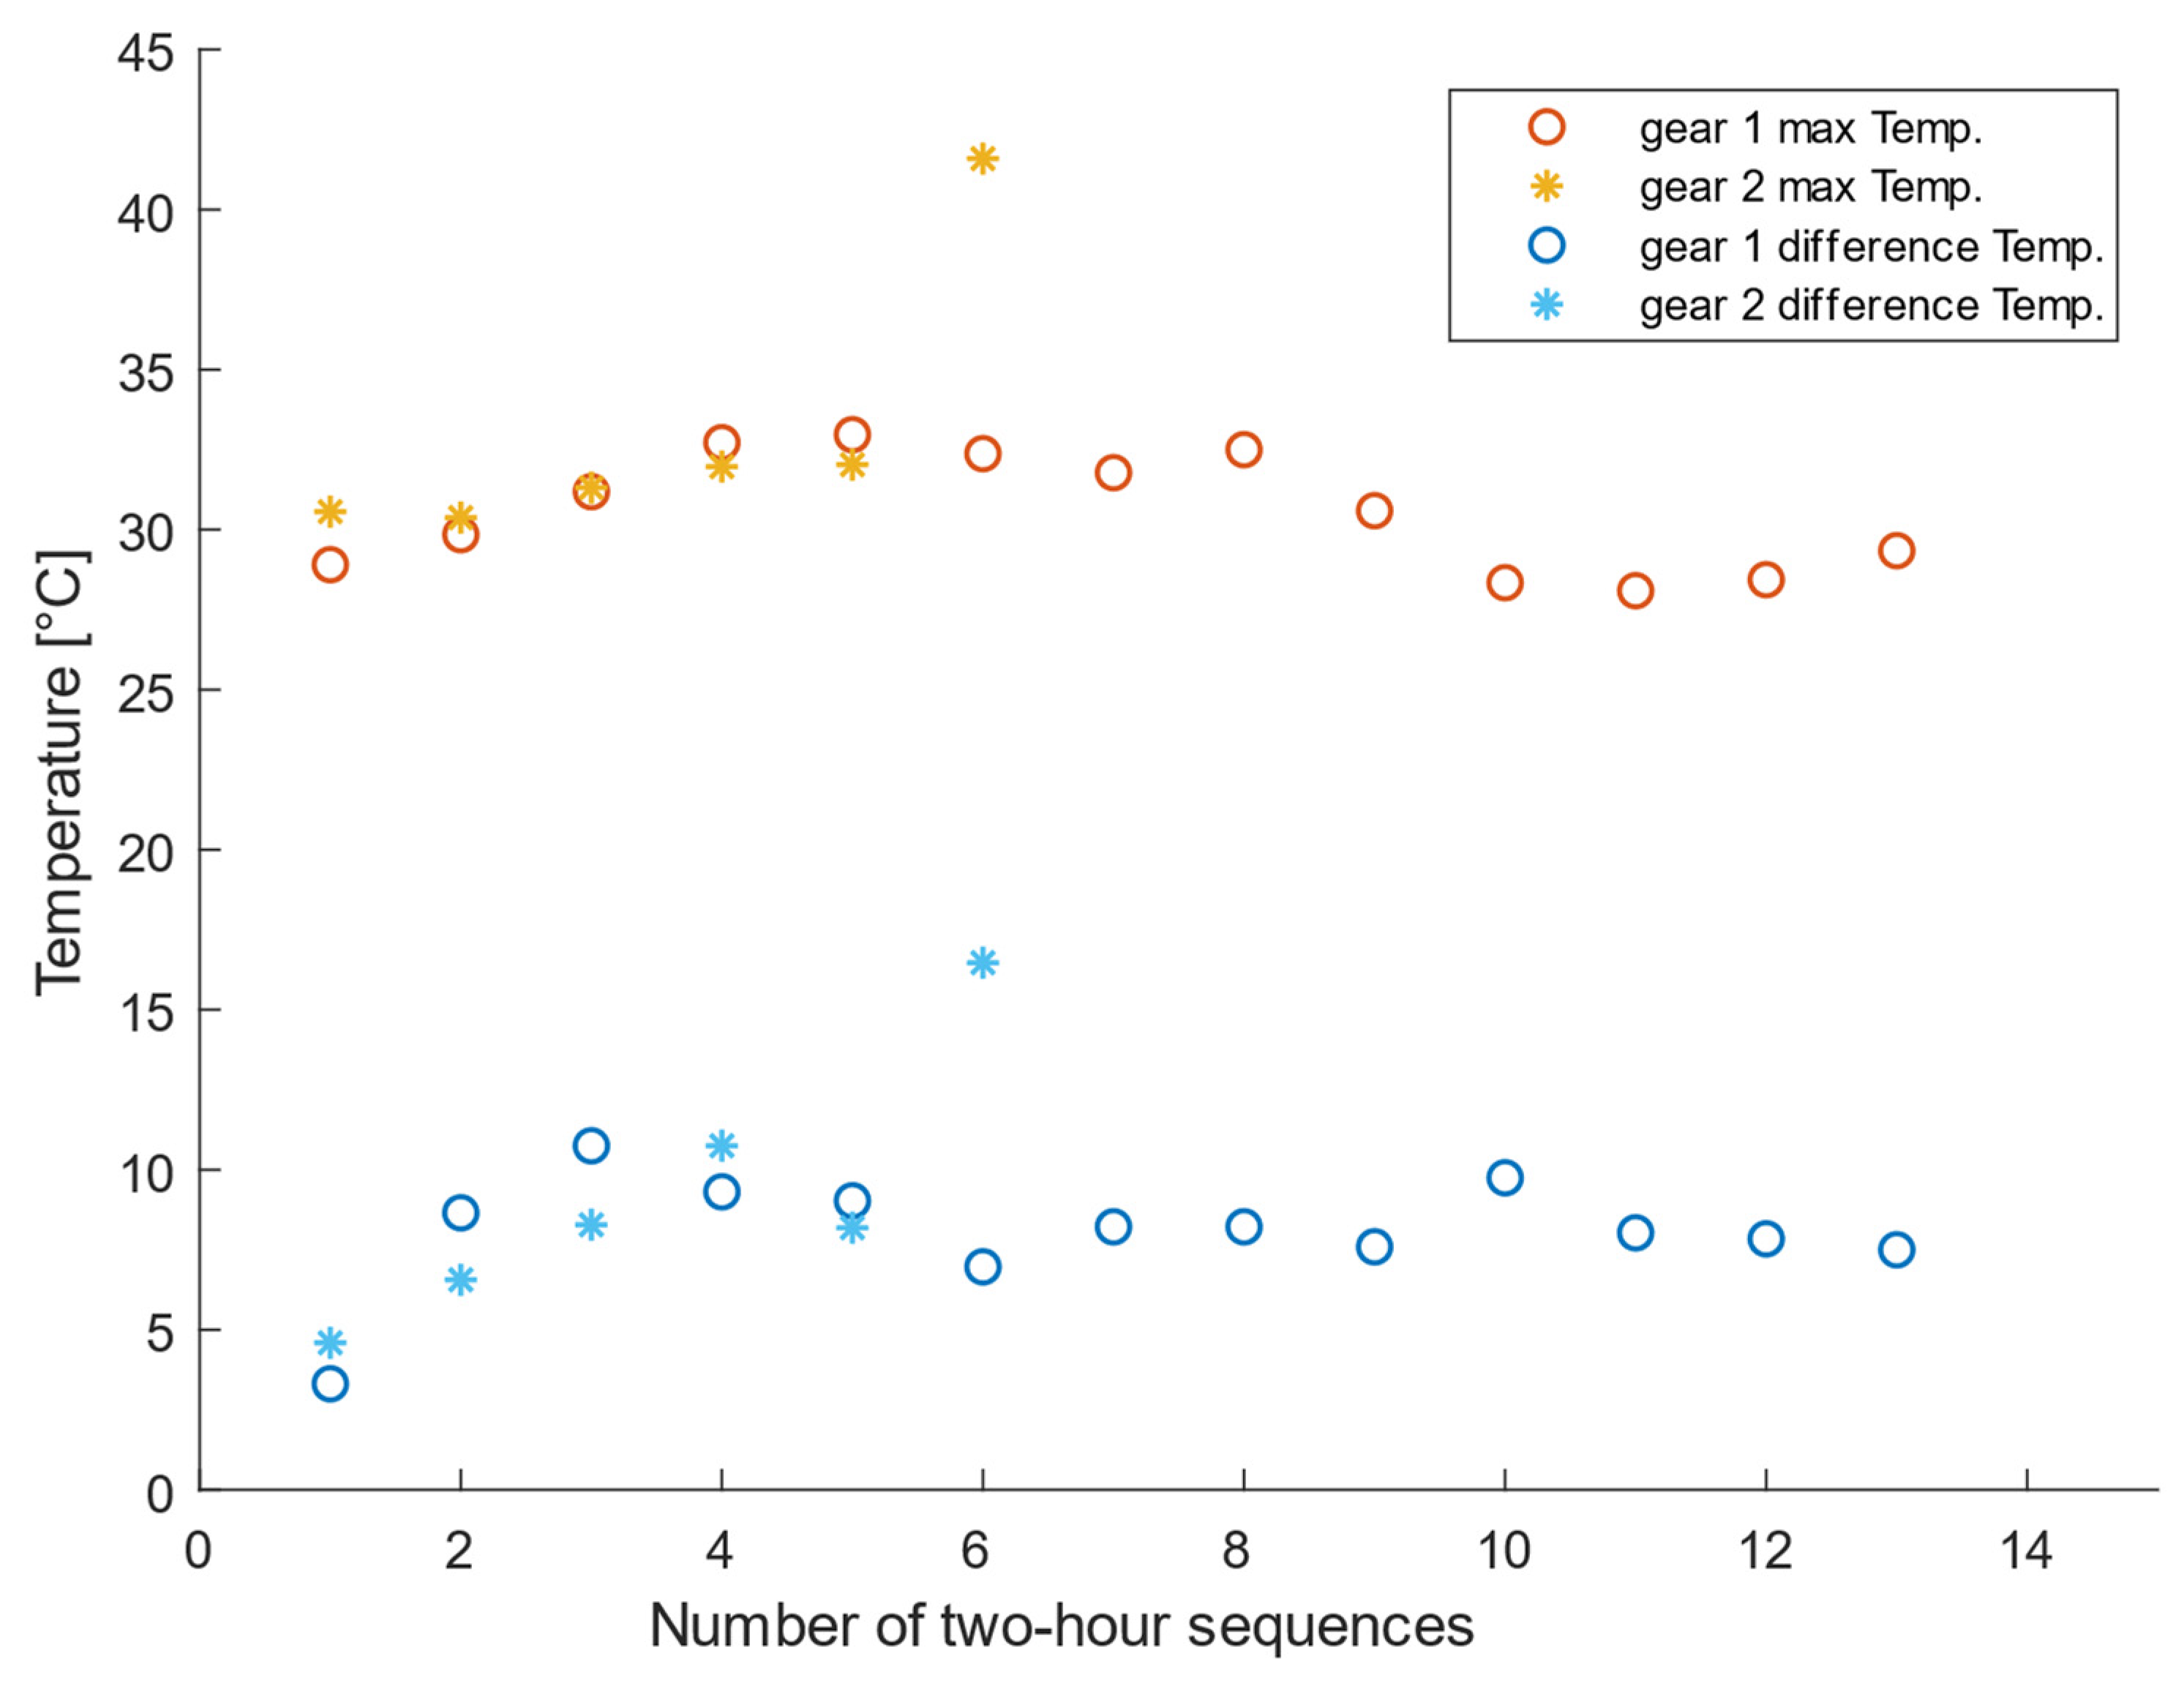
3.2. Temperature
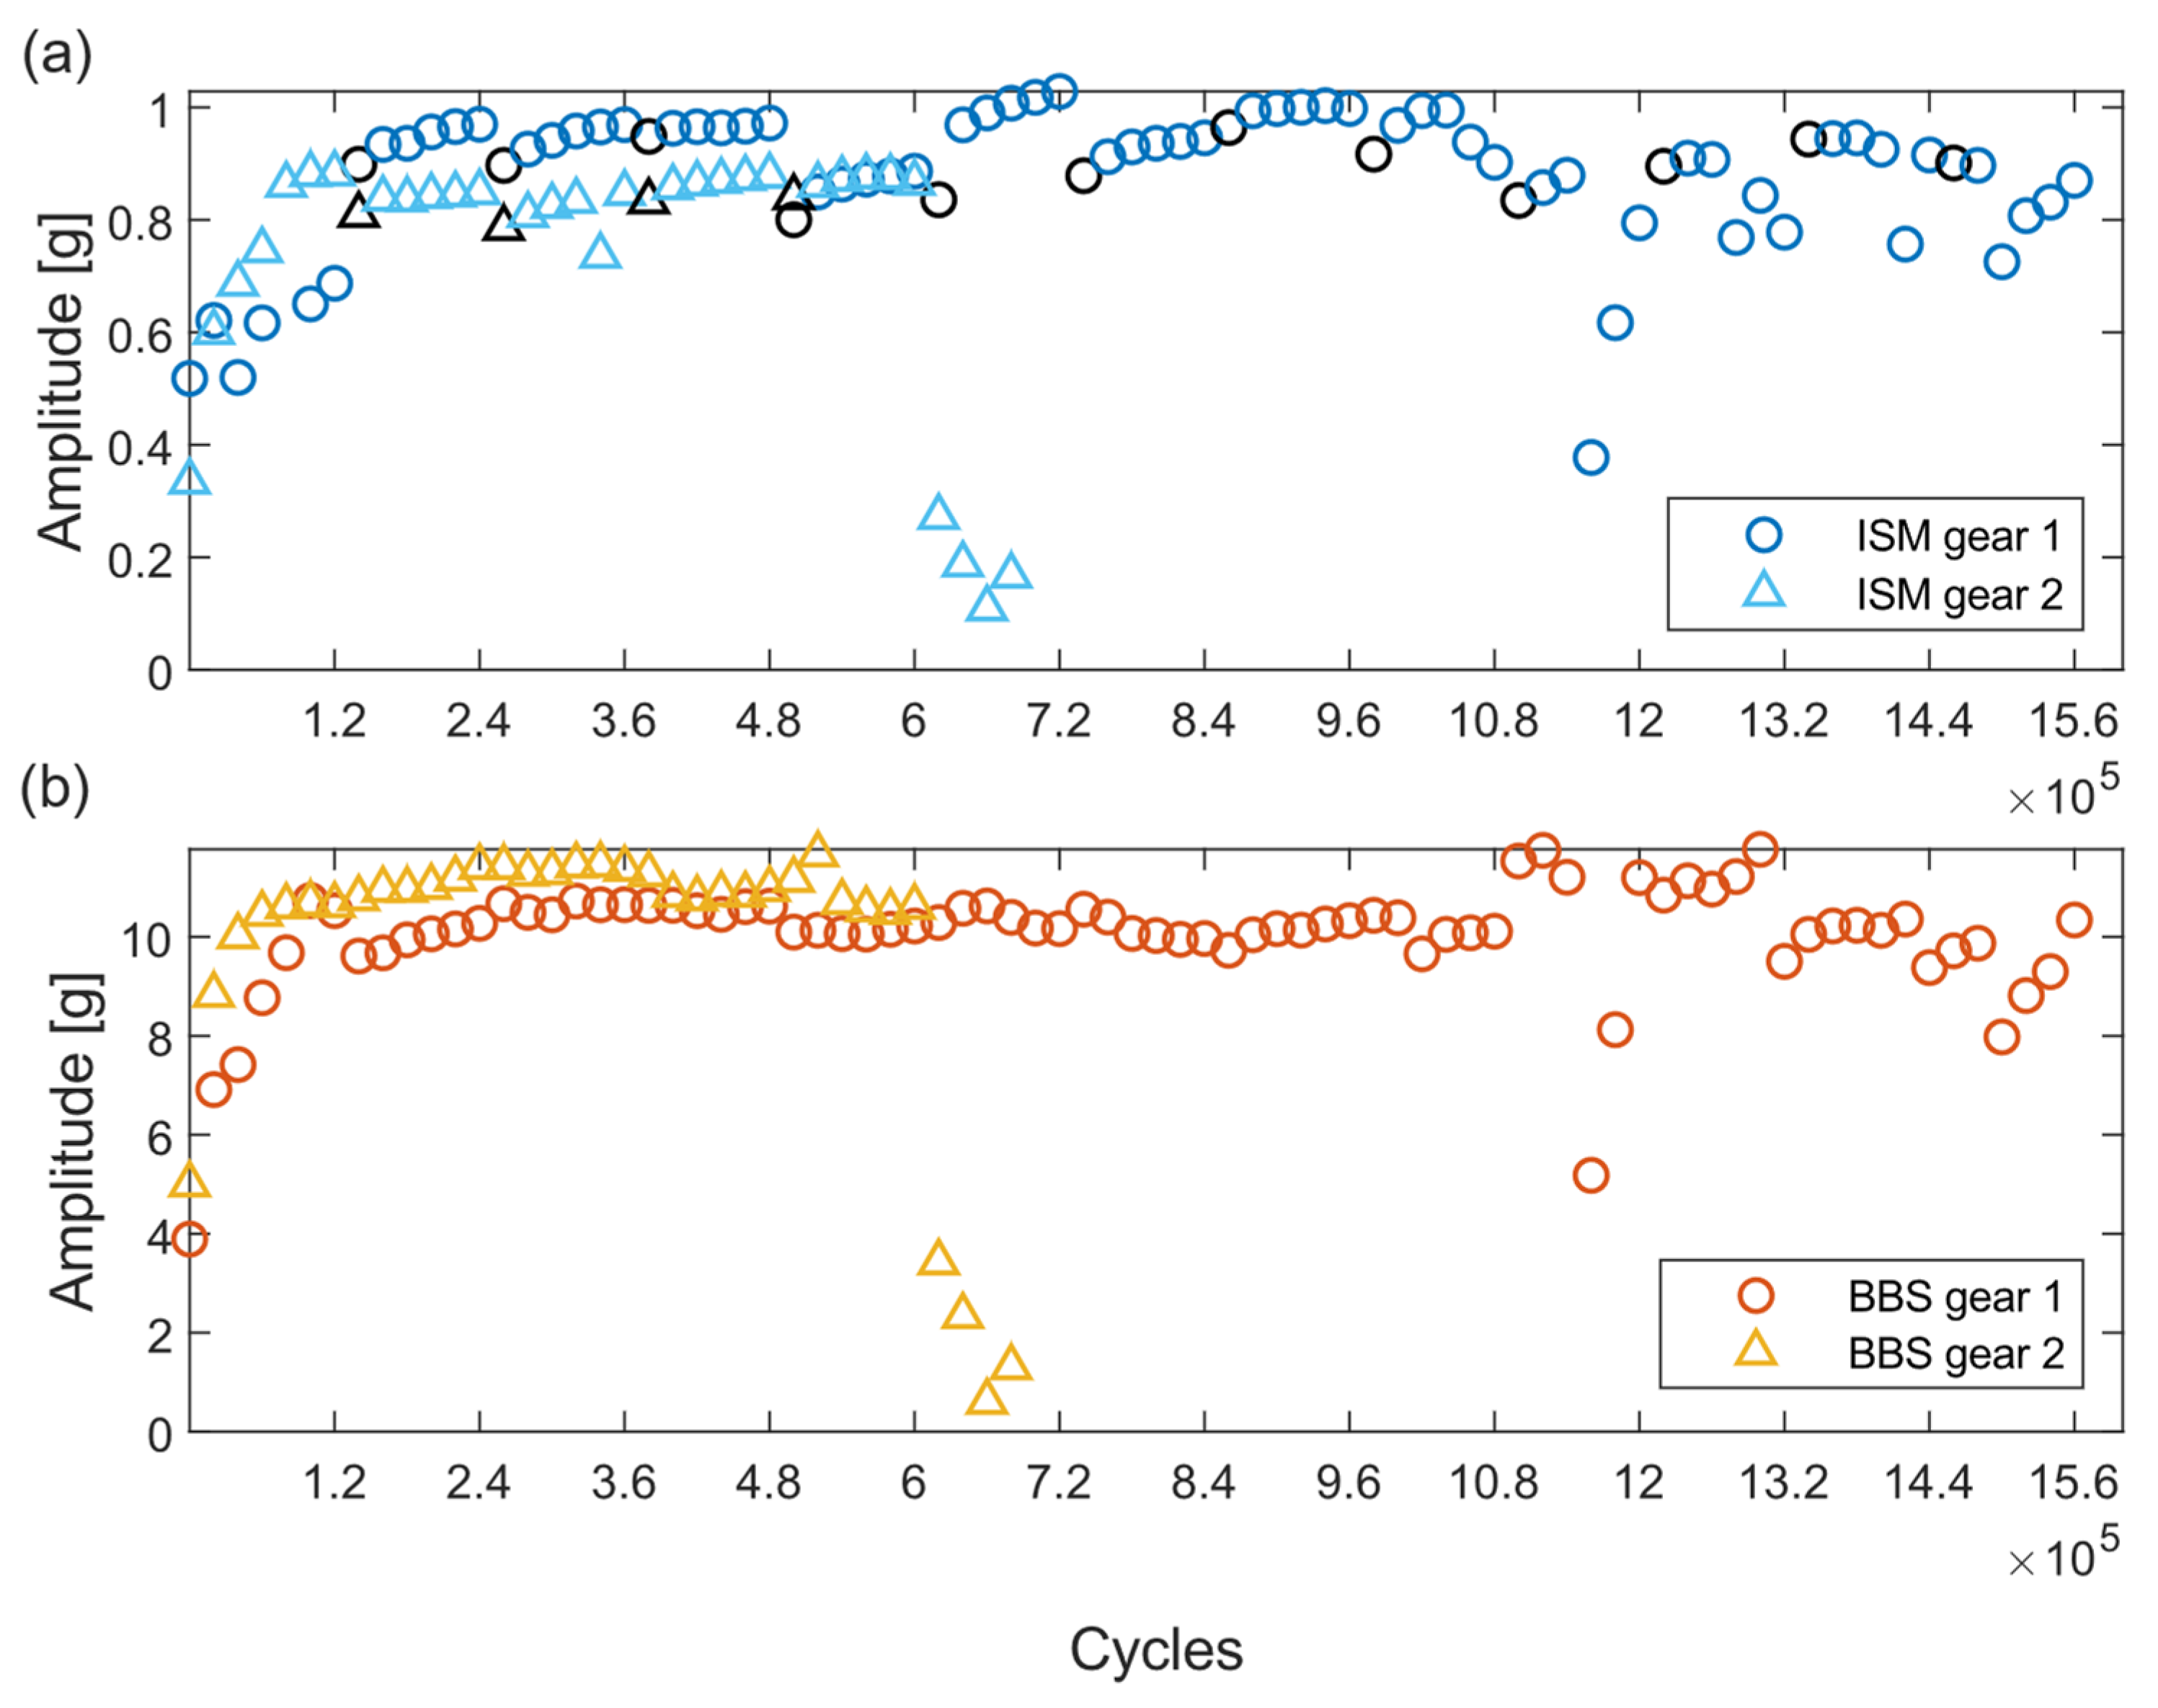
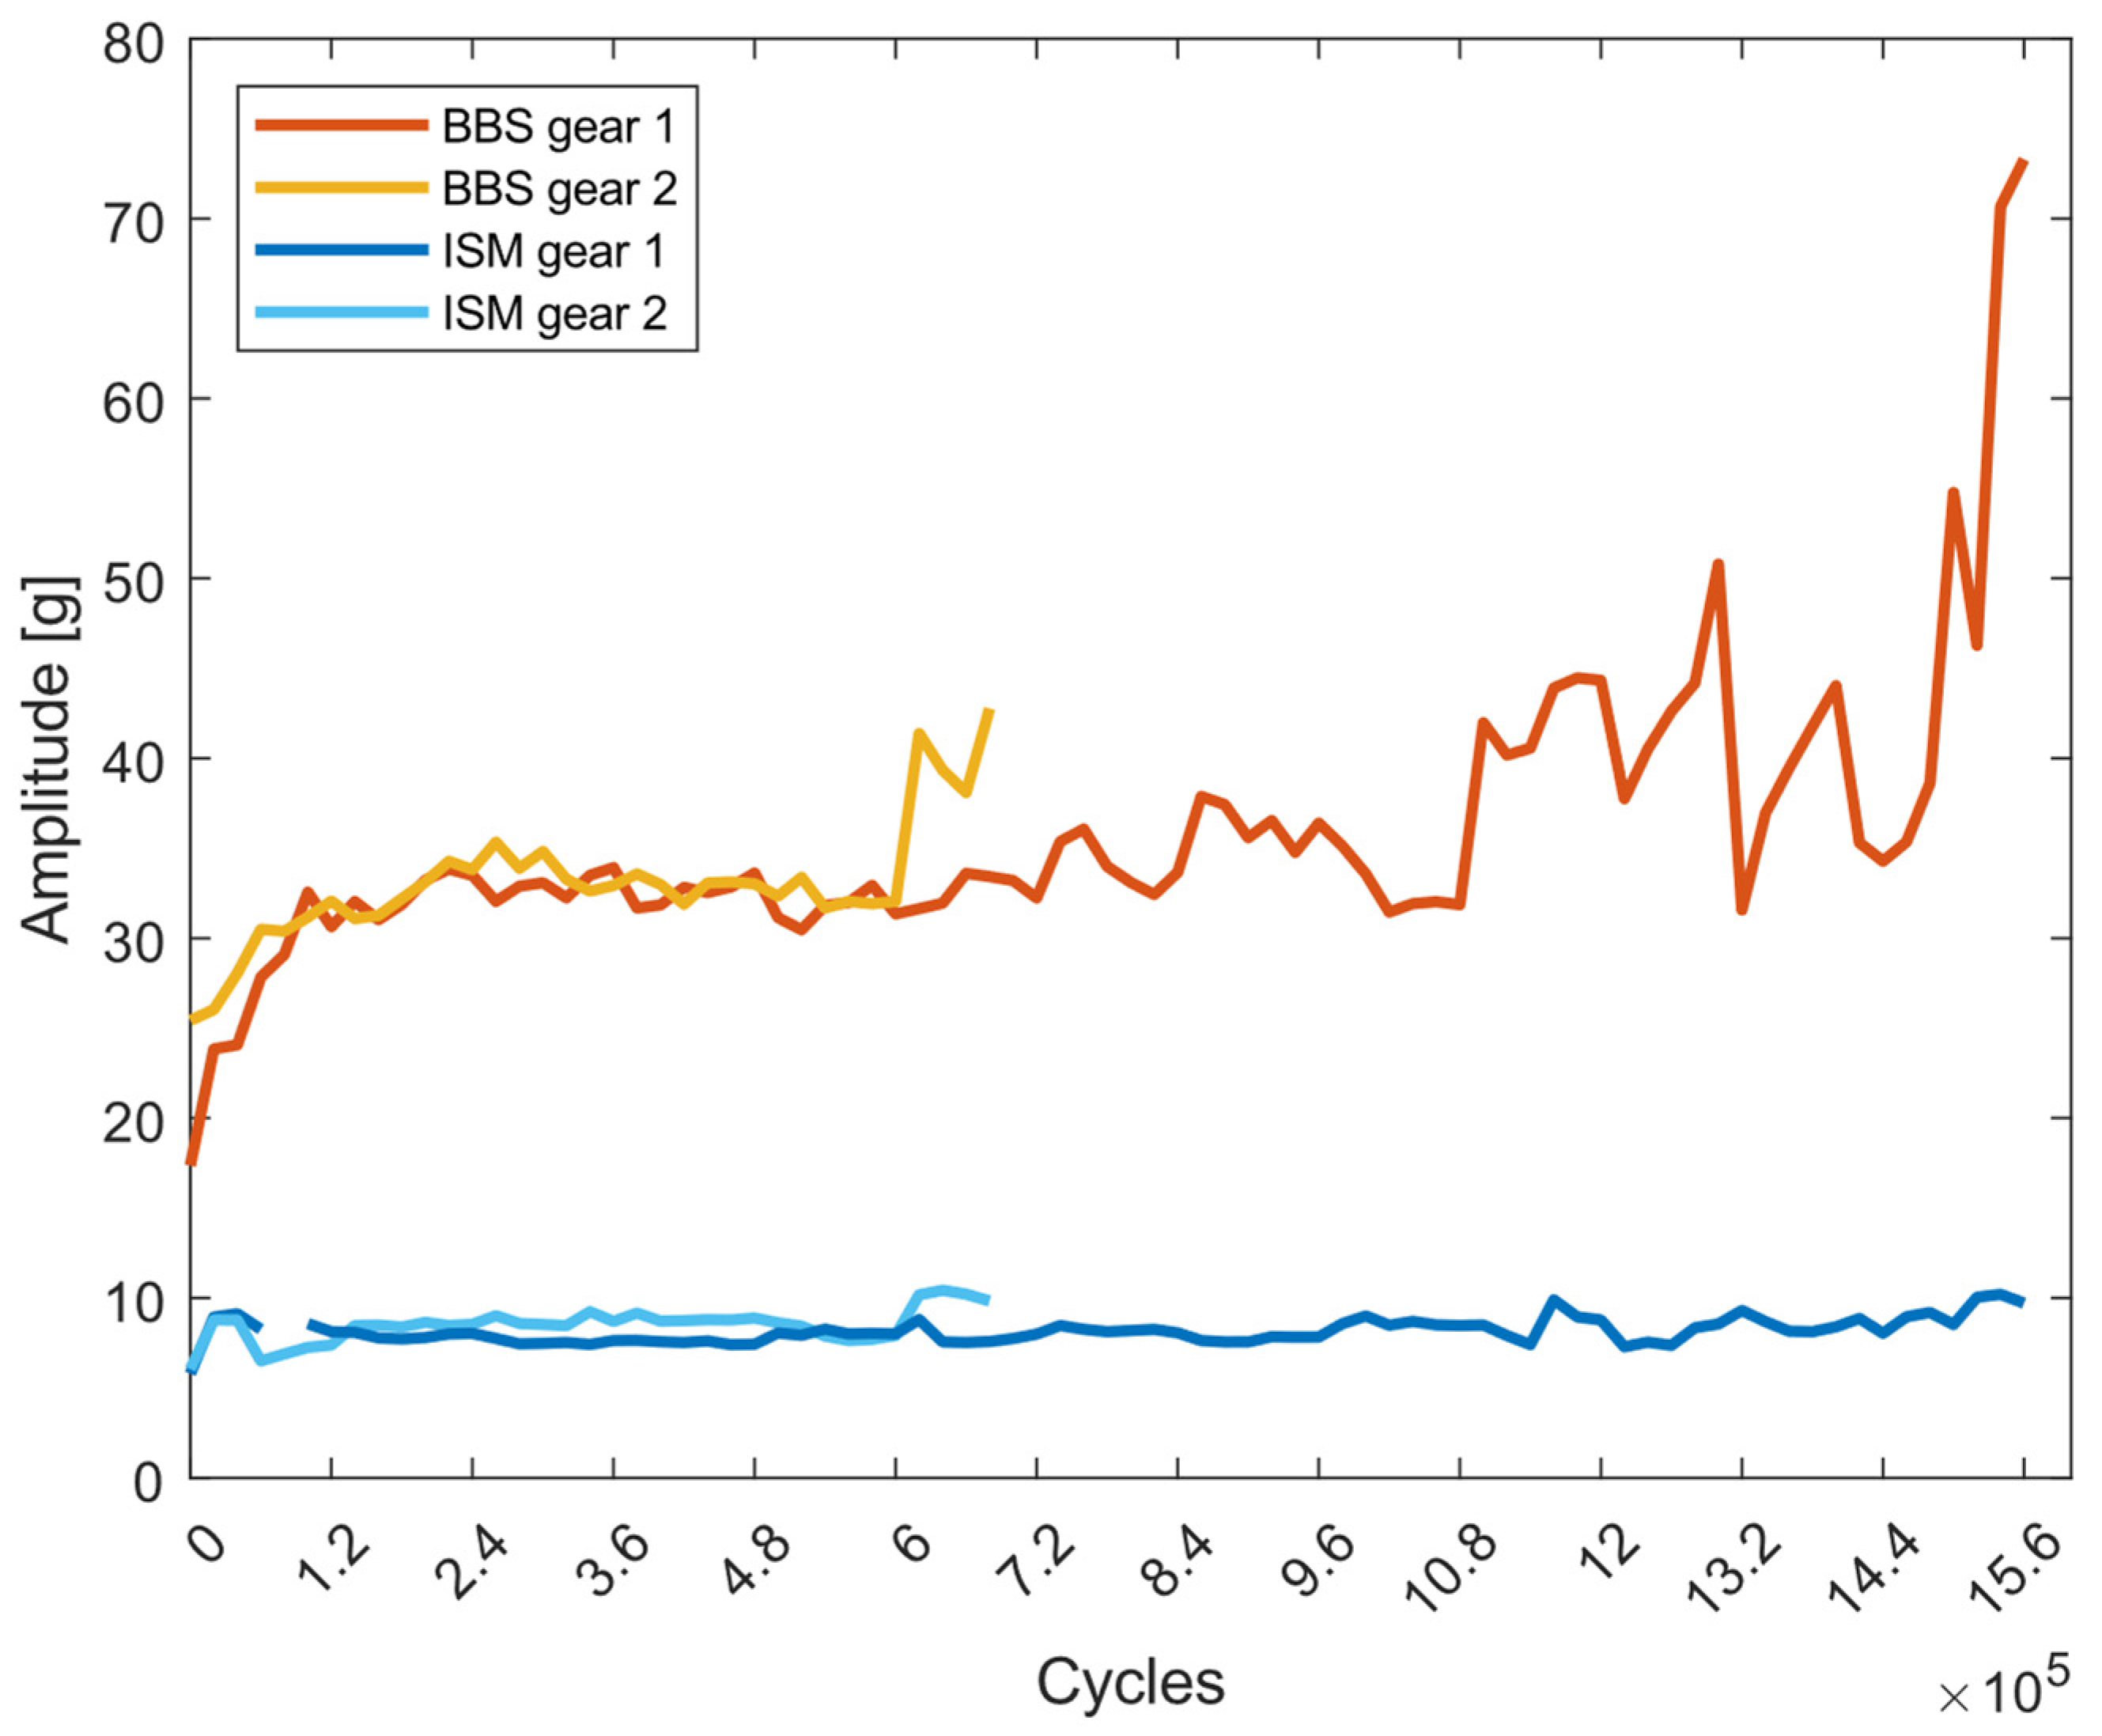
3.3. Acceleration Signal Properties
3.4. Gear Condition Metrics
4. Discussion
4.1. Wear
4.2. Temperature Sensor
4.3. Vibration Analysis
5. Conclusions
Author Contributions
Funding
Institutional Review Board Statement
Informed Consent Statement
Data Availability Statement
Conflicts of Interest
Abbreviations
| Term | Abbreviation |
| Polyoxymethylene | POM |
| Gear Mesh Frequency | GMF |
| Gear Condition Metrics | GCMs |
| Energy Ratio | ER |
| In situ Sensor Module | ISM |
| Bluetooth Low Energy | BLE |
| Bearing Block Sensors | BBSs |
| Lateral Surface Area | LSA |
References
- Eyre, T.S. Wear characteristics of metals. Tribol. Int. 1976, 9, 203–212. [Google Scholar] [CrossRef]
- Smith, J.D. Gear Noise and Vibration, 2nd ed.; Review and Expanded; Marcel Dekker: New York, NY, USA; Basel, Switzerland, 2003; ISBN 0-8247-4129-3. [Google Scholar]
- Feng, K.; Ji, J.C.; Ni, Q.; Beer, M. A review of vibration-based gear wear monitoring and prediction techniques. Mech. Syst. Signal Process. 2023, 182, 109605. [Google Scholar] [CrossRef]
- Kuang, J.H.; Lin, A.D. The Effect of Tooth Wear on the Vibration Spectrum of a Spur Gear Pair. J. Vib. Acoust. 2001, 123, 311–317. [Google Scholar] [CrossRef]
- Mott, R.L.; Vavrek, E.M.; Wang, J. Machine Elements in Mechanical Design, 6th ed.; Pearson Education: New York, NY, USA, 2018; ISBN 978-0-13-444118-4. [Google Scholar]
- Chen, X.; Wang, S.; Qiao, B.; Chen, Q. Basic research on machinery fault diagnostics: Past, present, and future trends. Front. Mech. Eng. 2018, 13, 264–291. [Google Scholar] [CrossRef]
- Lewicki, D.; Lambert, N.A.; Wagoner, R.S. Evaluation of MEMS-Based Wireless Accelerometer Sensors in Detecting Gear Tooth Faults in Helicopter Transmissions; NASA: Washington, DC, USA, 2015.
- Kumar, A.; Parey, A.; Kankar, P.K. Vibration based fault detection of polymer gear. Mater. Today Proc. 2021, 44, 2116–2120. [Google Scholar] [CrossRef]
- Martin, G.; Vogel, S.; Schirra, T.; Vorwerk-Handing, G.; Kirchner, E. Methodical Evaluation of Sensor Positions for Condition Monitoring of Gears. In NordDesign 2018 Proceedings of the NordDesign 2018, Linköping, Sweden, 14–17August 2018; Ekströmer, P., Schütte, S., Ölvander, J., Eds.; The Design Society: Glasgow, UK, 2018; ISBN 978-91-7685-185-2. [Google Scholar]
- Chin, Z.Y.; Borghesani, P.; Smith, W.A.; Randall, R.B.; Peng, Z. Monitoring gear wear with transmission error. Wear 2023, 523, 204803. [Google Scholar] [CrossRef]
- Smith, W.; Deshpande, L.; Randall, R.; Li, H. Gear diagnostics in a planetary gearbox: A study using internal and external vibration signals. Int J Cond. Monit. 2013, 3, 36–41. [Google Scholar] [CrossRef]
- Peters, J.; Ott, L.; Dörr, M.; Gwosch, T.; Matthiesen, S. Sensor-integrating gears: Wear detection by in-situ MEMS acceleration sensors. Forsch. Ingenieurwes 2021, 86, 421–432. [Google Scholar] [CrossRef]
- Binder, M.; Stapff, V.; Heinig, A.; Schmitt, M.; Seidel, C.; Reinhart, G. Additive manufacturing of a passive, sensor-monitored 16MnCr5 steel gear incorporating a wireless signal transmission system. Procedia CIRP 2022, 107, 505–510. [Google Scholar] [CrossRef]
- Bonaiti, L.; Knoll, E.; Otto, M.; Gorla, C.; Stahl, K. The Effect of Sensor Integration on the Load Carrying Capacity of Gears. Machines 2022, 10, 888. [Google Scholar] [CrossRef]
- Elforjani, B.; Xu, Y.; Brethee, K.; Wu, Z.; Gu, F.; Ball, A. Monitoring gearbox using a wireless temperature node powered by thermal energy harvesting module. In Proceedings of the 23rd International Conference on Automation and Computing (ICAC), Huddersfield, UK, 7–8 September 2017; pp. 1–6. [Google Scholar] [CrossRef]
- Resendiz-Ochoa, E.; Saucedo-Dorantes, J.J.; Benitez-Rangel, J.P.; Osornio-Rios, R.A.; Morales-Hernandez, L.A. Novel Methodology for Condition Monitoring of Gear Wear Using Supervised Learning and Infrared Thermography. Appl. Sci. 2020, 10, 506. [Google Scholar] [CrossRef]
- Alharbi, K.A.M. Wear and Mechanical Contact Behavior of Polymer Gears. J. Tribol. 2019, 141, 011101. [Google Scholar] [CrossRef]
- Hooke, C.J.; Mao, K.; Walton, D.; Breeds, A.R.; Kukureka, S.N. Measurement and Prediction of the Surface Temperature in Polymer Gears and Its Relationship to Gear Wear. J. Tribol. 1993, 115, 119–124. [Google Scholar] [CrossRef]
- Mao, K.; Li, W.; Hooke, C.J.; Walton, D. Polymer gear surface thermal wear and its performance prediction. Tribol. Int. 2010, 43, 433–439. [Google Scholar] [CrossRef]
- Matkovič, S.; Kalin, M. Effects of slide-to-roll ratio and temperature on the tribological behaviour in polymer-steel contacts and a comparison with the performance of real-scale gears. Wear 2021, 477, 203789. [Google Scholar] [CrossRef]
- Pogačnik, A.; Kalin, M. Parameters influencing the running-in and long-term tribological behaviour of polyamide (PA) against polyacetal (POM) and steel. Wear 2012, 290–291, 140–148. [Google Scholar] [CrossRef]
- Hameed, Z.; Hong, Y.S.; Cho, Y.M.; Ahn, S.H.; Song, C.K. Condition monitoring and fault detection of wind turbines and related algorithms: A review. Renew. Sustain. Energy Rev. 2009, 13, 1–39. [Google Scholar] [CrossRef]
- Ziaran, S.; Darula, R. Determination of the State of Wear of High Contact Ratio Gear Sets by Means of Spectrum and Cepstrum Analysis. J. Vib. Acoust. 2013, 135. [Google Scholar] [CrossRef]
- Lebold, M.; McClintic, K.; Campbell, R.; Byington, C.; Maynard, K. Review of Vibration Analysis Methods for Gearbox Diagnostics and Prognostics. In Proceedings of the 54th Meeting of the Society for Machinery Failure Prevention Technology, Virginia Beach, VA, USA, 1–4 May 2000. [Google Scholar]
- Večeř, P.; Kreidl, M.; Šmíd, R. Condition Indicators for Gearbox Condition Monitoring Systems. Acta Polytech. 2005, 45, 35–43. [Google Scholar] [CrossRef] [PubMed]
- Amarnath, M.; Praveen Krishna, I.R.; Krishnamurthy, R. Experimental Investigations to Study the Effectiveness of Cepstral Features to Detect Surface Fatigue Wear Development in a FZG Spur Geared System Subjected to Accelerated Tests. Arch. Acoust. 2023, 46, 479–489. [Google Scholar] [CrossRef]
- Evans, S.M.; Keogh, P.S. Efficiency and running temperature of a polymer–steel spur gear pair from slip/roll ratio fundamentals. Tribol. Int. 2016, 97, 379–389. [Google Scholar] [CrossRef]
- Hu, C.; Smith, W.A.; Randall, R.B.; Peng, Z. Development of a gear vibration indicator and its application in gear wear monitoring. Mech. Syst. Signal Process. 2016, 76–77, 319–336. [Google Scholar] [CrossRef]
- Mao, K.; Li, W.; Hooke, C.J.; Walton, D. Friction and wear behaviour of acetal and nylon gears. Wear 2009, 267, 639–645. [Google Scholar] [CrossRef]
- Shannon, C.E. Communication in the Presence of Noise. Proc. IRE 1949, 37, 10–21. [Google Scholar] [CrossRef]


| GCM | Formula | Description | |
|---|---|---|---|
| Energy Ratio (ER) | (2) | : standard deviation of the differential signal of a data sample : standard deviation of the regular signal of a data sample | |
| NA4* | (3) | : number of data points in a vibration signal : residual vibration signal : residual vibration signal of a data sample of the unworn gear | |
| Signal | Composite |
|---|---|
| Regular | Shaft frequency and plus sidebands up to fourth harmonic |
| Differential | Normal vibration signal with removed shaft frequency and plus sidebands up to fourth harmonic |
| Residual | Normal vibration signal with removed shaft frequency and plus first order sidebands |
| In Situ Sensor Module (ISM) | Bearing Block Sensors (BBSs) | |
|---|---|---|
| Name | ADXL05 | PCB-356A02 |
| Type | MEMS with analog output | Piezo |
| Measurement range | ±100 g | ±50 g |
| Frequency Range | 23 kHz | 5 kHz |
| Resonance Frequency | 42 kHz | 25 kHz |
| Sensitivity | 14.3 mV/g | 10 mV/g |
| Sensitivity change from 20 °C to 50 °C | ±2% | −10–0% |
| Noise Density | 125 µg/√Hz | 5 µg/√Hz |
| POM Gear | Steel Gear | |
|---|---|---|
| Material | POM | steel |
| Fabrication | milled | milled |
| Module | 1.5 | 1.5 |
| Number of teeth | 55 | 65 |
| Width | 17 mm | 10 mm |
| Diameter | 82.5 mm | 97.5 mm |
| Weight | 165 g | 742 g |
| Thermal conductivity | 0.31 W/m·K | 50.2 W/m·K |
| Shaft Frequency | ||||
|---|---|---|---|---|
| 16.7 Hz | 916.7 Hz | 1833.3 Hz | 2750 Hz | 3666.7 Hz |
Disclaimer/Publisher’s Note: The statements, opinions and data contained in all publications are solely those of the individual author(s) and contributor(s) and not of MDPI and/or the editor(s). MDPI and/or the editor(s) disclaim responsibility for any injury to people or property resulting from any ideas, methods, instructions or products referred to in the content. |
© 2024 by the authors. Licensee MDPI, Basel, Switzerland. This article is an open access article distributed under the terms and conditions of the Creative Commons Attribution (CC BY) license (https://creativecommons.org/licenses/by/4.0/).
Share and Cite
Hasenoehrl, S.; Peters, J.; Matthiesen, S. Integration of Sensors for Enhanced Condition Monitoring in Polymer Gears: A Comparative Study of Acceleration and Temperature Sensors. Appl. Sci. 2024, 14, 2240. https://doi.org/10.3390/app14062240
Hasenoehrl S, Peters J, Matthiesen S. Integration of Sensors for Enhanced Condition Monitoring in Polymer Gears: A Comparative Study of Acceleration and Temperature Sensors. Applied Sciences. 2024; 14(6):2240. https://doi.org/10.3390/app14062240
Chicago/Turabian StyleHasenoehrl, Sascha, Julian Peters, and Sven Matthiesen. 2024. "Integration of Sensors for Enhanced Condition Monitoring in Polymer Gears: A Comparative Study of Acceleration and Temperature Sensors" Applied Sciences 14, no. 6: 2240. https://doi.org/10.3390/app14062240