
Study on Hydration Heat Release Model and Its Influence Coefficient of Addition Concrete
Abstract
:1. Introduction
2. Concrete Hydration Exothermic Model and Its Finite Element Analysis Method
2.1. Introduction to Exothermic Modeling of Concrete Hydration
- Mono-exponential model
- 2.
- Hyperbolic model
- 3.
- Composite exponential model
- 4.
- Selection of hydration exothermic models
2.2. Finite Element Analysis Method for Exothermic Hydration of Concrete
3. Numerical Calculation Model and Its Accuracy Verification
3.1. Numerical Calculation Model
3.2. Semi-Adiabatic Temperature Rise Test
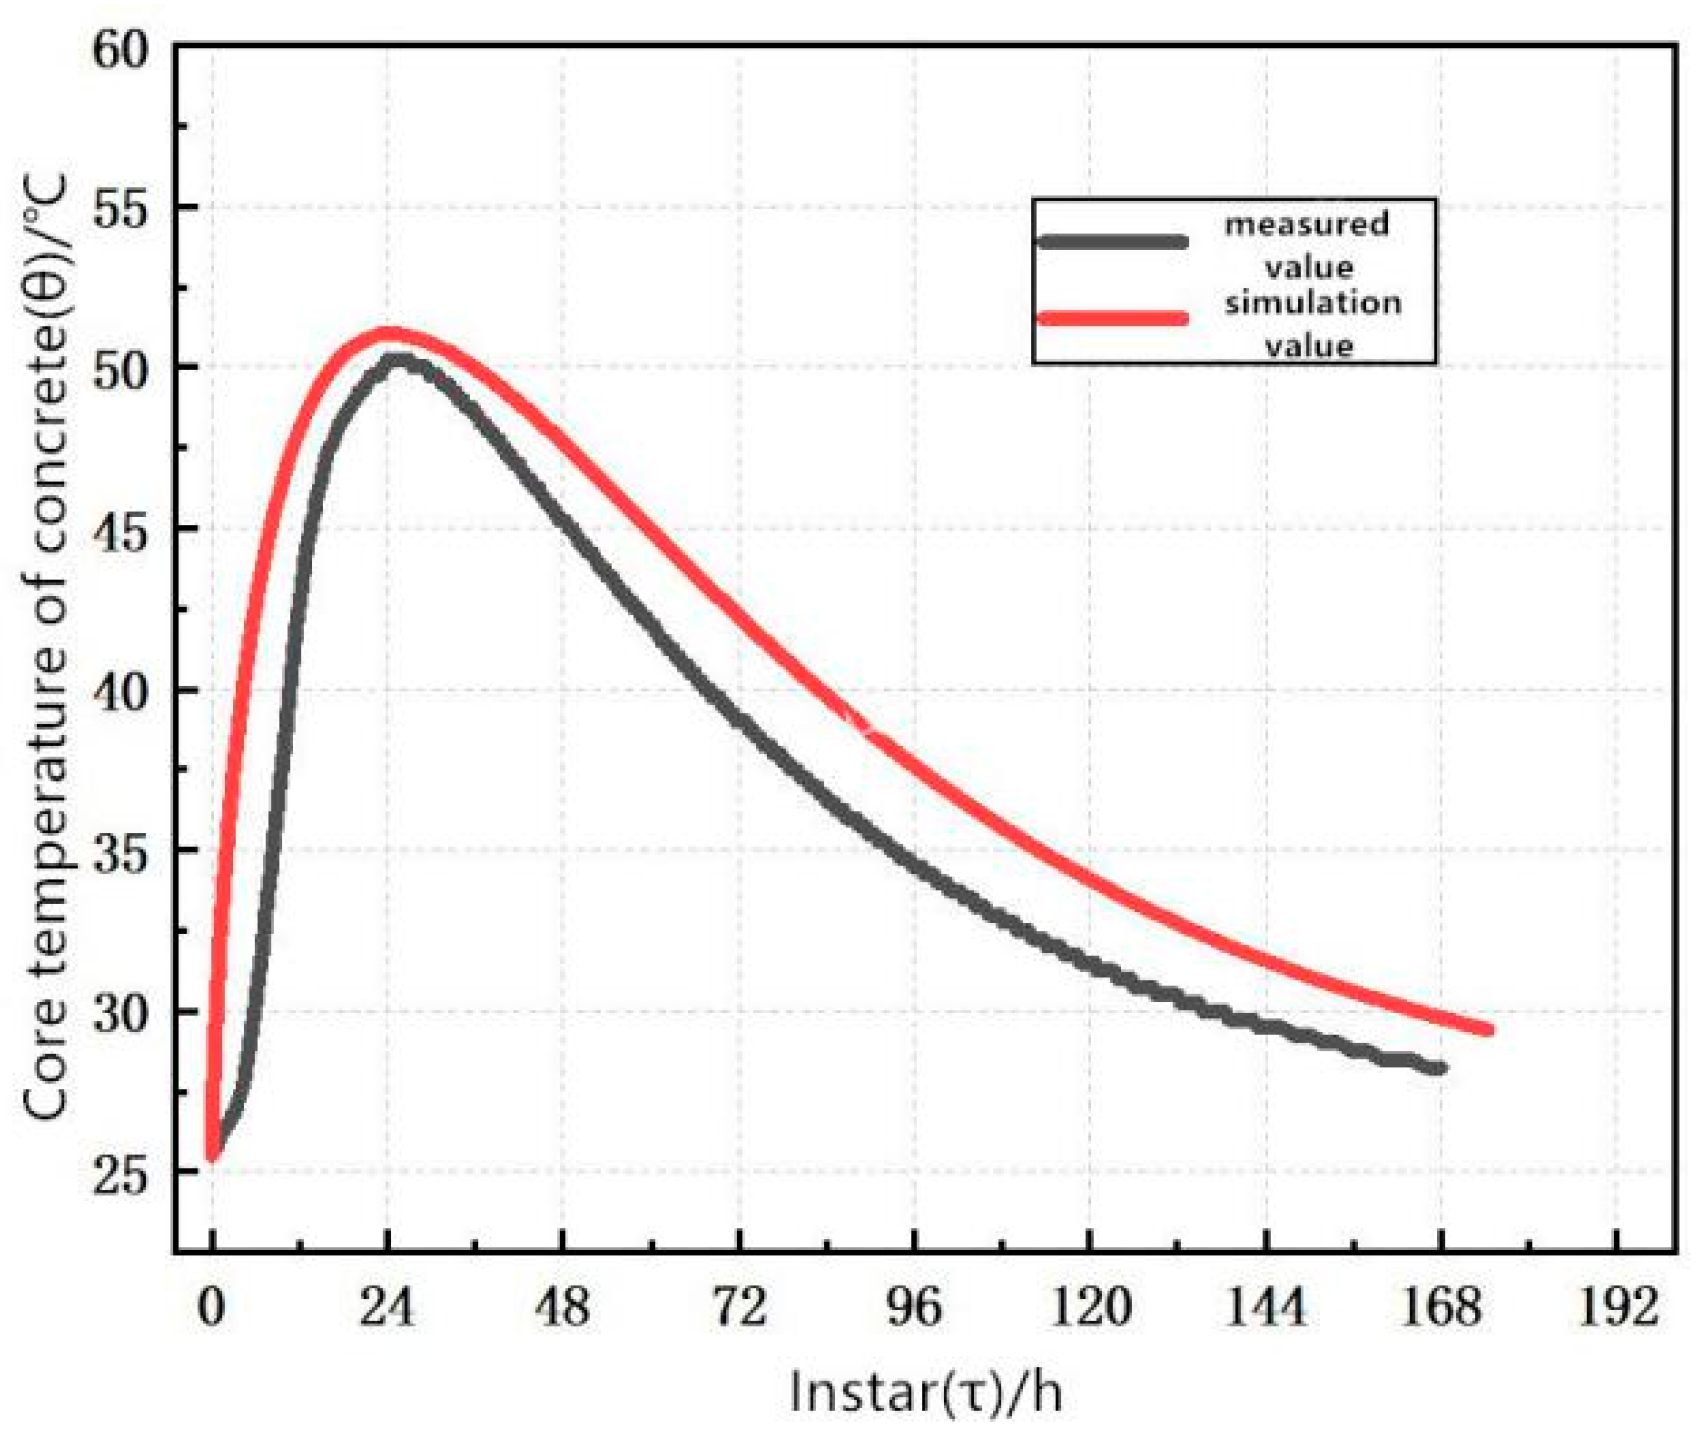
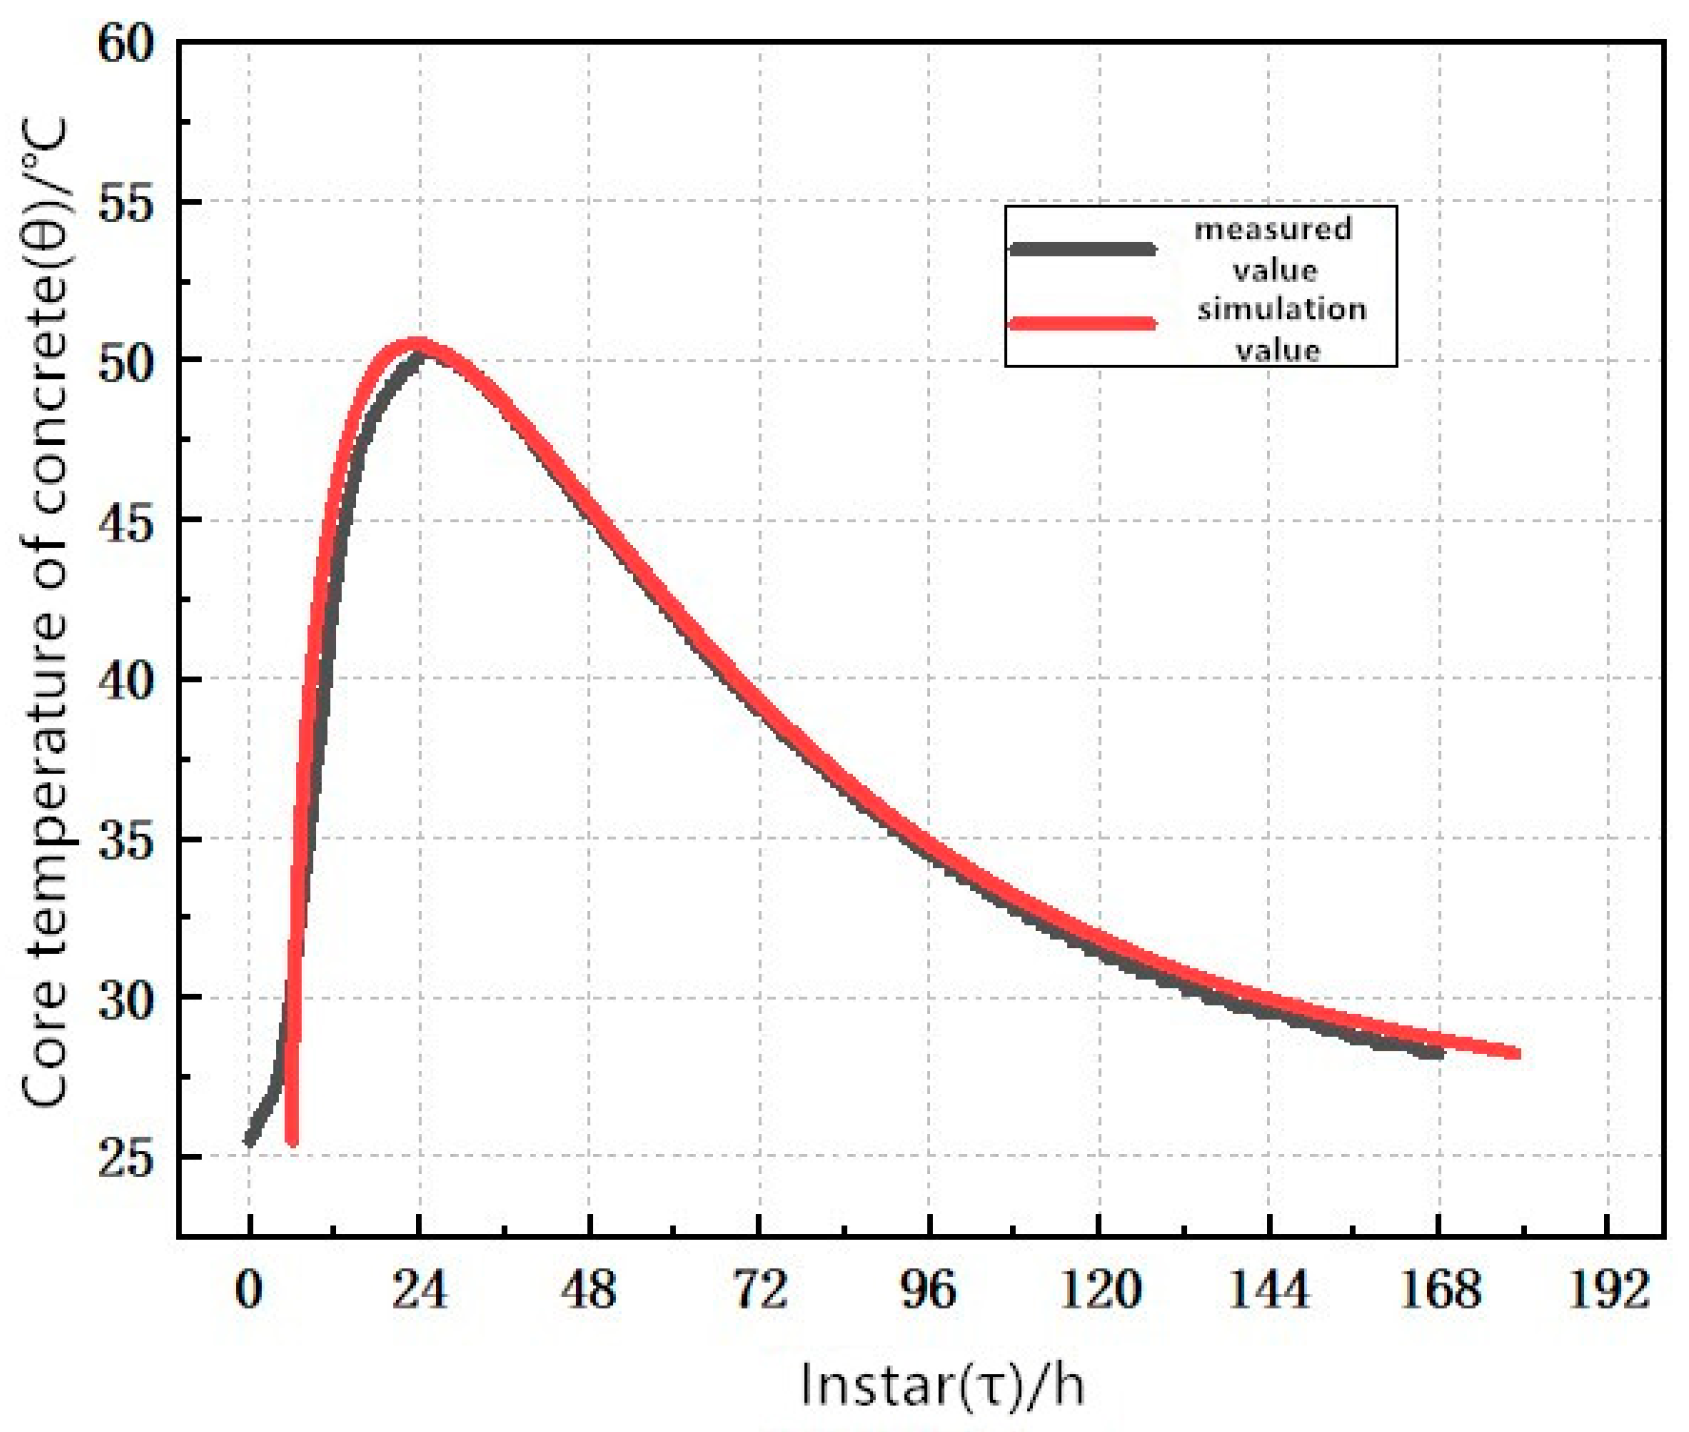
3.3. Validation of the Accuracy of the Numerical Method
4. Modeling of Heat of Hydration of Mineral Admixture Concrete
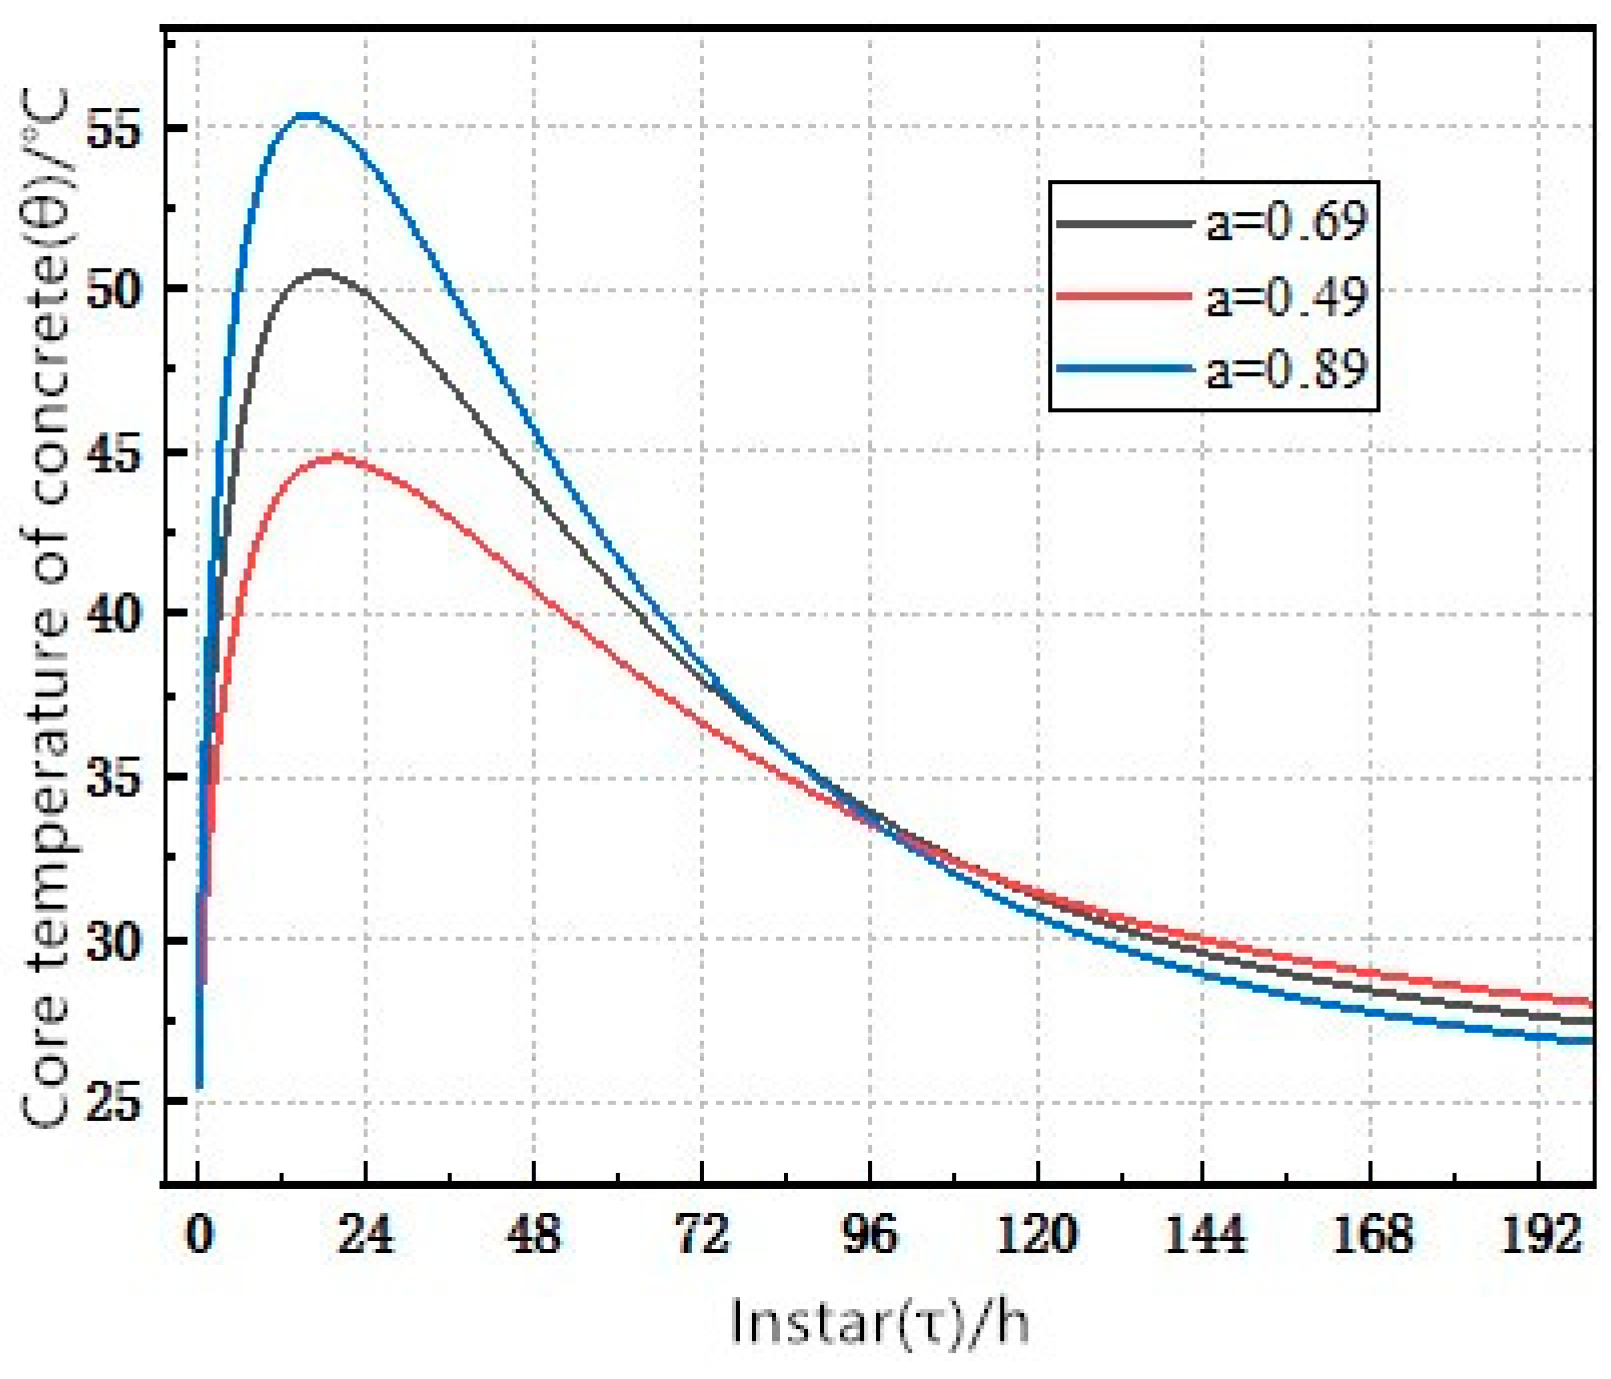
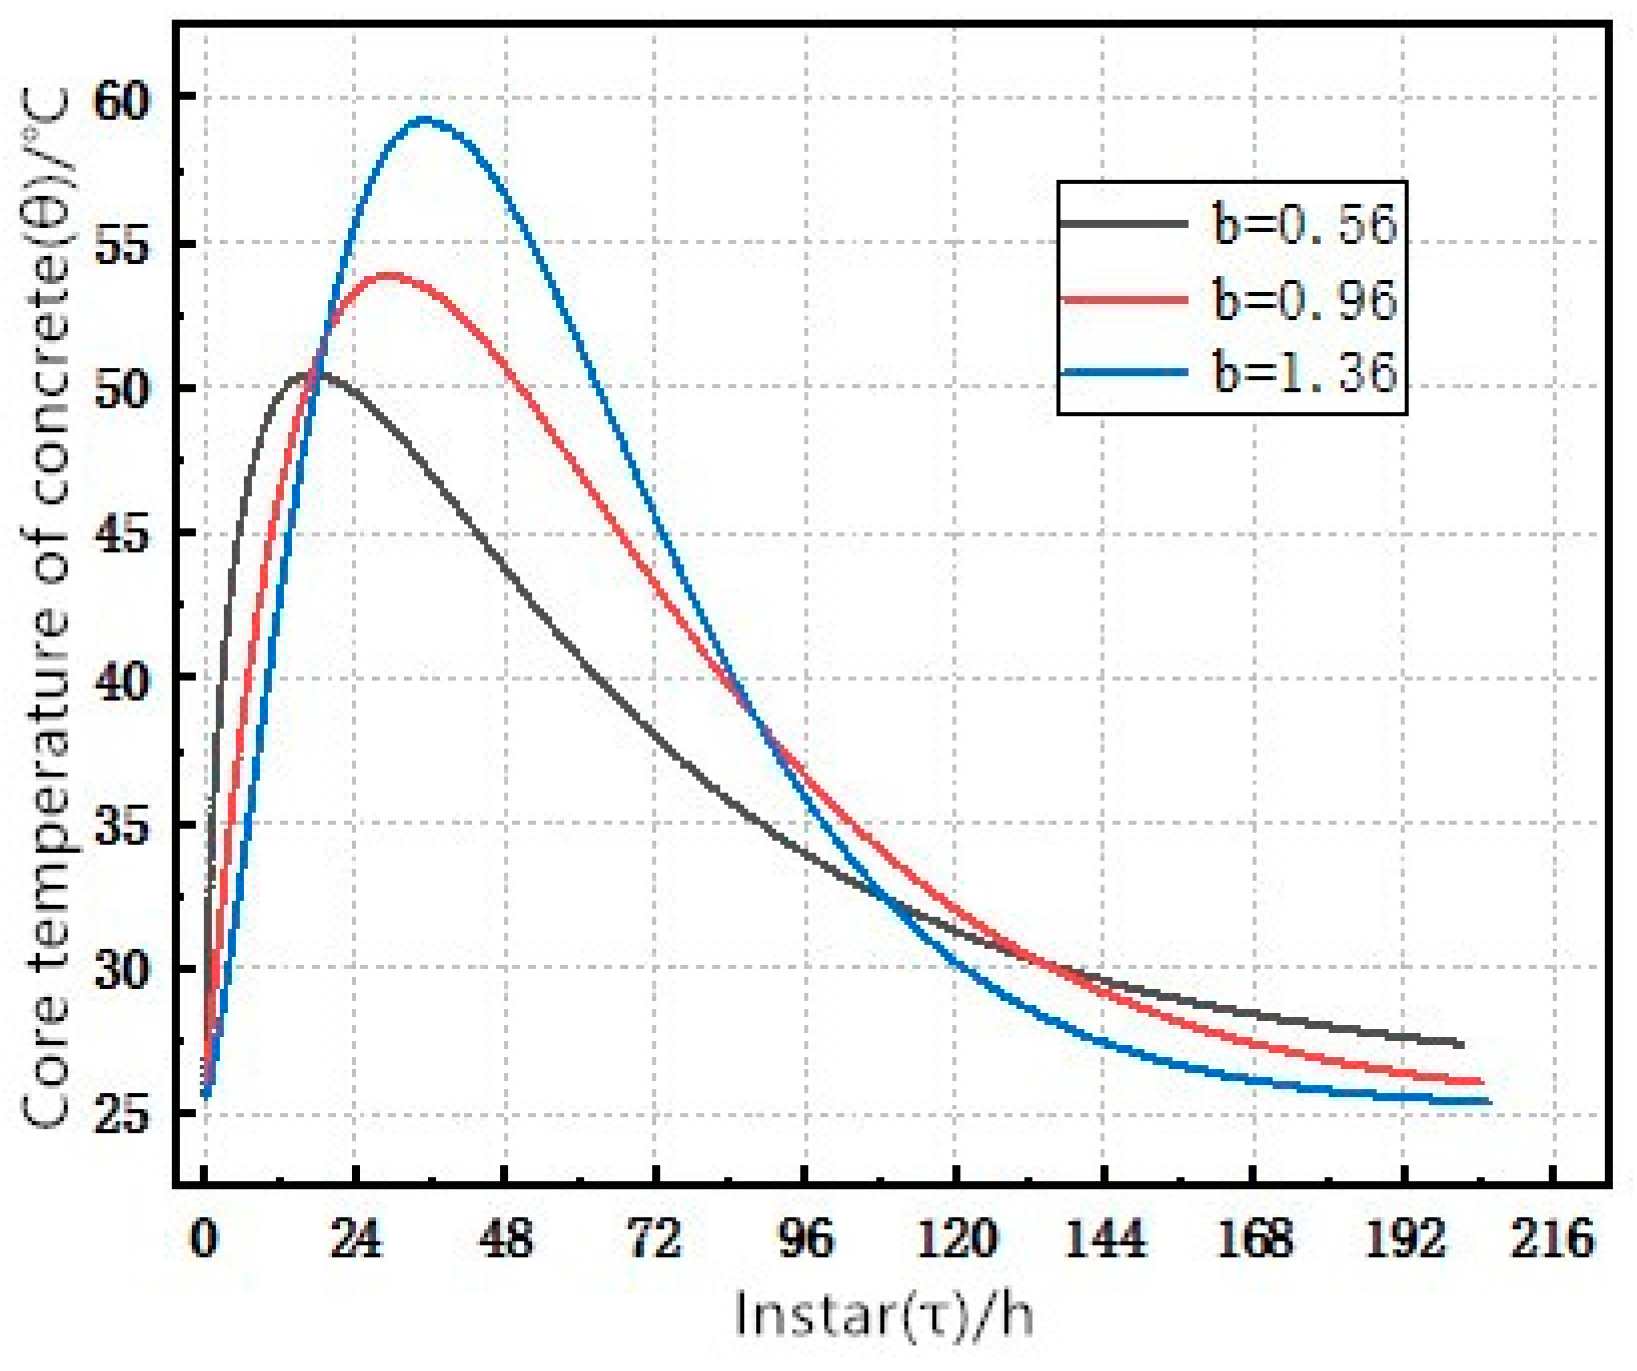
4.1. Sensitivity Analysis of Impact Coefficients of Hydration Exotherm Models
4.2. Data Fitting to Solve the Hydration Exothermic Model for Impact Coefficients
5. Conclusions
- (1)
- The smaller the influence coefficient a, the smaller the maximum temperature that can be reached, and the smaller the temperature change. However, there is no significant change in the effect of the influence coefficient a on the time it takes for concrete to reach the maximum temperature. Therefore, the maximum temperature of the concrete can be controlled by adjusting the influence coefficient a.
- (2)
- The smaller the influence coefficient b, the lower the maximum temperature that can be reached and the shorter is the time required to reach the maximum temperature. Therefore, the temperature profile of concrete can be adjusted by adjusting the influence coefficient b. The larger the influence coefficient b is, the “steeper” the temperature profile will be, and the smaller the influence coefficient b is, the more “shallow” the temperature profile will be.
- (3)
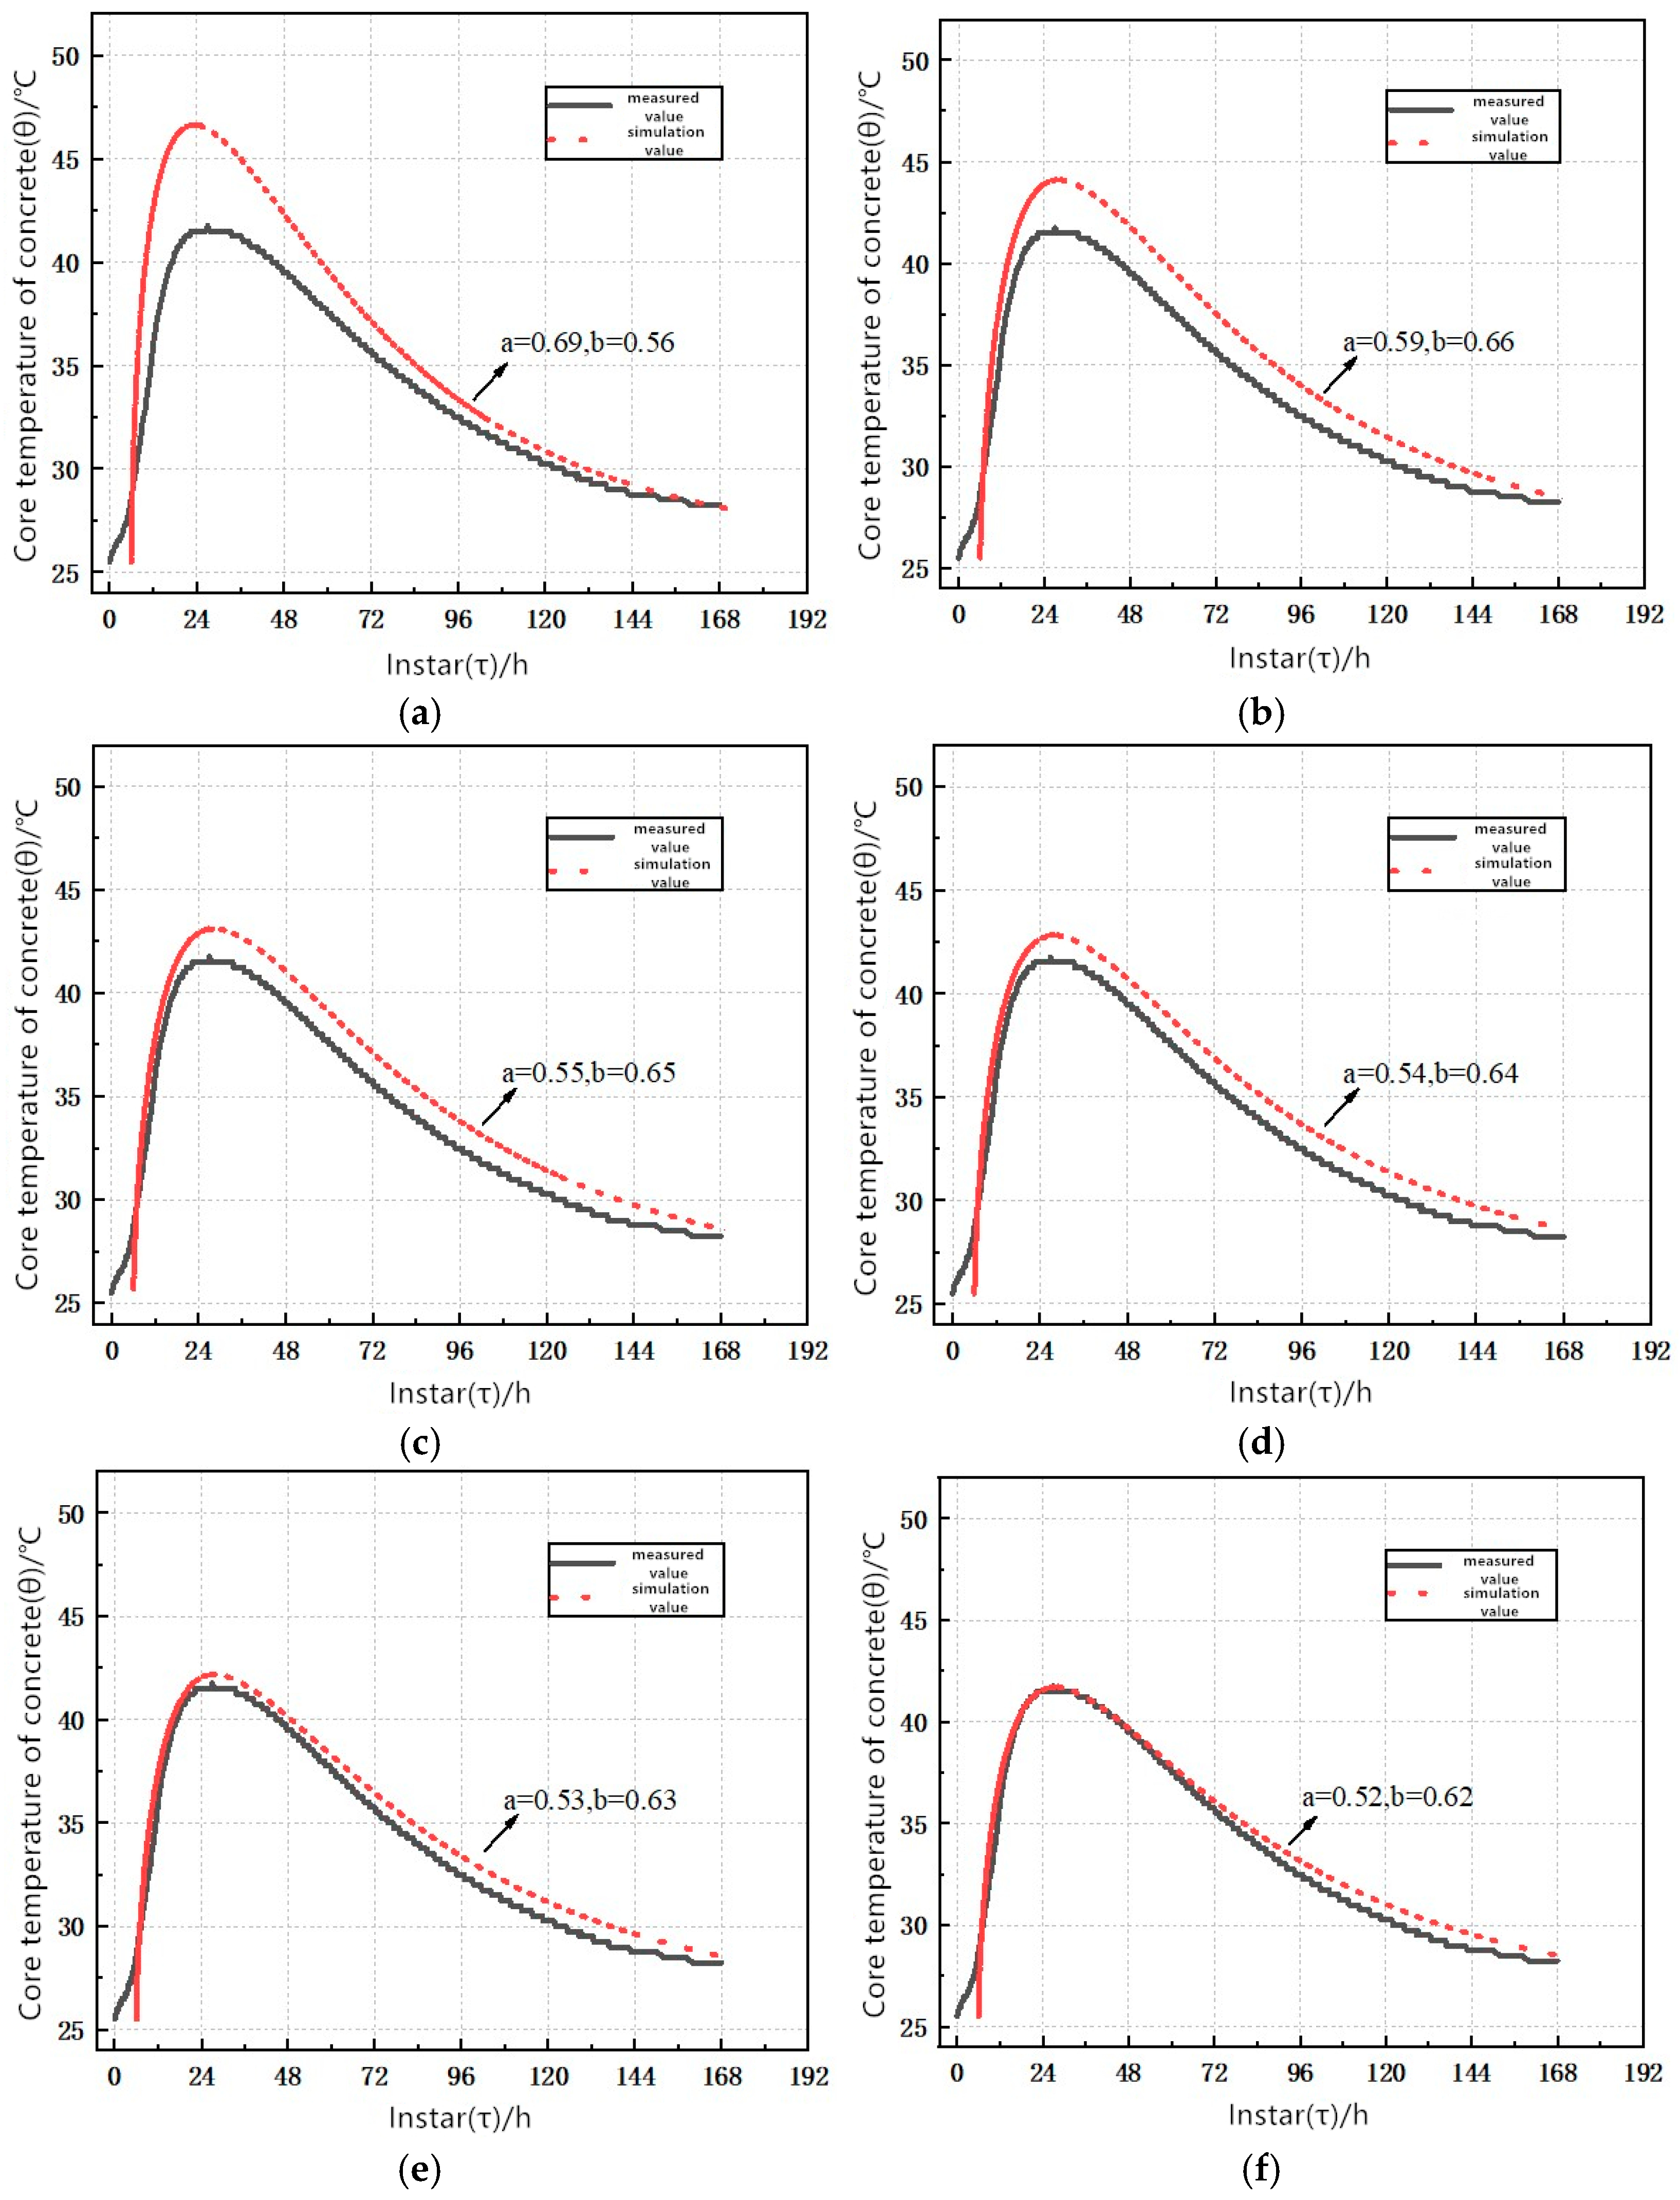
- Combined with the measured temperature curves of several types of mineral-adulterated concrete, a composite exponential hydration exothermic model of several types of mineral-adulterated concrete was obtained by simulation and analysis using the tuning parameter fitting method to solve the influence coefficient of the proposed hydration exothermic model.
Author Contributions
Funding
Institutional Review Board Statement
Informed Consent Statement
Data Availability Statement
Acknowledgments
Conflicts of Interest
References
- CAMET. Action Program for Green Urban Railway Development of Urban Rail Transportation in China. Urban Rail Transp. 2022, 8, 20–35. [Google Scholar]
- Yuan, G.; Huang, F.; Shen, H.; Gao, P. Study on the hydration heat temperature field and temperature stress during the construction period of mass concrete. Concrete 2005, 2, 86–88. [Google Scholar]
- Qin, W.-Z. Shrinkage and cracking of concrete and its evaluation and prevention. Concrete 2001, 7, 3–7. [Google Scholar]
- Lin, Z.-H.; Qin, W.-Z.; Zhang, S.-H.; Zhang, T. Evaluation of early stress development and crack resistance of concrete. Constr. Technol. 2003, 1, 34–35. [Google Scholar]
- Pettersson, D.; Alemo, J. Thelandersson. Influence on crack development in concrete structures from imposed strains and varying boundary conditions. Constr. Build. Mater. 2002, 16, 207–213. [Google Scholar] [CrossRef]
- Saeed, M.K.; Rahman, M.K.; Baluch, M.H. Early age thermal cracking of mass concrete blocks with Portland cement and ground granulated blast-furnace slag. Mag. Concr. Res. 2016, 68, 647–663. [Google Scholar] [CrossRef]
- Visagie, J.W.; Moelich, G.M.; Meyer, D.M.; Kanyenze, S.S.; Kayondo, M.; Boshoff, W.P.; Combrinck, R. Effect of surface curing timing on plastic shrinkage cracking of concrete. Innov. Infrastruct. Solut. 2023, 8, 61. [Google Scholar] [CrossRef]
- Aniskin, N.; Nikolay, A.; Trong Chuc, N. Evaluation of thermal cracks in mass concrete structures during construction. IOP Conf. Ser. Mater. Sci. Eng. 2020, 869, 072028. [Google Scholar] [CrossRef]
- Yue, Z.; Sun, X.; Zhang, D.; Wang, Q. Research on numerical calculation of heat of hydration of mass concrete footing. Constr. Technol. 2017, 46, 128–133. [Google Scholar]
- Zhang, W.; Zhao, S.; Mao, M.; Xu, Y.; Chen, W. Analytical study on the heat of hydration of mass fly ash concrete. Concrete 2018, 9, 157–160. [Google Scholar]
- Zhan, J. Research on the analysis and control of factors affecting concrete cracks in side walls of subway stations. Roadbed Eng. 2018, 3, 113–116. [Google Scholar]
- Gan, M.; Li, G.; Zhan, Y.; Wang, Y.; Sun, Z.; Zhang, Y. Cracking risk analysis of mass concrete based on one-way coupled multi-scale multi-field model. J. Shandong Univ. (Eng. Ed.) 2021, 51, 103–110. [Google Scholar]
- Cai, Z. Concrete Performance; Architecture & Building Press: Beijing, China, 2016. [Google Scholar]
- Zhu, B. A new computing model for the adiabatic temperature rise of concrete and the method of back analysis. Water Power 2003, 4, 29–32. [Google Scholar]
- GB 50496-2018; Bulk Concrete Construction Standards. Ministry of Housing and Urban-Rural Development of China: Beijing, China, 2018.
- GB/T 51028-2015; Technical Specification for Temperature Measurement and Control of Large-volume Concrete. Ministry of Housing and Urban-Rural Development of China: Beijing, China, 2015.
- DL/T5055-2007; Technical Specification for Mixing Fly Ash in Hydraulic Concrete. Electric Power Press: Beijing, China, 2007.
- Zhang, Y. Study on Volume Stability of Limestone Powder-Slag-Fly Ash Concrete and Heat of Hydration of Composite Cementitious Materials. Master’s Thesis, China University of Mining and Technology, Xuzhou, China, 2018. [Google Scholar]


| Cement Varieties | Q0 | a | b |
|---|---|---|---|
| CEM I 42.5 CHN | 330 | 0.69 | 0.56 |
| CEM I 52.5 CHN | 350 | 0.36 | 0.74 |
| CEM II/A 42.5 CHN | 270 | 0.79 | 0.70 |
| CEM II/A 52.5 CHN | 285 | 0.29 | 0.76 |
| Mineral Admixture | 0 | 10% | 20% | 30% | 40% |
|---|---|---|---|---|---|
| Fly-ash (k1) | 1 | 0.96 | 0.95 | 0.93 | 0.82 |
| Slag (k2) | 1 | 1 | 0.93 | 0.92 | 0.84 |
| Limestone powder (k3) | 1 | 0.95 | 0.90 | 0.85 | 0.80 |
| Metakaolin (k4) | 1 | 1 | 0.97 | 0.95 | 0.90 |
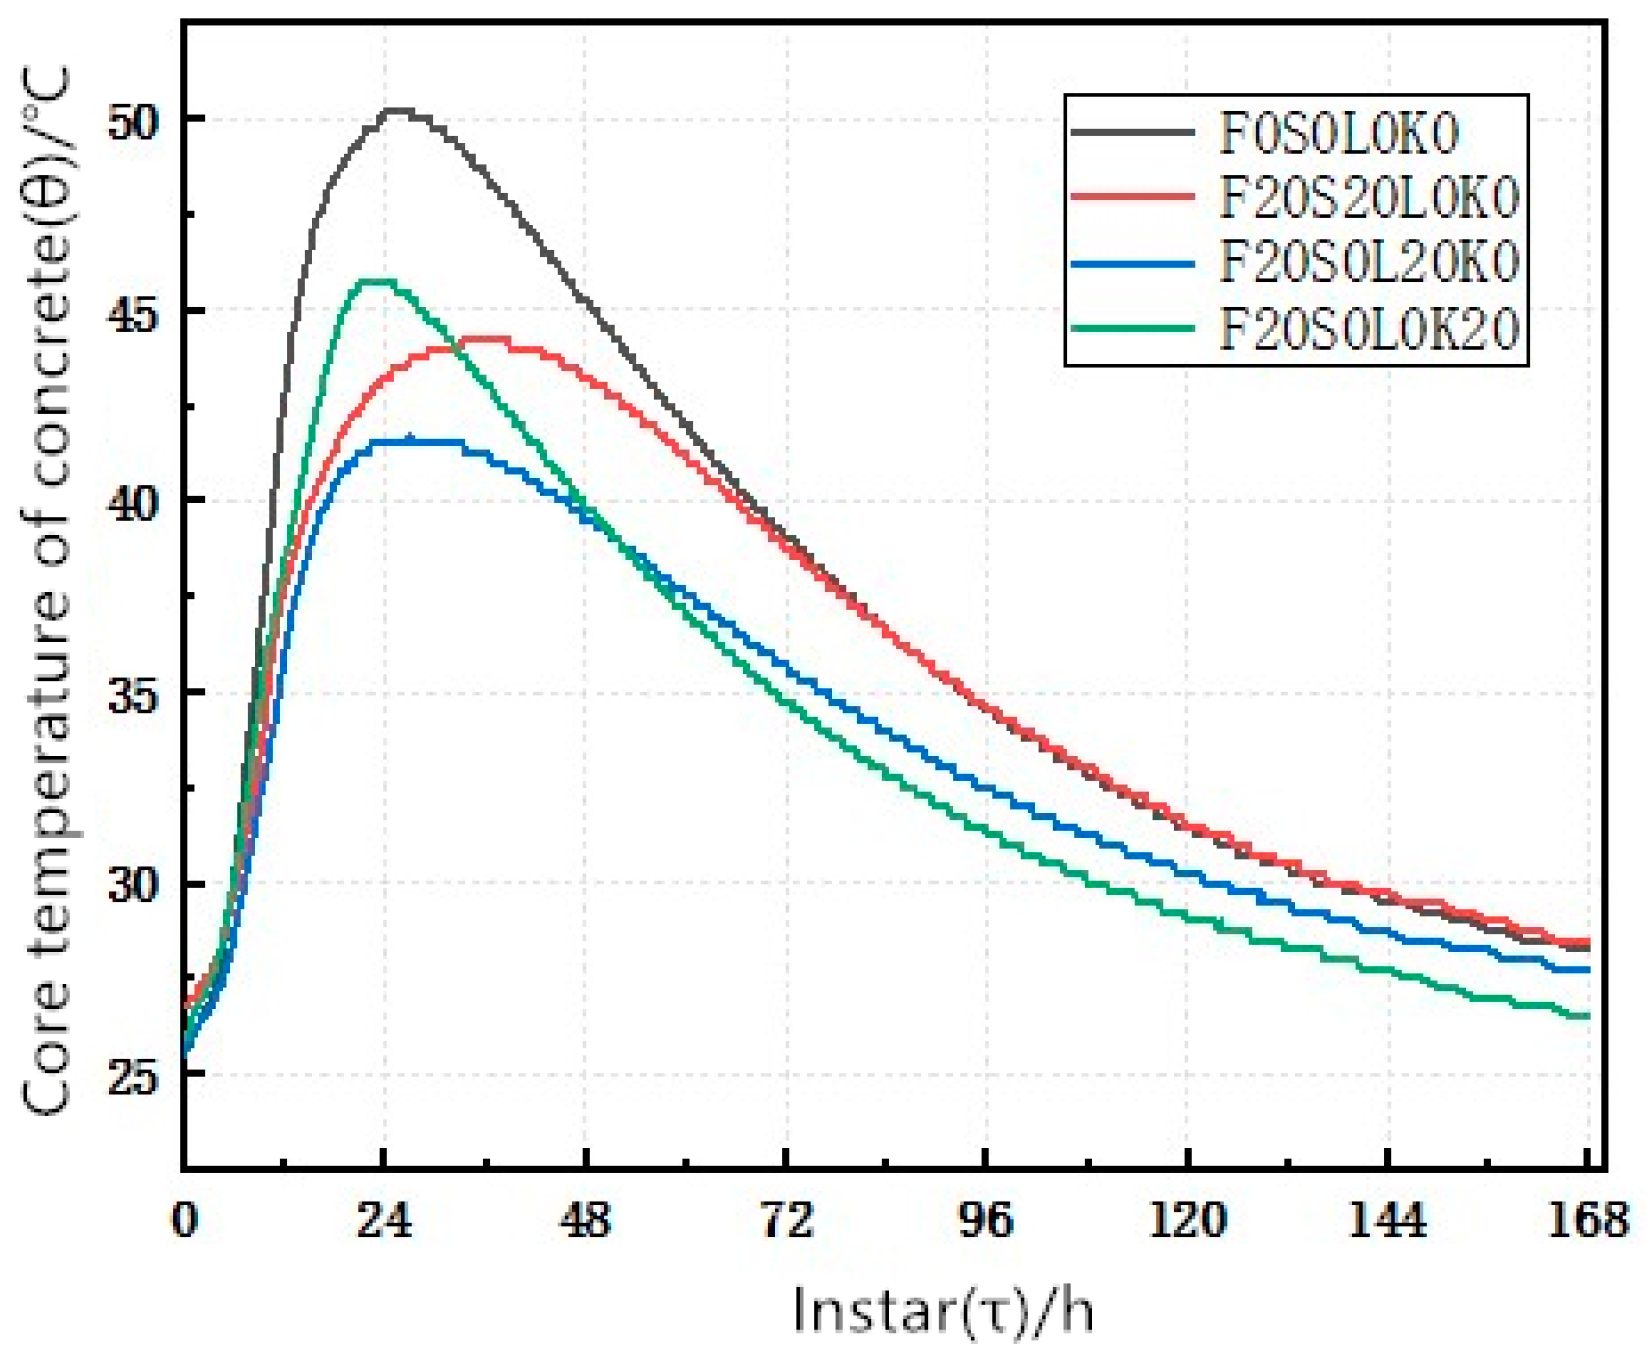
| Serial Number | Cement (kg) | Fly-Ash (kg) | BF Slag (kg) | Limestone Powder (kg) | Metakaolin (kg) | Medium Sand (kg) | Coarse Aggregates (Stone) (kg) | Water (kg) | Superplasticizer (kg) | Volume (m3) |
|---|---|---|---|---|---|---|---|---|---|---|
| F0S0L0K0 | 420.0 | 0.0 | 0.0 | 0.0 | 0.0 | 745.0 | 1117.0 | 168.0 | 2.5 | 0.008 |
| F20S20L0K0 | 252.0 | 84.1 | 84.1 | 0.0 | 0.0 | 745.0 | 1117.0 | 168.0 | 2.5 | 0.008 |
| F20S0L20K0 | 252.0 | 84.1 | 0.0 | 84. 1 | 0.0 | 745.0 | 1117.0 | 168.0 | 2.5 | 0.008 |
| F20S0L0K20 | 252.0 | 84.1 | 0.0 | 0.0 | 84.1 | 745.0 | 1117.0 | 168.0 | 2.5 | 0.008 |
| F15S12.5L12.5K0 | 252.0 | 63.0 | 52.5 | 52.5 | 0.0 | 745.0 | 1117.0 | 168.0 | 2.5 | 0.008 |
| F15S12.5L0K12.5 | 252.0 | 63.0 | 52.5 | 0.0 | 52.5 | 745.0 | 1117.0 | 168.0 | 2.5 | 0.008 |
| F15S0L12.5K12.5 | 252.0 | 63.0 | 0.0 | 52.5 | 52.5 | 745.0 | 1117.0 | 168.0 | 2.5 | 0.008 |
| F10S10L10K10 | 252.0 | 42.0 | 42.0 | 42.0 | 42.0 | 745.0 | 1117.0 | 168.0 | 2.5 | 0.008 |
| Specimen Number | Heat of Hydration Adjustment Factor k | Total Exothermic Hydration Q0 (kJ/kg) | Specimen Number | Heat of Hydration Adjustment Factor k | Total Exothermic Hydration Q0 (kJ/kg) |
|---|---|---|---|---|---|
| F0S0L0K0 | 1 | 330.0 | F15S12.5L12.5K0 | 0.87 | 287.0 |
| F20S20L0K0 | 0.88 | 290.4 | F15S0L12.5K12.5 | 0.92 | 303.6 |
| F20S0L20K0 | 0.82 | 270.5 | F15S12.5L0K12.5 | 0.95 | 313.5 |
| F20S0L0K20 | 0.92 | 303.6 | F10S10L10K10 | 0.91 | 300.3 |
| Specimen Number | Composite Exponential Hydration Exothermic Model | Specimen Number | Composite Exponential Hydration Exothermic Model |
|---|---|---|---|
| F0S0L0K0 | F15S12.5L12.5K0 | ||
| F20S20L0K0 | F15S0L12.5K12.5 | ||
| F20S0L20K0 | F15S12.5L0K12.5 | ||
| F20S0L0K20 | F10S10L10K10 |
Disclaimer/Publisher’s Note: The statements, opinions and data contained in all publications are solely those of the individual author(s) and contributor(s) and not of MDPI and/or the editor(s). MDPI and/or the editor(s) disclaim responsibility for any injury to people or property resulting from any ideas, methods, instructions or products referred to in the content. |
© 2024 by the authors. Licensee MDPI, Basel, Switzerland. This article is an open access article distributed under the terms and conditions of the Creative Commons Attribution (CC BY) license (https://creativecommons.org/licenses/by/4.0/).
Share and Cite
Wu, K.; Dou, Z.; Liu, Z.; Xu, J. Study on Hydration Heat Release Model and Its Influence Coefficient of Addition Concrete. Appl. Sci. 2024, 14, 2276. https://doi.org/10.3390/app14062276
Wu K, Dou Z, Liu Z, Xu J. Study on Hydration Heat Release Model and Its Influence Coefficient of Addition Concrete. Applied Sciences. 2024; 14(6):2276. https://doi.org/10.3390/app14062276
Chicago/Turabian StyleWu, Ke, Zhongyu Dou, Zhenhua Liu, and Jiaxiang Xu. 2024. "Study on Hydration Heat Release Model and Its Influence Coefficient of Addition Concrete" Applied Sciences 14, no. 6: 2276. https://doi.org/10.3390/app14062276