Article

A Drag Force Model of Vertical Penetration into a Granular Medium Based on DEM Simulations and Experiments

School of Technology, Beijing Forestry University, Beijing 100083, China
*
Author to whom correspondence should be addressed.
Appl. Sci. 2024, 14(6), 2336; https://doi.org/10.3390/app14062336
Submission received: 10 January 2024 / Revised: 28 February 2024 / Accepted: 6 March 2024 / Published: 11 March 2024

Abstract

:
The force exerted on a cylindrical intruder as it penetrates a granular medium was analyzed utilizing both experiments and the discrete element method (DEM). In this work, a series of penetration experiments were performed, considering cylindrical intruders with different nose shapes. We found that the drag force of the intruder with a hemispherical nose is close to that of those with conical noses with apex angles of 53° and 90°. The drag force of the blunt-nosed intruder is bigger; the drag force of the conical-nosed intruder with an apex angle of 37° is the smallest. We studied the interplay between the drag force on an intruder with a hemispherical nose and key variables—the penetration velocity (V), penetrator’s diameter ( d i ), and friction coefficient (μ). From this analysis, two piecewise functions were derived: one for the average drag force versus the penetration velocity, and the other for the scaled drag force versus the friction coefficient. Furthermore, the average drag force per contact point, Fa/P, can be succinctly represented by two linear relationships: Fa/P = 0.232 μ + 0.015(N) for μ < 0.9 , and Fa/P = 0.225(N) for μ 0.9 .

1. Introduction

It is crucial to analyze the characterization of the forces on moving objects in granular matter in various engineering fields such as geotechnics [1], road engineering [2,3], machine learning [4], chemical sciences [5], and biological engineering [6]. It is the reason why researching drag force in detail plays a key role in understanding the dynamics of granular materials.
Analysis of the optimal nose shape [7,8,9] is significantly more intricate than the conventional investigation of penetration using prescribed shape data [10,11,12,13,14]. In general, the conundrum of determining the optimal shape of the nose of an axisymmetric rigid projectile can only be solved using numerical methodologies. The key to studying the optimal nose shape is the way friction is accounted for. Research has demonstrated that while the effect of friction affecting the ultimate penetration depth of a projectile is noticeable, its influence on determining the optimal nose shape is minimal across all scenarios [7]. A closed-form solution to the optimal nose shape can be obtained using simplified constitutive relationships when friction is not considered [9]. In a word, an oval or conical shape is considered the optimal nose shape for a one-time penetration. However, projectile tips are easily worn or broken under extensive repetitive work. Considering their practical engineering uses, such as in pile drivers, we should also consider other shapes.
Previous studies have proposed that the drag force on an object penetrating into a granular material vertically is almost universally separated into depth and velocity dependent terms, so that F = F Z + F V [15,16,17,18,19,20]. When V < 2 g d p (here, g is the acceleration of gravity and d p is mean diameter of the granular media), the drag force is independent of the object’s speed [21] and has been found to be linear in depth, which has different proposed forms according to the state of impact and the intruder shape [22,23]. For a cylinder F Z = α μ ρ p g d i 2 Z , α is a constant which is found to be 20~30 [24], μ is an internal friction coefficient equal to the tangent of the repose angle, ρ p is the material density of the particles, d i is the diameter of the intruder, and Z is the vertical penetration distance. When V > 2 g d P , the peak drag force is observed to be proportional to the square of the velocity only for a short period of time at the beginning of penetration, and then, at larger depths, all force profiles fall on the line of the former experiments ( V < 2 g d p ) [25,26]. In addition, in order to avoid changes in the contact area between the intruder and the granular media at larger depths, a cylindrical intruder was placed horizontally in the media, which is different from the experiments of Roth, L.K. [20]. With the further acceleration of penetration velocities, three different regimes, from the quasi-static (force independent of the velocity) to the viscous (force linearly related to velocity), and then to the inertial (force related to the square of velocity), are exhibited [27]. However, it has not been investigated whether there are still significant turning points when the contact area between the intruder and the granular media gradually increases (e.g., in a pile driver).
In the meantime, many researchers [28,29] have assessed the sensitivity of flow characteristics to interparticle friction. The initial solid volume fraction was varied by adjusting the interparticle friction coefficients during compression [30], setting μ to 0.1, 0.25, 0.5, 0.75, or 1.0. The range of μ values (0.12~0.35) was given in experimental particle–particle friction tests [31]. Many DEM simulations using spherical or elliptical particles have set higher values ( μ 0.5 ) [32,33,34,35,36] to explore the influence of interparticle friction on critical-state behavior. They discovered that the flow characteristics at the critical state appear to remain unaffected in conditions where μ is greater than or equal to 0.5. The particle-scale data revealed that the buckling resistance of individual strong force chains did not always increase as μ increased. However, there was a decrease in the number of force-transmitting particles and an increase in the number of rattlers (particles with fewer than two contacts that do not transmit load) [36]. Though inter-grain friction features prominently, the motion of grains tangential to the intruder surface does not significantly contribute to the drag force [14]. Therefore, it is crucial to focus on the flow characteristics of particles directly beneath the vertical intruder to understand why the drag force ceases to increase once μ surpasses a threshold value. Notably, in this study, the threshold value of μ exceeds 0.5.
Most of the presented research focused on simple shapes of intruders, such as cylinders [14,20,21] and spheres [23,27]. However, the interplay between the drag on intruders with hemispherical noses and the key variables—penetration velocity (V), penetrator diameter ( d i ), and friction coefficient (μ)—remains unexplored. When investigating the relationship between drag force and velocity, a consideration of the increasing contact area between the intruder and the granular medium with depth is a crucial distinction from other studies.

2. Numerical Model and Methodology

The motion of particles is governed by the well-established Newton’s second law. For one particle, the translational and rotational equations are as follows:
F i = m i d v i d t
and
T i = I i d ω i dt ( I i · ω i ) × ω i
in which m i , Ii, v i , and ω i are the mass, moment of inertia, and translational and rotational velocities of the particle i, respectively; Fi and Ti are external forces and moments exerting on it.
The discrete element method (DEM), proposed by Cundall and Strack (1979), is adopted to simulate the interaction between two objects. The DEM used in this study is a soft-sphere model based on spherical contact theories, and there are four contact scenarios: particle–particle, particle–hemispherical nose, particle–container inner surface, and particle–intruder outer surface. The contact models used in this study include Hertz for normal force and Mindlin for tangential force. The normal component of the contact force F n c of the first three contact scenarios can be expressed as
F n c = 4 3 E * R * 1 2 δ n 3 2
in which δ n is the overlap in normal direction. E * is equivalent Young’s modulus, and R * is equivalent radius of two objects in contact, which are defined as 1 E * = 1 v 1 2 E 1 + 1 v 2 2 E 2 and 1 R * = 1 R 1 + 1 R 2 , respectively, where E 1 and E 2 , R 1 and R 2 , v 1 and v 2 are the Young’s moduli, the radii, and the Poisson’s ratios of two contacting particles.
For the particle–intruder outer surface, the normal component of the contact force F n c can be expressed as
F n c = 8 R * 27 α 3 2 E * δ n 3 2
in which α is determined by the shape of the contact area and set to be 0.974 [37].
The Mindlin model is utilized for the tangential contact force [38]. When two contacting particles are subjected to an increasing tangential displacement, δ t , the incremental tangential force T due to the incremental tangential displacement δ t depends not only on the loading history but also on the variation of the normal force. Therefore, T can be expressed as
T = 8 G * a θ k δ t + 1 k μ N ( 1 θ k )
where N is the incremental normal force, μ is the coefficient of sliding friction, a = δ n R * is the radius of the contact area, and the parameter θ k depends on the loading status, e.g., when T < μ N , then θ k = 1, so T = 8 G * a δ , which corresponds to a case in which there is no microslip, otherwise microslip occurs and
θ k = 1 T + μ N μ N 3 if k = 0
θ k = 1 1 k T T k + 2 μ N 2 μ N 3 if k = 1 , 2
here, k = 0, 1, 2 represent loading, unloading, and reloading paths, respectively, and T k is the historical tangential force at which loading or reloading commenced. The parameter G * is defined as
G * = 2 v 1 G 1 + 2 v 2 G 2
in which G 1 and G 2 are the shear moduli of each particle.
Also, the contact damping forces are added to dissipate the energy upon the contacts. The normal and tangential contact damping force [39], F n c d and F t c d , are expressed as
F n c d = c β c 2 m * K n c V n c
F t c d = β c 2 m * K t c V t c
where the parameter c is a constant which is equal to 5 / 6 when the normal contact force F n c is proportional to δ n 3 / 2 . The contact damping coefficient β c determines the collisional dissipation rate, β c = ln e π 2 + ( ln e ) 2 , in which e is the coefficient of restitution. m * is equivalent mass, m * = 1 m 1 + 1 m 2 1 , m1 and m2 are the masses of two contacting particles. K n c is normal contact stiffness and K t c is tangential contact stiffness, given by K n c = d F n c d δ n and K t c = 8 G * a , respectively [40]. V n c and V t c are the normal and tangential components of relative velocity at the contact point.

3. Experimental and Numerical Setup

The experimental equipment for penetration will be introduced in the following four modules: control, transmission, penetration, and data acquisition/output. As shown in Figure 1, the control module consists of a power supply, a programmable controller, a driver, an encoder, and several switches, and has stable low-speed torque characteristics, dynamic acceleration, and deceleration performance. The transmission module consists of a synchronous belt module, limit switches, and mounting feet. Compared to the ball screw drive and worm gear drive, the timing belt module has the advantages of a wider adjustable speed range, higher integration, safety, and less noise. Moreover, the forces along the axial direction and the two orthogonal lateral directions on the intruder are collected by the three-axis pressure sensor and transmitted to the computer via the multichannel digital transmitter to complete data storage, with the sensor’s data precision of the three-axis direction able to reach a precision of 10−6 N.
The experimental setup is shown in Figure 2. A cylindrical container, with length 600 mm and inner diameter 230 mm, was filled to a depth of 535 mm with acrylic beads (diameter d p = 10 mm and density ρ a c r = 1190 kg/cm3). The bed was prepared by pouring beads into a container, leveling it with a scraper. After each experimental run, the box was emptied and refilled. When the experiment started with an acrylic rod (diameter d i = 40 mm; length L i = 450 mm) penetrating the granular bed at a constant velocity of V , the rod was attached to an L-shaped connector and driven by a servo motor. The maximum penetration depth was set to half the granular bed height to avoid the bottom boundary effect. The triaxial penetration resistances were measured by a force sensor as a function of time. Since the lateral forces caused by asymmetric particle distribution are much smaller than the axial forces, the lateral forces will not be discussed in this study.
The DEM simulation setup is shown in Figure 3. Some key parameters were discussed in simulations to assess their impact. The simulations were performed as follows: particles were generated within a cylindrical domain and allowed to fall under the influence of gravity until the cylindrical container was filled to the same particle number and height as observed in the experiment. The initial solid volume fraction was maintained by using the same coefficient of friction as during compression. Once the particles had settled and the granular bed had reached a stable state, an intruder was inserted into the center of the particle bed at a constant vertical velocity. The simulation and experimental parameters are shown in Table 1.

4. Results and Discussion

4.1. Experimental Results

Intruders with different nose shapes—hemispherical, conical, and blunt—were vertically immersed into a granular bed at a velocity of 10 mm/s. The conical noses had apex angles of 37°, 53°, and 90°, as depicted in Figure 4. Vertical forces acting on the intruders, recorded as drag forces, are compared in Figure 5. It is observed that the drag force on the intruder with a 37° apex angle is the least, while the blunt nose experiences the greatest drag force, with the others falling in between these two extremes. The drag force on the hemispherical nose is comparable to that on conical noses with 53° and 90° angles. Considering practical engineering applications, reducing the apex angle of the conical nose to decrease drag force without accounting for the intruder’s mass loss is impractical. Mass loss primarily occurs due to tip breakage and scratching over the surface, with tips more likely to break when the apex angle is very small. Additionally, the shape of the hemispherical nose is solely determined by its radius, which directly correlates with the cylindrical rod’s diameter. For these reasons, the hemispherical nose was selected for DEM simulations in this study.
The drag force curves of five nose shapes exhibit similar trends at different constant speeds, as shown in Figure 5. The average drag force can be defined as
F a = 0 Z 0 F Z d z Z 0
where Z 0 represents the maximum distance of penetration, and we only research the drag force within 270 mm.
Figure 6 illustrates a typical relationship between drag force and penetration velocity. It was observed that the drag force remains independent of velocity at lower speeds, exhibiting minor fluctuations across multiple datasets. However, as velocity increases, a distinct upward trend in the drag force is evident for the five different nose shapes examined. The experimental apparatus’s constraints limit the penetration speed to a range of 10 to 1000 mm/s. Exploring beyond this velocity range to ascertain the presence of significant turning points in the relationship requires simulation.
In this study, the DEM simulations and experiments of acrylic beads and glass beads penetrated by the same intruder were compared. The physical properties of glass beads and acrylic beads are listed in Table 1.
The comparison between experiments and simulations is shown in Figure 7. It is evident that the drag forces of simulations are consistent with those of experiments for both glass and acrylic beads, which shows that the simulation methodology used in this study can be applied to the simulation of penetration into granular materials. Additionally, for both materials, the drag forces are proportionally related to the penetration depth. The drag force associated with glass beads is markedly greater than that of acrylic beads. This is primarily due to the drag force’s linear proportionality to both the friction coefficient ( μ ) and the particle density ( ρ p ), as mathematically represented by F Z = α μ ρ p g d i 2 Z . The product of the friction coefficient and density for glass is almost twice as much as that for acrylic material.

4.2. Influence of Key Parameters

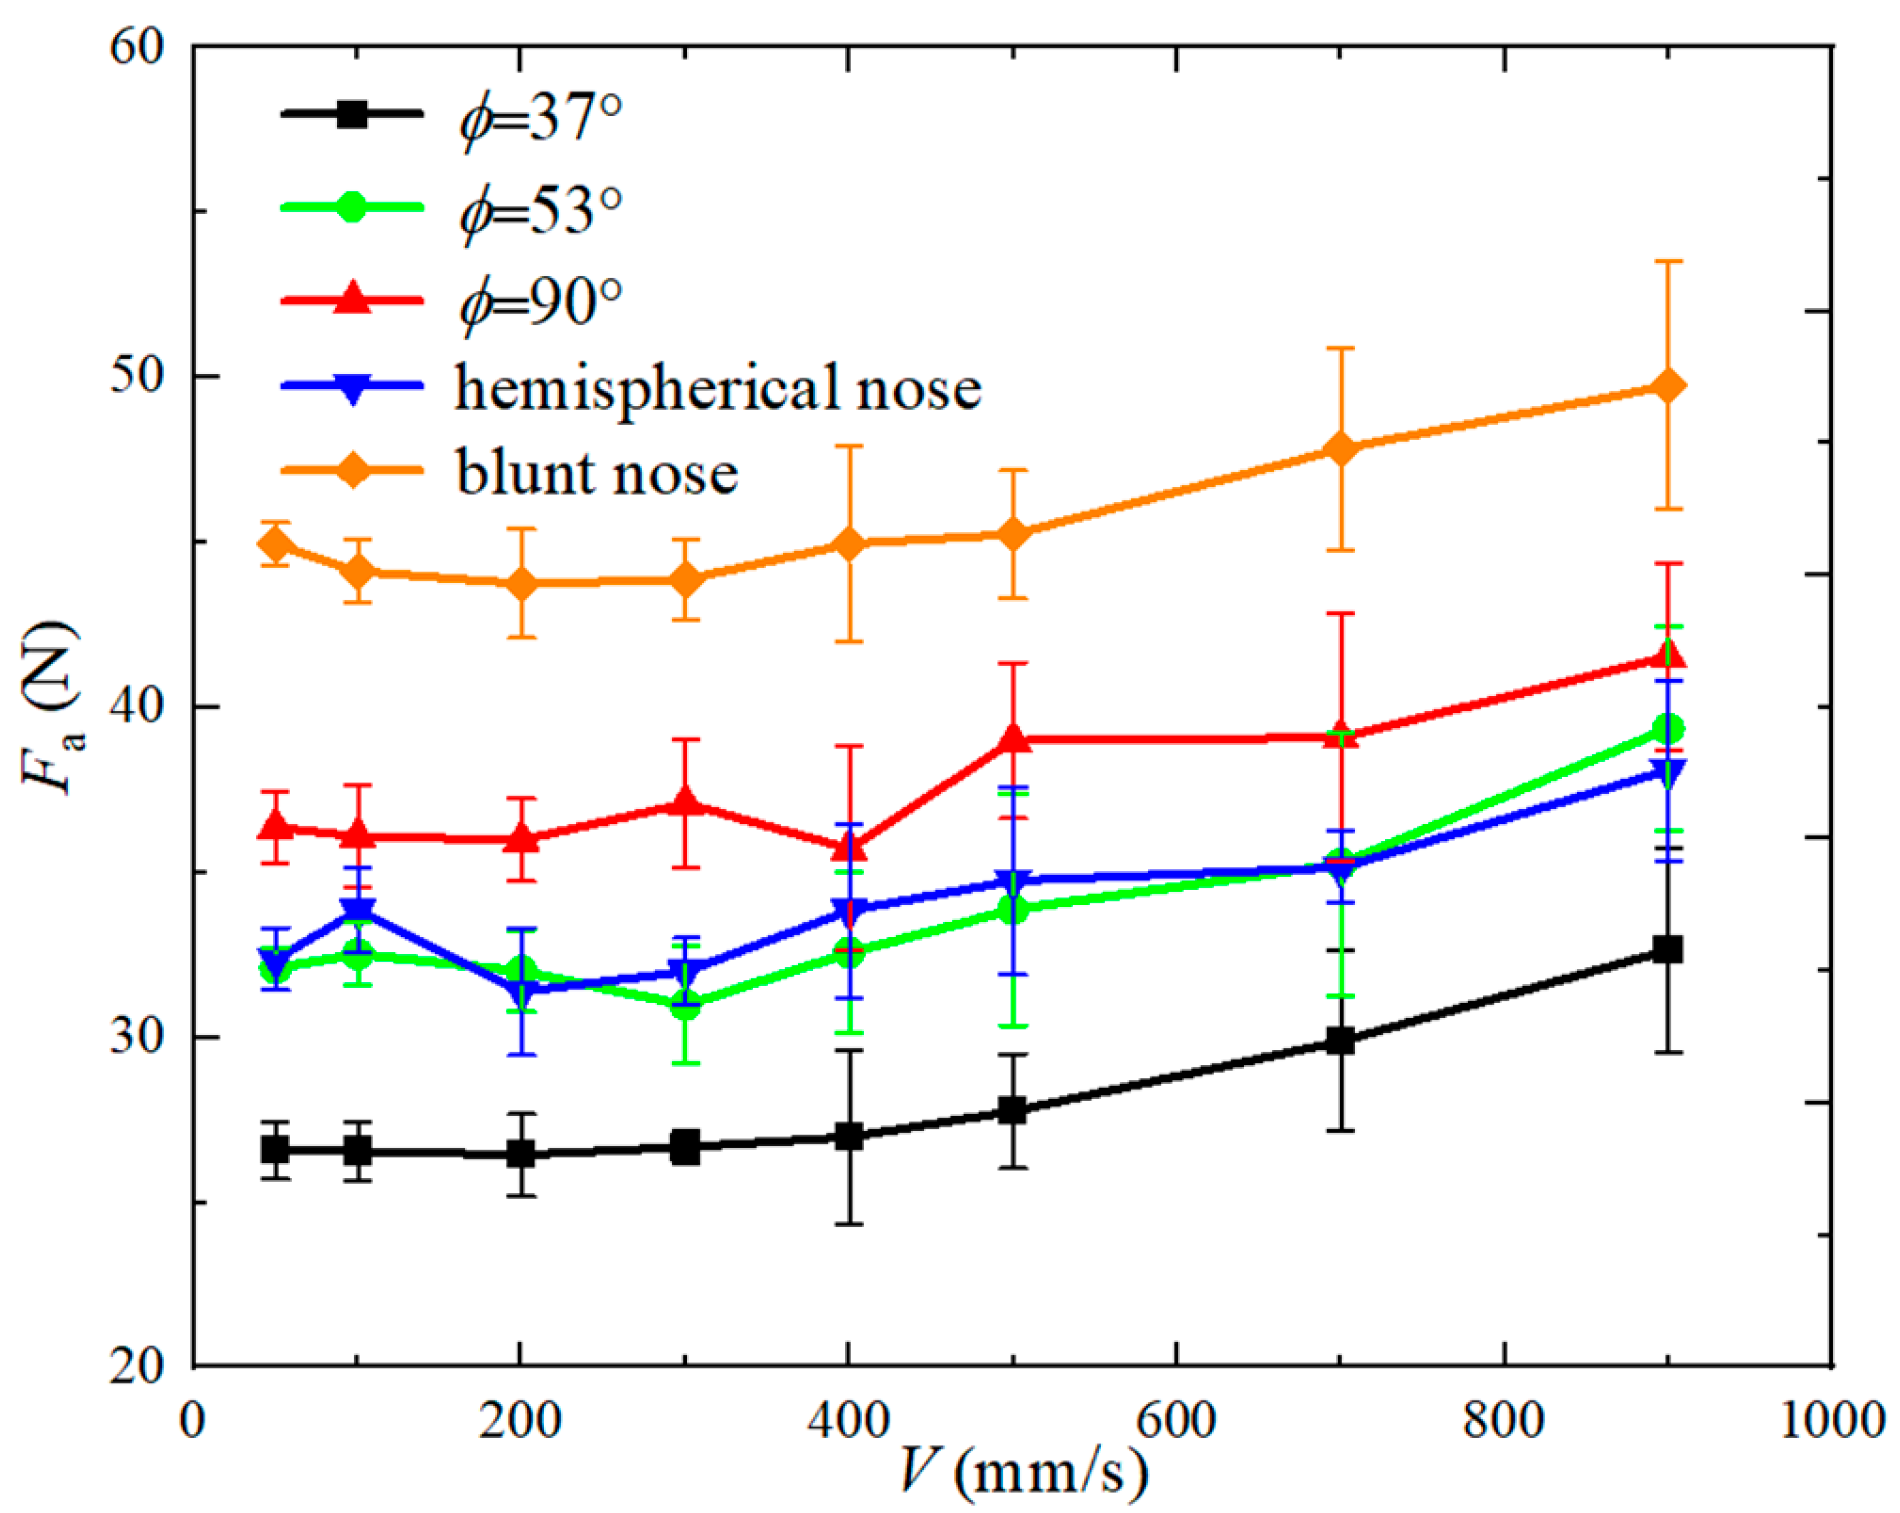
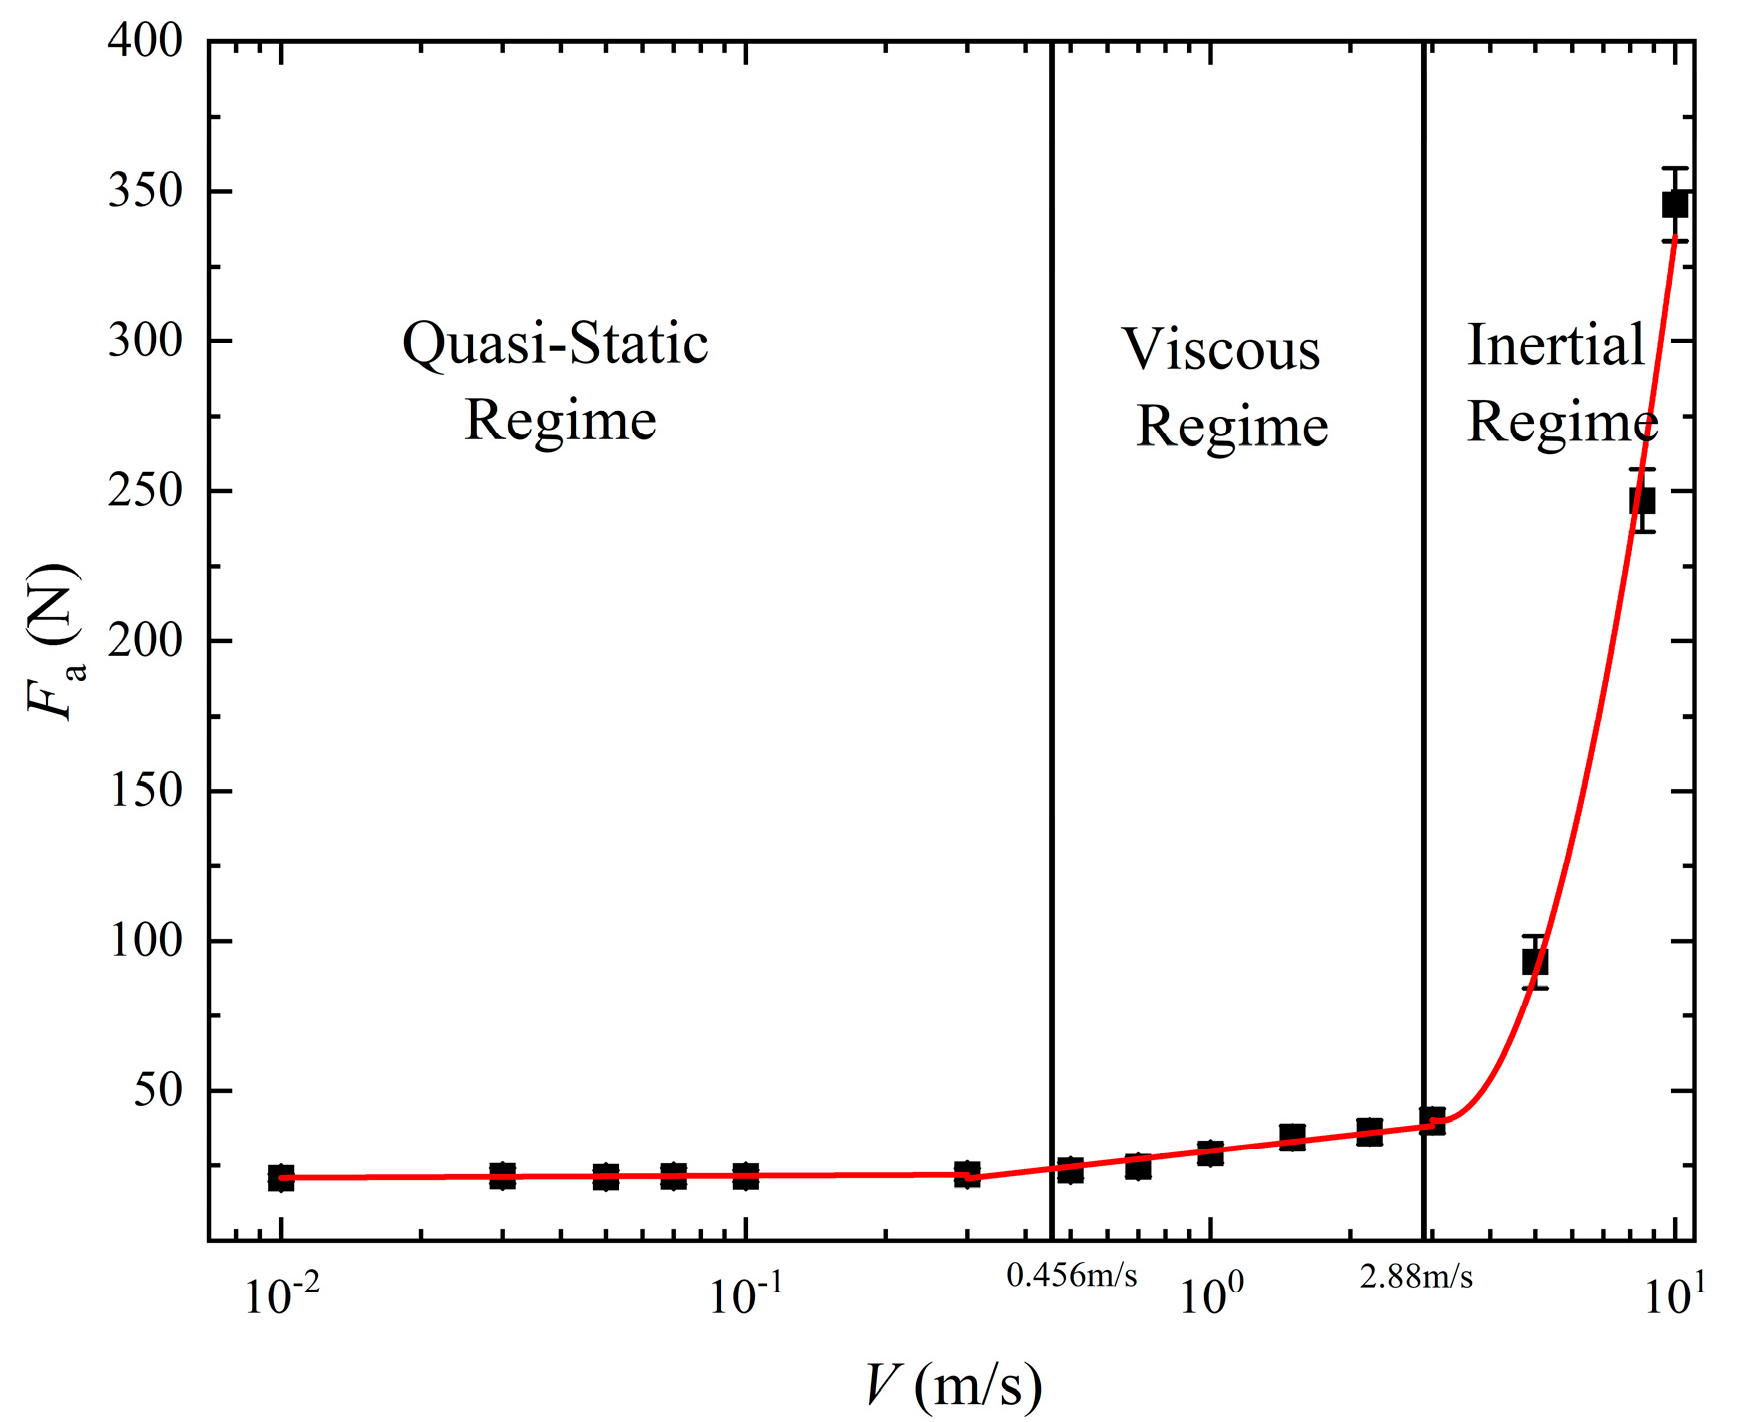
4.2.1. Penetrating Velocity

The critical velocity is 0.443 m/s from V c = 2 g d p when the mean diameter of the particle d p is 10 mm and the gravity g is 9.81 m/s2. The values of d c and d i are also consistent with the experiments. When V < V c , the penetration can be regarded as the quasi-static regime. For each drag force curve, five individual runs were averaged, as shown in Figure 8.
The forces acting on the cylinders have three distinguished tendencies at different velocity ranges. From Figure 8a, it can be found that for V < V c (0.01~0.3 m/s), the system is in the quasi-static regime, where the drag force–depth curves exhibit fewer fluctuations and all drag forces ( V < V c ) collapse onto a master line, as predicted by F = K z Z [15,25]. The parameter K z represents the slope of the fitting line. Additionally, the force fluctuates over a larger area as the cylinder sinks along the penetration direction when the velocity exceeds the critical point of 0.443 m/s (0.5~2.0 m/s). However, when the speed is greater than 3 m/s (Figure 8b), the force fluctuates tremendously and it is independent of depth.
The real speed at where the turnaround occurs is shown in Figure 9. It shows the relationship between the average force F a and the penetrating velocity. For the simulation where V < 3 m/s, the drag force is linear with depth, and the average force can be calculated according to Equation (10).
When V ≥ 3 m/s, the force fluctuates tremendously, so the average force formula is
F a = i = 1 n F i n
in which n represents the number of drag force records in the vertical direction.
Figure 9 depicts the average force F a applied to the cylinder, which can be distinctly classified into three regimes: the quasi-static regime (velocity-independent), the viscous regime (force linearly correlates with velocity), and the inertial regime (force is proportional to the square of the velocity). For scenarios entailing either penetration at a constant speed or an impact with a predetermined initial velocity, it is proposed that the drag force can be uniformly described as follows:
F a = α V 2 + β V + K z Z a
where Z a represents the average of the penetration distance.
When the penetration velocity V falls below V s v (with V s v being the critical velocity transitioning from the quasi-static to the viscous regime), the drag force correlates with depth Z and is not dependent on V. In the scenario where V s v < V < V v i ( V v i representing the critical velocity from the viscous to the inertial regime), the force is governed by a viscous term linearly dependent on velocity ( β V ). For velocities exceeding V v i , the drag force is governed by an inertial term proportional to the square of the velocity ( α V 2 ), where α , β , and K z are constants that adapt based on the velocity regime. The transition velocities V s v and V v i can be determined from the intersections of three fitting curves [20].
The critical velocity V c = 2 g d p ≈ 0.443 m/s from the quasi-static regime to the viscous regime is nearly consistent with existing conclusions, which is V s v 0.456 m/s in our situation. The critical velocity V v i transitioning from the viscous to the inertial regime is approximately 2.88 m/s, which is inconsistent with the theoretical solution derived from classical hydrodynamics models [18].
From Figure 9, Equation (13) can be fitted to our data:
F a = α V 2 + β V + K z Z a = 195.3 Z , α = β = 0 , w h e n 0 < V < V s v 8.7 V + 164.3 Z , α = 0 , w h e n V s v < V < V v i 3.3 V 2 + 0.5 V + 132.8 Z , w h e n V v i < V

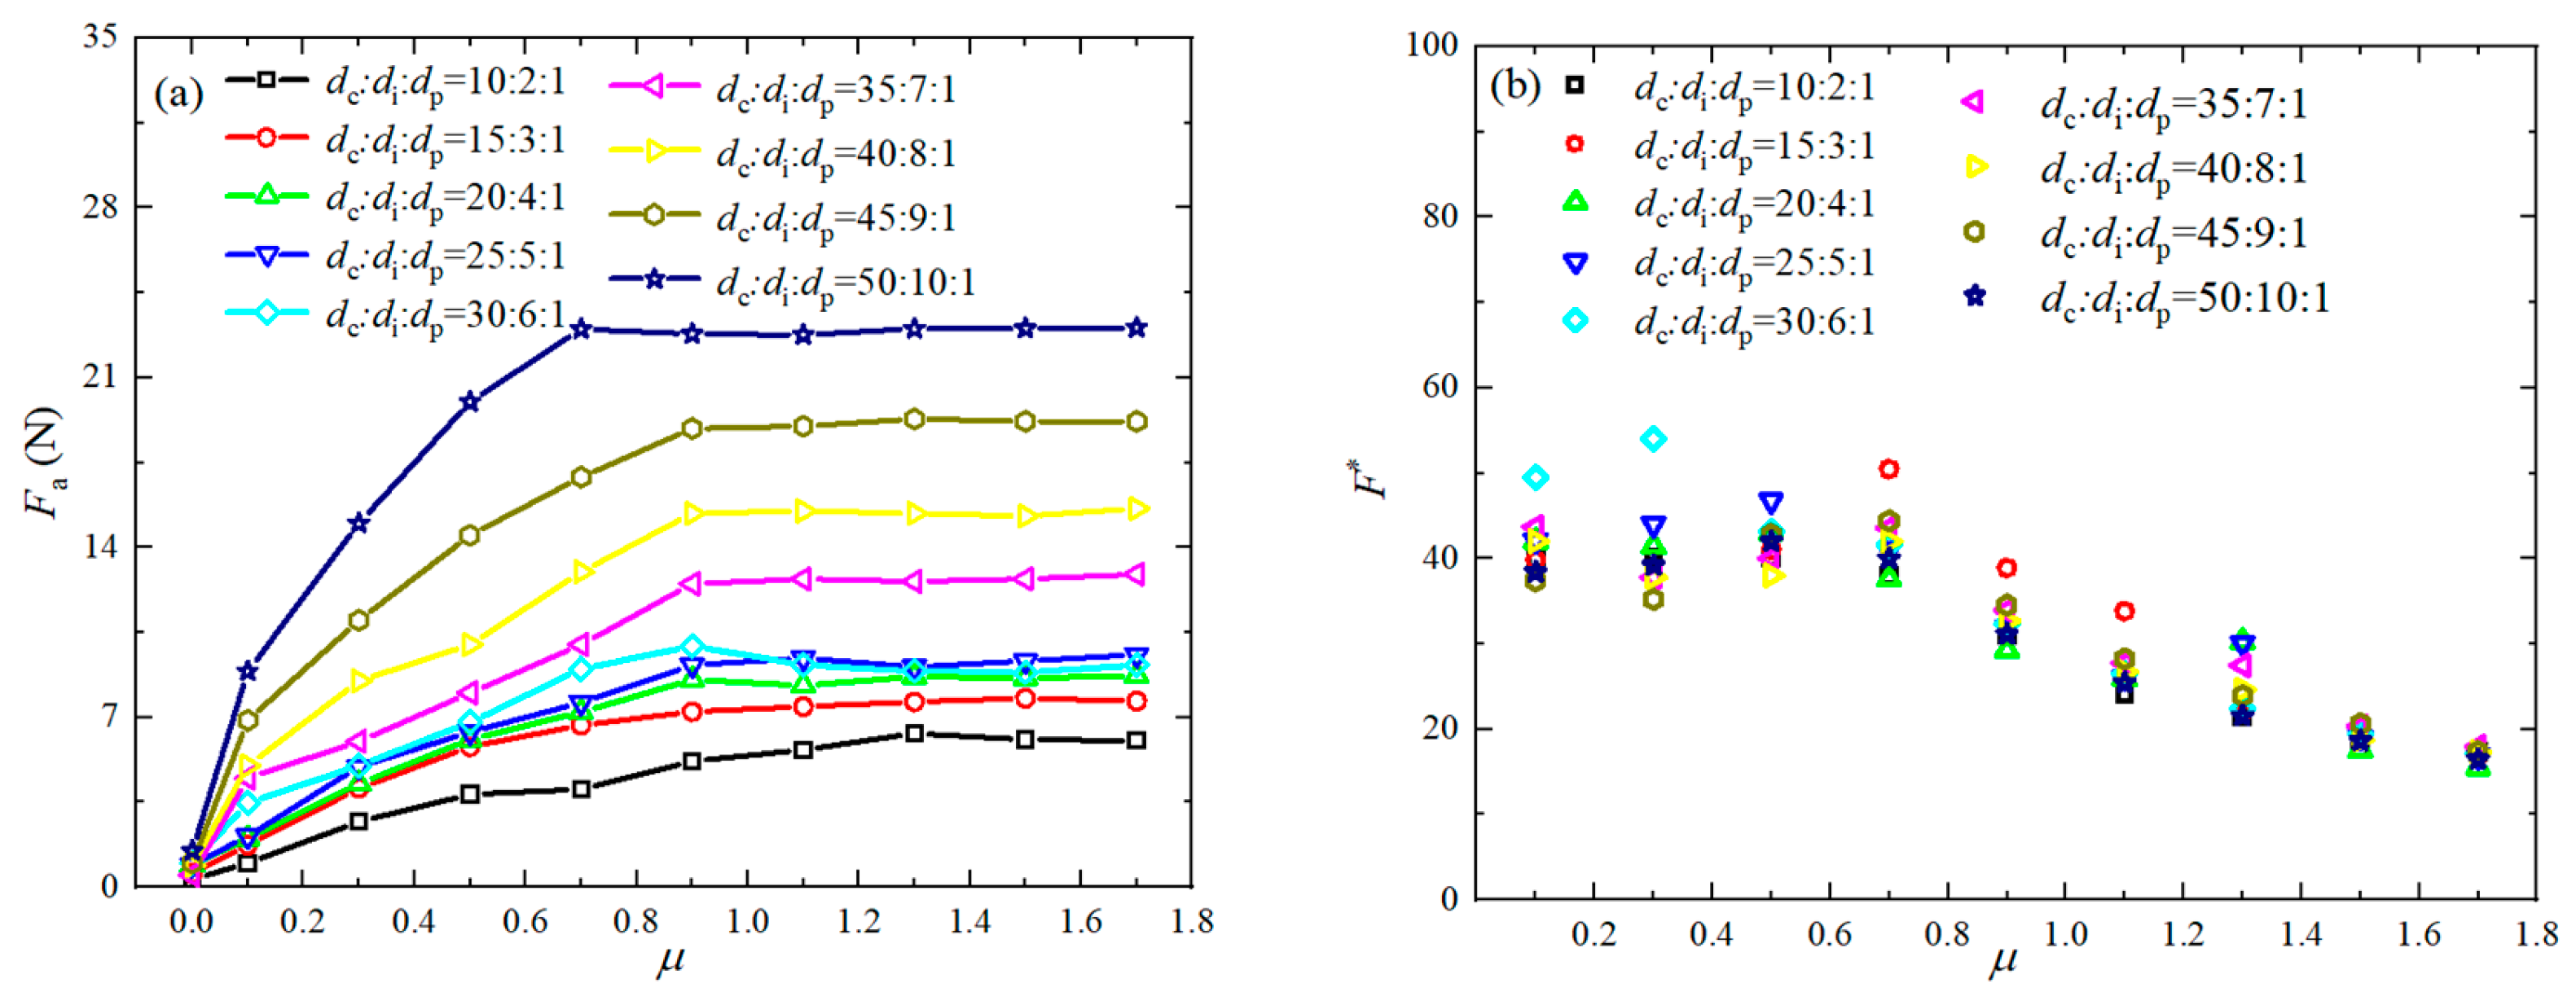
4.2.2. Diameter of Particle d p

For quasi-static penetration (low velocities), the drag force behaves independently of the penetration velocity. V = 10 mm/s (less than 1/10 of V c ) is chosen as the base value for later simulations. To take into account the impact of sensitive parameters on the penetration process, the drag force is scaled as follows:
F * = F a μ ρ p g d i 2 Z a
To minimize the impact of the boundary effect, the diameter ratio of container to intruder d c : d i is 5 and the penetration depth should be 1/2 of the total height of penetration. Meanwhile, five different particle diameters are used in this part, shown in Table 1. The penetration forces of different particle diameters are shown in Figure 10. It can be observed that the drag force of penetration decreases with the particle diameter in the bed, and the effect of particle diameter on boundary effects is negligible when the particle diameter decreases to 6 mm ( d c : d i : d p = 100:20:6). d p = 6 mm is chosen as the base value for subsequent simulations.

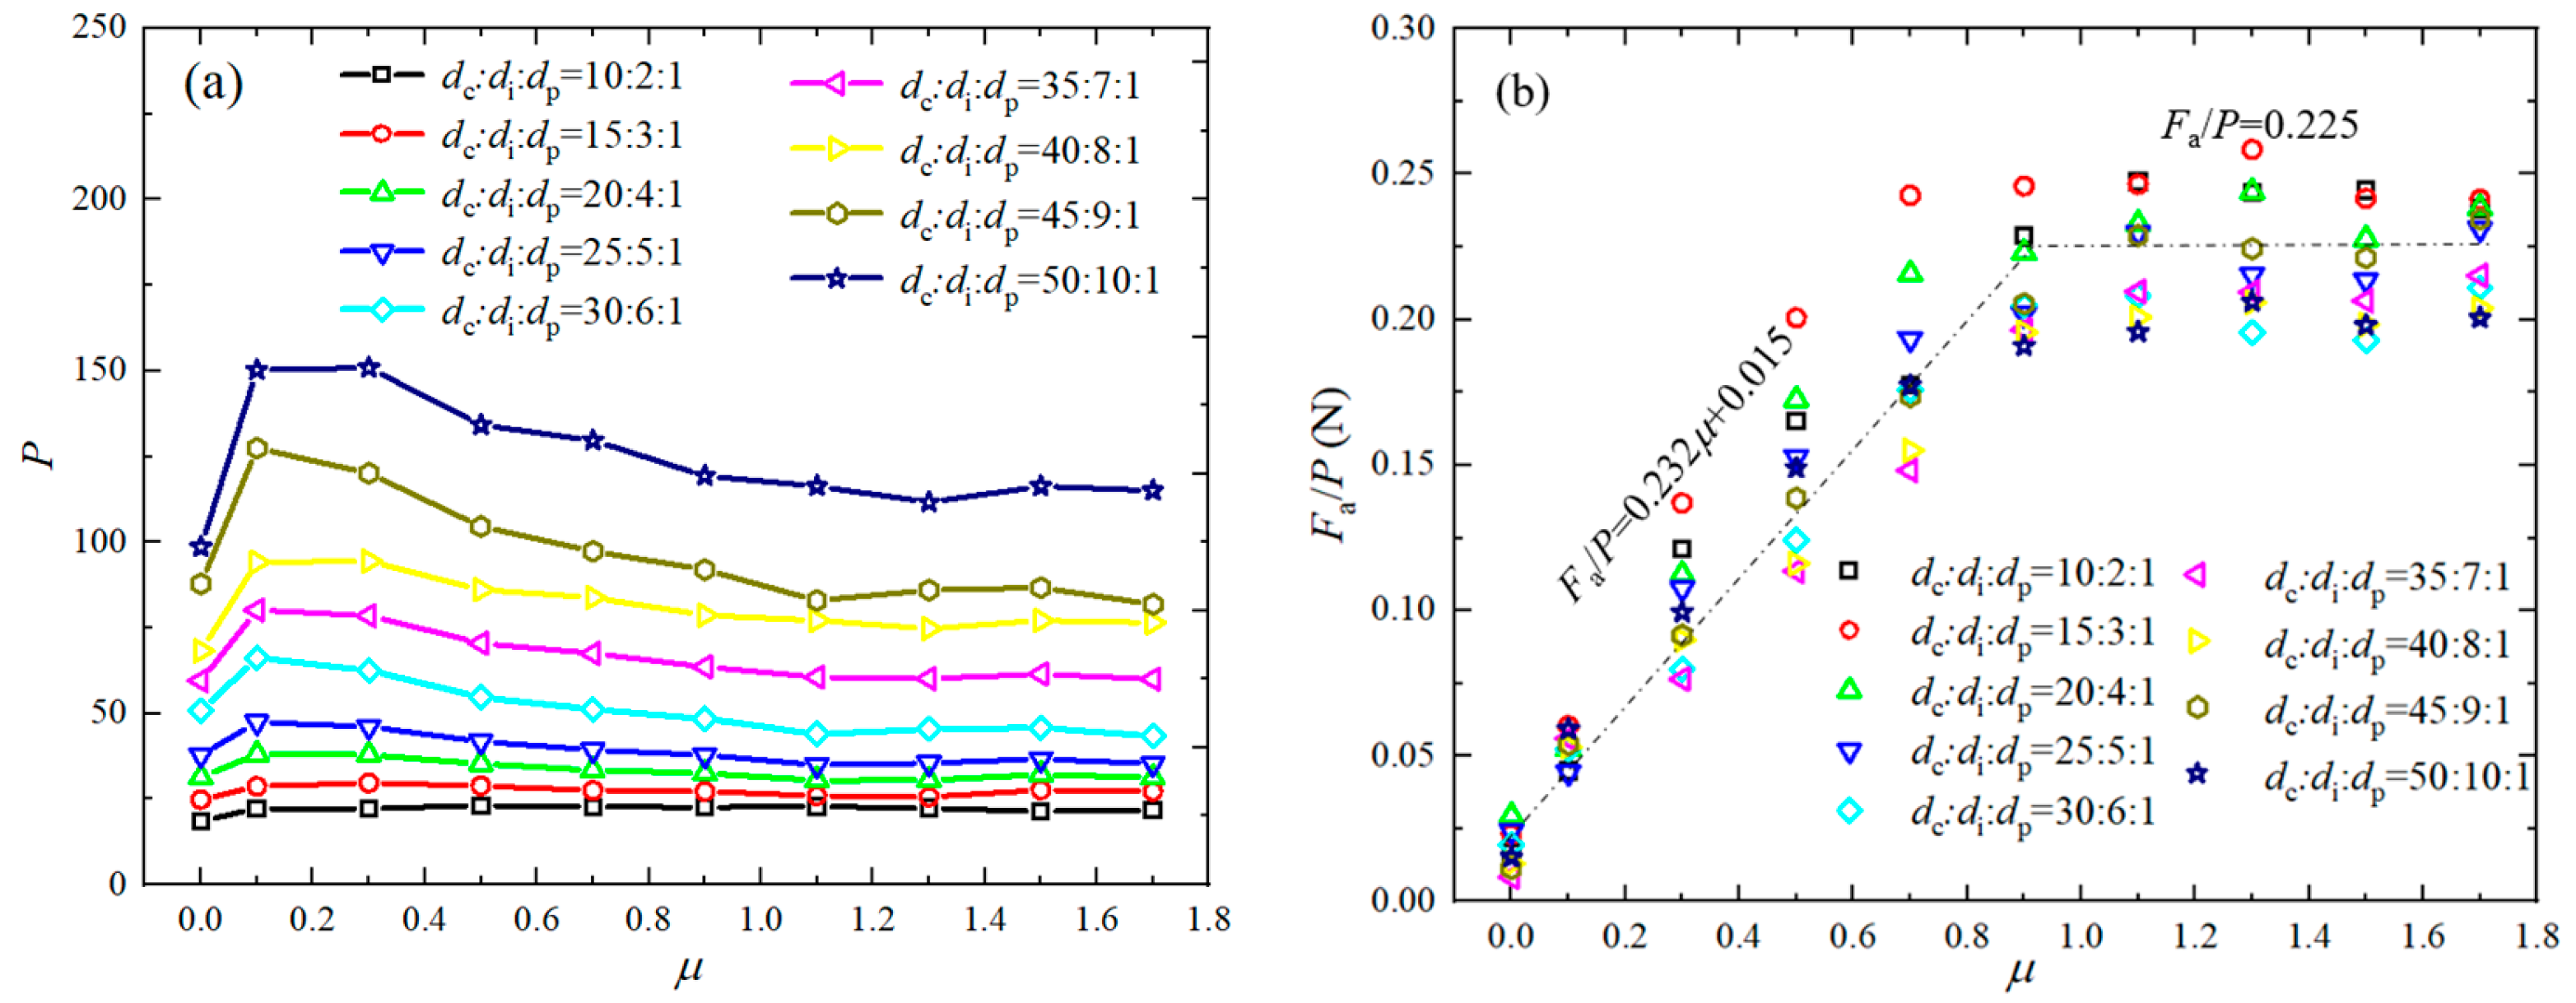
4.2.3. The Combined Influence of di and μ

When the frictional coefficient of particles changes simultaneously with the intruder’s diameter, we can observe the effect of their combined impact on the scaled drag force. From Figure 11a, there is a systematic increase in the drag force with μ for μ < 0.9 ; when μ 0.9, the drag force seems to be insensitive to further increases in μ . Accordingly, the graph in Figure 11b displays the scaled drag force for various friction coefficients and intruder diameters. The results indicate that the value of F* varies between 34 and 46 when μ is below 0.9 and then decreases gradually with a further increase in μ . The value of F* can be collapsed into two straight lines with F* = 41.6 and F* = −34 μ + 68, which means that the drag force remains proportional to the square of the intruder diameter; however, it is no longer strictly proportional to the friction coefficient when the friction coefficient is greater than 0.9. Based on the above discussion, we can obtain the piecewise formula for drag force:
F * = 41.6 , μ < 0.9 34 μ + 68 , μ 0.9
To elucidate why the drag force ceases to increase beyond a friction coefficient of 0.9, we present vertical profiles of velocity and solid volume fraction in Figure 12, averaged within a cylinder of diameter. These parameters, v and Φ, respectively, represent the velocity component along the Z direction and the volume fraction of particles. The area highlighted in Figure 13 was chosen to examine the characteristics of particle flow and the density of force-transmitting particles directly beneath the vertical intruder. The moment the intruder contacts the first particle is designated as t = 0 s. The velocity profile of particles, v, demonstrates uniform cessation at a distance of 2di from the intruder, as shown in Figure 12a. Consequently, a region of 2di was selected for analyzing the solid volume fraction. Observations show that the solid volume fraction significantly diminishes as the friction coefficient decreases to 0.9, beyond which it stabilizes. This suggests that the bulk density of particles in front of the intruder’s leading edge remains constant for friction coefficients above 0.9, maintaining a consistent force exerted by the displacement of particles ahead.
The parameter P denotes the number of particles contacting with the intruder, as shown in Figure 14a. In vertical penetration, the contact area between the side wall of the intruder and the particle gradually increases, which contributes greatly to the numerical value of P. It is easy to understand that the larger the d i , the greater the side wall surface, and the greater the value of P. When the friction coefficient is set to a minimum value ( μ = 0), the flow properties of the granule bed are more pronounced and the particles are not stacked on the intruder surface, so the number of contact points is relatively small. However, as the friction coefficient increases ( μ > 0), the granular bed is more loosely arranged, resulting in a decrease in P. But the amount of decline is very limited. From Figure 14b, we can learn that diameter of the intruder has little effect on Fa/P. The average drag force per contact point, Fa/P, can be succinctly represented by two linear relationships: Fa/P = 0.23 μ + 0.015(N) for μ < 0.9 , and Fa/P = 0.225(N) for μ 0.9 .

5. Conclusions

In this study, our objective was to assess the impact of various parameters on granular penetration at a constant velocity. Our investigations commenced with experiments, which indicated that the drag force encountered by an intruder with a hemispherical nose closely mirrors that of intruders equipped with conical noses at apex angles of 53° and 90°. We noted that the hemispherical nose exhibits enhanced durability compared to its conical counterparts from an engineering perspective. The hemispherical nose was selected for DEM simulations in this paper.
Our study explores an uncharted area: the variation of two critical velocities as the contact area varies with penetration depth. Our findings suggest that V s v aligns with existing theories, whereas V v i is inconsistent with the theory solution based on the classical hydrodynamics model, highlighting an avenue for our follow-up research. Additionally, we introduce Equation (13) as a method for calculating the average force, which can predict the drag force acting on intruders at any penetration speed. However, Equation (13) accounts for only two parameters: penetration speed and depth, while the impact of variables such as the friction coefficient and density on the drag force is captured by three constants: α , β , and K Z . Consequently, this formula may no longer be applicable when the experimental material changes.
We found that the scaled drag force is independent of d i , meaning that the drag force is always proportional to the square of the intruder diameter when V < V s v . However, the drag force does not continue to increase when the friction coefficient exceeds the limit value (0.9). We plot vertical profiles of v and Φ. Our investigation into the flow characteristics immediately below the intruder reveals that the solid volume fraction remains virtually constant when the friction coefficient exceeds 0.9. This implies that the force required to displace the particles ahead remains steady. Furthermore, we observed that the scaled drag force can be represented by two distinct linear relationships: F* = 41.6 and F* = −34μ + 68.
Finally, the average drag force per contact point Fa/P can be succinctly described by two linear relationships: for μ < 0.9 , Fa/P = 0.23 μ + 0.015(N); and for μ 0.9, Fa/P remains constant at 0.225(N). This delineation indicates a distinct shift in the drag force’s dependency on the friction coefficient at the threshold of μ = 0.9, suggesting that beyond this value, the increase in friction does not proportionally affect the average drag force experienced at each contact point. This observation provides critical insight into the interaction dynamics between the intruder and the granular medium, especially in the context of varying frictional conditions.

Author Contributions

Conceptualization, F.W.; methodology, F.W.; software, F.W. and Y.C.; validation, Y.C.; formal analysis, F.W. and Y.C.; investigation, Y.L. (Yang Li); resources, Y.L. (Yanjie Li); data curation, F.W.; writing—original draft preparation, F.W.; writing—review and editing, Y.L. (Yanjie Li); visualization, Y.L. (Yang Li); supervision, Y.L. (Yanjie Li); project administration, Y.L. (Yang Li); funding acquisition, Y.L. (Yanjie Li). All authors have read and agreed to the published version of the manuscript.

Funding

This work was supported by the National Natural Science Foundation of China (31971803).

Institutional Review Board Statement

Not applicable.

Informed Consent Statement

Not applicable.

Data Availability Statement

The data presented in this study are available on request from the corresponding author. The data are not publicly available due to privacy.

Conflicts of Interest

The authors declare no conflicts of interest.

References

  1. Meroz, Y.; Meade, B.J. Intermittent Granular Dynamics at a Seismogenic Plate Boundary. Phys. Rev. Lett. 2017, 119, 138501. [Google Scholar] [CrossRef] [PubMed]
  2. Zhu, S.; Ji, T.; Niu, D.; Yang, Z. Investigation of PEG/mixed metal oxides as a new form-stable phase change material for thermoregulation and improved UV ageing resistance of bitumen. RSC Adv. 2020, 10, 44903–44911. [Google Scholar] [CrossRef] [PubMed]
  3. Tsuji, D.; Otsuki, M.; Katsuragi, H. Laboratory experiment and discrete-element-method simulation of granular-heap flows under vertical vibration. Phys. Rev. E 2019, 99, 062902. [Google Scholar] [CrossRef]
  4. Treers, L.K.; Cao, C.; Stuart, H.S. Granular Resistive Force Theory Implementation for Three-Dimensional Trajectories. IEEE Robot. Autom. Lett. 2021, 6, 1887–1894. [Google Scholar] [CrossRef]
  5. Zhou, L.; Zhang, L.; Bai, L.; Shi, W.; Li, W.; Wang, C.; Agarwal, R. Experimental study and transient CFD/DEM simulation in a fluidized bed based on different drag models. RSC Adv. 2017, 7, 12764–12774. [Google Scholar] [CrossRef]
  6. Naclerio, N.D.; Karsai, A.; Murray-Cooper, M.; Ozkan-Aydin, Y.; Aydin, E.; Goldman, D.I.; Hawkes, E.W. Controlling subterranean forces enables a fast, steerable, burrowing soft robot. Sci. Robot. 2021, 6, eabe2922. [Google Scholar] [CrossRef] [PubMed]
  7. Yankelevsky, D.Z.; Feldgun, V.R.; Karinski, Y.S. The optimal nose shape of a rigid projectile deeply penetrating into a solid target considering friction. Int. J. Impact Eng. 2022, 162, 104157. [Google Scholar] [CrossRef]
  8. Yankelevsky, D.Z.; Feldgun, V.R.; Karinski, Y.S. The false nose shape in a high velocity projectile penetration into dry sand. Int. J. Impact Eng. 2023, 177, 104492. [Google Scholar] [CrossRef]
  9. Feldgun, V.R.; Yankelevsky, D.Z. The optimal nose shape of a projectile penetrating into targets described by a locked hydrostat and a linear shear failure relationship. Int. J. Solids Struct. 2020, 200–201, 119–131. [Google Scholar] [CrossRef]
  10. Glößner, C.; Moser, S.; Külls, R.; Heß, S.; Nau, S.; Salk, M.; Penumadu, D.; Petrinic, N. Instrumented Projectile Penetration Testing of Granular Materials. Exp. Mech. 2016, 57, 261–272. [Google Scholar] [CrossRef]
  11. Chian, S.C.; Tan, B.C.V.; Sarma, A. Projectile penetration into sand: Relative density of sand and projectile nose shape and mass. Int. J. Impact Eng. 2017, 103, 29–37. [Google Scholar] [CrossRef]
  12. Collins, A.L.; Addiss, J.W.; Walley, S.M.; Promratana, K.; Bobaru, F.; Proud, W.G.; Williamson, D.M. The effect of rod nose shape on the internal flow fields during the ballistic penetration of sand. Int. J. Impact Eng. 2011, 38, 951–963. [Google Scholar] [CrossRef]
  13. Omidvar, M.; Iskander, M.; Bless, S. Response of granular media to rapid penetration. Int. J. Impact Eng. 2014, 66, 60–82. [Google Scholar] [CrossRef]
  14. Brzinski, T.A.; Mayor, P.; Durian, D.J. Depth-Dependent Resistance of Granular Media to Vertical Penetration. Phys. Rev. Lett. 2013, 111, 168002. [Google Scholar] [CrossRef] [PubMed]
  15. Aguilar, J.; Goldman, D.I. Robophysical study of jumping dynamics on granular media. Nat. Phys. 2015, 12, 278–283. [Google Scholar] [CrossRef]
  16. Feng, Y.; Blumenfeld, R.; Liu, C. Support of modified Archimedes’ law theory in granular media. Soft Matter 2019, 15, 3008–3017. [Google Scholar] [CrossRef]
  17. Katsuragi, H.; Durian, D.J. Unified force law for granular impact cratering. Nat. Phys. 2007, 3, 420–423. [Google Scholar] [CrossRef]
  18. Seguin, A.; Gondret, P. Drag force in a cold or hot granular medium. Phys. Rev. E 2017, 96, 032905. [Google Scholar] [CrossRef]
  19. Umbanhowar, P.; Goldman, D.I. Granular impact and the critical packing state. Phys. Rev. E 2010, 82, 010301. [Google Scholar] [CrossRef]
  20. Zhang, C.; Ye, X. Force and flow characteristics of an intruder immersed in 3D dense granular matter. Particuology 2022, 71, 47–55. [Google Scholar] [CrossRef]
  21. Abbasi Aghda, S.; Naji, A. Drag force on cylindrical intruders in granular media: Experimental study of lateral vs axial intrusion and high grain-size polydispersity. Powder Technol. 2023, 415, 118194. [Google Scholar] [CrossRef]
  22. Ambroso, M.A.; Kamien, R.D.; Durian, D.J. Dynamics of shallow impact cratering. Phys. Rev. E 2005, 72, 041305. [Google Scholar] [CrossRef] [PubMed]
  23. Goldman, D.I.; Umbanhowar, P. Scaling and dynamics of sphere and disk impact into granular media. Phys. Rev. E 2008, 77, 021308. [Google Scholar] [CrossRef]
  24. Li, C.; Zhang, T.; Goldman, D.I. A Terradynamics of Legged Locomotion on Granular Media. Science 2013, 339, 1408–1412. [Google Scholar] [CrossRef] [PubMed]
  25. Roth, L.K.; Han, E.; Jaeger, H.M. Intrusion into Granular Media Beyond the Quasistatic Regime. Phys. Rev. Lett. 2021, 126, 218001. [Google Scholar] [CrossRef] [PubMed]
  26. Roth, L.K. Constant speed penetration into granular materials: Drag forces from the quasistatic to inertial regime. Granul. Matter 2021, 23, 54. [Google Scholar] [CrossRef]
  27. Zik, O.; Stavans, J.; Rabin, Y. Mobility of a Sphere in Vibrated Granular Media. Europhys. Lett. EPL 1992, 17, 315–319. [Google Scholar] [CrossRef]
  28. Pongó, T.; Stiga, V.; Török, J.; Lévay, S.; Szabó, B.; Stannarius, R.; Hidalgo, R.C.; Börzsönyi, T. Flow in an hourglass: Particle friction and stiffness matter. New J. Phys. 2021, 23, 023001. [Google Scholar] [CrossRef]
  29. Duan, Y.; Feng, Z.-G. Incorporation of velocity-dependent restitution coefficient and particle surface friction into kinetic theory for modeling granular flow cooling. Phys. Rev. E 2017, 96, 062907. [Google Scholar] [CrossRef]
  30. Thornton, C. Numerical simulations of deviatoric shear deformation of granular media. Géotechnique 2000, 50, 43–53. [Google Scholar] [CrossRef]
  31. Senetakis, K.; Coop, M.R.; Todisco, M.C. Tangential load–deflection behaviour at the contacts of soil particles. Géotechnique Lett. 2013, 3, 59–66. [Google Scholar] [CrossRef]
  32. Yan, W.M.; Dong, J. Effect of Particle Grading on the Response of an Idealized Granular Assemblage. Int. J. Geomech. 2011, 11, 276–285. [Google Scholar] [CrossRef]
  33. Yan, W.M.; Zhang, L. Fabric and the critical state of idealized granular assemblages subject to biaxial shear. Comput. Geotech. 2013, 49, 43–52. [Google Scholar] [CrossRef]
  34. Fu, P.; Dafalias, Y.F. Fabric evolution within shear bands of granular materials and its relation to critical state theory. Int. J. Numer. Anal. Methods Geomech. 2010, 35, 1918–1948. [Google Scholar] [CrossRef]
  35. Guo, N.; Zhao, J. The signature of shear-induced anisotropy in granular media. Comput. Geotech. 2013, 47, 1–15. [Google Scholar] [CrossRef]
  36. Huang, X.; Hanley, K.J.; O’Sullivan, C.; Kwok, C.Y. Exploring the influence of interparticle friction on critical state behaviour using DEM. Int. J. Numer. Anal. Methods Geomech. 2014, 38, 1276–1297. [Google Scholar] [CrossRef]
  37. Kidokoro, T.; Arai, R.; Saeki, M. Investigation of dynamics simulation of granular particles using spherocylinder model. Granul. Matter 2015, 17, 743–751. [Google Scholar] [CrossRef]
  38. Mindlin, R.D.; Deresiewicz, H. Elastic Spheres in Contact Under Varying Oblique Forces. J. Appl. Mech. 1953, 20, 327–344. [Google Scholar] [CrossRef]
  39. Guo, Y.; Liu, Q.; Li, Y.; Li, Z.; Jin, H.; Wassgren, C.; Curtis, J.S. Discrete element method models of elastic and elastoplastic fiber assemblies. AIChE J. 2021, 67, e17296. [Google Scholar] [CrossRef]
  40. Mindlin, R.D. Compliance of Elastic Bodies in Contact. J. Appl. Mech. 1949, 16, 259–268. [Google Scholar] [CrossRef]
Figure 1. The four modules included in the experimental system.
Applsci 14 02336 g001
Figure 2. A constant speed penetration device and an experimental setup sketch.
Applsci 14 02336 g002
Figure 3. Schematic diagram of the simulation equipment.
Applsci 14 02336 g003
Figure 4. Intruders with different nose shapes.
Applsci 14 02336 g004
Figure 5. Comparison of drag forces for different nose shapes where each data point is obtained from five drag experiments.
Applsci 14 02336 g005
Figure 6. Plot of the average drag force as a function of moving velocity for different nose shapes, where each data point is obtained from five drag experiments, as shown in Figure 5.
Applsci 14 02336 g006
Figure 7. Comparison of the drag forces between numerical simulation and experimental results (penetration velocity V = 10 mm/s, d p = 10 mm).
Applsci 14 02336 g007
Figure 8. Drag force exerted on an intruder impacting at the velocity ranging from (a) 0.01 to 2.0 m/s; (b) 3.0 to 10.0 m/s.
Applsci 14 02336 g008
Figure 9. The relationship between the average force and the penetrating velocity.
Applsci 14 02336 g009
Figure 10. Comparison of penetration drag forces values and linear fitting functions for different particle diameters (scattered points represent simulation results, while solid straight lines represent fitted curves).
Applsci 14 02336 g010
Figure 11. (a) The averaged forces. (b) The scaled drag forces of intruder influenced by different friction coefficients and the diameters of intruder ( d c : d i = 5:1, d p = 6 mm).
Applsci 14 02336 g011
Figure 12. Flow profiles averaged within a cylinder aligned with the intruder axis. (a) The vertical grain velocity v as a function of distance from the intruder surface at t = 4.0 s. (b) Local packing density under the intruder surface as a function of the friction coefficient.
Applsci 14 02336 g012
Figure 13. Vertical profile through the central axis of the intruder ( d c : d i = 5:1, d p = 6 mm).
Applsci 14 02336 g013
Figure 14. (a) The parameter P. (b) The average drag force on each contact point Fa/P influenced by different friction coefficients and the diameters of intruder ( d c : d i = 5:1, d p = 6 mm).
Applsci 14 02336 g014
Table 1. Parameters used in the experiments and DEM simulations.
ParametersValues
Particle diameter (mm) d p = 5, 6 #, 7, 8, 10
Intruder diameter (mm) d i : d p = 2 ~ 10 , d i = 40
Container diameter (mm) d c : d i = 5 # , d c = 230
Length of intruder (mm)L = 450 #
Young’s modulus (GPa)Eacr = 2.5, Egls = 71.7
Poisson’s ratio ν acr = 0.37 , ν gls = 0.24
Density (kg/m3)ρacr = 1190, ρgls = 2502
Coefficient of friction μ acr = 0.3 # , 0.0 ~ 1.7 , μ gls = 0.3
Coefficient of restitutioneacr = 0.865, egls = 0.88
Time step (s)t = 1.496 × 10⁻⁶
Gravity (m/s2)g = 9.81
Penetration speed (m/s)V = 0.01 #~10
Particles bed height (mm)H = 535 #
Note: The numbers marked with # are the parameters used in the base case for simulations in this paper. The parameters marked with “acr” and “gls” represent acrylic and glass materials, respectively. The glass material is used in the comparison of the drag forces between numerical simulation and experimental results only. The values in bold font are the parameters used in the experiments.
Disclaimer/Publisher’s Note: The statements, opinions and data contained in all publications are solely those of the individual author(s) and contributor(s) and not of MDPI and/or the editor(s). MDPI and/or the editor(s) disclaim responsibility for any injury to people or property resulting from any ideas, methods, instructions or products referred to in the content.

