Abstract
Sugar derived from crops is a crucial organic energy source studied in the Earth sciences, serving as a renewable and clean energy alternative. Biofuels produced from crop sugars are more environmentally friendly than traditional fossil fuel sources and contribute to solar energy storage and conversion within the Earth’s cycle. Using mangoes as a case study, this research employs near-infrared spectral analysis technology to develop an algorithm for a mango brix detection device. The study investigates the relationship between brix and absorbance, as well as changes in brix levels, and their application for on-site mango brix detection. Near-infrared spectral data in the range of 1300 nm to 2300 nm were collected during the mango ripening season in summer and preprocessed using various techniques. A neural network-based least squares modeling approach was utilized to develop a mango sugar content detection model, resulting in a correlation coefficient of 0.9055 and a root-mean-square error of 0.2192. To enhance model accuracy and avoid local optimization issues, this study incorporated the simulated annealing algorithm for model optimization, leading to a correlation coefficient of 0.9854 and a root-mean-square error of 0.0431. The findings demonstrate that the non-destructive testing model of mangoes based on near-infrared spectroscopy effectively detects brix changes and storage potential post-harvest, offering valuable insights for mango quality assessment, optimal picking and selling times, and market selection.
1. Introduction
Crop-derived sugar is a significant organic energy resource that is studied in the Earth sciences, playing a crucial role as a primary energy source [1,2]. Near-infrared spectroscopy, recognized for its efficiency, non-destructiveness, and environmental friendliness, has been extensively used in rapid fruit testing [3]. This technology enables the continuous monitoring of brix levels in fruits without altering their visual appearance, offering essential support and analysis for fruit research, development, cultivation, ripeness assessment, harvest timing, storage, transportation, distribution, and pricing [4,5,6]. While NIR spectroscopy effectively captures essential fruit characteristics, its modeling process using Fourier transform NIR spectroscopy can be impacted by irrelevant variables, leading to model interference, weak predictive ability, and poor stability.
In recent years, extensive research efforts have focused on developing models for detecting fructose content. McGlone et al. utilized the absorption method to assess whole apples, measuring transmitted light in the 650–950 nm wavelength range to analyze absorption levels and predict dry matter content, and ultimately achieved favorable results [4]. In 2013, Travers et al. conducted predictive modeling of wave bandwidth in two specific ranges, revealing that the modeling effectiveness was optimal within the wavelength range of 1100–2350 nm [7]. Yande Liu et al. conducted investigations on apple brix degree models at varying measuring distances. Zhenhua Tu et al. employed a Charge-Coupled Device (CCD) spectrometer for mango brix content detection, integrating spectrum pretreatment to establish a reliable prediction model. Khodabakhshian et al. devised a multispectral imaging system for evaluating total soluble solids (TSS), titratable acidity (TA), and pH levels in pomegranates [8]. Xiao Chen et al. employed a neural network algorithm to enhance the predictive model for estimating the brix content of pear fruits, assessing the impact of uncorrelated factors on the test samples [9]. Yunqi Zhang et al. utilized near-infrared (NIR) spectroscopy to detect sugar and acidity ratios in apples, developing a relationship model between spectra and sugar and acidity levels using the partial least squares model. Their findings demonstrate that this NIR rapid detection method enables non-destructive assessment of the internal quality of apples [10]. While advancements have been achieved in NIR spectral analysis techniques and related research findings, challenges persist in addressing issues such as local miniaturization and inconsistent weight assignment in the BP neural network, hindering the effective resolution of measurement challenges in practical applications.
In this investigation, our research team collected spectral data and recorded sugar content from various mango varieties within a controlled experimental setting, utilizing primary equipment including the Ocean Optics NIR-Quest spectrometer. The acquired spectral data underwent preprocessing techniques including Standard Normal Variate (SNV) processing, Savitzky–Golay (S–G) smoothing, outlier removal, and interpolation. A brix model was developed for the processed data using a partial least squares approach integrated with the BP neural network algorithm, which was further optimized through a simulated annealing algorithm to enable the non-destructive prediction of mango brix levels. This methodology holds significance for enhancing quality control measures in agricultural production and processing [11].
2. Equipment and Method
2.1. Experimental Materials and Instrument
2.1.1. Experimental Materials
Ninety-five samples of Tai Tainong and Jin Huang Awn mangoes, chosen for their smooth surfaces, the absence of scars, even ripeness, and consistent size distribution, were sourced from Haidian District, Beijing [12]. The samples were randomly divided into distinct ratios and categorized into training and calibration sets. Purified water was employed to cleanse each mango, ensuring the mango’s inherent quality remained intact during the cleaning process. Following cleaning, the mangoes were uniformly positioned in a controlled outdoor environment to minimize external factors, such as wind and surface temperature, that could affect the prediction accuracy. Each mango was individually numbered and marked in sequence [13].
2.1.2. Experimental Instrument
The experiment utilized a state-of-the-art NIR-Quest+ infrared spectrometer, an HL-2000-LL series halogen light source (with a wavelength range of 360–2400 nm and a power output of 4.75 W), and a Vision infrared light reflection probe, all procured from Ocean Optics Company. The optical resolution of the final experimental system was 5.5 nm.
Following spectral data acquisition, the brix content of the mango samples was analyzed. To ensure precise brix measurements, the experimental brix calibration Digital Handheld Refractometer (DHR) 95 sun protection device from Schmidt + Haensch GmbH & Co. (Berlin, Germany) was employed. The instrument’s operational temperature range was 5–40 °C, with a brix measurement error of 0.1%, meeting the experimental specifications. Additionally, the Japan ATAGO Mango Non-Destructive Brix Meter PAL-HIKARi 15 was utilized for comparison, boasting a brix measurement range of 10.0 to 22.0%, accuracy of ±1.5%, resolution of 0.1% Brix, and an automatic temperature compensation from 10.0 to 35.0 °C. All computations were conducted on Windows 11 using Matlab R2022a software. (Mathworks Inc., Massachusetts, USA) (Matlab R2022a v9.12.0.1884302 (accessed on 15 February 2024)).
2.1.3. Spectral Data Acquisition
- Spectrometer Parameter Setting
The spectrometer and light source are first preheated and allowed to stabilize before performing a standard zero correction based on daily light intensity levels to minimize the impact of experimental system instability on results. To mitigate the effects of field-of-view constraints and unclear phase characteristics on spectral data acquisition, an intensity calibration algorithm is employed after analyzing the subject’s phase properties to enhance data accuracy [14]. Three detection points are chosen on the smooth equatorial region of the mango sample to ensure precise alignment with the probe at each measurement point [15]. Employing the OceanView software integral to the system, the parameters are configured as follows: integration time is set to 4 milliseconds, average frequency to 120, smoothing frequency to 4, and the spectrometer is equipped with electronic dark noise correction (EDC).(OceanView v2.0.16. https://www.oceaninsight.com/products/software/acquisition-and-analysis/oceanview-70e79976/ (accessed on 2 February 2024)) Three specific points, namely the equator, base, and apex, are targeted for three successive scans using the spectrometer, with the resultant average of the three scans deemed the preliminary spectrum for the experiment.
- Selection of spectral data acquisition point
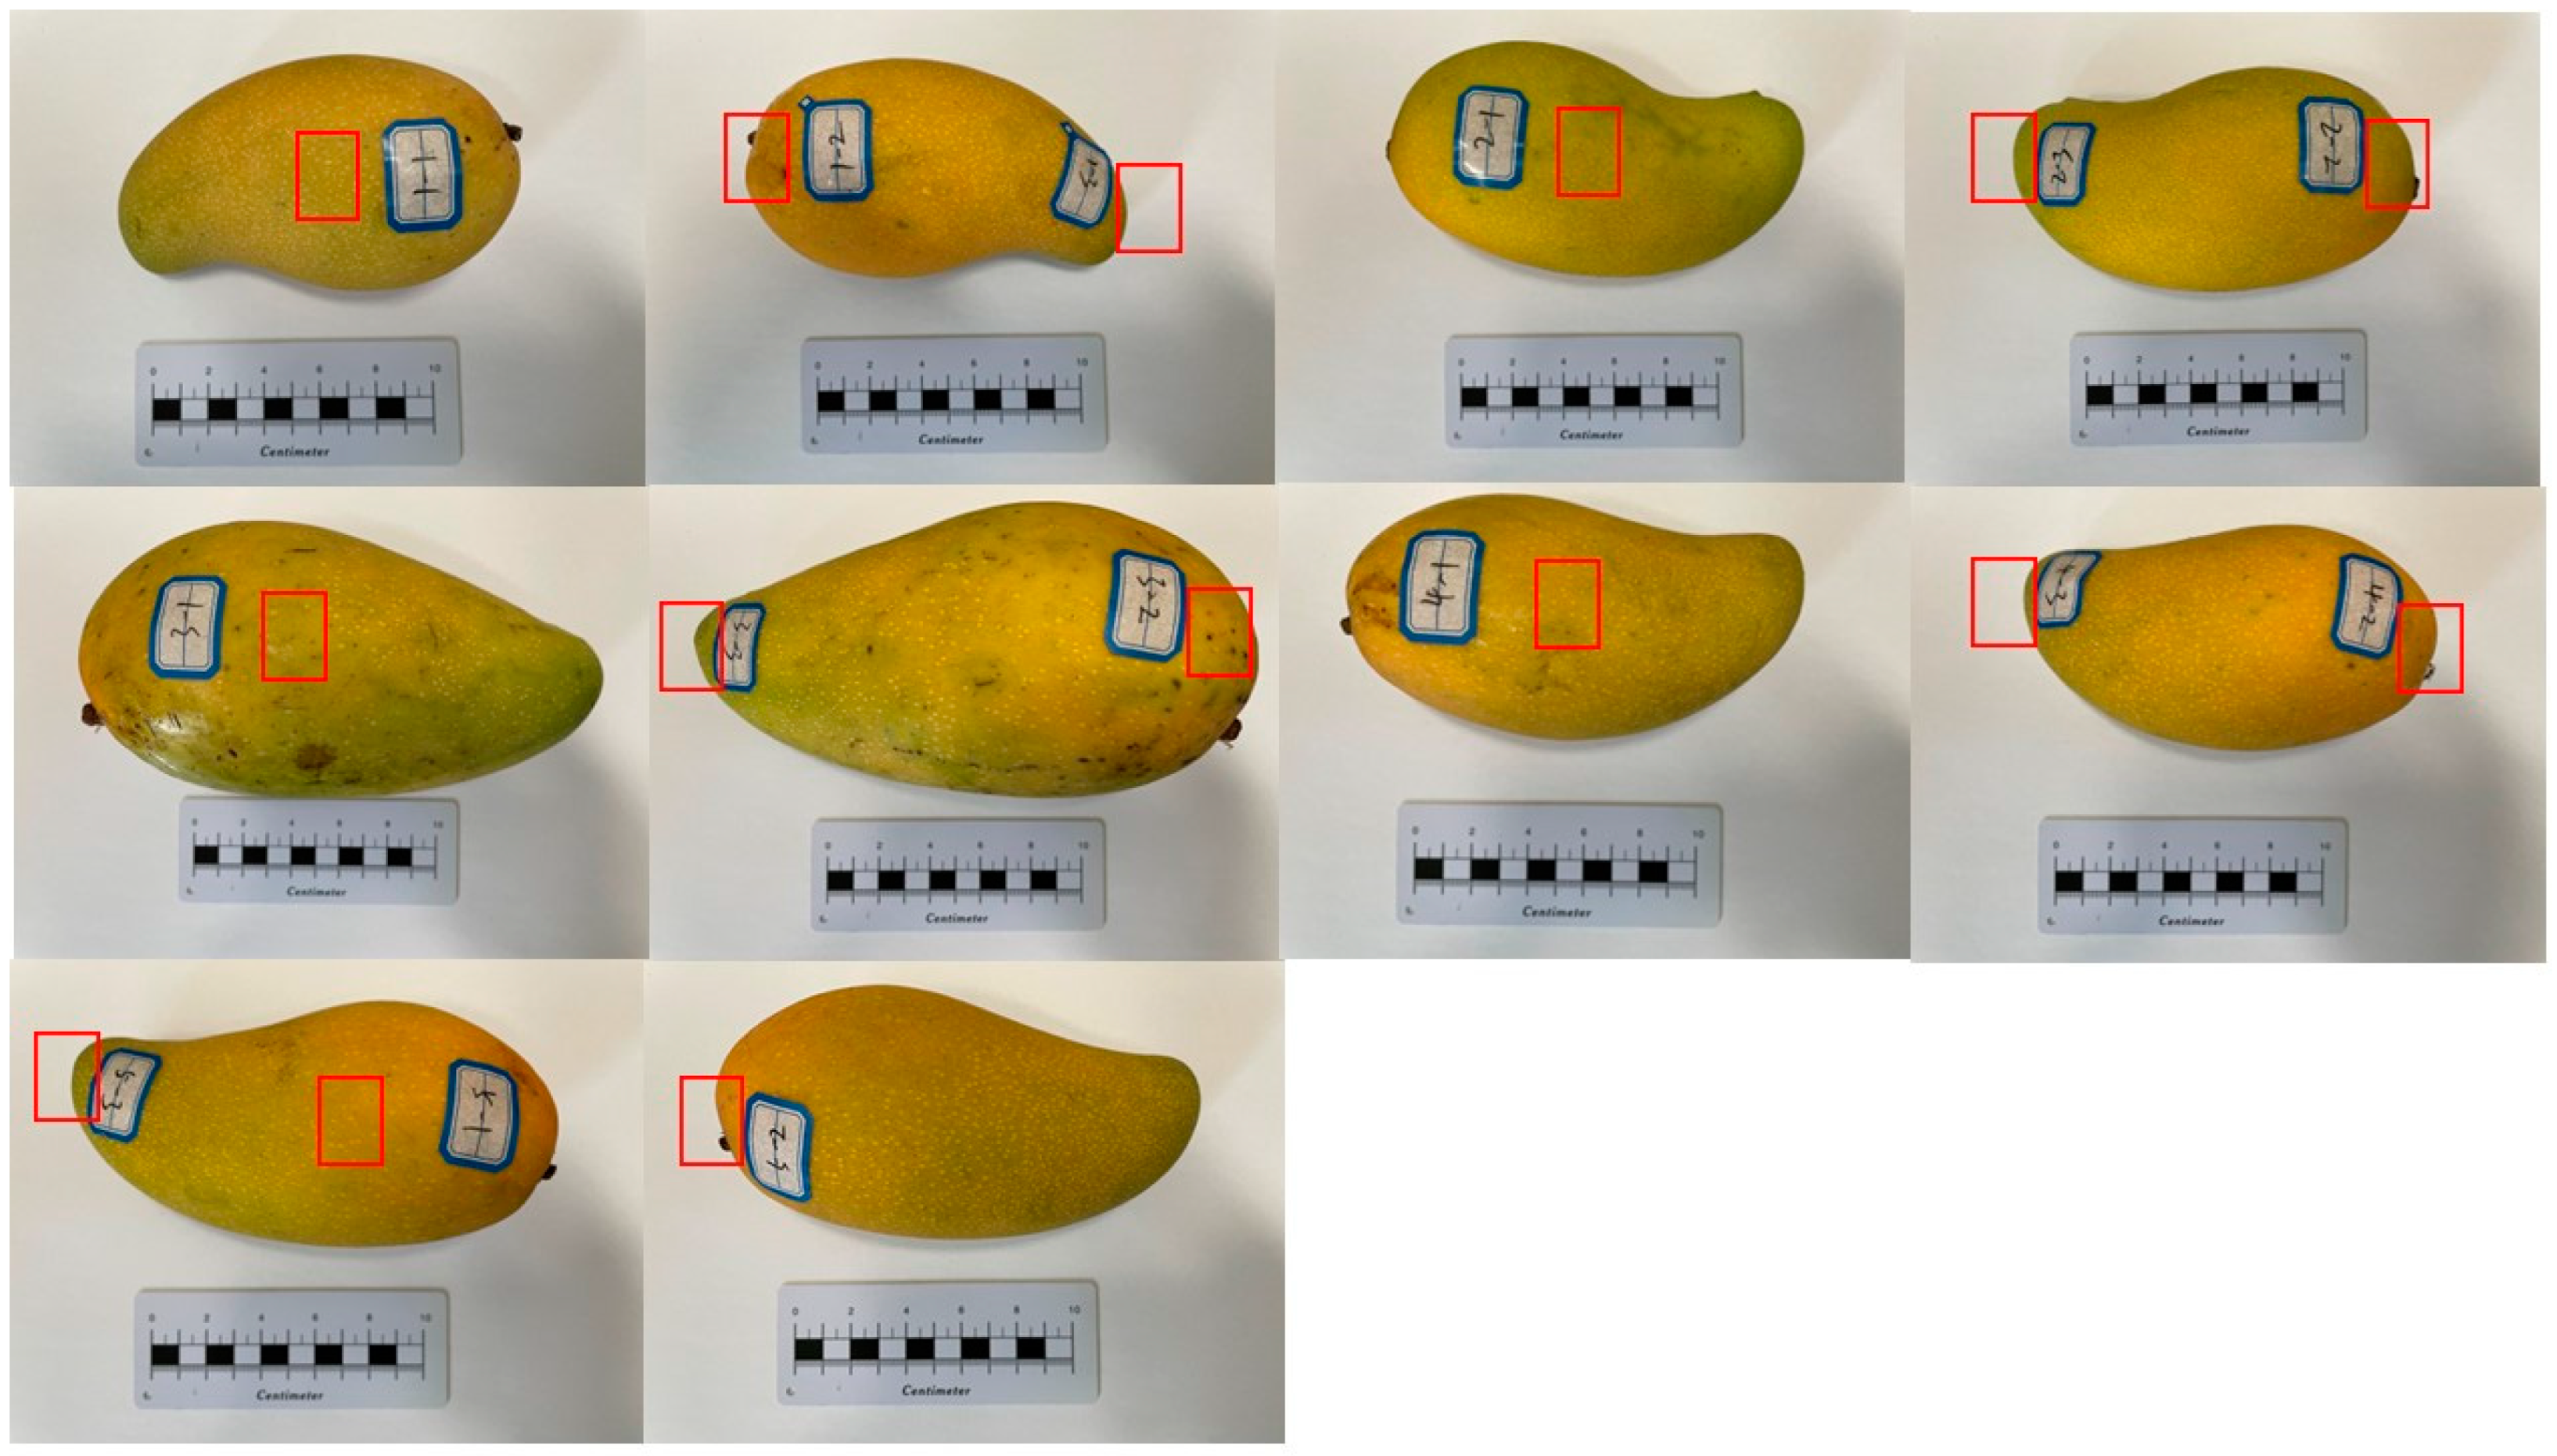
Following equipment preheating, the reflectance spectral curves of 95 mango samples are obtained in a controlled environment. The wavelength is plotted on the horizontal axis while spectral absorbance is depicted on the vertical axis. Uniform labeling is applied to mark the equatorial, basal, and apex regions of the mangoes for near-infrared (NIR) spectrum acquisition, as illustrated in Figure 1, with the red box indicating the measurement location.

Figure 1.
Mango spotting physical map.
2.2. Machine Learning Model
2.2.1. Back Propagation Neural Network Establishment
In this study, the linear fitting model is chosen over the BP neural network at the software level [16]. In contrast to many neural networks, the BP neural network demonstrates superior performance in handling tasks necessitating long-term memory, selective information updating and transmission, and information control. Moreover, its intricate network structure enables more effective modeling of sequential relationships, enhancing the capturing of patterns and features within the training dataset [17].
Traditional recurrent neural networks are composed of a series of interconnected identical basic units, each capable of transmitting information to the succeeding unit. In the BP neural network model, four interconnected neural network layers operate in unique symbiosis. These layers encompass memory elements for system state maintenance and nonlinear gate elements, facilitating information regulation within and outside the memory element at any given period. Any recurrent neural network may be deconstructed into an infinite array of recurring basic units. Equation (1) illustrates the input gate of the neural network, with ht−1 and xt denoting the prior state output value and current state input value, respectively. These values signify the acceptance or rejection of corresponding information, thereby dictating the updating state.
Equation (2) signifies the candidate cell state, where information is stored and subsequently assessed through dot multiplication to identify pertinent memories. A value of 0 denotes complete discard, while a value of 1 signifies total retention, thereby integrating retained information as fresh memory into the new unit state. Within Equation (3), Ct−1 symbolizes the former cell state; σ denotes the sigmoid function which maps the input values to a range between 0 and 1; ft denotes the output of the forget gate; Wi and Wc reflect the parameter matrix; and bi and bc denote bias parameters. Equation (3) delineates the formation of each novel unit state.
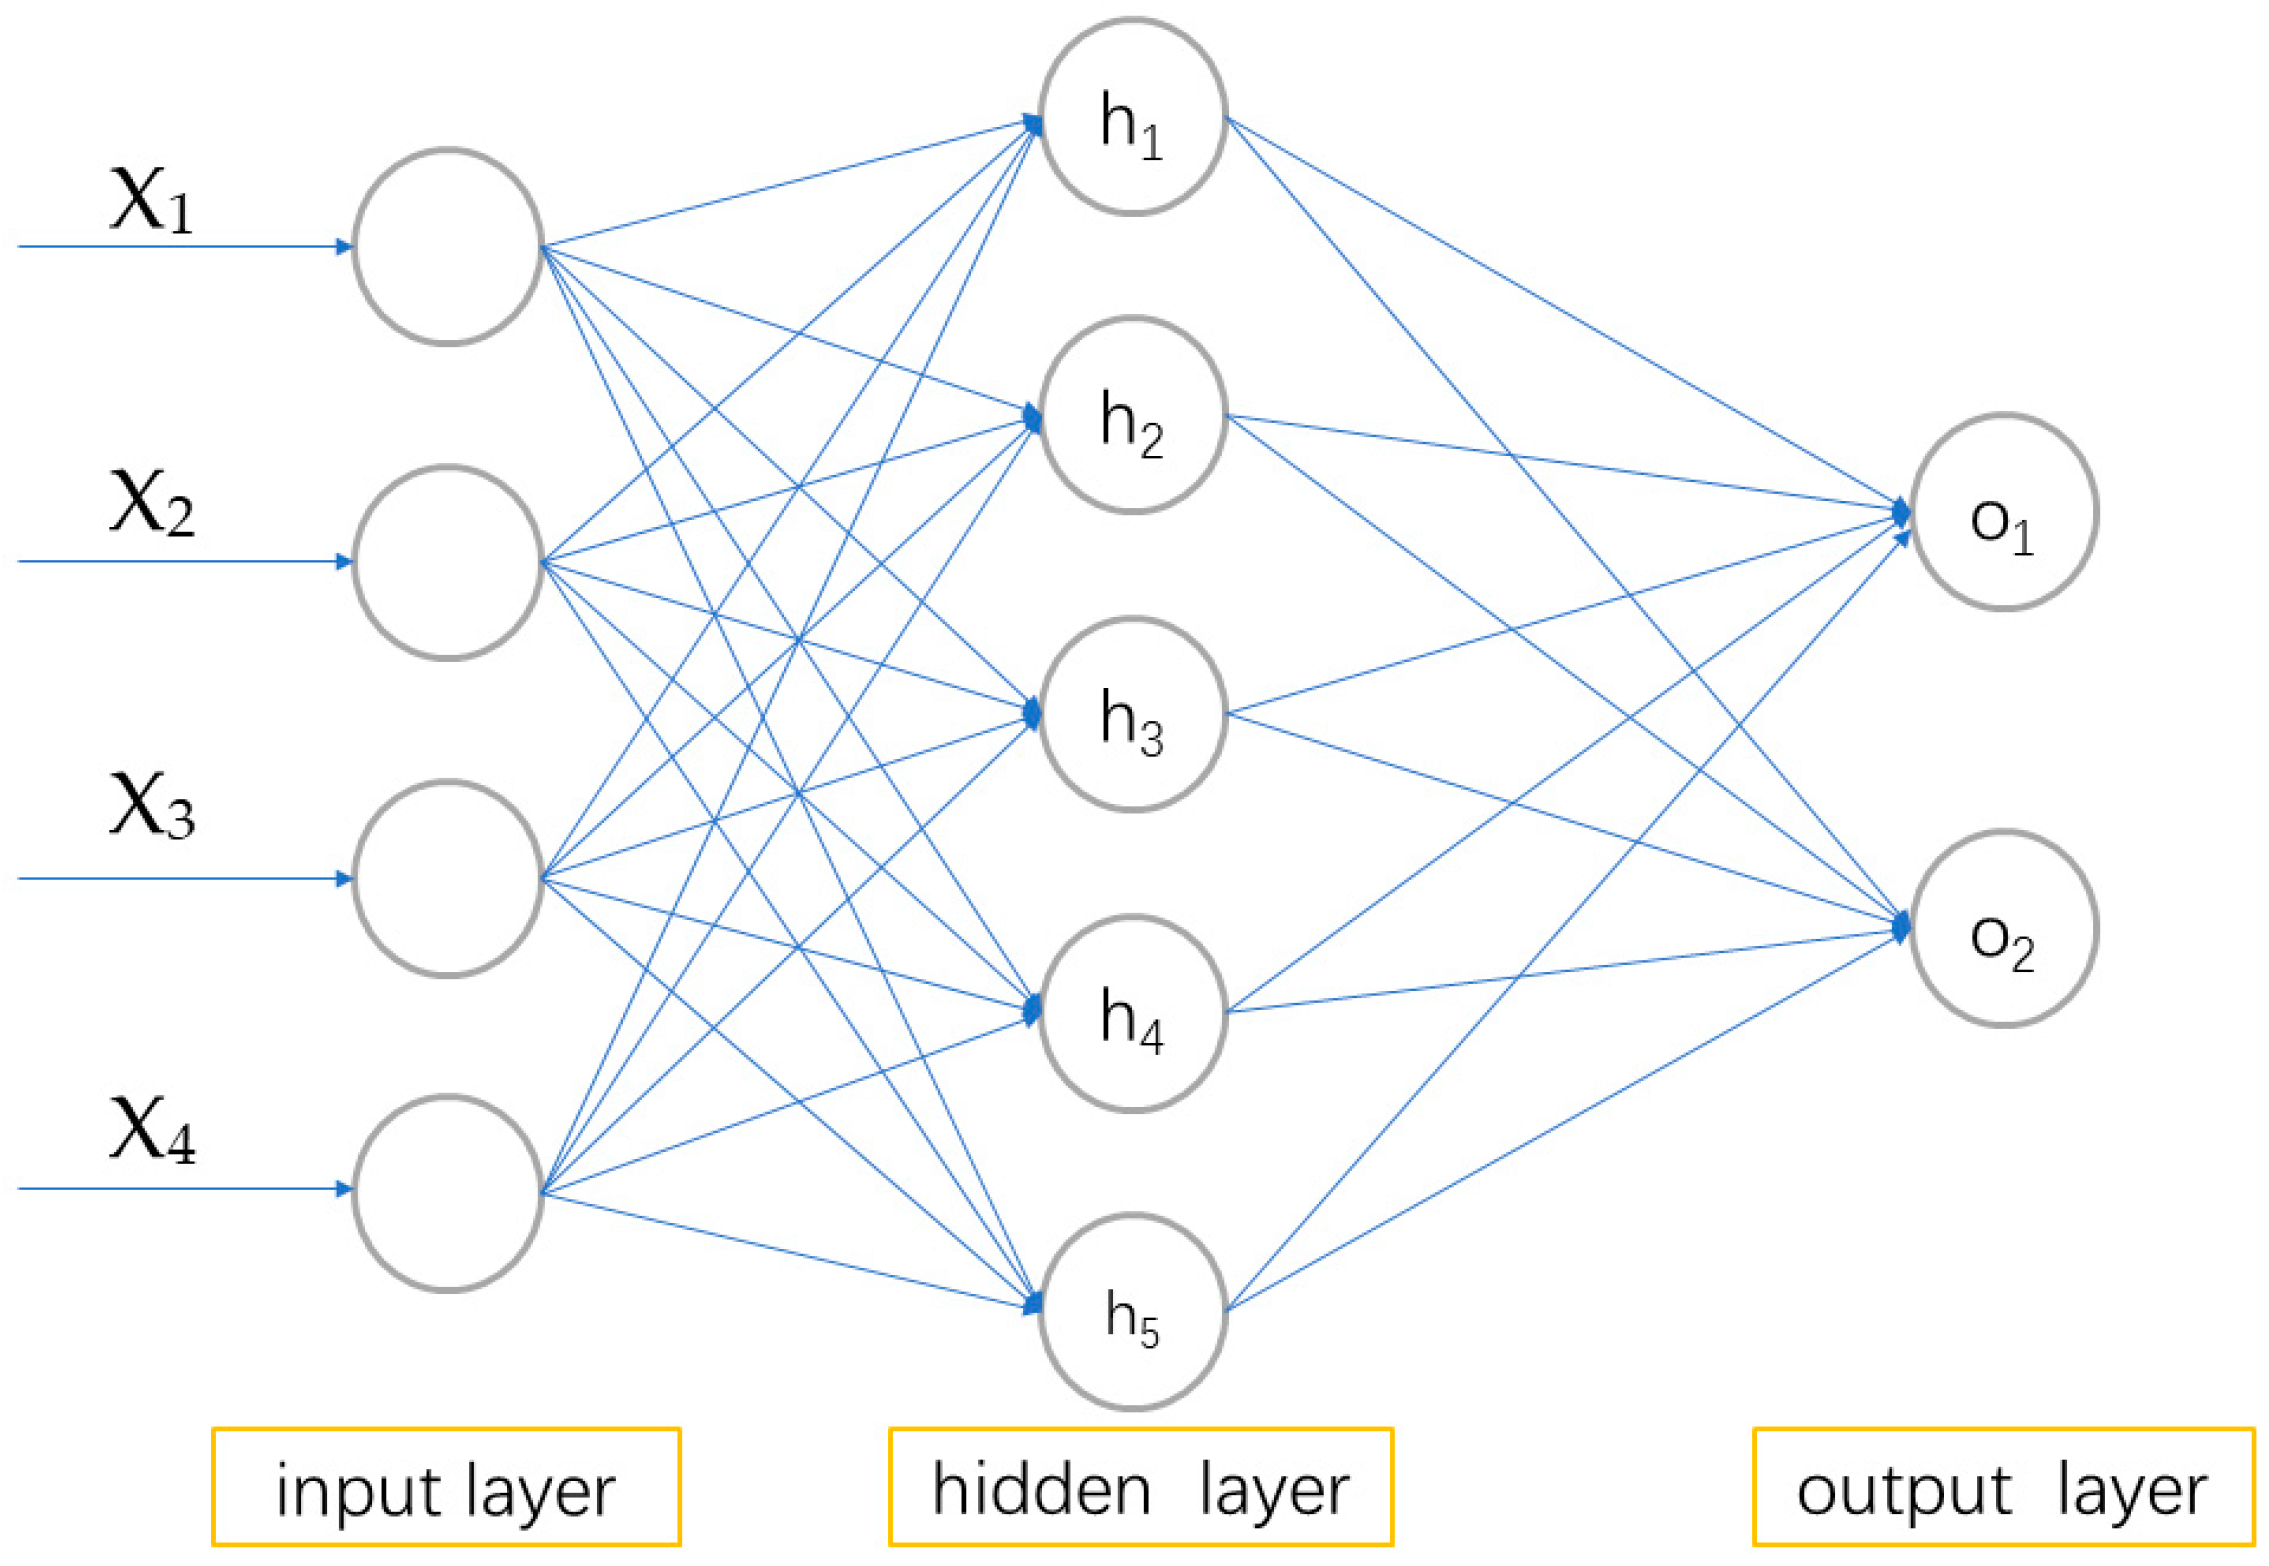
Equation (4) represents the updated cell state derived from the Sigmoid layer, responsible for determining the portion of the unit state to be output. Subsequently, the necessary memory is output as an output gate for the entire neural network, as illustrated in the fundamental principle in Figure 2.
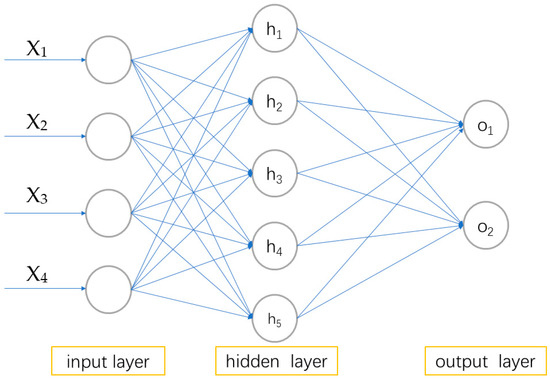
Figure 2.
BP neural network structure diagram.
2.2.2. Partial Least Squares Curve
In BP-PLS, the independent and dependent variables undergo dimensionality reduction through the principal component analysis method. The original data are thereby converted into a fresh set of potential variables known as PLS components [18]. These PLS components represent linear combinations that encapsulate the significant explanatory variance of both the independent and dependent variables. Each PLS component can be leveraged to construct a regression model linking the independent and dependent variables. Subsequently, through iterative refinement, BP-PLS identifies the optimal PLS component capable of elucidating the variances in both variables. During each iteration, BP-PLS computes the covariance matrix between the independent and dependent variables and determines the direction that maximizes covariance as a novel PLS component [19]. This process undergoes multiple iterations until reaching a predefined quantity of PLS components. Ultimately, within each PLS component, the contribution of that component to the predicted dependent variable can be computed based on the loading coefficient between the component and the independent and dependent variables [20]. The linear regression model linking the independent and dependent variables is established utilizing the BP neural network structure, which is formulated through the weighted summation of these contribution values.
2.2.3. Optimization by Simulated Annealing Algorithm
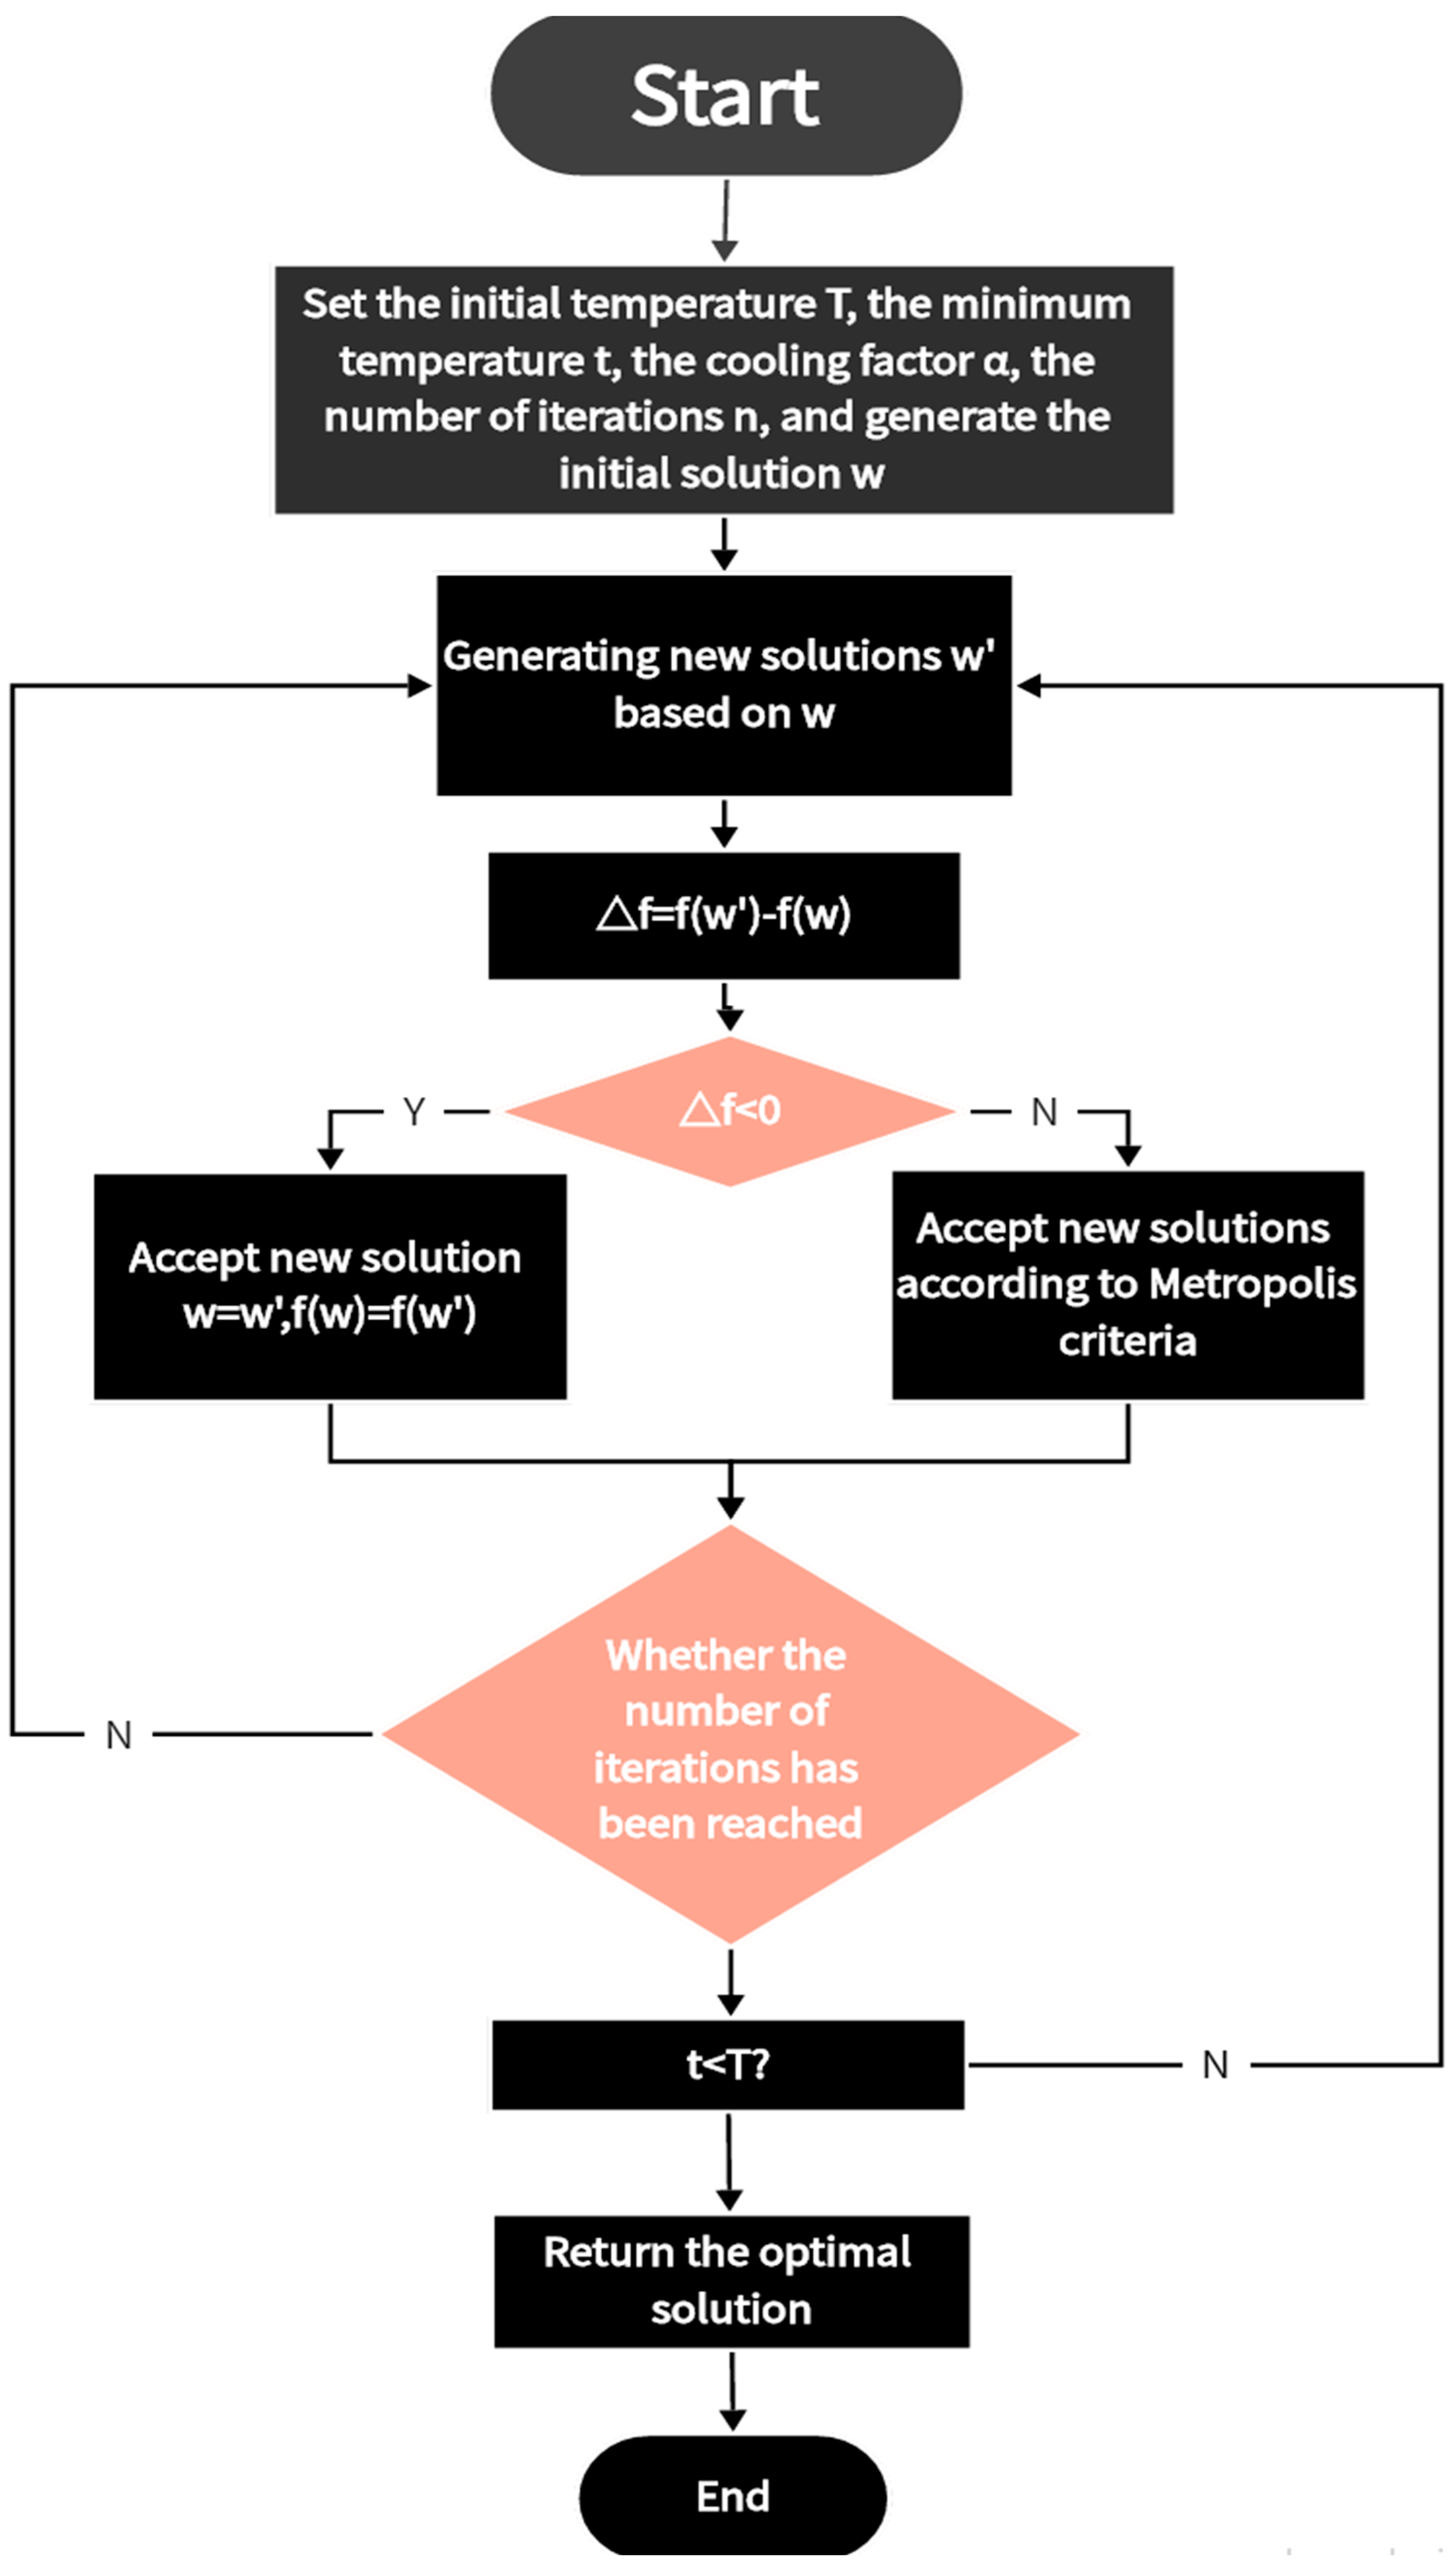
In consideration of the linear regression curve derived from the BP-PLS model and a thorough literature review, the propensity for overfitting during the BP neural network training phase is elucidated, often accompanied by uncertain network topology. To address these challenges, the study introduces the Simulated Annealing Algorithm (SAA) [21]. The simulated annealing algorithm is initiated by drawing parallels between the annealing process in solid matter physics and general combinatorial optimization problems. The algorithm’s flowchart is depicted in Figure 3. Commencing from a designated high temperature T and progressively decreasing temperature parameters, the algorithm facilitates a probabilistic transition towards the global optimal solution of the objective function by evading local optima. This approach helps in mitigating errors arising from local optima entrapment and overfitting during the search process, thereby enhancing the optimization of the neural network’s weight thresholds. Consequently, the study leverages the simulated annealing algorithm to optimize the neural network and enhance its overall performance.
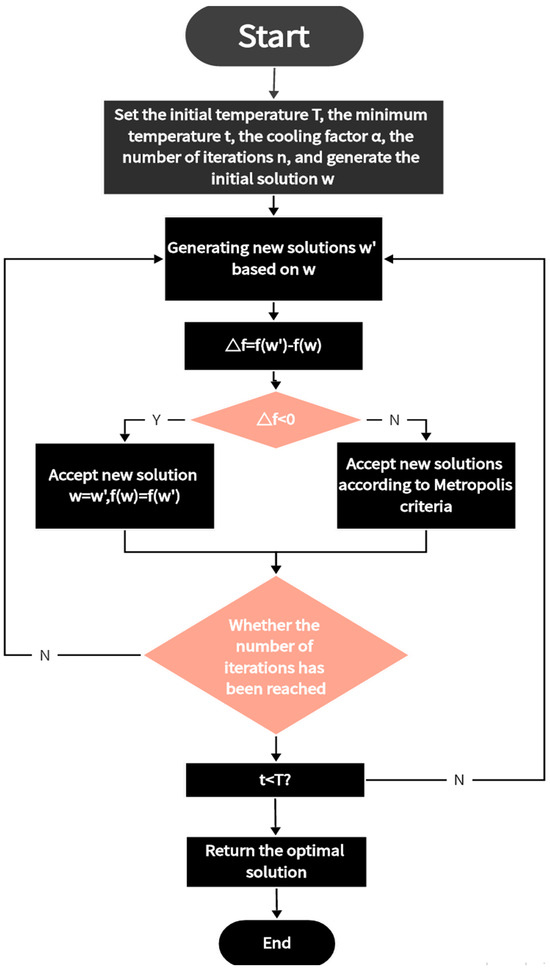
Figure 3.
Flowchart of SA algorithm.
2.3. Results and Discussion
2.3.1. Data Processing
- Statistics of mango brix data
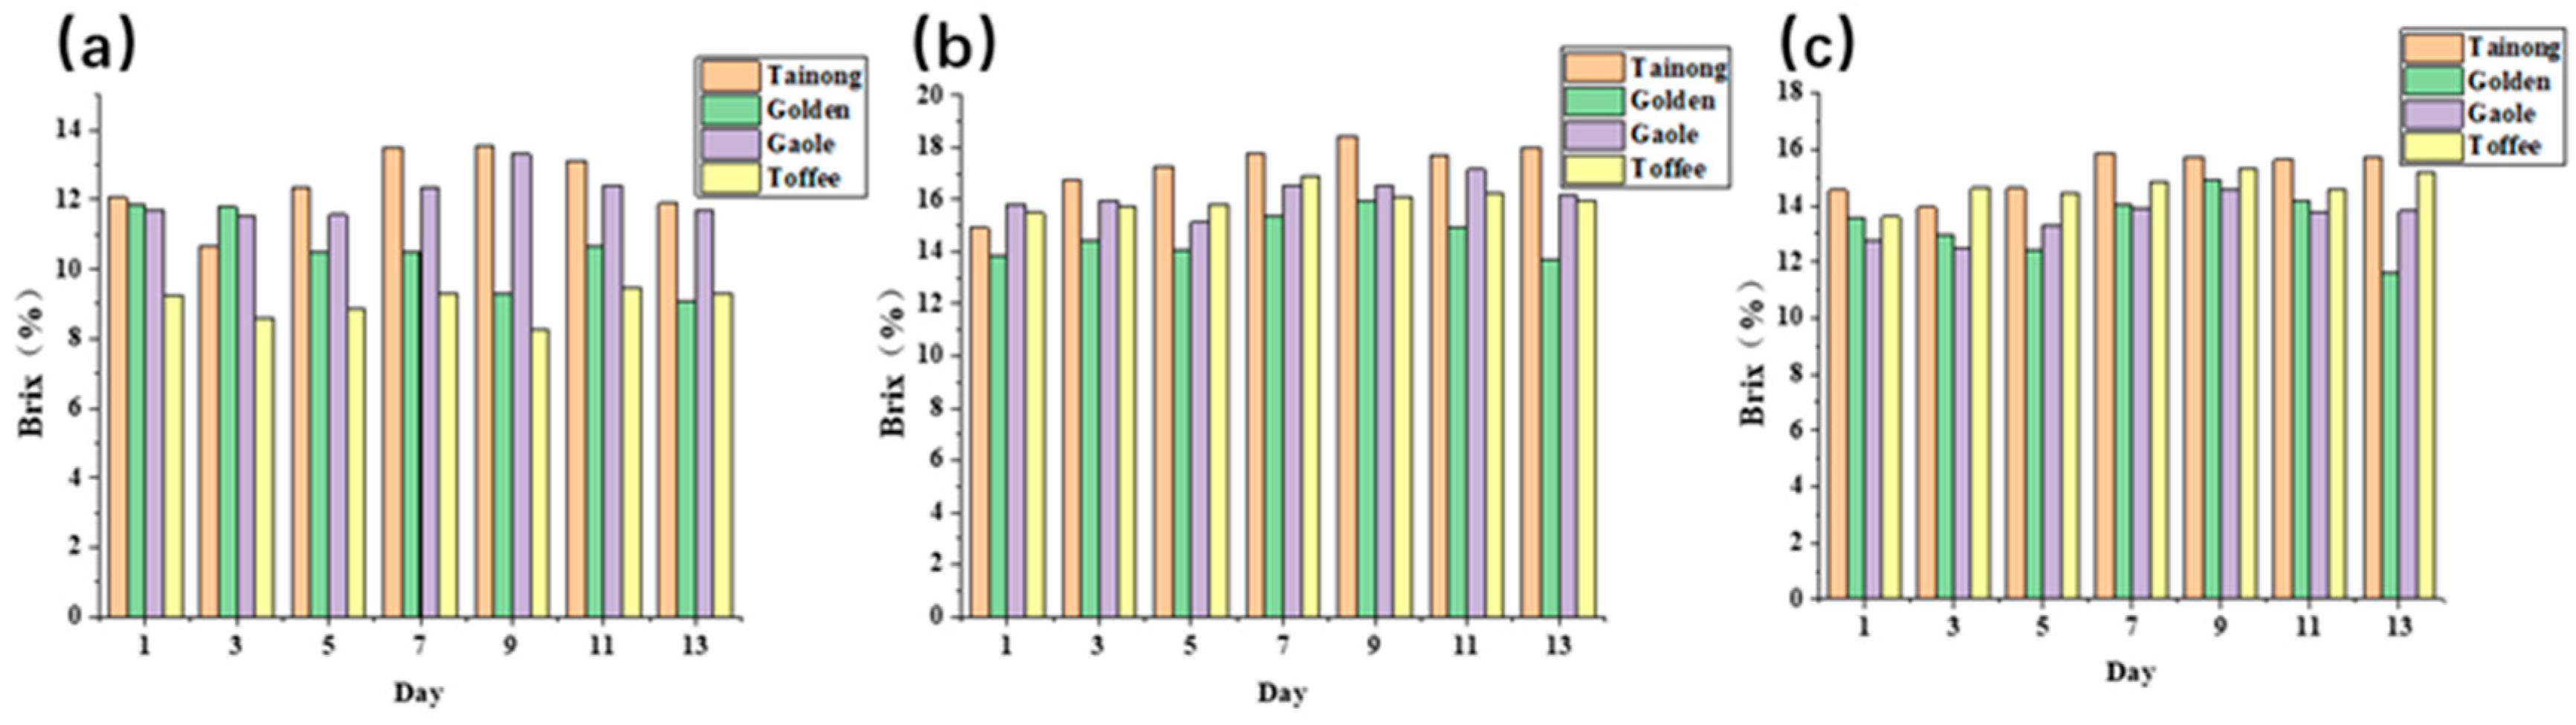
The effects of different point sites on mango brix levels were investigated by plotting the curves of brix levels for each point site of various mango varieties as a function of time, as depicted in Figure 4a–c. The mango varieties included in the study, such as Tainong, Golden, Gaole, and Toffee, are known for their similar size and sugar content, containing high levels of sugar and vitamin C ranging from approximately 14 to 20 percent. These mango varieties predominantly originate from provinces such as Hainan, Guangxi, Yunnan, and Sichuan in China. Specifically, the mango point location in Figure 4a corresponds to the abdomen of the mango, which is exposed to sunlight for the majority of the day and plays a significant role in photosynthesis [22]. The activity of the encoded convertase exhibits a continuous increase, resulting in the elevated cleavage of sucrose into glucose and fructose, consequently leading to a rise in soluble solid content and the highest brix content in mango. In Figure 4c, the mango roots are exposed to greater sunlight, serving as the primary site for soluble solid production and subsequent accumulation, resulting in a slightly higher brix content compared to the top in Figure 4b. However, with prolonged storage, the mango surface undergoes damage due to the diminished activity of antioxidant enzymes and reduced brix content, potentially impacting the experimental outcomes. Hence, in the current study, efforts are made to minimize brix measurements following prolonged preservation periods [23].
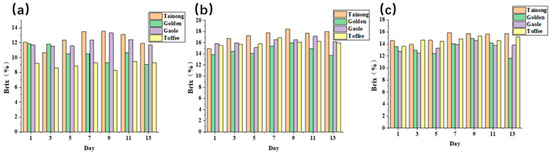
Figure 4.
(a) Brix bar graph of brix content of different mangoes at top points over time; (b) brix bar graph of brix content of different mangoes at equator points over time; and (c) brix bar graph of brix content of different mangoes at the root point over time.
- Spectral data preprocessing
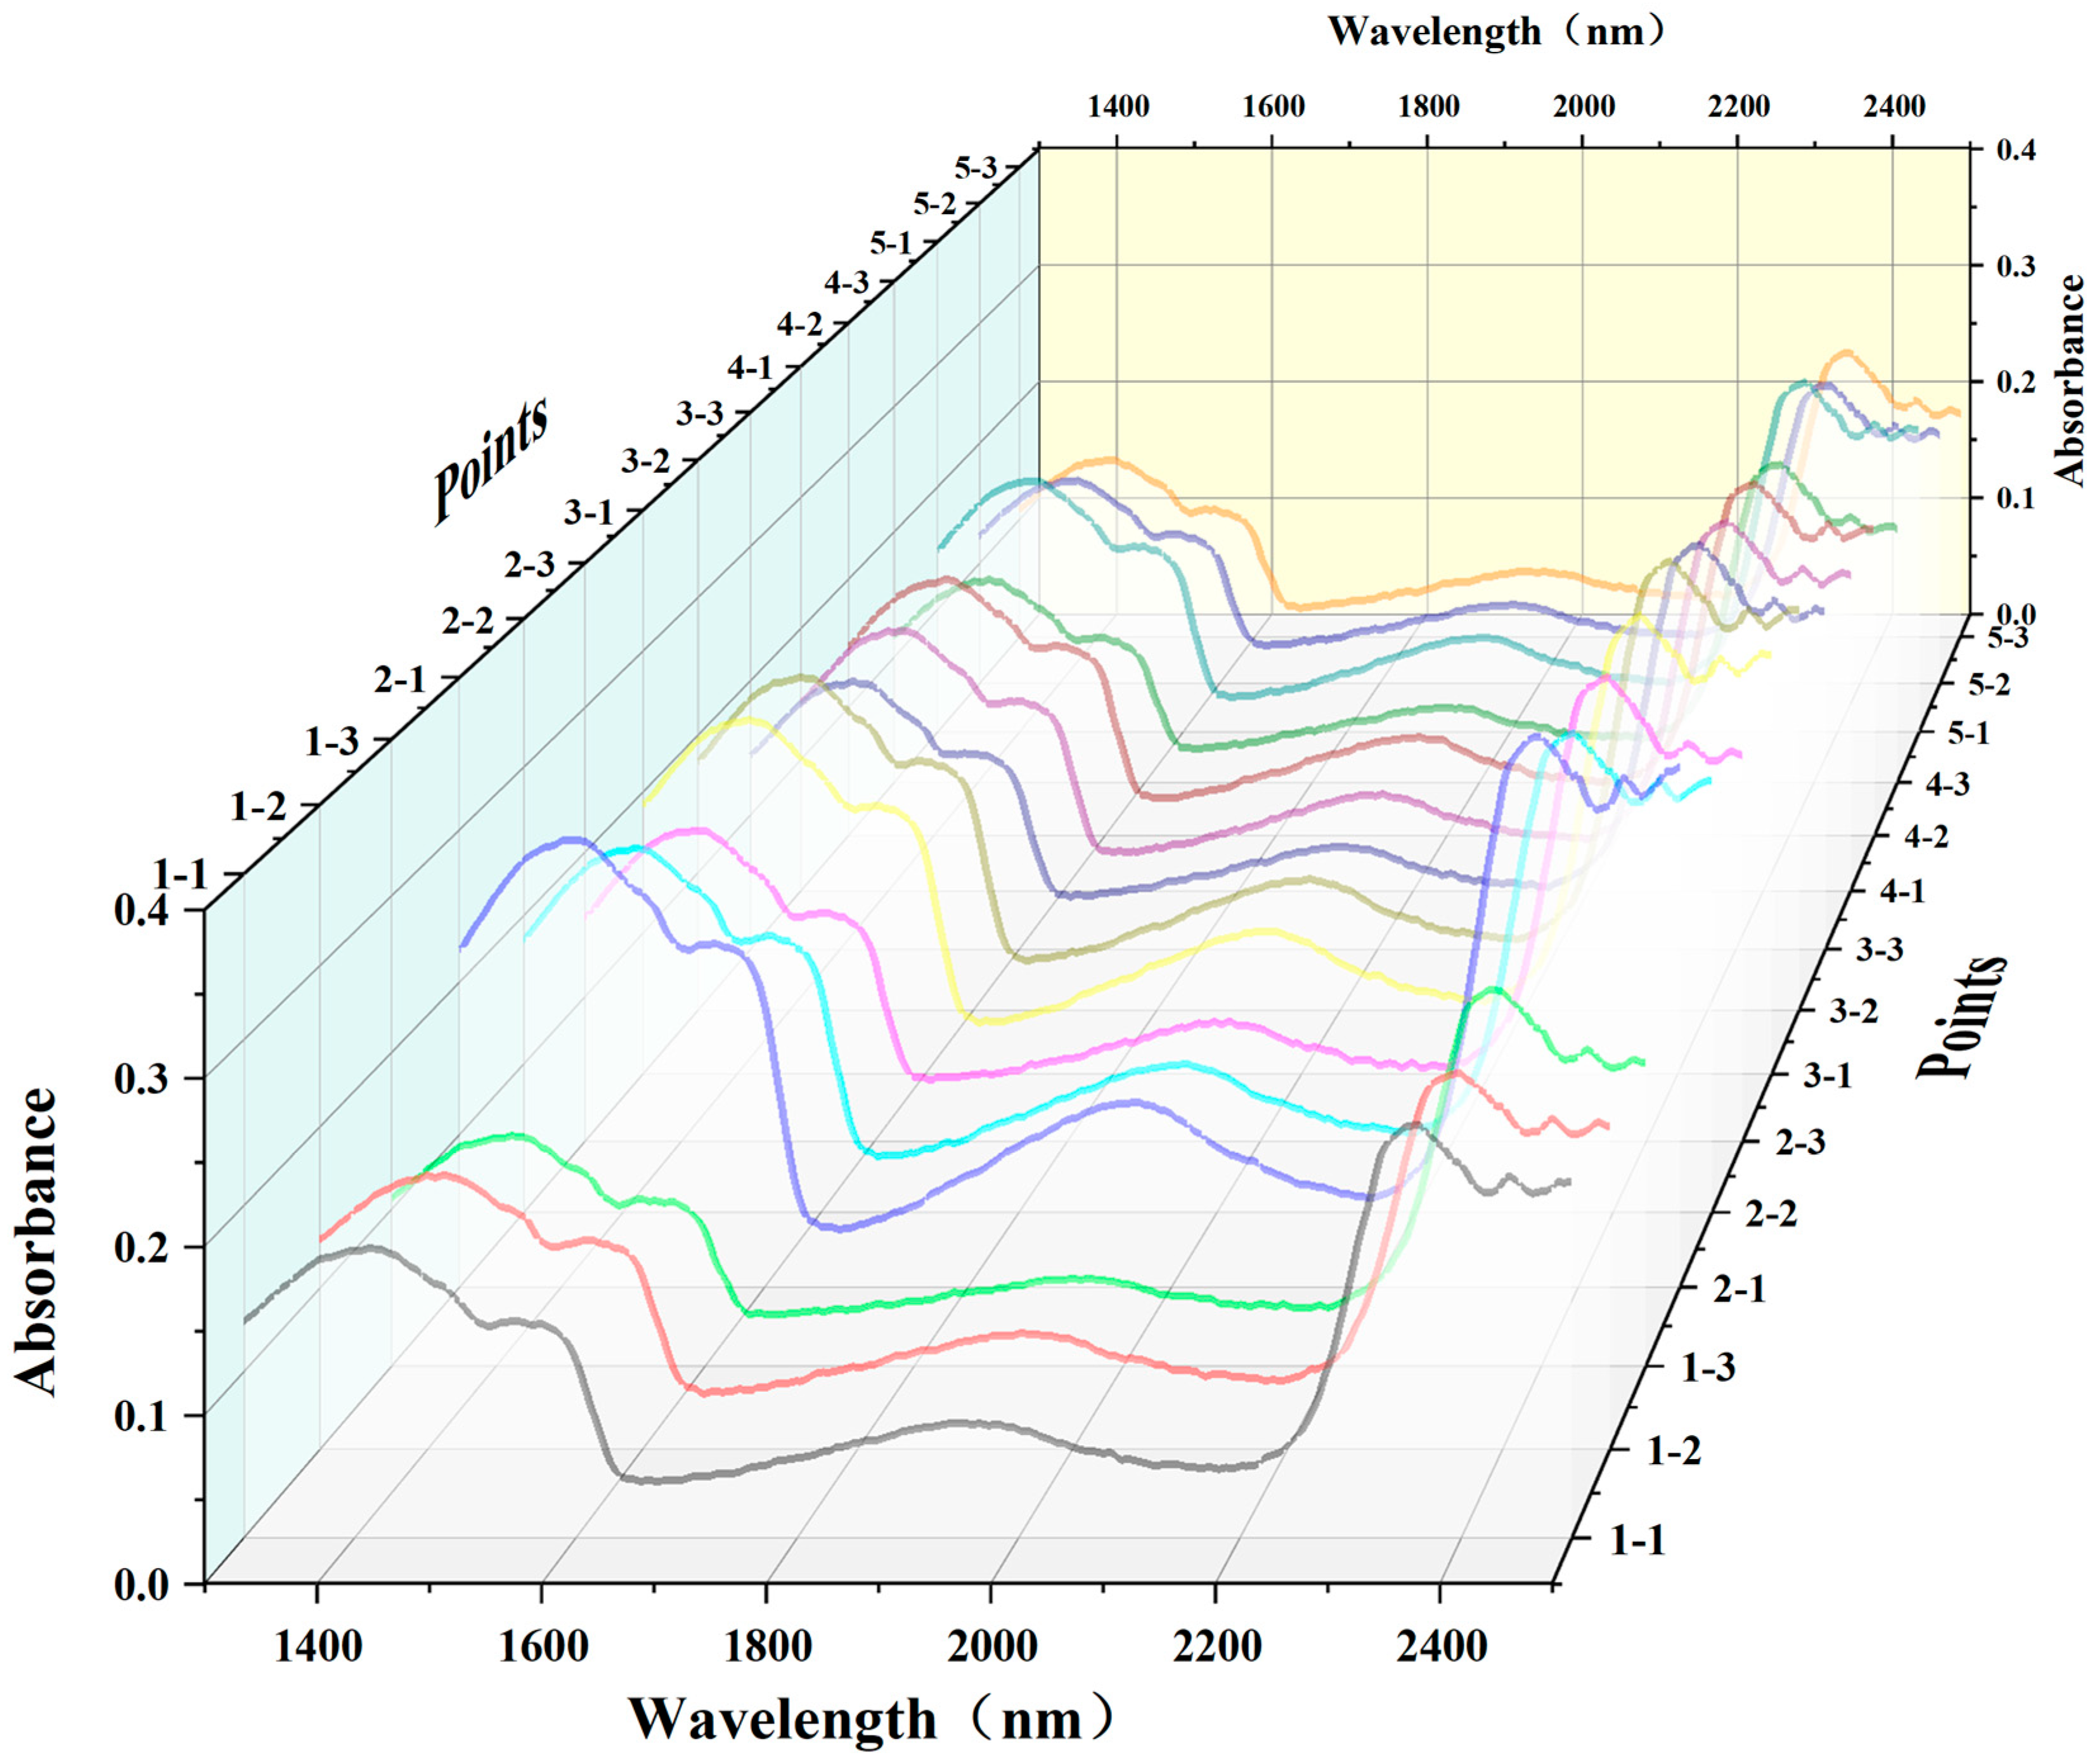
The NIR spectral curves from various locations on the mango are captured and are depicted in Figure 5. Notably, the spectral data from points 5-1, 5-2, and 5-3 exhibit relative stability, showing minimal interference from noise factors and displaying distinct characteristic peaks, rendering them more conducive for subsequent research endeavors [24]. Accordingly, the aforementioned three points are selected for analysis.
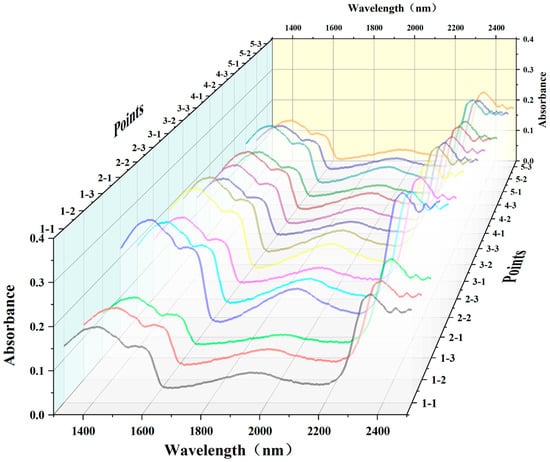
Figure 5.
A 3D plot of different points of mango.
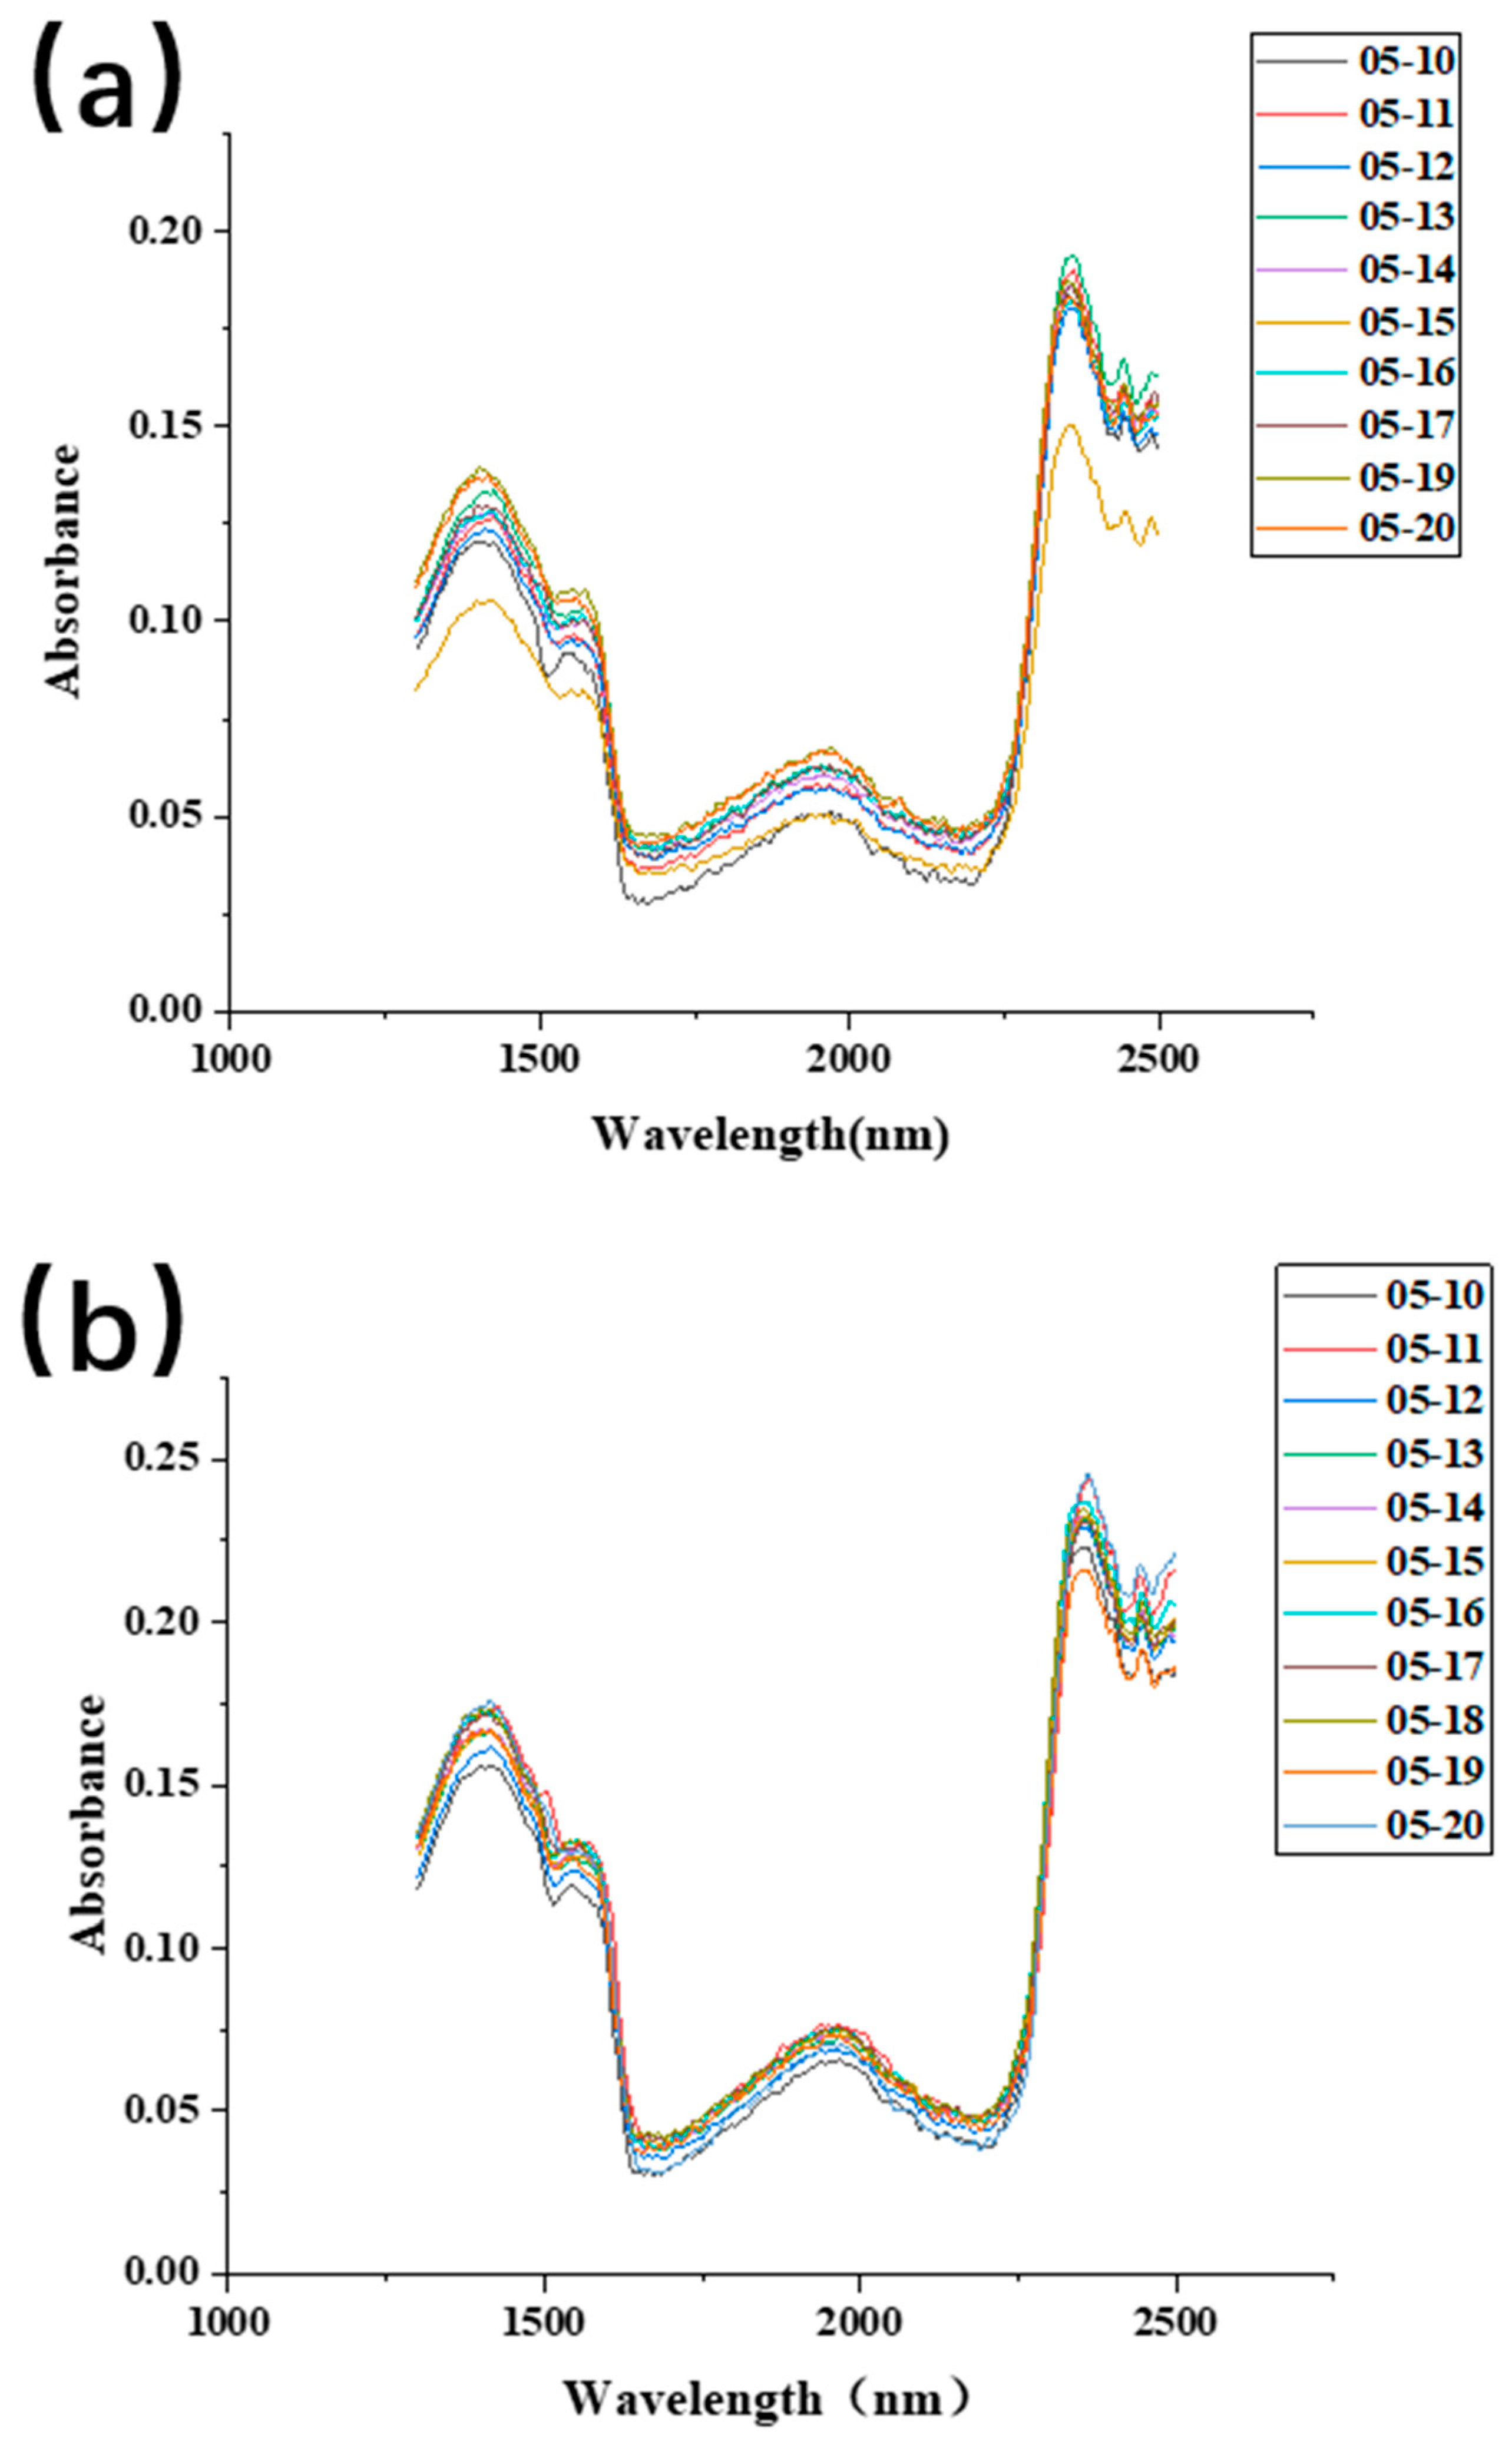
Data were collected from all 95 samples at points 5-1, 5-2, and 5-3, with spectral readings obtained over a span of 11 days, ensuring optimal mango freshness. Given the performance attenuation of the NIR spectrometer at the extremities of the wavelength range, significant noise is observed at these points in the spectral data. Consequently, only spectral information within the wavelength range of 1300–2300 nm was preserved for the experiment, as illustrated in Figure 6a.
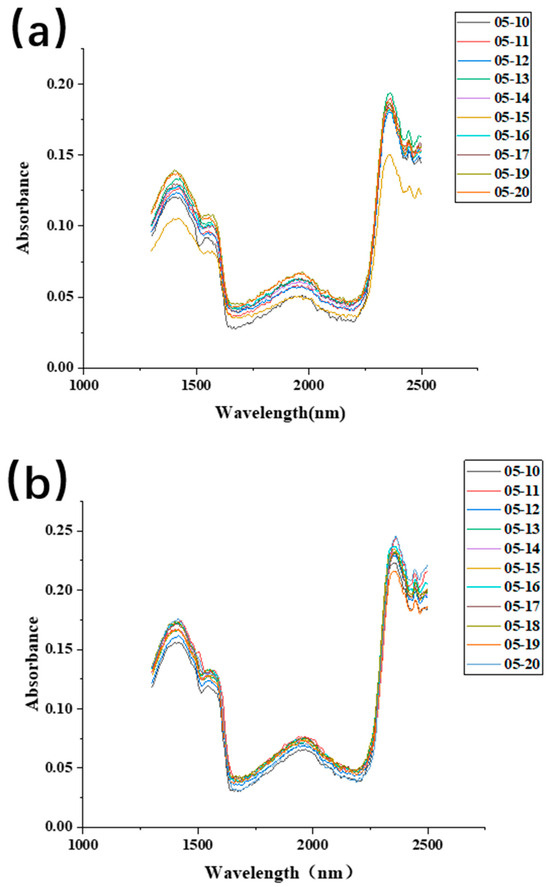
Figure 6.
(a) The 2D spectral profiles of points 5-1, 5-2, 5-3 without data preprocessing; (b) 2D spectral profiles of points 5-1, 5-2, 5-3 after data preprocessing.
The spectral data underwent additional preprocessing following noise removal. Missing values were addressed using cubic spline interpolation implemented in MATLAB R2022a software. To mitigate instrument noise effects on the spectral curve and enhance the signal-to-noise ratio, Savitzky–Golay convolution smoothing was applied in the research methodology [25]. The findings demonstrate the effective filtering of external noise, revealing characteristic peaks at 1400 nm and 1985 nm. Additionally, the original spectrum underwent Standard Normal Variate (SNV) transformation to rectify spectral errors arising from sample scattering, resulting in enhanced clarity of the two characteristic peaks while retaining the original spectral information. Ultimately, a second derivative treatment was applied to the spectral curve to eliminate baseline drift and enhance spectral resolution [26,27]. The preprocessed spectral curve, depicted in Figure 6b, was acquired, setting the stage for the model’s accuracy through meticulous data preprocessing.
As illustrated in Figure 6b, the absorption within the 1300–1500 nm range is prominent, with diminished absorption observed within the 1600–2200 nm range. This distinctive peak is attributed to the yellow hue of the mango peel and the absorption properties of pigments like carrots present in the mango. Additionally, a subtle characteristic peak is noted around 1970 nm, signifying the absorption band associated with O-H and C-H components [10]. The observed outcomes can be attributed to the light absorption by substances present in the mango [28].
- Calibration Data Acquisition
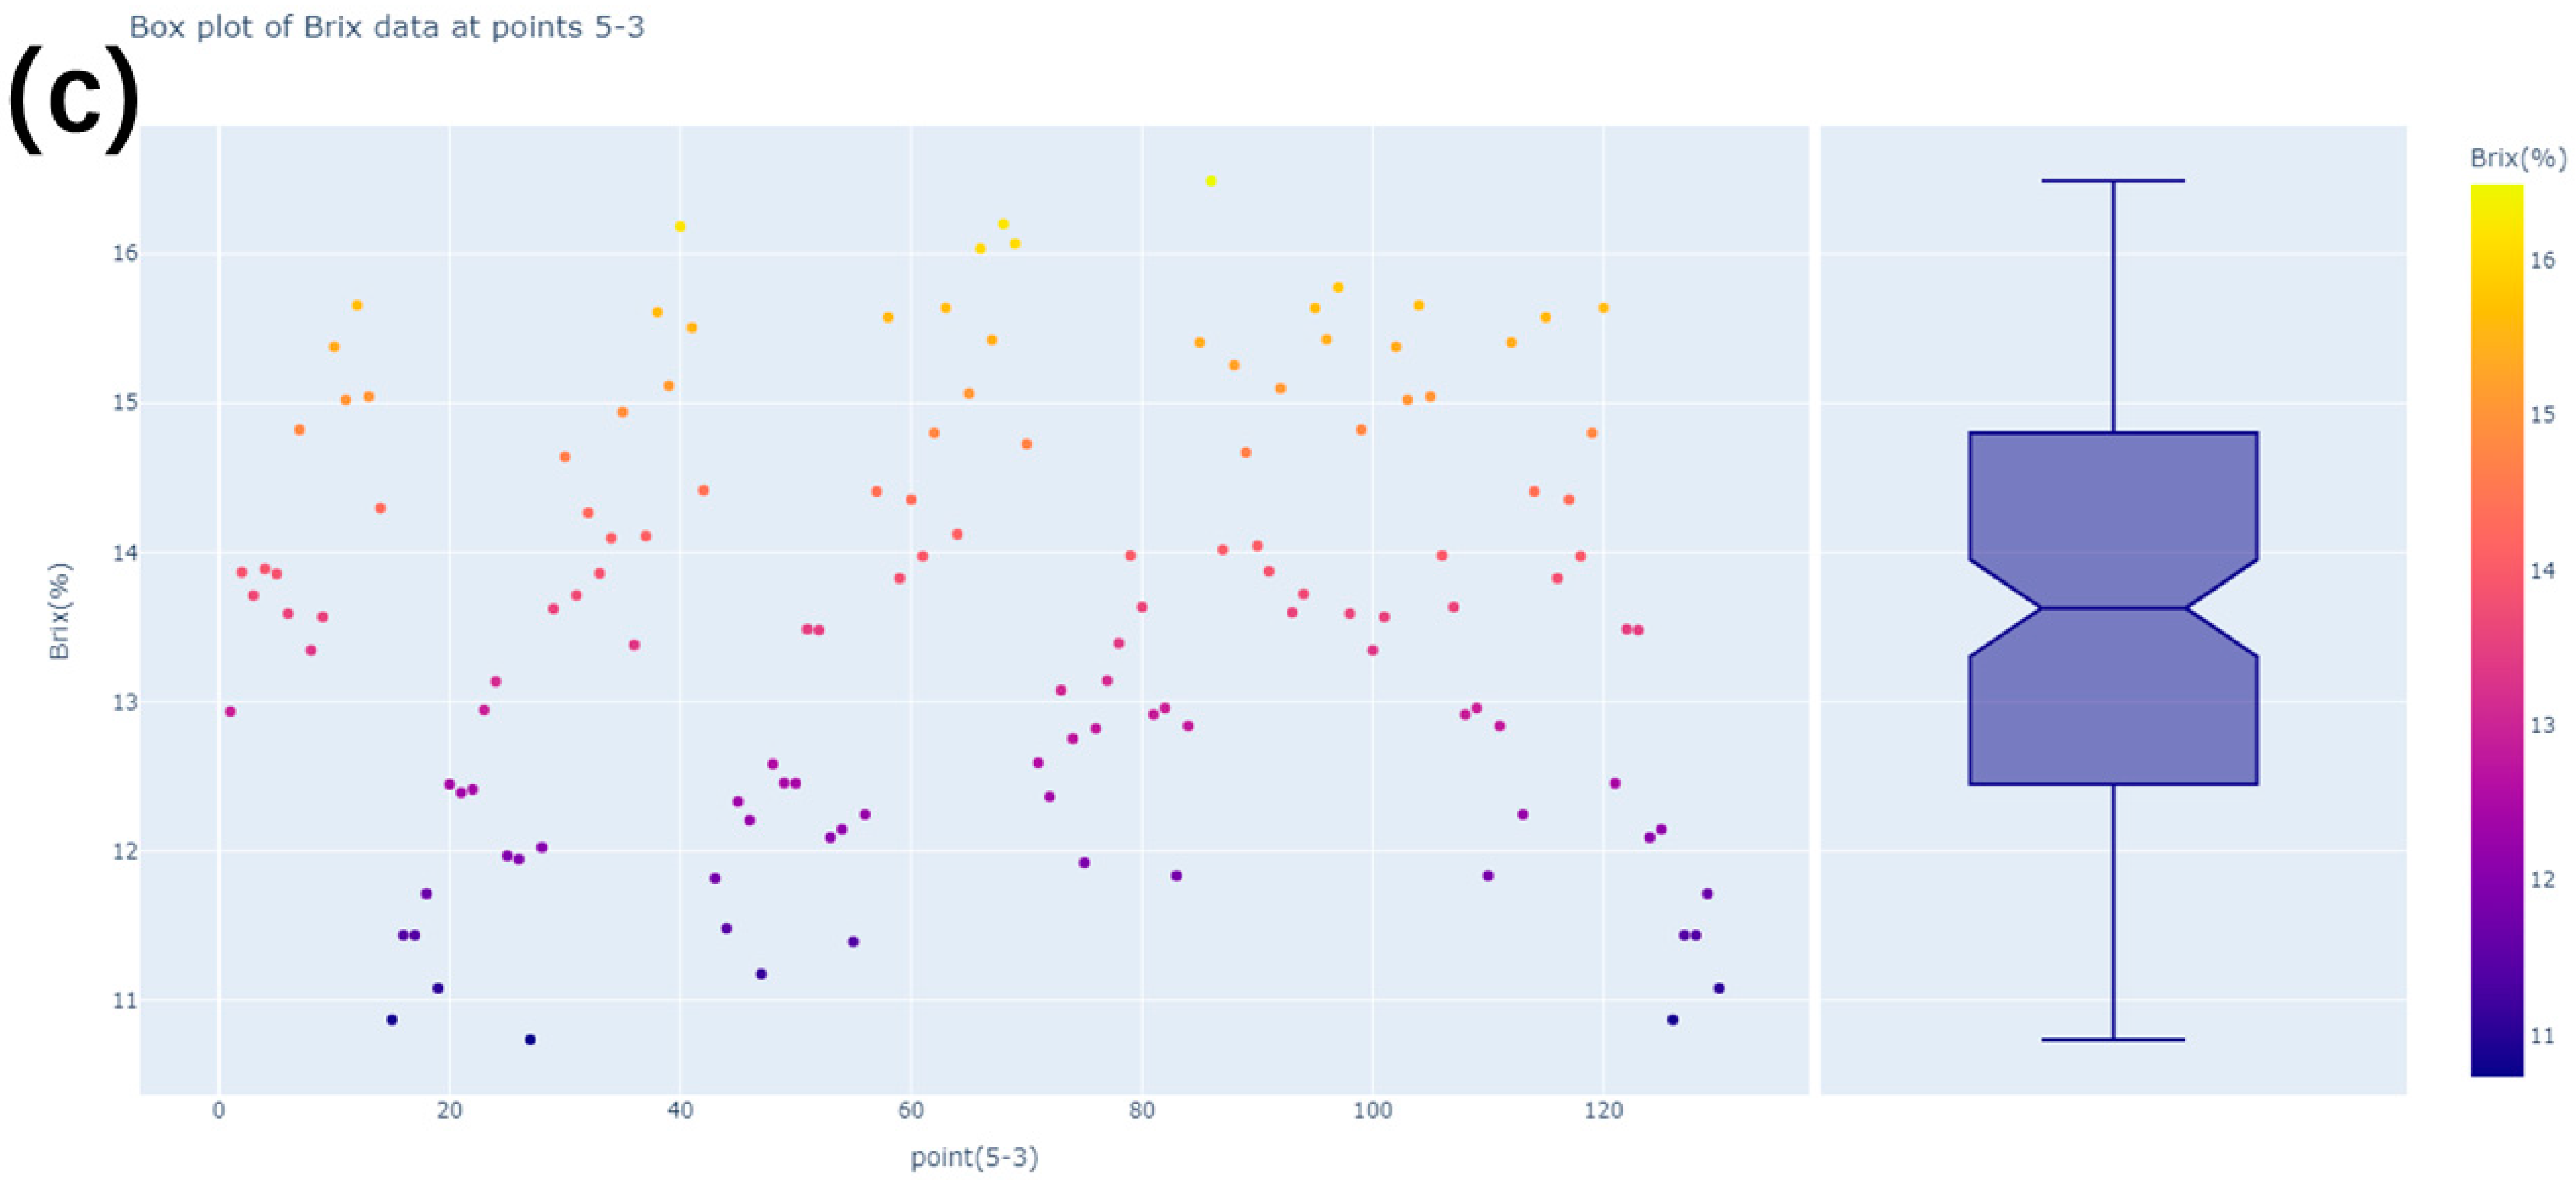
The mango sample undergoes processing involving peeling, crushing, and pressing, while the sugar content is calibrated through visible spectrophotometry employing a DHR 95 refractometer [29]. Each point undergoes three measurements, with the average value serving as the standard brix content for that specific point. Based on the aforementioned analysis, points 5-1, 5-2, and 5-3 are identified as calibration data for mango brix content. Corresponding boxplots are generated for the collected data, depicted in Figure 7a–c. Notably, point 5-1 represents the mango’s root section, point 5-2 reflects the equatorial region, and point 5-3 corresponds to the mango’s top portion. Importantly, all brix values for these points exhibit an absence of outliers, thus necessitating no additional data preprocessing.
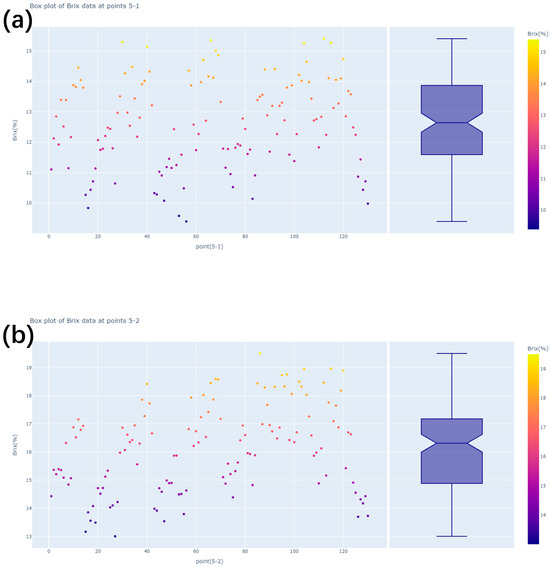
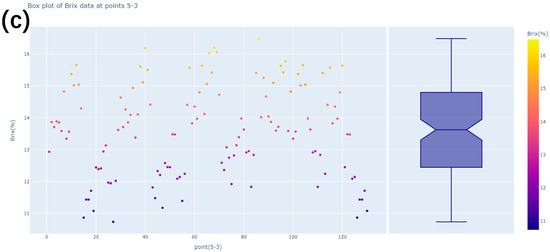
Figure 7.
(a) Point 5-1 brix data boxplot; (b) point 5-2 brix data boxplot; and (c) point 5-3 brix data boxplot.
Simultaneously, a statistical analysis was conducted on the brix content of the three points and is presented in Table 1.

Table 1.
Overall statistical table of mango brix content data.
2.3.2. Establishing the Partial Least Squares Curve
The instrument’s model encompasses the training of multiple neural network layers involving 1000 training iterations, leveraging extensive data characteristics. Considering the presence of weak spectral information in some samples revealed by PLS analysis, the optimal model configuration is achieved with a selection of 12 principal factors exhibiting enhanced clustering efficiency for sugar levels. Consequently, the initial number of hidden layer units is assigned as 20. To address nonlinearities effectively, the tanh function is adopted as the activation function for the hidden layer. During model training, a challenge arises with the root-mean-square error (RMSE) curve demonstrating slow convergence. This issue is mitigated through adjustments in the epoch number after multiple dataset iterations through the network. Following network state initialization, single-step prediction is performed utilizing the neural network to update predicted values, thereby optimizing adaptation levels and enhancing curve adjustments. Key parameters of the BP neural network include a learning rate of 0.05, training duration set at 1000 epochs, and the adoption of RMSE as the error function [30]. Upon the completion of training, both the RMSE function and the loss function are minimized.
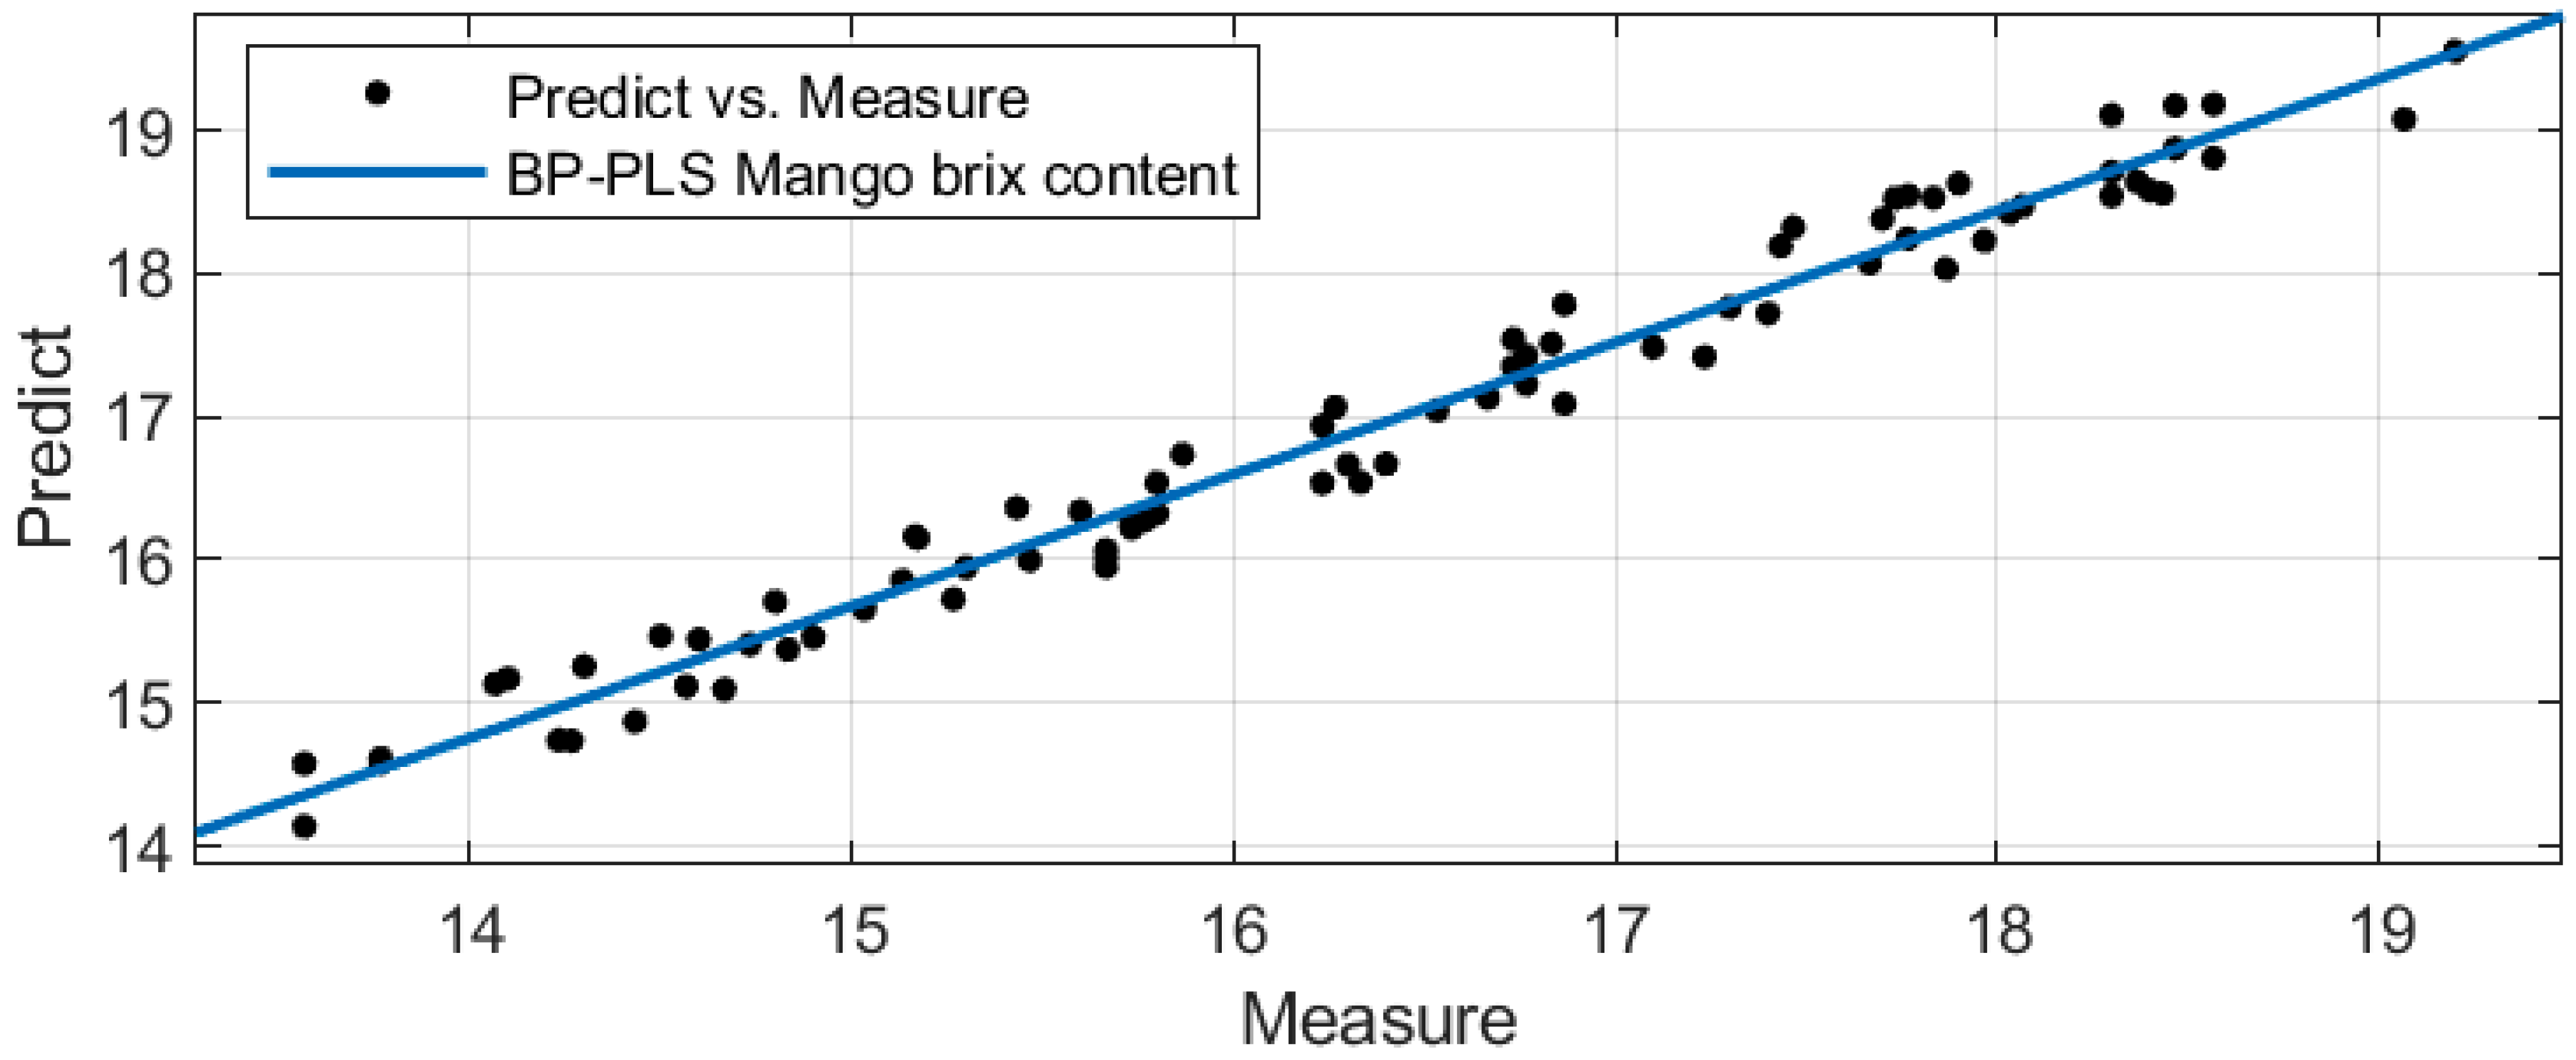
A comparison of spectral curves post data preprocessing reveals the significant impact of various parameter combinations on the adjustment of R-square and RMSEP values. Adjusted R-squared, often referred to as the model goodness-of-fit index, signifies the portion of variability in the dependent variable explained by the independent variable through regression. It essentially measures the equation’s conformity to observed values. When employing a calibration set-to-training set ratio of 1:4, as per the Kennard–Stone algorithm, the adjusted R-squared and RMSE values are computed as 0.9055 and 0.2192, respectively. While the adjusted R-squared value nears unity in this scenario, the RMSE surpassing 0.1 signals inadequate model fitting and hints at overfitting tendencies, leading to local optimization issues, as demonstrated in Figure 8 [31]. Hence, this study employs a simulated annealing algorithm to optimize the model, in line with rigorous research principles [32].
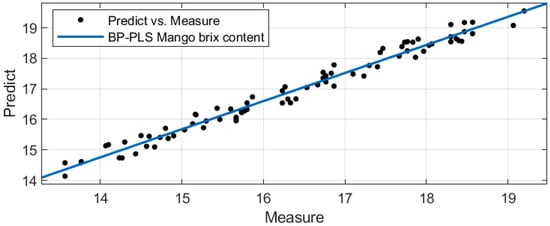
Figure 8.
BP-PLS brix fitting plot.
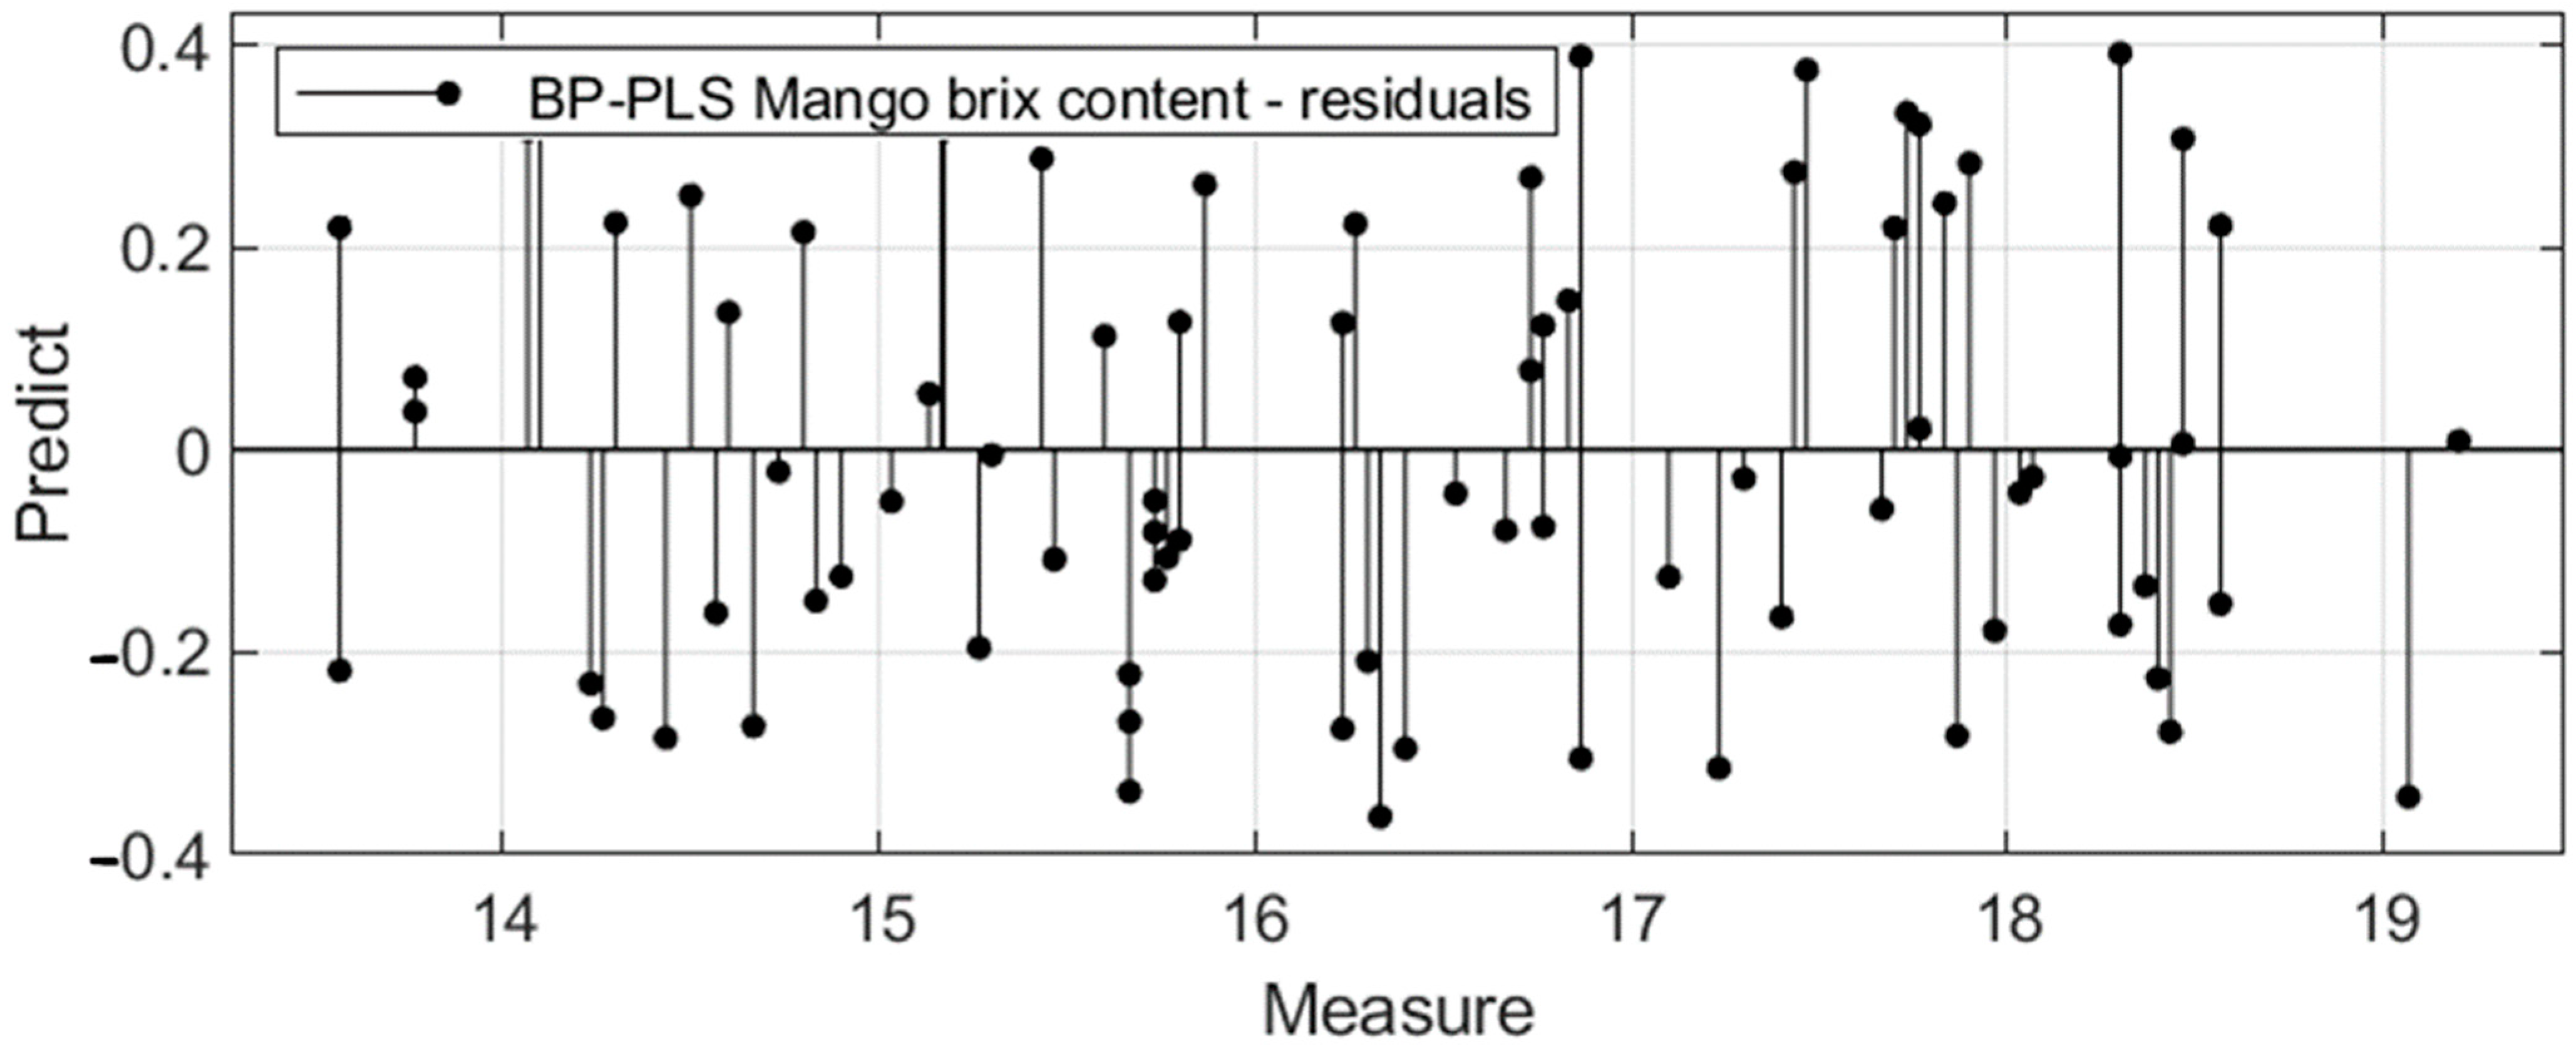
In this study, the measured brix content value is utilized as the horizontal coordinate, and the residual difference between the predicted and measured values serves as the longitudinal coordinate, enabling the construction of the residual diagram, as illustrated in Figure 9. The analysis of the residual graph reveals a lack of systematic patterns and predictability in the differences between the prediction and measurement sets within this regression model. This observation indicates that the points in the residual graph adhere to the essential criteria for the model’s validity [33].

Figure 9.
Residual plots of BP-PLS model data.
2.3.3. Optimization of the Simulated Annealing Algorithm
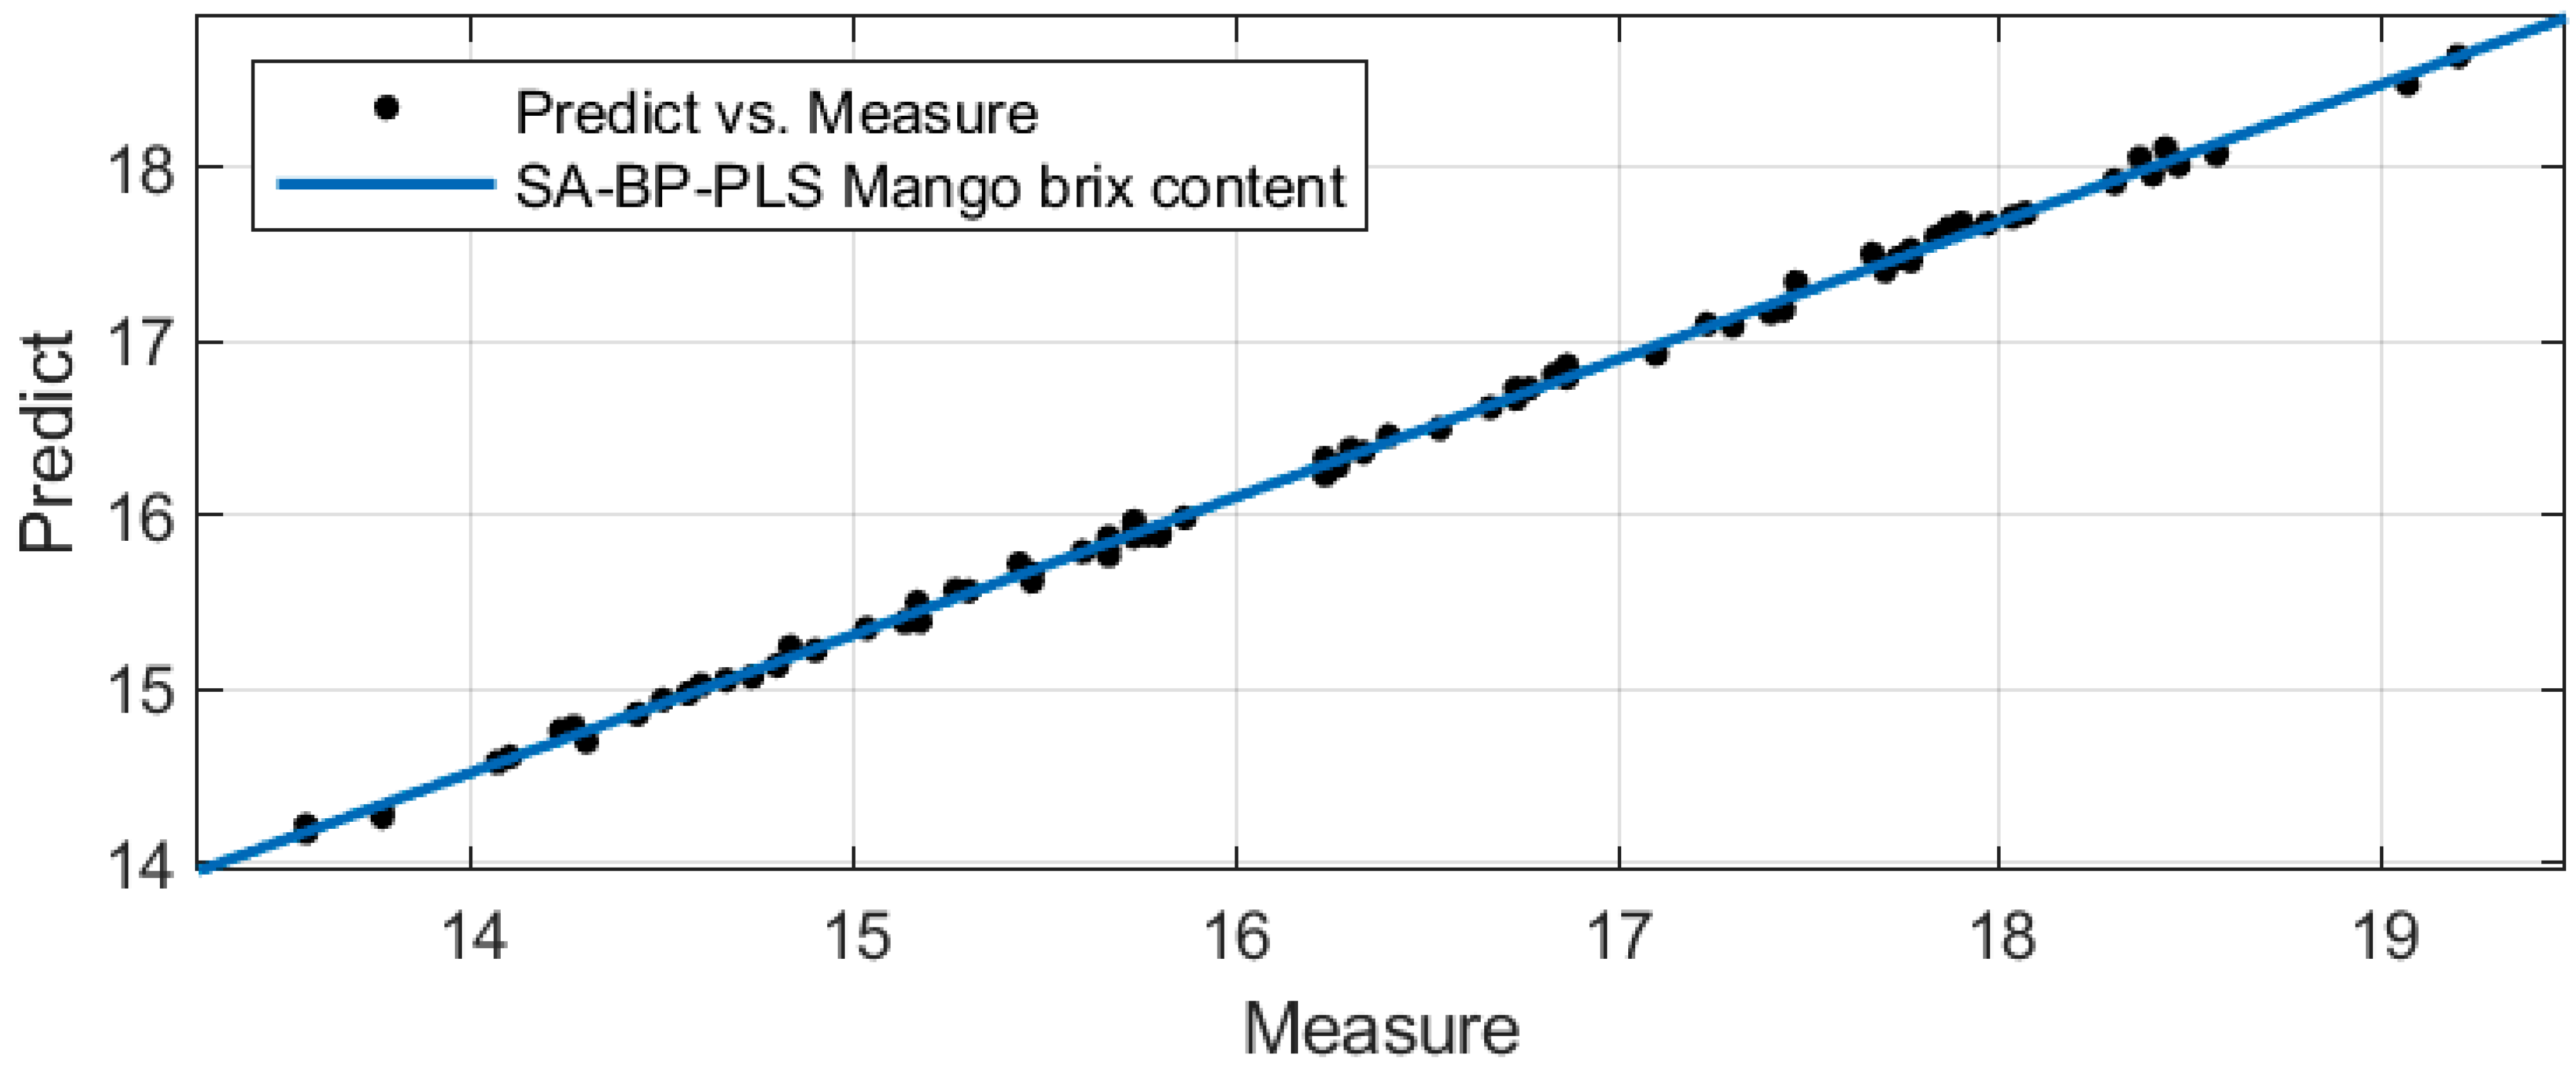
The BP neural network demonstrates notable linear fitting capabilities; nonetheless, upon careful examination of the aforementioned outcomes, it becomes apparent that the network may encounter local optimization challenges that significantly influence the model’s prediction accuracy. Employing a simulated annealing algorithm for optimization effectively addresses these local optimization issues, enabling the adjustment of the weights and thresholds within the BP neural network to obtain an optimal predictive model solution [34]. Throughout the research process, the damping function parameter of controller T is set at 0.99, with an initial temperature of 1, a minimum temperature threshold of 0.110, the maximum number of iterations denoted by K, and an acceptance based on the Metropolis criterion [35]. The optimized neural network is configured with a hidden layer unit count of 25 and utilizes a leaky ReLU activation function. The optimized fitting graph is presented in Figure 10. A comparison between Figure 8 and Figure 10 illustrates that the regression curve model, refined through the simulation algorithm, exhibits enhanced accuracy and successfully addresses local optimization challenges. The refined model achieves an adjusted R-squared value of 0.9854, with a decreased predicted root-mean-square error (RMSE) of 0.0431, showcasing improved performance of the training network.
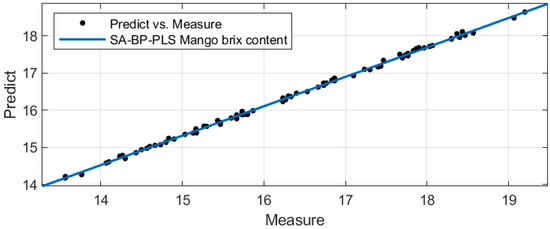
Figure 10.
SA-BP-PLS brix fitting plot.
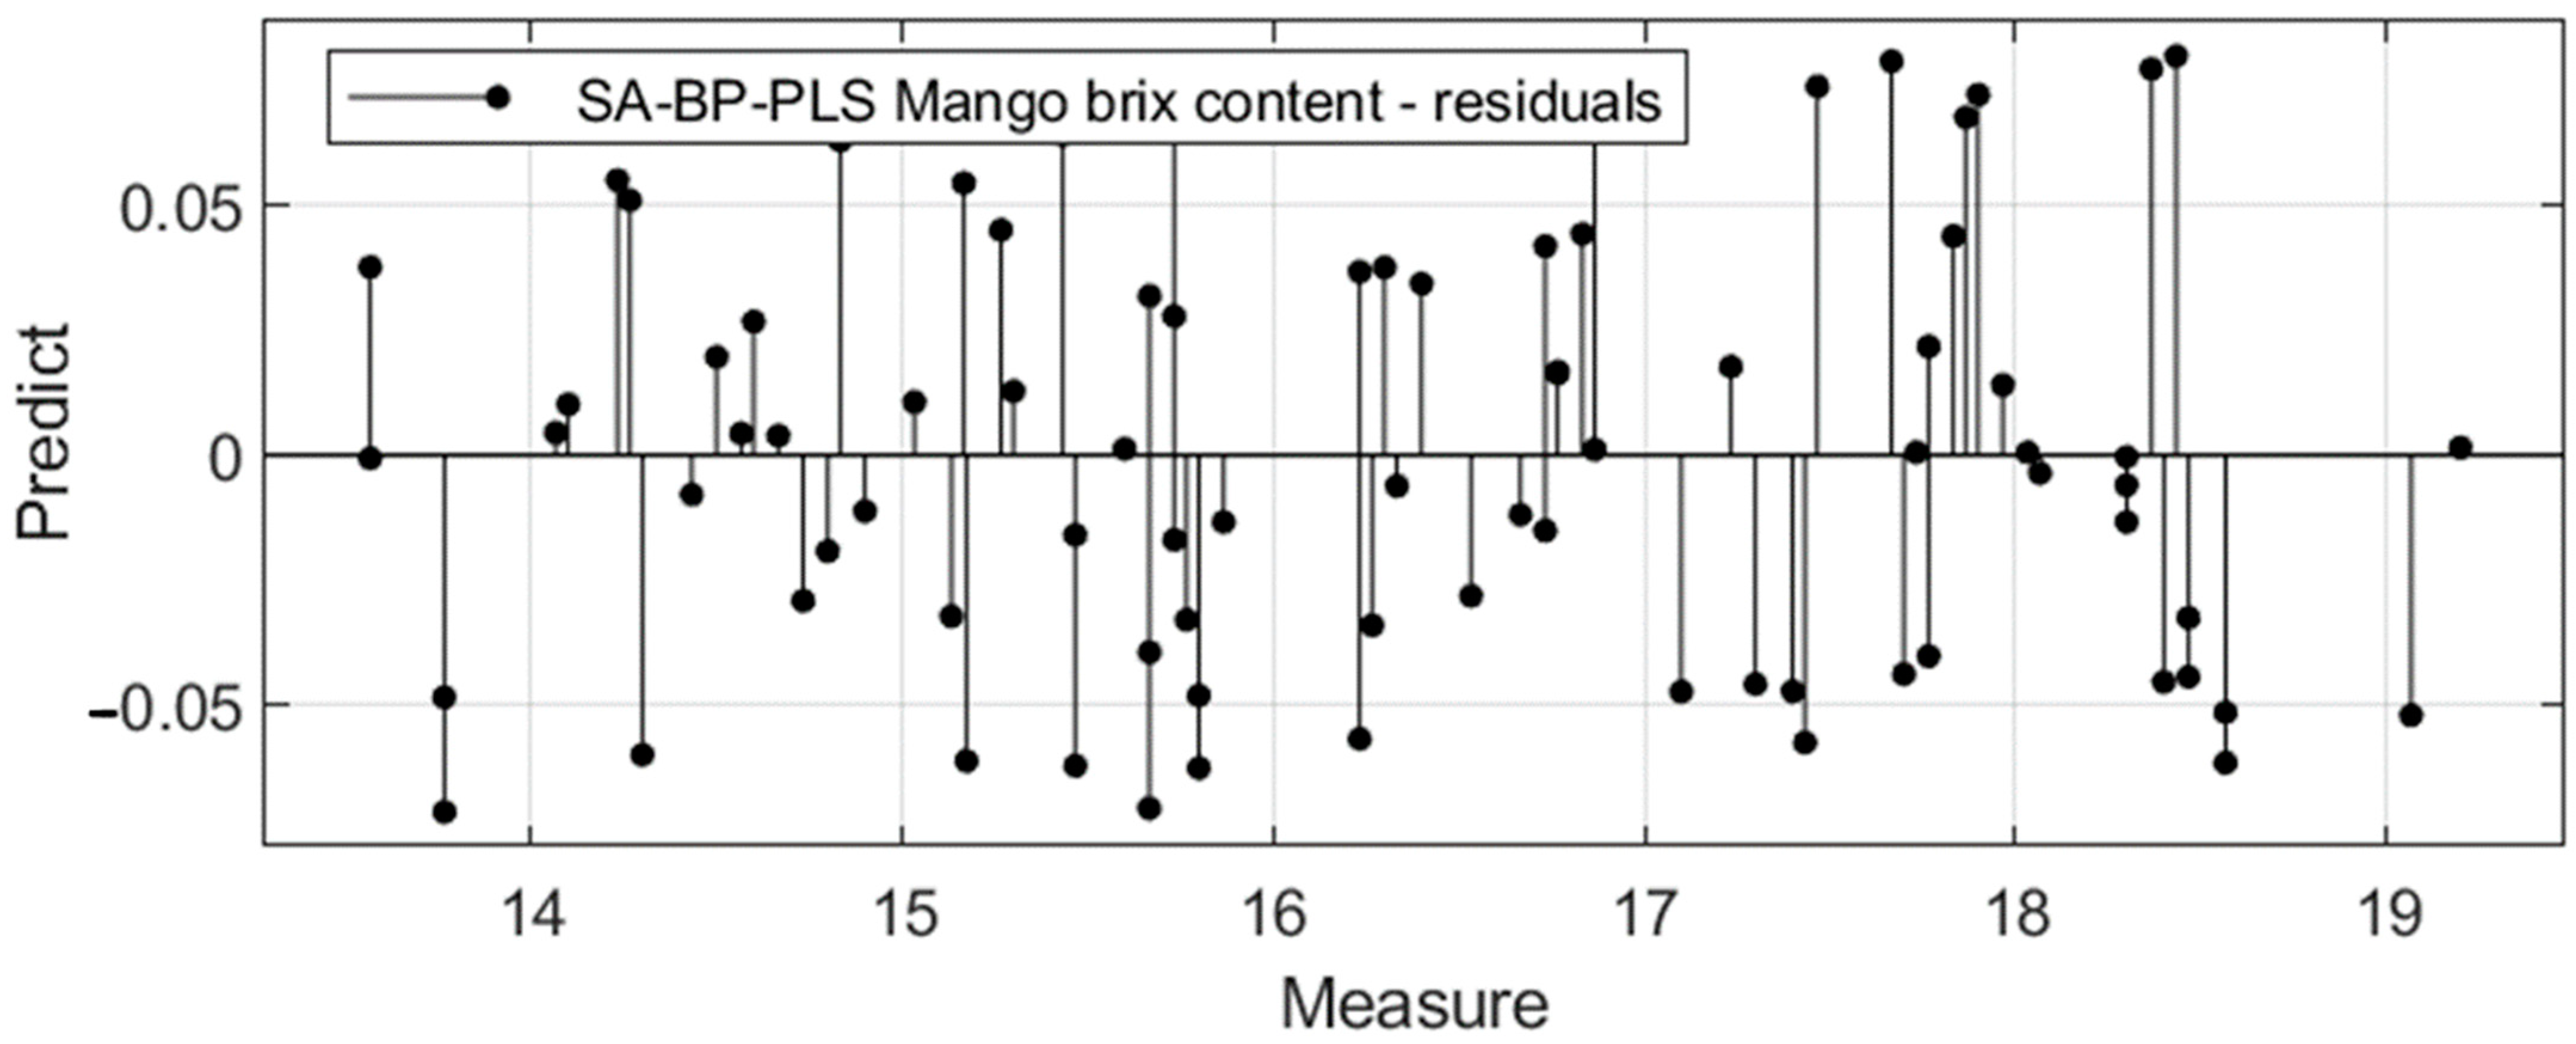
The residuals of the measurement set data and the optimized prediction set data are extracted and plotted, with the measurement set data representing the horizontal coordinate and the residuals of the two datasets representing the longitudinal coordinate, as illustrated in Figure 11. An analysis of the residual graph reveals ongoing randomness and unpredictability between the two dataset residuals, aligning with the model’s correct specifications. A comparison of the predicted and measured values of both models is detailed in Table 2. Ultimately, the evaluation demonstrates the superior predictive performance of the SA-BP_PLS model over the BP-PLS model for mango prediction.

Figure 11.
Residual plots of SA-BP-PLS model data.
Table 2.
Comparison of results of the two models.
3. Conclusions
This study integrates insights from previous research to develop a predictive model for non-destructive testing of mangoes using near-infrared spectroscopy (NIRS), establishing the correlation between brix levels and spectral data acquired through NIR diffuse reflectance. Under controlled conditions, suitably sized mangoes were selected for experimental data collection. Within the 1300 nm to 2300 nm wavelength range, the BP-PLS mango brix level prediction model exhibits a R-squared prediction set of 0.9055, with a root-mean-square error (RMSE) of 0.2192. The elevated RMSE value suggests potential overfitting issues necessitating further optimization to enhance prediction accuracy. Addressing this concern, this study employs the simulated annealing algorithm for model refinement. The resultant SA-BP-PLS mango brix level prediction model showcases a correlation coefficient of 0.9854 and an improved root-mean-square error of 0.0431, surpassing the performance of the BP-PLS model. This research underscores the efficacy of spectral acquisition technology in conjunction with stoichiometric measurement methods, appropriate spectral systems, and refined spectral pretreatment techniques for mango brix content determination, offering valuable insights for the development of online non-destructive testing instruments.
Author Contributions
Conceptualization, Z.Z. and T.W.; Methodology Z.Z. and H.F.; Formal Analysis, Z.Z. and H.F.; Investigation, T.W. and H.F.; Resources, H.F. and Z.Z.; Data Organization, H.F. and T.W.; Writing—Original Draft Preparation, Z.Z. and T.W.; Writing—Review and Editing, Z.Z., T.W. and H.F.; Visualization, H.F.; Supervision, H.F., Z.Z. and T.W.; Project Management, H.F. and Z.Z.; Funding Acquisition, H.F. All authors have read and agreed to the published version of the manuscript.
Funding
This work was supported by the National Students’ Innovation and Entrepreneurship Training Program (Project Number: 202311415082).
Institutional Review Board Statement
Not applicable.
Data Availability Statement
Data used in the manuscript and analytic code will be made available upon request.
Conflicts of Interest
The authors declare no conflicts of interest.
Correction Statement
This article has been republished with a minor correction to the Funding statement. This change does not affect the scientific content of the article.
References
- Halford, N.G.; Curtis, T.Y.; Muttucumaru, N.; Postles, J.; Mottram, D.S. Sugars in crop plants. Ann. Appl. Biol. 2011, 158, 1–25. [Google Scholar] [CrossRef]
- Luo, L.; Sun, S.; Xue, J.; Gao, Z.; Zhao, J.; Yin, Y.; Gao, F.; Luan, X. Crop yield estimation based on assimilation of crop models and remote sensing data: A systematic evaluation. Agric. Syst. 2023, 210, 103711. [Google Scholar] [CrossRef]
- Pasquini, C. Near infrared spectroscopy: A mature analytical technique with new perspectives—A review. Anal. Chim. Acta 2018, 1026, 8–36. [Google Scholar] [CrossRef] [PubMed]
- Lin, H.; Ying, Y. Theory and application of near infrared spectroscopy in assessment of fruit quality: A review. Sens. Instrum. Food Qual. Saf. 2009, 3, 130–141. [Google Scholar] [CrossRef]
- Jakubíková, M.; Sádecká, J.; Kleinová, A.; Májek, P. Near-infrared spectroscopy for rapid classification of fruit spirits. J. Food Sci. Technol. 2016, 53, 2797–2803. [Google Scholar] [CrossRef] [PubMed]
- Nicolaï, B.M.; Beullens, K.; Bobelyn, E.; Peirs, A.; Saeys, W.; Theron, K.I.; Lammertyn, J. Nondestructive measurement of fruit and vegetable quality by means of NIR spectroscopy: A review. Postharvest Biol. Technol. 2007, 46, 99–118. [Google Scholar] [CrossRef]
- Travers, S.; Bertelsen, M.G.; Petersen, K.K.; Kucheryavskiy, S.V. Predicting pear (cv. Clara Frijs) dry matter and soluble solids content with near infrared spectroscopy. LWT-Food Sci. Technol. 2014, 59, 1107–1113. [Google Scholar] [CrossRef]
- Khodabakhshian, R.; Emadi, B.; Khojastehpour, M.; Golzarian, M.R.; Sazgarnia, A. Development of a multispectral imaging system for online quality assessment of pomegranate fruit. Int. J. Food Prop. 2017, 20, 107–118. [Google Scholar] [CrossRef]
- Chen, X.; Zhou, G.; Chen, A.; Pu, L.; Chen, W. The fruit classification algorithm based on the multi-optimization convolutional neural network. Multimed. Tools Appl. 2021, 80, 11313–11330. [Google Scholar] [CrossRef]
- Zhang, Y.; Chen, Y.; Wu, Y.; Cui, C. Accurate and nondestructive detection of apple brix and acidity based on visible and near-infrared spectroscopy. Appl. Opt. 2021, 60, 4021–4028. [Google Scholar] [CrossRef]
- Hu, W.; Sun, D.-W.; Pu, H.; Pan, T. Recent Developments in Methods and Techniques for Rapid Monitoring of Sugar Metabolism in Fruits. Compr. Rev. Food Sci. Food Saf. 2016, 15, 1067–1079. [Google Scholar] [CrossRef]
- Zhang, T.; Huang, H.; Zhang, Z.; Gao, H.; Gao, L.; Zheng, Z. Sensitive characterizations of polyvinyl chloride using terahertz time-domain spectroscopy. Infrared Phys. Technol. 2021, 118, 103878. [Google Scholar] [CrossRef]
- Yang, M.; Zhang, S.; Huang, H.; Ma, Y.; Hao, S.; Zhang, Z.; Zheng, Z. Insights into a Mineral Resource Chlorite Mica Carbonate Schist by Terahertz Spectroscopy Technology. Energies 2022, 15, 6314. [Google Scholar] [CrossRef]
- Huang, H.; Yuan, E.; Zhang, D.; Sun, D.; Yang, M.; Zheng, Z.; Zhang, Z.; Gao, L.; Panezai, S.; Qiu, K. Free Field of View Infrared Digital Holography for Mineral Crystallization. Cryst. Growth Des. 2023, 23, 7992–8008. [Google Scholar] [CrossRef]
- Seehanam, P.; Chaiya, P.; Theanjumpol, P.; Tiyayon, C.; Ruangwong, O.; Pankasemsuk, T.; Nakano, K.; Ohashi, S.; Maniwara, P. Internal disorder evaluation of ‘Namdokmai Sithong’ mango by near infrared spectroscopy. Hortic. Environ. Biotechnol. 2022, 63, 665–675. [Google Scholar] [CrossRef]
- Chang, J.; Pan, Q.; Shen, Z.; Qin, H. Intelligent Prediction of Refrigerant Amounts Based on Internet of Things. Complexity 2020, 2020, 1743973. [Google Scholar] [CrossRef]
- Huang, L.; Xie, G.; Zhao, W.; Gu, Y.; Huang, Y. Regional logistics demand forecasting: A BP neural network approach. Complex Intell. Syst. 2023, 9, 2297–2312. [Google Scholar] [CrossRef]
- Machlev, R.; Tolkachov, D.; Levron, Y.; Beck, Y. Dimension reduction for NILM classification based on principle component analysis. Electr. Power Syst. Res. 2020, 187, 106459. [Google Scholar] [CrossRef]
- Munawar, A.A.; Zulfahrizal; Meilina, H.; Pawelzik, E. Near infrared spectroscopy as a fast and non-destructive technique for total acidity prediction of intact mango: Comparison among regression approaches. Comput. Electron. Agric. 2022, 193, 106657. [Google Scholar] [CrossRef]
- Dong, K.; Zhang, D.; Liu, X.; Guo, D. Analysis of Performance Evaluation Model for Higher Education Informatization by Means of PLS-BP Model. Discret. Dyn. Nat. Soc. 2022, 2022, 9239812. [Google Scholar] [CrossRef]
- Kuo, C.L.; Kuruoglu, E.E.; Chan, W.K.V. Neural Network Structure Optimization by Simulated Annealing. Entropy 2022, 24, 348. [Google Scholar] [CrossRef] [PubMed]
- Li, Y.; Hu, J.; Wei, H.; Jeong, B.R. A Long-Day Photoperiod and 6-Benzyladenine Promote Runner Formation through Upregulation of Soluble Sugar Content in Strawberry. Int. J. Mol. Sci. 2020, 21, 4917. [Google Scholar] [CrossRef] [PubMed]
- Lo’ay, A.A.; Mostafa, N.A.; Al-Qahtani, S.M.; Al-Harbi, N.A.; Hassan, S.; Abdein, M.A. Influence of the Position of Mango Fruit on the Tree (Mangifera indica L. CV. ‘Zibda’) on Chilling Sensitivity and Antioxidant Enzyme Activity. Horticulturae 2021, 7, 515. [Google Scholar] [CrossRef]
- Li, S.-S.; Qiu, K.-F.; Hernández-Uribe, D.; Gao, Y.-X.; Santosh, M.; Huang, H.-C.; Zheng, Z.-Y.; Zhang, Z.-L.; Gao, S.-C. Water Recycling in the Deep Earth: Insights From Integrated μ-XRF, THz-TDS Spectroscopy, TG, and DCS of High-Pressure Granulite. J. Geophys. Res. Solid Earth 2023, 128, e2022JB025915. [Google Scholar] [CrossRef]
- Du, Y.H.; Li, X.; Ren, W.; Zuo, H. Application of near-infrared spectroscopy and CNN-TCN for the identification of foreign fibers in cotton layers. J. Nat. Fibers 2023, 20, 2172638. [Google Scholar] [CrossRef]
- Grisanti, E.; Totska, M.; Huber, S.; Krick Calderon, C.; Hohmann, M.; Lingenfelser, D.; Otto, M. Dynamic Localized SNV, Peak SNV, and Partial Peak SNV: Novel Standardization Methods for Preprocessing of Spectroscopic Data Used in Predictive Modeling. J. Spectrosc. 2018, 2018, 5037572. [Google Scholar] [CrossRef]
- Khodabakhshian, R.; Bayati, M.R.; Emadi, B. Adulteration detection of Sudan Red and metanil yellow in turmeric powder by NIR spectroscopy and chemometrics: The role of preprocessing methods in analysis. Vib. Spectrosc. 2022, 120, 103372. [Google Scholar] [CrossRef]
- Theanjumpol, P.; Self, G.; Rittiron, R.; Pankasemsuk, T.; Sardsud, V. Selecting Variables for Near Infrared Spectroscopy (NIRS) Evaluation of Mango Fruit Quality. J. Agric. Sci. 2013, 5, 146. [Google Scholar] [CrossRef]
- Cheng, H.; Huang, H.-C.; Yang, M.-F.; Yang, M.-H.; Yan, H.; Panezai, S.; Zheng, Z.-Y.; Zhang, Z.; Zhang, Z.-L. Characterization of the remediation of chromium ion contamination with bentonite by terahertz time-domain spectroscopy. Sci. Rep. 2022, 12, 11149. [Google Scholar] [CrossRef]
- Qin, T.; Jia, T.; Feng, Q.; Li, X. Sea surface wind speed retrieval from Sentinel-1 HH polarization data using conventional and neural network methods. Acta Oceanol. Sin. 2021, 40, 13–21. [Google Scholar] [CrossRef]
- Gao, T.; Hu, L.; Jia, Z.; Xia, T.; Fang, C.; Li, H.; Hu, L.; Lu, Y.; Li, H. SPXYE: An improved method for partitioning training and validation sets. Clust. Comput. 2019, 22, 3069–3078. [Google Scholar] [CrossRef]
- Ren, L.; Wu, X.; Zhao, K. Obesity Mass Monitoring in Medical Big Data Based on High-Order Simulated Annealing Neural Network Algorithm. Comput. Intell. Neurosci. 2021, 2021, 8336887. [Google Scholar] [CrossRef]
- Larsen, W.A.; McCleary, S.J. The Use of Partial Residual Plots in Regression Analysis. Technometrics 1972, 14, 781–790. [Google Scholar] [CrossRef]
- Song, S.; Hou, J.; Sun, S.; Li, Y.; Wang, X.; Dou, L.; Liu, Y.; Kang, Q.; Huang, S. Local optimization of DFN by integrating tracer data based on improved simulated annealing. J. Pet. Sci. Eng. 2018, 170, 858–872. [Google Scholar] [CrossRef]
- Xu, J.; Hu, W.; Gu, W.; Yu, Y. A Discrete JAYA Algorithm Based on Reinforcement Learning and Simulated Annealing for the Traveling Salesman Problem. Mathematics 2023, 11, 3221. [Google Scholar] [CrossRef]

Disclaimer/Publisher’s Note: The statements, opinions and data contained in all publications are solely those of the individual author(s) and contributor(s) and not of MDPI and/or the editor(s). MDPI and/or the editor(s) disclaim responsibility for any injury to people or property resulting from any ideas, methods, instructions or products referred to in the content. |
© 2024 by the authors. Licensee MDPI, Basel, Switzerland. This article is an open access article distributed under the terms and conditions of the Creative Commons Attribution (CC BY) license (https://creativecommons.org/licenses/by/4.0/).