Abstract
Currently, more attention has been given to the study of the microstructure of contaminated clay, while few studies have focused on the analysis of SEM images of clay from a threshold perspective. The purpose of this paper was to determine the threshold range of image pixel values for municipal waste-contaminated clay by observing and processing SEM images of municipal waste-contaminated clay under different seepage depths and concentrations. In this study, municipal waste-contaminated clay samples were obtained at different depths in a column test exhibiting different CaCO3 and CH3COOH concentrations, imaged through SEM and subjected to binarization. Three steps for determining the pixel threshold value of the SEM images were described, including preprocessing and binarizing the SEM images in Image Pro Plus 6.0 (IPP) and morphological processing by the Pores (Particles) and Cracks Analysis System V2.3 (PCAS). The apparent void ratio of contaminated clay and the fractal dimension of clay particles were applied as evaluation parameters. The determined effective threshold range of the image pixel values of municipal waste-contaminated clay was 110–140. The accuracy of this method was verified in three aspects: the relationship between the threshold value and the apparent void ratio, the variation in pore blockage with seepage depth, and the characteristics of the compaction factor with seepage depth and pollutant concentration.
1. Introduction
The distribution, morphology, and particle size of dust, soils, and sediments can be identified using a Scanning Electron Microscope (SEM), so it is widely used in environmental studies [1,2]. The microstructure of soil includes the particle morphology, particle arrangement, porosity, and contact relationship of particles [3,4]. These variables not only determine the structural components and mutual connection strength of soil but also directly affect the soil engineering geological properties [5,6,7]. The structural deformation and strength change of soil under environmental change or external loading are the exterior manifestations of internal microstructural change [8,9,10,11]. In addition, increasing attention has been given to the characteristics and structure of clay contaminated by municipal waste [12,13,14]. The microstructure and pixel threshold value of municipal waste-contaminated clay notably affect the assessment of its engineering characteristics. In many previous studies, the fractal dimension and apparent void ratio are commonly used parameters for analyzing the microstructure of soil [15,16,17,18,19]. The fractal dimension can be used to quantitatively describe the complexity of the particle shape profile, and the change in the apparent void ratio directly reflects the soil deformation [20,21].
The structural properties of pores and particles in rock and soil can be quantitatively investigated with computer image processing software for segmenting and quantifying SEM images. As technology has developed, it has become commonplace to analyze the microstructure of rock and soil using computer image techniques [22,23,24]. To more correctly assess the microscopic properties of clay, many researchers have devised and developed image processing systems and codes, thereby achieving various research results. For example, Tang et al. [25] developed a soil microstructure analysis system to quantify and analyze the microstructure characteristics of sand and clay, which involved three steps: pretreatment, identification and quantification of soil particles and pores, data output and storage; Di Remigio et al. [26] developed a code based on image analysis (MiCA), which could be used to quantitatively represent the direction and porosity of clay particles through SEM images; and Liu et al. [27] developed image processing software Pores (Particles) and Cracks Analysis System (PCAS), which could be employed to accurately identify pores in SEM images and eliminate impurities by selecting the appropriate element radius and minimum area.
The grayscale value and pore area of images vary for different threshold values because SEM image processing impacts the data extracted from images, while the void ratio derived from SEM image processing is highly influenced by the selected threshold [28]. Therefore, pixel threshold values are necessary for investigating the soil microstructure because the same soil exhibits distinct microstructure features under the application of the same research method but different threshold values. Currently, there are two main types of threshold determination methods: empirical and theoretical methods. In empirical methods, binarized images are visually compared with the original SEM images to determine the threshold value. These methods can be used to immediately determine the threshold, but they suffer the drawbacks of a time-consuming process and significant human error. Theoretical methods, which can be categorized as global or local methods, are based on certain threshold calculation theories [29], such as the Otsu algorithm [30,31], iteration algorithm [32], image histograms [33], entropy criterion [34], gray wolf optimizer [35], and edge detection [36]. Although these theories could facilitate threshold calculation, they are not all appropriate for clay SEM image processing due to the very small size of soil particles and pores and the difficulty in identifying contours. The microscopic properties of soil could be obtained using more established image processing techniques, but there is no standardized procedure or step for image preprocessing and binarization, particularly for determining the threshold value of image segmentation.
In this paper, the microscopic structure of municipal waste-contaminated clay was adopted as the research object. A novel method for processing SEM images and determining threshold values was proposed and applied in the processing of SEM images of clay contaminated with municipal waste using the Image Pro Plus (IPP) and Pores (Particles) and Cracks Analysis System (PCAS) software packages. To investigate the variation trend in the microstructure of municipal waste-contaminated soil with different seepage depths and different CaCO3 and CH3COOH concentrations at the later stage of municipal waste pollution degradation, the apparent void ratio and fractal dimension were chosen as parameters. Additionally, the effective threshold range was established and verified. The research method is simpler and more accurate for determining the threshold value of image segmentation, and the research conclusions are very important for improving the reliability of the extraction of the microstructure parameters of contaminated soil.
2. Materials and Methods
2.1. Test Soil and Equipment
In this study, two types of clay contaminated with municipal waste were prepared: seeping municipal waste-contaminated clay and soaking municipal waste-contaminated clay. Seeping municipal waste-contaminated clay is contaminated with municipal waste pollutants (mainly leachate) and occurs at different seepage depths. The soaking municipal waste-contaminated clay was prepared by mixing clay with CaCO3 and CH3COOH, which are the products of the later degradation stage of municipal waste pollutants. The uncontaminated clay used in this experiment was obtained from a southern suburb of Xuzhou city in Jiangsu Province, China, and was prepared for use by screening, natural drying, and eliminating impurities. The basic physical properties and composition of the clay are listed in Table 1.

Table 1.
Physical properties and composition of uncontaminated clay.
When preparing the municipal waste-contaminated clay with different seepage depths, the clay was compacted layer by layer into the test device, and the height of the clay column was approximately 100 cm. A gravel drainage layer was emplaced atop the compacted clay layer, and domestic waste was graded, compacted, and emplaced atop the gravel drainage layer. The experimental device was based on the liner construction of a domestic waste dump site as the prototype, and the preparation for the testing of seeping municipal waste-contaminated soil was designed using the similarity criterion, as shown in Figure 1. Leachate from municipal waste flowed through the clay layer at a rate of 38.5 L/d using a pressure pump, and the seepage level in the column was maintained at 1 m above the clay layer. Table 2 provides the water quality of the leachate. According to the research of Cao [37], the properties of clay are obviously different at various seepage depths. In this paper, six clays with different depths were selected, and the sampling depths of the sampling holes were 3.1, 17.3, 36.8, 48.5, 56.3, and 75.8 cm (based on the top surface of the compacted clay layer).
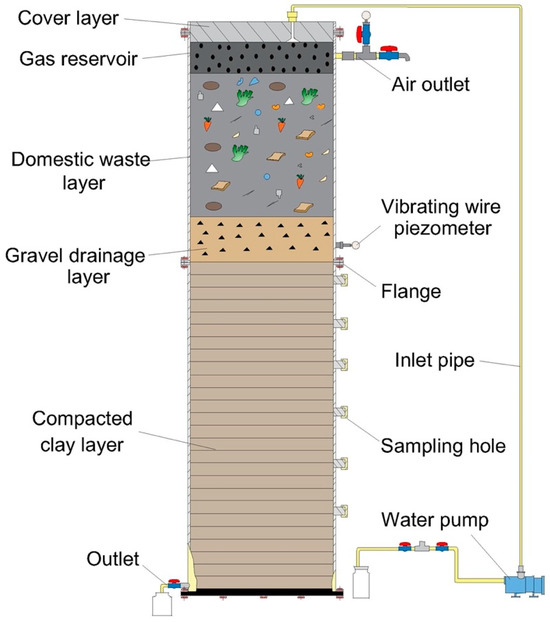
Figure 1.
Schematic of experimental setup: municipal domestic waste, gravel drainage, and compacted clay layers.
Table 2.
Water quality of leachate in simulating landfill experiment.
Contaminated clay in the later stage of municipal waste pollutant degradation was investigated to examine the pixel threshold of contaminated clay from a different angle. With the use of the clay soaking method, CaCO3- and CH3COOH-contaminated clay specimens with concentrations of 0.2, 0.4, and 0.6 mol/L were artificially prepared as soaking municipal waste-contaminated clay because municipal waste contaminants are continuously degraded in the seepage process and the main products of the late degradation stage are CaCO3 and CH3COOH [38]. The CaCO3 and CH3COOH concentrations were determined according to the content of soluble organic matter in the leachate of municipal landfills in different regions [39,40].
2.2. Sample Preparation
Seeping municipal waste-contaminated soil was obtained by extracting six sets of contaminated clay samples at different seepage depths from six sampling holes of the seeping municipal waste-contaminated soil preparation test device, while uncontaminated clay samples were also prepared as a control. The clay properties at the different seepage depths are listed in Table 3. Soaking municipal waste-contaminated soil was obtained by preparing six groups of CaCO3- and CH3COOH-contaminated clay samples with concentrations of 0.2, 0.4 and 0.6 mol/L, and the chemical elements are listed in Table 4. The samples for SEM analysis were prepared in accordance with the specifications of the adopted SEM with as little disturbance as possible. The clay was sliced and trimmed into samples with measurements of 1 cm by 1 cm by 1 cm. The samples were then dried in an oven at 65 °C. After the samples were dried, tape was used to remove any loose clay particles from the cross section of the sample until a completely smooth surface was obtained.
Table 3.
Physical parameters of contaminated clay samples at different depths of the column after seepage.
Table 4.
Chemical elements of soaking municipal waste-contaminated soil.
3. Results
3.1. Image Processing Method: IPP and PCAS
In IPP, images can be transformed from color to grayscale images and from grayscale to binary images. In both manual and automatic methods, this program can be used to measure more than 60 measurement parameters, including the center point, long and short axes, perimeter, area, and number of dimensions. It can also select the necessary measurement parameters, display the target parameters, and automatically number the target in accordance with the specifications. The main function of PCAS is to automatically identify, geometrically quantify and statistically analyze microscopy images of particles, cracks, and pores. Through the image corrosion operation and seed algorithm, the fine connections between pores can be removed to identify and separate any particles that come into contact and overlap with each other in the image [41].
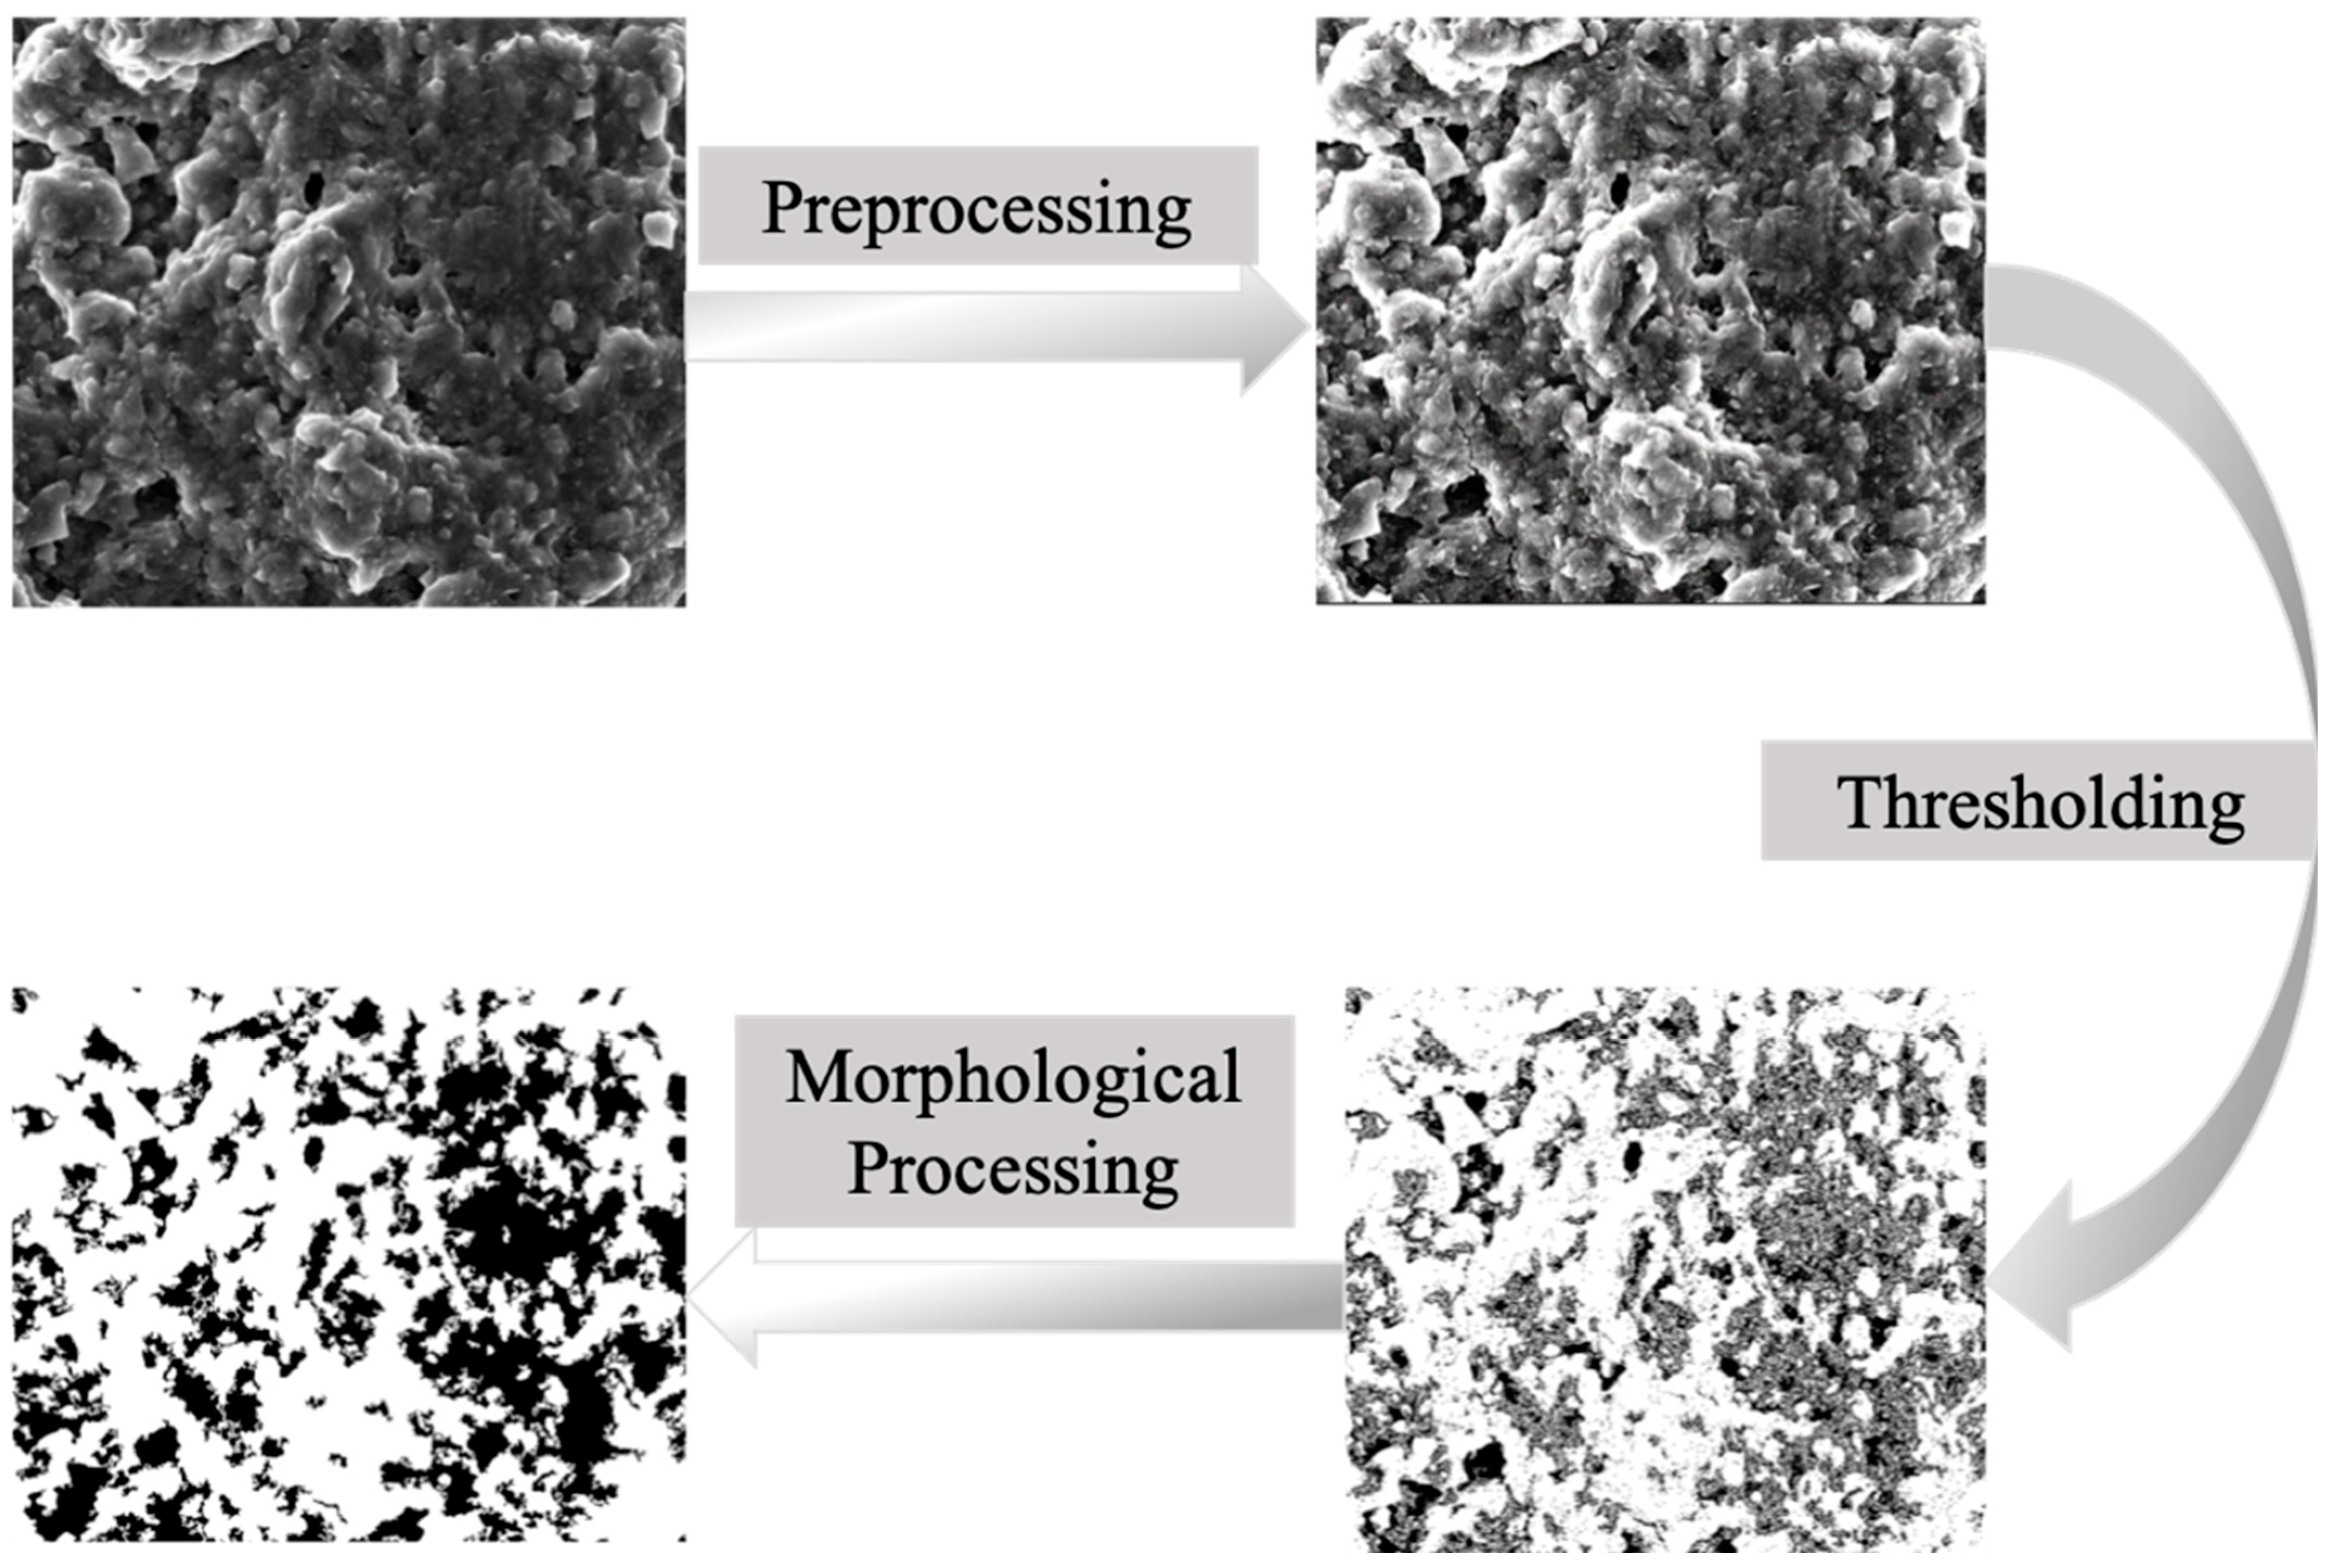
The two primary categories of frequently used image binarization methods are local and global thresholding methods (S.-B. Song et al., 2020) [42]. Local thresholding, which is based on the grayscale histogram and other methods of achieving multithreshold segmentation, is typically used to identify severe interference in poor-quality images [43]. However, the calculation speed is low, and image connectivity cannot be guaranteed. In the global thresholding method, a threshold is determined based on the entire image. The disadvantage is that the processing effect is significantly worse when the illumination distribution is uneven or the noise interference is high [44]. In this study, each SEM image was preprocessed before the global threshold approach was utilized to calculate the threshold value. The specific SEM image processing steps, adopting an uncontaminated clay image as an example, are shown in Figure 2.
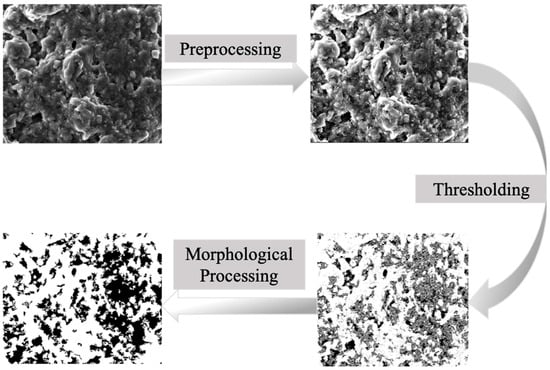
Figure 2.
SEM images preprocessing of the uncontaminated clay sample.
- (1)
- Preprocessing of SEM Image
Images should be set to the same brightness and contrast levels as much as possible because these factors significantly impact the image information, and too much or too little brightness could result in inaccurate or missing image information. First, IPP was used to correct distortions of the image background and eliminate uneven brightness. Then, the background-corrected image was processed to enhance the image intensity by adjusting the brightness, contrast, and gamma correction levels. After determining the range of variation of these three parameters by selecting several values, the brightness value was increased by 4–18, the contrast value was increased by 4–18, and the gamma value was increased by −0.3–0.3. Finally, the sharpened filter was used to improve the measurement accuracy and image quality.
- (2)
- Thresholding of SEM Image
The image was segmented using the global thresholding method, which was programmed in MATLAB 2022 in accordance with Equation (1). The gray value of a pixel with a threshold lower than T in the original image was set to 0; otherwise, it was set to 1.
where is the grayscale function of the original image, is the grayscale function of the binarized image, and T is the threshold.
- (3)
- Morphological Processing of the SEM Images
After image binarization, there were isolated black and bright spots in the soil binary image due to the influence of impurities and image noise. These isolated points were resolved via automatic pore system analysis in PCAS.
The recognition of particles in PCAS is based on the seed algorithm. The minimum area was set to 50, low-noise pixels below the threshold were removed, and particles with pixels above the threshold were recognized. The overlapped portion of particles was then corroded after the element radius was set to two based on the corrosion operation. To acquire the particle properties, independent particles were finally located, and the corroded pixels were added back to the original particles. After SEM image morphological processing, the diameter, area, perimeter, fractal dimension, and roundness of the contaminated clay particles and pores could be obtained in IPP.
3.2. Morphology of Microstructure of Contaminated Clay
The control and seeping municipal waste-contaminated clay samples (obtained at column depths of 3.1, 17.3, 36.8, 48.5, 56.3, and 75.8 cm) and uncontaminated clay and soaking municipal waste-contaminated clay samples (with concentrations of 0.2, 0.4, and 0.6 mol/L CaCO3 and 0.2, 0.4, and 0.6 mol/L CH3COOH) were scanned at different magnifications (1200×, 1500×, 1800×, and 2100×). The research results of Tang et al. [41] were incorporated; notably, the observation effect did not necessarily improve with increasing magnification, and the best magnification scale occurred within the 1500 ± 300 range. Therefore, SEM images magnified by 1500 were selected for the control and seeping municipal waste-contaminated clay samples, and SEM images magnified by 1200 were selected for the uncontaminated clay and soaking municipal waste-contaminated clay samples. The sample table was cleaned by a cleaning instrument before the observation. Then, the samples were covered with a small amount of conductive adhesive involving a wooden stick firmly pressed against the clay surface. SEM images of the control and seeping municipal waste-contaminated clay samples collected at depths of 17.3, 56.3, and 75.8 cm and corresponding binary images after treatment are shown in Figure 3. SEM images of the uncontaminated clay and CaCO3- and CH3COOH-contaminated clay samples with concentrations of 0.2, 0.4, and 0.6 mol/L and corresponding binary images after treatment are shown in Figure 4.
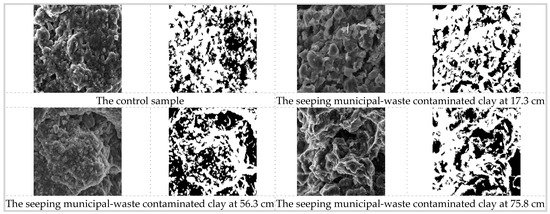
Figure 3.
SEM images and binary images of the control sample and contaminated clay with different seepage depths at 1500 magnification.
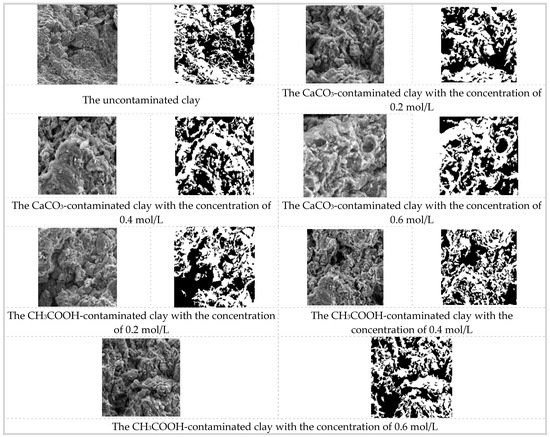
Figure 4.
SEM images and binary images of uncontaminated soil and contaminated clay with different concentrations at 1200 magnification.
3.3. Effective Threshold Range of Image Pixel Values Based on Apparent Void Ratio of Contaminated Clay
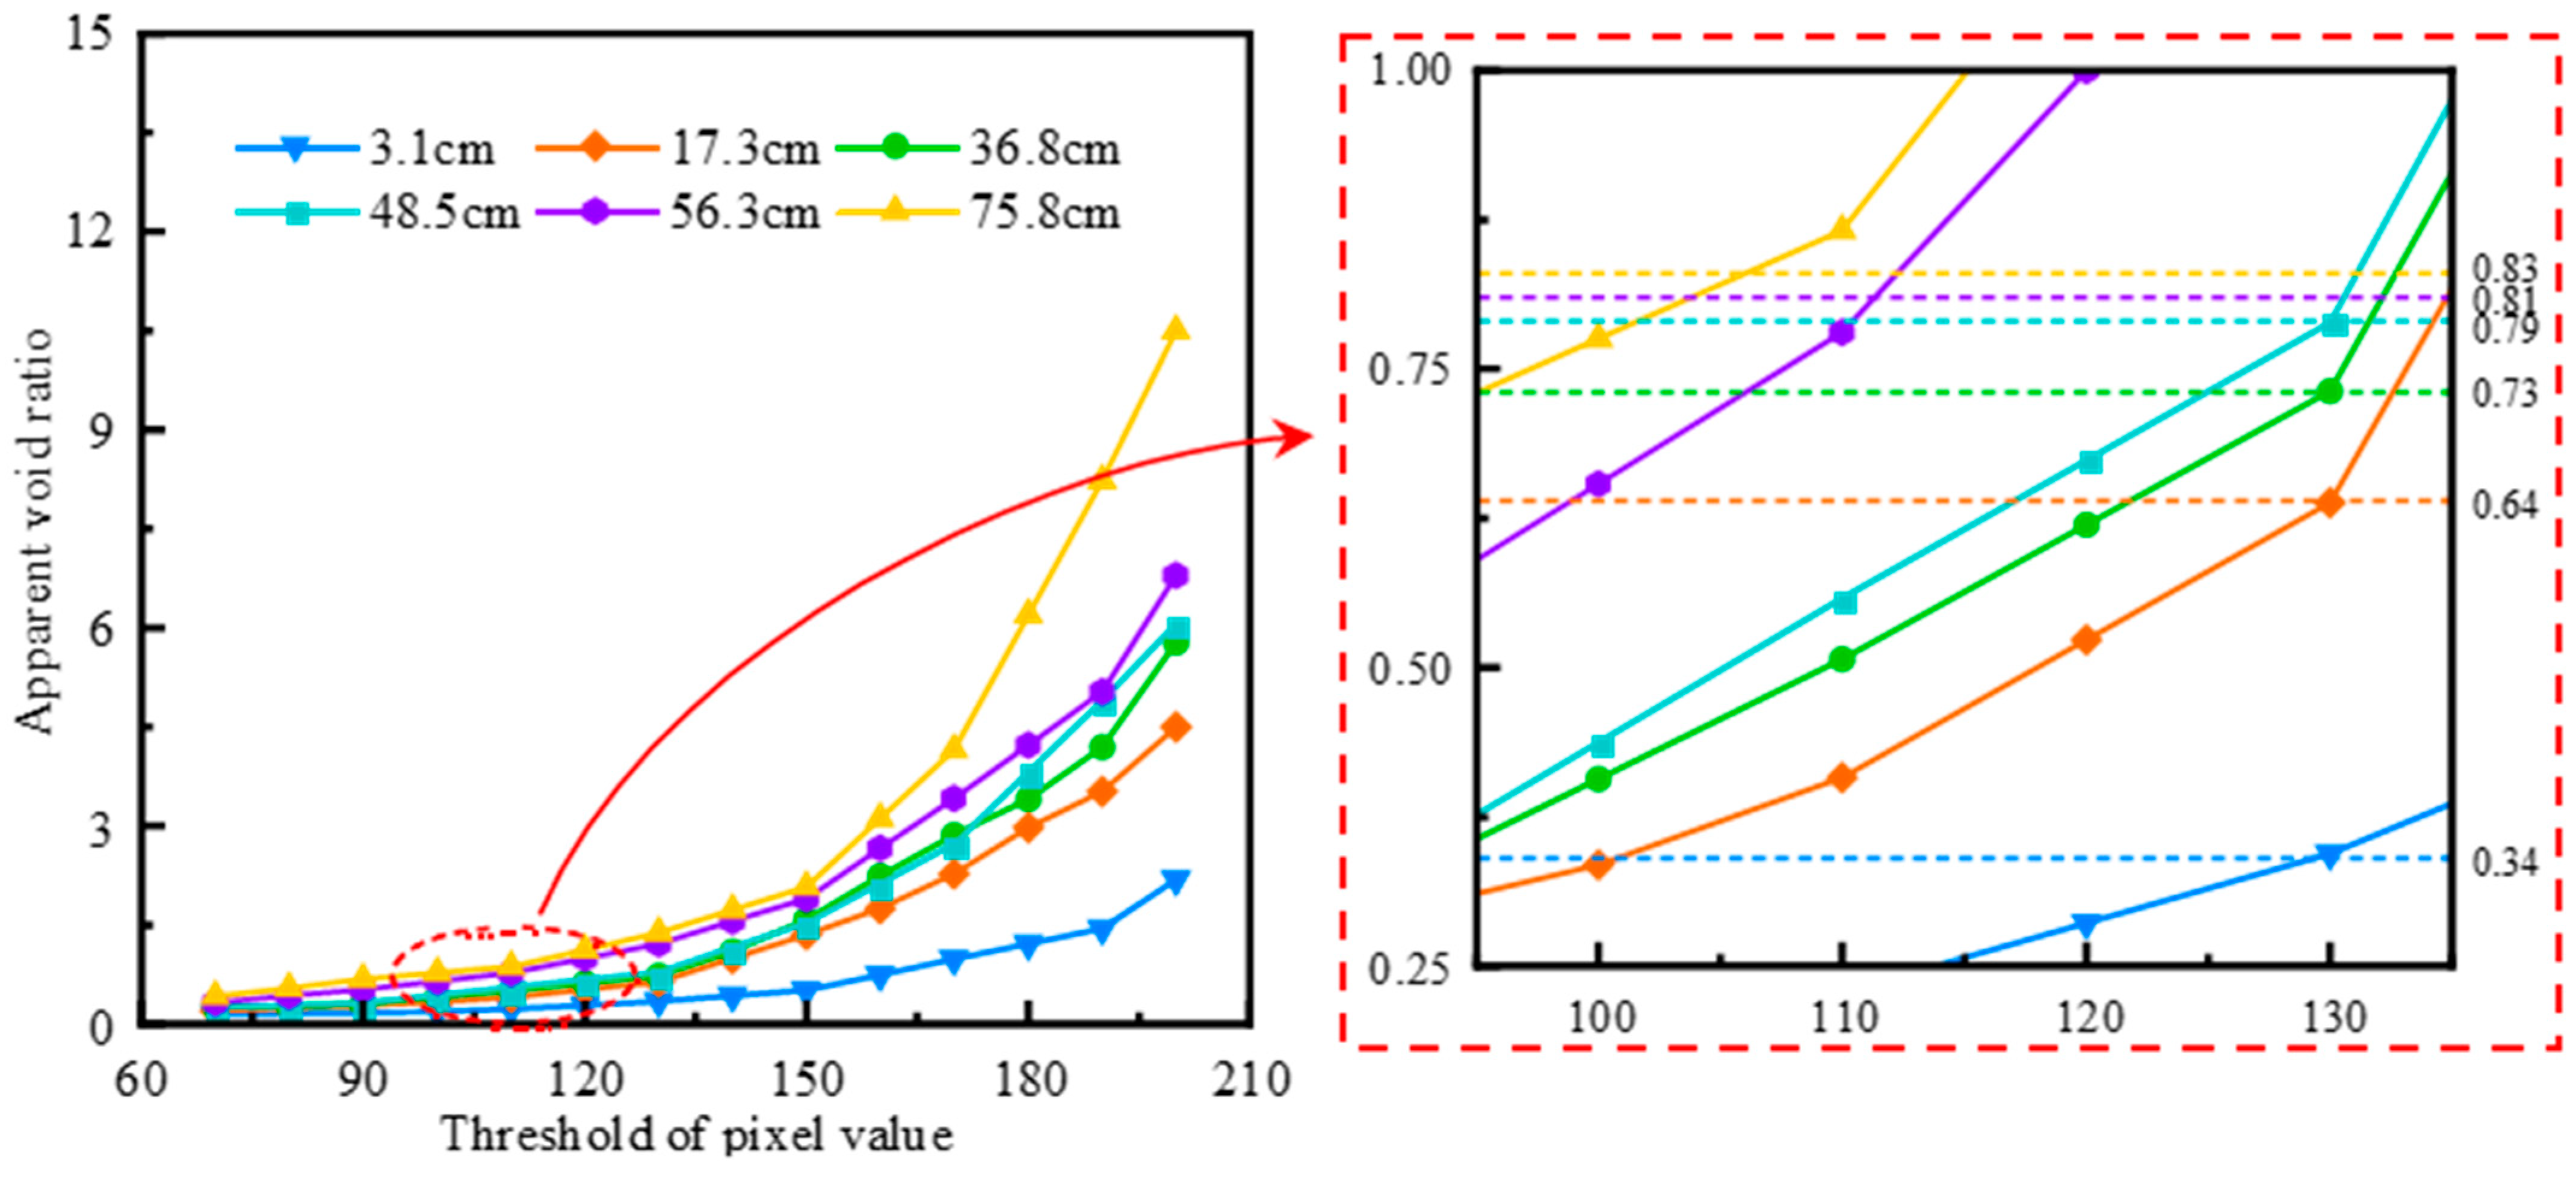
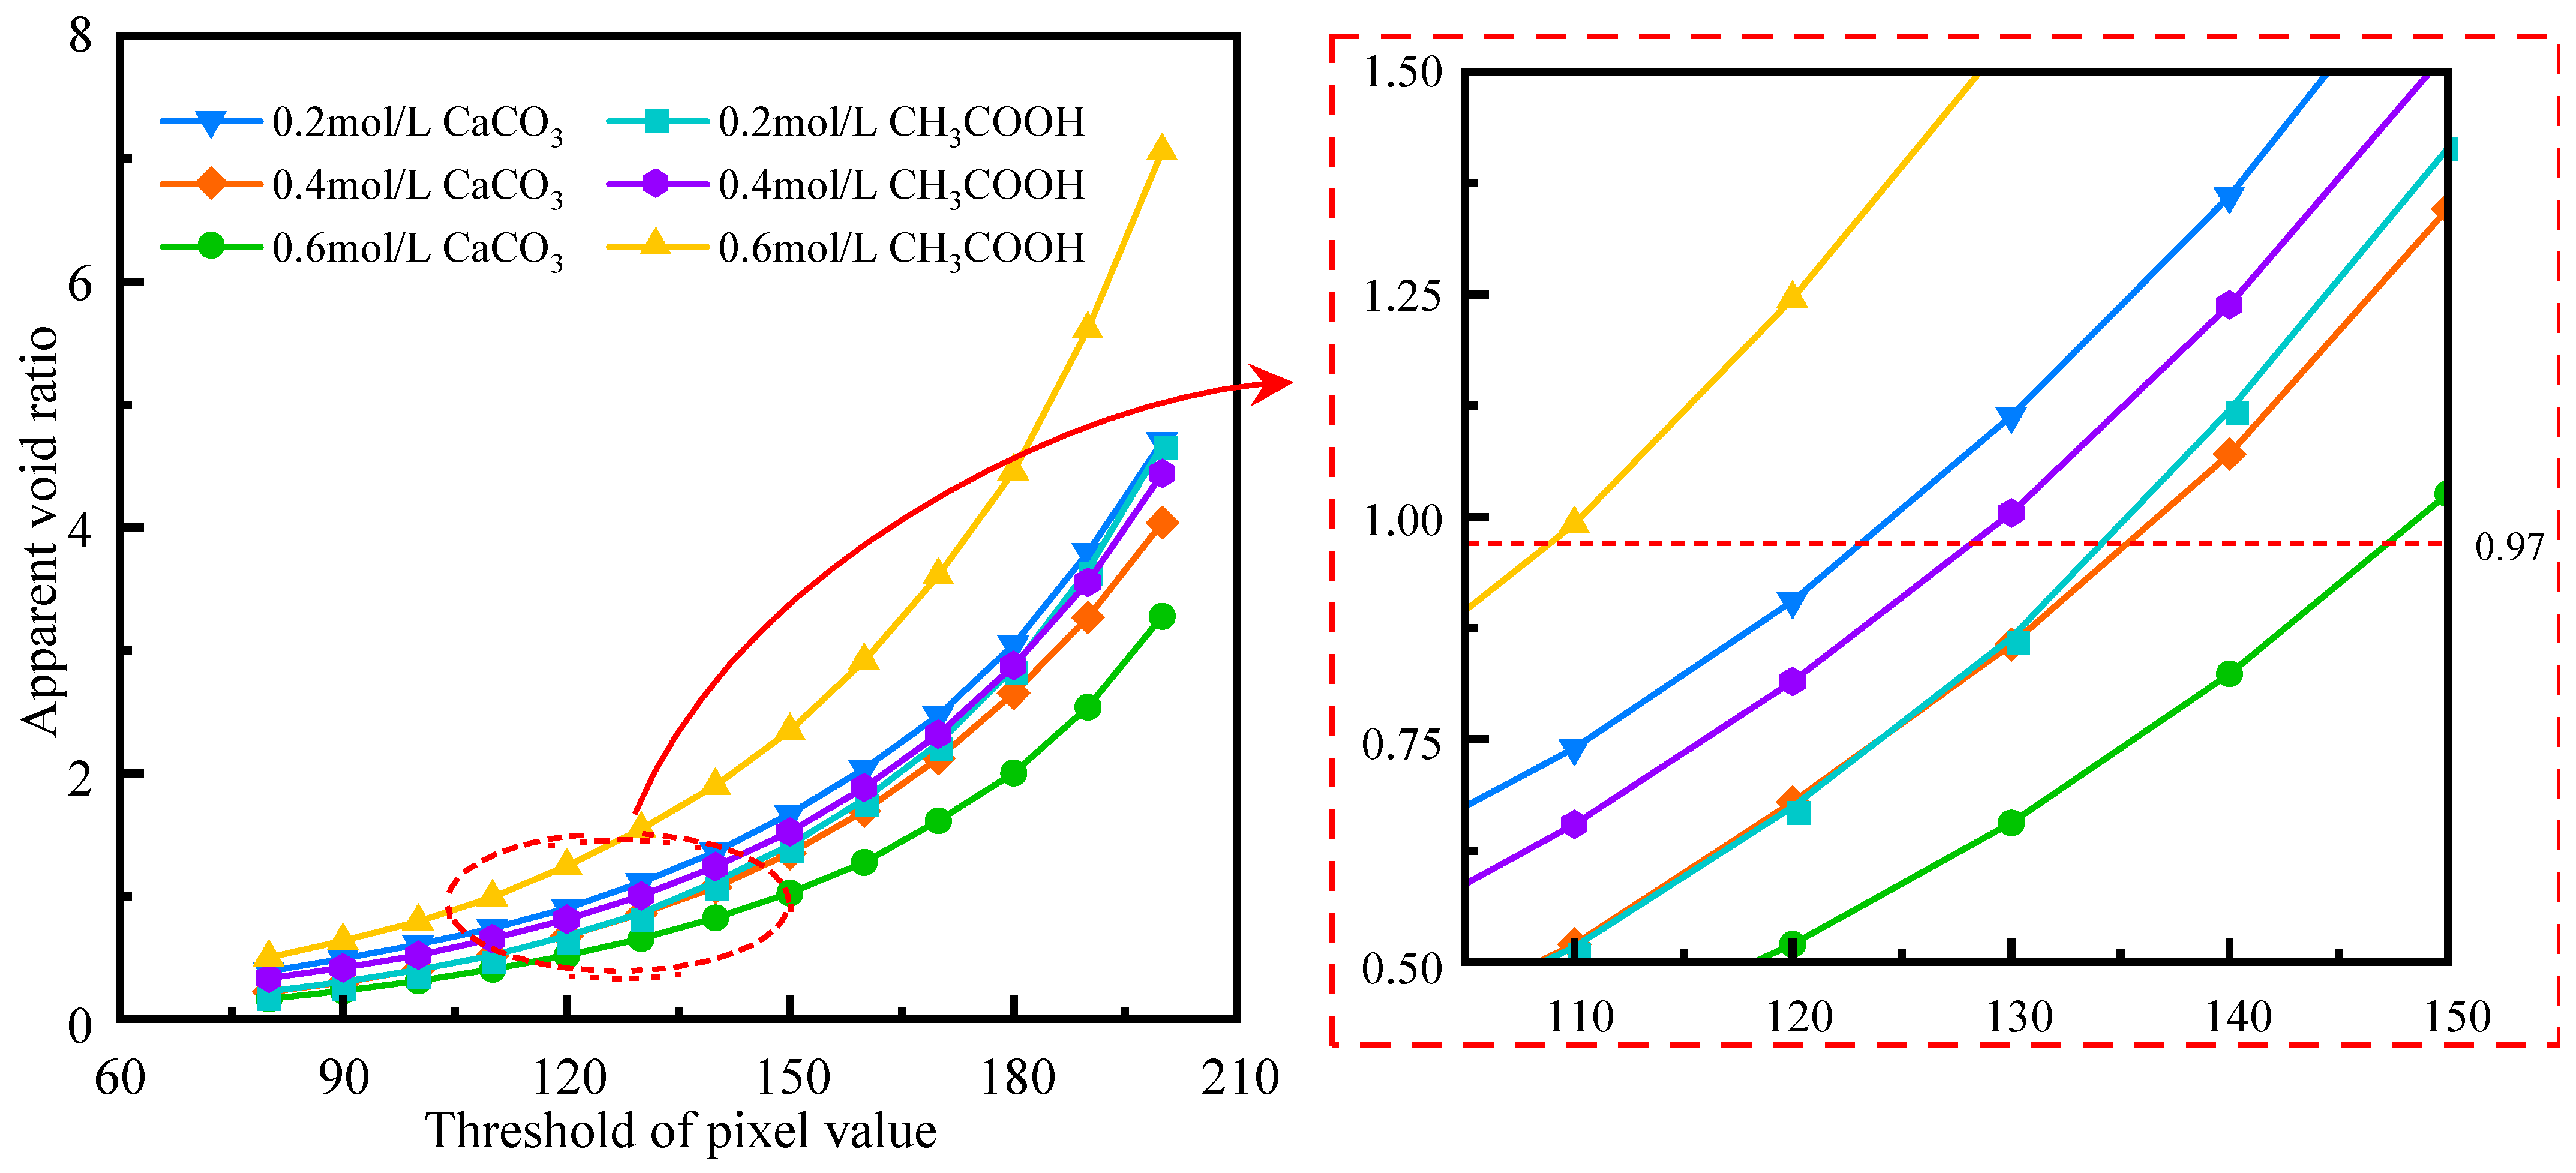
After enhancement, segmentation, binarization and denoising of the SEM images, the black and white pixels in the binary images represent pores and soil particles, respectively. Therefore, the apparent void ratio can be calculated according to the ratio of the black area to the white area in each image. With the use of the data collected by IPP, the apparent void ratio and image pixel values of the seeping municipal waste-contaminated clay samples are shown in Figure 5, and the apparent void ratio and image pixel values of the soaking municipal waste-contaminated clay samples are shown in Figure 6.
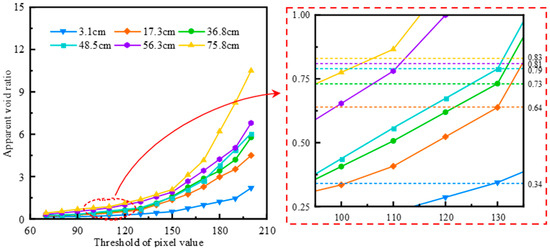
Figure 5.
Relationship between apparent void ratio and pixel threshold values of samples at different column depths.
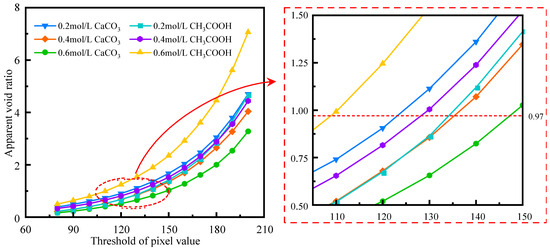
Figure 6.
Relationship between apparent viod ratio and pixel threshold values of samples at different concentrations.
Table 1 indicates that the void ratio of all soaking municipal waste-contaminated clay samples was 0.97. Table 3 indicates that the void ratios of the seeping municipal waste-contaminated clay samples collected at column depths of 3.1, 17.3, 36.8, 48.5, 56.3, and 75.8 cm were 0.34, 0.64, 0.73, 0.79, 0.81, and 0.83, respectively. As such, a value of 130 could be used as the threshold value for the contaminated clay collected at a seepage depth of 3.1 cm, since at this depth, the apparent void ratio was approximately 0.31, which is closer to the measured void ratio of 0.34. The reasonable threshold values for the contaminated clay collected at seepage depths of 17.3, 36.8, 48.5, 56.3, and 75.8 cm were 130, 130, 130, 110, and 110, respectively, with the apparent void ratio closely approximating the measured void ratio as the determination basis. The reasonable threshold values for the CaCO3-contaminated clay samples with concentrations of 0.2, 0.4 and 0.6 mol/L were 120, 130, and 140, respectively. The reasonable threshold values for the CH3COOH-contaminated clay samples with concentrations of 0.2, 0.4, and 0.6 mol/L were 130, 125, and 110, respectively.
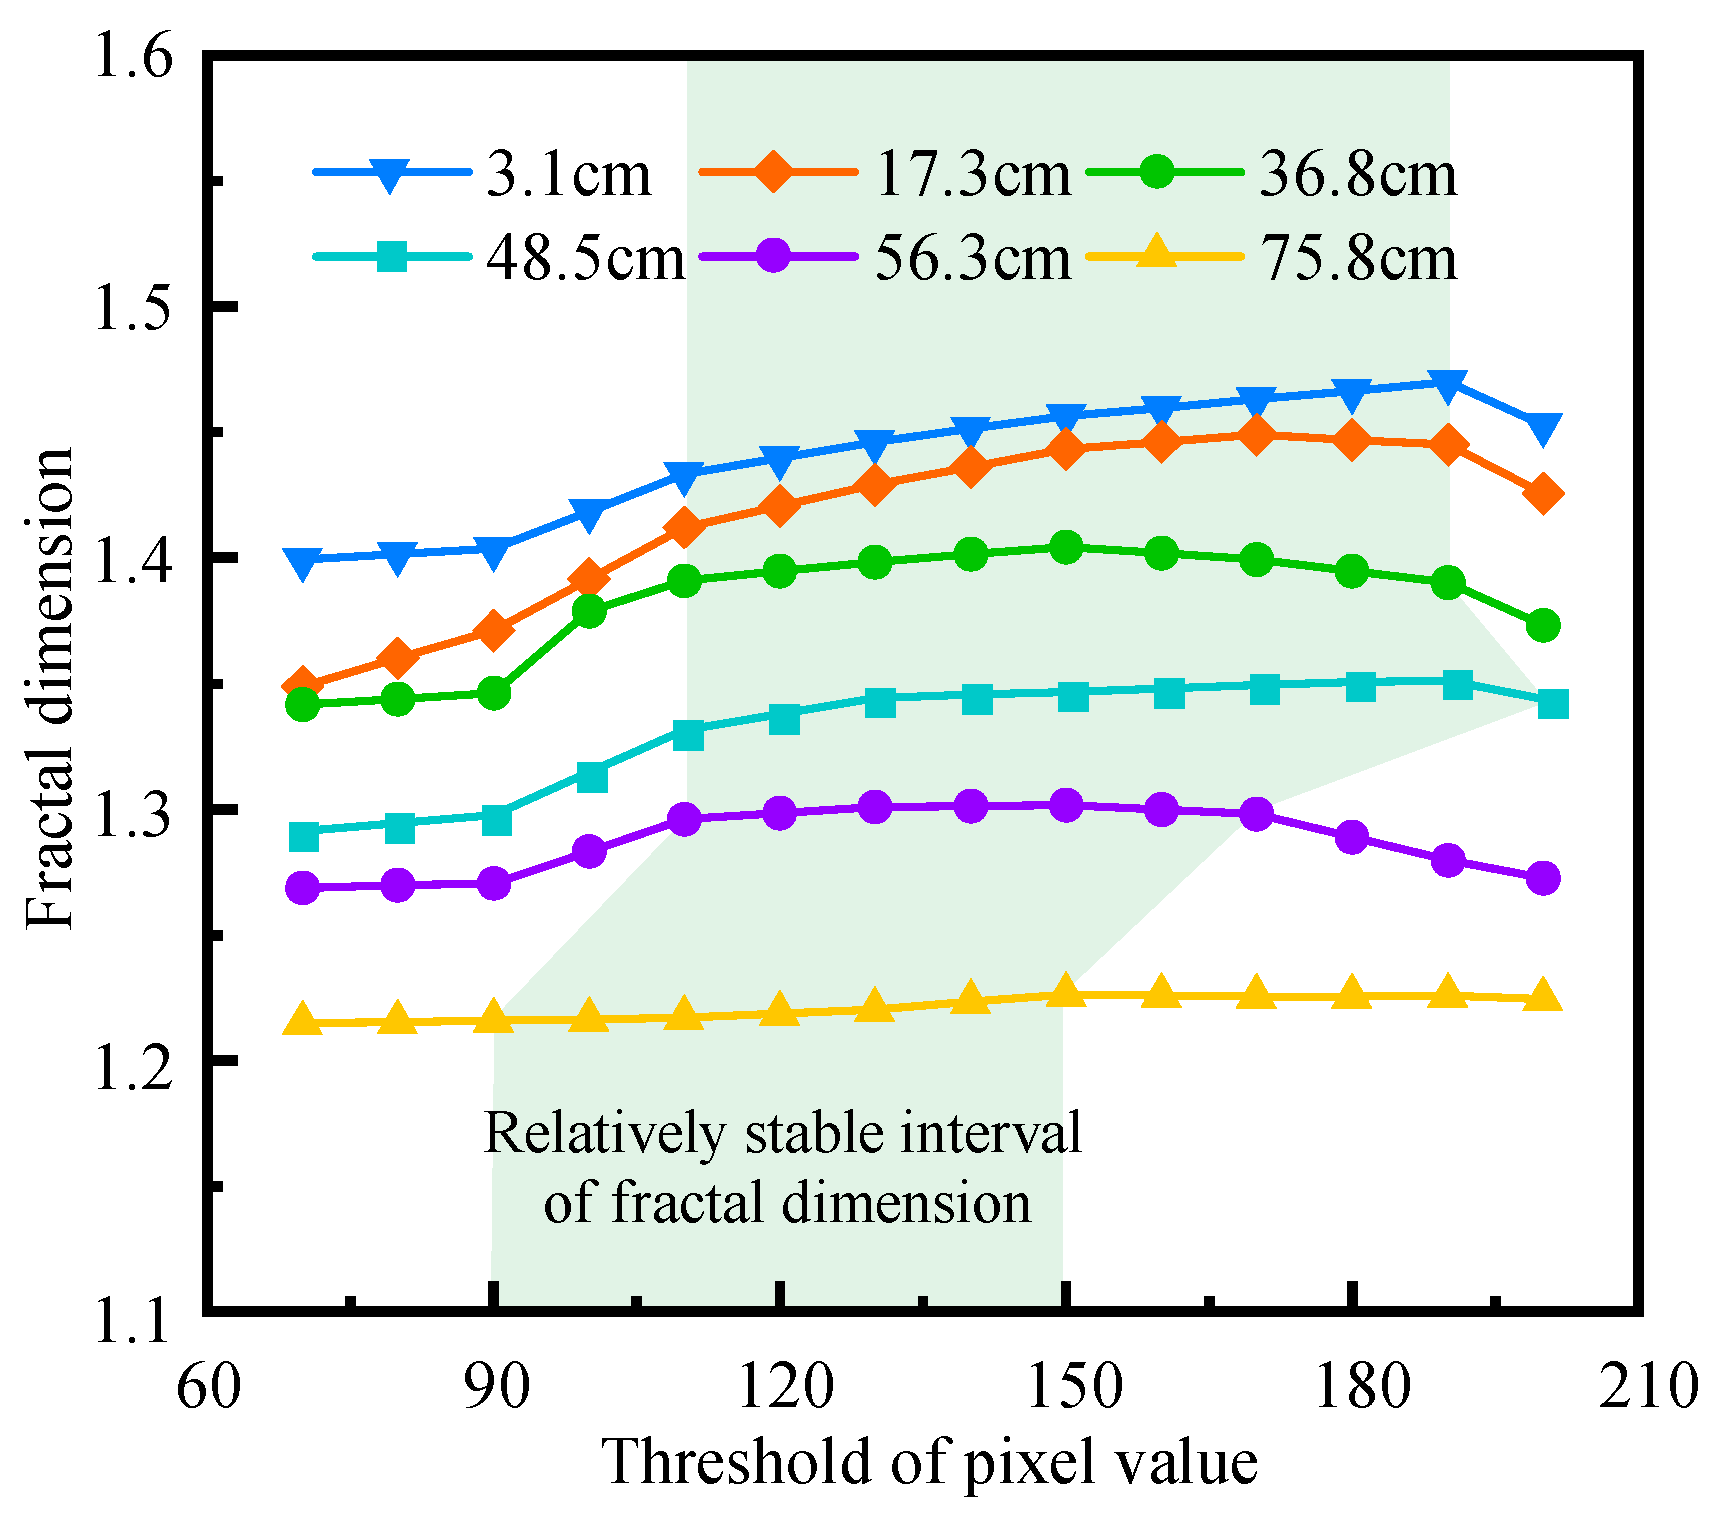
3.4. Effective Threshold Range of Image Pixel Values Based on the Fractal Dimension of Contaminated Clay Particles
The fractal dimension is an important parameter to quantitatively describe the shape contour of particles. Through image analysis, the fractal dimension can quantitatively describe the complexity of particle contours.
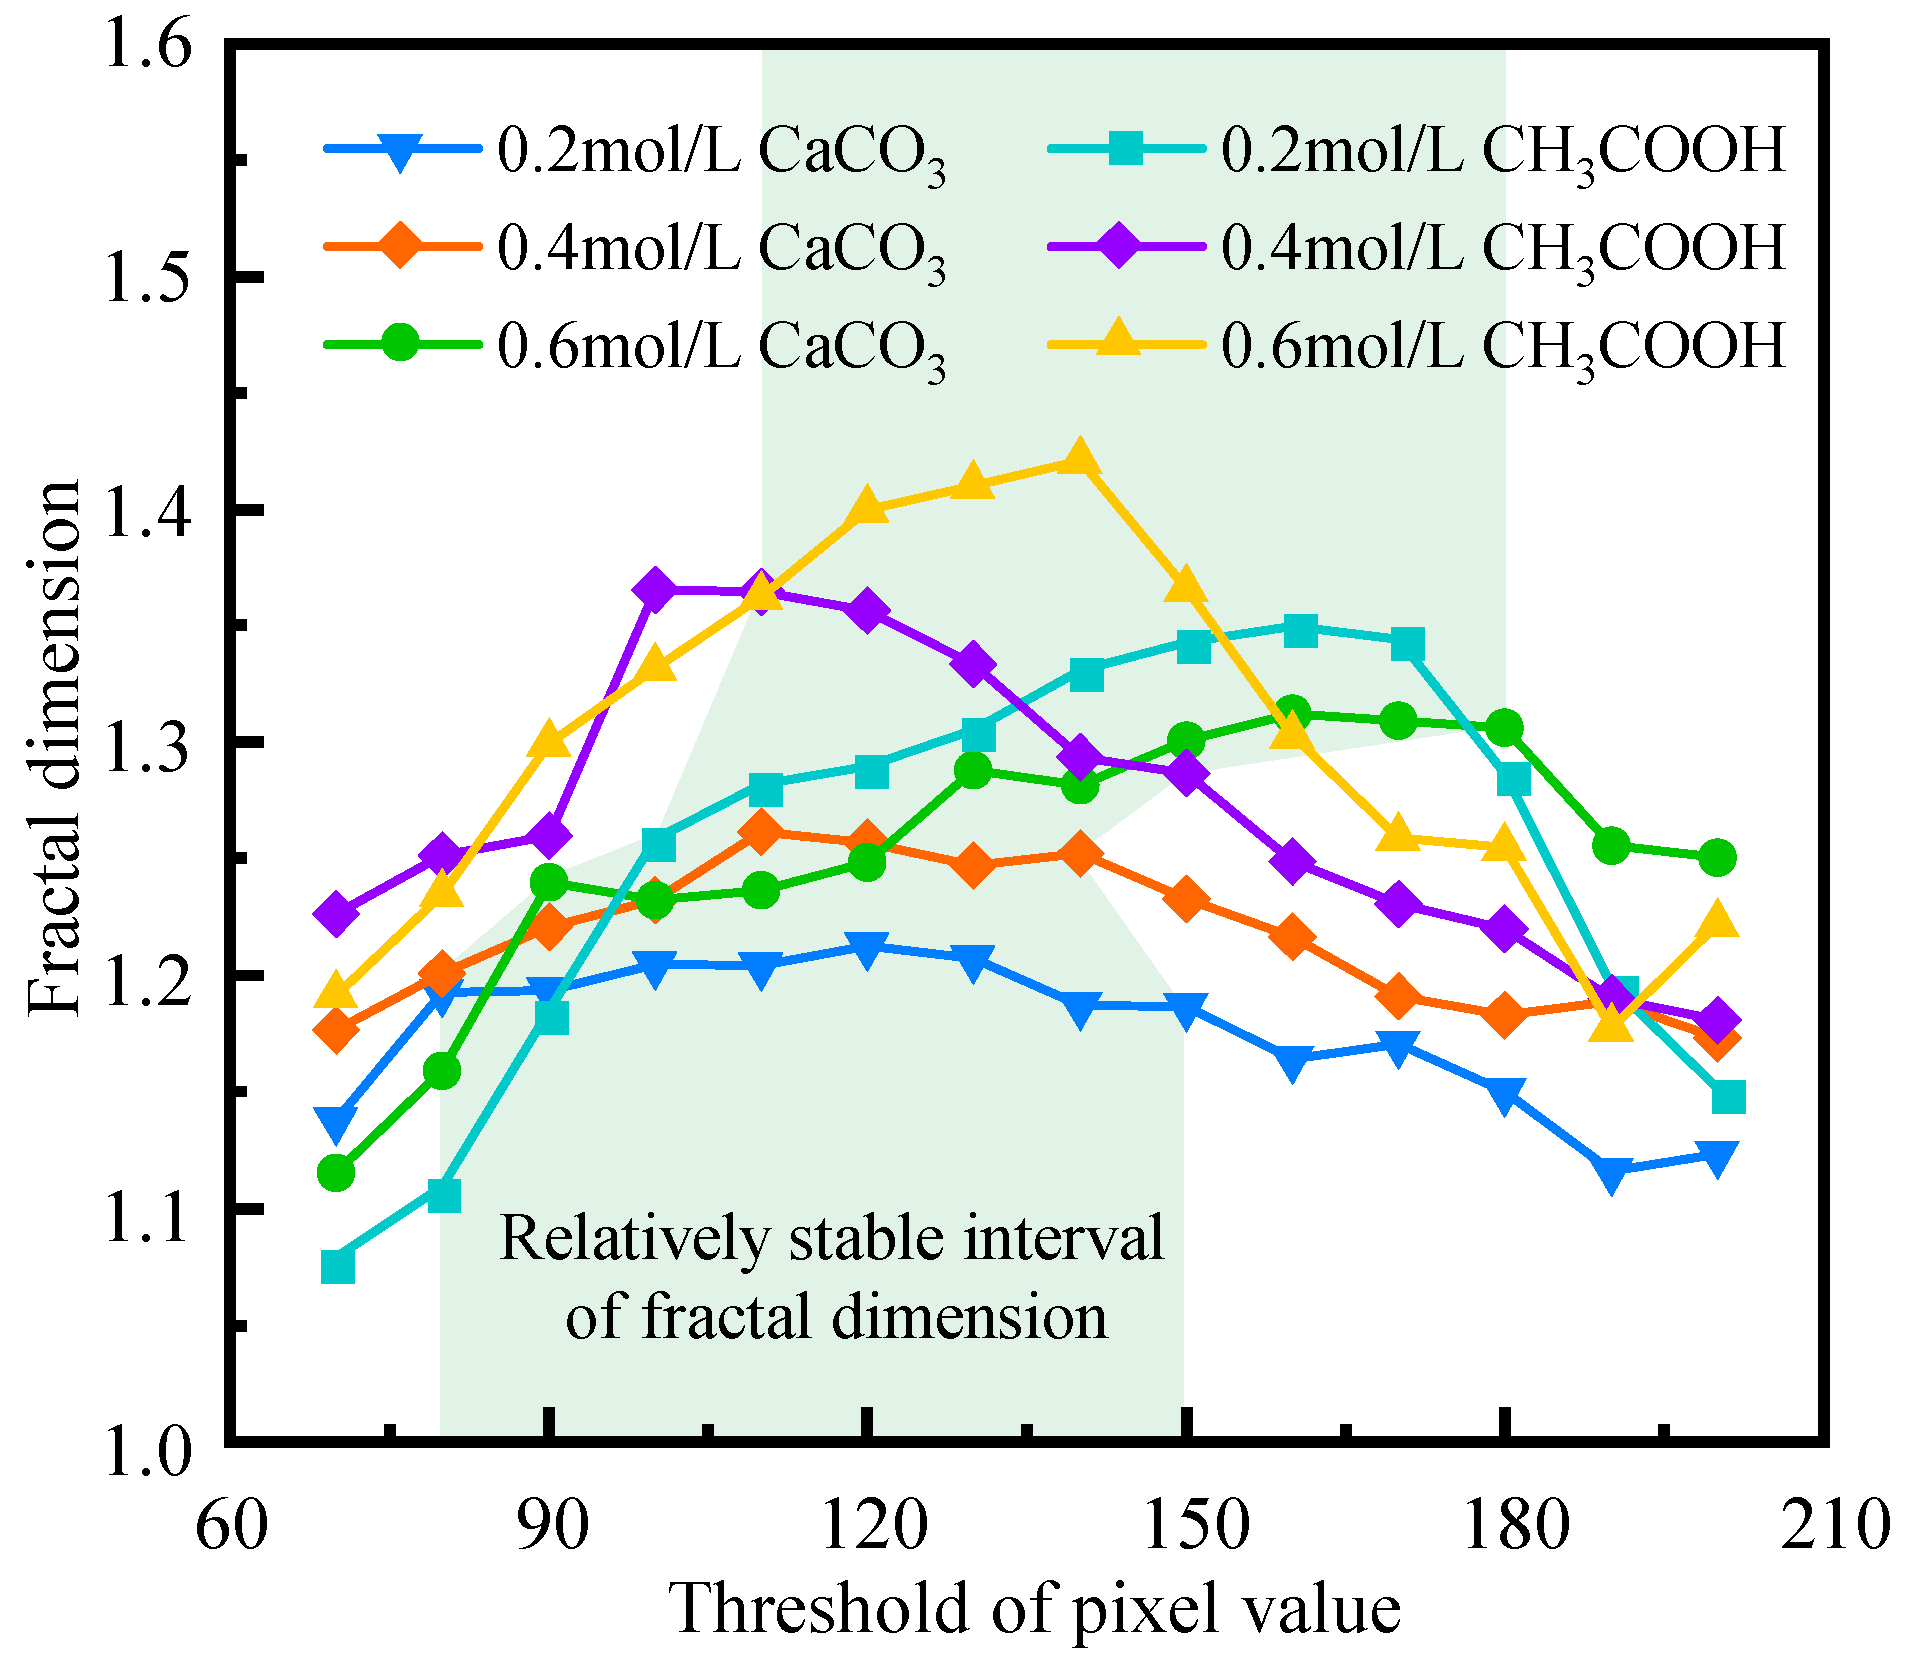
Figure 7 and Figure 8 show the link between the fractal dimension and the image pixel threshold value of the seeping and soaking municipal waste-contaminated clay samples, respectively, using the data obtained by IPP. The fractal dimension of the particles initially increased with increasing pixel value, tended to stabilize, and then sharply declined. The fractal dimension of clay particles should be investigated within a constant interval, according to Tang et al. [45]. The fractal dimension of the contaminated clay particles at a column depth of 3.1 cm exhibited a relatively constant pixel value with a range of 110~170. Similarly, the pixel value intervals for the fractal dimensions of the seeping municipal waste-contaminated clay samples at column depths of 17.3, 36.8, 48.5, 56.3, and 75.8 cm were 110~190, 110~190, 110~210, 110~170, and 90~150, respectively; the pixel value intervals for the fractal dimensions of the CaCO3-contaminated clay samples with concentrations of 0.2, 0.4, and 0.6 mol/L were 80~150, 110~140, and 90~180, respectively; and the pixel value intervals for the fractal dimensions of the CH3COOH-contaminated clay samples with concentrations of 0.2, 0.4 and 0.6 mol/L were 100~140, 110~150, and 100~180, respectively. In summary, the optimal pixel value interval was 110–140 based on the fractal dimension of the contaminated clay particles, and calculations based on this range should be very reliable.
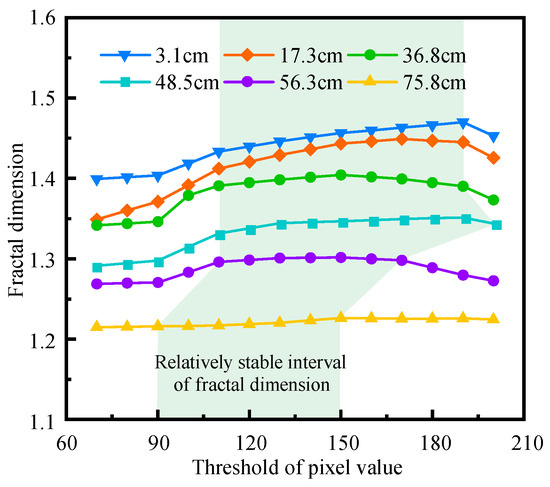
Figure 7.
Relationship between fractal dimension and the pixel value of clay particles at different column depths.
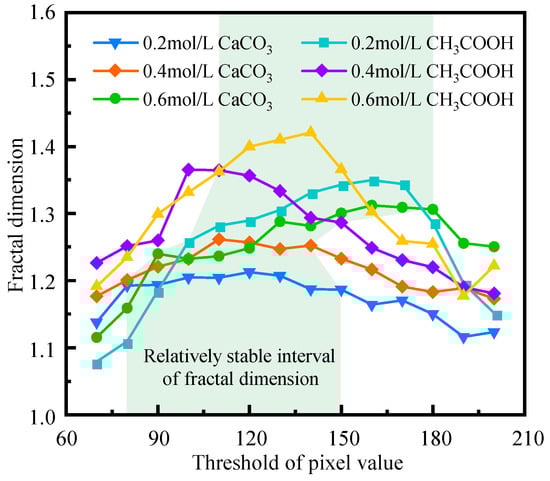
Figure 8.
Relationship between fractal dimension and the pixel value of clay particles at different concentrations.
3.5. Determining Effective Threshold Range of Image Pixel Values for Contaminated Clay
When the clay microstructure is investigated, clay pores and particles are the main subjects. Pores and clay particles should be considered when determining the ideal threshold range of image pixel values. The effective threshold range of image pixel values in this investigation was 110–140 when the apparent void ratio of the contaminated clay samples was accounted for. The effective threshold range of the pixel values was also 110–140 when the fractal dimension of the contaminated clay samples was accounted for. As a result, 110–140 is the ideal threshold range of the pixel values based on the microscopic structure of municipal waste-contaminated clay.
4. Discussion
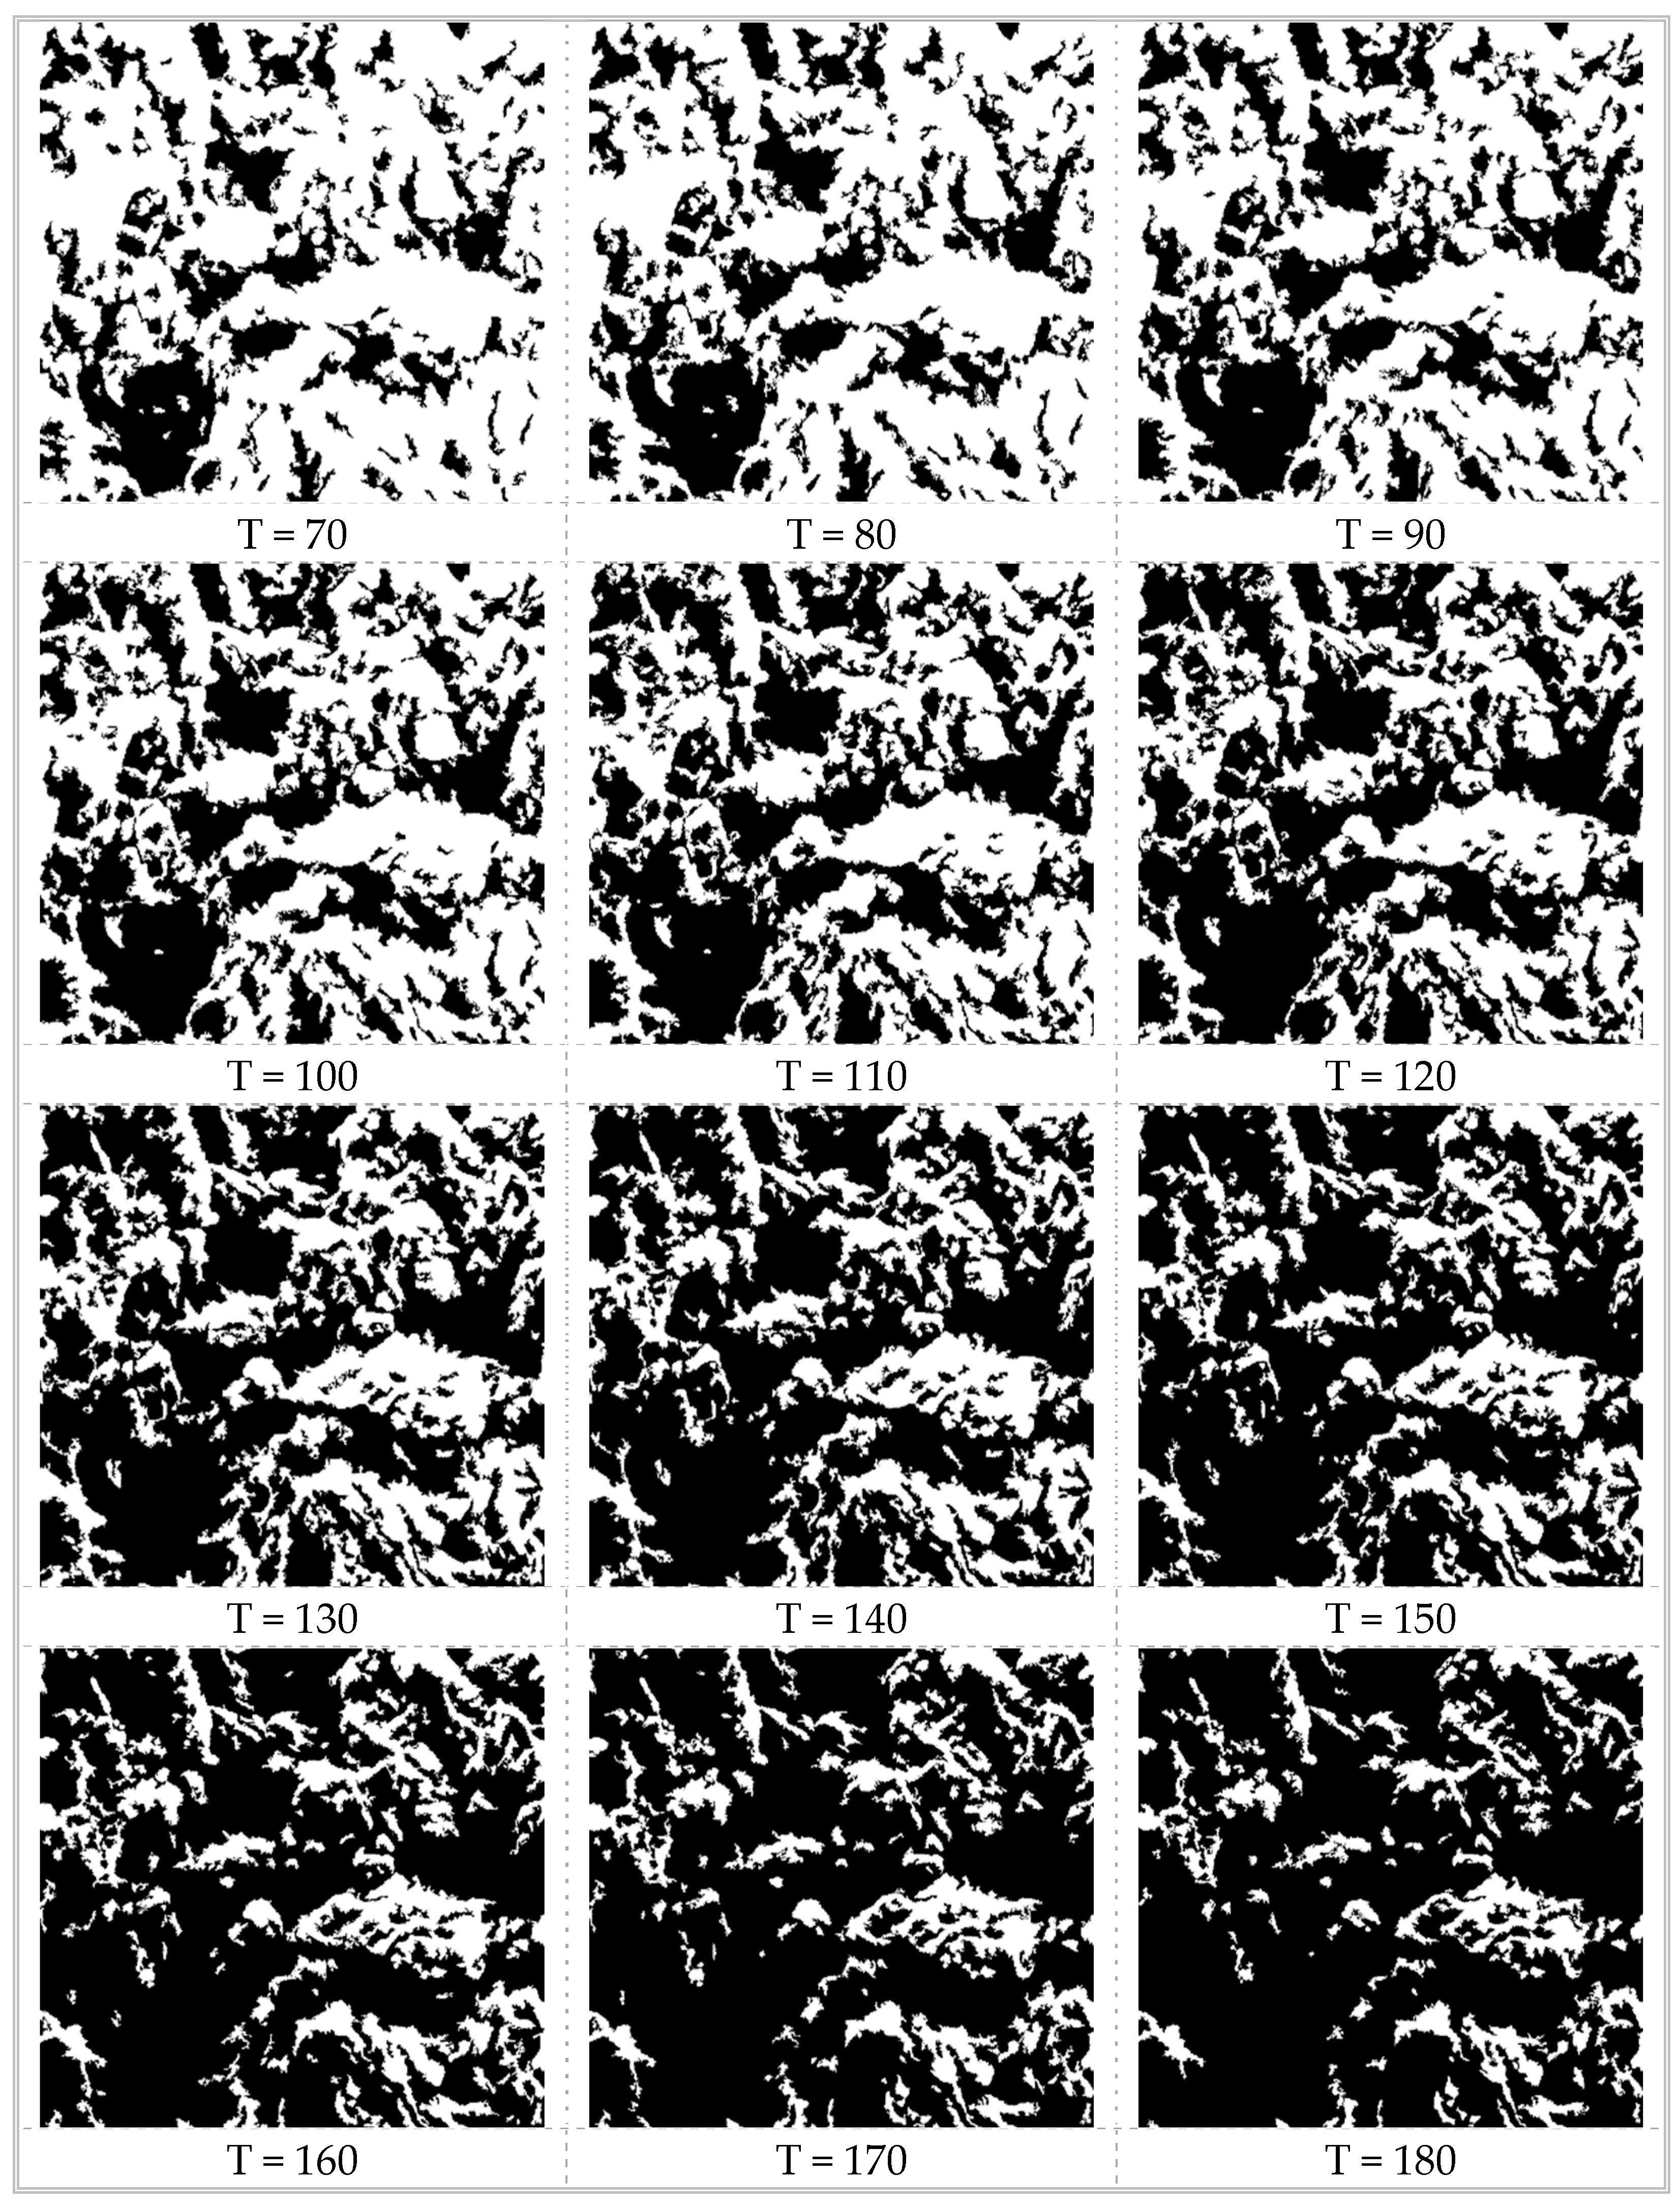
Figure 9 shows binarized SEM images of clay polluted with CH3COOH at a concentration of 0.6 mol/L for 12 image pixel values (T denotes the pixel value). The following three factors were used to validate the effective threshold range of 110–140.
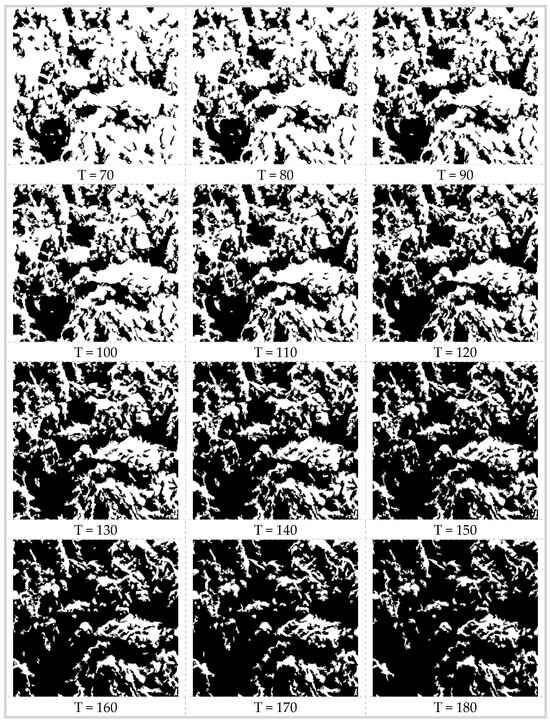
Figure 9.
Binarization of SEM images of CH3COOH-contaminated clay with the concentration of 0.6 mol/L segmented by different pixel values.
First, there is a connection between the effective threshold range of image pixel values and the apparent void ratio. The same SEM images of municipal waste-contaminated clay resulted in different threshold ranges of image pixel values, which led to different binary images. Since more image pixels were regarded as pores given a larger threshold range, there were more black pixels and a higher apparent void ratio. At the same time, when the pixel threshold value was 130, the apparent void ratio approximated the actual void ratio the most. Figure 9 shows this phenomenon.
Second, pore obstruction varies depending on the seepage depth. The amounts of calcium carbonate and organic matter per kilogram of clay generated are shown in Table 3. It can be seen that the amounts of calcium carbonate and organic matter produced per kilogram of clay gradually decrease with the depth of seepage. This occurs because during waste-contaminant seepage, organic matter (organisms) and suspended debris obstruct the pores, and organic matter and its degradation substances chemically react with the clay to generate calcium carbonate and other deposits in the clay pores [46,47]. Therefore, the smaller pores in the upper soil prevent the leachate from moving lower, resulting in less chance of clay contamination and a higher void ratio when municipal waste contaminants seep to greater depths. The results indicated that the threshold determination method was reasonable given that the curves corresponding to the various thresholds depicted in Figure 6 were consistent with this classification.
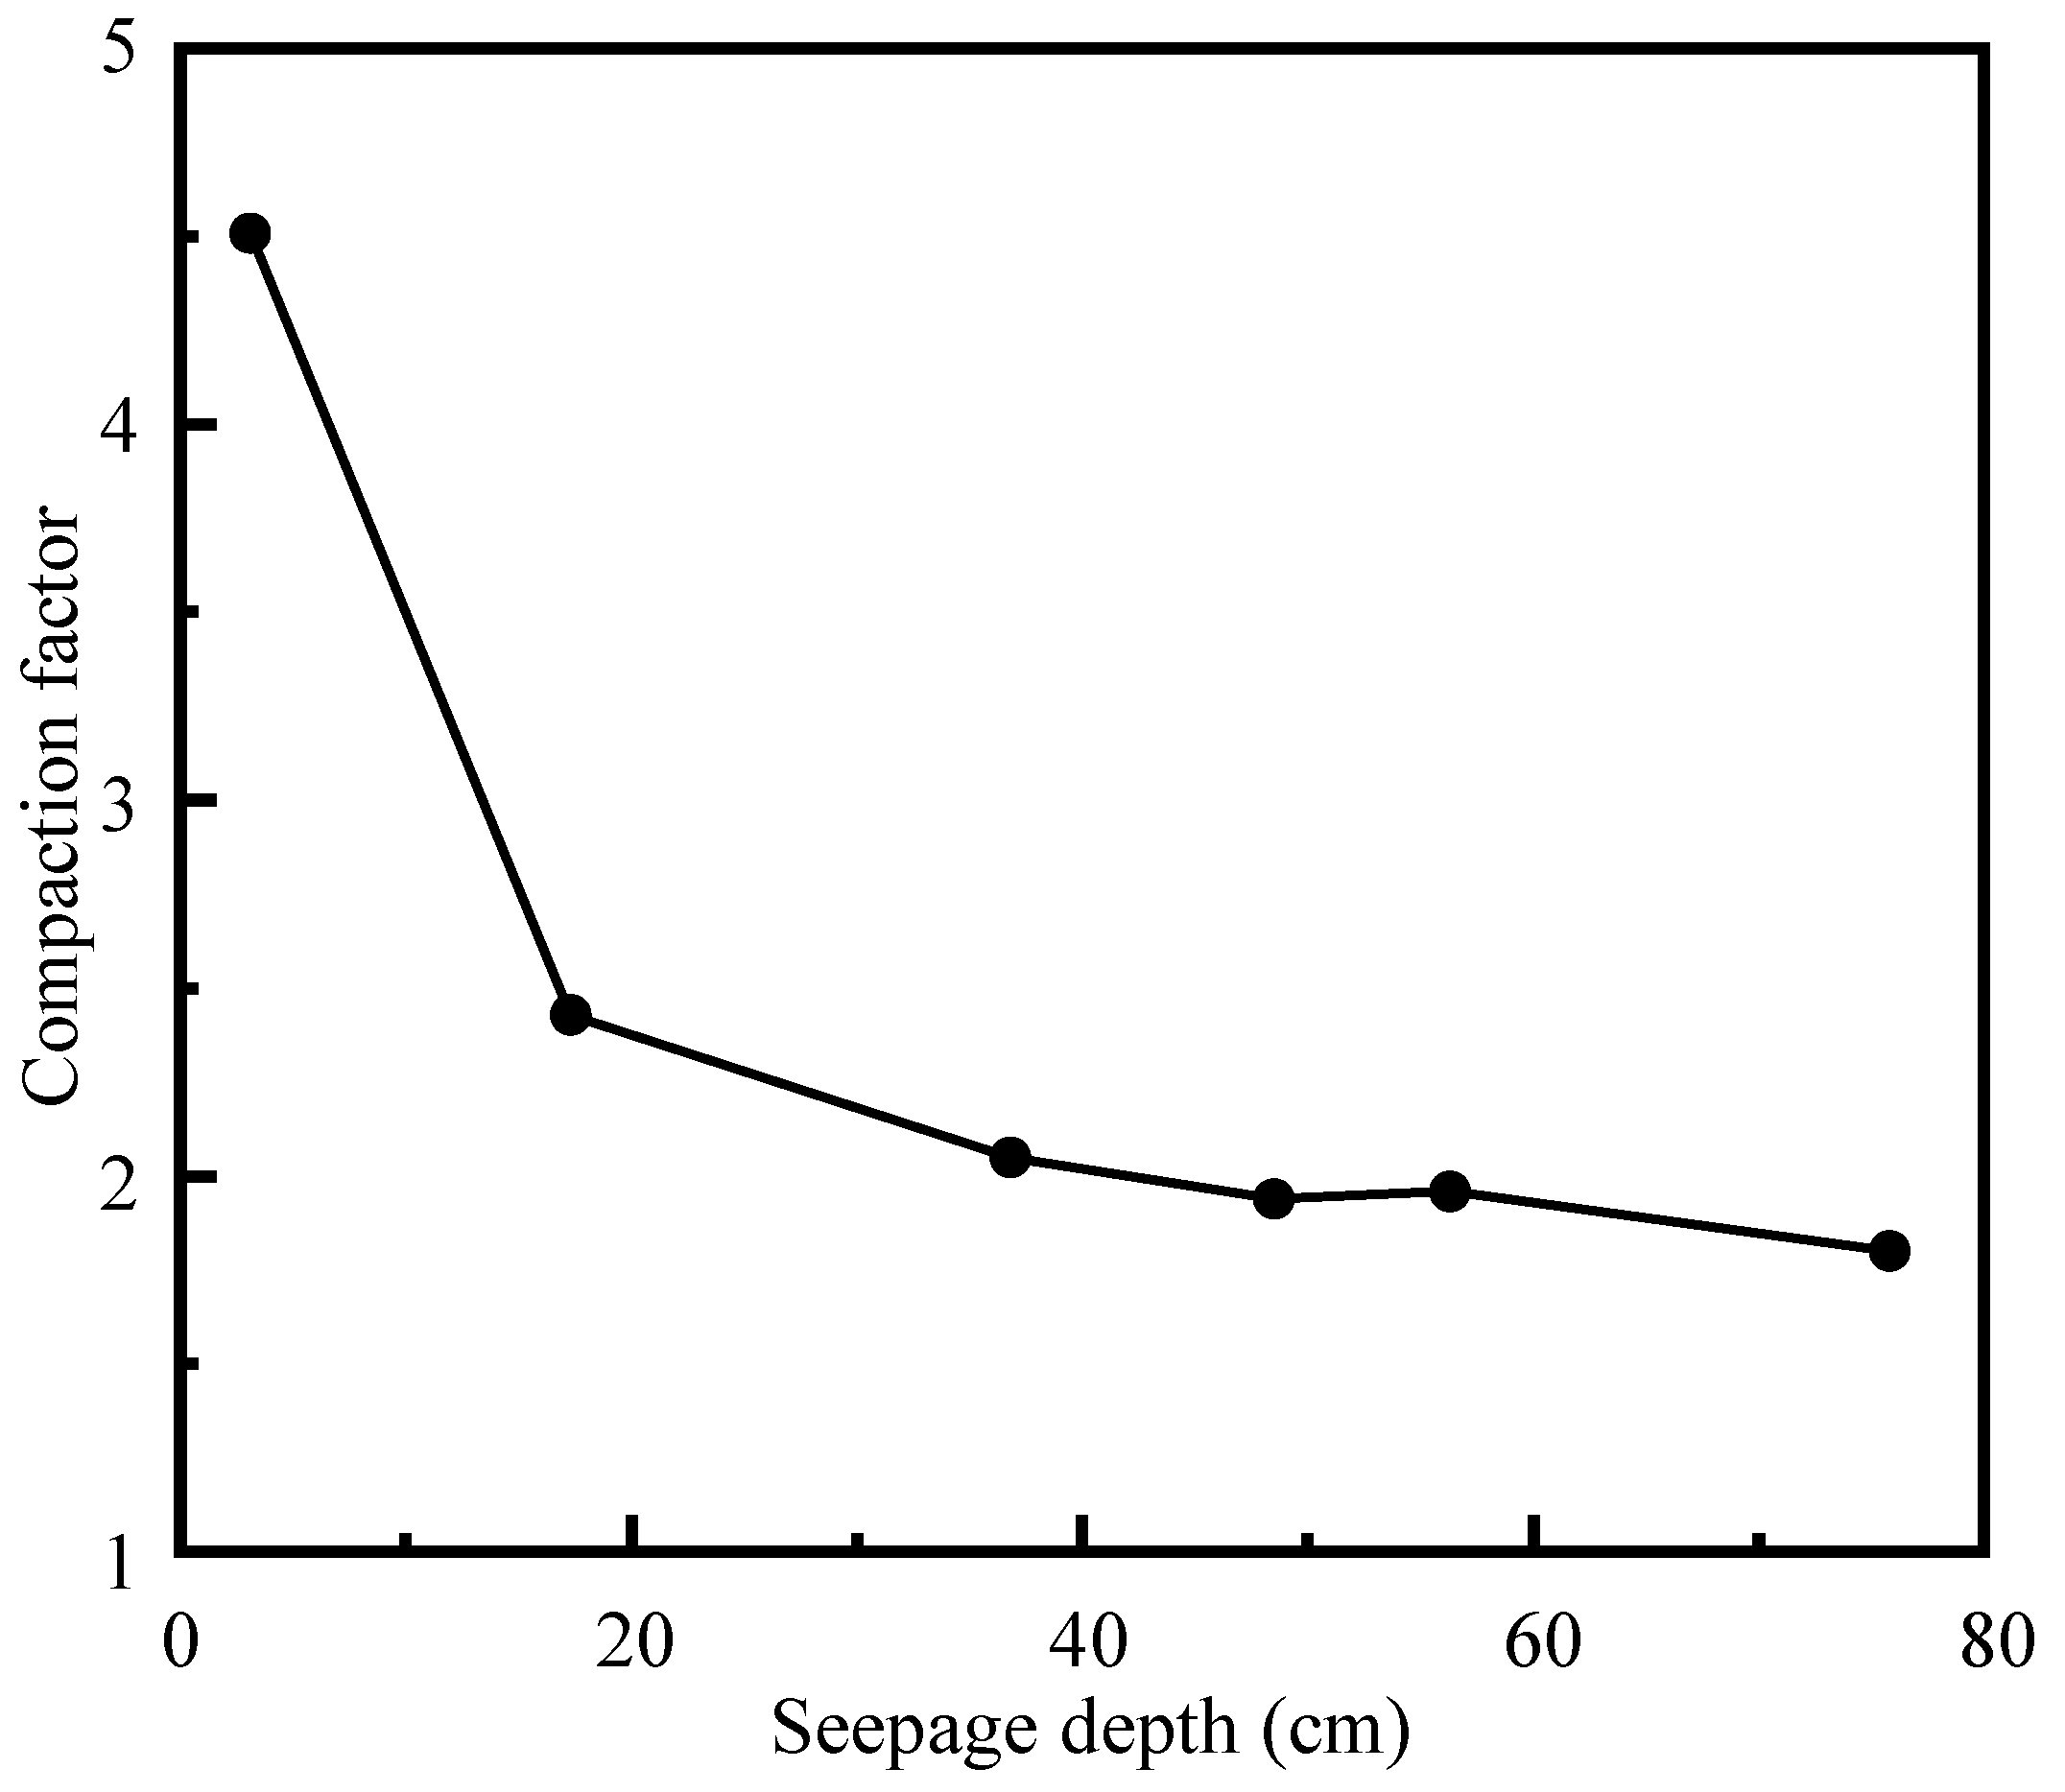
Third, from the perspective of macroscopic parameters, the suitability of the threshold values was confirmed. In this study, a parameter, namely, the compaction factor, which is equal to the ratio of the dry density to the apparent void ratio, was defined as the effective combination of the soil macroscopic properties (dry density) and microstructure (apparent void ratio). The larger the compaction factor is, the more compact the soil. The compaction factor values for municipal waste-contaminated soils at appropriate thresholds could be estimated using the apparent void ratio values corresponded to the thresholds for the seeping and soaking municipal waste-contaminated soils determined in Section 3.3.
Figure 10 shows that the compaction factor decreased with increasing seepage depth, while the compactness of clay also decreased, which agrees with the finding that the void ratio of municipal waste-contaminated clay increased with pollutant seepage. The compaction factor increased with increasing CaCO3 concentration and decreased with increasing CH3COOH concentration, which is consistent with the finding that CaCO3 imposed a cementation effect on soil and that CH3COOH exerted a corrosion effect on soil. This suggests that the thresholds were appropriate.

Figure 10.
Relationship between compaction factor and seepage depths.
Therefore, it is reasonable to conclude that the pixel threshold value ranges from 110 to 140.
5. Conclusions
In this paper, SEM images of seeping and soaking municipal waste-contaminated clay samples were processed and studied in IPP and PCSA. The main conclusions are as follows:
- (1)
- The threshold was determined by binarization and morphological processing of the SEM images using IPP and PACS. IPP was used to preprocess and binarize the SEM images to eliminate uneven brightness. The particles that came into contact and overlapped with each other were identified and separated in each image by using PACS.
- (2)
- Based on the relationship between the threshold value and apparent void ratio and the relationship between the threshold value and particle fractional dimension, the range of the pixel threshold value of municipal waste-contaminated clay was determined as 110–140.
- (3)
- The pixel threshold value range of 110–140 of municipal waste-contaminated clay was validated based on the relationship between the pixel threshold value and apparent void ratio, the variation in pore blockage with seepage depth, and the compaction factor value variation with seepage depth and contaminant concentration.
This study proposes a simple and accurate method for determining effective threshold range of image pixel values for municipal waste-contaminated clay, thus improving the reliability of the extraction of the microstructure parameters of contaminated soil. Because of the abundance of soil pores, most types of soil can use this method to establish the threshold value. However, this method is only applicable to soil, and further research on the microstructure of rocks is required.
Author Contributions
All authors contributed to the study conception and design. The methodology, investigation and data curation were performed by R.Z. The funding acquisition, methodology and supervision were performed by L.C. The formal analysis and resources were performed by Y.G. The first draft of the manuscript was written by R.Z. and all authors commented on previous versions of the manuscript. All authors have read and agreed to the published version of the manuscript.
Funding
This study is supported by the National Natural Science Foundation of China (No. 42372309, 41972281).
Institutional Review Board Statement
Not applicable.
Informed Consent Statement
Not applicable.
Data Availability Statement
All relevant data are within the paper.
Acknowledgments
We are grateful to Xuehan Feng, Shenglin Wang, and Nian Cai for preparing the experiments, drawing figures and testing the software for threshold determination. We also thank the editor and three anonymous reviewers for their thoughtful comments, which led to a greatly improved manuscript.
Conflicts of Interest
The authors declare no conflicts of interest.
References
- Haque, E.; Jing, X.; Bostick, B.C.; Thorne, P.S. In vitro and in silico bioaccessibility of urban dusts contaminated by multiple legacy sources of lead (Pb). J. Hazard. Mater. Adv. 2022, 8, 100178. [Google Scholar] [CrossRef]
- Schiavo, B.; Meza-Figueroa, D.; Vizuete-Jaramillo, E.; Robles-Morua, A.; Angulo-Molina, A.; Reyes-Castro, P.A.; Inguaggiato, C.; Gonzalez-Grijalva, B.; Pedroza-Montero, M. Oxidative potential of metal-polluted urban dust as a potential environmental stressor for chronic diseases. Environ. Geochem. Health 2023, 45, 3229–3250. [Google Scholar] [CrossRef]
- Wang, P.; Yin, Z.Y.; Hicher, P.Y.; Cui, Y.J. Micro-mechanical analysis of one-dimensional compression of clay with DEM. Int. J. Numer. Anal. Methods Geomech. 2023, 47, 2706–2724. [Google Scholar] [CrossRef]
- Zhang, X.; Ding, Z.; He, S.H.; Zhang, G.D.; Sun, M.M.; Xia, T.D. An Experimental Study on the Microstructure Evolution of Soil under Lateral Consolidation Compression. Appl. Sci. 2022, 12, 8331. [Google Scholar] [CrossRef]
- Pedarla, A.; Puppala, A.J.; Hoyos, L.R.; Chittoori, B. Evaluation of Swell Behavior of Expansive Clays from Internal Specific Surface and Pore Size Distribution. J. Geotech. Geoenvironmental Eng. 2016, 142, 04015080. [Google Scholar] [CrossRef]
- Sergeyev, Y.M.; Grabowska, O.B.; Osipov, V.I.; Sokolov, V.N.; Kolomenski, Y.N. The classification of microstructures of clay soils. J. Microsc. 1980, 120, 237–260. [Google Scholar] [CrossRef]
- Yin, P.; Vanapalli, S.K. Model for predicting evolution of microstructural void ratio in compacted clayey soils. Can. Geotech. J. 2022, 59, 1602–1621. [Google Scholar] [CrossRef]
- Nguyen, V.; Pineda, J.A.; Romero, E.; Sheng, D. Influence of soil microstructure on air permeability in compacted clay. Géotechnique 2021, 71, 373–391. [Google Scholar] [CrossRef]
- Wei, T.; Fan, W.; Zhou, Y.; Deng, L.; Wu, Z.; Wei, Y. Quantification of the spatial-temporal evolution of loess microstructure from the Dongzhi tableland during shearing. Eng. Geol. 2023, 323, 107213. [Google Scholar] [CrossRef]
- Trzciński, J.; Wójcik, E. Application of microstructure classification for the assessment of the variability of geological-engineering and pore space properties in clay soils. Open Geosci. 2019, 11, 236–248. [Google Scholar] [CrossRef]
- Zheng, Y.M.; Sun, H.; Hou, M.X.; Ge, X.R. Microstructure evolution of soft clay under consolidation loading. Eng. Geol. 2021, 293, 106284. [Google Scholar] [CrossRef]
- Emami, S.; Negahdar, A.; Zarei, M. Investigating the Influence of the Leachate from the Municipal Solid Waste on the Mechanical and Environmental Properties of Soil around the Landfill (Case Study: The Municipal Landfill Located in Ardabil—Iran). Arab. J. Sci. Eng. 2019, 44, 8417–8428. [Google Scholar] [CrossRef]
- Guo, Y.L.; Cao, L.W.; Feng, X.H.; Liu, H. Influence of Leachate on Properties and Regions of Compacted Clay Layer: A Column Experiment. Soil Sediment Contam. Int. J. 2019, 28, 684–694. [Google Scholar] [CrossRef]
- Qi, J.F.; Yu, J.C.; Shah, K.J.; Shah, D.D.; You, Z.Y. Applicability of Clay/Organic Clay to Environmental Pollutants: Green Way—An Overview. Appl. Sci. 2023, 13, 9395. [Google Scholar] [CrossRef]
- Ari, A.; Akbulut, S. Effect of fractal dimension on sand-geosynthetic interface shear strength. Powder Technol. 2022, 401, 117349. [Google Scholar] [CrossRef]
- Dai, C.X.; Zhang, Q.F.; He, S.H.; Zhang, A.; Shan, H.F.; Xia, T.D. Variation in Micro-Pores during Dynamic Consolidation and Compression of Soft Marine Soil. J. Mar. Sci. Eng. 2021, 9, 750. [Google Scholar] [CrossRef]
- Francisca, F.M.; Glatstein, D.A. Long term hydraulic conductivity of compacted soils permeated with landfill leachate. Appl. Clay Sci. 2010, 49, 187–193. [Google Scholar] [CrossRef]
- Di, S.; Jia, C.; Ding, P.; Zhu, X. Microstructural Variation of Clay during Land Subsidence and the Correlation between Macroscopic and Microscopic Parameters. Materials 2022, 15, 1817. [Google Scholar] [CrossRef] [PubMed]
- Liu, Y.; Deng, H.; Wang, P.; Yu, S. Analysis of pore structure characteristics and strength prediction model of coarse-grained soil based on fractal theory. Environ. Earth Sci. 2023, 82, 592. [Google Scholar] [CrossRef]
- MolaAbasi, H.; Naderi Semsani, S.; Saberian, M.; Khajeh, A.; Li, J.; Harandi, M. Evaluation of the long-term performance of stabilized sandy soil using binary mixtures: A micro- and macro-level approach. J. Clean. Prod. 2020, 267, 122209. [Google Scholar] [CrossRef]
- Xiaoqin, S.; Dongli, S.; Yuanhang, F.; Hongde, W.; Lei, G. Three-dimensional fractal characteristics of soil pore structure and their relationships with hydraulic parameters in biochar-amended saline soil. Soil Tillage Res. 2021, 205, 104809. [Google Scholar] [CrossRef]
- Izdebska, M.D.; Trzciński, J. Clay soil behaviour due to long-term contamination by liquid petroleum fuels: Microstructure and geotechnical properties. Bull. Eng. Geol. Environ. 2021, 80, 3193–3206. [Google Scholar] [CrossRef]
- Ural, N. The significance of scanning electron microscopy (SEM) analysis on the microstructure of improved clay: An overview. Open Geosci. 2021, 13, 197–218. [Google Scholar] [CrossRef]
- Zeroual, A.; Bouaziz, A.; Dadda, A.; Feia, S.; Khechai, A.; Lamouri, B.; El, H.A. Experimental investigation on the desiccation cracking process in date palm fiber reinforced clayey soil using digital image correlation. Eur. J. Environ. Civ. Eng. 2024, 28, 1141–1162. [Google Scholar] [CrossRef]
- Tang, C.S.; Lin, L.; Cheng, Q.; Zhu, C.; Wang, D.W.; Lin, Z.Y.; Shi, B. Quantification and characterizing of soil microstructure features by image processing technique. Comput. Geotech. 2020, 128, 103817. [Google Scholar] [CrossRef]
- Di, R.G.; Rocchi, I.; Zania, V. New method for a SEM-based quantitative microstructural clay analysis—MiCA. Appl. Clay Sci. 2021, 214, 106248. [Google Scholar] [CrossRef]
- Liu, C.; Tang, C.S.; Shi, B.; Suo, W.B. Automatic quantification of crack patterns by image processing. Comput. Geosci. 2013, 57, 77–80. [Google Scholar] [CrossRef]
- Wang, B.J.; Shi, B.; Liu, Z.B.; Cai, Y. Fractal study on microstructure of clayey soil by GIS. Chin. J. Geotech. Eng. 2004, 26, 244–247. (In Chinese) [Google Scholar]
- Purswani, P.; Karpyn, Z.T.; Enab, K.; Xue, Y.; Huang, X. Evaluation of image segmentation techniques for image-based rock property estimation. J. Pet. Sci. Eng. 2020, 195, 107890. [Google Scholar] [CrossRef]
- Barros, W.K.P.; Dias, L.A.; Fernandes, M.A.C. Fully Parallel Implementation of Otsu Automatic Image Thresholding Algorithm on FPGA. Sensors 2021, 21, 4151. [Google Scholar] [CrossRef]
- Singh, S.; Mittal, N.; Singh, H.; Oliva, D. Improving the segmentation of digital images by using a modified Otsu’s between-class variance. Multimed. Tools Appl. 2023, 82, 40701–40743. [Google Scholar] [CrossRef] [PubMed]
- Han, N.N.; Li, S.D.; Song, Z.J. Efficient iterative thresholding algorithms with functional feedbacks and null space tuning. Signal Process. 2021, 188, 108199. [Google Scholar] [CrossRef]
- Lee, H.S.; In Cho, S. Spatial color histogram-based image segmentation using texture-aware region merging. Multimed. Tools Appl. 2022, 81, 24573–24600. [Google Scholar] [CrossRef]
- Wang, G.; Peng, B.; Feng, Z.Y.; Yang, X.Y.; Deng, J.; Wang, N.C. Adaptive filtering based on recursive minimum error entropy criterion. Signal Process. 2021, 179, 107836. [Google Scholar] [CrossRef]
- Meidani, K.; Hemmasian, A.; Mirjalili, S.; Barati, F.A. Adaptive grey wolf optimizer. Neural Comput. Appl. 2022, 34, 7711–7731. [Google Scholar] [CrossRef]
- Yan, J.H.; Zhang, L.; Luo, X.H.; Peng, H.; Wang, J. A novel edge detection method based on dynamic threshold neural P systems with orientation. Digit. Signal Process. 2022, 127, 103526. [Google Scholar] [CrossRef]
- Cao, L.W. Study on the Influence of Leachate on the Geotechnical Properties of Liner System. Doctoral Dissertation, China University of Mining and Technology, Xuzhou, China, 2006. (In Chinese). [Google Scholar]
- Hao, J.T. Properties and Stability Evaluation of Life Source Polluted Foundation Soil. Master Graduation Thesis, China University of Mining and Technology, Xuzhou, China, 2018. (In Chinese). [Google Scholar]
- Li, Y.Q.; Ma, J.W.; Ren, Y.Q.; Li, Y.J.; Yue, D.B. Calcium leaching characteristics in landfill leachate collection systems from bottom ash of municipal solid waste incineration. J. Environ. Manag. 2021, 280, 111729. [Google Scholar] [CrossRef]
- Wijekoon, P.; Koliyabandara, P.A.; Cooray, A.T.; Lam, S.S.; Athapattu, B.C.L.; Vithanage, M. Progress and prospects in mitigation of landfill leachate pollution: Risk, pollution potential, treatment and challenges. J. Hazard. Mater. 2022, 421, 126627. [Google Scholar] [CrossRef]
- Liu, C.; Shi, B.; Zhou, J.; Tang, C.S. Quantification and characterization of microporosity by image processing, geometric measurement and statistical methods: Application on SEM images of clay materials. Appl. Clay Sci. 2011, 54, 97–106. [Google Scholar] [CrossRef]
- Song, S.B.; Liu, J.F.; Ni, H.Y.; Cao, X.L.; Pu, H.; Huang, B.X. A new automatic thresholding algorithm for unimodal gray-level distribution images by using the gray gradient information. J. Pet. Sci. Eng. 2020, 190, 107074. [Google Scholar] [CrossRef]
- Anitha, J.; Pandian, S.I.A.; Agnes, S.A. An efficient multilevel color image thresholding based on modified whale optimization algorithm. Expert Syst. Appl. 2021, 178, 115003. [Google Scholar] [CrossRef]
- Liao, J.; Wang, Y.; Zhu, D.; Zou, Y.; Zhang, S.; Zhou, H. Automatic Segmentation of Crop/Background Based on Luminance Partition Correction and Adaptive Threshold. IEEE Access 2020, 8, 202611–202622. [Google Scholar] [CrossRef]
- Tang, C.S.; Shi, B.; Wang, B.J. Factors affecting analysis of soil microstructure using SEM. Chin. J. Geotech. Eng. 2008, 4, 560–565. (In Chinese) [Google Scholar]
- Song, C.; Elsworth, D.; Zhi, S.; Wang, C. The influence of particle morphology on microbially induced CaCO3 clogging in granular media. Mar. Georesources Geotechnol. 2021, 39, 74–81. [Google Scholar] [CrossRef]
- Weinhardt, F.; Deng, J.; Hommel, J.; Vahid Dastjerdi, S.; Gerlach, R.; Steeb, H.; Class, H. Spatiotemporal Distribution of Precipitates and Mineral Phase Transition During Biomineralization Affect Porosity–Permeability Relationships. Transp. Porous Media 2022, 143, 527–549. [Google Scholar] [CrossRef]


Disclaimer/Publisher’s Note: The statements, opinions and data contained in all publications are solely those of the individual author(s) and contributor(s) and not of MDPI and/or the editor(s). MDPI and/or the editor(s) disclaim responsibility for any injury to people or property resulting from any ideas, methods, instructions or products referred to in the content. |
© 2024 by the authors. Licensee MDPI, Basel, Switzerland. This article is an open access article distributed under the terms and conditions of the Creative Commons Attribution (CC BY) license (https://creativecommons.org/licenses/by/4.0/).