Article

Cause Analysis and Preventive Measures against False Bottoms in Echosounder Data

1
Key Laboratory of Fisheries Remote Sensing, Ministry of Agriculture and Rural Afairs, East China Sea Fisheries Research Institute, Chinese Academy of Fishery Sciences, Shanghai 200090, China
2
School of Navigation and Naval Architecture, Dalian Ocean University, Dalian 116023, China
3
Laoshan Laboratory, Qingdao 266237, China
*
Author to whom correspondence should be addressed.
Appl. Sci. 2024, 14(6), 2444; https://doi.org/10.3390/app14062444
Submission received: 18 January 2024 / Revised: 25 February 2024 / Accepted: 8 March 2024 / Published: 14 March 2024
(This article belongs to the Section Electrical, Electronics and Communications Engineering)

Abstract

:
This article presents a summary of three common false-bottom occurrences in echosounder imaging based on an analysis of echosounder data. Utilizing the imaging principle of the echosounder, a comprehensive analysis was conducted and an explanation of each situation’s causes, imaging characteristics, impacts, and solutions is presented. Additionally, the article includes calculations to determine the precise location of the false bottom, which were subsequently validated through actual data collection. To address the two most impactful false-bottom scenarios in target detection, solutions are proposed from two perspectives. By accurately judging the position and imaging characteristics of these false bottoms, the article concludes with an analysis of the causes of false bottoms and presents corresponding solutions. The article aims to facilitate the rapid identification and elimination of false bottoms, thus mitigating their adverse effects on target detection.

1. Introduction

In 1906, Lewis Nixon invented the first sonar receiving device for the purpose of detecting icebergs [1]. With the outbreak of World War I, sonar technology garnered significant interest from researchers. After nearly a century of progress, sonar technology has become increasingly comprehensive [2,3], and numerous detection devices based on sonar technology have emerged and are now widely utilized in diverse fields, such as scientific research, fisheries, and military operations [4,5,6,7,8,9]. The advancement of sonar technology not only enhances productivity in activities like aquaculture and fishing [10,11], but also enriches research methodologies for studying aquatic organisms and conducting geological exploration [12,13]. With the increasing prevalence of sonar technology, research in this field is also expanding, incorporating successful applications that combine sonar technology with emerging areas like artificial intelligence [14,15]. These synergistic developments significantly propel the advancement of sonar technology, enabling it to better serve current production processes and research endeavors.
Although advancements have been made in the application process, the use of echosounders to determine underwater positions still poses certain challenges, specifically, misleading seabed echoes that mask fish echoes. Misleading seabed echoes can occur when the echosounders employed to detect underwater objects erroneously detect the presence of a seabed that does not actually exist. This issue can compromise the accuracy and reliability of imaging technology, warranting attention and potentially leading to improvements in the field [16]. Indeed, the issue of false bottoms has been a topic of discussion among scholars since as early as 2002 [17]. However, previous studies on false bottoms were limited in terms of their data sources and comprehensiveness. These studies relied solely on echosounder data from a single water body, failing to provide a comprehensive summary of the common occurrences of false bottoms. Subsequently, several relevant articles have addressed the phenomenon of false bottoms [18]; however, none have conducted a thorough analysis of the various situations in which false bottoms can arise.
This article addresses the limitations associated with single small-batch sampling data by providing a comprehensive summary of the various situations in which false bottoms occur. The study utilized a large dataset of echosounder data from different periods to analyze the problem of false bottoms from multiple perspectives and the analysis included an exploration of the factors contributing to their formation, their imaging characteristics, their impact, and potential solutions. Misleading seabed echoes are categorized into three distinct types, and the relationship is calculated between the maximum detection and the true depth of the seabed in each situation. Furthermore, the specific locations and intensities of each type of false bottom are determined, and preventive solutions based on sound transmission characteristics are proposed. By investigating false bottoms in echosounder imaging, we aim, in this study, to enhance the reliability and efficiency of echosounder detection, while facilitating its broader application in scientific research, fisheries, and related fields [17,19].

2. Materials and Methods

2.1. Material Sources

All data in this study were sourced from a scientific echosounders of water acoustic instruments, which can be operated using multiple transceivers of different frequencies. The echosounder frequency of the data analyzed in this article was 38 kHz. The data collection period lasted from 23 January 2023 to 16 June 2023; the data were collected by the Antarctic krill vessel, Deep Blue, in the 48.1 Antarctic krill fishing zone. We used Echoview software (V 8.0.92) to read the raw data information, and we used Python 3.10 to analyze the data. The main package used for parsing was Echopype; the exploit IDE was PyCharm 2022.3.

2.2. The Working Principle and Imaging Principle of the Echosounder

The echosounder [20] operates by emitting sound signals in a directed manner through a transmitter and subsequently receiving echo signals. When the emitted signal encounters a target or object, it generates a significant echo signal [21]. By recording the intensity and time of the echo and implementing various data-processing steps, such as amplification, filtering, and denoising [22,23,24,25], the echosounder can calculate the position and size of the target, as well as other relevant information. In echosounder imaging, the processed echo intensity data (dB) are depicted as a grayscale or thermal map, thereby generating a two-dimensional echosounder image. Each pixel in the image represents the reflection intensity of the target at the corresponding location, providing a visual representation of the target’s shape, position, size, and other characteristics [26,27].

2.3. The Influence of False Bottoms on Echosounder Detection and Its Causes

The term “false bottom” refers to a spurious representation of the ocean floor. Within echosounder images, false bottoms exhibit continuity and certain thickness characteristics, resembling the actual bottom. These false bottoms can significantly impede the accurate determination of the bottom position. Moreover, if a false-bottom image appears above the actual bottom, it can be erroneously identified as an echosounder image of the target object, thereby compromising the accuracy and reliability of echosounder detection. However, false bottoms do not manifest randomly or spontaneously. They typically arise due to the reception of multiple reflections, primarily secondary reflections, by the echosounder’s receiver, resulting in detection-related effects. Additionally, a false bottom can originate from the reception of echo signals occurring beyond the detection range. Common false bottoms can be categorized into the following three types [17]:

2.3.1. The Second Reflection of the Same Ping Signal Forms a False Bottom

One possible cause of the formation of a false bottom is the occurrence of two reflections of the bottom echo being received by the receiver during an echosounder reception cycle. This leads the receiver to perceive the two reflections as a single reflection echo signal originating from the false bottom’s location (see Figure 1a). Consequently, the time for the receiver to receive the signal for one cycle can be expressed as follows:
t m = 2 d m v
2 d r 1 = v t r 1
where the propagation speed of sound waves in seawater is denoted by v , t m is each ping during the cycle duration, d m is the maximum detection depth, t r 1 is the time of the true-bottom echo transmission of the first type, and d r 1 is the seabed depth of the first type.
Within a signal cycle, two reflections of the bottom echo are received by the receiver; therefore, the following equation can be used:
t f 1 = 2 t r 1
where t f 1 is the sonar transmission time of the formation of the first type of false bottom. The receiver should be able to receive the secondary echo signal within one cycle, and the following requirement must be met:
t m > t f 1
It is not difficult to derive the following equation from the above formula:
d r 1 < d m 2
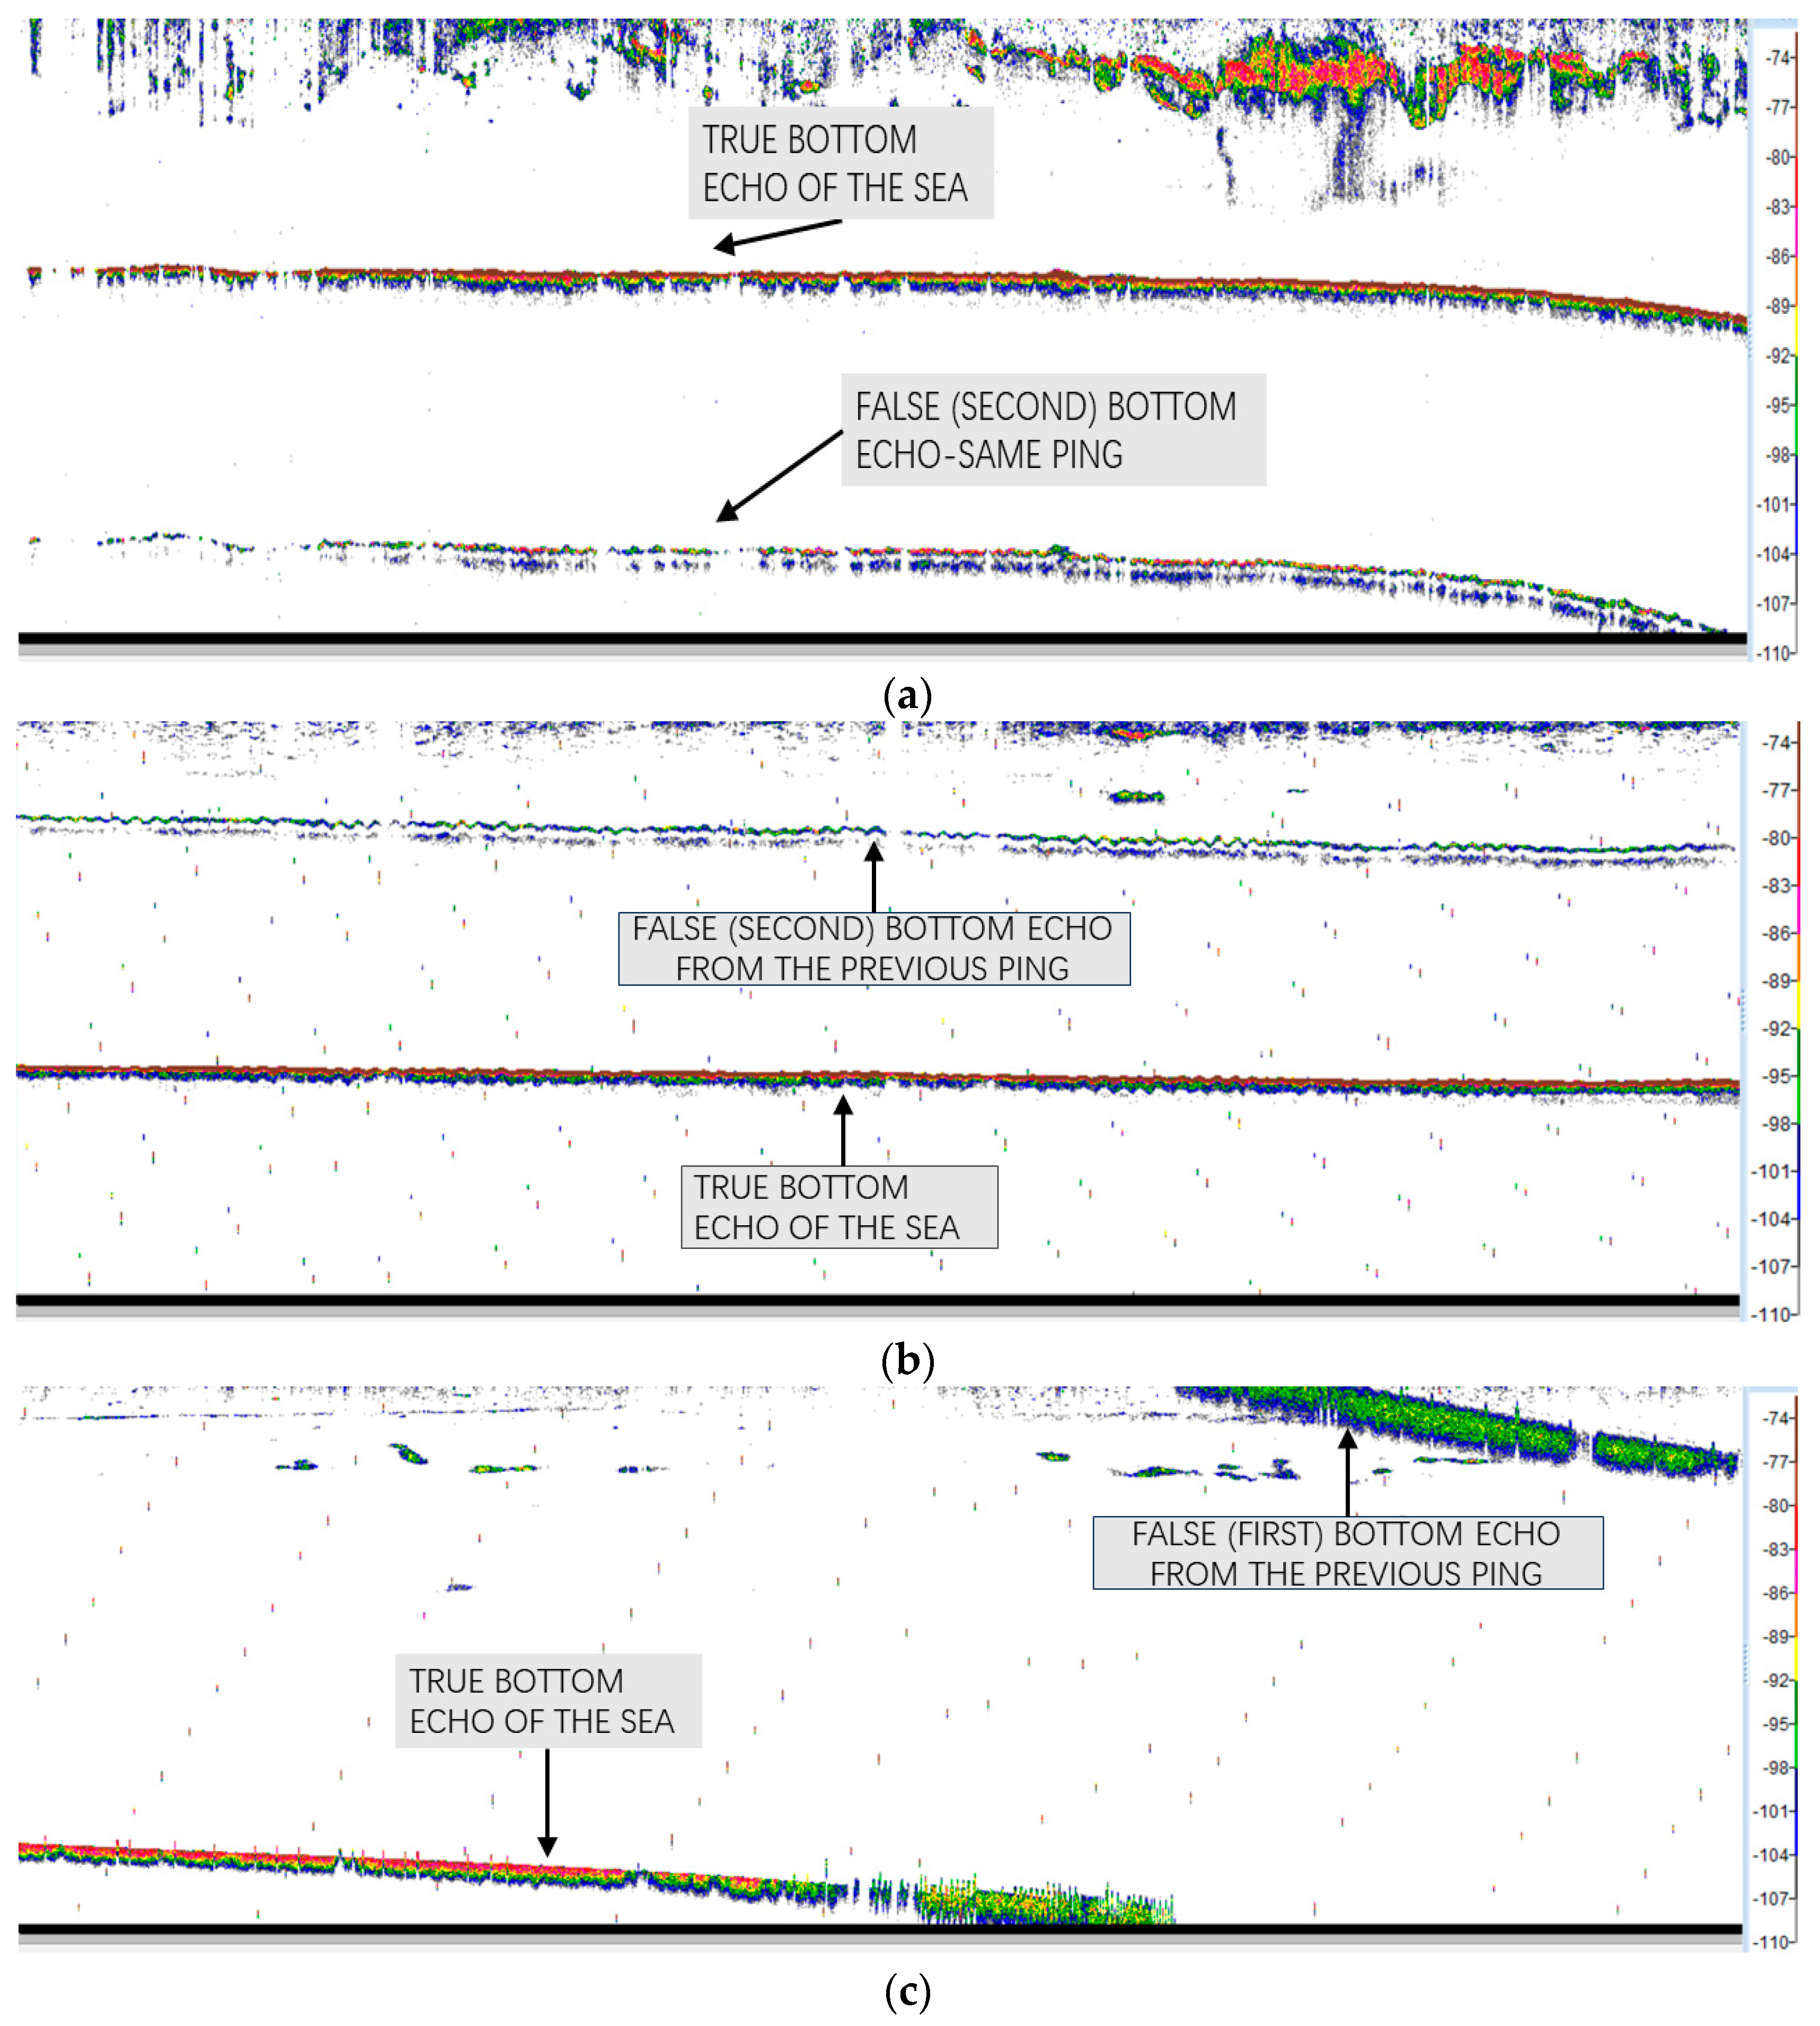
It is apparent from Formula (5) that the second reflection of the same ping signal generates a false bottom, where the true depth of the seabed ( d r 1 ) must be less than half of the maximum detection depth ( d m ), as depicted in Figure 2a of the echosounder image. The false-bottom echo, compared with the genuine bottom echo signal, experiences two additional reflections (one from the seabed and one from the water surface) and travels a greater distance in the water. Consequently, the acoustic signal undergoes more significant attenuation, resulting in a weaker signal being received in comparison to the actual bottom. Given the shallow depth of the genuine bottom ( d r 1 < d m 2 ), the transmission distance of the genuine bottom echo is small, yielding a relatively strong echo intensity for the bottom target. Hence, the false-bottom image can be readily distinguished. In this scenario, the depth of the false bottom is twice that of the actual bottom ( d f 1 = 2 d r 1 ). However, it is important to note that the false bottom does not occur in the same area as the target echo, and therefore does not significantly affect target detection.

2.3.2. The First Ping Echo Signal Is Reflected Twice to Form a False Bottom on the Second Ping

A false bottom can also be formed by the first ping echo signal having two reflections, resulting in the formation of a false bottom during the second ping. This principle is illustrated in Figure 1b. The formation process occurs when the receiver partially receives the true-bottom echo after the first reflection, resulting in the presence of a genuine bottom echo in the echosounder image. Subsequently, the remaining echo signals are reflected at the water surface and then once more at the bottom before being received by the receiver in the subsequent cycle. Mistakenly, these echoes are perceived as signals that were emitted by the echosounder in the next cycle, consequently creating a false bottom. In this case, the transmission interval t v between the two ping signals is as follows:
t v = t m + t i
From Figure 1b, it is evident that the false bottom occurs upon the second ping signal.
2 d f 2 = v t f 2 = v ( 2 t r 2 t v )
d f 2 = 2 d r 2 d m v t i 2
where d f 2 is the false-bottom depth of the second type, d r 2 is the seabed depth of the second type, and t f 2 is the time between the start of the second ping and the arrival of the second bottom echo from the previous ping. In this case, the true-bottom echo will appear in the current ping echosounder image, so the following equation holds:
d m > d r 2
The depth of the false bottom ( d f 2 ) is greater than zero, and the interval ( t i ) between the adjacent ping-receiving cycles is also greater than zero. Using Formula (8), we can conclude that this false-bottom scenario occurs when the actual depth ( d r 2 ) of the seabed is greater than half of the maximum detection depth ( d m ) and less than the maximum detection depth. The true echo signal of the seabed will appear in the first ping, and the secondary echo signal of the seabed will be received by the receiver in the next cycle, which is then considered to be the signal echo of the subsequent cycle. Consequently, a false-bottom image is formed at the corresponding depth ( d f 2 ) in the second signal cycle. The specific presentation of this phenomenon in echosounder images is illustrated in Figure 2b.
Compared with the real-bottom echo situation, the false-bottom signal has two more reflections (one seabed reflection and one water-surface reflection), and travels farther in the water, resulting in greater loss of acoustic signal and a weaker received signal. However, this false-bottom signal will be randomly distributed above the real seabed, and in the detection of fishery resources, the depth range in which the target object appears is approximately the same. If the influence of the false bottom is ignored, the false-bottom signal will be mistaken for the target object, resulting in detection errors. Therefore, it is necessary to avoid the occurrence of such false bottoms.

2.3.3. The Bottom Echo Signal Outside the Detection Range of the Previous Ping Forms a False Bottom in the Next Ping

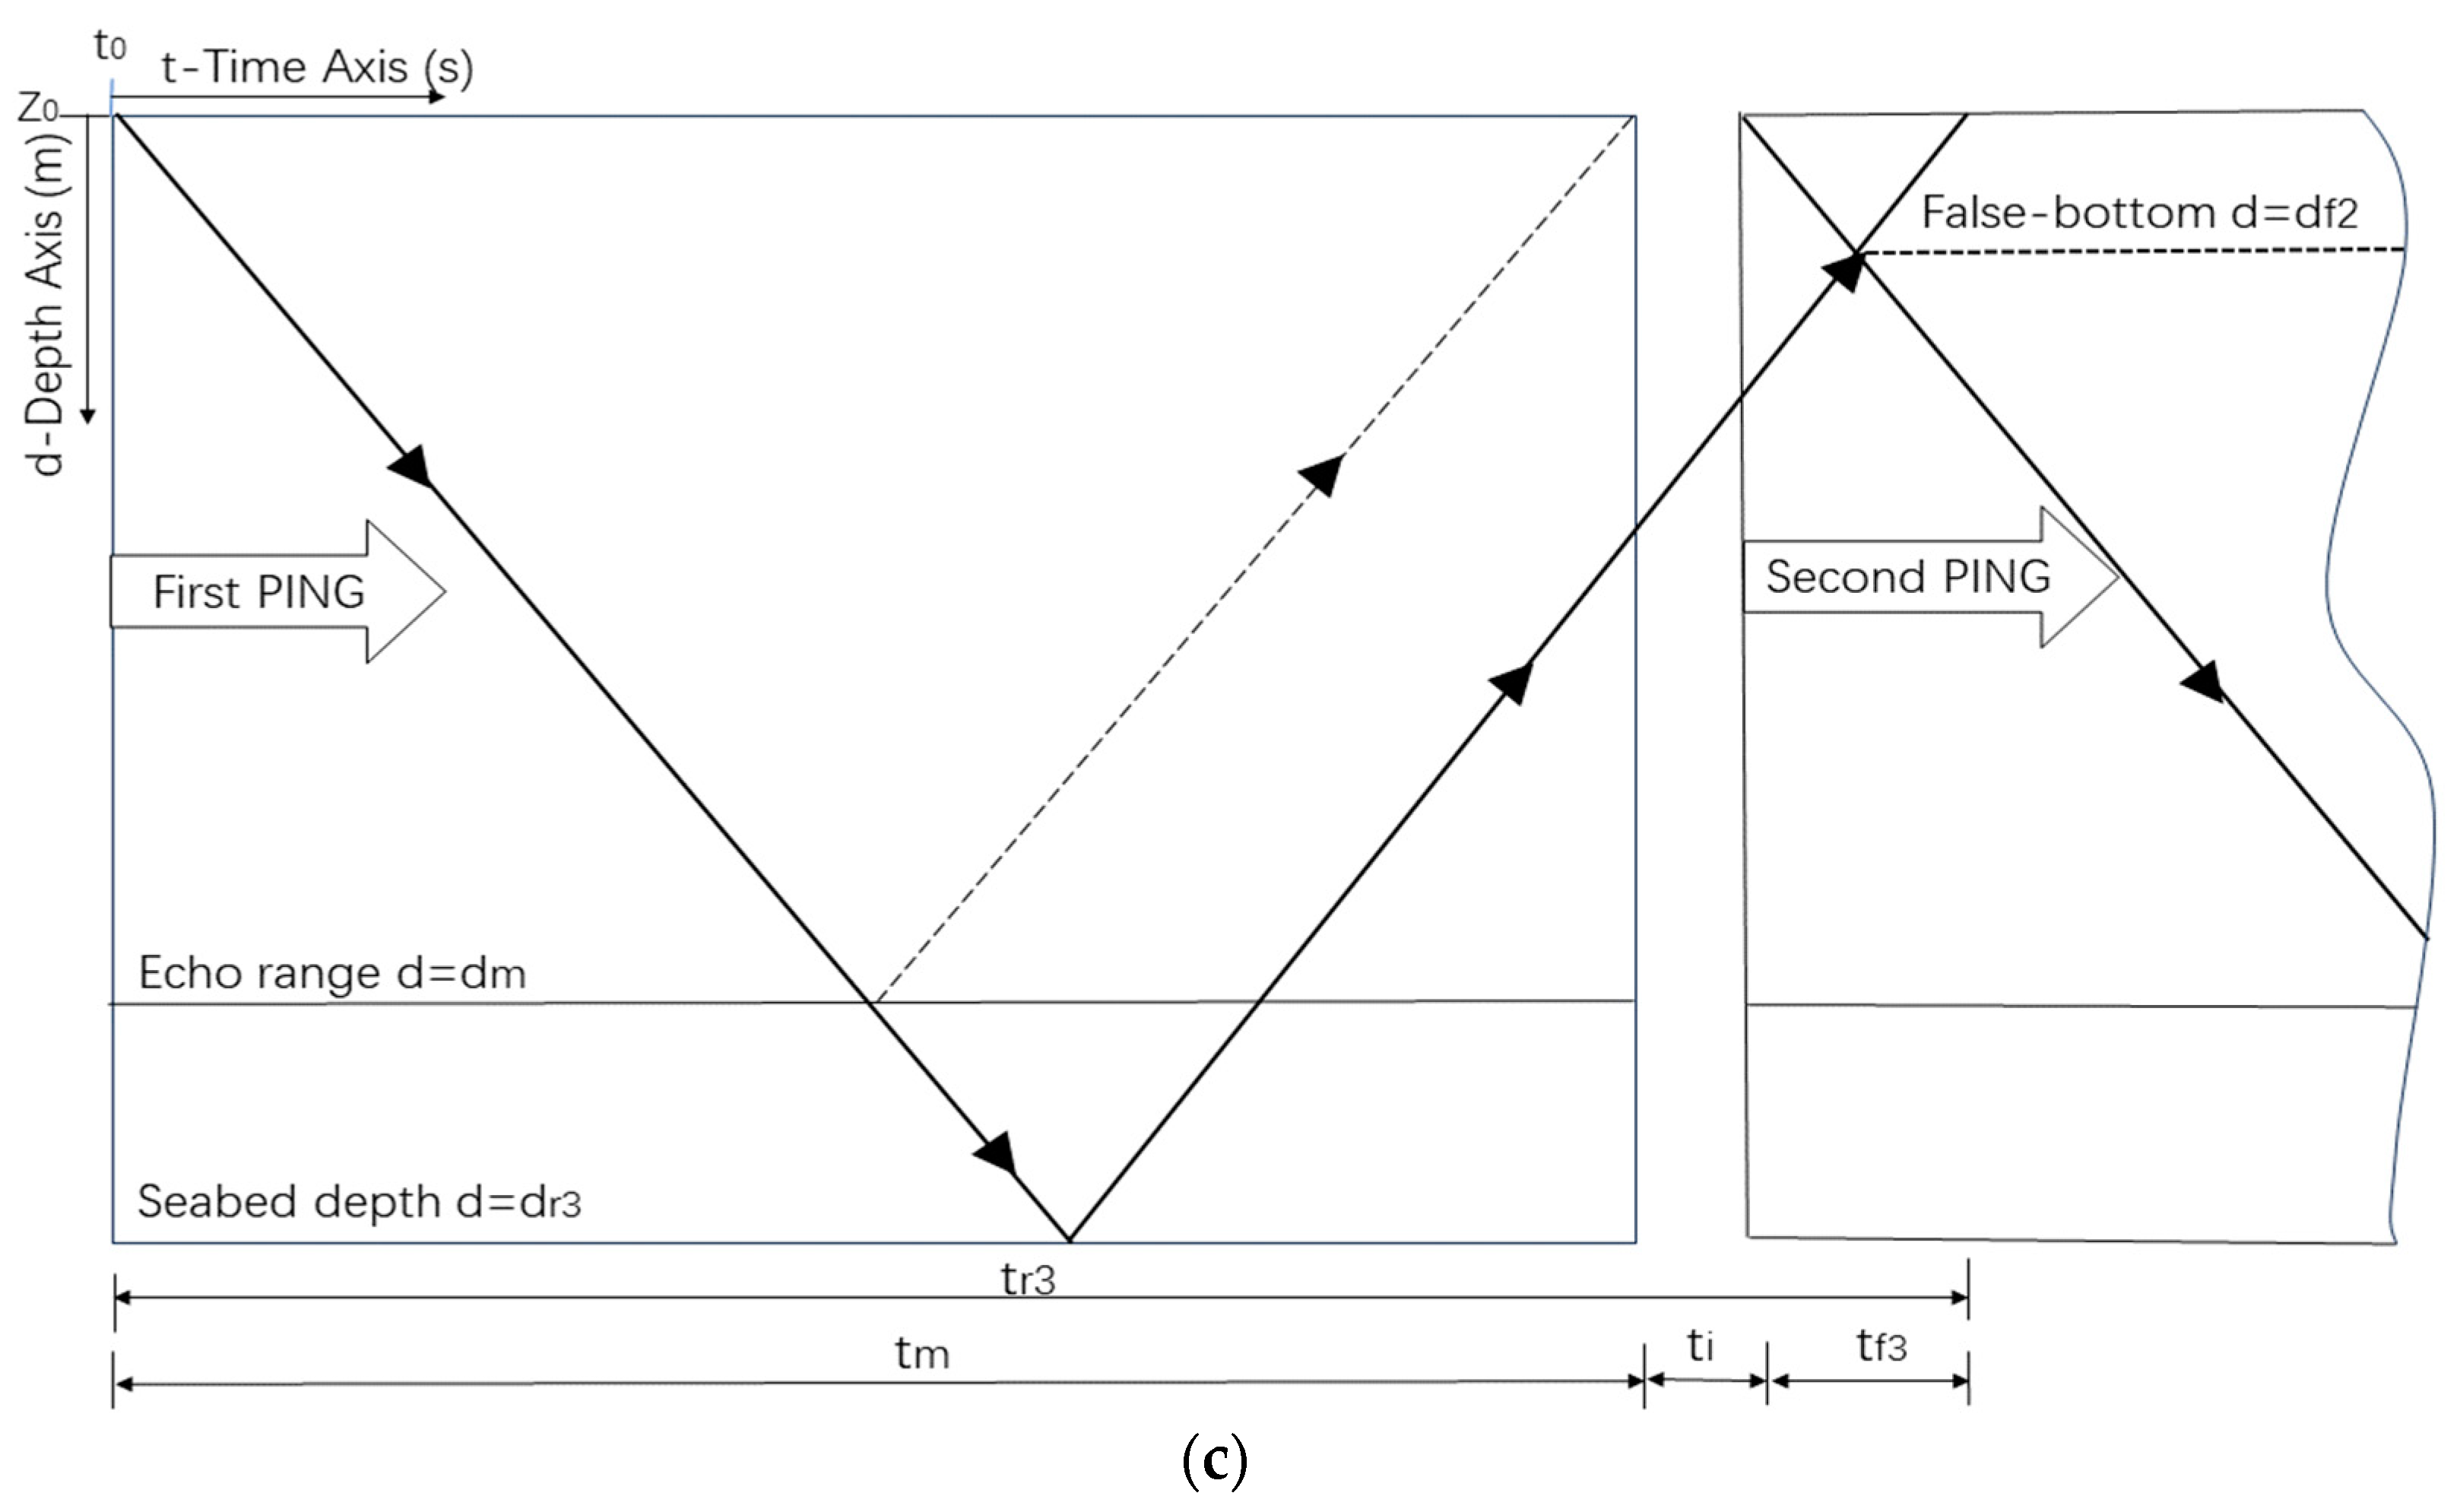
In this case (Figure 1c), the true-bottom depth exceeds the maximum detection depth. However, in the actual detection process, the echosounder’s reflection still appears in the echosounder image under specific circumstances.
Using Formula (6), the transmission interval between two consecutive ping signals ( t v ) can be calculated. When the echosounder reflects off the true bottom at a depth greater than the maximum detection range, the echo’s reflection time extends beyond one complete reception cycle. If a false bottom is present, the echo signal will be received by the receiver in the subsequent cycle. Hence, in such instances, the seabed depth must satisfy the following conditions:
t v + t m > 2 d r 3 v > t v
where t v is the time between two consecutive ping signals, and t m is each ping received during one cycle. Multiplying both sides by v 2 at the same time yields the following:
2 d m + v t i 2 > d r 3 > d m + v t i 2
The depth of the false bottom is as follows:
d f 3 = v t f 3 2 = v ( t r 3 t m t i ) 2 = d r 3 d m v t i 2
From the echosounder image (Figure 2c), it becomes evident that, when the bottom depth ( d r 3 ) satisfies the conditions ( 2 d m + v t i 2 > d r 3 > d m + v t i 2 ), there is potential for the formation of a false bottom, where the bottom echo is generated beyond the detection range. In the aforementioned scenario, as the true-bottom depth surpasses the maximum detected bottom, the echo signal at the bottom of the ping is absent in the current ping. Determining the trend of the bottom depth necessitates combining the preceding and subsequent echosounder images. As shown in Figure 2c, the bottom depth continues to deepen until it disappears after surpassing the maximum detection depth. At the interruption point, the true-bottom depth equates to the maximum detection depth, and the depth further increases. In the dataset selected for this study, t i is relatively small. After exceeding the maximum detection depth, a false bottom begins to emerge at a depth of 0 (Formula (12)). Consequently, in the echosounder image, any continuous image that appears from a depth of 0 after surpassing the maximum detection depth can be classified as a false bottom. Relying solely on observations of false bottoms during the detection process can result in mistaking false-bottom images as either a cluster of fish or the true bottom. Thus, it is imperative to avoid such misinterpretations in practical use.
It is important to acknowledge that false bottoms may also arise in other circumstances. Nevertheless, through extensive observations and analyses of numerous echosounder data, the occurrence of false bottoms in these other situations was found to be exceptionally rare. Accordingly, further elucidation of these occurrences will not be provided in this article.

2.4. Verification of the Correctness of the Formula Derivation

To verify the correctness of the formula derivation, we randomly selected echosounder data that included the first two instances of false bottom from the collected dataset for further analysis. The parsed data are a two-dimensional position depth table. Therefore, the depth value corresponding to the Nth echo point can be calculated using the following expression:
d N = N d m M
where d N is the depth corresponding to the Nth echo point and d m is the maximum detection depth, which represents the deepest point that can be detected. By combining the echosounder data with echo maps, the approximate region of the actual bottom and false bottom is identified. The actual position of the false bottom is then calculated using Formula (13). This calculated position is compared with the position derived from the aforementioned formula to validate the accuracy of the derivation.

3. Results

A total of 200 Type 1 and 200 Type 2 false-bottom echosounder data were selected for analysis. The actual depth of the false bottom and true bottom in the image was calculated utilizing the false-bottom calculation formula derived in the article to determine the theoretical depth. Subsequently, a comparison was made between the actual depth of the true and false bottoms, and the theoretical depth of the false bottom. The obtained results are presented as Table 1.
The experimental results obtained by calculating the error of the false-bottom depth using the formula are clearly illustrated in the Table 1. It can be observed that the difference between the theoretical false-bottom depth and the actual false-bottom depth is minimal. When comparing the calculated false-bottom depth obtained using the formula with the actual false-bottom depth, both types exhibit data errors below 2% in over 90% of cases, with only a few instances exceeding 5% error. These findings demonstrate that Formulas (2) and (8), derived from the theory used for calculating false-bottom depth, are generally consistent with the actual results, satisfying the requirements for practical use.
In the scenario of a third pseudo-bottom, the depth of the true bottom extends beyond the range of the echo detector, rendering the determination of the actual depth impossible. Nevertheless, valuable insights were gleaned from extensive observations of the echosounder data, resulting in the formulation of the following rules. The appearance of the third type of false bottom coincides with the gradual deepening of the true bottom, surpassing the detection range, and disappears as the true bottom gradually becomes shallower, returning to within the detection range. The theoretical conditions for the occurrence of the third type of false bottom align with empirical observations, wherein false bottoms typically originate at a depth of 0, consistent with real-world scenarios. While the calculation formula for the third depth satisfies the theoretical requirements, further verification is necessary before its implementation in practical production.
We suggest carrying out multiple tests in the same water area. First, a researcher should measure the depth of the water area; then, they should adjust the maximum detection depth so that the maximum detection depth is less than the depth of the water area. Observing the depth of the false bottom in the image, the true-bottom depth can be inserted into the derived formula to obtain a set of false-bottom depth data. The results can be compared with the false-bottom depth obtained from the corresponding position experiment to verify the correctness of the derivation.

4. Discussion

False bottoms in echosounder data can be addressed in two stages: pre-acquisition and post-acquisition. Post-processing techniques, such as filtering and removing false bottoms, have been extensively studied by scholars [16,28,29]. However, these methods can sometimes lead to the loss of critical information and induce identification errors in specific situations, such as the occurrence of seabed faults or measurements that exceed the detection range [30]. To mitigate false-bottom occurrences and ensure data integrity, in this article we propose two collection-stage schemes that effectively prevent false bottoms and ensure data preservation.

4.1. Comparison of High-Frequency and Low-Frequency Signals

In the aforementioned cases, when the receiver picks up the echo signal that is creating a false bottom, it travels a greater distance compared with the true-bottom echo. Combining the absorption loss characteristics of sound propagation [31], the following equation can be derived:
T L 2 = α x
where T L 2 represents the propagation loss resulting from medium absorption, as indicated by the absorption coefficient, and x represents the propagation distance. It is important to note that, under identical conditions, the absorption loss of propagation increases in proportion to the propagation distance.
α = A S f r f 2 f r 2 + f 2 + B f 2 f r ( d B / k m )
where A = 2.03 × 10⁻², B = 2.94 × 10⁻², S is the salinity (‰), f is the frequency of the sound wave (kHz), and f r is the relaxation frequency (kHz). In the same medium, at the same temperature and the same propagation distance, there is a positive correlation between the acoustic propagation loss and the acoustic frequency, suggesting that high-frequency signals attenuate more quickly during propagation [32,33]. All input data in this study were obtained from an underwater acoustic instrument called the Scientific Echosounder [34], which is a high-precision, single-beam, multi-frequency detection echosounder for marine organisms. It can be operated using multiple transceivers of different frequencies, allowing for the simultaneous use of multiple band pulses by combining high-frequency signals that experience faster attenuation during propagation. The use of high-frequency pulse signals effectively suppresses false-bottom occurrences without compromising target and bottom recognition. However, it is important to note that, due to the significant loss that occurs during high-frequency signal transmission, weak echo signals may not be detected. Thus, while this approach successfully eliminates false bottoms, it may decrease echo intensity resolution due to the high audio frequency that is emitted.

4.2. Increasing the Time Interval between Adjacent Signal Reception Cycles

False-bottom formation is caused by echo disorder. A false bottom is generated during a signal cycle when the second reflection of the same ping signal experiences disorder between the second echo at the bottom and the actual bottom echo signal [18]. In this scenario, the area in which the target object appears (above the seabed) does not overlap with the area in which the false bottom emerges (below the seabed); thus, it does not affect the target object detection. However, the areas in which the other two false bottoms occur overlap with the areas where the target object appears, meaning that they must be avoided during data collection. Both types of false bottom result from echo disturbance between adjacent signal cycles, in line with the principle of false-bottom formation. Specifically, these false bottoms are caused by the echo signal from the previous cycle, which is collected during the current cycle’s signal acquisition stage. To prevent mutual interference between adjacent periods, the time interval between the two signal acquisition cycles ( t i ) can be increased, further attenuating the previous cycle’s echosounder signal in water [19]. However, increasing the time interval will reduce the temporal resolution of the echosounder; therefore, the accuracy must meet the required standards when implementing this approach.

5. Conclusions

Echosounders are important tools for fishery resource assessment, with a wide range of applications in fisheries [35,36,37,38]. Understanding the working principles of echosounders is crucial for effectively addressing any problems that are encountered. False bottoms are a common issue when using echosounders for target detection, making the study of false bottoms essential for improving detection accuracy.
This study encompasses a large dataset of echosounder data to identify and analyze three common false-bottom situations. It provides a detailed analysis and explanation of the causes, imaging characteristics, impacts, and solutions for each situation. The study also calculates the locations of false bottoms. Moreover, a plan is proposed to prevent the occurrence of false bottoms based on the principle of false-bottom formation and the characteristics of echosounder propagation, which enhances the reliability of echosounder detection.
We compared our research with the existing research [16,17,39,40]. Our study is unique in starting from the principle of false-bottom formation, categorizing common false bottoms into three situations, and analyzing echosounder false bottoms from multiple dimensions, such as the causes, characteristics, and impacts. This study avoids making generalizations about false bottoms by providing a clear and accurate classification. The differentiation of false-bottom types allows for corresponding prevention and elimination plans to be established for each type, surpassing the limitations of traditional research. Nonetheless, research on false-bottom imaging algorithms still lags behind other research [41,42,43,44].
The article’s limitations include the fact that the attempts to prevent false bottoms are limited to the collection stage, and an effective solution for processing offline echosounder data has not been presented. Only the true-bottom depth obtained from the offline echosounder data is currently used to determine the position of false bottoms and assist in their identification. Thus, there is a need for an efficient and reliable method to remove false bottoms. If an algorithm can accurately and effectively remove false bottoms, echosounders could be better applied in scientific research [45], fisheries, and other fields. However, further exploration and research are required for the development of this algorithm.

Author Contributions

X.X. and Y.D.; methodology, X.X.; software, X.X.; validation, X.X., Y.D. and R.H.; formal analysis, Z.W. (Zhongqiu Wang) and Y.W.; investigation in, Z.W. (Zuli Wu); resources, X.X. and S.Y.; data curation, X.X.; writing—original draft preparation, X.X. and R.H.; writing—review and editing, X.X.; visualization, Y.D.; supervision, Y.D. and W.F.; project administration, Y.D. and W.F.; funding acquisition, Y.D. and W.F. All authors have read and agreed to the published version of the manuscript.

Funding

This research was financially supported by the National Key Research and Development Project of China, grant No. 2023YFD2401202, and the Laoshan Laboratory, grant No. LSKJ202201801.

Data Availability Statement

The following software used in the experiment can be downloaded at: Welcome to Python.org (accessed on 10 June 2023), Software: python v3.10 [46]. The following software used in the experiment can be downloaded at: OSOceanAcoustics/echopype: Enabling interoperability and scalability in ocean sonar data analysis (github.com) (accessed on 10 June 2023), Software: Echopype v0.7.1 [47], part data be downloaded at: https://drive.google.com/drive/folders/19Jn62d_Or8MC08_-iOsxeG2PxV6LDoD2?usp=sharing (accessed on 10 February 2024).

Acknowledgments

The data collection for this study was supported by the research vessel “Deep Blue”.

Conflicts of Interest

The authors declare no conflicts of interest. The funders had no role in the design of the study; in the collection, analyses, or interpretation of data; in the writing of the manuscript; or in the decision to publish the results.

References

  1. Naik, M.; Ranade, G.; Lohani, R.B. Evolution of Sonar Survey Systems for Sea Floor Studies. Eng. Technol. J. 2017, 2, 185–195. [Google Scholar] [CrossRef]
  2. Zhang, X.; Heald, G.; Lyons, A.P.; Hansen, R.E.; Hunter, A.J. Guest editorial: Recent advances in synthetic aperture sonar technology. Electron. Lett. 2023, 59, e12881. [Google Scholar] [CrossRef]
  3. Wu, Y.; Deng, Y.; Zhang, L.; Zhang, Q.; Bao, R. Research on the development of unmanned underwater system detection technology. J. Phys. Conf. Ser. 2022, 2218, 012079. [Google Scholar] [CrossRef]
  4. Wei, Y.; Duan, Y.; An, D. Monitoring fish using imaging echosounder: Capacity, challenges and future perspective. Fish Fish. 2022, 23, 1347–1370. [Google Scholar] [CrossRef]
  5. Sánchez-Carnero, N.; Rodríguez-Pérez, D.; Llorens, S.; Orenes-Salazar, V.; Ortolano, A.; García-Charton, J. An expeditious low-cost method for the acoustic characterization of seabeds in a Mediterranean coastal protected area. Estuar. Coast. Shelf Sci. 2023, 281, 108204. [Google Scholar] [CrossRef]
  6. Shang, X.; Zhao, J.; Zhang, H. Obtaining high-resolution seabed topography and surface details by co-registration of side-scan echosounder and multibeam echo sounder images. Remote Sens. 2019, 11, 1496. [Google Scholar] [CrossRef]
  7. Bollinger, M.A.; Kline, R.J. Validating sidescan sonar as a fish survey tool over artificial reefs. J. Coast. Res. 2017, 33, 1397–1407. [Google Scholar] [CrossRef]
  8. Misund, O.A.; Aglen, A.; Frønæs, E. Mapping the shape, size, and density of fish schools by echo integration and a high-resolution sonar. ICES J. Mar. Sci. 1995, 52, 11–20. [Google Scholar] [CrossRef]
  9. Soria, M.; Fréon, P.; Gerlotto, F. Analysis of vessel influence on spatial behaviour of fish schools using a multi-beam echosounder and consequences for biomass estimates by echo-sounder. ICES J. Mar. Sci. 1996, 53, 453–458. [Google Scholar] [CrossRef]
  10. Wang, C.; Li, Z.; Wang, T.; Xu, X.; Zhang, X.; Li, D. Intelligent fish farm—The future of aquaculture. Aquac. Int. 2021, 29, 2681–2711. [Google Scholar] [CrossRef]
  11. Gerlotto, F.; Soria, M.; Fréon, P. From two dimensions to three: The use of multibeam sonar for a new approach in fisheries acoustics. Can. J. Fish. Aquat. Sci. 1999, 56, 6–12. [Google Scholar] [CrossRef]
  12. He, R.; Dai, Y.; Liu, S.; Yang, Y.; Wang, Y.; Fan, W.; Zhang, S. Application of Wavelet Transform for the Detection of Cetacean Acoustic Signals. Appl. Sci. 2023, 13, 4521. [Google Scholar] [CrossRef]
  13. Tsai, C.C.; Lin, C.H. Review and Future Perspective of Geophysical Methods Applied in Nearshore Site Characterization. J. Mar. Sci. Eng. 2022, 10, 344. [Google Scholar] [CrossRef]
  14. Steiniger, Y.; Kraus, D.; Meisen, T. Survey on deep-learning based computer vision for sonar imagery. Eng. Appl. Artif. Intell. 2022, 114, 105157. [Google Scholar] [CrossRef]
  15. Pose, S.; Reitmann, S.; Licht, G.J.; Grab, T.; Fieback, T. AI-Prepared Autonomous Freshwater Monitoring and Sea Ground Detection by an Autonomous Surface Vehicle. Remote Sens. 2023, 15, 860. [Google Scholar] [CrossRef]
  16. Blackwell, R.; Harvey, R.; Queste, B.; Fielding, S. Aliased seabed detection in fisheries acoustic data. arXiv 2019, arXiv:1904.10736. [Google Scholar]
  17. Tomczak, M.; Haffner, G.D.; Fronaes, E. False-bottom acoustic echo in mid water? A note on how to evaluate and prevent the interference. IEEE J. Ocean. Eng. 2002, 27, 870–872. [Google Scholar] [CrossRef]
  18. Renfree, J.S.; Demer, D.A. Optimizing transmit interval and logging range while avoiding aliased seabed echoes. ICES J. Mar. Sci. 2016, 73, 1955–1964. [Google Scholar] [CrossRef]
  19. Wang, S.X.; Zhang, S.M.; Dai, Y.; Wang, Y.J.; Sui, J.H.; Zhu, W.B. Study on the method of extracting fishing depth of krill using echosounder data. South. Fish. Sci. 2021, 17, 91–97. [Google Scholar]
  20. Li, Q. Digital Echosounder Design in Underwater Acoustics: Principles and Applications; Springer Science & Business Media: Berlin/Heidelberg, Germany, 2012. [Google Scholar]
  21. Carter, G.C.; Mehta, S.K.; McTaggart, B.E. Echosounder Systems. In Advanced Signal Processing; CRC Press: Boca Raton, FL, USA, 2017; pp. 381–406. [Google Scholar]
  22. Yuan, F.; Xiao, F.; Zhang, K.; Huang, Y.; Cheng, E. Noise reduction for echosounder images by statistical analysis and fields of experts. J. Vis. Commun. Image Represent. 2021, 74, 102995. [Google Scholar] [CrossRef]
  23. Zhang, H.; Cheng, J.; Tian, M.; Liu, J.; Shao, G.; Shao, S. A Reverberation Noise Suppression Method of Echosounder Image Based on Shearlet Transform. IEEE Sens. J. 2022, 23, 2672–2683. [Google Scholar] [CrossRef]
  24. Wicker, K.; Arens, E. Adaptive compensation of noise in an echosounder system. J. Acoust. Soc. Am. 1999, 105 (Suppl. S2), 973. [Google Scholar] [CrossRef]
  25. Stolojescu-Crisan, C.; Isar, A. Denoising and inpainting ECHOSOUNDER images. In Proceedings of the 2015 38th International Conference on Telecommunications and Signal Processing (TSP), Prague, Czech Republic, 9–11 July 2015; IEEE: Piscataway, NJ, USA, 2015; pp. 1–5. [Google Scholar]
  26. Kang, H. Identification of underwater objects using echosounder image. J. Inst. Electron. Inf. Eng. 2016, 53, 91–98. [Google Scholar]
  27. Tueller, P.; Kastner, R.; Diamant, R. Target detection using features for sonar images. IET Radar Sonar Navig. 2020, 14, 1940–1949. [Google Scholar] [CrossRef]
  28. Harrison, L.M.K.; Cox, M.J.; Skaret, G.; Harcourt, R. The R package EchoviewR for automated processing of active acoustic data using Echoview. Front. Mar. Sci. 2015, 2, 15. [Google Scholar] [CrossRef]
  29. Buelens, B.; Pauly, T.; Higginbottom, I. Echoview as a multibeam echosounder data processing and analysis toolkit for fisheries research. J. Acoust. Soc. Am. 2003, 114 (Suppl. S4), 2301. [Google Scholar] [CrossRef]
  30. Foote, K.G.; Knudsen, H.P.; Korneliussen, R.J.; Nordbo, P.E.; Roang, K. Postprocessing system for echo sounder data. J. Acoust. Soc. Am. 1991, 90, 37–47. [Google Scholar] [CrossRef]
  31. Liu, B.S.; Huang, Y.W.; Chen, W.J.; Lei, J.Y. Principles of Hydroacoustics, 3rd ed.; Science Press: Beijing, China, 2019; Volume 11, pp. 30–35. [Google Scholar]
  32. Pierce, A.D. Acoustics: An Introduction to Its Physical Principles and Applications; Springer: Berlin/Heidelberg, Germany, 2019. [Google Scholar]
  33. Pierce, L. Acoustics; Springer International Publishing: Cham, Switzerland, 2019. [Google Scholar]
  34. Andersen, L.N. The new Simrad EK60 scientific echo sounder system. J. Acoust. Soc. Am. 2001, 109, 2336. [Google Scholar] [CrossRef]
  35. Letessier, T.B.; Proud, R.; Meeuwig, J.J.; Cox, M.J.; Hosegood, P.J.; Brierley, A.S. Estimating pelagic fish biomass in a tropical seascape using echosounding and baited stereo-videography. Ecosystems 2022, 25, 1400–1417. [Google Scholar] [CrossRef]
  36. Langkau, M.C.; Balk, H.; Schmidt, M.B.; Borcherding, J. Can acoustic shadows identify fish species? A novel application of imaging sonar data. Fish. Manag. Ecol. 2012, 19, 313–322. [Google Scholar] [CrossRef]
  37. Jones, R.E.; Griffin, R.A.; Unsworth, R.K.F. Adaptive Resolution Imaging Echosounder (ARIS) as a tool for marine fish identification. Fish. Res. 2021, 243, 106092. [Google Scholar] [CrossRef]
  38. Terayama, K.; Shin, K.; Mizuno, K.; Tsuda, K. Integration of sonar and optical camera images using deep neural network for fish monitoring. Aquac. Eng. 2019, 86, 102000. [Google Scholar] [CrossRef]
  39. Trabant, P.K. Applied High-Resolution Geophysical Methods: Offshore Geoengineering Hazards; Springer Science & Business Media: Berlin/Heidelberg, Germany, 2013. [Google Scholar]
  40. Bourguignon, S.; Berger, L.; Scalabrin, C.; Fablet, R.; Mazauric, V. Methodological developments for improved bottom detection with the ME70 multibeam echosounder. ICES J. Mar. Sci. 2009, 66, 1015–1022. [Google Scholar] [CrossRef]
  41. Wang, J.; Li, H.; Ma, J.; Chen, B.; Xing, T.; Zhao, H. Fast double selectivity index-CFAR detection method for the multi-beam echo sounder. Mar. Geod. 2020, 43, 44–62. [Google Scholar] [CrossRef]
  42. Jiang, Y.; Yang, Z.; Liu, Z.; Yang, C. High-resolution bottom detection algorithm for a multibeam echo-sounder system with a U-shaped array. Acta Oceanol. Sin. 2018, 37, 78–84. [Google Scholar] [CrossRef]
  43. Brautaset, O.; Waldeland, A.U.; Johnsen, E.; Malde, K.; Eikvil, L.; Salberg, A.-B.; Handegard, N.O. Acoustic classification in multifrequency echosounder data using deep convolutional neural networks. ICES J. Mar. Sci. 2020, 77, 1391–1400. [Google Scholar] [CrossRef]
  44. Debese, N.; Moitié, R.; Seube, N. Multibeam echosounder data cleaning through a hierarchic adaptive and robust local surfacing. Comput. Geosci. 2012, 46, 330–339. [Google Scholar] [CrossRef]
  45. Mosca, F.; Matte, G.; Lerda, O.; Naud, F.; Charlot, D.; Rioblanc, M.; Corbières, C. Scientific potential of a new 3D multibeam echosounder in fisheries and ecosystem research. Fish. Res. 2016, 178, 130–141. [Google Scholar] [CrossRef]
  46. Python-python v3.10 Manual. Available online: https://www.python.org/ (accessed on 10 June 2023).
  47. Echopype-echopype v0.7.1 Manual. Available online: https://github.com/OSOceanAcoustics/echopype (accessed on 10 June 2023).
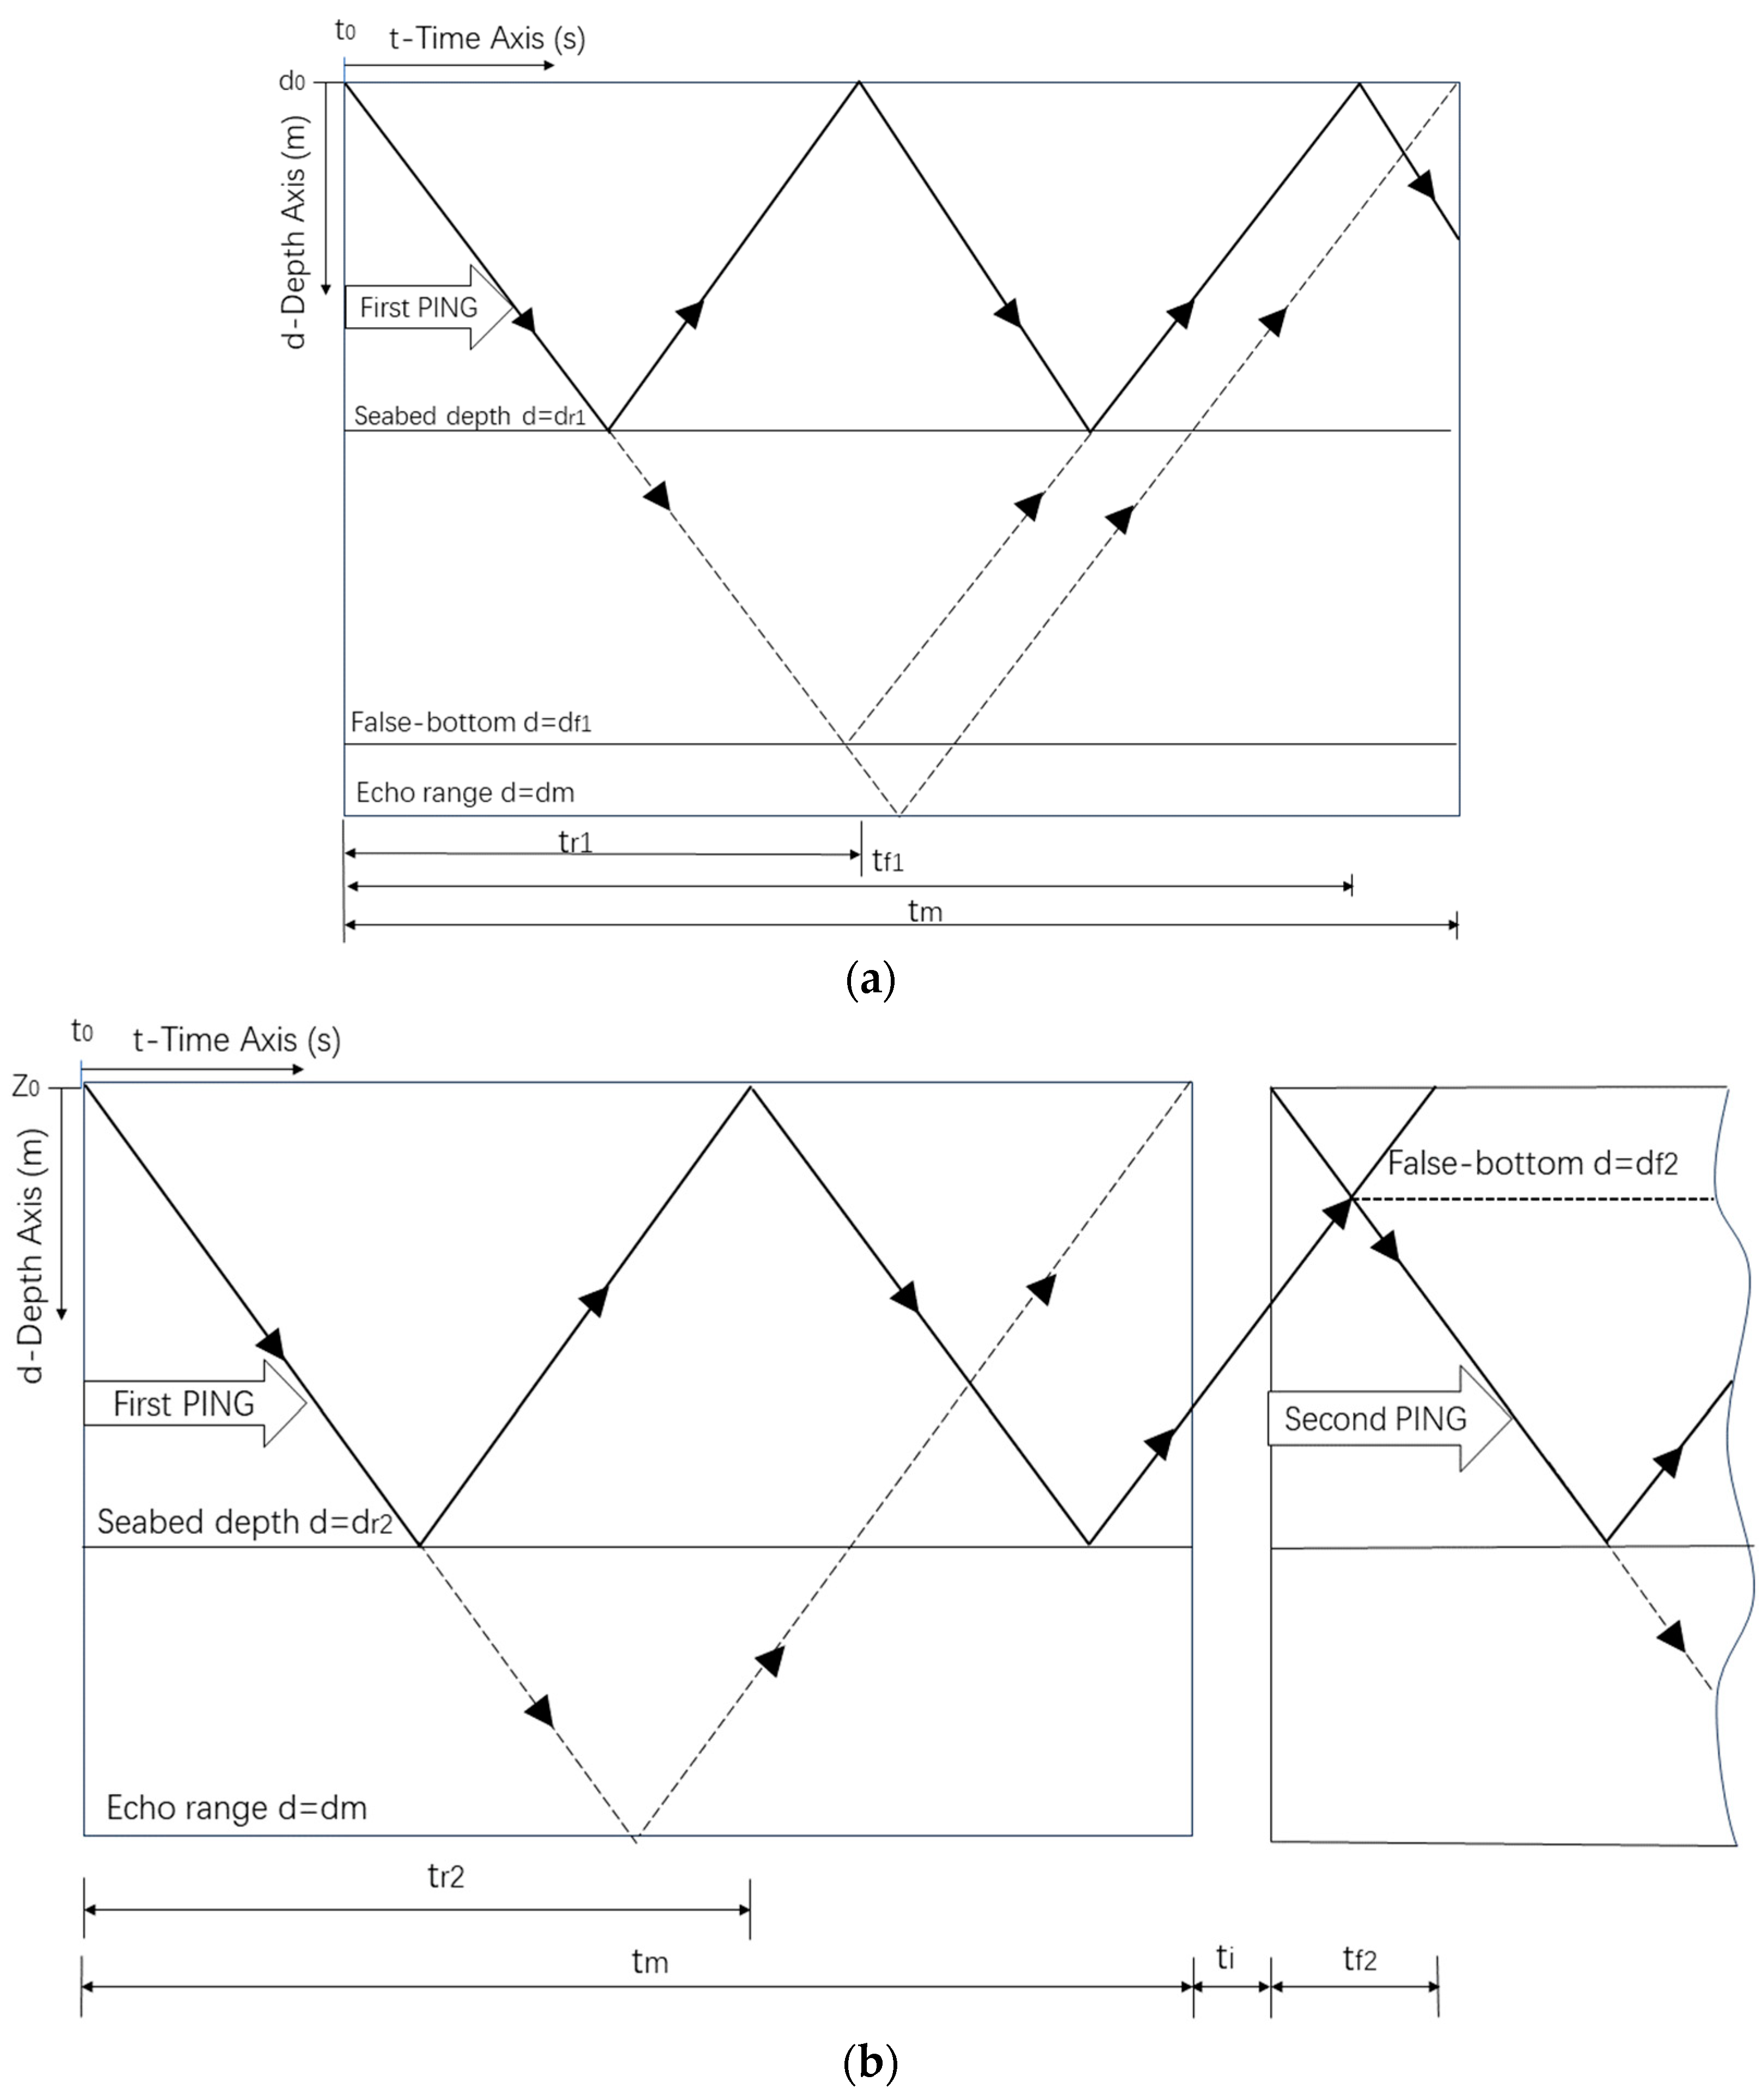
Figure 1. Sonar diagram of different types of false bottom. (a) First type. (b) Second type. (c) Third type. d 0 —sea surface depth [0 m]; d r 1 —seabed depth of first type [m]; d r 2 —seabed depth of second type [m]; d r 3 —seabed depth of third type [m]; d m —echo range [m]; d f 1 —false-bottom depth of first type [m]; d f 2 —false-bottom depth of second type [m]; d f 3 —false-bottom depth of third type [m]; t 0 —start time of first ping [0s]; t r 1 —time of arrival of the true-bottom echo of first type [s]; t r 2 —time of arrival of the true-bottom echo of second type [s]; t r 3 —time of arrival of the true-bottom echo of third type [s]; t i —interval between adjacent ping receiving cycles [s]; t m —each ping receiving cycle duration [s]; t f 1 —formation of false-bottom sonar transmission time [s]; t f 2 —time between the start of second ping and the arrival of the second bottom echo from previous ping [s]; t f 3 —time between the start of second ping and the arrival of the first bottom echo from previous ping [s].
Applsci 14 02444 g001aApplsci 14 02444 g001b
Figure 2. Target intensity (dB) echogram. (a) First type. (b) Second type. (c) Third type.
Applsci 14 02444 g002
Table 1. Experimental results of the formula’s calculation of false-bottom depth errors.
TypeParametersQuantity
First typeTotal
<2%
2%~5%
>5%
200
195
5
0
Second typeTotal
<2%
2%~5%
>5%
200
192
6
2
Disclaimer/Publisher’s Note: The statements, opinions and data contained in all publications are solely those of the individual author(s) and contributor(s) and not of MDPI and/or the editor(s). MDPI and/or the editor(s) disclaim responsibility for any injury to people or property resulting from any ideas, methods, instructions or products referred to in the content.