Article

Peak Acceleration Distribution on the Surface of Reef Islands under the Action of Vertical Ground Motion

1
Institute of Geology, China Earthquake Administration, Beijing 100029, China
2
College of Transportation Engineering, Nanjing Tech University, Nanjing 211816, China
3
State Key Laboratory of Coastal and Offshore Engineering, Dalian University of Technology, Dalian 116000, China
*
Author to whom correspondence should be addressed.
Appl. Sci. 2024, 14(6), 2515; https://doi.org/10.3390/app14062515
Submission received: 12 January 2024 / Revised: 2 March 2024 / Accepted: 13 March 2024 / Published: 16 March 2024
(This article belongs to the Section Marine Science and Engineering)

Abstract

:
This paper adopts the fluid–structure coupling algorithm based on the acoustic fluid element, the fluid dynamic artificial boundary, and the consistent viscoelastic artificial boundary of solid media to establish a finite element model of the dynamic interaction of the reef-island–seawater system. Then, a numerical simulation of the seismic response of the reef-island site is carried out to study the seismic ground motion distribution patterns of the reef–seawater site and the reef-island–lagoon site. The innovation of this article is that the influence of reef–island topography and fluid–structure coupling is considered in the analysis when vertical ground motion is input. The results show that the slope angle of the bottom layer has a significant influence on the peak ground acceleration distribution and peak size on the island slope surface and the reef platform. For high-frequency input motion, a smaller reef platform width will induce a larger peak acceleration response on the reef platform. Seawater has a significant suppressive effect on vertical ground acceleration. The more high-frequency components of the input bedrock motion, the more obvious this suppression effect will be. The existence of the lagoon will amplify the maximum peak acceleration on the reef platform. According to the calculation results, lagoon terrain can amplify the maximum horizontal and vertical peak accelerations on the reef platform by about 19 and 6 times relative to the free-field results, respectively.

1. Introduction

In recent years, due to the increasing development of maritime transportation in China, the construction of marine engineering has become the focus of China’s development [1,2,3]. At the same time, the South China Sea is located in a complex geological environment with active ground motion. As an important basis for seismic design and seismic safety evaluation of marine engineering, seismic response analysis of sea areas should be highly concerned [4,5,6].
The study of site seismic response is started from the land area. The seismic response analysis of land sites involves the nonlinear constitutive relationships of soil, the distribution of soil layers, and the boundary conditions. The earlier deterministic site seismic response analysis method is the linear elastic wave analysis method, which assumes that the soil is a linear elastic medium. Trifunac [7], Wong [8], and Jennings [9] used analytical and semi-analytical methods to study the seismic response of the semi-circular and semi-elliptical valley site under the incident plane SH wave. Durante et al. [10] performed a numerical experiment using the finite element method, exploring the combined effect of wave passage and the presence of 2D topographic features. To further consider the nonlinear constitutive relationship of soil, Yuan et al. [11] proposed a new generation of one-dimensional site seismic response calculation method and the computer program SOILQUAKE and tested the program by using actual seismic records of four types of sites with extremely thick cover-layers. Since then, Rachamadugu et al. [12], Yang and Yin [13], Huang et al. [14], Stanko et al. [15], and Dong et al. [16] have carried out further research work. For the boundary conditions of the soil, the viscous boundary proposed by Lymser and Kuhlemeyerl [17] is more accurate in a one-dimensional case, but it is prone to low-frequency drift in other cases. Deeks and Randolph [18] derived a two-dimensional viscoelastic artificial boundary based on the cylindrical wave equation. Liu et al. [19] proposed the three-dimensional viscoelastic artificial boundary through the spherical wave equation and further derived the viscoelastic artificial boundary with the unity of dynamic and static. Stanko and Markušić [20] presented the first developed site amplification model for Croatia using random vibration theory. Castelli et al. [21] used PLAXIS3D software to numerically simulate the liquefaction effect on soil–structure interaction under earthquake action. Cavallaro et al. [22] presented the local site amplification maps for the volcanic area of Trecastagni, south-eastern Sicily, in Italy.
The seismic response analysis of islands and reefs is still in the initial stage because of the complexity of the problems. Ye et al. [23] developed FSSI-CAS 3D, a numerical analysis model of fluid–structure–foundation dynamic interaction based on the finite volume method, and took caisson breakwater as an example to study the dynamic interaction among ocean waves, caisson breakwater, and seabed foundation. Chen et al. [24] established a 2D seismic response analysis model for coral reefs by considering the nonlinear dynamic characteristics of coral sand and the influence of artificial boundary conditions at the near-field site. They analyzed the spatial distribution characteristics of the peak acceleration amplification factor, ground surface acceleration response spectrum, and time-holding characteristics of the reef site, but they did not consider the influence of seawater on the seismic response of the reef site in the analysis. Mehl et al. [25] proposed two novel parallel implicit black-box coupling algorithms for partitioned fluid–structure interaction simulations. The simultaneous calculation of fluid and structure overcomes the parallel efficiency limitations of the classical staggered coupling approaches if used on massively parallel systems. Ye et al. [26] used a unified elasto-plastic constitutive model that can describe the liquefaction of sand and the two-phase u-p theory for saturated soils to analyze the dynamic responses of a sandy seabed subjected to cyclic wave loads. Then, some scholars have carried out further research [27,28,29,30].
Due to the huge geometric size of reef islands, existing research on the seismic response of reef-island sites mostly uses simplified calculation models. Although the simplified model has the advantage of being simple and efficient, it is too idealistic and is difficult to quantitatively obtain the seismic ground motion field distribution patterns that can be used to guide actual engineering construction.
In view of the shortcomings of the existing models, this paper adopts the fluid–structure coupling algorithm based on the acoustic fluid element [31], the fluid dynamic artificial boundary [32], and the consistent viscoelastic artificial boundary to establish a finite element model of the dynamic interaction of the reef-island–seawater system. Afterward, a numerical simulation of the seismic response of the island reef site was carried out to study the seismic ground motion distribution patterns of the reef-island–seawater site and the reef-island site with a lagoon terrain. This article will focus on analyzing the influence of factors such as the width and slope of the reef platform, the dynamic coupling effect of seawater, and the lagoon on the seismic response of the island reef site. The research framework diagram of this article is shown in Figure 1.
As mentioned above, the existing seismic response analysis of reef sites mostly adopts a simplified one-dimensional calculation model without considering the influence of reef geometry and fluid–structure coupling. Compared with previous studies, the innovation of this paper is that the influence of reef–island topography and fluid–structure coupling is considered in the analysis when vertical ground motion is input. The purpose of this paper is to reveal the influence of island geometry and fluid–structure coupling on island seismic response. Because the geometric contour of reef islands generally presents the shape of a trapezoidal layered convex, to reveal the general law qualitatively, the reef islands are assumed to be trapezoidal and layered in the subsequent model in this paper.
Figure 1 shows the flow framework for the entire analysis. Firstly, a sea–island dynamic interaction model is established according to the reef geometric dimensions, medium parameters and fluid artificial boundary method. Secondly, the representative ground motion records in the sea area are selected as the ground motion input to calculate the dynamic response of the whole model. Finally, according to the calculation results, the general law of seismic response of the reef is analyzed, i.e., the influence law of the bottom slope angle, the width of the reef platform, the fluid–structure coupling, the frequency spectrum of input ground motions on the seismic response of the reef.

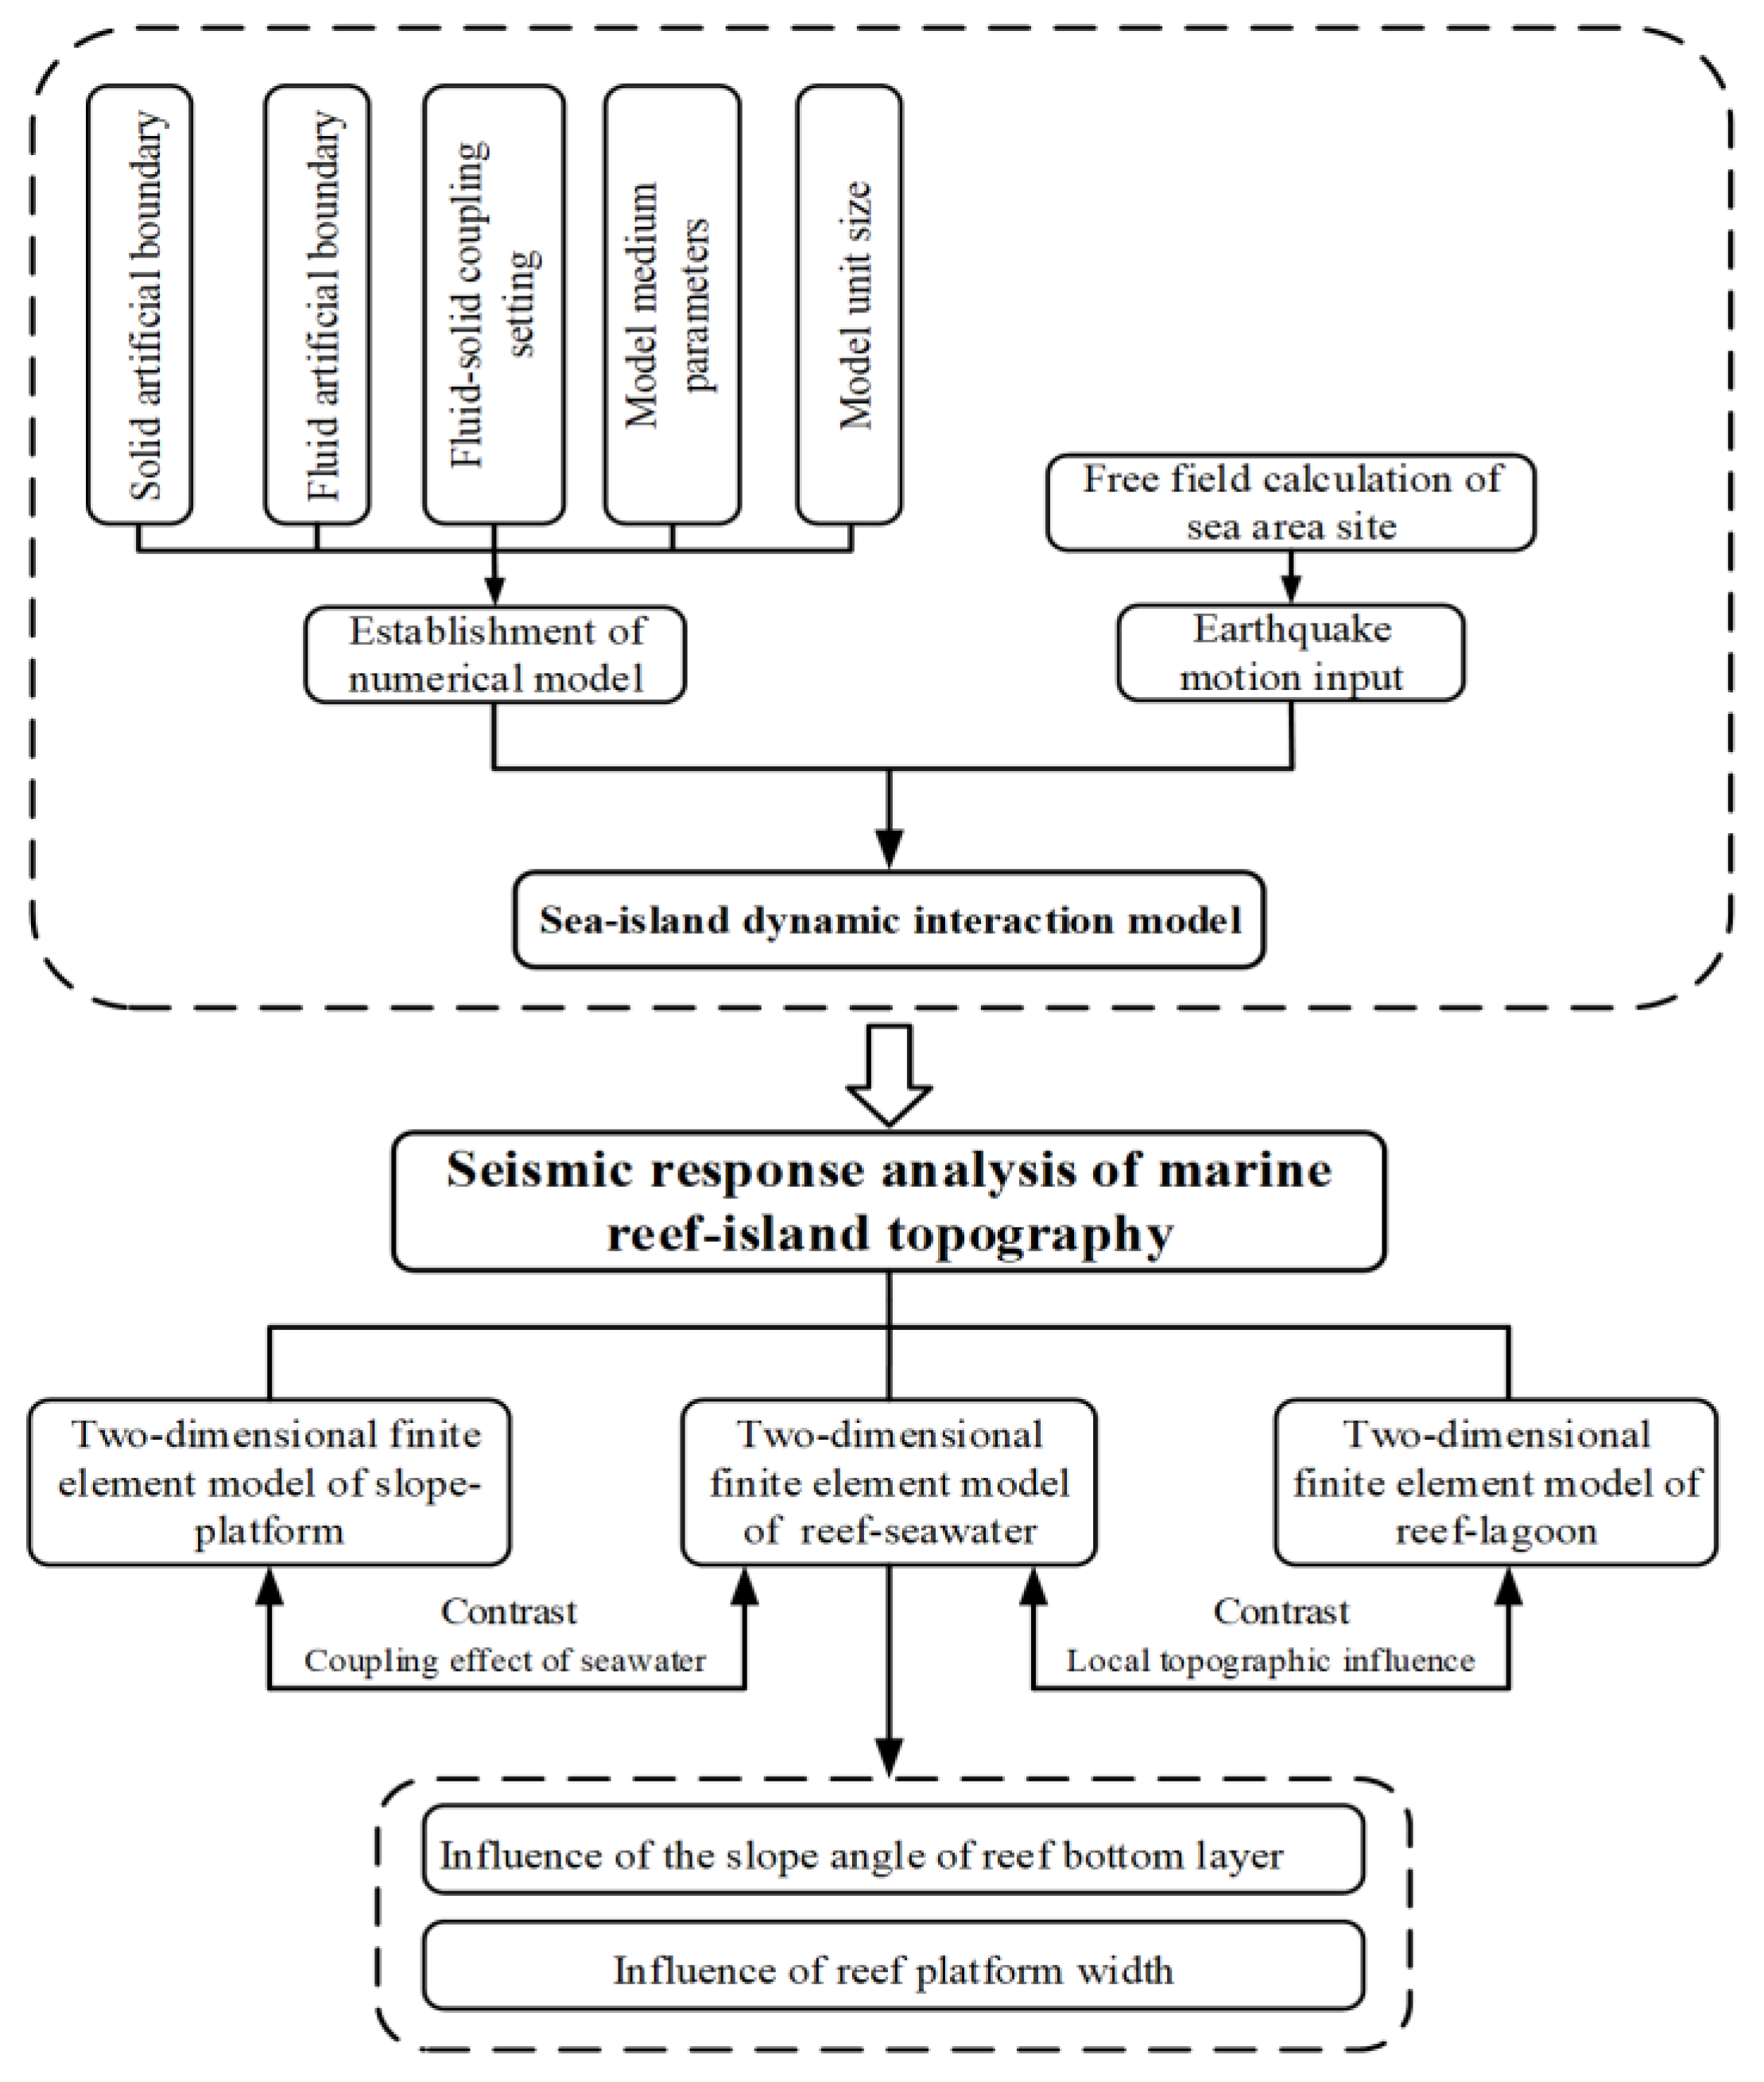
2. Finite Element Model of Reef-Island–Seawater System

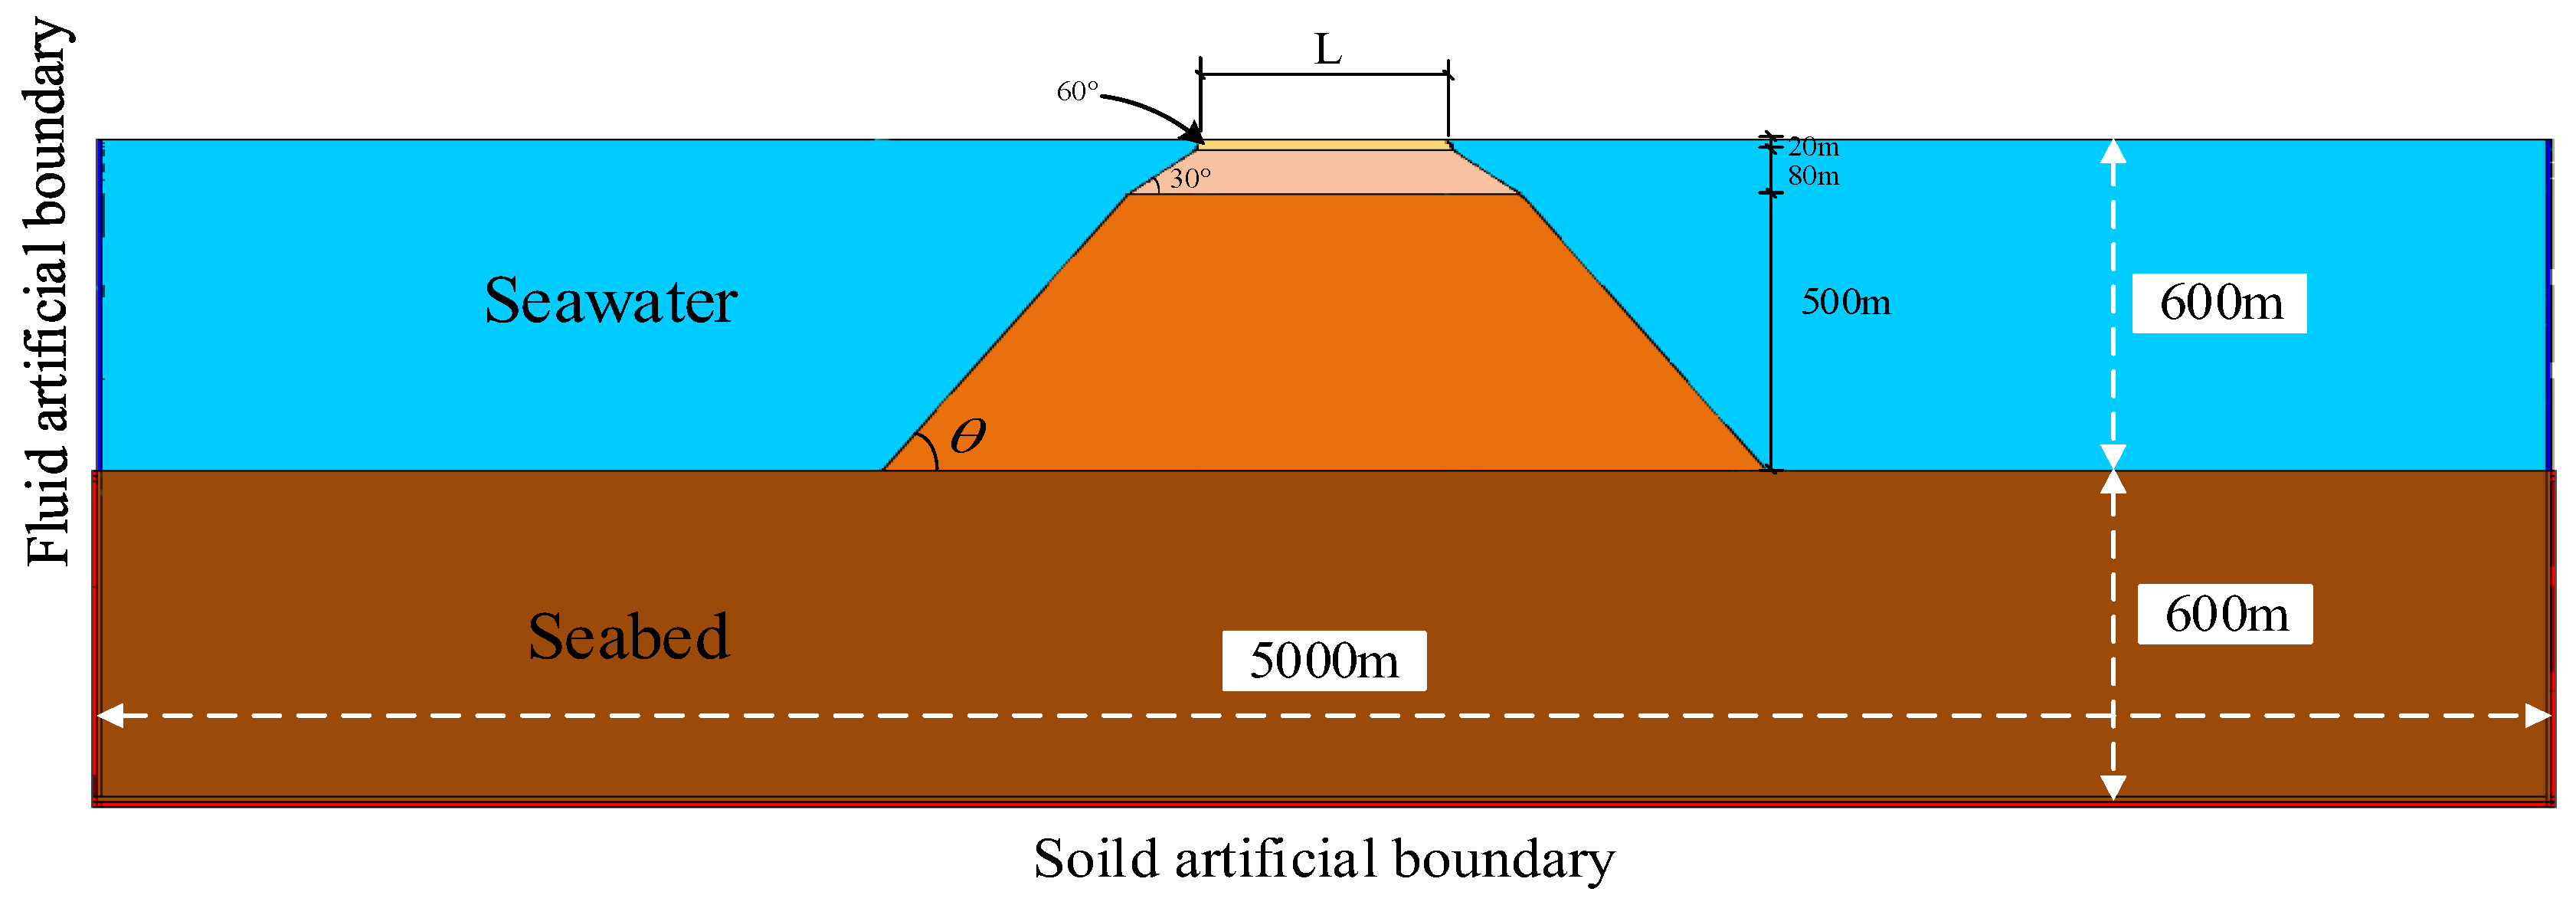
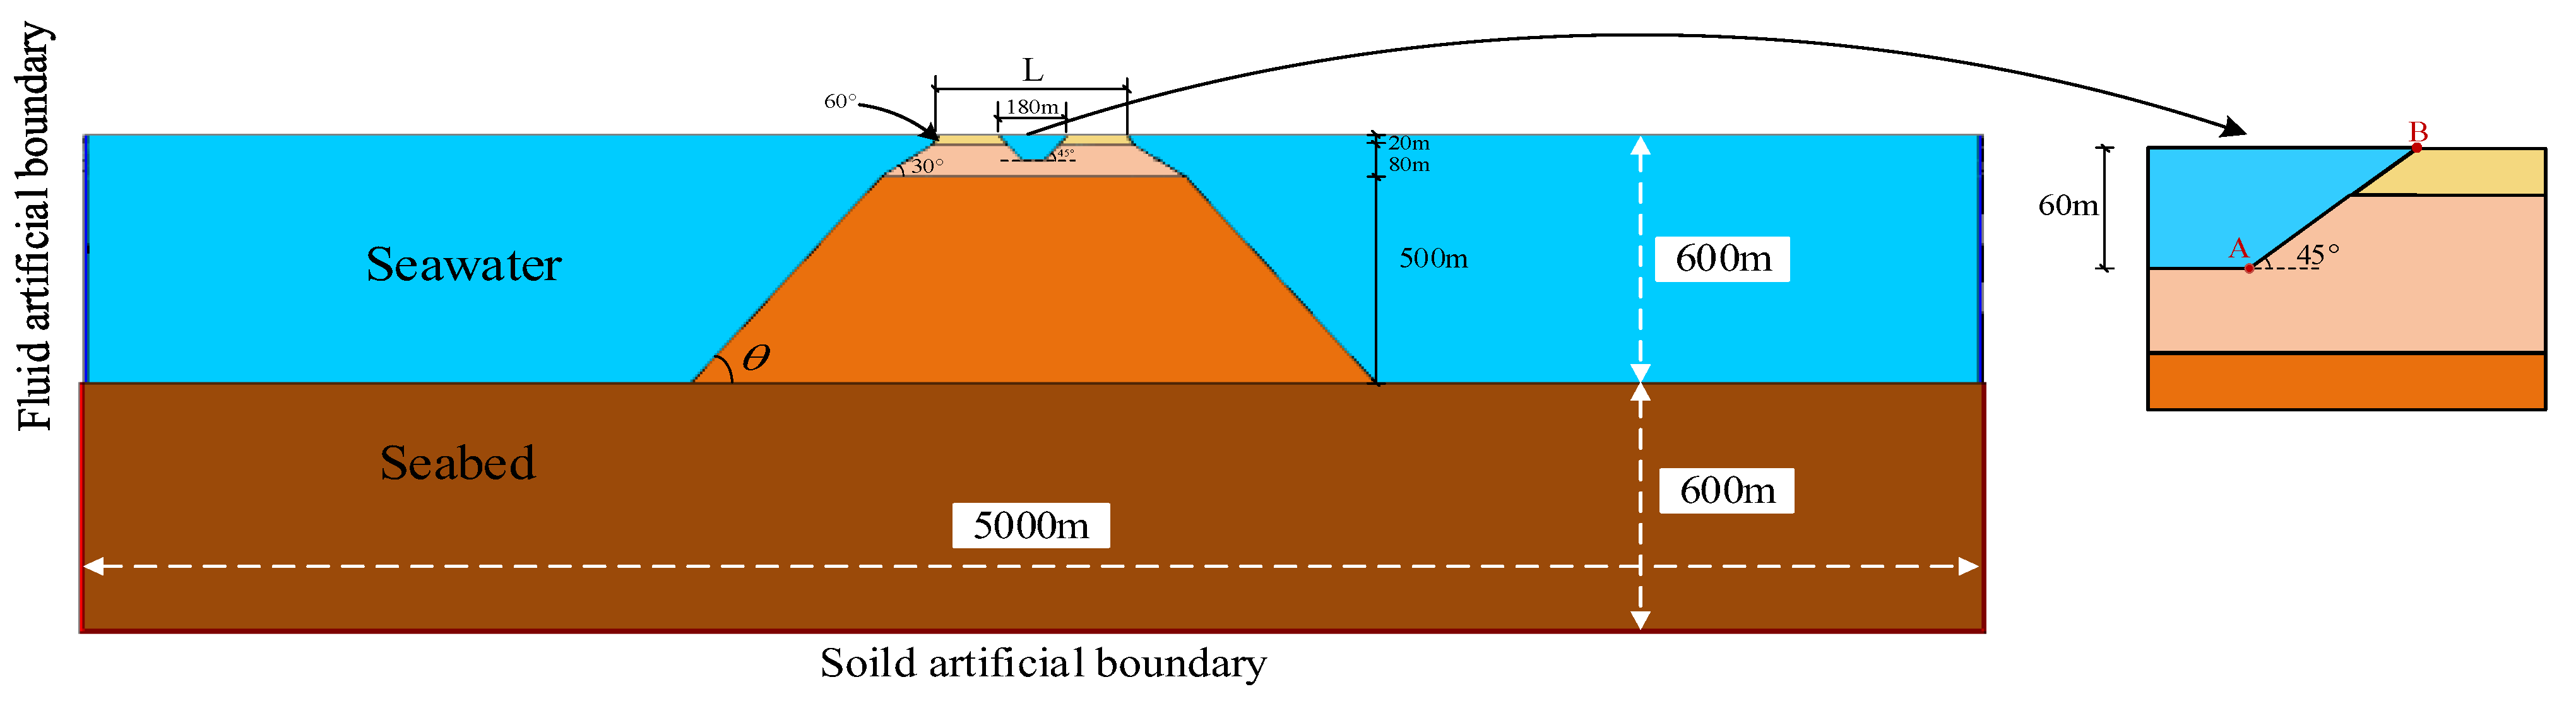
2.1. Computational Model

As shown in Figure 2, the length of the 2D reef-island–seawater system model is 5000 m. The height of the seabed and seawater is 600 m, and the width of the reef platform is L. The reef medium is a linear elastic medium. The reef island is assumed to consist of three layers. The slope of the first and second layers is fixed at 60° and 30°, respectively, and the slope of the third layer at the bottom is θ. To discuss the influence of θ and L on the seismic response of the reef site, θ = 30°, 45°, and 65°, and L = 200 m, 500 m, and 700 m, respectively. According to the relevant studies on the geological characteristics of islands and reefs in the South China Sea and the longitudinal distribution of wave velocity of reef limestone, the site topography and material parameters of the reef island are shown in Table 1. The model was established by using the common finite element software ANSYS 18.0. Solid45 element is used to simulate solid media such as seabed and reef, and the Fluid80 element is used for simulating seawater. For the coupling of the fluid–solid interface, the dynamic interaction between seawater and island topography is simulated by coupling the normal degrees of freedom of the fluid and the solid nodes. For the truncation boundaries of the fluid and solid media, the fluid dynamic artificial boundary and the consistent viscoelastic artificial boundary are adopted. APDL parametric programming in ANSYS is used to implement operations such as the determination of artificial boundary parameters and the extraction and application of free field displacement and equivalent seismic loads on boundary nodes. The dynamic solution of the model in the time domain is obtained by using the Newmark-β method.
The model discretization may cause “low-pass effects” and “dispersion effects”, which will cause the waveforms of displacement and stress waves to change during propagation. The extent of this change depends not only on the cutoff frequency and medium shear-wave velocity but also on the element size. Because the number of elements directly affects the accuracy and time of dynamic calculations, it is extremely important to control the finite element mesh size. According to Liao et al. [33], the mesh size must meet the following conditions:
x 1 6 ~ 1 8 c m i n f m a x
where Δ x is the mesh size, c min is the minimum shear-wave speed of the medium, and f max is the cutoff frequency. The cutoff frequency in this paper is 18 Hz, and the corresponding mesh size is 8~11 m. The mesh size is set at 10 m to ensure accuracy and improve the calculation efficiency.

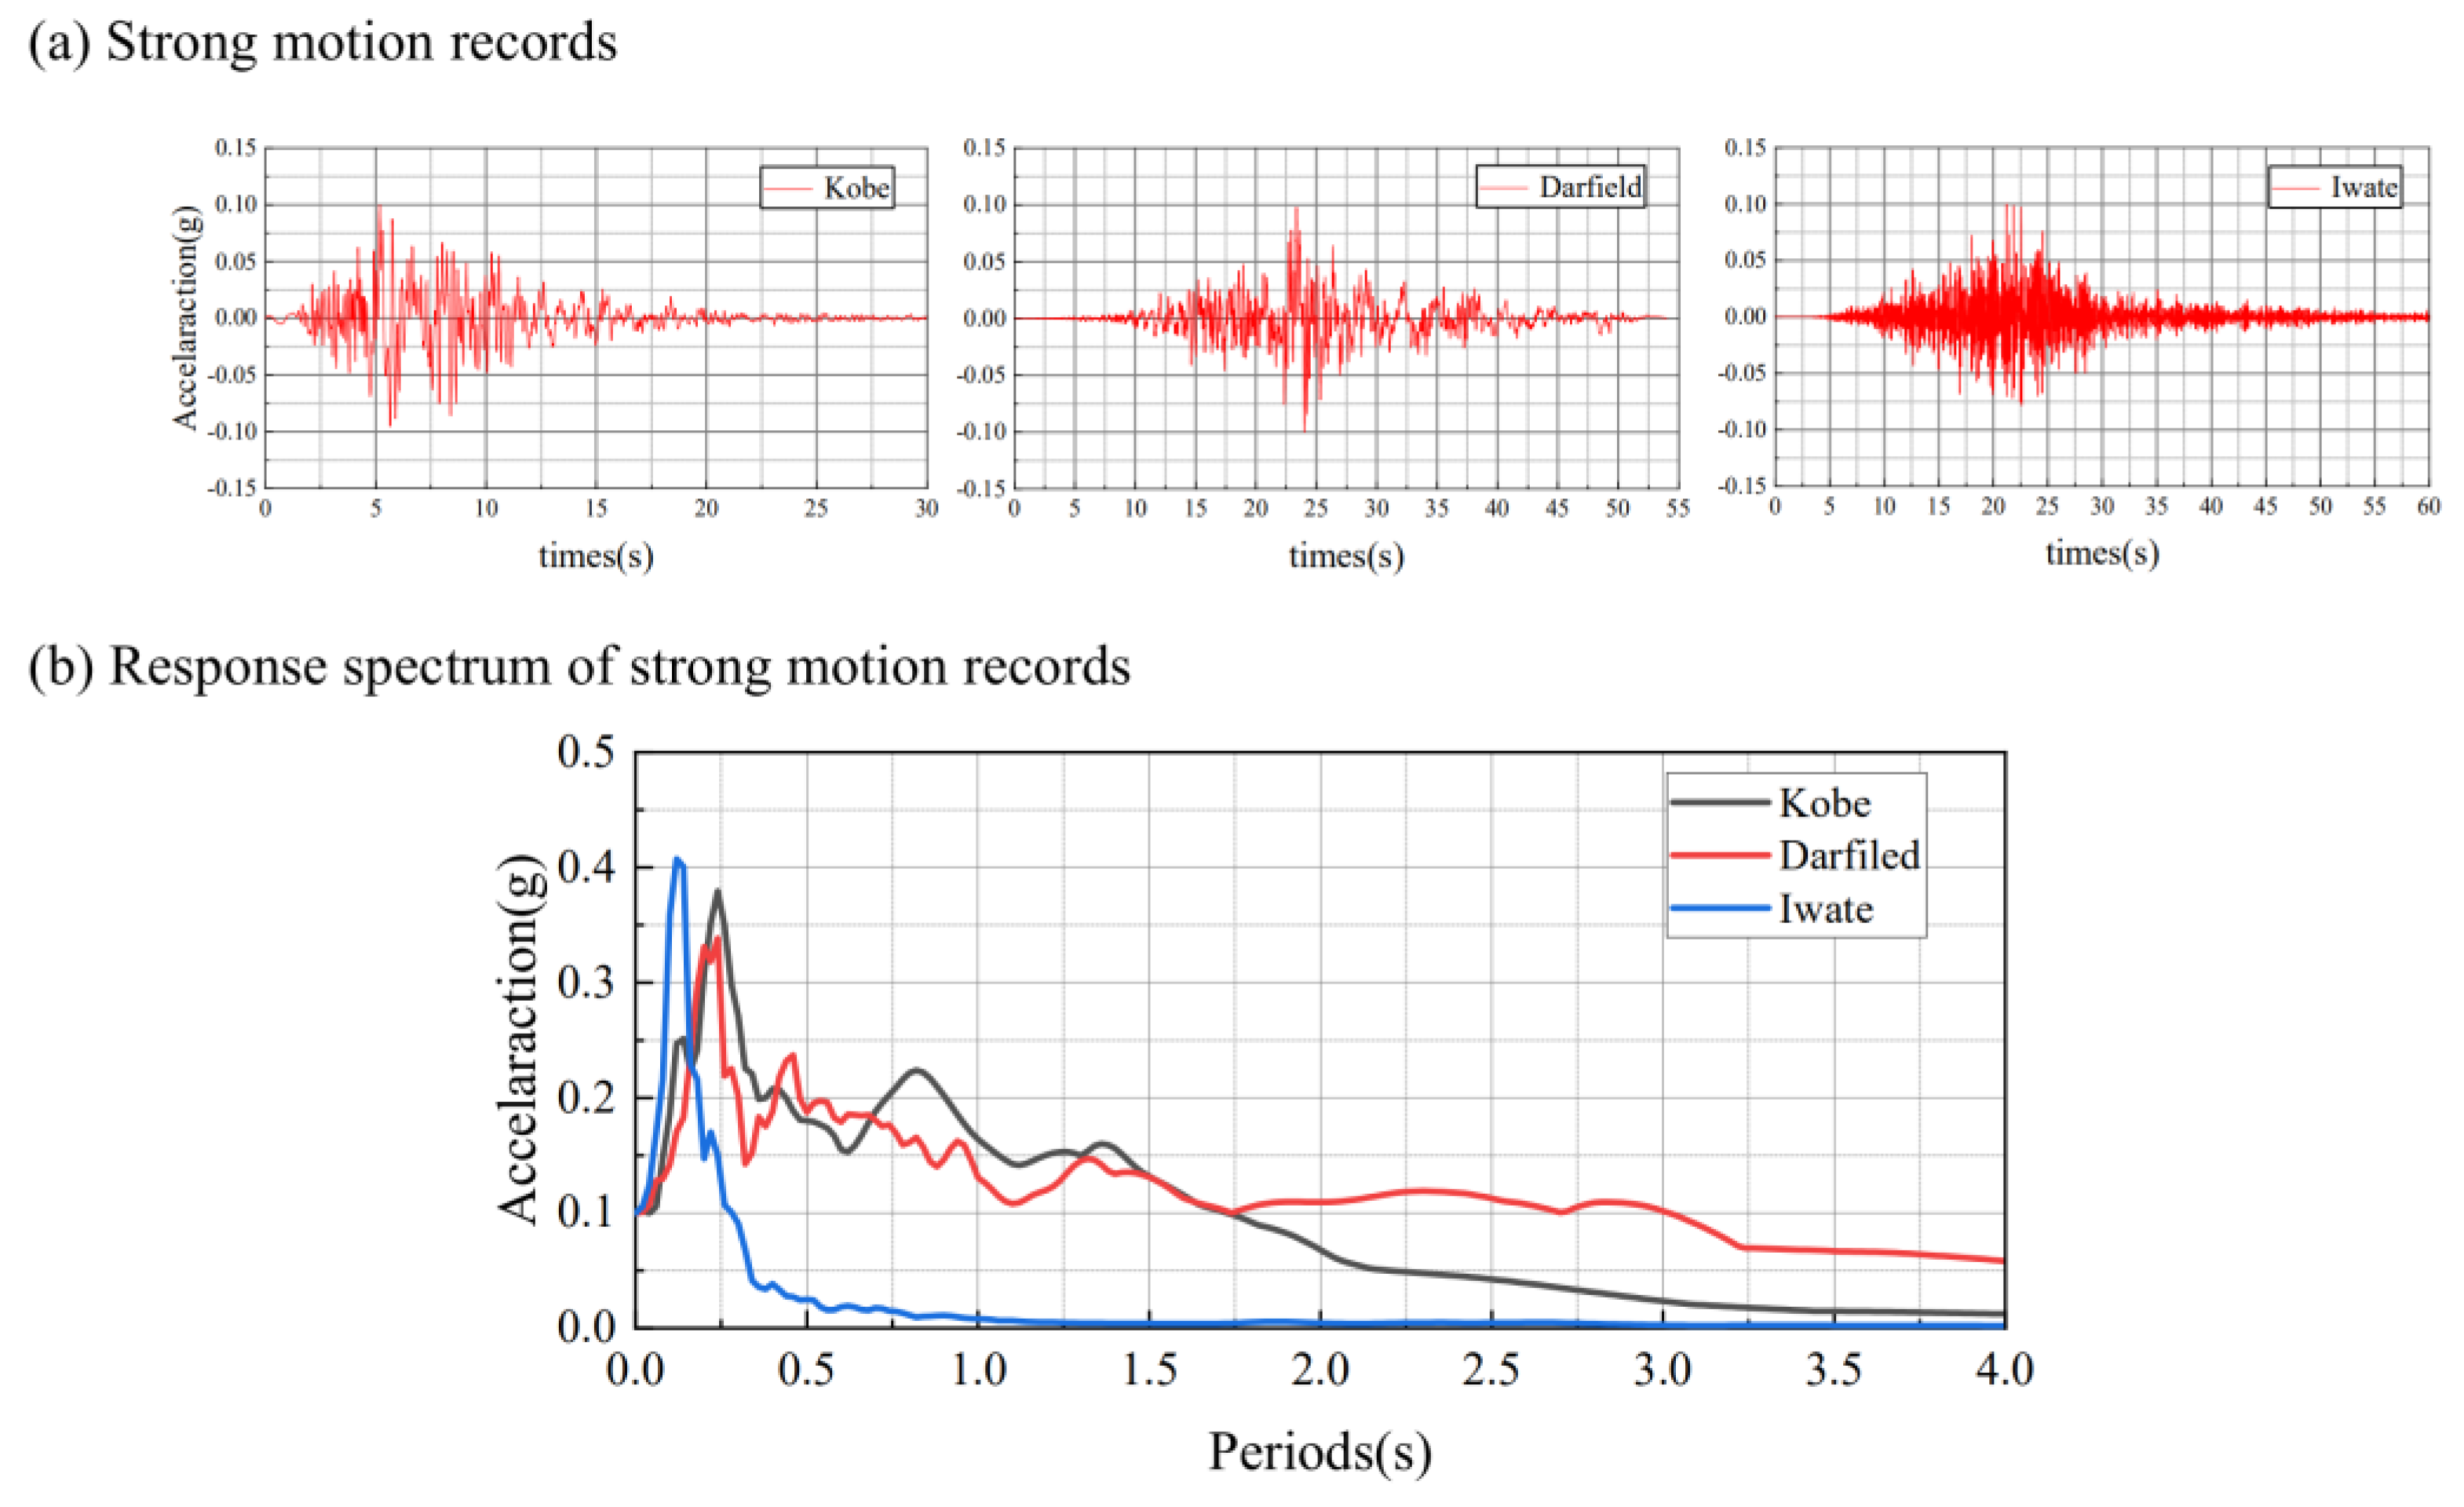
2.2. Bedrock Input Motion
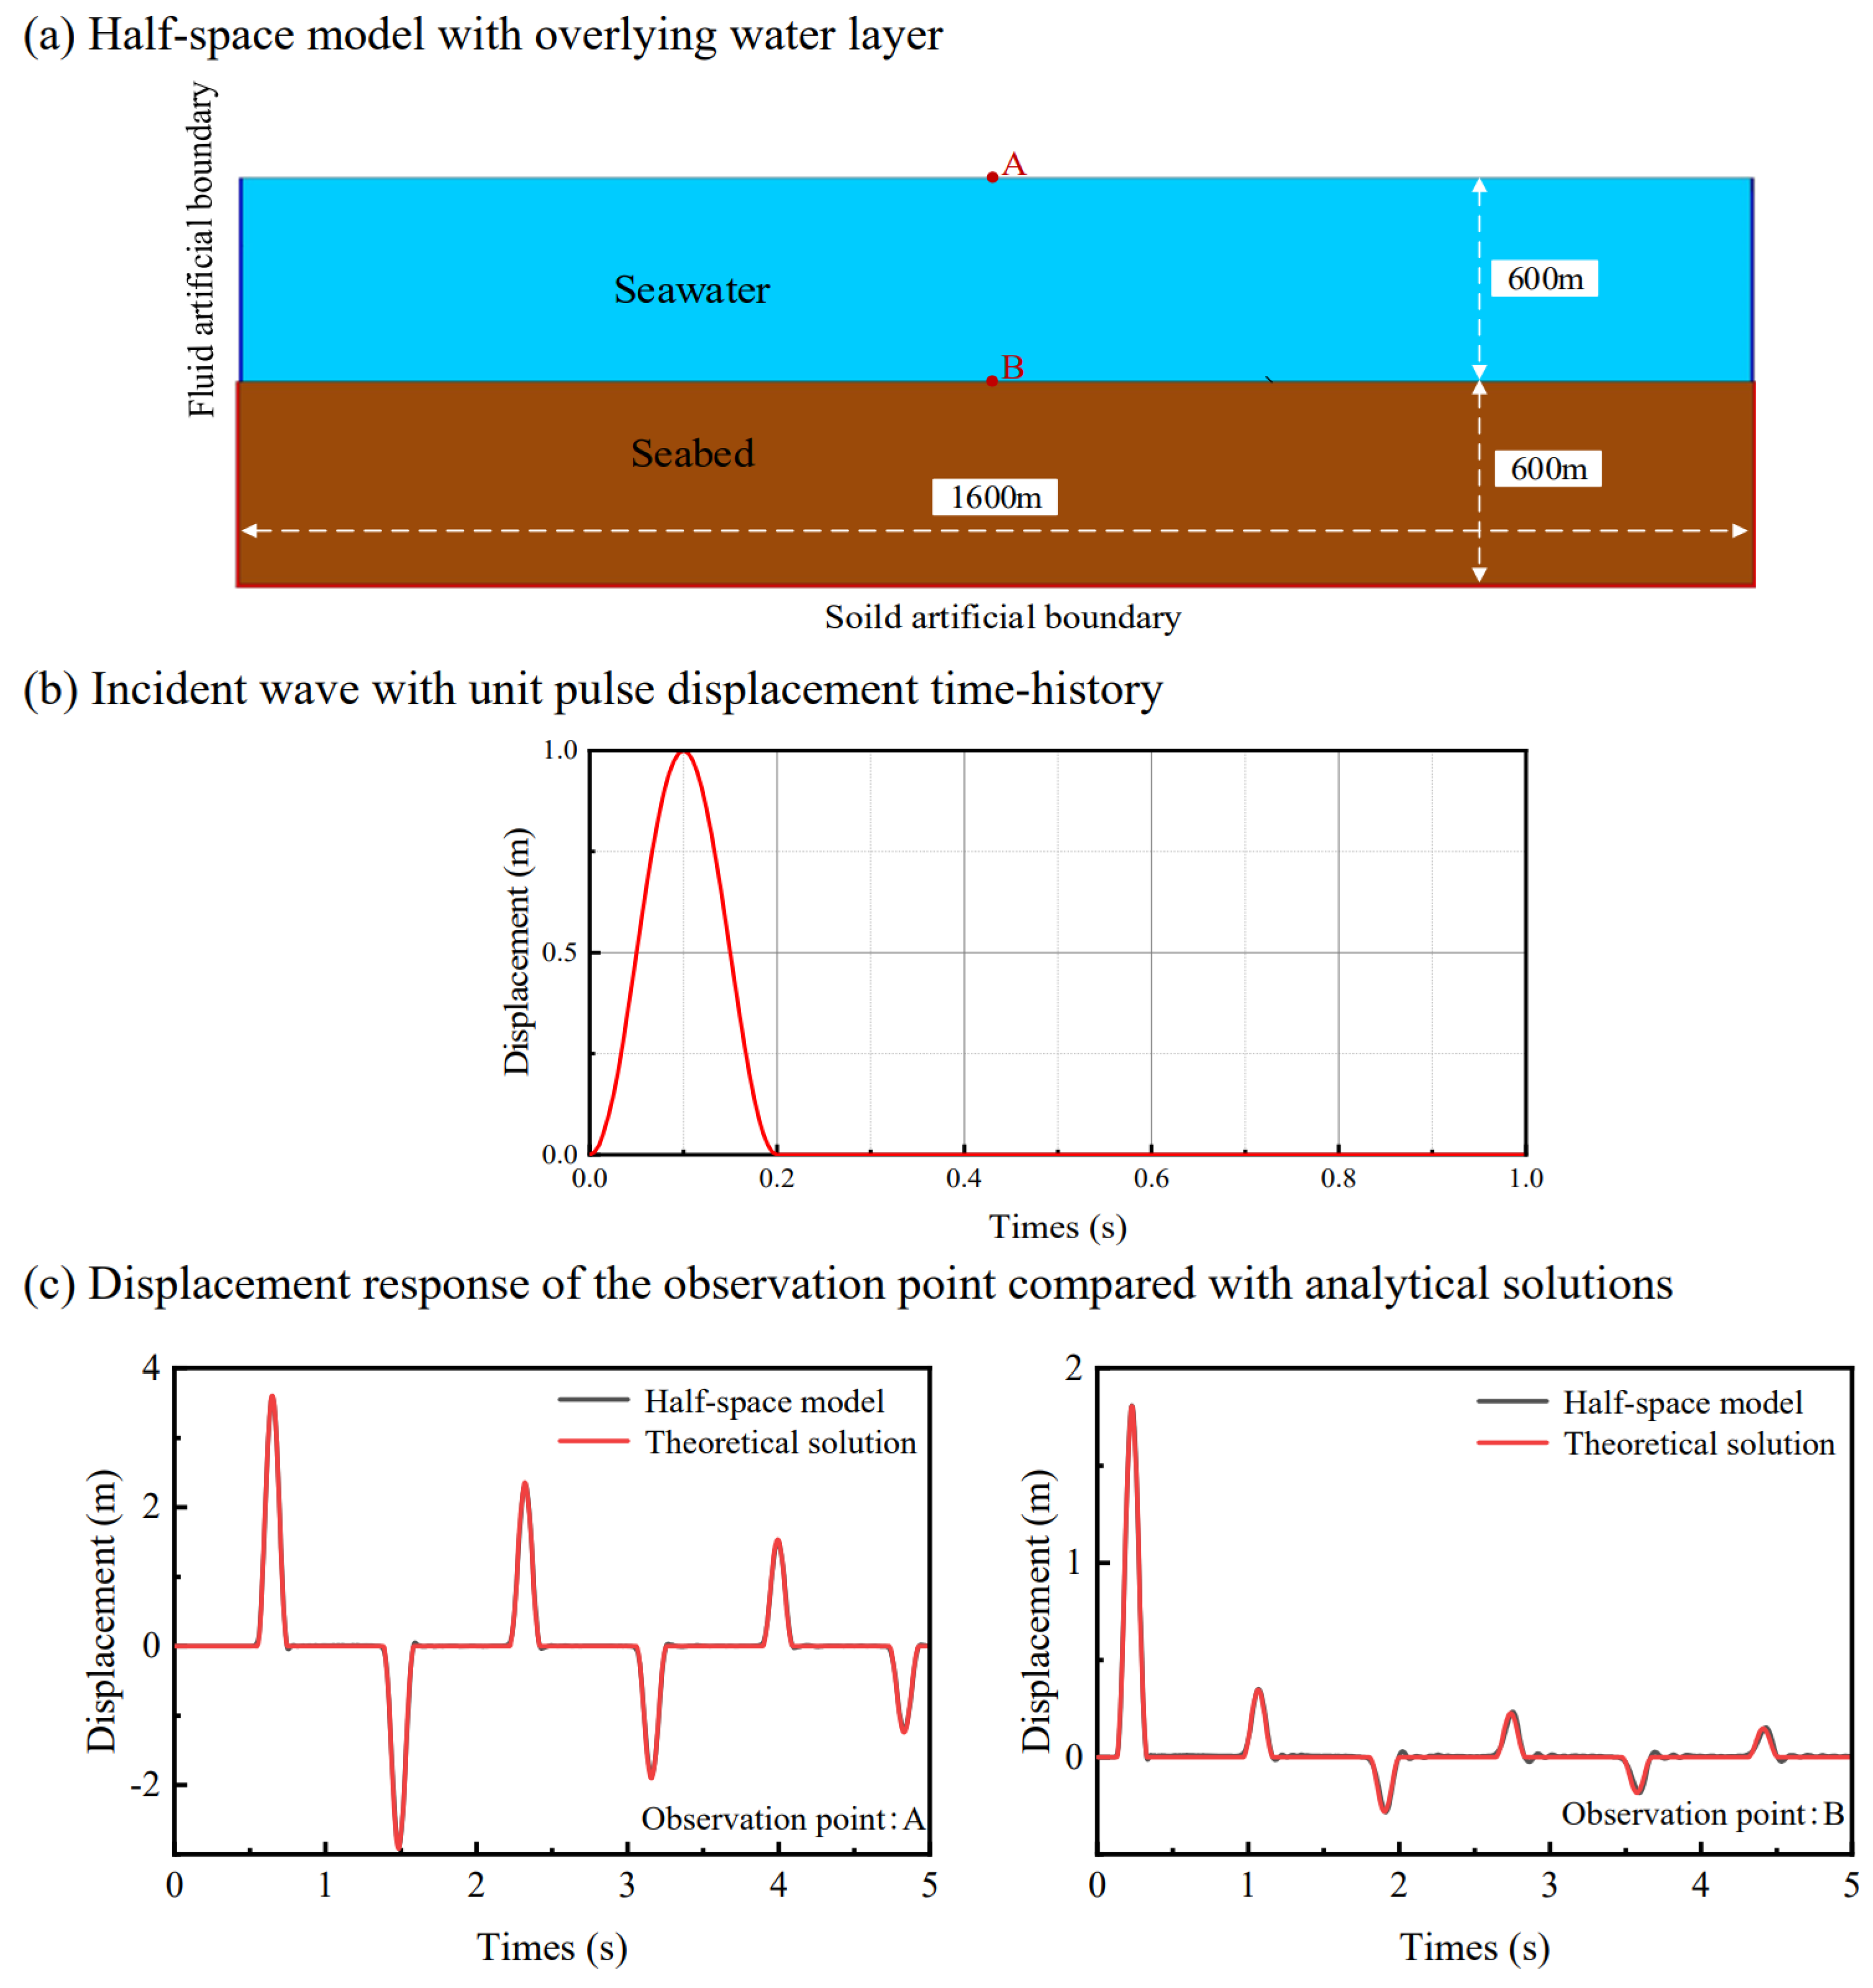
The site response caused by vertical ground motion is one of the key parameters in the seismic design of structures. Three ground motion records are selected as the bedrock input motion to study the seismic response of the reef island under vertical ground motion, i.e., the Kobe time history recorded in the Kobe Ms 7.3 earthquake in 1995, the Darfield time history recorded in the New West Darfield Ms 7.1 earthquake in 2010, and the Iwate time history recorded in the Iwate Ms 7.2 earthquake in 2008. According to Tso et al. [34], (i) PGA/PGV ≥ 1.2, high-frequency records; (ii) 0.8 < PGA/PGV < 1.2, medium-frequency records; (iii) PGA/PGV < 0.8, low-frequency records. Therefore, for the Iwate record, PGA/PGV = 3.82, high-frequency record; for the Kobe record, PGA/PGV = 0.918, medium-frequency record; for the Darfield record, PGA/PGV = 0.500, low-frequency record. Therefore, the records in this article cover the high, medium, and low frequencies, which can take into account the influence of spectral characteristics on the seismic responses of underground structures. The peak value of the input bedrock motion is adjusted to 0.1 g, and the acceleration time history and response spectrum are shown in Figure 3.

2.3. Verification

To verify the correctness of the results in this article, we establish a finite element model of the free field containing only the overlying water layer based on the above-mentioned fluid and solid artificial boundary conditions, ground motion input method, and fluid–solid coupling method, as shown in Figure 4a. The length of the model used for verification is 1600 m, and the water depth and seabed height are both 600 m. The material parameters are shown in Table 2. A pulse wave with a unit displacement peak, as shown in Figure 4b, is used for dynamic analysis, and the pulse duration is 0.2 s. We extract the displacement response time history at midpoint A of the fluid–solid coupling interface and the midpoint B of the free liquid surface in the model and compare them with the theoretical solution [35]. As shown in Figure 4c, our results are completely consistent with the theoretical results, which fully proves the accuracy of our results.

3. Parameter Analysis

3.1. Influence of the Slope Angle of Reef Bottom Layer on Site Responses

In this section, the influence of slope θ on reef island response is studied. Here, the reef platform width of L = 500 m is taken as an example, and θ is 30°, 45° and 65°. The middle point of the reef platform width is taken as the origin of the horizontal coordinate, and an observation point is taken every 10 m. The horizontal coordinate corresponding to the reef platform width is −250~250 m, where x = ±250 m is the corner point where the reef platform connects with the slopes on both sides.
We define the ratio of the peak response of each point on the surface of the reef-island site to the peak response of the free-field ground surface as the site amplification factor Ac.
A c = m a x | a x ,     t | m a x a f r e e x , t
where the variable x is the horizontal coordinate of every observation point; a is the acceleration time series on the surface of the seabed and reef island in Figure 2; t is the time factor. The subscript “free” represents the ground response of the free-field site, i.e., the model only contains the seawater layer and the horizontal seabed layer without the reef island terrain.

3.1.1. Influence on the Responses of the Reef Platform

Figure 5 shows the distribution of peak acceleration at the reef platform. For different slope θ values, the horizontal peak acceleration increases rapidly from the midpoint of the reef platform to both sides but decreases rapidly in the area close to the corner points at both sides. This phenomenon is most obvious when θ = 65°. When the slope is θ = 65°, the horizontal peak acceleration of each point on the reef flat is greater than the corresponding results for θ = 30° and 45°. This may be explained as follows. The bottom opening width of the reef island terrain corresponding to θ = 65° is the smallest, resulting in the smallest internal space of the entire terrain. When seismic waves enter this small space, they will scatter repeatedly within it and become difficult to come out, thus causing the above phenomenon. In addition, for a fixed slope, there are significant differences in the results under different input ground motions, which is especially reflected in the results of θ = 30° under Iwate motion. This reflects that the spectral characteristics of the input ground motion have a significant impact on the distribution of horizontal peak acceleration on the reef platform.
The distribution of vertical peak acceleration on the reef platform is more complex. This is mainly reflected in the range of about −120~120 m, that is, within the range of about 1/4 of the platform width on both sides of the original point. Within this range, the vertical peak acceleration corresponding to the slope θ = 65° is greater than for the slopes θ = 30° and 45°. The explanation for this is the same as that for the horizontal peak ground motion above. The spectral characteristics of the input ground motion also have a significant impact on the vertical peak acceleration distribution on the reef platform, and high-frequency ground motions will cause larger vertical peak acceleration on the platform.

3.1.2. Influence on the Responses of Reef Slope and Seabed

Figure 6 shows the distribution of horizontal peak acceleration on the reef island surface and seabed. The influence of the slope angle θ of the bottom layer is mainly reflected in the impact on the peak acceleration on the slope surface of the reef island. For small slope angle (θ = 30°) and low- to medium-frequency input ground motions (Kobe and Darfield), the horizontal peak acceleration on the slope surface is already close to the peak acceleration at the reef platform, while for high-frequency input ground motion (Iwate), the peak acceleration at different locations on the slope surface has a small difference.
Figure 7 demonstrates the distribution of vertical peak accelerations on the reef island surface and seabed. It can be seen that as the slope angle of the bottom layer increases, the vertical peak acceleration on the slope surface becomes closer to the free-field result. When the slope angle θ = 65°, it is almost consistent with the vertical peak ground motion of the free field.

3.2. Influence of Reef Platform Width on Site Responses

In this section, the width L of the reef platform is set to 200 m, 500 m, and 700 m, respectively, to study the influence of reef platform width on the peak acceleration distribution of the reef island.

3.2.1. Influence on the Responses of the Reef Platform

Figure 8 shows the distribution of horizontal peak acceleration on the reef platform surface under different reef platform widths (L). It can be seen that the influence of the platform width (L) on the horizontal peak acceleration distribution is closely related to the slope angle of the bottom layer of the reef island and the spectral characteristics of the input motion. For the same input motion (such as the Kobe motion), when the slope angle is small (θ = 30°), the maximum peak ground motion on the reef platform surface corresponding to different widths (L) is small, and the difference is not obvious. However, when the slope angle increases (θ = 45° and 65°), the maximum peak acceleration on the reef platform surface corresponding to different widths also increases. For the same slope angle (such as θ = 45°), high-frequency inputs tend to cause larger horizontal peak ground motion under smaller reef platform width.
Figure 9 illustrates the distribution of vertical peak acceleration on the reef platform surface under different reef platform widths. The results corresponding to the platform width L = 500 m and 700 m are significantly different from the results of 200 m width, which is especially reflected in high-frequency input (Iwate motion). It can be seen that for high-frequency input, a smaller reef flat width will cause a larger vertical peak response on the reef flat surface.

3.2.2. Influence on the Responses of Reef Slope and Seabed

Figure 10 gives the distribution of horizontal peak acceleration on the reef island slope surface and seabed under different reef platform widths. For medium- and low-frequency inputs (Kobe and Darfeild), the influence of reef platform width (L) is mainly reflected in the peak acceleration distribution and peak size on the island slope surface and reef platform surface. This difference in distribution and peak size decreases as the slope angle (θ) of the reef bottom layer increases, which can be observed in the results for the slope angle θ = 65°. For high-frequency input (Iwate), the maximum peak ground motion on the reef platform corresponding to the smaller width (L = 200 m) is very significant.
Corresponding to Figure 10, Figure 11 shows the distribution of vertical peak acceleration. It can be seen that the reef platform width mainly affects the peak distribution and peak size on the reef platform surface but has no significant impact on the peak distribution and size on the slope surface. High-frequency ground motion input (Iwate) or larger bottom slope angle (θ = 65°) usually causes a larger vertical peak ground motion for a smaller reef platform width (L = 200 m).

3.3. Influence of Seawater on the Site Seismic Response

One of the most significant differences between marine sites and land sites is that the site response is affected by the dynamic coupling effect with seawater. Therefore, it is necessary to study the impact of seawater on the seismic response of the reef island. The land site model (i.e., the slope–platform model) used in this section is obtained by deleting the fluid elements and the fluid artificial boundaries of the reef-island–seawater system model. The comparison results of the two models are shown in Figure 10 and Figure 11.
Figure 12 and Figure 13 show the distribution of horizontal and vertical peak accelerations on the reef island surface and seabed, respectively. It can be seen from the figure that, on the slope surface of the reef island, the horizontal peak acceleration of the reef-island–seawater model is significantly greater than that of the slope–platform model, while the vertical peak acceleration is smaller than that of the slope–platform model. This is because for vertical input motions, the seawater layer has a strong suppression effect on vertical ground motion, so the vertical peak acceleration on the slope surface is smaller than that of the slope–platform model.

4. Influence of Lagoon on the Seismic Response of Reef Island

In reality, there are usually lagoons within reef islands. To study the influence of the lagoon on the seismic response of the reef island, as shown in Figure 14, the reef-island–lagoon model, we add a lagoon with a width of 180 m and a depth of 60 m to the reef-island–seawater system model in Section 2.1. The slope angle of the lagoon is 45°. Other model geometric parameters and material parameters are consistent with those of the reef-island–seawater system model.
Figure 15, Figure 16 and Figure 17 show the influence of the lagoon on the horizontal peak acceleration distribution of the reef island. The influence of the lagoon is significantly concentrated at the location of the reef platform, but the impact on the horizontal peak acceleration distribution on the reef slope surface and seabed surface is not obvious. The existence of the lagoon will amplify the maximum peak acceleration on the reef platform, and the degree of this amplification is closely related to the slope angle (θ) of the bottom layer of the reef island, the reef platform width (L), and the spectral components of input ground motions. Table 3 lists the amplification factors of the maximum horizontal peak acceleration of the reef platform under different working conditions corresponding to Figure 15, Figure 16 and Figure 17. It can be seen that, for high-frequency input (Iwate), the maximum horizontal peak acceleration of the reef platform of the model containing the lagoon can be amplified by 19.426 times relative to the free-field result.
Figure 18, Figure 19 and Figure 20 show the influence of the lagoon on the vertical peak acceleration distribution of the island and reef. The influence of the lagoon on the vertical ground motion distribution is also significantly concentrated only at the reef platform location. However, unlike the effect on the horizontal ground motion distribution, the presence of the lagoon will greatly reduce the vertical ground motion at the corresponding location but will remove the lagoon reef’s flat surface. Table 4 lists the maximum vertical peak acceleration amplification factor of the reef flat under different working conditions corresponding to Figure 18, Figure 19 and Figure 20. It can be seen that, for high-frequency input (Iwate), the maximum vertical peak acceleration of the reef platform containing the lagoon model can be amplified by 5.835 times relative to the free-field result.

5. Conclusions

Based on the fluid artificial boundary, this paper established a 2D finite element model of the reef-island–seawater system and further analyzed the site seismic response under the action of ground motions with different spectral characteristics. The study focuses on the influence of factors such as the slope angle (θ) of the bottom layer of the reef island, the reef platform width (L), and the lagoon topography on the peak ground motion distribution of the reef-island site. The conclusions and findings are as follows:
(1)
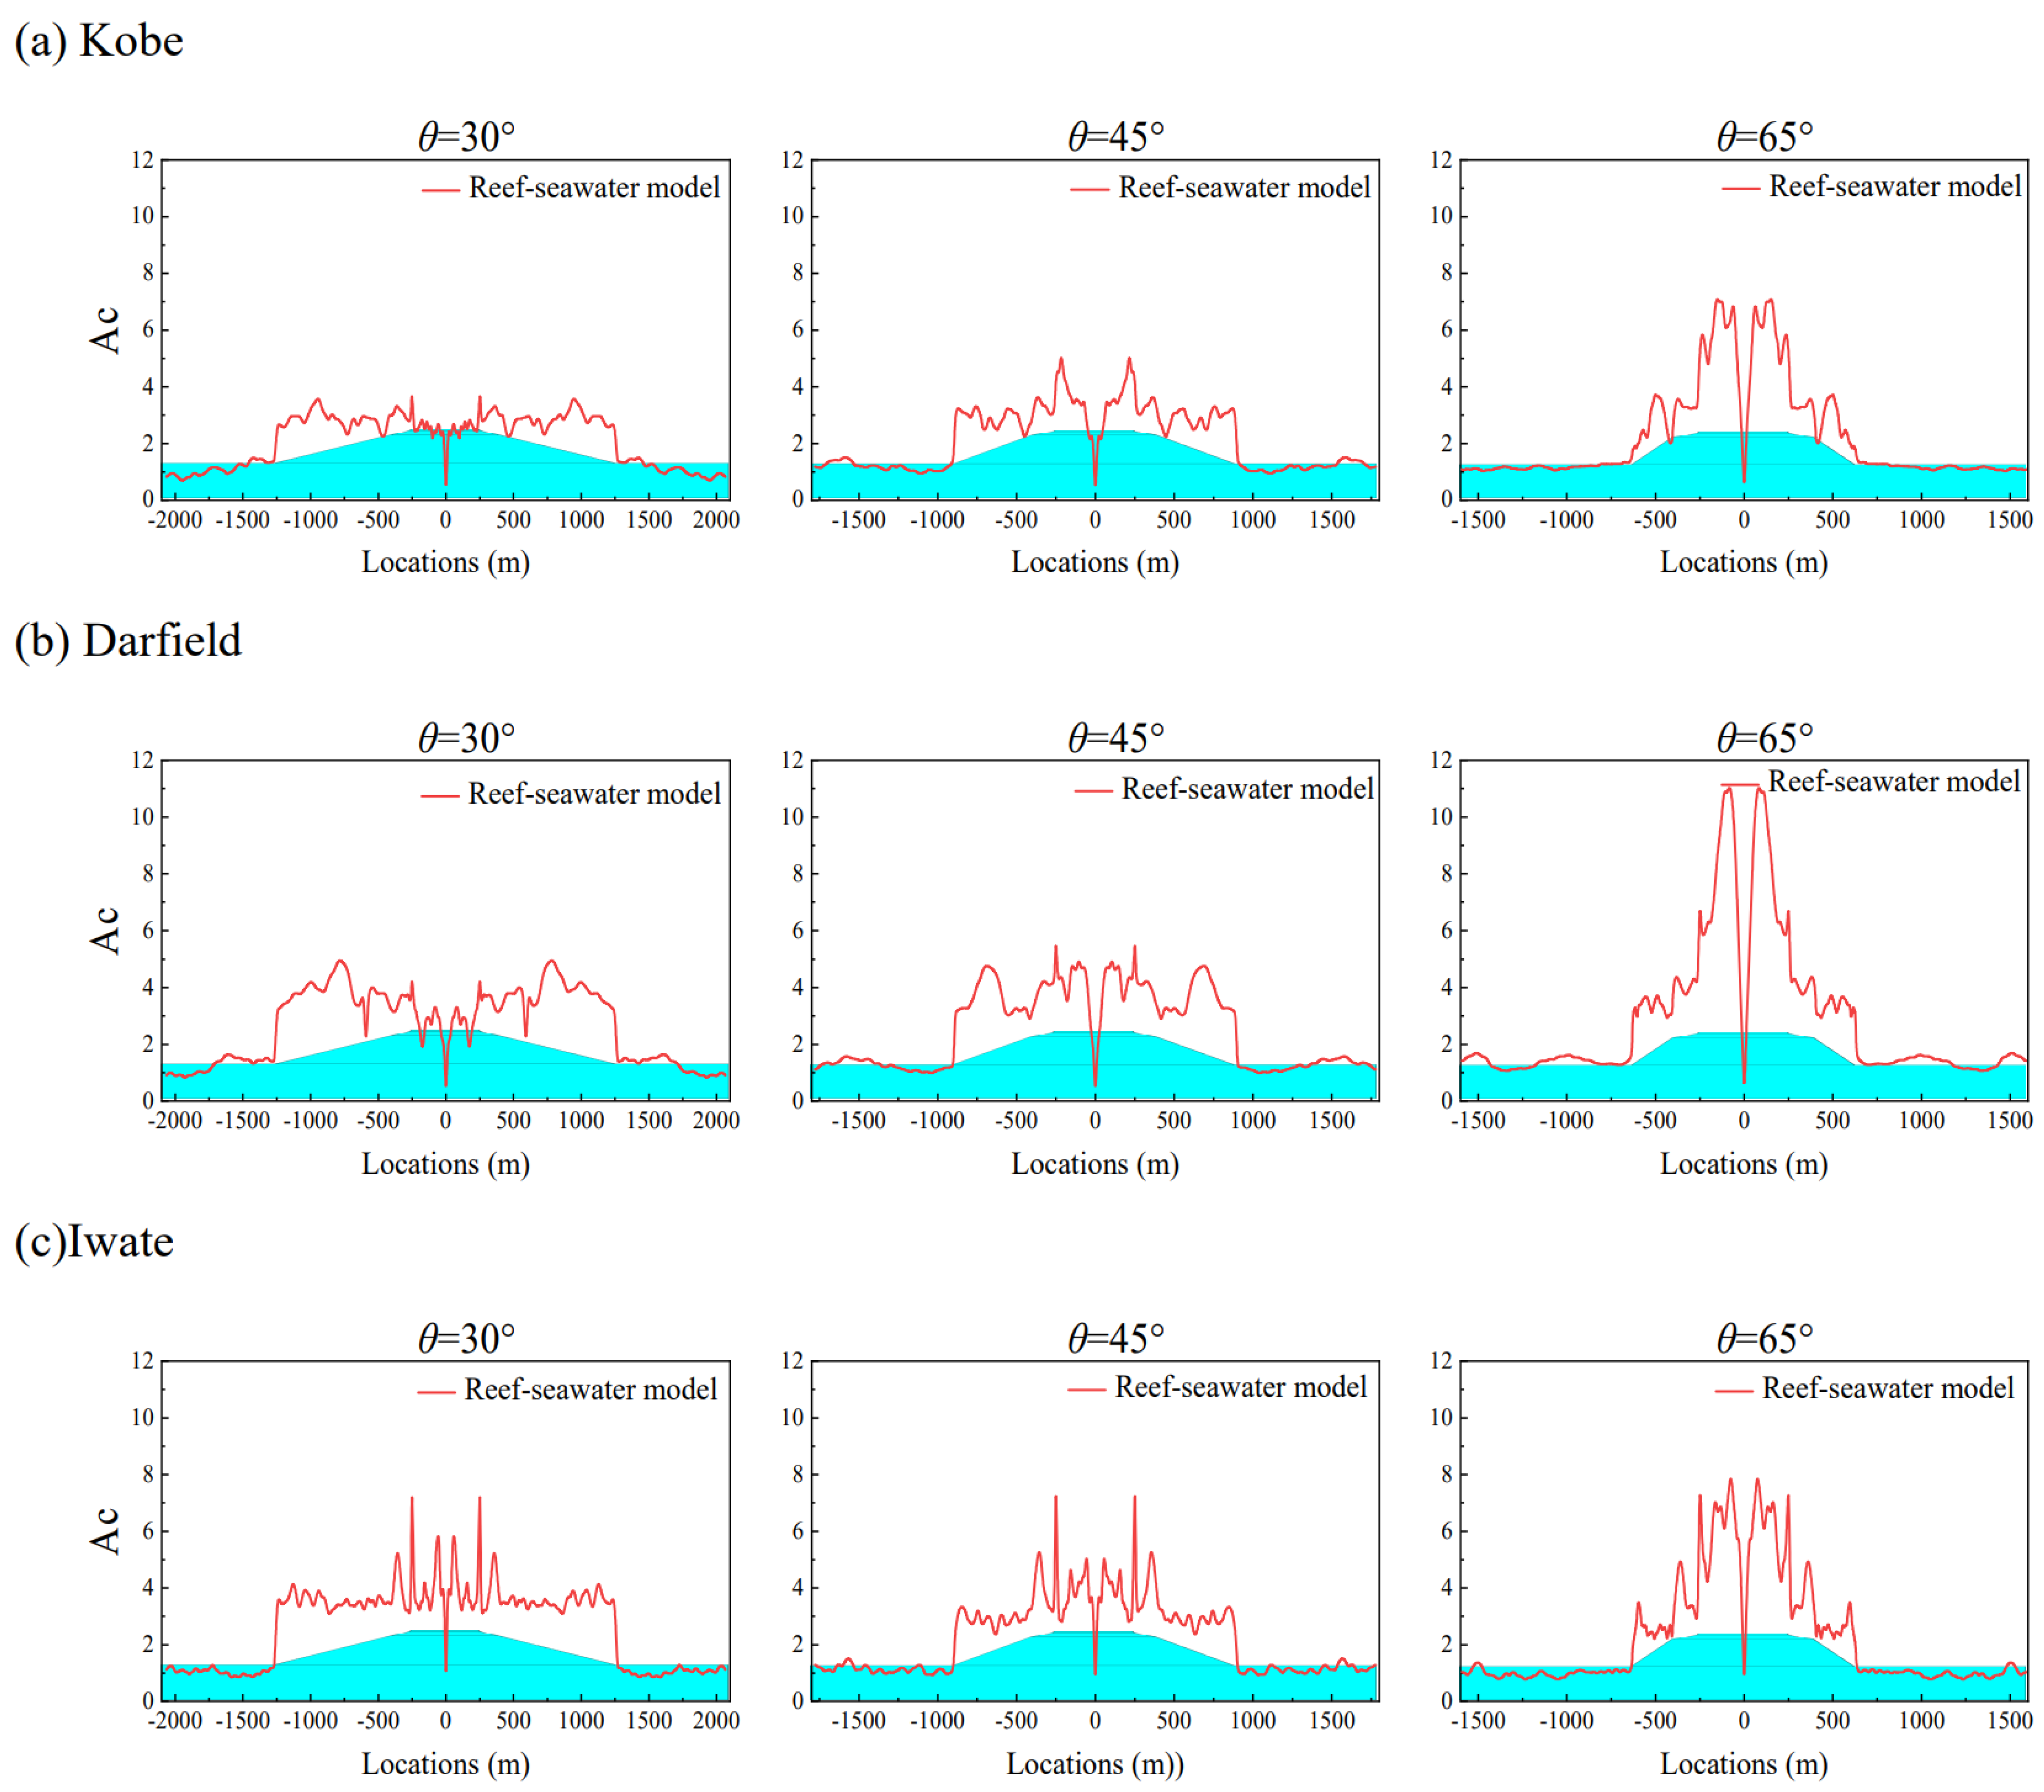
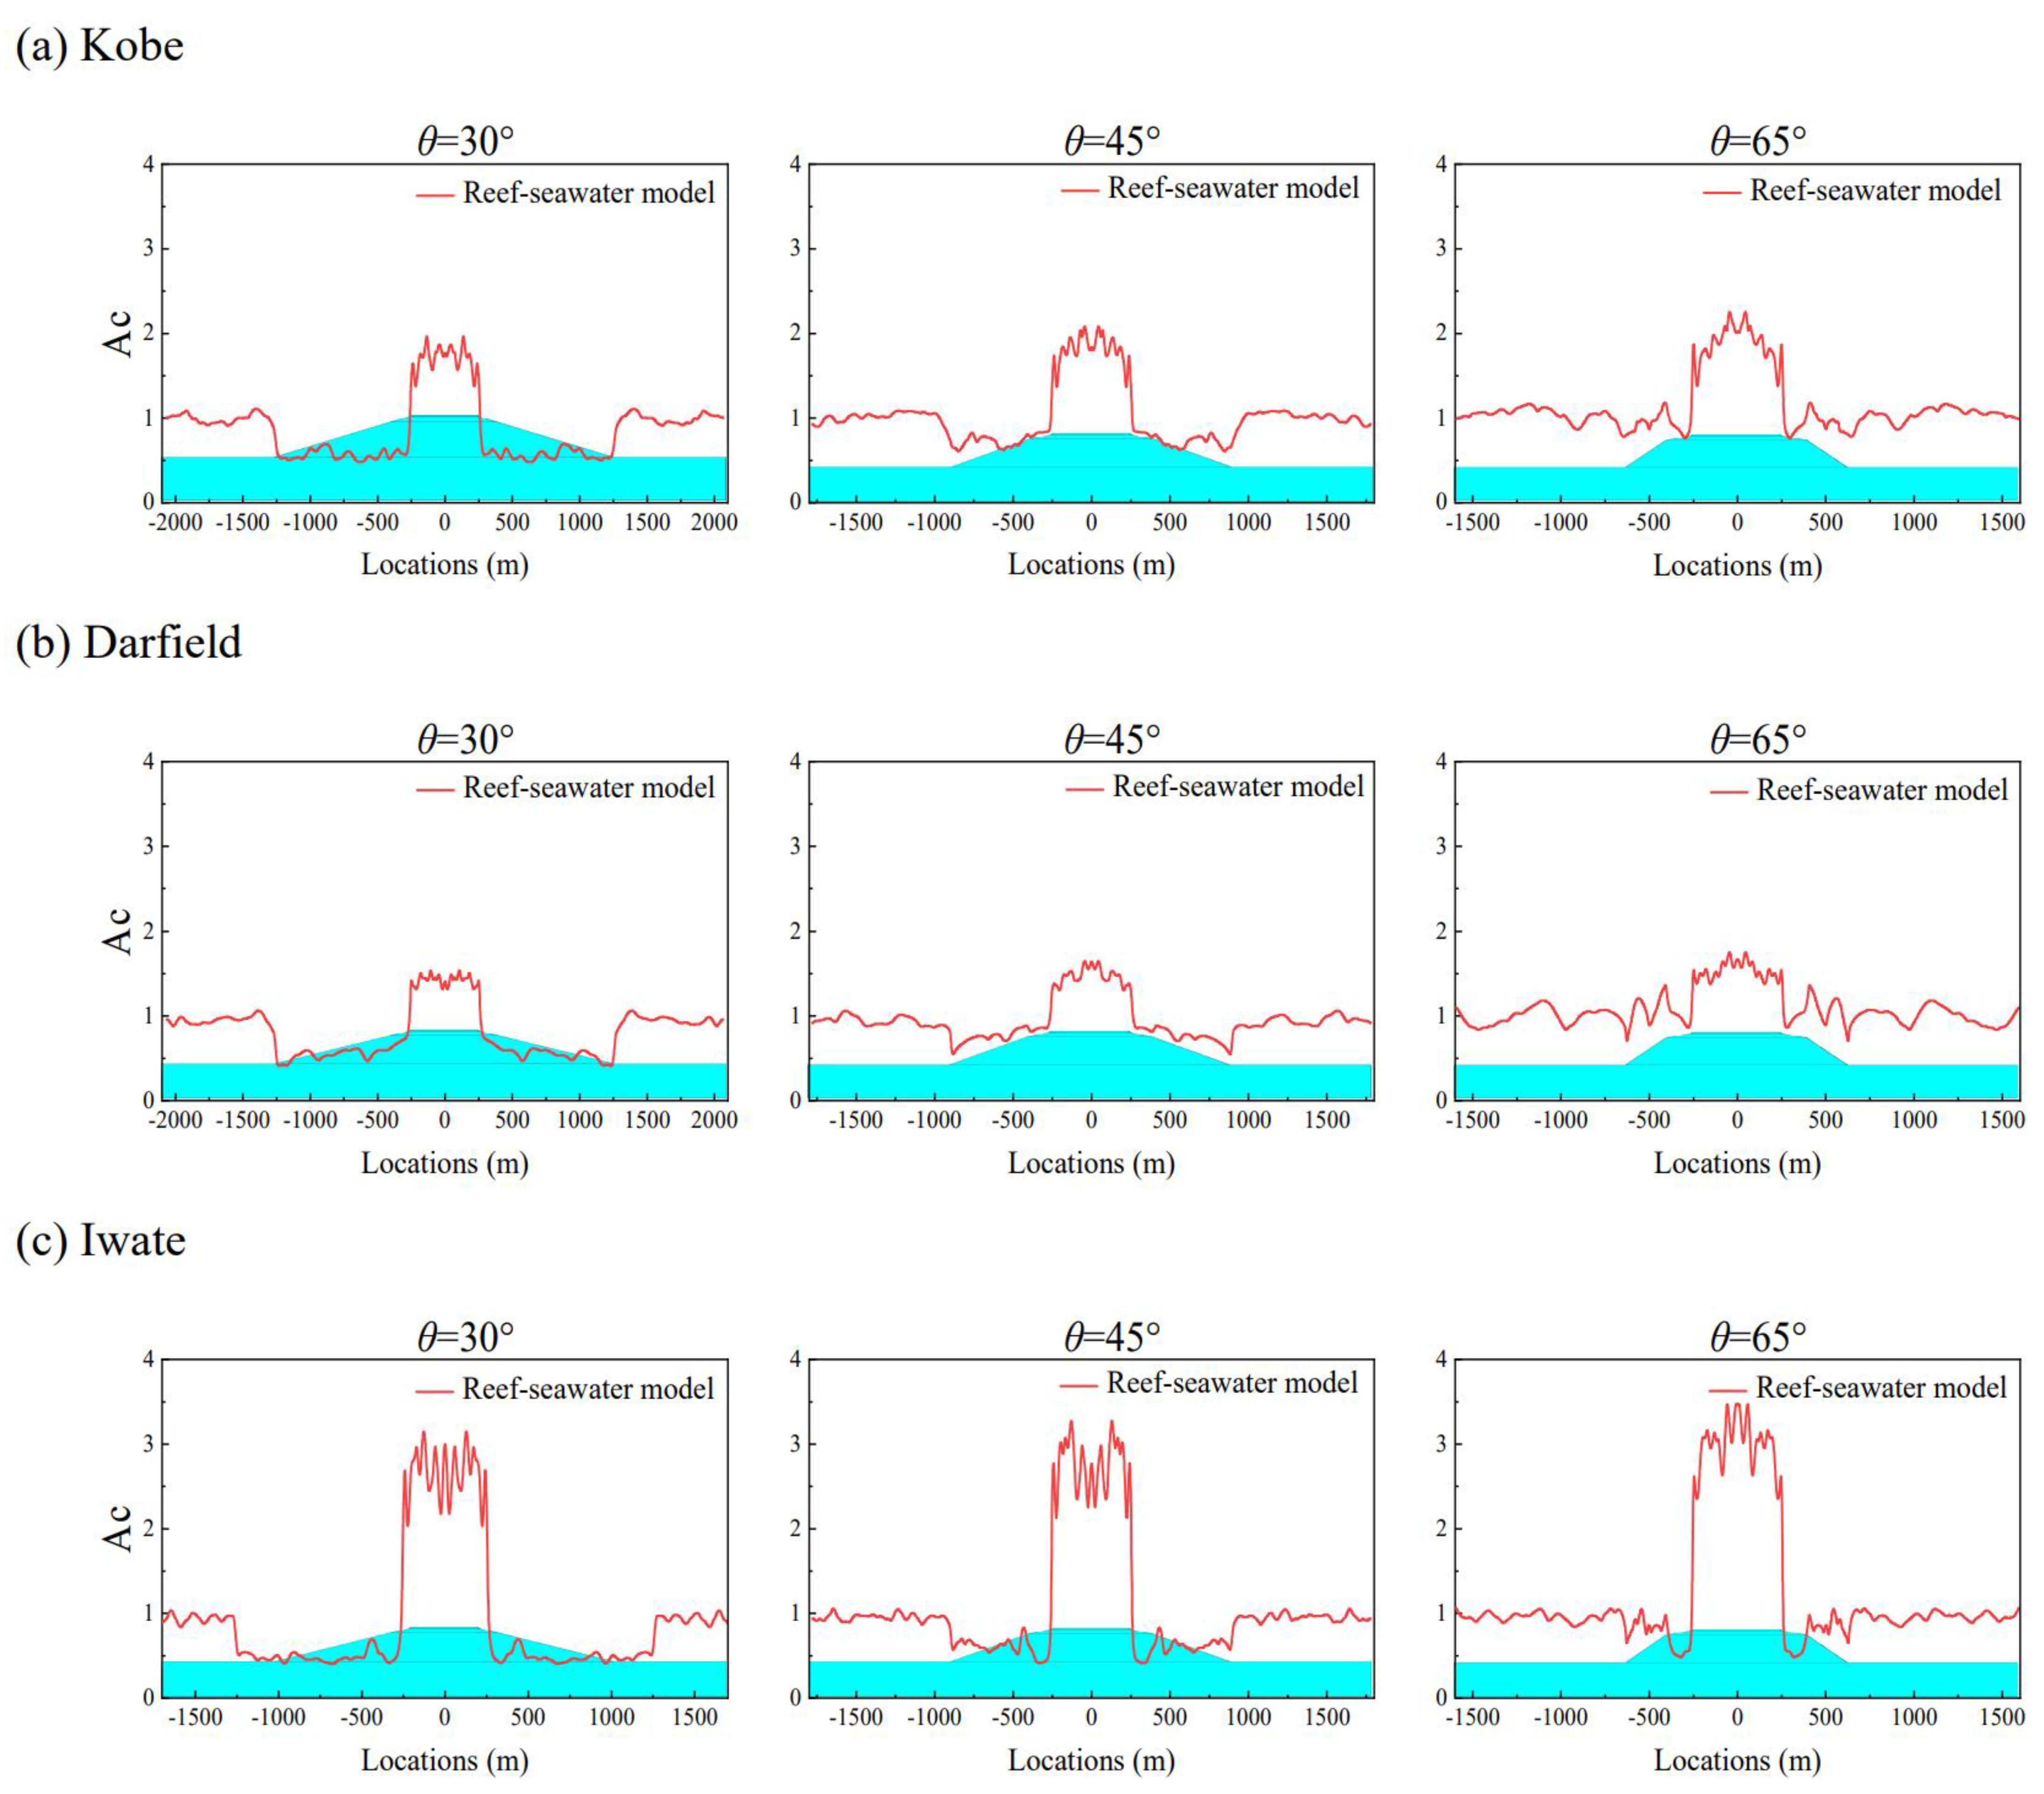
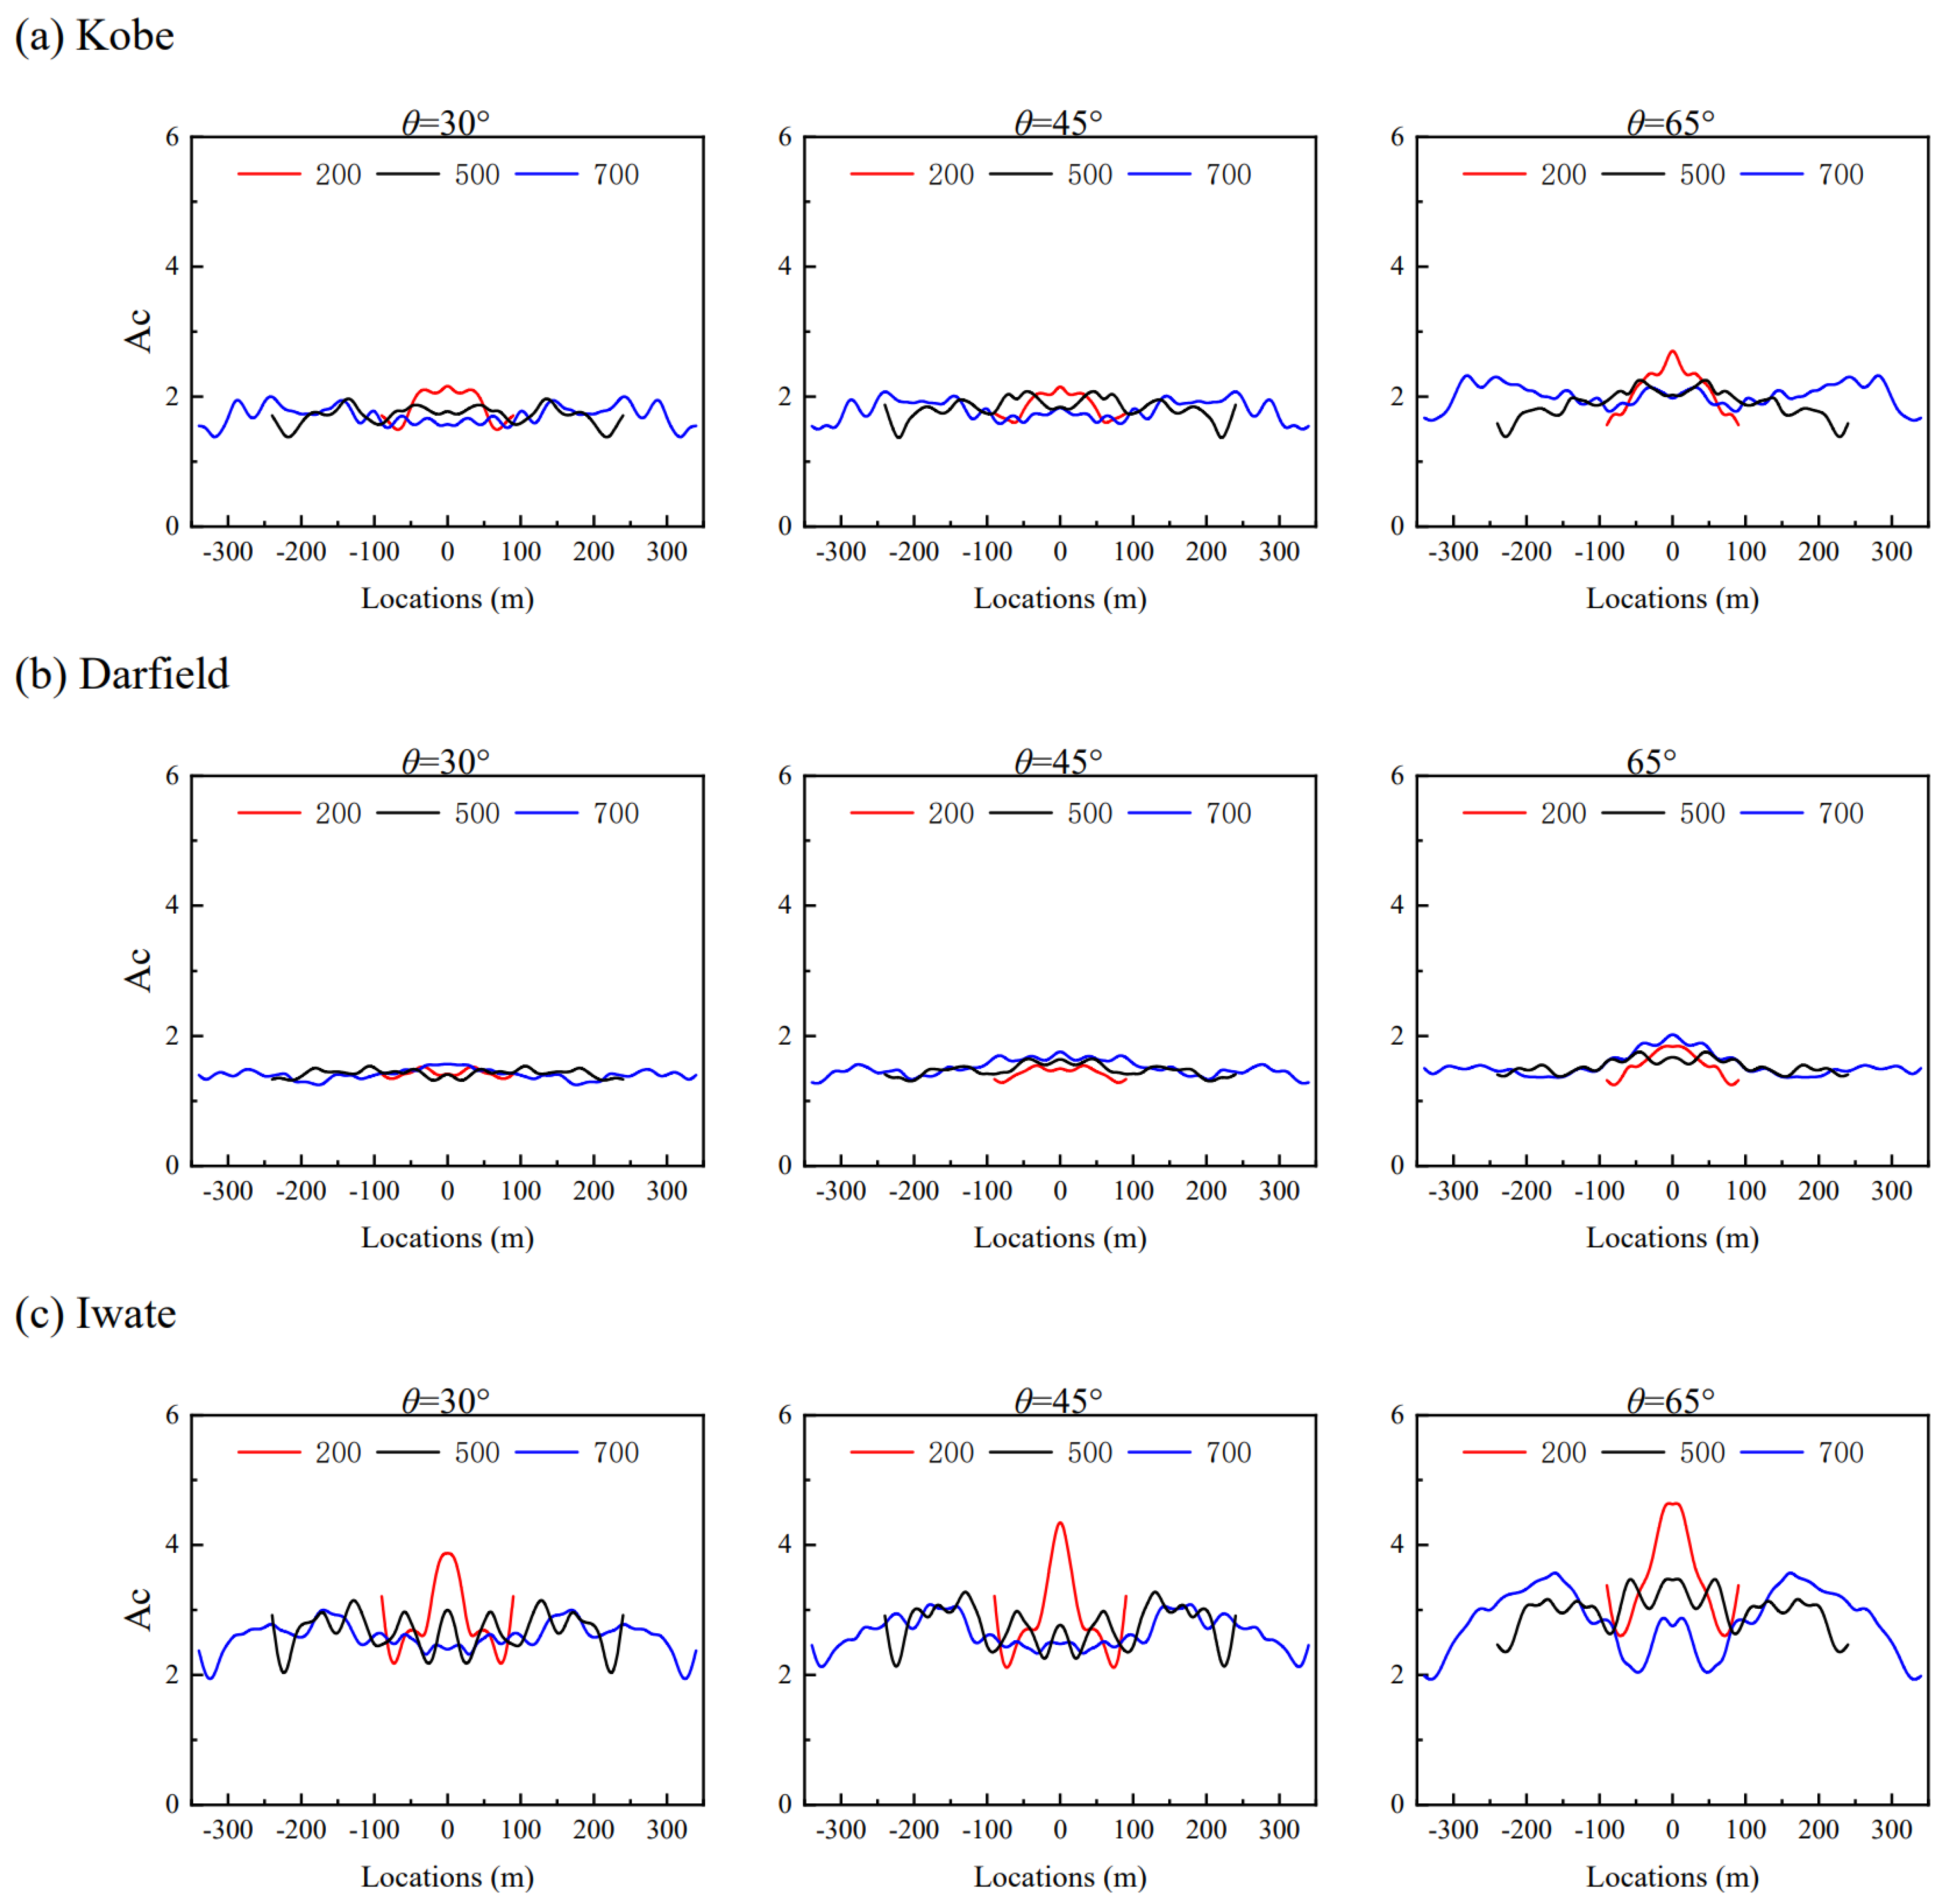
The influence of the bottom layer slope angle (θ) of the reef island on the peak ground motion distribution is mainly reflected in the position of the reef island slope surface. For the distribution of the horizontal ground motion peak, the influence is mainly reflected in the slope surface of the reef. For the vertical ground motion peak distribution, with the increase of the bottom slope of the island, the vertical ground motion peak distribution of the island slope is closer to the vertical ground motion distribution of the free-field. The larger the bottom slope angle and the more high-frequency components of ground motion input, the larger the amplification coefficient corresponding to the peak of ground motion on the reef platform surface will be.
(2)
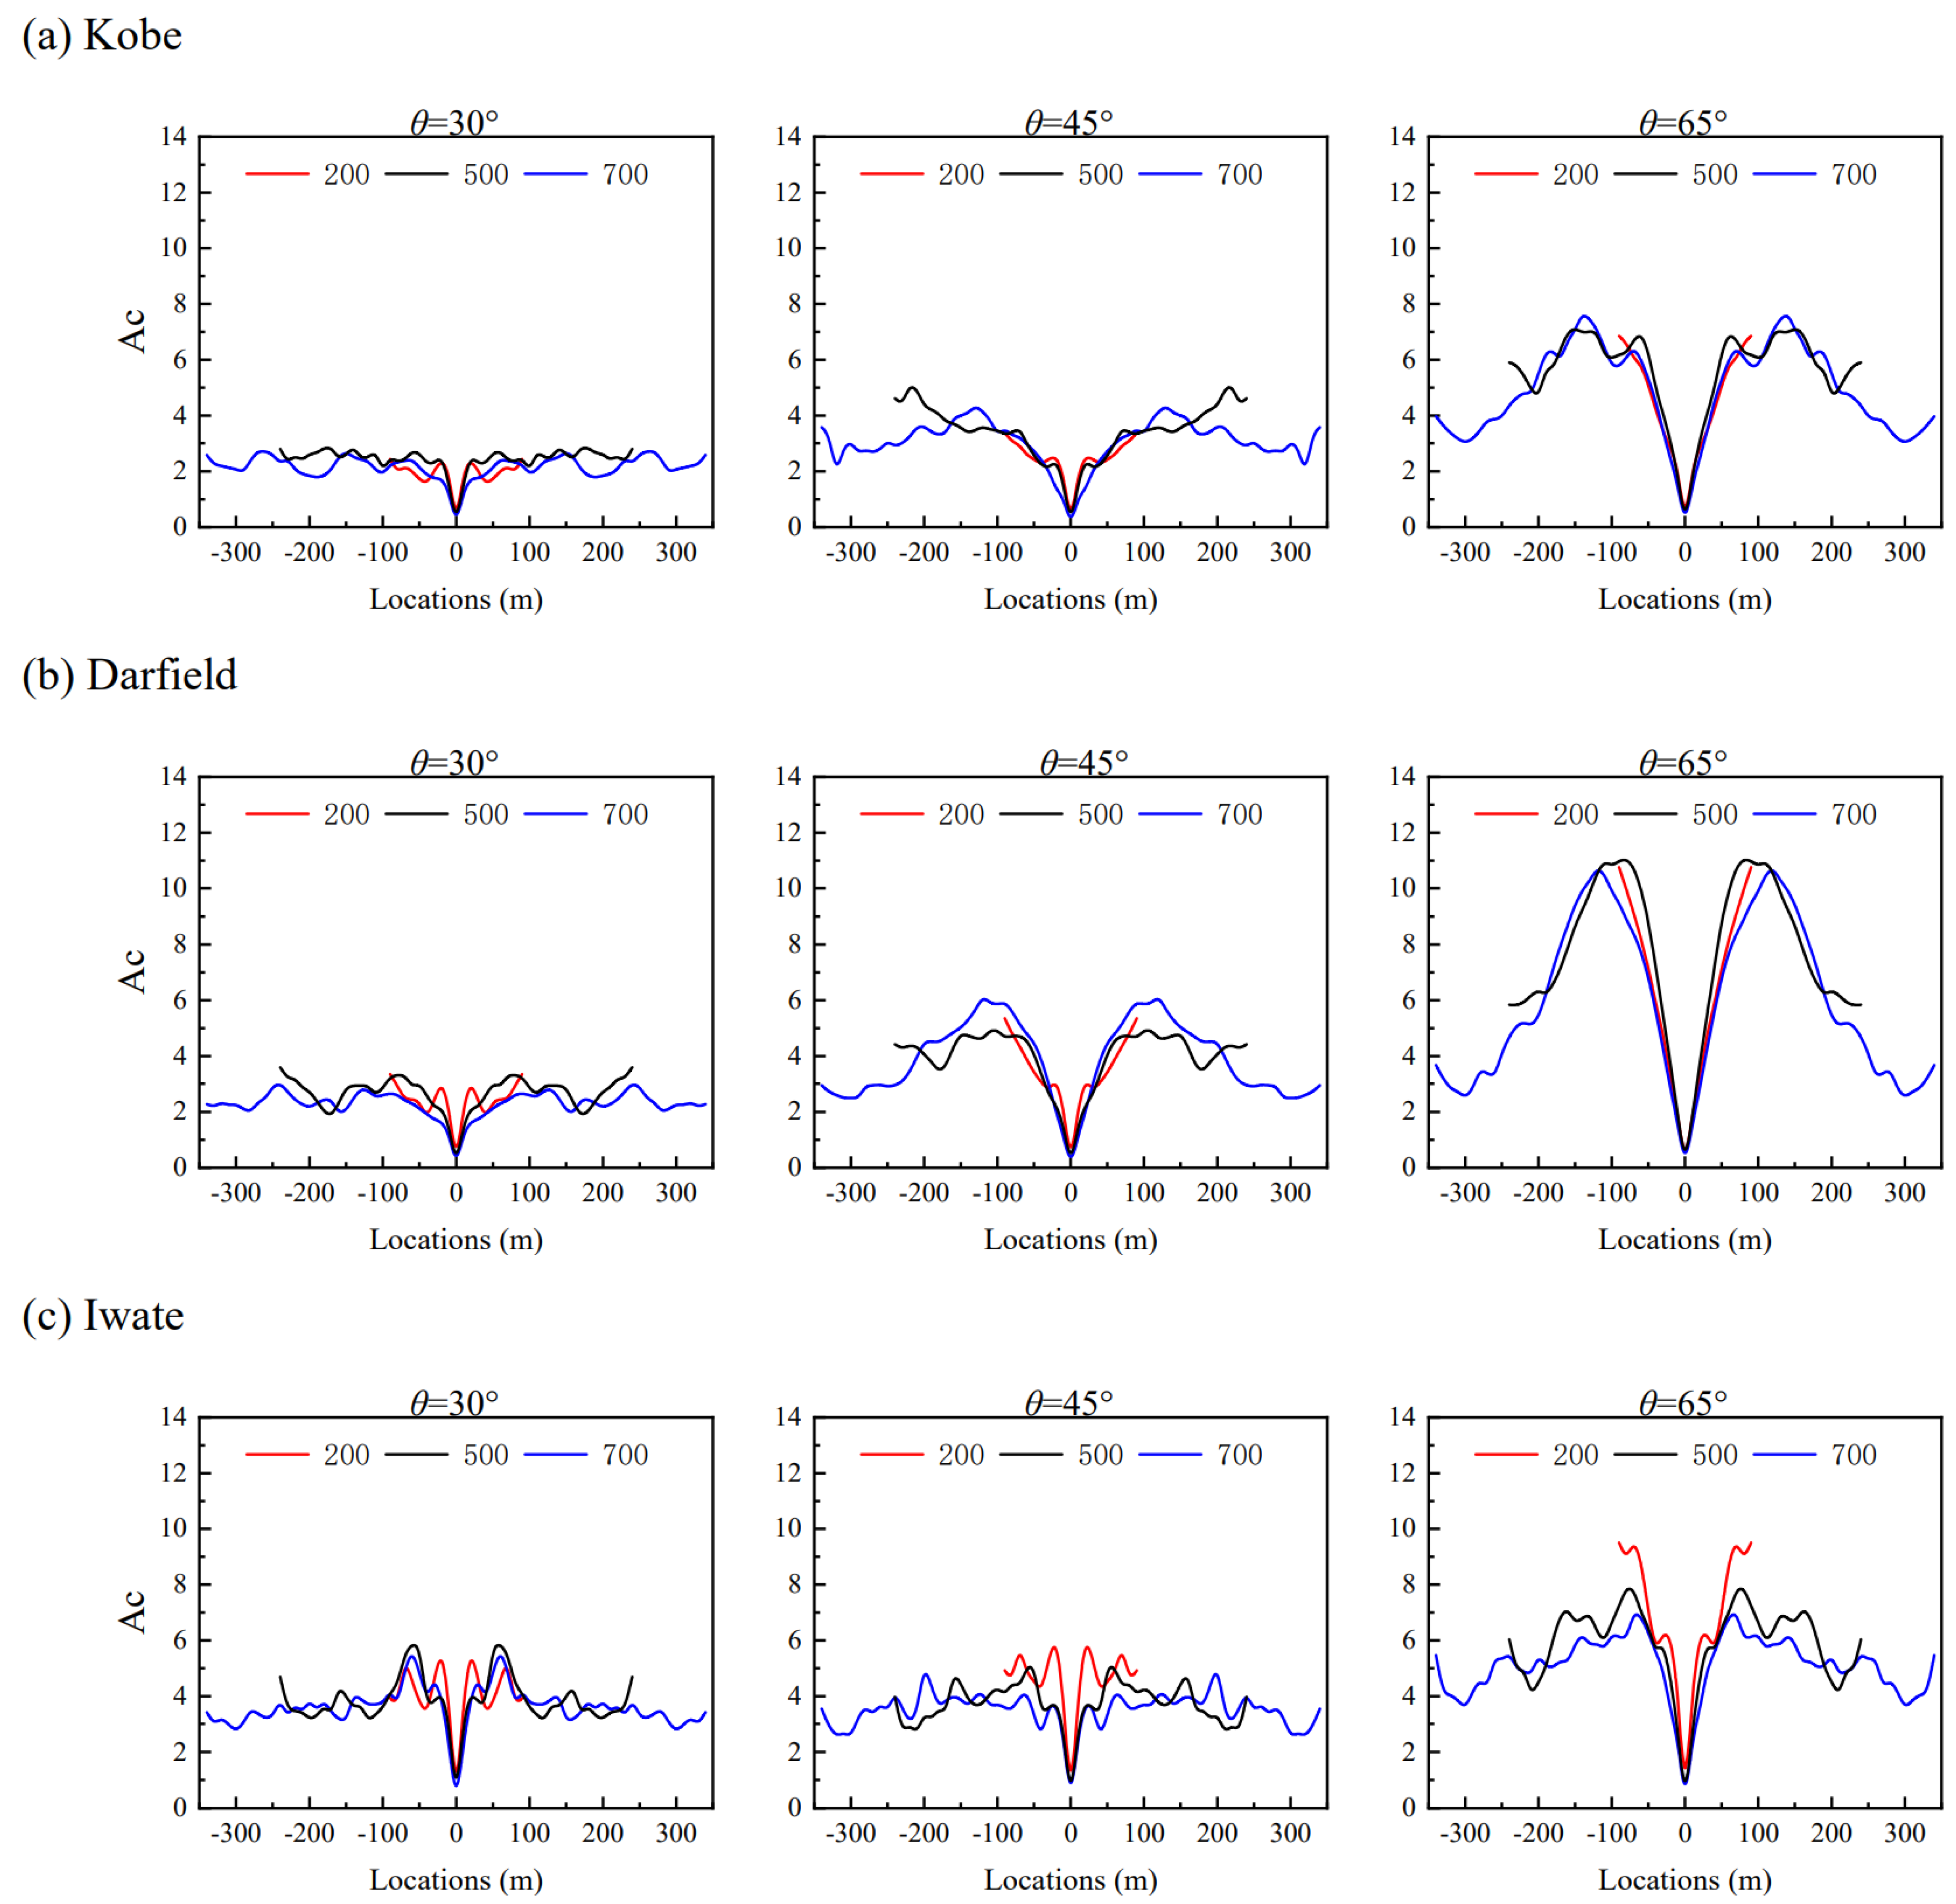
The influence of the reef platform width (L) on the peak acceleration distribution is reflected in the peak distribution and peak size on the island slope surface and the reef platform surface. The extent of this influence will decrease as the slope angle (θ) increases. For high-frequency input, a smaller reef platform width will induce a larger peak acceleration response on the reef platform surface. For vertical peak ground motion distribution, it is usually shown that high-frequency input motion will cause a large peak ground motion response within a small platform width.
(3)
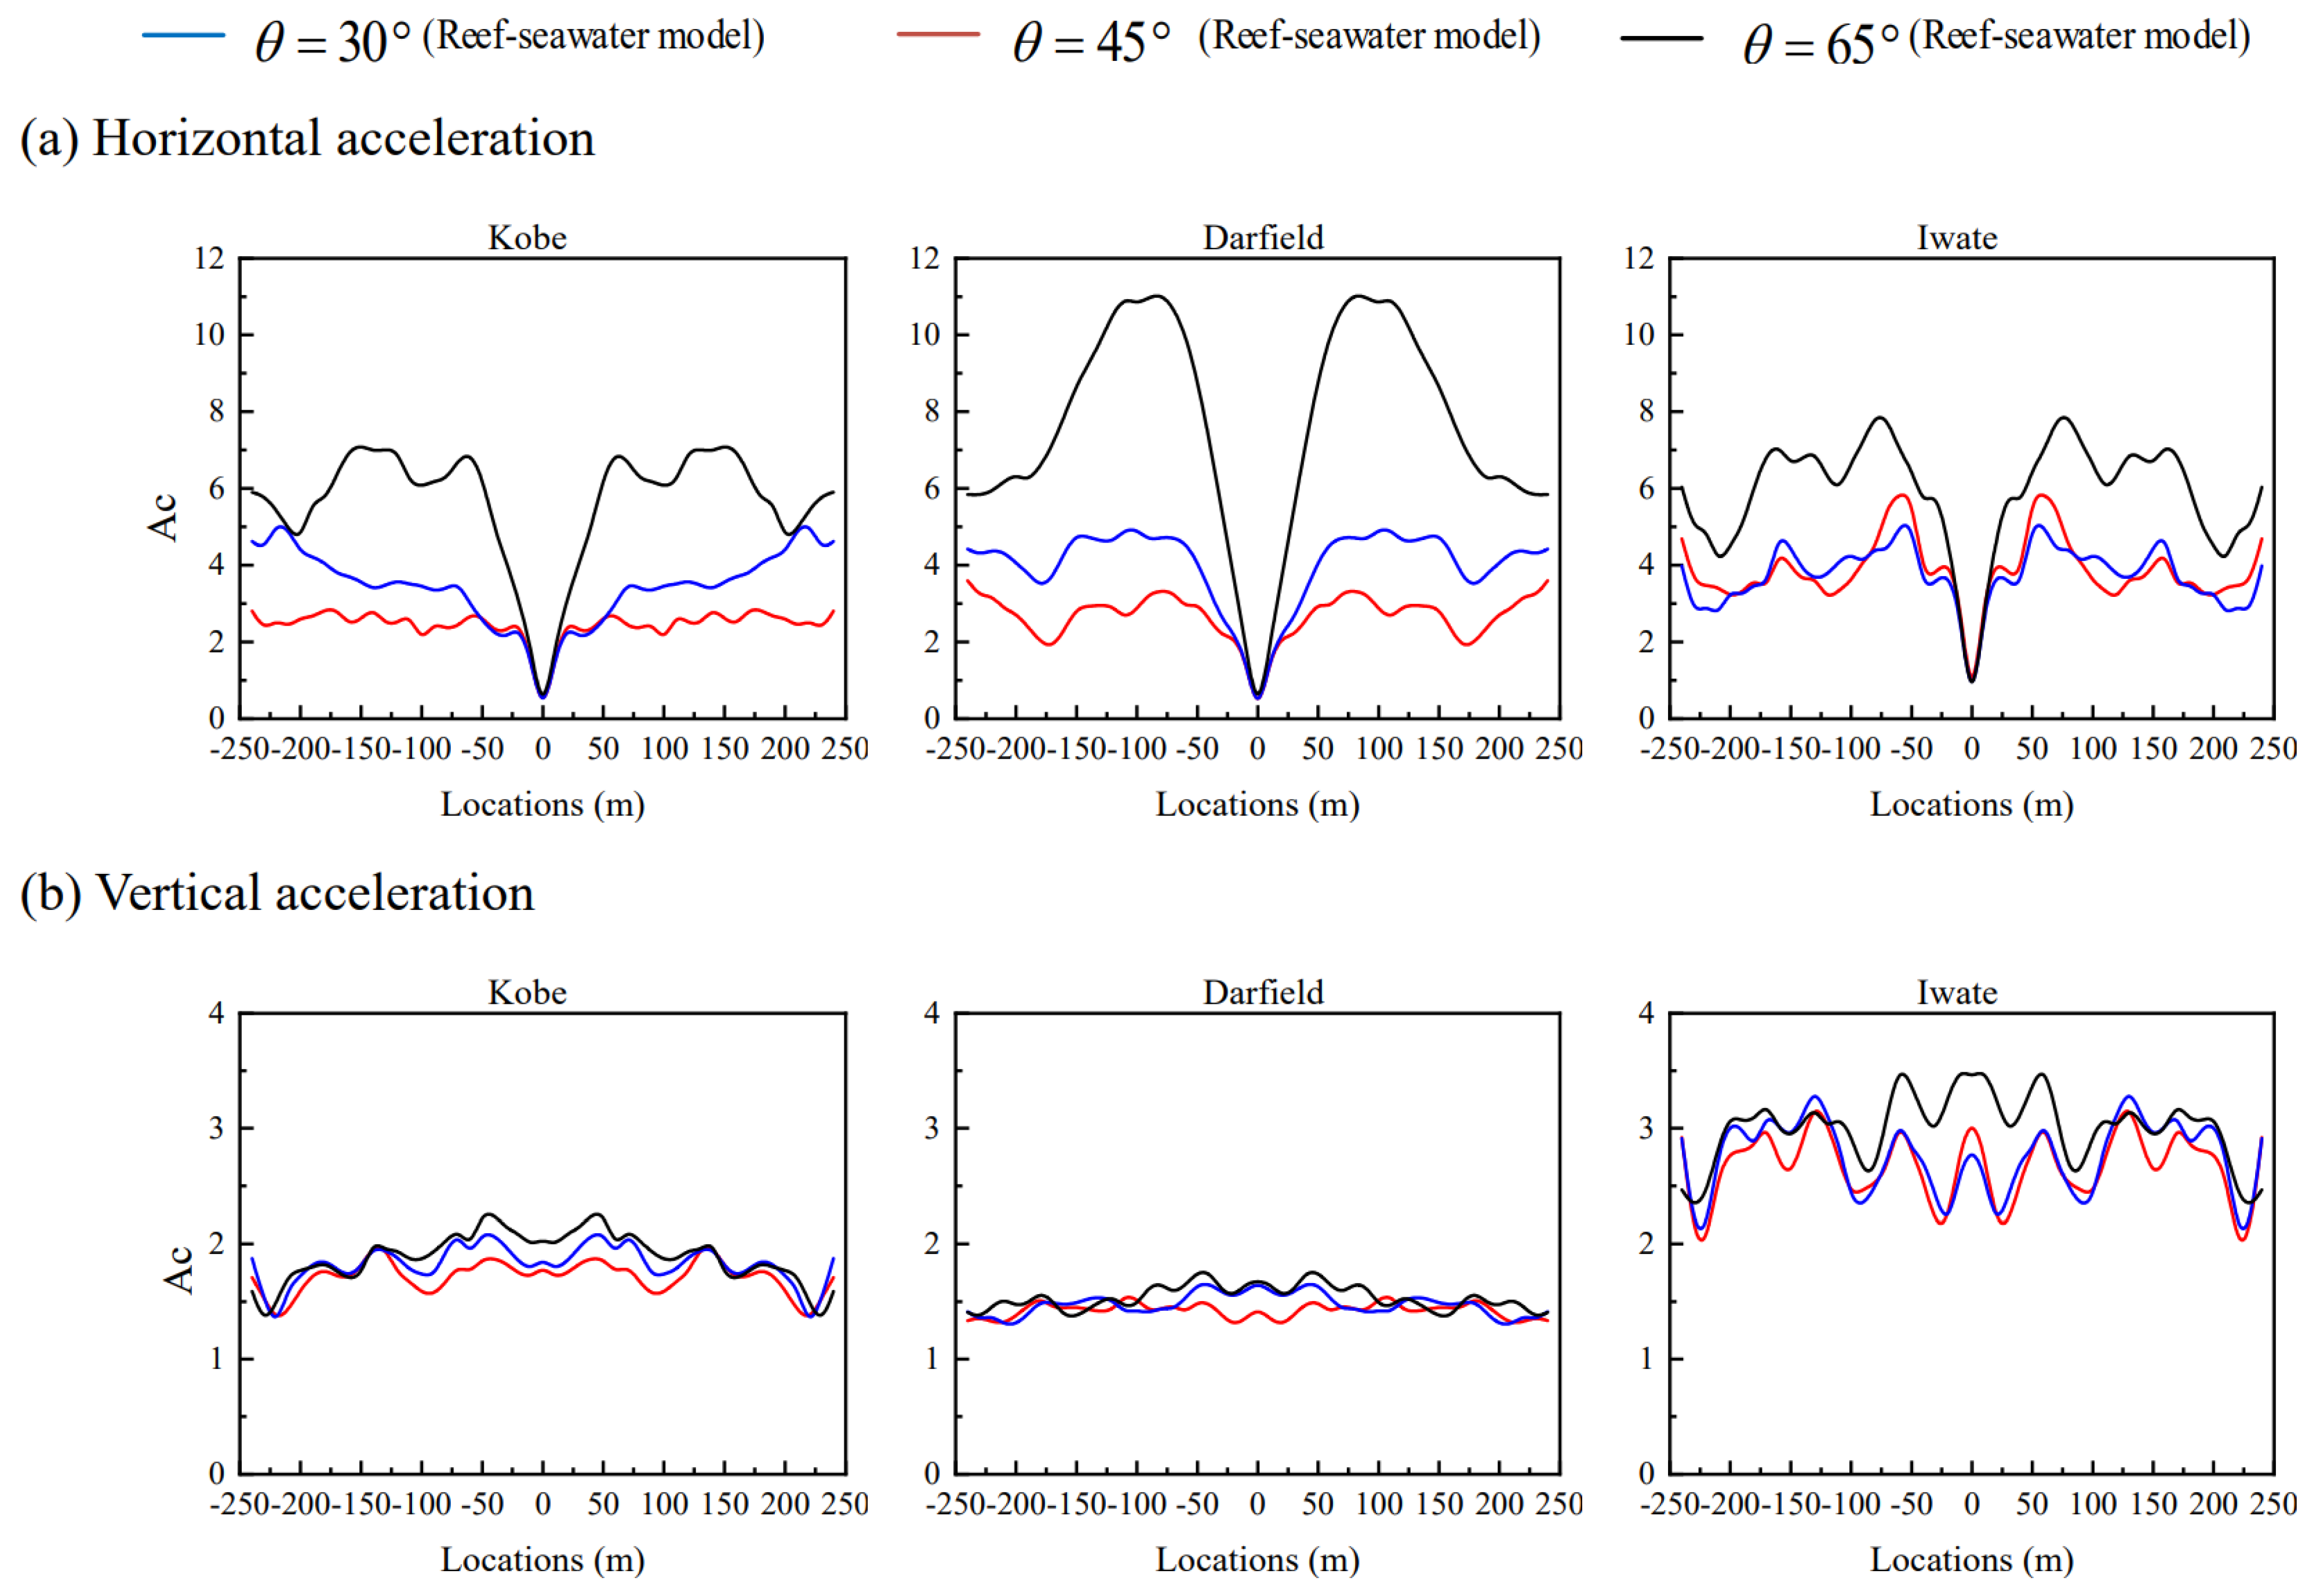
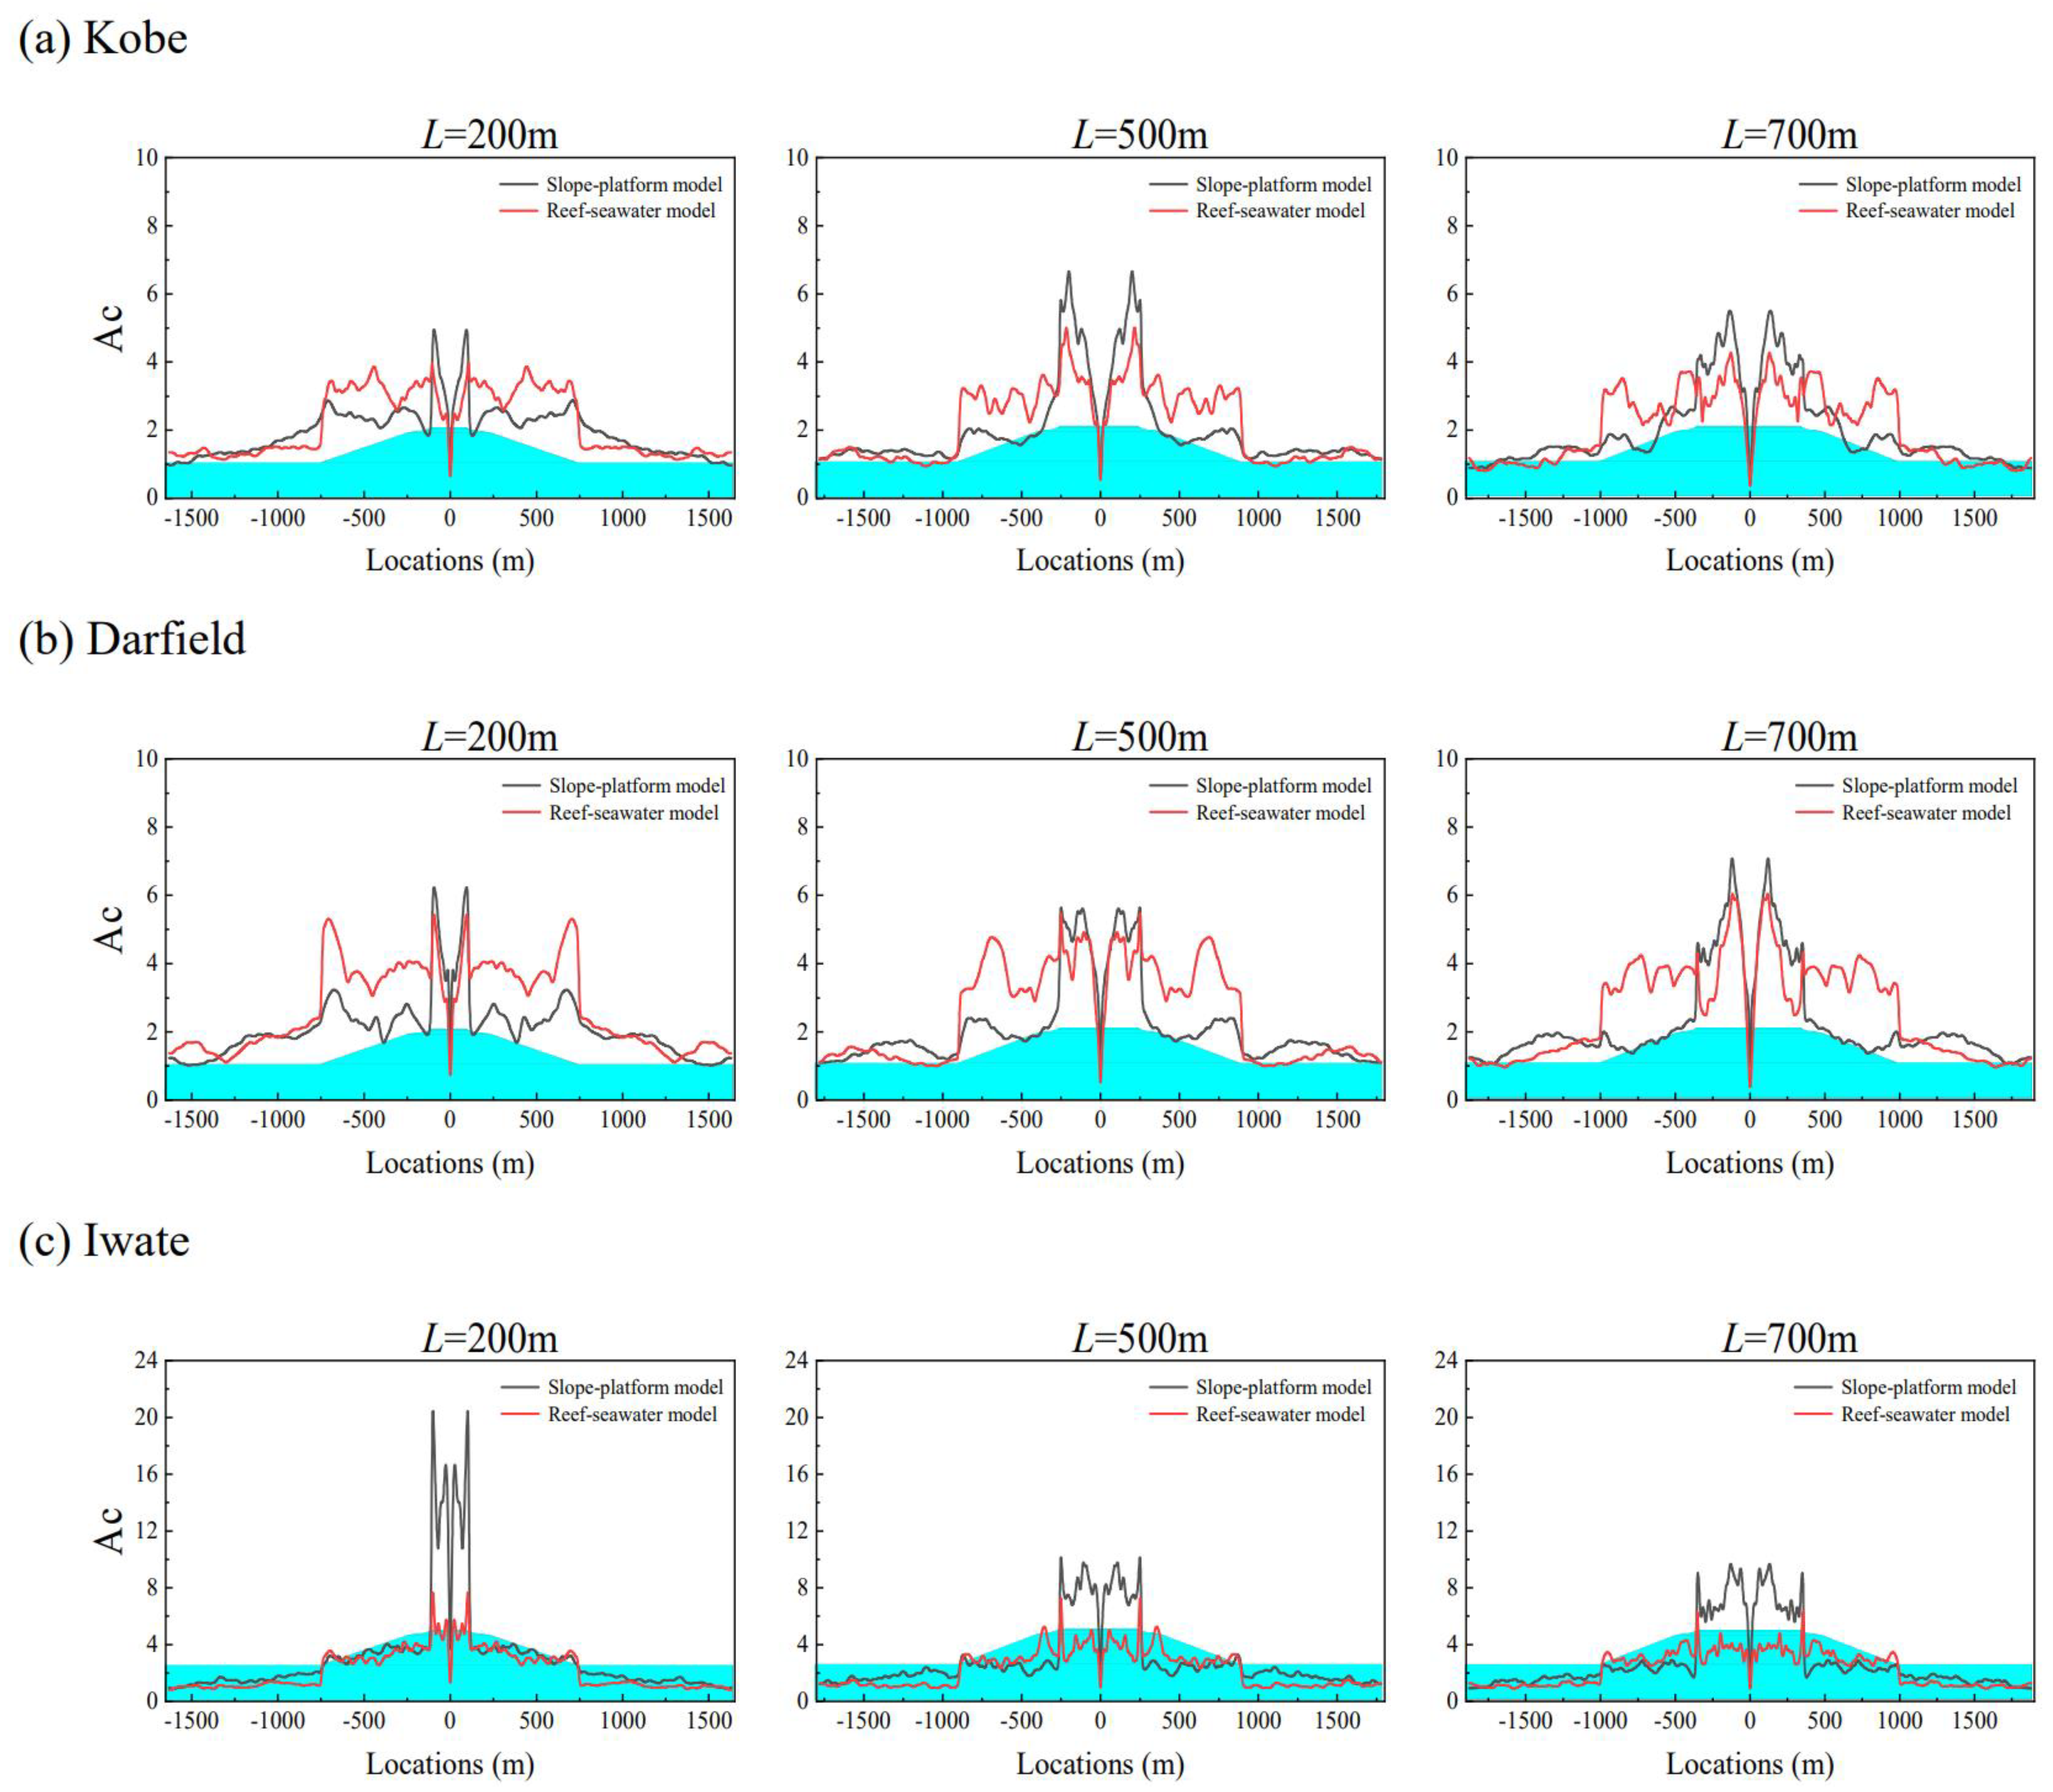
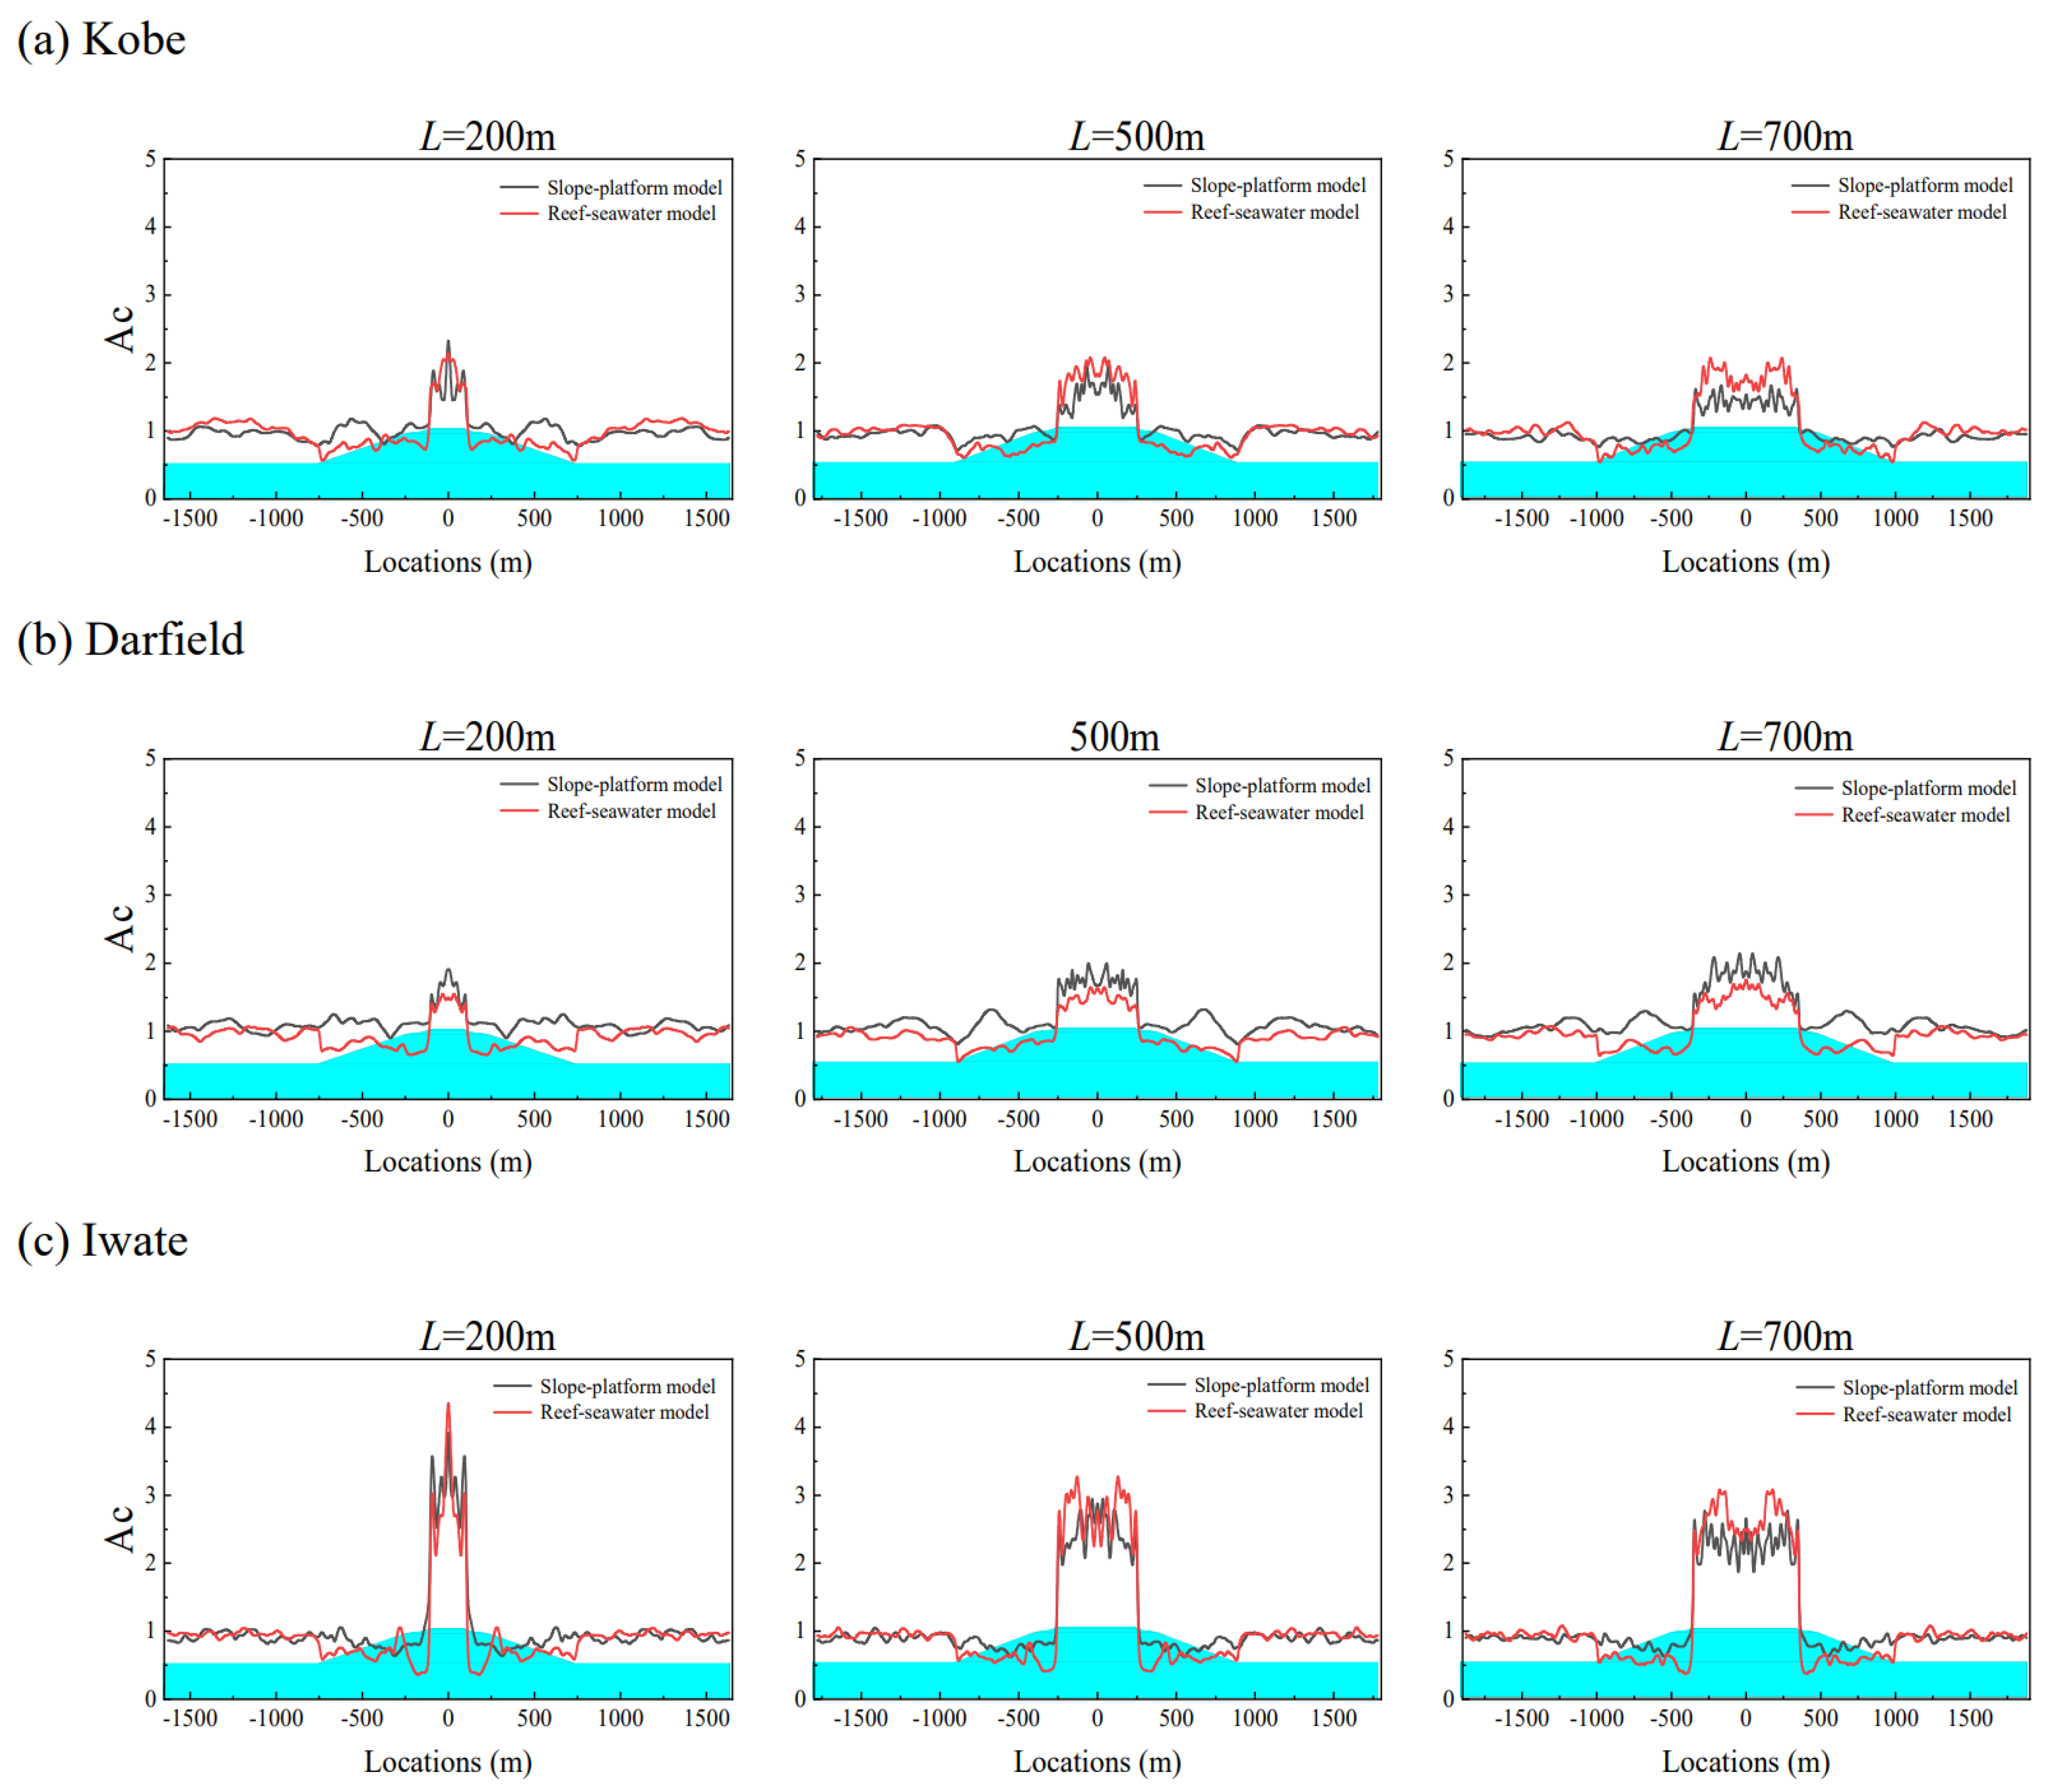
Seawater has a significant suppressive effect on vertical ground motion. The more high-frequency components of the input ground motion, the more obvious this suppression effect will be. The influence of the seawater layer is mainly reflected in the seismic peak distribution on the slope of the reef and the surrounding seabed. Due to the suppression effect of seawater layer on vertical ground motion, the maximum horizontal acceleration of the island–seawater model is obviously greater than that of the slope–platform model, while the maximum vertical acceleration is smaller than that of the slope–platform model.
(4)
The existence of the lagoon will amplify the maximum peak acceleration on the reef platform, and the degree of this amplification is closely related to the slope angle (θ), the reef platform width (L), and the spectral components of the input ground motion. According to the results of different working conditions, the lagoon can amplify the maximum horizontal and vertical peak accelerations on the reef platform by about 19 and 6 times relative to the corresponding free-field results, respectively.
It is worth noting that the study in this article assumes that the medium of the reef site is a linear elastic medium. However, under the action of large earthquakes, the medium of the reef will enter a nonlinear stress-strain state. Therefore, in subsequent research, it is necessary to propose a constitutive model for the reef limestone medium that can describe its nonlinear stress and strain state to conduct a nonlinear seismic response analysis of the reef site.

Author Contributions

L.J.: methodology, conceptualization, validation, formal analysis, visualization, and writing—original draft, review, and editing. L.D.: validation, formal analysis, data curation, and writing—original draft. Z.Z.: supervision, investigation, and writing—review and editing. X.B.: methodology, software, validation, visualization, and writing—review and editing. All authors have read and agreed to the published version of the manuscript.

Funding

This work was supported by the National Key R&D Program of China (2023YFC3007400) and the Beijing Natural Science Foundation (Grant No. 8232016).

Data Availability Statement

The raw data supporting the conclusions of this article will be made available by the authors on request.

Conflicts of Interest

The authors declare that they have no known competing financial interests or personal relationships that could have appeared to influence the work reported in this paper.

References

  1. Chang, Y.C.; Xin, S.R.; Zhang, X. A Proposal for Joint Marine Scientific Research Activities in the Disputed Maritime Areas of the South China Sea. Coast. Manag. 2022, 50, 215–236. [Google Scholar] [CrossRef]
  2. Vahdani, S.; Pyke, R.; Siriprusaned, U. Liquefaction of Calcareous Sands and Lateral Spreading Experienced in Guam as a Result of the 1993 Guam Earthquake; US National Center for Earthquake Engineering Research: Buffalo, NY, USA, 1994. [Google Scholar]
  3. Brandes, H.G.; Nicholson, P.G.; Robertson, I.N. Liquefaction of Kawaihae Harbor and other effects of 2006 Hawaii earthquakes. In Proceedings of the 17th International Offshore and Polar Engineering Conference, Lisbon, Portugal, 1–6 July 2007; International Society of Offshore and Polar Engineers: Cupertino, CA, USA, 2007; pp. 1169–1176. [Google Scholar]
  4. Green, R.A.; Olson, S.M.; Cox, B.R.; Rix, G.J.; Rathje, E.; Bachhuber, J.; French, J.; Lasley, S.; Martin, N. Geotechnical aspects of failures at Port-au-Prince seaport during the 12 January 2010 Haiti earthquake. Earthq. Spectra 2011, 27 (Suppl. S1), S43–S65. [Google Scholar] [CrossRef]
  5. Elgamal, A.W.; Zeghal, M.; Parra, E. Liquefaction of reclaimed island in Kobe, Japan. J. Geotech. Eng. 1996, 122, 39–49. [Google Scholar] [CrossRef]
  6. Hamada, M.; Nakamura, S.; Ohsumi, T. The 1999 Jiji Earthquake Taiwan: Investigation into Damage to Civil Engineering Structures; Japan Society of Civil Engineering: Tokyo, Japan, 1999. [Google Scholar]
  7. Trifunac, M.D. Scattering of plane SH waves by a semicylindrical canyon. Earthq. Eng. Struct. Dyn. 1972, 1, 267–281. [Google Scholar] [CrossRef]
  8. Wong, L.; Trifunac, M.D. Scattering of plane SH waves by a semi-elliptical canyon. Earthq. Eng. Struct. Dyn. 1974, 3, 157–169. [Google Scholar] [CrossRef]
  9. Wong, H.L.; Jennings, P.C. Effects of canyon topography on strong ground motion. Bull. Seismol. Soc. Am. 1975, 65, 1239–1259. [Google Scholar]
  10. Durante, M.G.; Brandenberg, S.J.; Ausilio, E.; Zimmaro, P. On the combined effect of topographic irregularities and wave passage on the spatial variation of seismic ground motion. Bull. Earthq. Eng. 2022, 20, 3577–3592. [Google Scholar] [CrossRef]
  11. Yuan, X.M.; Li, R.S.; Sun, R. A new generation method for earthquake response analysis of soil layers. China Civ. Eng. J. 2016, 49, 95–102. (In Chinese) [Google Scholar]
  12. Rachamadugu, R.; Vikash, G. Lateral Response of Hollow Circular Caisson Embedded in Nonlinear Soils. Int. J. Geomech. 2022, 22, 4021275. [Google Scholar] [CrossRef]
  13. Yang, J.; Yin, Z.Y. Soil-structure interface modeling with the nonlinear incremental approach. Int. J. Numer. Anal. Methods Geomech. 2021, 45, 1381–1404. [Google Scholar] [CrossRef]
  14. Huang, D.R.; Wang, G.; Wang, C.Y.; Jin, F. A Modified Frequency-Dependent Equivalent Linear Method for Seismic Site Response Analyses and Model Validation using KiK-Net Borehole Arrays. J. Earthq. Eng. 2020, 24, 827–844. [Google Scholar] [CrossRef]
  15. Stanko, D.; Markušić, S.; Gazdek, M.; Sanković, V.; Slukan, I.; Ivančić, I. Assessment of the Seismic Site Amplification in the City of Ivanec (NW Part of Croatia) Using the Microtremor HVSR Method and Equivalent-Linear Site Response Analysis. Geosci. 2019, 9, 312. [Google Scholar] [CrossRef]
  16. Dong, K.; Connolly, D.P.; Laghrouche, O.; Woodward, P.K.; Costa, P.A. Non-linear soil behaviour on high speed rail lines. Comput. Geotech. 2019, 112, 302–318. [Google Scholar] [CrossRef]
  17. Lysmer, J.; Kuhlemeyer, R.L. Finite dynamic model for infinite media. J. Eng. Mech. Div. 1969, 95, 859–878. [Google Scholar] [CrossRef]
  18. Deeks, A.J.; Randolph, M.F. Axisymmetric time-domain transmitting boundaries. J. Eng. Mech. 1994, 120, 25–42. [Google Scholar] [CrossRef]
  19. Liu, J.B.; Li, B. 3D viscoelastic static-dynamical uniform artificial boundary. Chin. Sci. Ser. E 2005, 35, 966–980. (In Chinese) [Google Scholar]
  20. Stanko, D.; Markušić, S. Site amplification model for Croatia estimated by random vibration theory-based site response analysis. Soil Dyn. Earthq. Eng. 2024, 179, 108547. [Google Scholar] [CrossRef]
  21. Castelli, F.; Grasso, S.; Lentin, I.V.; Sammito, M.S.V. Assessment of liquefaction effects on dynamic soil-structure interaction for the 1908 Messina and Reggio Calabria scenario earthquake. Soil Dyn. Earthq. Eng. 2024, 178, 108445. [Google Scholar] [CrossRef]
  22. Cavallaro, A.; Fiamingo, A.; Grasso, S.; Massimino, M.R.; Sammito, M.S.V. Local site amplification maps for the volcanic area of Trecastagni, south-eastern Sicily (Italy). Bull. Earthq. Eng. 2024, 22, 1635–1676. [Google Scholar] [CrossRef]
  23. Ye, J.H.; Jeng, D.S.; Chan, A.H.C.; Wang, R.; Zhu, Q.C. 3D integrated numerical model for fluid-structures-seabed interaction (FSSI): Loosely deposited seabed foundation. Soil Dyn. Earthq. Eng. 2017, 92, 239–252. [Google Scholar] [CrossRef]
  24. Chen, G.X.; Zhu, X.; Zhao, D.F.; Liu, J.R. Nonlinear seismic response characteristics of a coral island site. Chin. J. Geotech. Eng. 2019, 41, 405–413. (In Chinese) [Google Scholar]
  25. Mehl, M.; Uekermann, B.; Bijl, H.; Blom, D.; Gatzhammer, B.; Zuijlen, A. Parallel coupling numerics for partitioned fluid–structure interaction simulations. Comput. Math. Appl. 2016, 71, 869–891. [Google Scholar] [CrossRef]
  26. Ye, G.L.; Leng, J.; Jeng, D.S. Numerical testing on wave-induced seabed liquefaction with a poro-elastoplastic model. Soil Dyn. Earthq. Eng. 2018, 105, 150–159. [Google Scholar] [CrossRef]
  27. Soukissian, T.H. Probabilistic modelling of significant wave height using the extended generalized inverse Gaussian distribution. Ocean. Eng. 2021, 230, 109061. [Google Scholar] [CrossRef]
  28. Jin, L.G.; Duan, X.L.; Zhou, B.G.; Zhou, Z.H. Surface motion of P/SV wave scattering by a semicircular canyon in saturated half-space by complex function and conformal mapping. Soil Dyn. Earthq. Eng. 2023, 175, 108276. [Google Scholar] [CrossRef]
  29. Adibzade, M.; Shafieefar, M.; Akbari, H.; Panahi, R. Multi-peaked directional wave spectra based on extensive field measurement data in the Gulf of Oman. Ocean. Eng. 2021, 230, 109057. [Google Scholar] [CrossRef]
  30. Sui, T.; Staunstrup, L.; Carstensen, S.; Fuhrman, D. Span shoulder migration in three-dimensional current-induced scour beneath submerged pipelines. Coast. Eng. 2021, 164, 103776. [Google Scholar] [CrossRef]
  31. Bao, X.; Liu, J.B. Dynamic finite element analysis methods for liquid container considering fluid-structure interaction. Nucl. Power Eng. 2017, 38, 111–114. [Google Scholar]
  32. Liu, J.B.; Bao, X.; Wang, D.Y.; Tan, H.; Li, S.T. The internal substructure method for seismic wave input in 3D dynamic soil- structure interaction analysis. Soil Dyn. Earthq. Eng. 2019, 127, 105847. [Google Scholar] [CrossRef]
  33. Liao, Z.P. Introduction to Wave Motion Theories in Engineering; Science Press: Beijing, China, 2002. [Google Scholar]
  34. Tso, W.; Zhu, T.; Heidebrecht, A. Engineering implication of ground motion A/V ratio. Soil Dyn. Earthq. Eng. 1992, 11, 133–144. [Google Scholar] [CrossRef]
  35. Bao, X.; Liu, J.B.; Wang, D.Y.; Wang, J.P.; Guo, D.; Song, K. Seismic response analysis of offshore reef site under incident P wave. Eng. Mech. 2019, 36 (Suppl. S1), 1–7. (In Chinese) [Google Scholar]
Figure 1. The research framework diagram of this article.
Applsci 14 02515 g001
Figure 2. Two-dimensional model of reef-island–seawater system.
Applsci 14 02515 g002
Figure 3. Input ground motion time history and the response spectra.
Applsci 14 02515 g003
Figure 4. Correctness verification by comparing with the theoretical solution [35].
Applsci 14 02515 g004
Figure 5. Spatial distribution of peak acceleration of reef flat (L = 500 m).
Applsci 14 02515 g005
Figure 6. Distribution of horizontal peak acceleration on the reef island surface and seabed (L = 500 m).
Applsci 14 02515 g006
Figure 7. Distribution of vertical peak acceleration on the reef island surface and seabed (L = 500 m).
Applsci 14 02515 g007
Figure 8. Distribution of horizontal peak acceleration on the reef platform with different reef platform widths.
Applsci 14 02515 g008
Figure 9. Distribution of vertical peak acceleration on the reef platform with different reef platform widths.
Applsci 14 02515 g009
Figure 10. Horizontal ground motion peak acceleration distribution on the seabed and reef island surface.
Applsci 14 02515 g010
Figure 11. Vertical ground motion peak acceleration distribution on the seabed and reef island surface.
Applsci 14 02515 g011
Figure 12. Comparison of the horizontal ground motion peak acceleration distribution on reef island and seabed with and without seawater (θ = 45°).
Applsci 14 02515 g012
Figure 13. Comparison of the vertical ground motion peak acceleration distribution on reef island and seabed with and without seawater (θ = 45°).
Applsci 14 02515 g013
Figure 14. Two-dimesional model of reef-island–lagoon interaction system.
Applsci 14 02515 g014
Figure 15. Comparison of the horizontal peak ground motion distribution on the reef island and seabed of the models with and without lagoon under Kobe ground motion excitation.
Applsci 14 02515 g015
Figure 16. Comparison of the horizontal peak ground motion distribution on the reef island and seabed of the models with and without lagoon under Darfield ground motion excitation.
Applsci 14 02515 g016
Figure 17. Comparison of the horizontal peak ground motion distribution on the reef island and seabed of the models with and without lagoon under Iwate ground motion excitation.
Applsci 14 02515 g017
Figure 18. Comparison of the vertical peak ground motion distribution on the reef island and seabed of the models with and without lagoon under Kobe ground motion excitation.
Applsci 14 02515 g018
Figure 19. Comparison of the vertical peak ground motion distribution on the reef island and seabed of the models with and without lagoon under Darfield ground motion excitation.
Applsci 14 02515 g019
Figure 20. Comparison of the vertical peak ground motion distribution on the reef island and seabed of the models with and without lagoon under Iwate ground motion excitation.
Applsci 14 02515 g020
Table 1. Topography size and medium parameters of the reef-island site.
ParametersLayer 1Layer 2Layer 3Seabed
Velocity of shear wave (m/s)500180020002200
Velocity of longitudinal wave (m/s)1225448548355000
Mass density (kg/m3)2000240027002700
Poisson’s ratio0.40.4040.380.38
Slope gradient (°)6030θ/
Height (m)2080500600
Table 2. Parameters for verification.
MediaParameterValue
FluidMass density (kg/m3)1000
Velocity of longitudinal wave (m/s)1435
SolidMass density (kg/m3)2700
Velocity of longitudinal wave (m/s)5000
Velocity of shear wave (m/s)2200
Table 3. Amplification factors of the maximum horizontal peak acceleration of the reef platform under different working conditions corresponding to Figure 15, Figure 16 and Figure 17.
Input MotionL
(m)
θ
(°)
Reef–Seawater
Model
(m/s2)
Island–Lagoon
Model
(m/s2)
Free-Field
(m/s2)
Ac
Reef–Seawater ModelIsland–Lagoon Model
Kobe200302.3244.0680.6413.6266.346
452.3535.773 3.6719.006
654.3967.4336.85811.596
500302.4294.2883.7896.690
453.2685.1255.0987.995
654.5735.8957.1349.197
700302.0814.1813.2466.523
452.7894.1164.3516.421
654.9316.0807.6939.485
Darfield200302.0812.5160.4494.6355.604
452.5154.211 5.6019.379
654.8277.15110.75115.927
500301.9732.2814.3945.080
452.6152.8345.8246.312
654.9666.16411.06013.728
700301.4992.9743.3396.624
452.7553.5526.1367.911
654.8154.96310.72411.053
Iwate200304.3248.2620.5408.00715.300
454.37110.335 8.09419.139
655.75610.49010.65919.426
500304.3728.3388.09615.441
454.5328.0838.39314.969
654.2838.4307.93115.611
700303.4437.5886.37614.052
453.3287.7476.16314.346
653.8107.8227.05614.485
Table 4. Amplification factors of the maximum vertical peak acceleration of the reef platform under different working conditions corresponding to Figure 18, Figure 19 and Figure 20.
Input MotionL
(m)
θ
(°)
Reef–Seawater
Model
(m/s2)
Island–Lagoon Model
(m/s2)
Free-Field
(m/s2)
Ac
Reef–Seawater ModelIsland–Lagoon Model
Kobe200304.5165.3782.0422.2122.634
454.5365.5272.2212.707
655.7546.5022.8183.184
500304.0455.1771.9812.535
454.2835.4812.0972.684
654.6446.2402.2743.056
700304.1595.0352.0372.466
454.3135.4872.1122.687
654.8466.4292.3733.148
Darfield200302.9742.8881.9311.5401.496
453.0304.0621.5692.104
654.1136.4942.1303.363
500303.0033.4381.5551.780
453.2123.7401.6631.937
653.3945.1791.7582.682
700303.0443.3891.5761.755
453.4483.5301.7861.828
653.9664.6772.0542.422
Iwate200308.4359.9932.1753.8784.594
459.83912.6924.5245.835
6510.21712.3924.6975.697
500307.0188.6323.2273.969
457.3089.4003.3604.322
657.73910.8273.5584.978
700306.6098.1223.0393.734
456.8318.5373.1413.925
657.8739.5923.6204.410
Disclaimer/Publisher’s Note: The statements, opinions and data contained in all publications are solely those of the individual author(s) and contributor(s) and not of MDPI and/or the editor(s). MDPI and/or the editor(s) disclaim responsibility for any injury to people or property resulting from any ideas, methods, instructions or products referred to in the content.

