Abstract
Background: Non-ST-elevation myocardial infarction (NSTEMI), a disease of mounting interest, continues to pose challenges and cast shadows of doubt on determining the optimal timing for revascularization. The current guidelines on NSTEMI recommend coronary angiography based on the GRACE score, emphasizing the critical need for early invasive assessment (within 24 h); very-high-risk patients have to undergo this intervention even sooner, within 2 h. We believe that a reality check of these assumptions is needed and that we should endeavor to update these strategies using new predictive markers. Materials and methods: Our study included patients hospitalized for NSTEMI over the course of 16 months. Simple blood parameters, namely MCV (mean corpuscular volume), MPV (mean platelet volume), RDW (red blood cell distribution width), and PDW (platelet distribution width), were analyzed in correlation with the extent of the myocardial infarction area and with complications during hospitalization and at 30-day follow-up. Results: The parameters mentioned above have been identified as statistically relevant indicators of prognosis in patients with NSTEMI. Conclusions: In the present day, living in the world of the blue sky concept allows us to search for new diagnostic algorithms. Therefore, the combination of these parameters can constitute the DNA strands of a new and up-to-date score stratification.
1. Introduction
Akin to a formidable opponent in a never-ending chess game that is constantly strategizing and adapting in which the king is left vulnerable to an inevitable checkmate, the rate of mortality in acute coronary syndrome (ACS) remains high despite the evolution in patient management [1,2,3,4]. Considering that most scores used to classify the group risk in NSTEMI were developed between 2007 and 2019, an up-to-date advanced score risk is sorely needed.
RDW, which reflects the variation in erythrocyte size, was positively correlated with increased mortality in cardiovascular diseases [5]. The explanation is straightforward: a higher value results in a greater variation in red blood cell size, which is further affected by the decrease in blood flow during myocardial infarction [6]. The study conducted by Polat N. showed a direct relationship between high RDW and higher GRACE scores in NSTEMI patients [7]. Furthermore, prior research has indicated that a higher MCV value means a higher mortality in individuals with ACS [8,9].
In the pathophysiology of ACS, platelet activation and aggregation play a crucial role. The development of atherosclerosis is significantly influenced by platelet aggregation and inflammation. Moreover, the size of platelets plays a role in determining their activity level, with larger platelets promoting the process of thrombosis. Epidemiological studies have demonstrated that PDW and MPV, as markers of platelet hyperreactivity and hypersecretion of pro-inflammatory factors, are positively correlated with the extent of myocardial infarction and implicit prognosis [10,11,12,13].
Currently, there are insufficient data to support the routine use of immediate coronary angiography in all NSTEMI patients. The objective of this research was to assess if the aforementioned parameters could serve as new predictive markers and whether, in the era of machine learning, we might be able to create a new up-to-date risk score that can provide additional benefits in immediate angiography and replace the GRACE score.
2. Materials and Methods
2.1. Study Design and Study Population
This study was carried out as prospective observational research within the Cardiology Department of “Bagdasar-Arseni” Emergency Hospital in Bucharest, Romania. A total number of 136 patients were evaluated for enrollment in our study between January 2022 and April 2023.
NSTEMI was diagnosed according to the symptoms of angina pectoris or their equivalents, elevated cardiac biomarkers, electrocardiogram with myocardial ischemia signs—without changes consistent with STEMI, and abnormal echocardiography indicating myocardial ischemia [14]. The inclusion criteria consisted of patients aged 18 and older bearing the diagnosis of NSTEMI. After implementing the exclusion criteria, which encompassed inflammatory conditions such as collagen vascular disorders, autoimmune diseases, neoplastic conditions, acute or chronic infections, severe liver and/or kidney ailments, hematological disorders, recent bleeding episodes, and radiation/chemotherapy within the preceding 30 days, a total of 98 NSTEMI patients were included in the research study.
Their demographic data (age, ethnicity, and gender), anthropometric measurements (BMI—body mass index), medical history (old myocardial infarction or another disease that could interfere with our results—see the exclusion criteria above), additional cardiovascular comorbidities (arterial hypertension, diabetes mellitus, dyslipidemia, smoking, and obesity), laboratory data (complete blood count, NT-proBNP, admission and peak high sensitive troponin, admission and peak creatine kinase, and creatine kinase-MB, creatinine, AST, ALT, and LDH) were collected. The demographical, anthropometric, main clinical, and main laboratory parameters (MCV, RDW, MPV, and PDW), which we have tried to correlate with prognosis, are presented in the table below (Table 1). Regarding the diagnosis of infection, which compels us to exclude the respective patients (see exclusion criteria), we defined the presence of an infection by the following: a PSEP exceeding 300 pg/mL and increased ESR and fibrinogen. For a comprehensive blood analysis, we obtained 2 milliliters of blood through venous puncture within 10 min of the patient’s arrival. The blood was subsequently analyzed using a Beckman Coulter ACT5 diff AL autoanalyzer to determine key hematological parameters such as MCV, RDW, MPV, and PDW. For measuring NT-proBNP, the ELISA technique was employed on a Pathfast-compact immunolyzer autoanalyzer. The laboratory’s standard reference range for MCV was 7.4–10.4 fl, RDW was 11.5–15.5%, MPV was 7.4–10.4 fl, and PDW was 0–99%. Any disruptions in kidney function were identified by a serum creatinine level exceeding 1.3 mg/dl for men and 1.1 mg/dl for women. A heightened level of NT-proBNP, indicating cardiac decompensation, was denoted by levels exceeding 300 pg/mL.

Table 1.
Primary features of the study cohort.
Any medication regimen the patients had been following prior to hospitalization was also recorded, with an emphasis on antihypertensive medication, oral antidiabetic agents, B-blockers, diuretics, antiagreggants, anticoagulants, and lipid-lowering agents.
Upon admission to the hospital, we assessed all factors included in the GRACE (Global Registry of Acute Coronary Events) risk score, such as age, heart rate, systolic blood pressure, baseline serum creatinine level, Killip class, cardiac arrest at admission, elevated cardiac markers, and ST-segment deviation [15]. The decision for surgical revascularization was predominantly based on the characteristics of the coronary artery lesion. Factors such as the lesion’s location, size, and complexity had a critical impact on determining the necessity of surgery. It is worth noting that this decision was individualized and involved the input of a diverse team of healthcare professionals, which included cardiologists and cardiac surgeons [14].
The main outcomes were defined as the composite of Killip class III/IV, in-hospital mortality, one-month mortality, duration of hospitalization, necessity of cardiovascular surgical intervention, and triple vessel disease. Follow-up was carried out by monitoring 30-day mortality or survival on the national health insurance platform and by contacting the patients or their families directly via a telephone call.
The research was carried out in compliance with principles outlined in the Declaration of Helsinki and was approved by the Ethics Committee of “Carol Davila” University of Medicine and Pharmacy, Bucharest, Romania (protocol code PO-35-F-03, dated 1 October 2021). All participants provided written informed consent and steps were taken to ensure complete anonymity of the data.
2.2. Statistical Analysis
The statistical analysis involved the use of linear and logistic regression models. The graphical representations of the statistical results employed boxplots, histograms, distribution representations, and receiver operating characteristics (ROC) curves. Data modeling was performed using the Python programming language, along with the classic modeling packages such as pandas, numpy, and statsmodels.
In assessing the statistical significance of the regression model, a p-value threshold of 0.05 was utilized to determine its significance. From the regression analysis, a mathematical formula was derived as follows: Score for event Y = .
Where X is the potential predictor used to check whether it is likely to be a real predictor. Having the beta 0 and beta 1 estimated we could compute the score. To obtain more interpretability from this model and the score obtained, we convert the score into probability. For that, we use the following classic relationship between score and probability from the logistic regression theory: probability = .
To analyze the cut-off value of MCV, RDW, MPV, and PDW in predicting Killip class III–IV, we used the ROC curve analysis.
3. Results
Demographic data reveal that all patients were of Caucasian ethnicity with an average age of 63 years old. As for the cardiovascular risk factors, 56.7% were dyslipidemic, 39.2% had diabetes mellitus, 36.1% had a BMI greater than 30 kg/m2, and 79.4% were hypertensive. Concerning the results obtained by means of coronary angiography, 28.9% of patients received an indication for surgical revascularization, while 36.1% were diagnosed with triple vessel disease. As to the main laboratory parameters analyzed in our study, the mean MCV value within the cohort was 88.61 fl, the mean RDW value was 14.133%, the mean MPV was 9.42%, and the mean PDW value was 17% (Table 1).
3.1. Correlation between MCV, RDW, MPV, PDW, and Other Laboratory Parameters
Table 2 presents the potential correlations between MCV, RDW, MPV, PDW, and the laboratory parameters that we intended to analyze.
Table 2.
Correlation between MCV, RDW, MPV, PDW, and other laboratory parameters.
We investigated the potential correlation between the values of MCV, RDW, MPV, PDW, and renal function. Our dataset revealed a relevant relationship between RDW and creatinine (r = 0.050, p < 0.05) (Figure 1), as well as between MPV and creatinine (r = 0.047, p < 0.05) (Figure 2). However, no statistically notable association was observed between PDW, MCV, and creatinine levels (Table 2).
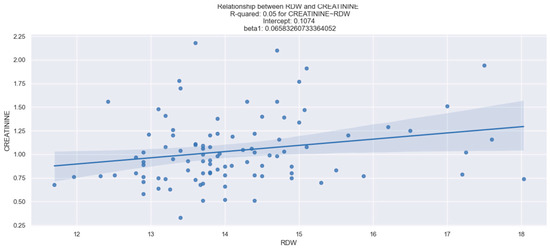
Figure 1.
Linear relationship between RDW and creatinine. The figure is an original contribution by the authors.
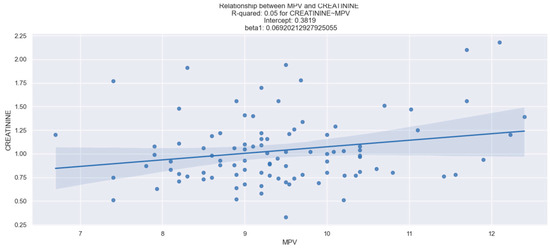
Figure 2.
Linear relationship between MPV and creatinine. The figure is an original contribution by the authors.
The NT-proBNP level was measured for each patient upon admission. We observed a statistically reliable interdependence between NT-proBNP and RDW (Figure 3). However, there was no relevant relationship between MCV, MPV, PDW, and the values of NT-proBNP (Table 2).
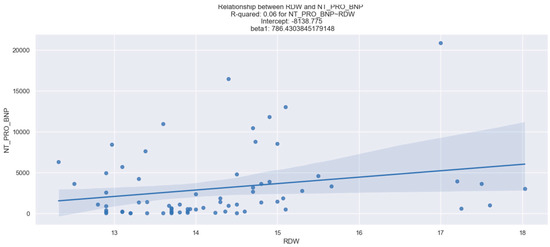
Figure 3.
Linear relationship between RDW and NT-proBNP. The figure is an original contribution by the authors.
Furthermore, our results showed no significant statistical correlation between the infarct size (measured by admission creatine-kinase, admission creatine kinase-MB, high-sensitivity troponin, peak creatine-kinase, peak creatine kinase-MB, and peak high-sensitivity troponin) and the parameters we proposed (Table 2).
Regarding the history of antiplatelet therapy, our findings did not indicate any significant effect of these drugs on MPV or PDW values, as demonstrated in Table 3.
Table 3.
Correlation between MPV, PDW, and antiplatelet therapy.
3.2. Correlation between MCV, RDW, MPV, PDW, and KILLIP Class III–IV in NSTEMI Patients
In this research, there was no notable pattern of interdependence between RDW, PDW, and Killip class III/IV. However, in contrast to these outcomes, a reliable relationship between MCV, MPV, and the probability of injuries consistent with Killip class III–IV in NSTEMI patients was demonstrated (Table 4).
Table 4.
Correlation between MCV, RDW, MPV, PDW, and KILLIP class III–IV in NSTEMI patients.
3.2.1. Correlation between MCV and KILLIP Class III–IV in NSTEMI Patients
We demonstrated the relationship between MCV and Killip class III–IV using a linear regression analysis, as displayed in Table 5.
Table 5.
Logistic regression applied to NSTEMI patients based on MCV values.
Based on the information provided in Table 5, we can draw the following conclusions. 1. The p value (0.029) linked to the MCV coefficient confirms that there is a significant association between higher MCV values and a higher risk of developing Killip class III–IV; 2. The R-square value of 0.0577 indicates that approximately 5.77% of the variability in developing Killip class III–IV can be accounted for by changes in the MCV values; 3. The coefficient for MCV is 0.1134, suggesting that for every one-unit increase in MCV, the score (which could be converted into probability) of developing Killip class III–IV increases by 0.1134.
The resulting model is as follows: score (representing the likelihood of class III–IV Killip in NSTEMI) = −11.6527 + 0.1134 × MCV value. Using this model, we can calculate the scores for different patients, for example, in the case of a patient with an MCV value of 100 fl, the score is = −11.6527 + 0.1134 × 100 = −0.3127. Since scores such as −0.3127 are not easily interpreted, they can be translated into probabilities using the following equation: .
The calculated likelihood for the above individual is 0.47, indicating a 47% chance of developing Killip class III–IV.
This information is further illustrated in Figure 4.
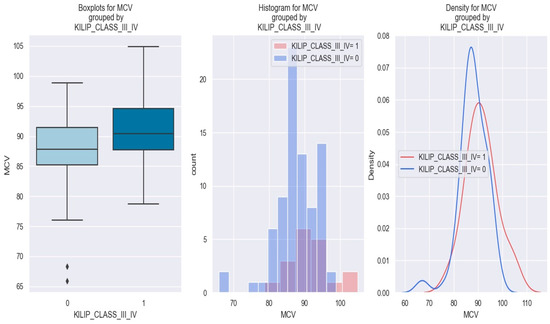
Figure 4.
MCV levels in individuals with NSTEMI Killip class III–IV vs. without Killip class III–IV. The diamond symbol means an aberrant value. The colors represent different values. The figure is an original contribution by the authors.
In Figure 4, the graphical representation demonstrates that patients with a high MCV value (i.e., over 90 fl) possess a higher risk of being stratified as Killip class III–IV compared to those with low MCV values.
The optimal cut-off value of MCV in predicting Killip class III–IV in NSTEMI patients was determined by the Youden index from the ROC results. An MCV of 104 fl was found to be the best threshold, with optimal sensitivity and specificity (Figure 5).
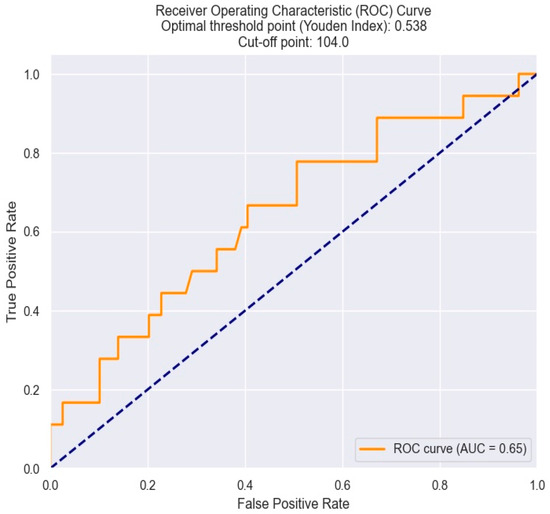
Figure 5.
ROC curve for predicting Killip class III–IV based on the MCV value. The figure is an original contribution by the authors.
Figure 6 demonstrates the relationship between MCV values and the likelihood of a patient developing Killip class III–IV. As indicated by the logistic regression analysis, as MCV increases, the likelihood of patients being in Killip class III–IV also increases. For example, patients with an MCV of 100 fl had a 45% chance of developing Killip class III–IV, compared with a probability of 28% in individuals with an MCV of 90 fl.
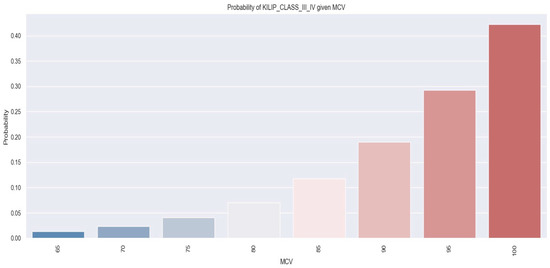
Figure 6.
Likelihood of individuals developing Killip class III–IV derived from MCV value. The figure is an original contribution by the authors.
Therefore, drawing from the arguments presented above, it can be deduced that the MCV value can serve as a predictor of severe heart failure following NSTEMI. Additionally, by employing a threshold value of 104 fl, we can pinpoint individuals who are at risk of experiencing this complication.
3.2.2. Correlation between MPV and Killip Class III/IV
On the other hand, as mentioned previously, MPV serves as an important indicator for predicting Killip class III–IV in NSTEMI patients.
Concerning the possible pattern of interdependence between MPV and the development of Killip class III–IV in NSTEMI individuals, it was found that as the MPV level increases, the risk of Killip III/IV also rises. These data are graphically represented in Figure 7.
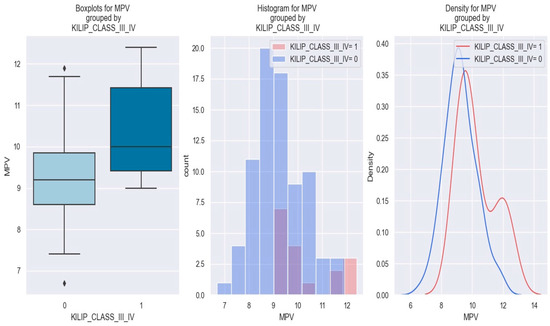
Figure 7.
MPV value in patients with NSTEMI Killip class III–IV vs. without Killip class III–IV. The diamond symbol means an aberrant value. The colors represent different values. The figure is an original contribution by the authors.
The phenomenon described above can be better understood by utilizing a logistic regression model (Table 6).
Table 6.
Application of the logistic regression analysis to NSTEMI individuals using MPV values.
This model helps us forecast the likelihood of a patient with NSTEMI developing Killip class III–IV in accordance with the MPV values. The model utilized in this instance is as follows: the occurrence of Killip class III–IV = −9.5357 + 0.8224 × MPV. For a patient with an MPV of 9 fl, the computation using the formula yields a score of −2.1. Consequently, the likelihood of a patient with NSTEMI and an MPV of 9 fl to develop Killip class III–IV is 0.108, which signifies a 10.8% chance.
Based on the data above, it can be concluded that the MPV value can be used as a predictor of the probability of developing Killip class III–IV in NSTEMI patients.
Regarding the optimal cut-off value of MPV in predicting Killip class III–IV in NSTEMI patients, this was also determined by the Youden index from the ROC results. An MPV of 11.7 fl shows optimal sensitivity and specificity and appears to be the best threshold value (Figure 8).
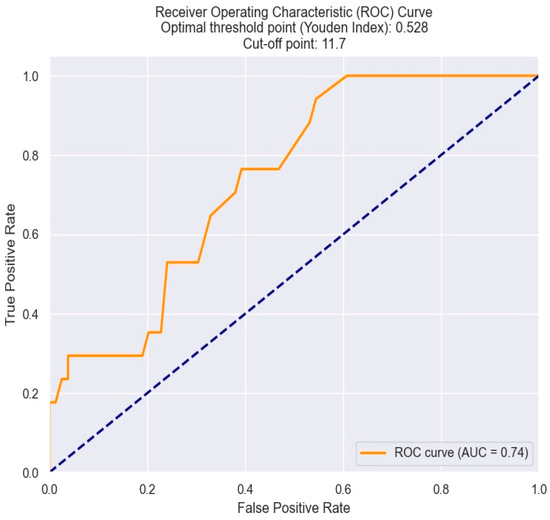
Figure 8.
Receiver operating characteristics analysis and curve for predicting Killip class III–IV based on MPV value. The figure is an original contribution by the authors.
According to the previously discussed points, it can be concluded that the MPV value can predict the development of severe heart failure following NSTEMI. Furthermore, by using a threshold value of 11.7, we can identify individuals who may be at heightened risk of experiencing this complication.
3.3. Correlation between MCV, RDW, MPV, PDW, and the Necessity of Surgical Revascularization in NSTEMI Patients
In our research, we discovered a reliable relationship between the value of RDW and the clinician’s ability to predict the necessity of surgical revascularization in NSTEMI patients. However, we did not demonstrate any notable association between MCV, MPV, PDW, and the need for surgical revascularization in NSTEMI patients (Table 7).
Table 7.
Correlation between MCV, RDW, MPV, PDW, and indication for surgical revascularization.
Our findings revealed that NSTEMI patients with high RDW values have a higher probability of needing surgical revascularization. This relationship is depicted in Figure 9, which demonstrates that patients with NSTEMI and RDW exceeding 15 had higher probabilities of necessitating surgical revascularization.
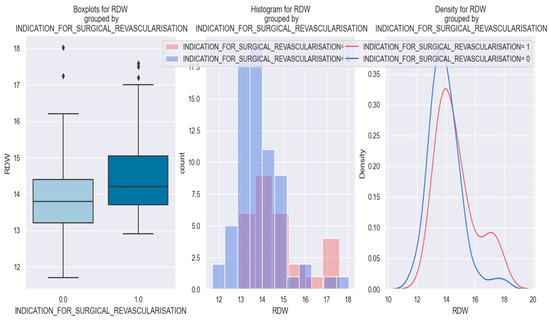
Figure 9.
RDW value in patients with NSTEMI and necessity of surgical revascularization vs. patients without necessity of surgical revascularization. The diamond symbol means an aberrant value. The colors represent different values. * The figure is an original contribution by the authors.
The logistic regression model, as illustrated in Table 8, provides us with the coefficients required to predict the necessity of surgical revascularization in patients with NSTEMI based on an RDW value.
Table 8.
Logistic regression applied to NSTEMI patients based on an RDW value.
This model allows us to estimate the likelihood of a patient with NSTEMI and a certain RDW value needing surgical revascularization. In this scenario, the model operates as follows: the rating for the requirement of surgical revascularization is determined by the formula −8.2315 + 0.5142 × RDW value. Let us consider an NSTEMI patient with an RDW value of 17%. By plugging this value into the equation, the score for this patient is calculated as 0.5099. Therefore, the probability that an NSTEMI patient with an RDW value of 17 would need surgical revascularization is 0.624, indicating a 62.4% chance of the event (necessitating surgical revascularization) occurring.
Figure 10 outlines the relationship between an RDW value and the necessity of surgical revascularization.
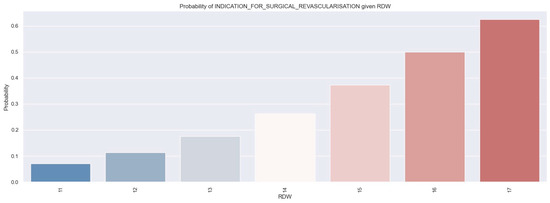
Figure 10.
Probability of patients receiving an indication for surgical revascularization based on RDW values by applying a logistic regression model. The figure is an original contribution by the authors.
According to the logistic regression, as the RDW value increases, the likelihood of an individual needing surgical revascularization also increases. For example, individuals with an RDW of 17% had a 60% chance of needing surgical revascularization.
To establish the cut-off value of RDW beyond which there is a high risk of necessitating surgical revascularization, we used the ROC curve. Thus, the identified threshold value was determined to be 16% (Figure 11).
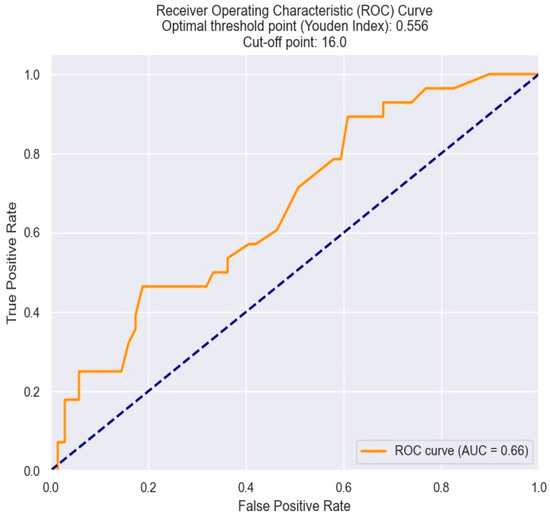
Figure 11.
ROC curve for predicting the indication for surgical revascularization based on the RDW value. The figure is an original contribution by the authors.
Therefore, starting from the arguments presented above, it can be affirmed that the RDW value can be indicative of the likelihood of requiring surgical revascularization in a patient with NSTEMI.
3.4. Correlation between MCV, RDW, MPV, PDW, and Triple Vessel Disease
Within our study, apart from the direct correlation between RDW and the need for surgical revascularization, we also demonstrated a significant relationship between RDW and triple vessel disease. However, despite this association, we did not demonstrate a reliable relationship between MCV, MPV, PDW, and triple vessel disease (Table 9).
Table 9.
Correlation between MCV, RDW, MPV, PDW, and triple vessel disease.
All three graphics displayed below show that patients with NSTEMI and triple vessel disease tend to have a higher RDW (more precisely—above 14) than those without triple vessel disease (Figure 12).
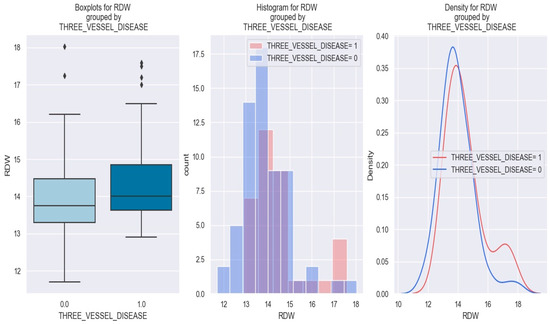
Figure 12.
RDW value in patients with NSTEMI and triple vessel disease vs. without triple vessel disease. The diamond symbol means an aberrant value. The colors represent different values. The figure is an original contribution by the authors.
Figure 13 displays the relationship between RDW and the probability of having triple vessel disease.
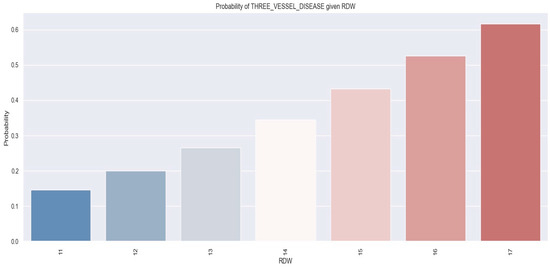
Figure 13.
Likelihood of individuals having triple vessel disease derived from RDW values using a logistic regression model. The figure is an original contribution by the authors.
The logistic regression analysis suggests that as the RDW value increases, there is a tendency for the likelihood of patients being diagnosed with triple vessel disease to also increase. For instance, individuals who had an RDW level of 17% showed a 62% chance of being diagnosed with triple vessel disease, whereas those with an RDW value of 12% had a 20% likelihood of having triple vessel disease.
To determine the threshold RDW value beyond which there is a high risk of having triple vessel disease, we utilized the ROC curve. Hence, the critical value was found to be 17% (Figure 14).
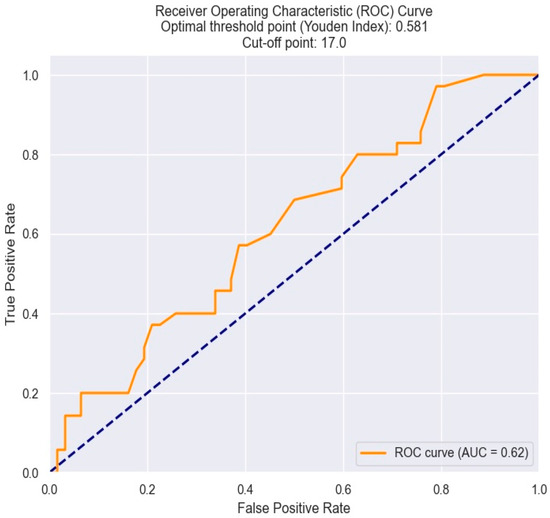
Figure 14.
Receiver operating characteristics analysis and curve for predicting triple vessel disease based on an RDW value. The figure is an original contribution by the authors.
Looking at the logistic regression analysis, the calculated parameters outlined in Table 10 allow us to establish the likelihood of being diagnosed with triple vessel disease according to the RDW value.
Table 10.
Logistic regression for NSTEMI individuals and triple vessel disease considering an RDW value.
This method utilizes the maximum likelihood estimation (MLE) to calculate the coefficients of the model.
The estimated model is the following: score (representing the likelihood of having triple vessel disease) = −5.8627 + 0.3729 × RDW value. Using this model, let us envision a patient with an RDW value of 17%. The score would be =0.4766. The probability would be 0.615, indicating a 61.5% chance that this patient has triple vessel disease.
3.5. Correlation between MCV, RDW, MPV, PDW, and 30-Day Mortality
Regarding the potential use of MCV, MPV, RDW, and PDW as predictors of one-month mortality, our findings indicate that only PDW demonstrated this predictive capability (Table 11).
Table 11.
Correlation between MCV, RDW, MPV, PDW, and 30-day mortality.
Based on the information provided in the table below (Table 12), the following conclusions can be drawn. 1. The p value = 0.03 linked with the PDW coefficient validates a reliable relationship between elevated PDW values and an increased risk of one-month mortality; 2. The R-square value of 0.1689 indicates that approximately 16.89% of the variability in 30-day mortality can be accounted for by changes in the PDW values; 3. The coefficient for PDW is 1.6545, suggesting that for every one-unit increase in PDW, the one-month mortality rises by 11.65%.
Table 12.
Logistic regression applied to NSTEMI patients and one-month mortality based on PDW values.
The estimated model is the following: score (representing the likelihood of one-month mortality) = −31.2314 + 1.6545 × PDW value. Using this model, we can calculate the scores for different patients, for instance, for a patient with a PDW value of 18%, the score is =−31.2314 + 1.6545 × 18= −1.4504. Since these results (i.e., scores such as −1.4504) do not provide much ease of interpretation, we can convert them into probabilities using the equation = .
The probability for the patient above is 0.189, representing an 18.9% chance of one-month mortality.
The optimal cut-off value of PDW in predicting one-month mortality in NSTEMI patients was determined by the Youden index from the ROC results. A PDW at 19% was found to be the best threshold, featuring optimal sensitivity and specificity (Figure 15).
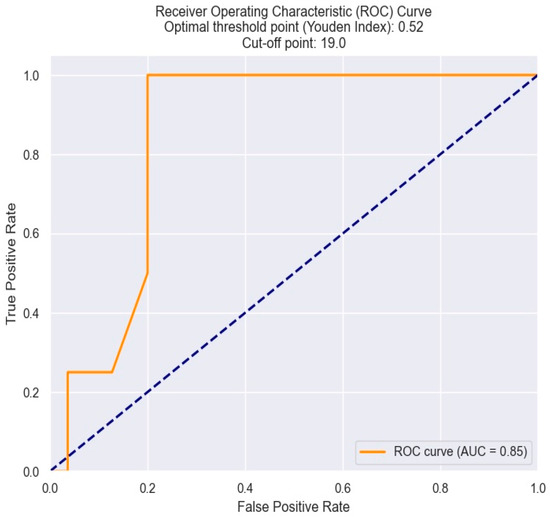
Figure 15.
ROC curve for predicting one-month mortality based on an PDW value. The figure is an original contribution by the authors.
The three graphics below show that patients with NSTEMI and high values of PDW tend to have a higher risk of one-month mortality—more exactly, patients with a PDW value above 17.5% (Figure 16).
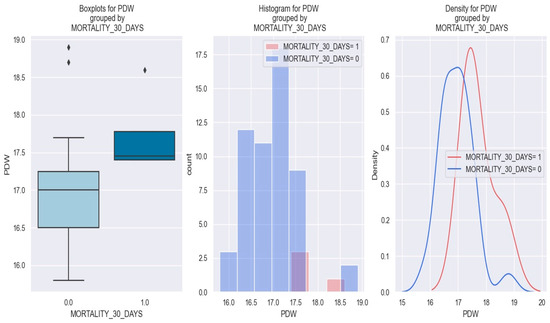
Figure 16.
PDW value in patients with NSTEMI and one-month mortality vs. patients with non-one-month mortality. The diamond symbol means an aberrant value. The colors represent different values. The figure is an original contribution by the authors.
Figure 17 displays the link between PDW value and one-month mortality.
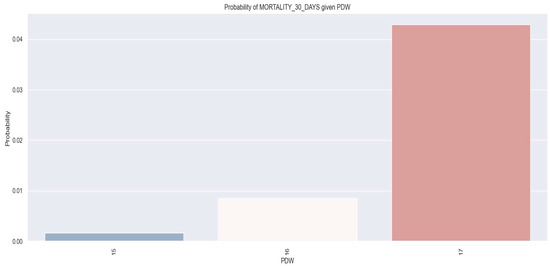
Figure 17.
Probability of one-month mortality based on PDW values by applying logistic regression model. The figure is an original contribution by the authors.
By observing the logistic regression, we can see that as the PDW value increases, the likelihood of one-month mortality increases as well. More concretely, we found that patients with a PDW of 17% had a 4% probability of one-month mortality.
Therefore, based on the arguments outlined above, it can be affirmed that the PDW value provides insight into the likelihood of one-month mortality in individuals with NSTEMI. A higher PDW value correlates with an increased likelihood of this event occurring. Due to the small cohort size, the association between PDW and one-month mortality is statistically reliable(p < 0.05) but holds little practical significance.
3.6. Correlation between MCV, MPV, RDW, PDW, and Length of Hospitalization
In our research, no reliable relationship was detected between MCV, MPV, and PDW with the length of hospitalization (Table 13).
Table 13.
Correlation between MCV, RDW, MPV, PDW, and days of hospitalization.
However, we discovered an interesting positive association between RDW and the duration of hospitalization. Patients with elevated RDW levels upon admission were at a notably increased risk of experiencing an extended duration of hospitalization (Table 13, Figure 18).
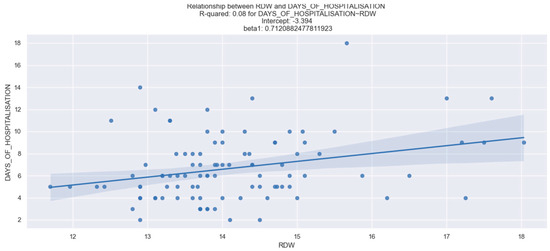
Figure 18.
Correlation between RDW and length of hospitalization. The figure is an original contribution by the authors.
3.7. Correlation between MCV, RDW, MPV, PDW, and in-Hospital Mortality
In addition to the aforementioned results, our dataset revealed that MCV emerged as a standalone predictor of in-hospital mortality among NSTEMI patients. Conversely, MPV, PDW, and RDW did not exhibit any notable link with in-hospital death (Table 14).
Table 14.
Correlation between MCV, RDW, MPV, PDW, and in-Hospital Mortality.
Furthermore, we aimed to establish the optimal threshold value of MCV in predicting in-hospital death in NSTEMI patients. This threshold value was determined using the Youden index derived from the ROC analysis. Interestingly, an MCV value of 108 fl demonstrated optimal sensitivity and specificity, making it the most suitable threshold value for predicting in-hospital mortality (Figure 19).
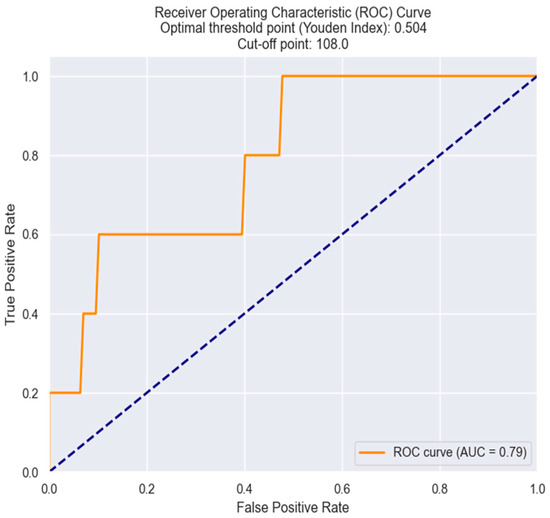
Figure 19.
Receiver operating characteristics analysis and curve for MCV in predicting in-hospital mortality. The figure is an original contribution by the authors.
3.8. Correlation between GRACE Score and MCV, RDW, MPV, and PDW
Considering all the results above, we tried to find a correlation between the markers proposed by us (MCV, MPV, RDW, and PDW) and the old score utilized for risk stratification in NSTEMI—the GRACE score. As is shown below, there is no reliable relationship between these parameters and the GRACE score (Table 15).
Table 15.
Relationship between GRACE score and MCV, MPV, RDW, and PDW derived from logistic regression.
4. Discussion
The present study revealed MCV, RDW, MPV, and PDW as important predictors of prognosis in individuals with NSTEMI. In the multivariate logistic regression analysis, there was a relevant relationship between MCV, in-hospital death, and Killip class III/IV, as well as between MPV, Killip class III/IV, and kidney dysfunction.
Furthermore, RDW showed a positive association with kidney dysfunction, a longer duration of hospitalization, triple vessel disease, and an increased risk of the patient requiring surgical revascularization. Additionally, our study demonstrated a positive linear regression between PDW and 30-day mortality.
Excluding individuals at an extremely high risk requiring angiography within 2 h, the latest guidelines for NSTEMI suggest coronary angiography with the aim of conducting revascularization within 24 h of hospital admission [14]. Limited research exists regarding the comparison between immediate invasive interventions and delayed angiography. The randomized RIDDLE NSTEMI study (randomized study of immediate vs. delayed invasive intervention in patients with non-ST-segment elevation myocardial infarction) showed that an immediate invasive strategy (<2 h) improves cardiovascular outcomes compared to a delayed strategy (2 to 72 h) [16]. Additionally, the clinical trial EARLY (early or delayed revascularization for intermediate and high-risk non-ST-elevation acute coronary syndrome) showcased a decline in cardiovascular death and recurrent ischemic events at 1 month in very early (<2 h) compared to delayed (12–72 h) intervention [17]. The original VERDICT trial (very early versus deferred invasive evaluation using computerized tomography) highlighted the potential benefits of immediate strategy in the high-risk category (GRACE score > 140) [18].
The GRACE risk score serves the purpose of stratifying risk among ACS and has demonstrated its superior predictive accuracy compared to other risk assessments [7].
But how effective is this risk stratification into two groups—high-risk versus non-high-risk? What if cases that are classified as non-high risk actually have their potential for a more severe prognosis masked by an inappropriate stratification model? To exclude this possibility, we should assume that our stratification risk is the most eloquent, with perfect congruity. There is no doubt that the GRACE score guided the management of these patients in an effective direction, but risk scores require permanent updates and greater perusal, not lesser. We believe that this perusal should involve revisiting some biological indicators closely related to myocardial infarction that were not included in the old scores.
In this context, we aimed to evaluate new possible predictor markers in patients with myocardial infarction. As far as we know, this is the first study endeavoring to develop a risk assessment tool for NSTEMI patients that incorporates MCV, RDW, PDW, and MPV.
The relationship between RDW and coronary artery disease (CAD) and other cardiovascular events can potentially be attributed to chronic low-grade inflammation, which serves as a plausible pathophysiological mechanism. Inflammation leads to the release of immature erythrocytes into the peripheral flow, resulting in anisocytosis [19]. Elevated levels of oxidative stress further contribute to the release of these premature erythrocytes into the circulation, reducing the lifespan of these cells and also leading to anisocytosis [20]. Most modern hematological analyzers can accurately assess anisocytosis, meaning the presence of red blood cells (RBCs) of varying sizes and volumes in the peripheral blood. These analyzers employ different techniques but yield a consistent measure known as the RDW [21].
Research conducted in the past has shown a link between MCV, RDW, and an elevated risk of long-term unfavorable outcomes in patients with ACS. Despite being a basic and often overlooked laboratory test, routine blood examinations hold valuable insights [22].
Our findings suggest that MCV is a standalone risk factor in predicting the prognosis of patients with NSTEMI. Specifically, higher MCV levels are associated with an increased risk of developing Killip class III–IV and serve as a substantial indicator of in-hospital death. Using a threshold value of >104 fl, we identified NSTEMI patients who are at risk of developing Killip class III–IV, while a cut-off value of >108 fl was indicative of in-hospital mortality. Although Killip classification provides valuable clinical information, it alone may not offer a comprehensive understanding of the underlying pathophysiology and prognosis. By identifying biological predictors like MCV, we can gain further insights into the disease mechanisms. Moreover, this information can potentially enhance risk stratification, inform personalized treatment decisions, and guide the development of targeted therapies.
In addition to MCV, our dataset also revealed RDW as an independent predictor of NSTEMI prognosis. Elevated RDW levels were associated with triple vessel disease, the need for surgical revascularization, and longer hospital stays. The cut-off values for RDW to predict the necessity of surgical revascularization and triple vessel disease were 16% and 17%, respectively. Furthermore, our study demonstrated a correlation between high RDW levels and elevated creatinine values, consistent with previous research suggesting an increased risk of renal dysfunction associated with RDW [23,24]. SembaRD et al. proposed that the connection between elevated RDW and kidney injury could be attributed to inflammation and resulting oxidative stress [25]. Further investigation is warranted to determine whether high RDW levels simply reflect underlying inflammation caused by kidney disease or if they pose a substantial risk for progressive renal damage. Our data align with the findings of Forhez et al., who demonstrated an association between RDW, ineffective erythropoiesis, and impaired renal function [26].
Moreover, we observed a statistically relevant relationship between NT-pro BNP and RDW values. Previous studies have explained this association by the presence of high anisocytosis and erythrocyte deformability, which can impair myocardial tissue oxygenation and contribute to heart failure [27].
Platelet activity plays a significant role in the pathophysiology ACS, which is primarily characterized by plaque rupture and thrombus formation. Research indicates that when an atherosclerotic plaque ruptures, there is an important depletion of platelets within the plaque, followed by the release of immature platelets from the bone marrow. Platelets exhibit variations in both activity and size [28,29]. In an activated state, platelets that are overall larger in size (measured by MPV), while also exhibiting significant size variability (in terms of PDW), are more metabolically active, adhesive, and have a higher capacity for aggregation. This heightened platelet activity speeds up the formation of blood clots within the blood vessels, triggering a series of clinical events linked to ACS. Platelet activity can be measured by some indices obtained by blood count tests, such as PDW and MPV [10,11].
Analyzing the data gathered from our patient cohort, we concluded that the cut-off value for PDW to predict 30-day mortality was 19%, while the cut-off value for MPV to predict Killip class III–IV in NSTEMI patients was 11.7%.
Our results are in accordance with other studies from the literature that also found the MPV and PDW as strong independent prognostic factors in ACS [13].
Regarding the association between MPV and creatinine levels, our study supports previous research showing a positive correlation [30].
Elevated MPV is considered a marker of ongoing inflammation and oxidative stress, both of which can contribute to kidney dysfunction. The pro-inflammatory and pro-thrombotic effects of larger platelets are believed to play a role in the progression of kidney disease [31]. Further research is necessary to fully understand the relationship between increased MPV and kidney function and to determine if targeting MPV could be a potential therapeutic approach for managing kidney function.
However, our study did not find a correlation between infarct size and the parameters we proposed. This unexpected result contradicts the expectation that a higher level of pro-inflammatory status during a myocardial infarction would directly correlate with infarct size and these parameters. We hypothesize that the small sample size of our study may have limited our power to effectively determine this association. Conversely, antiplatelet therapy has been extensively studied and proven effective in reducing mortality and morbidity in cardiovascular diseases. Interestingly, our data suggest that this therapy does not have a significant effect on MPV and PDW. This could explain why patients with high PDW and MPV, even if they receive antiplatelet therapy, have a more unfavorable prognosis with a higher death rate [31,32].
We speculate that antiplatelet therapy primarily targets platelet aggregation and activation and, while it can affect various aspects of platelet function, it typically does not directly impact PDW and MPV levels. Several studies have consistently shown no significant relation between MPV, PDW, and the use of antiplatelet medications [33,34].
Considering all the information above, our study suggests that measuring MCV, MPV, RDW, and PDW (which are useful low-cost markers) is a straightforward way of stratifying cardiovascular risk, predicting the occurrence of complications, and imposing rapid management in some patients with a high risk masked by an old risk stratification score.
Thus, we have demonstrated that MCV is associated with in-hospital mortality and Killip class III/IV, while RDW is correlated with kidney dysfunction, an indication for surgical intervention, and also represents a stand-in for triple vessel disease and longer duration of hospitalization.
Furthermore, PDW independently predicts short-term mortality and MPV is correlated with Killip class III/IV and kidney dysfunction.
However, we are not able to show a correlation between the GRACE score and MCV/MPV/PDW/RDW. The new predictive markers proposed by us are correlated with heart failure after ACS and renal dysfunction, outcomes included in the GRACE score. Nevertheless, these new markers not only anticipate in-hospital mortality, within one month, but also forecast the length of hospital stay, the likelihood of a patient requiring cardiac surgery, and the presence of triple vessel disease—all of which are endpoints not covered by the GRACE score. The predictive markers we have proposed serve as surrogate indicators of the pathophysiological processes occurring during ACS, going beyond the clinical and biological aspects encompassed by the GRACE score. These observations may elucidate the absence of a correlation between these markers and the aforementioned score. Ultimately, it is essential that studies involving larger multicenter cohorts of patients are conducted to either confirm the lack of correlation or, conversely, establish whether the relatively small patient cohort in our study influenced this outcome. On the other hand: what if these patients classified as high-risk according to the new marker proposed by us are, in fact, categorized as non-high-risk according to the GRACE score? In other words, are these patients high-risk but labeled as being non-high-risk by an old outdated score?
- Study limitations
The single-center design of the study, along with the small cohort of patients, were the major limitations, meaning that more well-designed studies are needed to confirm our results.
Is the promise of machine learning just a half-promise?
The influence of machine learning in acute coronary syndrome can be regarded as a double-edged sword since we still are unable to assure causal inference. External contextual information and connections between the pertinent variables in each context are required for causal inference. Machine learning cannot draw the necessary conclusions from a dataset because the data only contain what occurred, not what might have occurred if certain circumstances had been different. An ideal context in which causality could be analyzed would be the one in which there would be a causal graph, where the medical theory could assume certain causes and, for each of these causes, there would be many observations and many other correlated variables (but not necessarily causal). Thus, techniques such as instrumental variables could be used to have a clearer picture of the cause.
Consequently, these prediction models cannot yet fulfill their promise and can be regarded as a double-edged sword because, without causal inference, a guarantee that the optimal treatment approach will be identified in all cases cannot exist.
Lastly, we failed to follow the long-term prognosis of these patients, which can limit the predictive value of these biomarkers for long-term risk.
- Future directions
It is indisputable that a correlation can be drawn between MCV, RDW, MPV, PDW, and NSTEMI. Therefore, a more extensive examination of these blood parameters’ function in early-onset NSTEMI is essential for improved prognostic assessment, therapeutic targeting, and risk stratification. Further research can lead to more individualized and successful treatment protocols.
5. Conclusions
Based on the findings of our research, we can assert that these markers (MCV, RDW, MPV, and PDW) could be integrated into a novel risk stratification score for NSTEMI patients. These easily accessible parameters found in standard hemograms allow for the identification of patients at risk of unfavorable outcomes, facilitating the prompt initiation of early management strategies. Although this new algorithmic score still presents several limitations that need to be overcome, the topic holds a lot of potential. These preliminary findings seem promising, even though they still demand prospective validation. Within the fantasy of machine learning surfaces one new framework: precision medicine, that one aspect which promises to transform general management guidelines into individualized care, relying on automating chores like diagnosis and prognosis with an as-yet-unheard-of accuracy. Before we become caught in the machine learning networks, we should stop and consider. Let us assume that the promise of machine learning is here. Could it be said that is it a shortcut to a faster diagnosis? It is more than that. It is an ultra-high-speed rail that, once arriving at an intersection, has the ability to continue on the fastest most efficient route. It is advisable to be realistic and take small steps, one by one. It has been slow to arrive but this high-speed rail could be on its way.
In the present era of machine learning, a more pragmatic route could be represented by stratified medicine, which might take us one step closer to the path to precision medicine. Our study demonstrated that simple blood parameters like MCV, MPV, RDW, and PDW could be seen as predictive elements for prognosis in myocardial infarction. The up-to-date score proposed by us can replace the GRACE score in helping the physician decide whether to perform revascularization in NSTEMI patients within 2 or, alternatively, within 24 h of hospital admission.
Author Contributions
Conceptualization, C.E.J., C.L.A. and L.N.B.; methodology, C.E.J.; software, O.C.; validation, C.E.J., C.L.A., R.O.D. and S.G.; formal analysis, C.E.J., C.L.A. and L.N.B.; investigation, C.E.J. and G.P.; resources, C.E.J., G.P., L.N.B. and C.L.A.; data curation, C.E.J.; writing—original draft preparation, C.E.J., C.L.A., L.N.B. and S.G.; writing review and editing, C.E.J., C.L.A., R.O.D. and S.G.; visualization, C.J.S., C.L.A., R.O.D. and S.G.; supervision, C.J.S., C.L.A. and S.G. All authors have read and agreed to the published version of the manuscript.
Funding
No external funding was received for this study.
Institutional Review Board Statement
The research was carried out in compliance with principles outlined in the Declaration of Helsinki and was approved by the Ethics Committee of “Carol Davila” University of Medicine and Pharmacy, Bucharest, Romania (protocol code PO-35-F-03, dated 1 October 2021). All participants provided written informed consent and steps were taken to ensure complete anonymity of the data.
Informed Consent Statement
Informed consent was obtained from all subjects involved in this study.
Data Availability Statement
The data presented in this study are available on request from the corresponding author. The data are not publicly available due to privacy issues.
Conflicts of Interest
The authors declare no conflicts of interest.
References
- Ariss, R.W.; Minhas, A.M.K.; Issa, R.; Ahuja, K.R.; Patel, M.M.; Eltahawy, E.A.; Michos, E.D.; Fudim, M.; Nazir, S. Demographic and Regional Trends of Mortality in Patients With Acute Myocardial Infarction in the United States, 1999 to 2019. Am. J. Cardiol. 2022, 164, 7–13. [Google Scholar] [CrossRef]
- Nowbar, A.N.; Gitto, M.; Howard, J.P.; Francis, D.P.; Al-Lamee, R. Mortality From Ischemic Heart Disease. Circ. Cardiovasc. Qual. Outcomes 2019, 12, e005375. [Google Scholar] [CrossRef]
- Nguyen, T.M.; Melichova, D.; Aabel, E.W.; Lie, Ø.H.; Klæboe, L.G.; Grenne, B.; Sjøli, B.; Brunvand, H.; Haugaa, K.; Edvardsen, T. Mortality in Patients with Acute Coronary Syndrome—A Prospective 5-Year Follow-Up Study. J. Clin. Med. 2023, 12, 6598. [Google Scholar] [CrossRef]
- Chan, M.Y.; Sun, J.L.; Newby, L.K.; Shaw, L.K.; Lin, M.; Peterson, E.D.; Califf, R.M.; Kong, D.F.; Roe, M.T. Long-Term Mortality of Patients Undergoing Cardiac Catheterization for ST-Elevation and Non-ST-Elevation Myocardial Infarction. Circulation 2009, 119, 3110–3117. [Google Scholar] [CrossRef]
- Lappé, J.M.; Horne, B.D.; Shah, S.H.; May, H.T.; Muhlestein, J.B.; Lappé, D.L.; Kfoury, A.G.; Carlquist, J.F.; Budge, D.; Alharethi, R.; et al. Red Cell Distribution Width, C-Reactive Protein, the Complete Blood Count, and Mortality in Patients with Coronary Disease and a Normal Comparison Population. Clin. Chim. Acta 2011, 412, 2094–2099. [Google Scholar] [CrossRef]
- Montagnana, M.; Cervellin, G.; Meschi, T.; Lippi, G. The Role of Red Blood Cell Distribution Width in Cardiovascular and Thrombotic Disorders. Clin. Chem. Lab. Med. 2011, 50, 635–641. [Google Scholar] [CrossRef]
- Polat, N.; Yildiz, A.; Oylumlu, M.; Kaya, H.; Acet, H.; Akil, M.A.; Yuksel, M.; Bilik, M.Z.; Aydin, M.; Ulgen, M.S. Relationship Between Red Cell Distribution Width and the GRACE Risk Score With In-Hospital Death in Patients With Acute Coronary Syndrome. Clin. Appl. Thromb. Hemost. 2014, 20, 577–582. [Google Scholar] [CrossRef]
- Wu, T.-H.; Fann, J.C.-Y.; Chen, S.L.-S.; Yen, A.M.-F.; Wen, C.-J.; Lu, Y.-R.; Chen, H.-H.; Chiu, S.Y.-H.; Liou, H.-H. Gradient Relationship between Increased Mean Corpuscular Volume and Mortality Associated with Cerebral Ischemic Stroke and Ischemic Heart Disease: A Longitudinal Study on 66,294 Taiwanese. Sci. Rep. 2018, 8, 16517. [Google Scholar] [CrossRef]
- Franczuk, P.; Kaczorowski, M.; Kucharska, K.; Franczuk, J.; Josiak, K.; Zimoch, W.; Kosowski, M.; Reczuch, K.; Majda, J.; Banasiak, W.; et al. Could an Analysis of Mean Corpuscular Volume Help to Improve Risk Stratification in Non-Anemic Patients with Acute Myocardial Infarction? Cardiol. J. 2015, 22, 421–427. [Google Scholar] [CrossRef]
- Schoene, N.W. Design Criteria: Tests Used to Assess Platelet Function. Am. J. Clin. Nutr. 1997, 65 (Suppl. S5), 1665S–1668S. [Google Scholar] [CrossRef]
- Abass, A.-E.; Yassir, T.; Saeed, Y.; Taha, A.; Basheer, A.; Mubarak, E.; Zonoon, F.; Faroog, G.; Mohammad, N. Investigation of Platelets Count and Indices in Coronary Artery Diseases among Sudanese Patients. IOSR J. Dent. Med. Sci. 2016, 15, 35–38. [Google Scholar]
- Ranjith, M.P.; DivyaRaj, R.; Mathew, D.; George, B.; Krishnan, M.N. Mean Platelet Volume and Cardiovascular Outcomes in Acute Myocardial Infarction. Heart Asia 2016, 8, 16–20. [Google Scholar] [CrossRef]
- Rechciński, T.; Jasińska, A.; Foryś, J.; Krzemińska-Pakuła, M.; Wierzbowska-Drabik, K.; Plewka, M.; Peruga, J.Z.; Kasprzak, J.D. Prognostic Value of Platelet Indices after Acute Myocardial Infarction Treated with Primary Percutaneous Coronary Intervention. Cardiol. J. 2013, 20, 491–498. [Google Scholar] [CrossRef]
- Byrne, R.A.; Rossello, X.; Coughlan, J.J.; Barbato, E.; Berry, C.; Chieffo, A.; Claeys, M.J.; Dan, G.-A.; Dweck, M.R.; Galbraith, M.; et al. 2023 ESC Guidelines for the Management of Acute Coronary Syndromes. Eur. Heart J. 2023, 44, 3720–3826. [Google Scholar] [CrossRef]
- MDCalc. GRACE ACS Risk and Mortality Calculator. Available online: https://www.mdcalc.com/calc/1099/grace-acs-risk-mortality-calculator (accessed on 25 February 2024).
- Milosevic, A.; Vasiljevic-Pokrajcic, Z.; Milasinovic, D.; Marinkovic, J.; Vukcevic, V.; Stefanovic, B.; Asanin, M.; Dikic, M.; Stankovic, S.; Stankovic, G. Immediate Versus Delayed Invasive Intervention for Non-STEMI Patients: The RIDDLE-NSTEMI Study. JACC Cardiovasc. Interv. 2016, 9, 541–549. [Google Scholar] [CrossRef]
- Lemesle, G.; Laine, M.; Pankert, M.; Boueri, Z.; Motreff, P.; Paganelli, F.; Baumstarck, K.; Roch, A.; Kerbaul, F.; Puymirat, E.; et al. Optimal Timing of Intervention in NSTE-ACS Without Pre-Treatment: The EARLY Randomized Trial. JACC Cardiovasc. Interv. 2020, 13, 907–917. [Google Scholar] [CrossRef]
- Kofoed, K.F.; Kelbæk, H.; Hansen, P.R.; Torp-Pedersen, C.; Høfsten, D.; Kløvgaard, L.; Holmvang, L.; Helqvist, S.; Jørgensen, E.; Galatius, S.; et al. Early Versus Standard Care Invasive Examination and Treatment of Patients With Non-ST-Segment Elevation Acute Coronary Syndrome. Circulation 2018, 138, 2741–2750. [Google Scholar] [CrossRef]
- Libby, P.; Ridker, P.M.; Maseri, A. Inflammation and Atherosclerosis. Circulation 2002, 105, 1135–1143. [Google Scholar] [CrossRef]
- Ghaffari, S. Oxidative Stress in the Regulation of Normal and Neoplastic Hematopoiesis. Antioxid. Redox Signal. 2008, 10, 1923–1940. [Google Scholar] [CrossRef]
- Lippi, G.; Pavesi, F.; Bardi, M.; Pipitone, S. Lack of Harmonization of Red Blood Cell Distribution Width (RDW). Evaluation of four hematological analyzers. Clin. Biochem. 2014, 47, 1100–1103. [Google Scholar] [CrossRef]
- Zhang, Z.; Gao, S.; Dong, M.; Luo, J.; Xu, C.; Wen, W.; Huang, Y.; Wu, Y.; Zhou, J.; Yuan, Z. Relationship between Red Blood Cell Indices (MCV, MCH, and MCHC) and Major Adverse Cardiovascular Events in Anemic and Nonanemic Patients with Acute Coronary Syndrome. Dis. Mark. 2022, 2022, 2193343. [Google Scholar] [CrossRef]
- Tonelli, M.; Sacks, F.; Arnold, M.; Moye, L.; Davis, B.; Pfeffer, M. Relation Between Red Blood Cell Distribution Width and Cardiovascular Event Rate in People With Coronary Disease. Circulation 2008, 117, 163–168. [Google Scholar] [CrossRef]
- Abrahan, L.L.; Ramos, J.D.A.; Cunanan, E.L.; Tiongson, M.D.A.; Punzalan, F.E.R. Red Cell Distribution Width and Mortality in Patients With Acute Coronary Syndrome: A Meta-Analysis on Prognosis. Cardiol. Res. 2018, 9, 144–152. [Google Scholar] [CrossRef]
- Semba, R.D.; Patel, K.V.; Ferrucci, L.; Sun, K.; Roy, C.N.; Guralnik, J.M.; Fried, L.P. Serum Antioxidants and Inflammation Predict Red Cell Distribution Width in Older Women: The Women’s Health and Aging Study I. Clin. Nutr. 2010, 29, 600–604. [Google Scholar] [CrossRef]
- Förhécz, Z.; Gombos, T.; Borgulya, G.; Pozsonyi, Z.; Prohászka, Z.; Jánoskuti, L. Red Cell Distribution Width in Heart Failure: Prediction of Clinical Events and Relationship with Markers of Ineffective Erythropoiesis, Inflammation, Renal Function, and Nutritional State. Am. Heart J. 2009, 158, 659–666. [Google Scholar] [CrossRef]
- Xanthopoulos, A.; Giamouzis, G.; Dimos, A.; Skoularigki, E.; Starling, R.C.; Skoularigis, J.; Triposkiadis, F. Red Blood Cell Distribution Width in Heart Failure: Pathophysiology, Prognostic Role, Controversies and Dilemmas. J. Clin. Med. 2022, 11, 1951. [Google Scholar] [CrossRef]
- Khode, V.; Sindhur, J.; Kanbur, D.; Ruikar, K.; Nallulwar, S. Mean Platelet Volume and Other Platelet Volume Indices in Patients with Stable Coronary Artery Disease and Acute Myocardial Infarction: A Case Control Study. J. Cardiovasc. Dis. Res. 2012, 3, 272–275. [Google Scholar] [CrossRef]
- Abrol, S.; Sharma, R.; Badgal, A.; Kundal, V.; Chowdhary, S. Mean platelets volume in acute coronary syndrome: A prospective observational study. J. Evol. Med. Dent. Sci. 2015, 04, 1606–1610. [Google Scholar] [CrossRef]
- Ju, H.Y.; Kim, J.K.; Hur, S.M.; Woo, S.A.; Park, K.A.; Park, M.Y.; Choi, S.J.; Hwang, S.D. Could Mean Platelet Volume Be a Promising Biomarker of Progression of Chronic Kidney Disease? Platelets 2015, 26, 143–147. [Google Scholar] [CrossRef]
- Matsagas, M.; Jagroop, I.A.; Geroulakos, G.; Mikhailidis, D.P. The Effect of a Loading Dose (300 mg) of Clopidogrel on Platelet Function in Patients with Peripheral Arterial Disease. Clin. Appl. Thromb./Hemost. 2003, 9, 115–120. [Google Scholar] [CrossRef]
- Yi, Y.-H.; Yin, W.-J.; Gu, Z.-C.; Fang, W.-J.; Li, D.-Y.; Hu, C.; Liu, K.; Ma, R.-R.; Zhou, L.-Y. A Simple Clinical Pre-Procedure Risk Model for Predicting Thrombocytopenia Associated With Periprocedural Use of Tirofiban in Patients Undergoing Percutaneous Coronary Intervention. Front. Pharmacol. 2018, 9, 115–120. [Google Scholar] [CrossRef]
- Higaki, T.; Kurisu, S.; Watanabe, N.; Ikenaga, H.; Shimonaga, T.; Iwasaki, T.; Mitsuba, N.; Ishibashi, K.; Dohi, Y.; Fukuda, Y.; et al. Influence of Dual Antiplatelet Therapy on Mean Platelet Volume in Patients with Coronary Artery Disease Undergoing Percutaneous Coronary Intervention. Heart Vessel. 2016, 31, 269–274. [Google Scholar] [CrossRef] [PubMed]
- Khandekar, M.M.; Khurana, A.S.; Deshmukh, S.D.; Kakrani, A.L.; Katdare, A.D.; Inamdar, A.K. Platelet Volume Indices in Patients with Coronary Artery Disease and Acute Myocardial Infarction: An Indian Scenario. J. Clin. Pathol. 2006, 59, 146–149. [Google Scholar] [CrossRef]


Disclaimer/Publisher’s Note: The statements, opinions and data contained in all publications are solely those of the individual author(s) and contributor(s) and not of MDPI and/or the editor(s). MDPI and/or the editor(s) disclaim responsibility for any injury to people or property resulting from any ideas, methods, instructions or products referred to in the content. |
© 2024 by the authors. Licensee MDPI, Basel, Switzerland. This article is an open access article distributed under the terms and conditions of the Creative Commons Attribution (CC BY) license (https://creativecommons.org/licenses/by/4.0/).