Abstract
In the area of dental healthcare services, where patients and professionals deal with multiple auditory stimuli, this cross-sectional study reports on the various dynamics of sound preferences, noise obstacles, and the profound impact of music on anxiety reduction within dental office settings. The sample comprises 134 dental patients, primarily females (56.7%), with varying age groups, education levels, and therapy durations in the university clinics of the Department of Dentistry, National and Kapodistrian University of Athens, and four private dental offices at the metropolitan area of Athens, Greece. Notably, 92.5% of the participants reported no hearing loss, and 56.7% exhibited some level of noise sensitivity. This study reveals a moderate to good perceived health status (M = 3.84, SD = 0.95) among participants, with low perceived noise disturbance in university dental clinics. Preferences for instrumental music, foreign pop, and classical music are prominent during waiting times. Potential irritations include impersonal treatment (44%) and staff behavior (41.8%). Correlations and predictors indicate associations between age, gender, educational status, music preferences, and noise disturbances. Findings aim to optimize eco-soundscapes in dental offices, contributing to enhanced patient well-being. The research underscores the potential of music interventions to alleviate dental anxiety and improve the overall dental experience and quality care.
1. Introduction
Dental professionals and patients within the dental clinic often encounter a variety of auditory stimuli [1]. These sounds can yield either unfavorable effects [2,3] or positive outcomes, such as the enjoyment of soothing music [4], or be perceived as disruptive noise. Sound in the dental office originates from both dental and non-dental sources. The first group includes noises generated by dental equipment [5], which can be reduced by taking appropriate measures. The second group incorporates sounds from within the dental clinic, including interactions between staff and patients, the operation of computers and printers, background music, and television, as well as external sources like traffic and ongoing roadwork sounds [6,7]. According to the National Research and Safety Institute, new dental equipment typically generates noise levels that remain below 85 dB(A) [8], while sound emitted overall within a dental facility falls overall below 80 dB(A), thus falling within the acceptable thresholds established by the World Health Organization [5,8]. If these limits are exceeded, or the noise is present for a long time during a patient’s stay in the dental office, then the sound has a negative effect on the patient’s psychology [6].
Noise, as described in the literature, refers to undesirable and bothersome sounds [9]. Among dental patients, the most extensively researched consequence of noise is heightened anxiety. In fact, noise-induced fear or anxiety ranks as the third most common reason for avoiding dental appointments [2]. Patients frequently perceive the dental clinic as an inhospitable and anxiety-inducing place, primarily due to the presence of disruptive and loud noises [10]. On the other hand, dental healthcare facilities frequently accommodate individuals with dental anxiety and phobias who exhibit heightened sensitivity to both sound and tactile sensations [11,12]. Such anxious patients may become uncooperative and pose increased challenges in the management of dental therapies [2,11].
Music, on the other hand, offers not only well-being benefits but also numerous advantages in healthcare settings, from community environments to waiting rooms and surgical settings, where it can serve as background music [6]. Its impact includes mood enhancement, pain and anxiety reduction, improved cardiovascular fitness, mindfulness, and increased social engagement [13]. Patients can use music as a self-management technique to reduce or control discomfort in these environments [14]. Also, listening to music provides an effective, nonpharmacologic option for reducing pre-procedural dental anxiety among dental patients [15]. Music therapy, as a non-invasive and cost-effective intervention, effectively diminishes dental anxiety, thus enhancing the outcomes of medical or dental procedures [6]. Also, music contributes significantly to relaxation, facilitating concentration, and it proves valuable in (a) reducing anxiety and pain levels [6], (b) aiding recovery [4,16], and (c) promoting commitment to essential preventive care [17]. Understanding the above-mentioned positive effects of music on patients’ anxiety is then essential for improving the overall patient experience, their well-being, and the well-being of dental professionals working in the area [18]. It also influences the sustainability of the setting in strategic management and marketing issues [19]. Thus, several studies have already investigated the potential of music as a non-pharmacological intervention to reduce anxiety levels in patients undergoing dental procedures [6,20,21] by affecting subjective anxiety scales and objective physiological parameters, such as heart rate, blood pressure, and cortisol hormones in patients with moderate dental anxiety during dental procedures [22]. To add more, a study assessing the effect of music therapy on dental anxiety levels of patients undergoing extractions found that music reduced fear, stress, and anxiety and was a form of meditation and relaxation [20].
Furthermore, the choice of music genre significantly affects anxiety and pain reduction, as studies indicate these effects are not exclusive to any specific music type [4]. Interestingly, in a specific study, 58% of respondents favored classical music in the healthcare setting [23]. Ideally, music in dental settings should align with patients’ personal musical preferences, which are deeply rooted and influential [6]. Patient preferences and past musical experiences are then crucial factors in the success of any health intervention [24], including dental procedures. To be effective, though, music should resonate with listeners in terms of culture, genre, mood, and era [25]. Dental professionals should also be mindful not to elicit excessive emotions or irritation, as music’s evocative nature can impact relaxation for them too [19]. In a relevant study, it was reported that music is most effective when the musical program is selected by the patient [26]. In another study, it was found that music chosen by the patient offers the best results in healthcare settings [27]. But of course, there is a difference between passive music listening, often administered by medical professionals, and active music therapy, where trained music therapists use music creatively to promote and sustain health and well-being [28]. Finally, it is reported that music therapy programs can benefit people of all ages and abilities, irrespective of their musical background or skill [6,29].
The selection of music types in diverse healthcare settings, including dental offices, is moreover contingent upon several factors, notably personal preferences, age, emotional associations, familiarity, and the overall dental office atmosphere and culture. Individuals exhibit unique musical tastes shaped by personal experiences, emotions, and cultural backgrounds, with certain types eliciting positive emotions or inducing relaxation [30]. Age also plays a pivotal role, as music preferences often vary among different generations; younger patients may gravitate towards contemporary genres, while older patients may lean towards classical or folk music [31,32]. Music’s ability to evoke emotions and establish a specific atmosphere is crucial in dental settings, where choosing music that promotes relaxation and reduces anxiety contributes to a more comfortable environment for patients [6]. The element of familiarity is significant, with patients often preferring music they know well, fostering a sense of comfort and security rooted in personal experiences or cultural backgrounds [33]. Moreover, the dental office atmosphere itself can influence preferences, with instrumental or soothing-tempo music being preferable, contributing to a calm and focused ambiance during appointments [6]. It seems that recognizing and accommodating these diverse music preferences based on various factors can significantly enhance the overall comfort and relaxation of dental patients.
The principal objective of this study was to investigate the current sound preferences of dental patients before and during dental treatment, encompassing ambient sounds like background music, staff–patient interactions, operation of dental equipment, and other environmental noises. Additionally, the research aimed to identify and understand noise obstacles within dental offices, considering both dental and non-dental sources while also evaluating the psychological impact of varying noise levels on patients during their dental appointments. Additionally, the investigation assessed the impact of music on anxiety reduction and analyzed the influence of music on patient outcomes, encompassing anxiety levels, pain reduction, and overall satisfaction. It also aimed to compare the effectiveness of patient-selected music versus music administered by dental professionals in reducing anxiety. Overall, we aimed to offer valuable insights into optimizing eco-soundscapes in dental offices, ultimately contributing to the improvement of the overall experience and well-being of dental patients. Τhe basic research questions of this study were then the following: (1) What are the preferences of patients relative to noise and music playing in the dental clinic, in terms of music type, music source, and types of noise that are perceived as unpleasant within the environment of a dental clinic? (2) What are the preferences of dental clinic visitors relative to the volume of music listening in their everyday lives? (3) How do disturbances and feelings of anxiety due to noise in the environment of the dental clinic relate to the demographic variables of patients? (4) How do disturbances and feelings of anxiety due to noise in the environment of the dental clinic relate to music and noise preferences? (5) What are the significant predictors of disturbances and feelings of anxiety due to noise in the environment of the dental clinic?
2. Methodology
2.1. Study Design
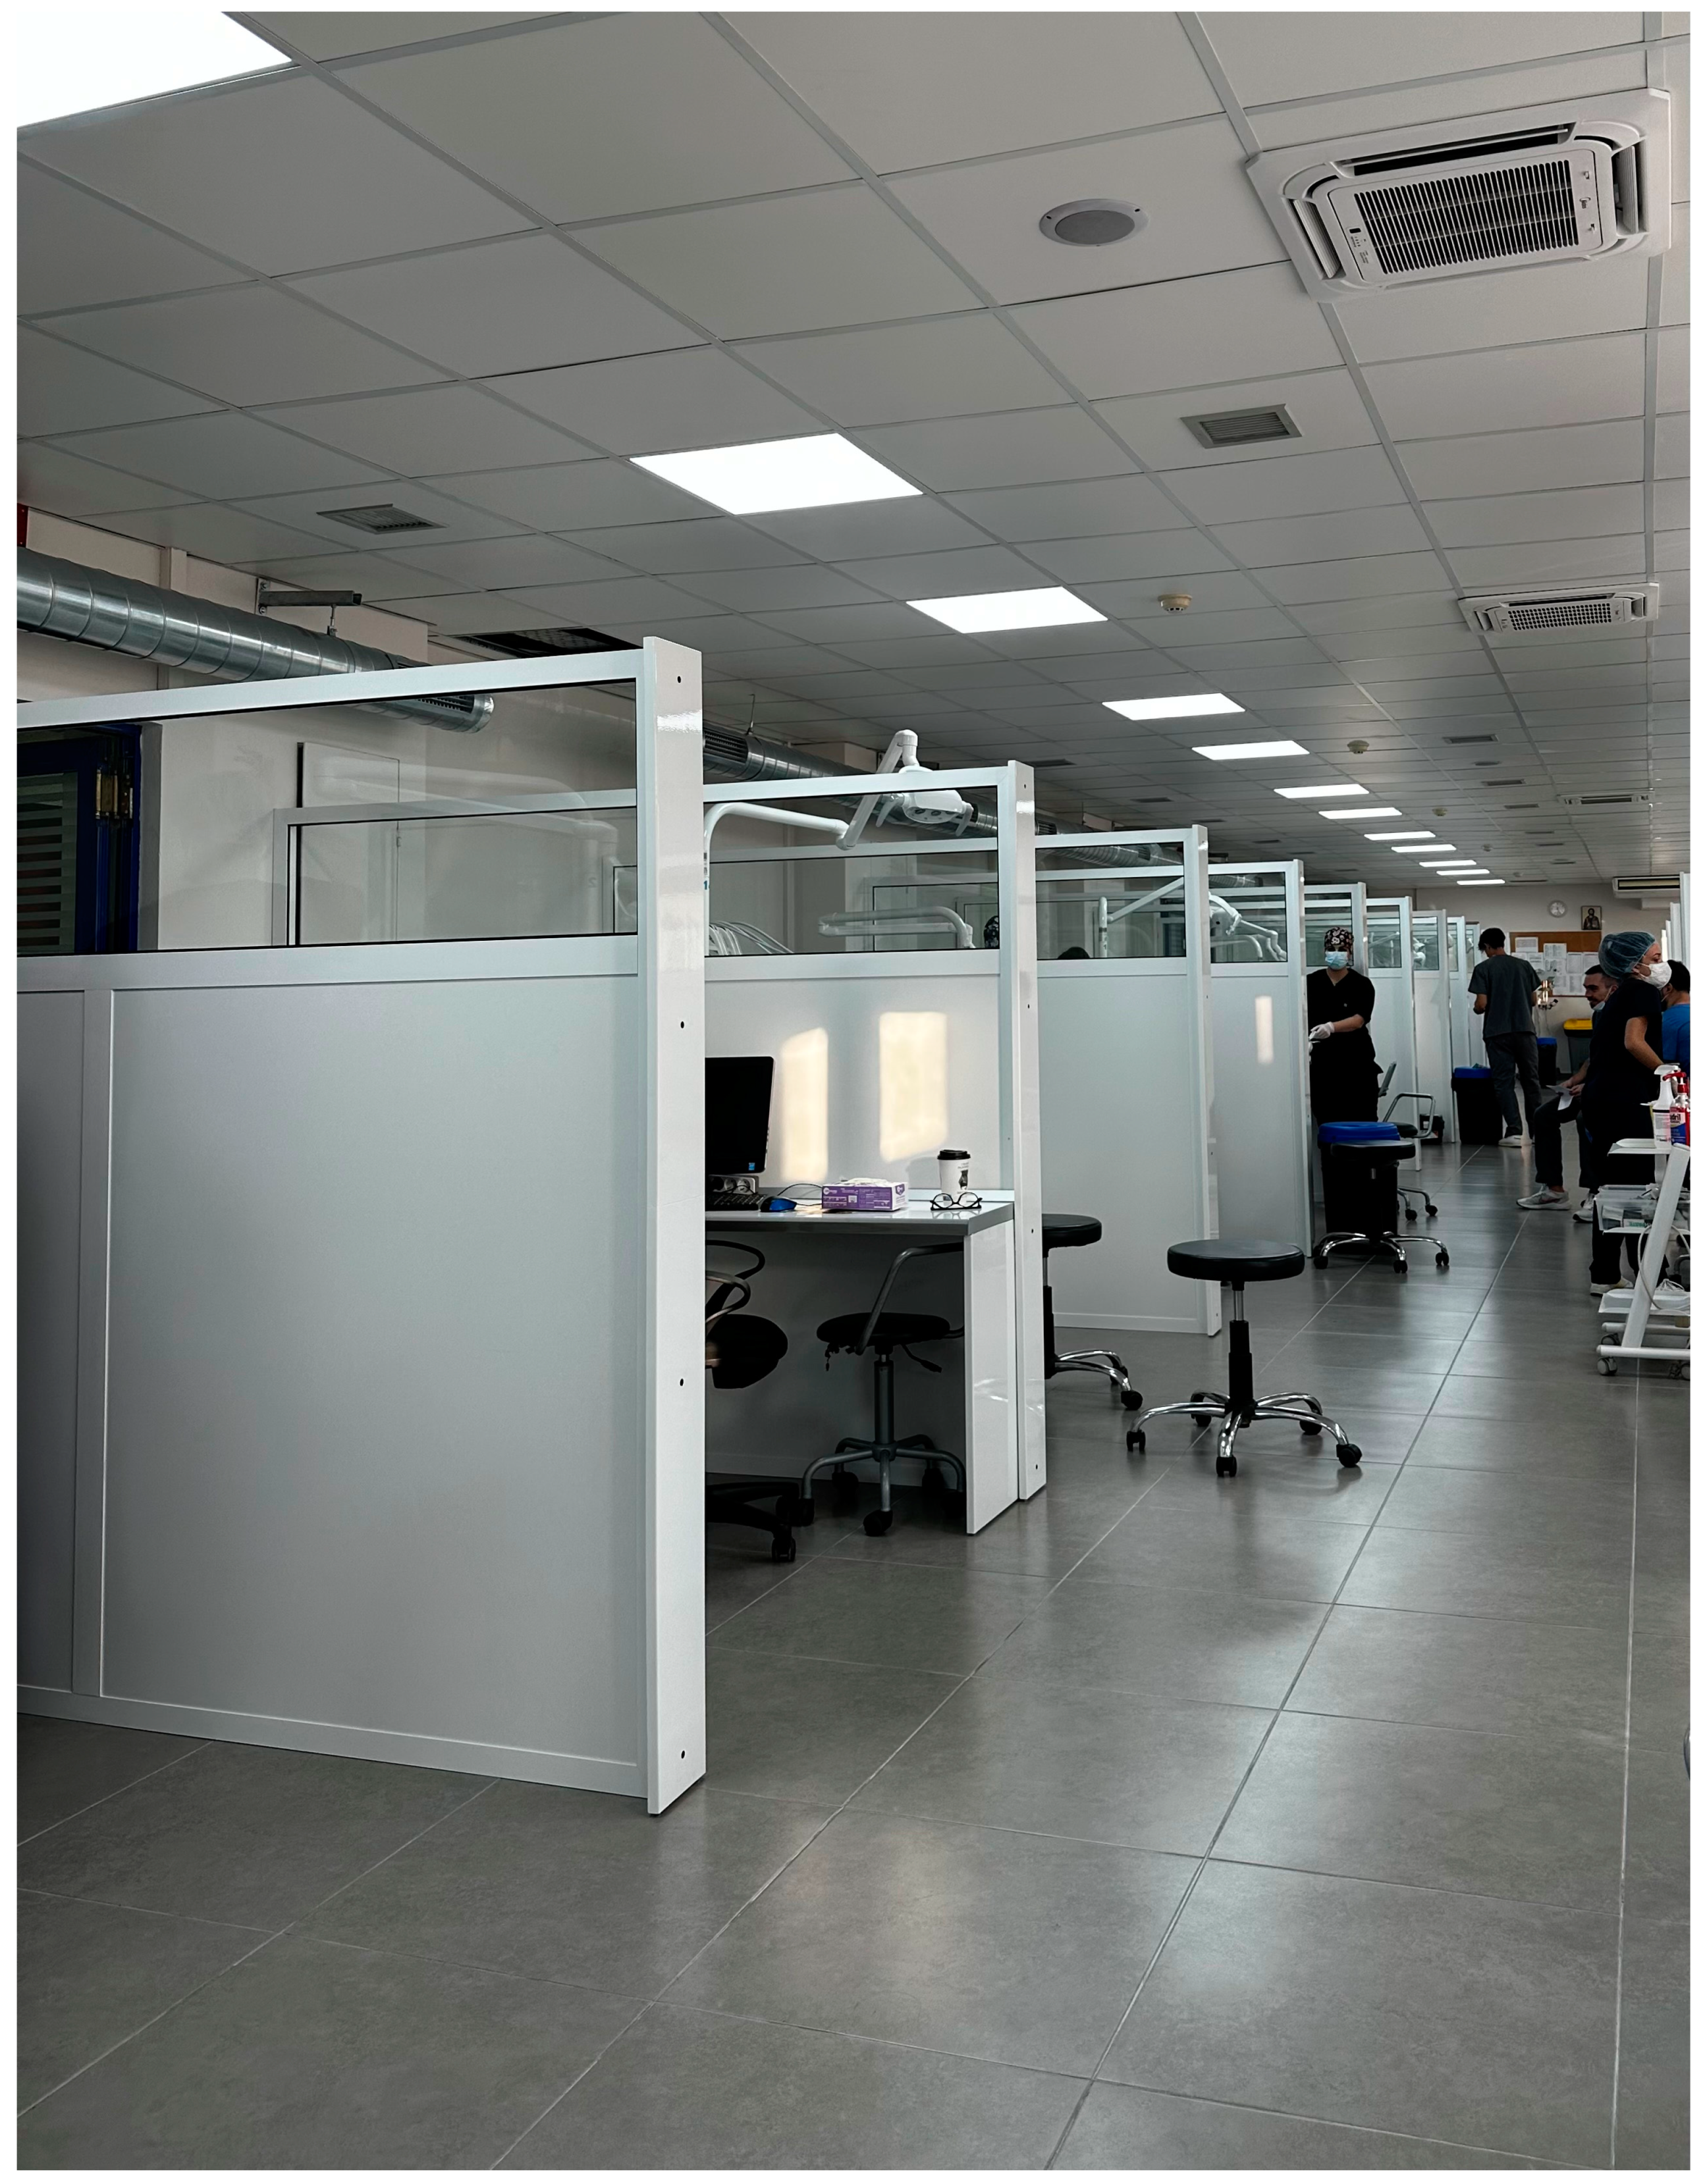
A cross-sectional study design was employed to collect data at a single point in time, capturing patients’ current perceptions and preferences regarding sound environments in dental clinics. Participants were recruited from diverse dental healthcare facilities, including the undergraduate and postgraduate clinics of the Department of Dentistry of the National and Kapodistrian University of Athens, Greece. Inclusion criteria encompassed adult patients (18 years and above) who have recently undergone dental treatment or were scheduled for upcoming treatments. The participants were met at the reception halls of the clinics of the Department of Dentistry and four private dental clinics in the metropolitan area of Athens located in different parts of the town. Two private settings had up to two staff members, and the other two had three or more staff members. Otherwise, the characteristics of the private dental settings were similar concerning the number of personnel in each subgroup, the number of units and dimensions of waiting rooms and secondary visiting areas), the mean time of waiting period between appointments, and setting of the reception area. A view of the main clinical university setting used to assess patients’ response to noise is seen in Figure 1 and is also described elsewhere [8].
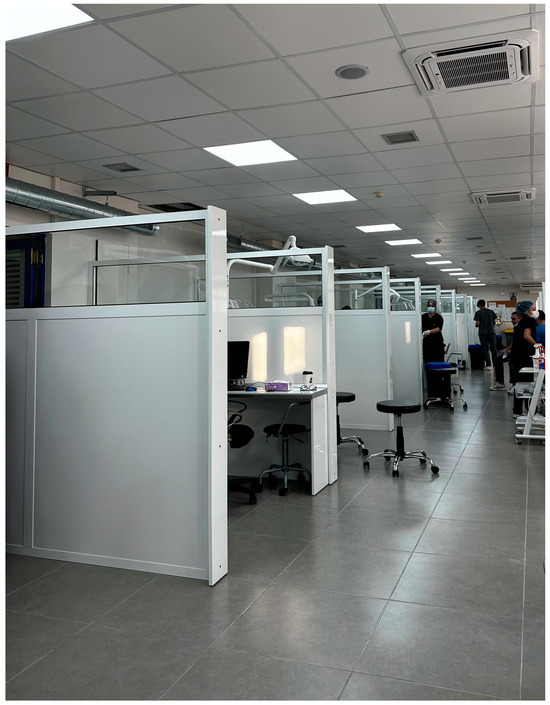
Figure 1.
The undergraduate clinic of the Department of Dentistry of the National and Kapodistrian University of Athens, Greece, where 21.6% of the participants were treated.
Further, in conducting the research on human participants to explore their preferences regarding sound and noise factors in the dental office, this study took No 569/2-2-2023 approval from the ethics committee of the Department of Dentistry as part of a bigger protocol studying sound issues in the university clinics [8]. Then, we obtained informed consent from all participants, ensuring a comprehensive understanding of this study’s objectives and potential implications. Consent was obtained either in a written form or through a secure digital platform, allowing participants to make an informed decision about their involvement in this study. Moreover, the research prioritized the privacy and confidentiality of participant information throughout the entire research process. Stringent measures were implemented to safeguard the sensitive data collected through the questionnaires, ensuring that participants’ identities and responses remained confidential, as described in Appendix A.
2.2. Questionnaire of the Study
In this study, we used the questionnaire study technique, which is a systematic method for data collection. Furthermore, it has previously been used to investigate people’s sensations in the presence of different sound stimuli in a dental environment [7]. So, a structured questionnaire was designed to address the objectives of this study. The questionnaire included an introductory message describing the aim of this study. It was further noted that participation was voluntary, and confidentiality was guaranteed. Participants had the right to refuse to participate.
The questionnaire included the following sections: (a) Part I, demographic information (age, gender, gender, educational level, clinic of attendance, duration of treatment) (Q1–Q5); (b) Part II, two questions (Q6–Q7) about patients’ acoustic health; (c) Part III, a question with five subquestions and a question with one subquestion concerning anxiety and potential irritations in the dental clinic (Q8–Q9); (d) Part IV, two questions about sound preferences in the waiting area (Q10–Q11); (e) Part V, eight questions regarding patients’ hobbies and habits (Q12–Q19); (f) Part VI, two questions about patients’ general health and their interest in the effect of sound on health (Q20–Q21); and (g) Part VII, two questions about patients’ dental experience with noise (Q22–Q23).
More specifically, the questionnaire investigated demographic characteristics of the sample, including gender, age, and educational level of the participants (as seen in questions Q1–Q3), which have also been described elsewhere as possible correlating factors to dental anxiety [34]. Questions Q4 and Q5 inquired about the patients’ clinic of attendance and the duration of their treatment there as background information. Questions Q6 and Q7 related to possible diagnosis of hearing loss and patients’ sensitivity to noise, respectively [35]. These questions had multiple-choice answers. Questions Q8.1–Q8.5 addressed patients’ potential discomfort regarding the crowded environment in the clinic as well as concerns about noise generated by various dental equipment such as suction devices, dental handpieces, and the ultrasonic scaler [2,8,36]. This question required answers in terms of a 5-point Likert scale, where 1 = “never (does not apply)”, 2 = “Rarely (applies to a small extent)”, 3 = “Sometimes (applies and does not apply)”, 4 = “Often (applies to a large extent)”, and 5 = “Always (always applies)”. Q9 addressed aspects that may lead to dissatisfaction, encompassing patient and staff behavior as well as the environment of the dental clinic [36,37]. Q10–Q11 referred to patients’ preferences regarding audiovisual content in the waiting room [2,23] and their music preferences [23]. In Q12, a question that is based on the ‘Health Assessment of Noise Exposure Update Questionnaire’ [35], conducted by the University of California, but also on a study by Jokitulppo et al. [38], patients filled in their hobbies. Moreover, questions Q13–Q19 were based on the equipment patients use when listening to music and their listening habits [39]. Questions Q20–Q21 were about the general health of the participants and their interest in the effect of sound on their health. Questions Q9–Q11.1 and Q13–Q21 were also multiple-choice questions. Finally, open-ended questions, Q22–23, gathered patients’ perspectives on enhancing their clinic experience, specifically regarding sound and any concerns they may have regarding noise within the dental practice.
Before the full-scale implementation, the questionnaire underwent pilot testing with a small group of individuals to ensure clarity, relevance, and appropriateness of the questions. Adjustments were made based on feedback received during this phase. The structure of the final questionnaire is seen in Table 1.

Table 1.
Summary of the questions in the self-administrated questionnaire.
The questionnaire was available in written form but was also assigned a specific QR code so that participants were digitally introduced to the purpose of this study while waiting for their appointment in the reception areas. They were then asked to fill it out in written form or through their smartphones just after the end of their appointment. The questionnaire was self-administrated, and all data collected were treated with maximum confidentiality, adhering to ethical guidelines and privacy regulations mentioned before. Participation was completely voluntary, and participants had the right not to participate without penalties, ensuring that their relationship with the university (and the private dental setting) remained unaffected. By submitting the study questionnaire, participants consented to their participation and contribution to the promotion of knowledge on soundscapes in dental settings. A max amount of twelve minutes was needed to complete the questionnaire.
2.3. Sampling Procedure and Data Collection
A systematic random sampling method was employed to select participants. Dental clinics were randomly chosen, and every 3rd patient attended the clinics (private and public ones were asked to participate during the data collection period). A trained research assistant was distributing the questionnaires to eligible patients in the waiting areas of dental clinics. Participants were encouraged to complete the questionnaire immediately after their dental appointment to ensure accurate recollection of experiences.
2.4. Statistical Analysis
Descriptive statistics were employed to summarize demographic information and participant responses. Correlation analysis was conducted to explore relationships between sound preferences, anxiety levels, and demographic variables. Data collected from the survey were analyzed with the statistical package IBM SPSS v.28. Cronbach’s alpha index was used to examine the reliability of the questionnaire. Absolute and relative frequencies were calculated to summarize demographic characteristics of the study sample. Quantitative variables were summarized with descriptive statistics (M, SD). Dummy variables were created for categorical variables to calculate Spearman correlation coefficients between demographics, music preferences, health status, noise disturbance from machines, patients, and staff and feelings of anxiety and nervousness because of the mobility in the clinic, people, and machines. Multiple linear regression analyses were used to detect significant predictors of health status and perceived noise disturbance from machines as well as noise disturbance from patients and staff [39]. Multiple linear regression was used in cross-sectional data, and all categorical variables were dummy coded. Also, the assumptions were met, considering that predictor variables were all dummy coded. More specifically, multicollinearity was assessed with VIF index, multivariate outliers were excluded based on the Mahalanobis distance, normality of residuals was assessed by producing the histogram of the regression standardized residuals, and homoscedasticity was assessed by the scatterplot of standardized predicted values with standardized residuals.
3. Results
A total of 134 questionnaires were completed, 55 from the department of dentistry and 79 from the four private practices over a 3-month period, from September 2023 to November 2023. Table 2 presents the demographic and clinical profile of the study’s sample (N = 134). Females slightly outnumbered males (56.7% vs. 43.3%). Participants were mainly aged 20–30 years (24.6%) and 51–60 years (23.9%), with fewer over 60 years (12.7%). Educational backgrounds varied: 42.5% had secondary education, 17.9% had post-secondary education, and 39.6% held university degrees. Most attended private dental clinics with over two seats (32.1%). Therapy duration was evenly distributed across ranges: 1–3 months (20.9%), 4–8 months (26.9%), 9–12 months (26.9%), and 12 months or more (25.4%). Few reported hearing loss (4.5%). Noise sensitivity varied: somewhat sensitive (56.7%), not sensitive (25.4%), and sensitive/very sensitive (17.9%). Overall health status was moderate to good (M = 3.84, SD = 0.95). Perceived noise disturbance from patients/staff (M = 2.11, SD = 1.62) and machines (M = 2.28, SD = 0.92) was low in dental clinics.
Table 2.
Demographic characteristics of the sample (N = 134).
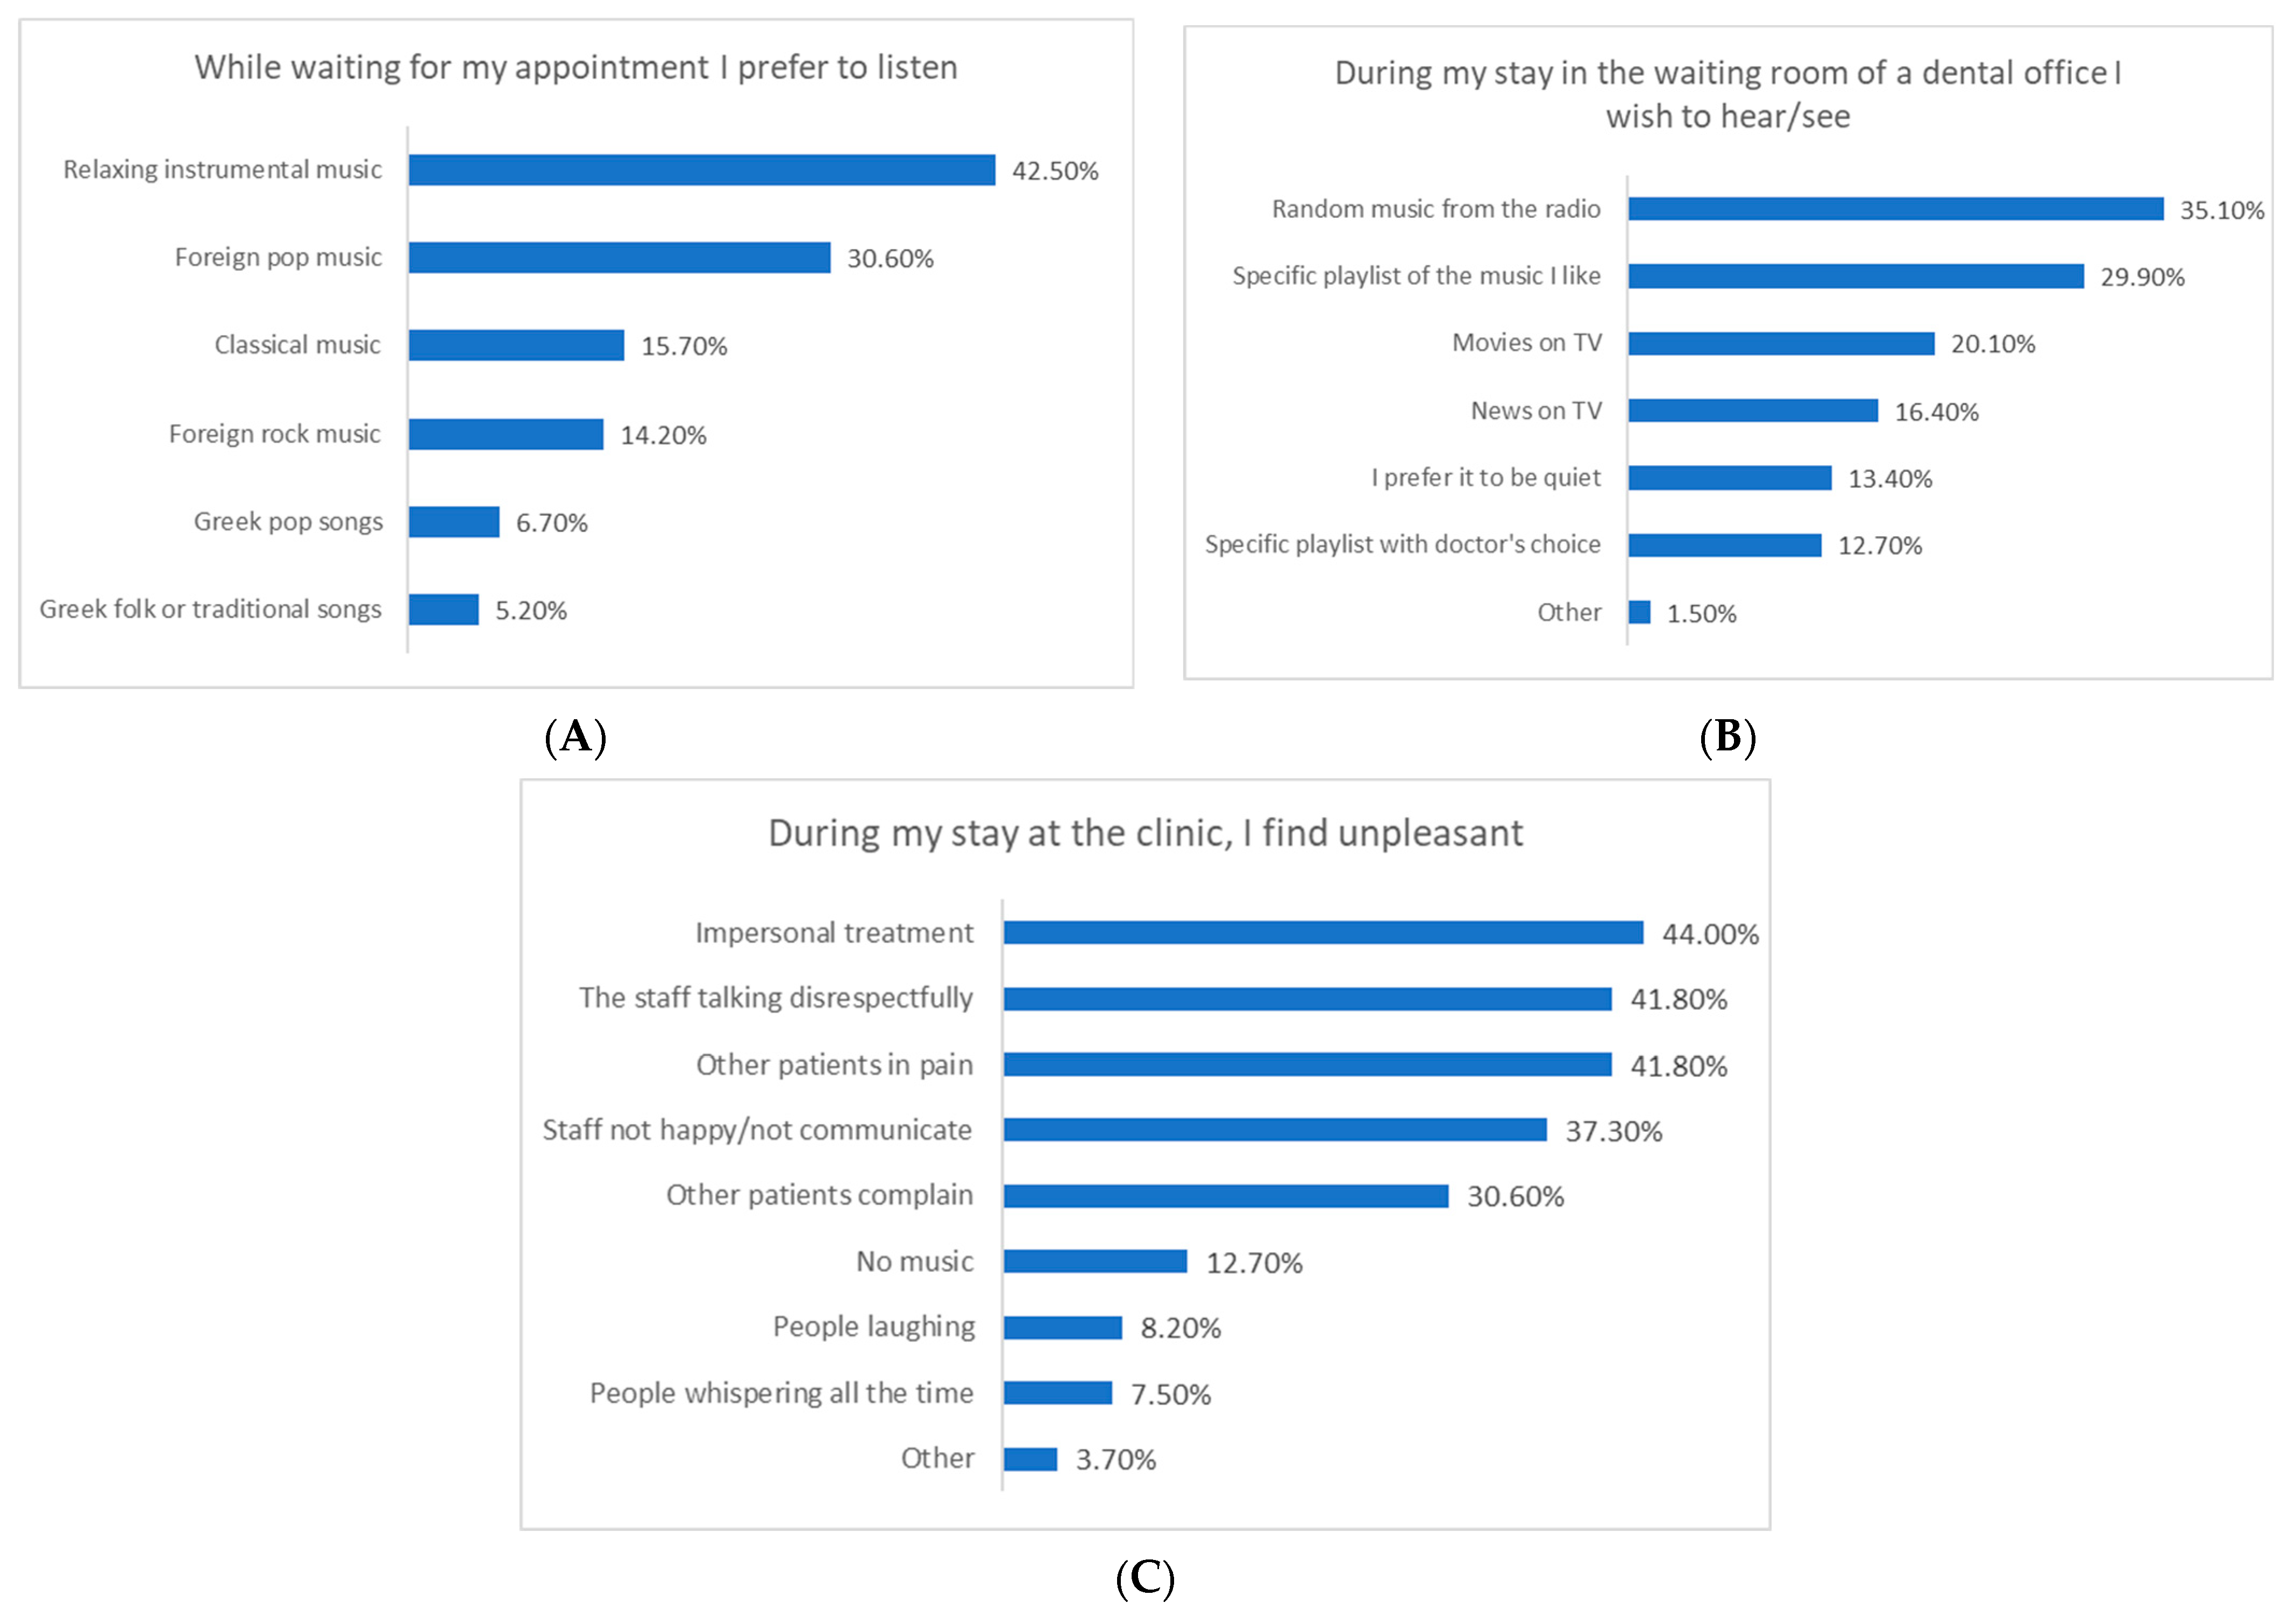
Participants waiting for dental appointments preferred relaxing instrumental music (42.5%), foreign pop (30.6%), or classical music (15.7%). In the waiting room, they wanted random radio music (35.1%), their own playlist (29.9%), TV shows (20.1%), or news (16.4%). They would be irritated by impersonal staff treatment (44%), disrespectful behavior (41.8%), hearing other patients in pain (41.8%), staff communication issues (37.3%), or complaints from others (30.6%), but only 12.7% by the lack of music in the clinic. Overall, Figure 2 shows data referring to the first research question of this study.

Figure 2.
Preferences relative to noise and music playing in the dental clinic: (A) type of music while waiting for the appointment, (B) source of music in the waiting room of the dental office, and (C) types of noise that are perceived as unpleasant in the dental clinic.
Table 3 presents data on the use of music players and related behaviors and answers to the second research question of this study. Participants primarily used radios (49.3%), headphones (41.0%), and smartphones (35.1%) for music. Most preferred moderate volume (44.0%), with significant portions liking high (29.9%) or low volumes (15.7%). Few listened at very high (8.2%) or very low volumes (1.5%). Only one person annoyed others with loud music. Speaking volumes in noisy environments were mostly moderate (36.6%) or high (35.1%). Perception of external sounds varied from bad (5.2%) to excellent (2.2%), with moderate (25.4%) and good (26.1%) being common. Daily music player usage ranged from 1–2 h (28.4%) to 0–30 min (22.4%). Continuous usage was mostly 0–30 min (32.8%) or 30–60 min (28.4%) per day. Live concert attendance was typically 1–2 times per year (46.3%), with 32.1% never attending.
Table 3.
General preferences relative to music playing and music listening.
Table 4 shows that female gender correlated with noise sensitivity (r = 0.220, p < 0.05) and poorer health (r = −0.176, p < 0.05). Private clinic visits were associated with younger age (r = −0.355, p < 0.01), higher education (r = 0.374, p < 0.01), and poorer health (r = −0.237, p < 0.01). Private clinic patients reported more noise disturbance (r = 0.235, p < 0.01) and less anxiety due to clinic mobility (r = −0.215, p < 0.05). Older age correlated with higher noise sensitivity (r = 0.194, p < 0.05), while lower education correlated with more noise from machines (r = −0.185, p < 0.05). Noise sensitivity was linked to more disturbance from machines (r = 0.438, p < 0.01), anxiety due to clinic mobility (r = 0.427, p < 0.01), and ambient noise (r = 0.399, p < 0.01). Table 4 presents data answering the third research question of this study.
Table 4.
Spearman correlation coefficients between demographic variables, health status, noise disturbance from machines, patients and staff, feelings of anxiety and nervousness because of the mobility in the clinic, people, and machines.
Since no significant associations were detected between music preferences in the dental clinic and feelings of anxiety (see Table 5), regression analyses were performed only for the outcome variables of perceived health status and noise disturbance from people and machines. Regression analysis at this stage was used exploratorily, aiming to detect the most substantial associations between music preferences and the outcome variables. In this context, better health status was linked to visiting university dental clinics (β = 0.300, p = 0.005), younger age (β = 0.300, p = 0.034), clearer perception of external sounds while using music players (β = 0.190, p = 0.039), avoiding smartphone music use (β = −0.370, p < 0.001), and disliking Greek folk songs (β = −0.200, p = 0.030). Noise disturbance from machines was associated with younger age (β = −0.270, p = 0.015), lower education (β = −0.210, p = 0.035), higher noise sensitivity (β = 0.190, p = 0.027), and increased anxiety due to ambient noise (β = 0.510, p = 0.027). Additionally, disturbance from patients or staff was related to private clinic visits (β = 0.240, p = 0.018), specific playlist preferences (β = 0.310, p = 0.012), absence of music (β = 0.280, p = 0.016), and smartphone music use (β = 0.230, p = 0.029).
Table 5.
Spearman correlation coefficients between music preferences, health status, noise disturbance from machines, patients and staff, feelings of anxiety and nervousness because of the mobility in the clinic, people, and machines.
Table 6 presents data answering the fifth research question of this study. Ιt specifically highlights significant predictors of perceived health status and noise disturbance. Better health was associated with visiting university dental clinics (β = 0.300, p = 0.005), younger age (β = 0.300, p = 0.034), and clearer perception of external sounds while using music players (β = 0.190, p = 0.039). However, poorer health correlated with liking Greek folk songs (β = −0.200, p = 0.030) and using smartphones for music (β = −0.370, p < 0.001). Noise disturbance from machines was predicted by younger age (β = −0.270, p = 0.015), lower education (β = −0.210, p = 0.035), higher noise sensitivity (β = 0.190, p = 0.027), and anxiety due to ambient noise (β = 0.510, p = 0.027). Similarly, noise disturbance from patients or staff was associated with private clinic visits (β = 0.240, p = 0.018), specific playlist preferences (β = 0.310, p = 0.012), absence of music (β = 0.280, p = 0.016), and smartphone music use (β = 0.230, p = 0.029).
Table 6.
Regression coefficients of demographics, volume preferences, music preferences, and device preferences for predicting health status, as well as noise disturbance from machines and noise disturbance from patients or staff.
4. Discussion
The present study provides a comprehensive overview of dental patients’ estimations of noise levels and sound disturbances in private and public dental clinics. The importance of controlling noise in healthcare settings, particularly within dental clinics, has already been discussed in relevant studies [1,5,8,40,41,42]. In the study we conducted in 2023, where we measured the noise levels using digital sound level meters and noise-integrating dosimeters equipped with analog electronic transducers, data were collected from specific postgraduate and undergraduate clinics and laboratories during peak operational hours. Our assessments included both personal (dosimeters) and static (area monitoring) noise exposure evaluations, focusing on various teaching-related activities in dental clinics. Across all locations, the maximum exposure limit value of 87 dB(A) was not exceeded. However, our findings revealed that chairside personal measurements during ultrasonic work surpassed the lower exposure action value of 80 dB(A), reaching 80.7 dB(A) [8], thus giving us a reason to pursue the current study concerning noise estimation on site. The insights gathered then on this issue from the data presented here further align with and extend upon previous research [2,8], offering an examination of the interplay between soundscapes in different dental environments (public and private ones), patient experiences, and healthcare outcomes. Overall, in our study, participants reported low perceived noise disturbance, both from people and dental equipment, emphasizing the importance of a calm clinical environment [6]. However, specific potential irritants were identified, such as staff behavior, other patients’ expressed pain, and communication gaps, emphasizing the need for personalized approaches to enhance the patient experience as mentioned elsewhere, too [9,10].
4.1. Preferences of Patients Relative to Noise, Music, and Volume Playing in the Dental Clinic
Μore specifically, the emotional dimensions of everyday sounds were already highlighted, showing that sound’s effects go beyond audiological considerations [3]. Our study further reveals that factors like listening habits, personal experiences, age, and individual preferences influence how sounds in dental settings are perceived. What may be soothing to one person could be irritating to another based on unique backgrounds and associations [43]. Moreover, the timing and setting of noise within the dental office can significantly impact its emotional effect [44]. According to our results, preferring higher volume on audio/video players was positively associated with higher noise disturbance from patients and staff. This correlation suggests that even though individuals may typically listen to audio/video content at high volumes, when they are in a dental office setting and where they may already feel anxious, the emotional impact of noise disturbance prompts a desire for reduced volume levels. This complexity highlights the rich interplay of psychological and situational factors in shaping our emotional responses to the sounds around us, as mentioned by other studies [45]. Moreover, our finding that 29.9% of respondents listen to music at high volumes underscores the need to consider not only individual preferences but also the situational context in which sound is experienced. Just as the timing and setting within a dental office can significantly impact the emotional effect of a noise, such as the sound of a dental drill for example, individuals’ choices to listen to music at high volumes may reflect their attempts to modulate their emotional state in various environments as discussed elsewhere [46].
4.2. Types of Noise Related to Disturbance and Feelings of Anxiety in the Dental Soundscape
Considering the psychological and physiological repercussions of noise exposure, it becomes evident that maintaining a controlled acoustic environment in dental clinics is paramount. Our participants commented on the sounds from other patients and their impersonal personnel and communication as a lack of quality in their dental journey [47]. Specifically, most respondents (44%) agreed that they would feel dissatisfaction if the staff of a dental clinic treated them impersonally and failed to explain the treatment plan. Significant concerns also revolve around the way staff address patients, particularly when perceived as impolite and when overhearing others in pain (41.8%). These situations not only lead to dissatisfaction but also raise stress levels and decrease relaxation, as noted already [48]. Our data highlights that dental patients value conduct, communication, and noise levels in the dental office, as well as other patients’ responses to treatment, recognizing their impact on emotional well-being and comfort during visits [6,8,11].
4.3. Relationship between Patient Demographics and Their Experience of Disturbance and Anxiety Caused by Noise in the Dental Soundscape
In this study, there are connections between demographic/psychographic factors and noise sensitivity/disturbance, adding to research on age, gender, education, health, and perceptual experiences in healthcare [1,3,4,5,49,50,51,52]. Females dominate our sample, and this is consistent with studies showing gender-specific links to noise sensitivity and health [1,3,49,50]. We also found a correlation between female gender and noise sensitivity, echoing previous research suggesting women may be more sensitive to noise [49,50]. Further, the age distribution in our study hints at generational differences in preferences, with older age correlating with heightened noise sensitivity influenced by aging-related health factors [4,51]. Younger individuals are more bothered by machine noise, possibly due to increased exposure to technology like smartphones [52]. This raises concerns about technology’s impact on our sensory experiences and reactions to environmental stimuli [52].
Further, multiple linear regression analyses utilized in this study to detect the most substantial associations between music preferences and health status, as well as noise disturbance, produced some interesting yet strange results. For example, the clearer perception of external sounds while using music players and aversion to Greek folk songs were related to better perceived health; that is to say, participants who listen to music at lower volumes and do not like Greek folk music reported better health in this study. Since the data are cross-sectional, no cause-and-effect relationship between these variables could be assumed, yet they may provide insights into more complicated effects [53]. For example, the preference for listening to Greek folk music was more prevalent in female participants of this study. At the same time, female participants reported poorer health and higher noise sensitivity compared to male participants. Hence, the associations between folk music preference, perception of external sounds, and health status may depict a more complex relationship between gender, music preference in dental offices, and health status or may be limited to the particularities of this specific sample. More research in larger samples is needed to account for these relationships.
Additionally, we found that opting for private clinics over university clinics is associated with a younger demographic, possibly reflecting the preferences of Generation Z for exclusive, quality service [54]. Younger individuals may favor private clinics for their shorter treatment plans and faster service. Higher education levels are also linked to private clinic visits, consistent with prior research [12]. Participants with secondary education levels were most common in our study, with lower education levels correlating with increased noise disturbance from machines [55]. Understanding how education influences sensitivity to environmental stimuli could shed light on why those with lower education levels may be more reactive to machine-generated noise, possibly due to differences in cognitive processing, environmental exposure, or economic factors [55,56]. Further research in this area could inform interventions to explore noise exposure effects, particularly among vulnerable populations [55].
4.4. Preferences of Dental Patients Relative to Music Playing in the Dental Soundscape
This study further examines participants’ music preferences and anxiety-alleviating behaviors, revealing a range of choices. Preferences for relaxing instrumental, foreign pop, and classical music align with the literature suggesting their anxiolytic effects in healthcare settings [14,21]. However, the relatively low irritation reported due to the absence of music in the dental clinic suggests that while music is appreciated, it might not be universally expected. A significant majority of participants prefer relaxing instrumental music while waiting, as suggested by previous studies [27,57,58], aiming to establish a healthy acoustic environment [45]. Yet, it remains unclear what elements should be prioritized for a healthy dental acoustic soundscape [44]. Additionally, many participants expressed a desire for random radio music, indicating the potential value of offering diverse music options to cater to varied preferences in healthcare settings [27].
4.5. Predictors of Disturbance and Feelings of Anxiety Due to Noise in the Dental Soundscape
Finally, our findings emphasize the importance of customizing sound interventions to individual preferences for a more positive patient experience in dental offices. About 29.90% of respondents prefer specific music playlists while waiting, echoing the significance of considering music preferences to reduce stress [59]. Patients often express a desire to choose their own music and adjust volume levels, suggesting the use of headphones for personalized music experiences [27,60]. Our data also shed light on participants’ music player usage and behaviors, with radio being a popular choice due to its accessibility and diverse content, as mentioned elsewhere [16]. Associations between volume preferences, health status, and noise disturbance in our study further highlight the complex interplay between individual traits and environmental factors [31,61]. Predictors of better health include visiting university clinics and younger age, suggesting the clinical environment’s influence on patients’ well-being [37].
This study has limitations worth considering in future research. The cross-sectional design offers only a static view of participant experiences, hindering causal relationship establishment. So, longitudinal designs could better capture dynamics over time. It is also important to mention that in this study, no acoustic parameters were considered since both public and private clinics are working places with no exaggerated needs for acoustics, as in concert hall areas, to interpret sound halo and other effects that could possibly interfere with noise levels thus providing to our participants a misleading environment for sound estimation [8]. Furthermore, no construction materials of the study areas were assessed since all clinics were more than 50 years old, and no renovation of building walls has ever been performed except for the inside design constructions. Additionally, reliance on self-report measures may introduce response bias. Future studies should incorporate objective measures and observational data. Also, this study’s generalizability is limited due to sample homogeneity and small size, urging broader participant recruitment. Qualitative methods could finally enhance understanding of patients’ emotional experiences.
Future investigations should aim for a different representation of diverse dental care settings to provide a wider understanding of patient experiences across various dental contexts and could make use of Weinstein’s noise sensitivity scale as a tool to search for individuals’ affective reactions and attitudes to both general noise and daily environmental sounds [62]. Despite limitations, this study suggests an interesting research model for future studies to track changes in dental patients’ noise experiences and preferences during dental appointments. Understanding the way that dental soundscapes impact patients’ well-being across different dental settings or procedures would contribute to broader and better-quality dental healthcare practices.
5. Conclusions
This study uncovers a notable perceived health status among participants, coupled with minimal noise disturbance in university dental clinics. Notably, instrumental music, foreign pop, and classical tunes dominate waiting times. However, concerns arise regarding impersonal treatment and staff behavior. Correlations and predictors highlight links between age, gender, educational status, music preferences, and noise disturbances. Female gender correlates with higher noise sensitivity, and younger age was associated with preferences for private clinic services and soundscapes. These findings seek to enhance eco-soundscapes in dental offices, ultimately fostering improved patient well-being. The research reports on the potential of music interventions in controlling dental anxiety and enhancing the overall dental experience and quality of care.
Author Contributions
Conceptualization, M.A. and P.T.; methodology, M.A., P.T. and C.A.; software, P.T. and C.A.; validation, M.A. and P.T.; formal analysis, M.A.; investigation, P.T.; resources, M.A., P.T. and C.A.; data curation, M.A.; writing—original draft preparation, M.A., P.T. and C.A.; writing—review and editing, M.A., P.T. and C.A.; visualization, M.A., P.T. and C.A.; supervision, M.A.; project administration, M.A.; funding acquisition, M.A. All authors have read and agreed to the published version of the manuscript.
Funding
This research received no external funding.
Institutional Review Board Statement
This study was conducted in accordance with the Declaration of Helsinki and approved by the Ethics Committee of the Department of Dentistry, School of Health Sciences, National and Kapodistrian University of Athens, for studies involving humans.
Informed Consent Statement
Informed consent was obtained from all subjects involved in the study.
Data Availability Statement
Data are contained within the article. Further inquiries can be directed to the corresponding authors.
Acknowledgments
The authors wish to thank all people who filled out the questionnaire of this study.
Conflicts of Interest
The authors declare no conflicts of interest.
Appendix A. Study Questionnaire
Appendix A.1. Introductory Message
This questionnaire is about recording your preferences regarding the noise and acoustic stimuli you receive while in the clinic. It also aims to investigate factors that influence your acoustic preferences in the dental clinic, as well as the intensity/frequency/quality of your acoustic stimuli during the day. It is self-administered. It is anonymous and no personal information is collected. Participation in this survey is voluntary. The questionnaire must be completed only once by each participant.
In this study, all collected data will be handled with the utmost confidentiality, adhering to ethical guidelines and personal data protection regulations. Identifiable information will be kept separately, and access to it will be restricted to members of the research team. Any elements (if any) that could potentially reveal the identity of participants will be anonymized. Participation is entirely voluntary, and participants have the right not to participate without consequences, ensuring that their relationship with the university remains unaffected.
Every possible effort will be made to minimize potential discomfort or inconvenience for participants, and the study does not involve any risks. All research data will be securely stored digitally, with limited access granted only to the researchers. Data retention will adhere to relevant ethical guidelines, and their secure disposal will occur after a specified period.
By submitting the study questionnaire, participants consent to their involvement and contribution to advancing knowledge regarding sound in dental clinics. The research team is committed to maintaining the highest ethical standards throughout the entire process. Responding to the questionnaire takes approximately 10 min.
The questionnaire consists of six parts:
- PART ONE: Contains questions related to demographic characteristics.
- PART TWO: Includes a total of 2 questions (Q6–Q7) about hearing loss diagnosis among participants and their sensitivity to noise.
- PART THREE: Includes a total of 2 questions with sub-questions (Q8–Q9) addressing situations that create discomfort in the dental office.
- PART FOUR: Contains a total of 2 questions with sub-questions (Q10–Q11) about patients’ preferences regarding audiovisual content and music in the waiting room.
- PART FIVE: Consists of eight questions (Q12–Q19) related to patients’ hobbies and listening habits.
- PART SIX: Consists of two questions about patients’ general health (physical and mental) and their interest in the effect of sound on health (Q20–Q21).
- PART SEVEN: Finally, the last part includes two open-ended questions (Q22–Q23), allowing participants to express concerns about noise in the dental office and suggest ways to improve their experience.
We appreciate your cooperation, and we thank you in advance.
For any questions or concerns, participants are encouraged to contact the principal investigator or the Ethics Committee of the Dental School at the National and Kapodistrian University of Athens.
Appendix A.2. Study Questionnaire
- Q1.
- What is your gender? Male_Female_Other
- Q2.
- What is your age? 20–30_31–40_41–50_51–60_61–70_71+
- Q3.
- What is your educational level? Primary school_High school_Private University_ Public University
- Q4.
- In what dental clinic do you proceed for your dental treatment? Private clinic with one dental chair_ Private dental clinic with two or more dental chairs_ Undergraduate university clinic_Postgraduate university clinic
- Q5.
- How often do you come to the clinic for your dental care (indicate the consecutive time period)? 1–3 months_4–8 months_9–12 months_ 12 or more months
- Q6.
- Have you been diagnosed with hearing loss? Yes_No_I am not sure/I would like not to answer
- Q7.
- Are you generally sensitive to noise? Not at all_Sensitive_Very sensitive
- Q8.
- Which of the following applies to you now?
- Q8.1
- Do you feel restless, anxious, or nervous because of the mobility in the clinic (people come and go all the time): 1 = Never (does not apply) 2 = Rarely (applies to a small extent) 3 = Sometimes (applies and does not apply) 4 = Often (applies to a large extent) 5 = Always (always applies)
- Q8.2
- Do you feel anxious during your stay in the clinic because of the ambient noise from people and machinery? 1 = Never (does not apply) 2 = Rarely (applies to a small extent) 3 = Sometimes (applies and does not apply) 4 = Often (applies to a large extent) 5 = Always (always applies)
- Q8.3
- Does the suction noise bother you? 1 = Never (does not apply) 2 = Rarely (applies to a small extent) 3 = Sometimes (applies and does not apply) 4 = Often (applies to a large extent) 5 = Always (always applies)
- Q8.4
- Does the airotor/micromotor noise bother you? 1 = Never (does not apply) 2 = Rarely (applies to a small extent) 3 = Sometimes (applies and does not apply) 4 = Often (applies to a large extent) 5 = Always (always applies)
- Q8.5
- Does the scaling noise bother you? 1 = Never (does not apply) 2 = Rarely (applies to a small extent) 3 = Sometimes (applies and does not apply) 4 = Often (applies to a large extent) 5 = Always (always applies)
- Q9.
- During my stay at the clinic, I feel uncomfortable when: I hear other patients being in pain_I hear other patients complaining_I hear the staff talking disrespectfully_I hear people whispering_I hear people laughing_People treat me impersonally and don’t explain the treatment_Staff are not happy and do not address me_I don’t listen to music_Other
- Q9.1
- If you answered “other” to the previous question, please fill in (briefly) what else you find unpleasant during your stay at the clinic.
- Q10
- While waiting for my appointment I prefer to listen: Relaxing instrumental music_Pop music_Rock music of foreign repertoire_Greek pop_Greek folk songs_Traditional songs_Classical music_Opera_Other
- Q10.1
- If you marked “Other” in the previous question, please summarise here what else you like to listen to.
- Q11
- During my stay in the waiting room of a dental clinic I wish to hear/watch: (you can tick more than one option): Film on TV_News on TV_Random music selections from the radio station_Playlist of music I like_Playlist with the doctor’s choice_I prefer it to be quiet_Other
- Q11.1
- If you answered “other” to the previous question, please fill in (briefly) what you would like to hear/watch in the waiting room.
- Q12
- Note the hobbies you participate in at least 1–2 times a month: Reading_Horseriding_All-terrain motoring_Running_Golf_Walking_Swimming_Hiking_Motorcycling_Barcade_Concerts_Hunting_Shooting_Firearms shooting_Scuba fishing_Cinema_Cycling_Attending webinars_Attending scientific workshops/conferences_Sports_Camping_Horticulture_Carpentry/woodcutting_Other activity not listed (please tick).
- Q13
- What types of devices do you use to play music? Headphones_Television_Radio_Smartphone_Other
- Q13.1
- If you answered “other” to the previous question, please indicate which other music player you use.
- Q14
- What is usually the volume of the audio/video player you use? Very low_Low_Neither loud nor low_Loud_Very loud_Others are disturbed by the volume I listen to music
- Q15
- What is the top volume of your voice in a noisy environment? Very low_Low_Neither loud nor low_Loud_Very loud_Others are annoyed by the volume of my voice
- Q16
- What is your perception of external sounds while using the music player? Poor_Average_Neutral_Good_Very good_Excellent
- Q17
- What is the total amount of time you use music players per day? 0–30 min_30–60 min_1–2 h_2–3 h_3–4 h_Over 4 h
- Q18
- How many hours of continuous use of your music player do you do per day? 0–30 min_30–60 min_1–2 h_2–3 h_3–4 h_Over 4 h
- Q19
- Do you attend live concerts? Never_1–2 times a year_3–4 times a year_4–5 times a year_5 times or more
- Q20
- What do you consider to be your state of health (physical and mental) at the moment? Bad_Fair_Neither bad nor good_Good_Very good
- Q21
- Would you like to know more about the effect of sound/noise on your health? Yes_No_I am not interested in the subject
- Q22
- What would you like to see improved in the acoustics of the clinic to make you feel better during your stay? (fill in)
- Q23
- Thank you for your participation. Please add here anything else that concerns you about noise in the dental office (optional).
References
- Shetty, R.; Shoukath, S.; Shetty, S.K.; Dandekeri, S.; Shetty, N.H.G.; Ragher, M. Hearing Assessment of Dental Personnel: A Cross-sectional Exploratory Study. J. Pharm. Bioallied. Sci. 2020, 12 (Suppl. S1), S488–S494. [Google Scholar] [CrossRef]
- Muppa, R.; Bhupatiraju, P.; Duddu, M.; Penumatsa, N.V.; Dandempally, A.; Panthula, P. Comparison of anxiety levels associated with noise in the dental clinic among children of age group 6–15 years. Noise Health 2013, 15, 190–193. [Google Scholar] [CrossRef] [PubMed]
- McGeoch, P.D.; Rouw, R. How everyday sounds can trigger strong emotions: ASMR, misophonia and the feeling of wellbeing. Bioessays 2020, 42, e2000099. [Google Scholar] [CrossRef] [PubMed]
- Kühlmann, R. The Sound of Medicine: Evidence-Based Music Interventions in Healthcare Practice; Erasmus University Rotterdam: Rotterdam, The Netherlands, 2019. [Google Scholar]
- Hartland, J.C.; Tejada, G.; Riedel, E.J.; Chen, A.H.; Mascarenhas, O.; Kroon, J. Systematic review of hearing loss in dental professionals. Occup. Med. 2023, 20, 391–397. [Google Scholar] [CrossRef] [PubMed]
- Antoniadou, M.; Tziovara, P.; Antoniadou, C. The Effect of Sound in the Dental Office: Practices and Recommendations for Quality Assurance-A Narrative Review. Dent. J. 2022, 10, 228. [Google Scholar] [CrossRef] [PubMed]
- Ai, Z.T.; Cheuk Ming, M.; Hai, W. Noise level and its influences on dental professionals in a dental hospital in Hong Kong. Build. Serv. Eng. 2017, 38, 522–535. [Google Scholar] [CrossRef]
- Antoniadou, M.; Tziovara, P.; Konstantopoulou, S. Evaluation of Noise Levels in a University Dental Clinic. Appl. Sci. 2023, 13, 10869. [Google Scholar] [CrossRef]
- Jue, K.; Nathan-Roberts, D. How Noise Affects Patients in Hospitals. Proc. Hum. Factors Ergon. Soc. Annu. Meet. 2019, 63, 1510–1514. [Google Scholar] [CrossRef]
- Shapiro, M.; Melmed, R.N.; Sgan-Cohen, H.D.; Eli, I.; Parush, S. Behavioural and physiological effect of dental environment sensory adaptation on children’s dental anxiety. Eur. J. Oral. Sci. 2007, 115, 479–483. [Google Scholar] [CrossRef]
- Appukuttan, D.P. Strategies to manage patients with dental anxiety and dental phobia: Literature review. Clin. Cosmet. Investig. Dent. 2016, 8, 35–50. [Google Scholar] [CrossRef]
- Wide, U.; Hakeberg, M. Treatment of Dental Anxiety and Phobia-Diagnostic Criteria and Conceptual Model of Behavioural Treatment. Dent. J. 2021, 9, 153. [Google Scholar] [CrossRef]
- Ainscough, S.L.; Windsor, L.; Tahmassebi, J.F. A review of the effect of music on dental anxiety in children. Eur. Arch. Paediatr. Dent. 2019, 20, 23–26. [Google Scholar] [CrossRef]
- Nilsson, U. The anxiety- and pain-reducing effects of music interventions: A systematic review. AORN J. 2008, 87, 780–807. [Google Scholar] [CrossRef]
- Chen, Y.; Hawkins, J. Effects of music listening to reduce preprocedural dental anxiety in special needs patients. Complement. Ther. Clin. Pract. 2021, 42, 101279. [Google Scholar] [CrossRef] [PubMed]
- Oomens, P.; Fu, V.X.; Kleinrensink, G.J.; Jeekel, J. The effect of music on simulated surgical performance: A systematic review. Surg. Endosc. 2019, 33, 2774–2784. [Google Scholar] [CrossRef] [PubMed]
- Iyendo, T.O. Exploring the effect of sound and music on health in hospital settings: A narrative review. Int. J. Nurs. Stud. 2016, 63, 82–100. [Google Scholar] [CrossRef]
- Wazzan, M.; Estaitia, M.; Habrawi, S.; Mansour, D.; Jalal, Z.; Ahmed, H.; Hasan, H.A.; Al Kawas, S. The Effect of Music Therapy in Reducing Dental Anxiety and Lowering Physiological Stressors. Acta Biomed. 2022, 92, e2021393. [Google Scholar] [CrossRef]
- Antoniadou, M.; Mangoulia, P.; Myrianthefs, P. Quality of Life and Wellbeing Parameters of Academic Dental and Nursing Personnel vs. Quality of Services. Healthcare 2023, 11, 2792. [Google Scholar] [CrossRef]
- Packyanathan, J.S.; Lakshmanan, R.; Jayashri, P. Effect of music therapy on anxiety levels on patient undergoing dental extractions. J. Family Med. Prim. Care 2019, 8, 3854–3860. [Google Scholar] [CrossRef]
- Bradt, J.; Teague, A. Music interventions for dental anxiety. Oral. Dis. 2018, 24, 300–306. [Google Scholar] [CrossRef]
- Karapicak, E.; Dulger, K.; Sahin, E.; Alver, A. Investigation of the effect of music listened to by patients with moderate dental anxiety during restoration of posterior occlusal dental caries. Clin. Oral. Investig. 2023, 27, 3521–3530. [Google Scholar] [CrossRef]
- Iyendo, T.O. Sound as a supportive design intervention for improving health care experience in the clinical ecosystem: A qualitative study. Complement. Ther. Clin. Pract. 2017, 29, 58–96. [Google Scholar] [CrossRef] [PubMed]
- Heiderscheit, A.; Breckenridge, S.J.; Chlan, L.L.; Savik, K. Music preferences of mechanically ventilated patients participating in a randomized controlled trial. Music Med. 2014, 6, 29–38. [Google Scholar] [CrossRef] [PubMed]
- Rehfeldt, R.A.; Tyndall, I.; Belisle, J. Music as a Cultural Inheritance System: A Contextual-Behavioral Model of Symbolism, Meaning, and the Value of Music. Behav. Soc. Iss. 2021, 30, 749–773. [Google Scholar] [CrossRef]
- Corah, N.L.; Gale, E.N.; Pace, L.F.; Seyrek, S.K. Relaxation and musical programming as means of reducing psychological stress during dental procedures. J. Am. Dent. Assoc. 1981, 103, 232–234. [Google Scholar] [CrossRef] [PubMed]
- Lai, J.C.; Amaladoss, N. Music in Waiting Rooms: A Literature Review. HERD 2022, 15, 347–354. [Google Scholar] [CrossRef] [PubMed]
- Lynch, K.A.; Emard, N.; Liou, K.T.; Popkin, K.; Borten, M.; Nwodim, O.; Atkinson, T.M.; Mao, J.J. Patient Perspectives on Active vs. Passive Music Therapy for Cancer in the Inpatient Setting: A Qualitative Analysis. J. Pain Symptom Manag. 2021, 62, 58–65. [Google Scholar] [CrossRef] [PubMed]
- Save the Music. Available online: https://www.savethemusic.org/blog/music-therapy-and-mental-health/ (accessed on 3 May 2023).
- Very Well Mind. Available online: https://www.verywellmind.com/music-and-personality-2795424 (accessed on 30 October 2023).
- Davies, C.; Page, B.; Driesener, C. The power of nostalgia: Age and preference for popular music. Mark. Lett. 2022, 33, 681–692. [Google Scholar] [CrossRef]
- Rentfrow, P.J.; Goldberg, L.R.; Levitin, D.J. The structure of musical preferences: A five-factor model. J. Pers. Soc. Psychol. 2011, 100, 1139–1157. [Google Scholar] [CrossRef]
- Fuentes-Sánchez, N.; Pastor, R.; Eerola, T.; Escrig, M.; Pastor, M. Musical preference but not familiarity influences subjective ratings and psychophysiological correlates of music-induced emotions. Personal. Individ. Differ. 2022, 198, 111828. [Google Scholar] [CrossRef]
- Kassem, H.; Hajj, E.; Fares, Y.; Abou-Abbas, L. Assessment of dental anxiety and dental phobia among adults in Lebanon. BMC Oral. Health 2021, 21, 48. [Google Scholar] [CrossRef]
- University of California, Berkeley. Health Assessment of Noise Exposure Update Questionnaire. Available online: https://uhs.berkeley.edu/sites/default/files/noiseexposure.pdf (accessed on 30 October 2023).
- Kankaala, T.; Kaakinen, P.; Anttonen, V. Self-reported factors for improving patient’s dental care: A pilot study. Clin. Exp. Dent. Res. 2022, 8, 1284–1294. [Google Scholar] [CrossRef] [PubMed]
- Jokitulppo, J.; Toivonen, M.; Björk, E. Estimated leisure-time noise exposure, hearing thresholds, and hearing symptoms of Finnish conscripts. Mil. Med. 2006, 171, 112–116. [Google Scholar] [CrossRef] [PubMed]
- Johnson, T.A.; Cooper, S.; Stamper, G.C.; Chertoff, M. Noise Exposure Questionnaire: A Tool for Quantifying Annual Noise Exposure. J. Am. Acad. Audiol. 2017, 28, 14–35. [Google Scholar] [CrossRef]
- Field, A. Discovering Statistics Using IBM SPSS Statistics, 5th ed.; SAGE Publications: Thousand Oaks, CA, USA, 2017. [Google Scholar]
- Vreman, J.; Lemson, J.; Lanting, C.; van der Hoeven, J.; van den Boogaard, M. The Effectiveness of the Interventions to Reduce Sound Levels in the ICU: A Systematic Review. Crit. Care Explor. 2023, 5, e0885. [Google Scholar] [CrossRef] [PubMed]
- Souza, R.C.D.S.; Calache, A.L.S.C.; Oliveira, E.G.; Nascimento, J.C.D.; Silva, N.D.D.; Poveda, V.B. Noise reduction in the ICU: A best practice implementation project. JBI Evid. Implement. 2022, 20, 385–393. [Google Scholar] [CrossRef] [PubMed]
- Xiao, X.; Tan, J.; Liu, X.; Zheng, M. The dual effect of background music on creativity: Perspectives of music preference and cognitive interference. Front. Psychol. 2023, 14, 1247133. [Google Scholar] [CrossRef]
- Lim, J.; Kweon, K.; Kim, H.W.; Cho, S.W.; Park, J.; Sim, C.S. Negative impact of noise and noise sensitivity on mental health in childhood. Noise Health 2018, 20, 199–211. [Google Scholar] [CrossRef]
- Chen, J.; Ma, H. A Conceptual Model of the Healthy Acoustic Environment: Elements, Framework, and Definition. Front. Psychol. 2020, 11, 554285. [Google Scholar] [CrossRef]
- Aletta, F.; Kang, J. Promoting Healthy and Supportive Acoustic Environments: Going beyond the Quietness. Int. J. Environ. Res. Public Health 2019, 16, 4988. [Google Scholar] [CrossRef]
- Ferrer-Torres, A.; Giménez-Llort, L. Misophonia: A Systematic Review of Current and Future Trends in This Emerging Clinical Field. Int. J. Environ. Res. Public Health 2022, 19, 6790. [Google Scholar] [CrossRef]
- Antoniadou, M.; Devetziadou, M. Sensory Branding: A New Era in Dentistry. Online J. Dent. Oral. Health 2020, 3, 1–8. [Google Scholar]
- Grissinger, M. Disrespectful Behavior in Health Care: Its Impact, Why It Arises and Persists, And How to Address It-Part 2. Pharm. Ther. 2017, 42, 74–77. [Google Scholar]
- Abbasi, A.; Darvishi, E.; Rodrigues, M.; Sayehmiri, K. Gender differences in cognitive performance and psychophysiological responses during noise exposure and different workloads. Appl. Acoust. 2022, 189, 108602. [Google Scholar] [CrossRef]
- Shepherd, D.; Heinonen-Guzejev, M.; Hautus, M.J.; Heikkilä, K. Elucidating the relationship between noise sensitivity and personality. Noise Health 2015, 17, 165–171. [Google Scholar] [CrossRef]
- Shepherd, D.; Welch, D.; Dirks, K.N.; Mathews, R. Exploring the relationship between noise sensitivity, annoyance and health-related quality of life in a sample of adults exposed to environmental noise. Int. J. Environ. Res. Public Health 2010, 7, 3579–3594. [Google Scholar] [CrossRef] [PubMed]
- Brodersen, K.; Hammami, N.; Katapally, T.R. Smartphone Use and Mental Health among Youth: It Is Time to Develop Smartphone-Specific Screen Time Guidelines. Youth 2022, 2, 23–38. [Google Scholar] [CrossRef]
- Savitz, D.A.; Wellenius, G.A. Can Cross-Sectional Studies Contribute to Causal Inference? It Depends. Am. J. Epidemiol. 2023, 192, 514–516. [Google Scholar] [CrossRef]
- McMaughan, D.J.; Oloruntoba, O.; Smith, M.L. Socioeconomic Status and Access to Healthcare: Interrelated Drivers for Healthy Aging. Front. Public Health 2020, 8, 231. [Google Scholar] [CrossRef]
- Lercher, P.; Evans, G.W.; Meis, M. Ambient Noise and Cognitive Processes among Primary Schoolchildren. Environ. Behav. 2003, 35, 725–735. [Google Scholar] [CrossRef]
- Klatte, M.; Bergström, K.; Lachmann, T. Does noise affect learning? A short review on noise effects on cognitive performance in children. Front. Psychol. 2013, 4, 578. [Google Scholar] [CrossRef] [PubMed]
- Dingle, G.A.; Sharman, L.S.; Bauer, Z.; Beckman, E.; Broughton, M.; Bunzli, E.; Davidson, R.; Draper, G.; Fairley, S.; Farrell, C.; et al. How Do Music Activities Affect Health and Well-Being? A Scoping Review of Studies Examining Psychosocial Mechanisms. Front. Psychol. 2021, 12, 713818. [Google Scholar] [CrossRef] [PubMed]
- Wang, K.; Gao, S.; Huang, J. Learning about Your Mental Health From Your Playlist? Investigating the Correlation Between Music Preference and Mental Health of College Students. Front. Psychol. 2022, 13, 824789. [Google Scholar] [CrossRef] [PubMed]
- Krause, A.E.; Scott, W.G.; Flynn, S.; Foong, B.; Goh, K.; Wake, S.; Miller, D.; Garvey, D. Listening to music to cope with everyday stressors. Music. Sci. 2023, 27, 176–192. [Google Scholar] [CrossRef]
- Kamioka, H.; Tsutani, K.; Yamada, M.; Park, H.; Okuizumi, H.; Tsuruoka, K.; Honda, T.; Okada, S.; Park, S.J.; Kitayuguchi, J.; et al. Effectiveness of music therapy: A summary of systematic reviews based on randomized controlled trials of music interventions. Patient Prefer Adherence 2014, 8, 727–754. [Google Scholar] [CrossRef]
- Burns, D.S.; Sledge, R.B.; Fuller, L.A.; Daggy, J.K.; Monahan, P.O. Cancer patients’ interest and preferences for music therapy. J. Music Ther. 2005, 42, 185–199. [Google Scholar] [CrossRef]
- Worthington, D.L. Weinstein Noise Sensitivity Scale (WNSS) 1978; Worthington, D.L., Bodie, G.D., Eds.; The Sourcebook of Listening Research; Wiley Online Library: Hoboken, NJ, USA, 2017. [Google Scholar] [CrossRef]
Disclaimer/Publisher’s Note: The statements, opinions and data contained in all publications are solely those of the individual author(s) and contributor(s) and not of MDPI and/or the editor(s). MDPI and/or the editor(s) disclaim responsibility for any injury to people or property resulting from any ideas, methods, instructions or products referred to in the content. |
© 2024 by the authors. Licensee MDPI, Basel, Switzerland. This article is an open access article distributed under the terms and conditions of the Creative Commons Attribution (CC BY) license (https://creativecommons.org/licenses/by/4.0/).