Abstract
Deep neural networks are powerful image classifiers but do they attend to similar image areas as humans? While previous studies have investigated how this similarity is shaped by technological factors, little is known about the role of factors that affect human attention. Therefore, we investigated the interactive effects of task and image characteristics. We varied the intentionality of the tasks used to elicit human attention maps (i.e., spontaneous gaze, gaze-pointing, manual area selection). Moreover, we varied the type of image to be categorized (i.e., singular objects, indoor scenes consisting of object arrangements, landscapes without distinct objects). The human attention maps generated in this way were compared to the attention maps of a convolutional neural network (CNN) as revealed by a method of explainable artificial intelligence (Grad-CAM). The influence of human tasks strongly depended on image type: for objects, human manual selection produced attention maps that were most similar to CNN, while the specific eye movement task had little impact. For indoor scenes, spontaneous gaze produced the least similarity, while for landscapes, similarity was equally low across all human tasks. Our results highlight the importance of taking human factors into account when comparing the attention of humans and CNN.
1. Introduction
Human–technology cooperation could greatly benefit from recent advances in deep learning. In the context of image classification, convolutional neural networks (CNN) can match or even surpass human abilities [1]. For instance, they can support humans in tasks such as medical image analysis [2], the recognition of facial expressions [3] or the understanding of complex scenes [4]. However, CNN act like a black box, while successful human–technology cooperation requires transparency [5,6]. The transparency of CNN can be enhanced by methods of explainable artificial intelligence (XAI). These XAI methods generate attention maps, highlighting the image areas that contributed to the CNN model’s classification decision. Such transparency is crucial as humans lose trust in a model if it relies on image areas that do not make sense to them [7]. Accordingly, it has rightfully been claimed that similarity to human attention is a relevant dimension for evaluating CNN and XAI methods. But how similar or different are the areas attended by humans and CNN? Comparisons of XAI outputs to human attention maps indicate that CNN often base their decisions on different image areas than humans (e.g., [8,9,10,11]). However, it is not always clear why. More precisely, most studies selectively focused on technological influences on human–CNN similarity such as the specific CNN or XAI method. In contrast, influences on human attention have not been in focus such as the task procedures used to elicit human attention maps (e.g., eye tracking vs. manual selection) or the images to be classified (e.g., single objects vs. complex scenes). While a striking diversity in these factors can be observed across studies, the effects of this diversity are poorly understood.
The purpose of the present study was to specify how human–CNN similarity is influenced by two human-related factors (i.e., tasks and images). Understanding these influences is important for practical and theoretical reasons. From a practical perspective, it can assist researchers in choosing particular human tasks and images for their human–CNN comparisons. It enables them to estimate whether their choice is likely to be inconsequential or whether it is likely to have profound effects on their results. This also allows them to decide whether they can safely base this choice on convenience and practical feasibility (e.g., relying on manual selection instead of eye movements, as the latter cannot be assessed in online studies). Conversely, in some cases, it might be important to choose a particular task or image type in order to obtain interpretable results. Similarly, understanding these dependencies allows researchers to estimate whether their results are likely to generalize to other tasks and images. From a theoretical perspective, knowledge about the influence of human-related factors can foster a more thorough understanding of the similarities and differences between human and artificial image classification strategies. It allows us to specify the boundary conditions under which humans and CNN may use strategies that are highly similar or fundamentally different. Ultimately, this knowledge may contribute to the development of better deep learning models. To investigate the human-related influences on human–CNN similarity, the present study makes the following contributions:
- We review the previous literature investigating the similarity between human and CNN attention. In this review, we specifically focus on the influence of tasks and images, concluding that the current knowledge about these two influences is insufficient;
- We conduct a human experiment in which participants have to select the areas most relevant for the classification of different types of images using different elicitation tasks;
- We compare the resulting human attention maps to those generated by a standard CNN model and XAI method that are most common in this area of research. This comparison reveals large influences of both task and image type on human–CNN similarity, calling into question the generalizability of previous findings. We discuss the implications for future research.
It needs to be noted that this article presents a psychological experiment, manipulating two factors that are known to shape human attention and assessing the effects on human–CNN similarity. In contrast, we do not propose any new technologies. In fact, we intentionally selected the most common, standard technologies for our CNN model (ResNet) and XAI method (Grad-CAM). This was done to guarantee that our results can easily be compared to those obtained in previous studies. In that way, differences between the results can more clearly be attributed to the factors we manipulated instead of technological factors that were not the focus of this study.
The article is organized as follows. To facilitate reasoning about the similarity between human and CNN attention maps, we first provide a brief overview of the psychological literature on scene viewing and the deep learning literature on image classification (Section 2.1). We ask what factors guide human eye movements in real-world scenes and highlight some general differences in the image processing of CNN. We then review and integrate previous studies that compared human and CNN attention maps (Section 2.2). In this literature review, we explicitly focus on the methodological diversity in tasks and images. Based on this overview, we derive our own experimental approach (Section 2.3). We describe our methods (Section 3) by specifying the participant sample, the lab setup and stimulus materials, the experimental procedures, the CNN model and XAI method as well as our approach to analyzing attention maps. The presentation of our results (Section 4) analyzes the similarity between humans and CNN as well as between different human tasks and also takes a look at the size of the attended areas. Finally, in the discussion (Section 5), we explore the effects of tasks, image types and comparison metrics, contemplate a number of potential influences on our findings, make the limitations of the present study explicit and propose directions for future research.
2. Theoretical Background
2.1. Visual Scene Processing of Humans and CNN
2.1.1. How Do Humans Process Scenes?
Humans can infer the basic-level category of scenes at a glance. The representation of this so-called gist refers to the overall meaning of a scene [12]: people instantly extract both low-level features (e.g., spatial frequencies, color) and high-level semantic information (e.g., birthday party). Gist perception relies on two complementary information sources: global scene statistics and diagnostic objects. On the one hand, there are regularities in the structure and color patterns of scenes from different categories, which enable a fast and reliable categorization [13]. These physical scene statistics generate subjectively perceivable global properties (e.g., openness, temperature or dynamics) that are vital for categorization [14]. For instance, deserts are high in openness and temperature but low in dynamics, while waterfalls are low in openness and temperature but high in dynamics. Accordingly, people are less likely to confuse deserts and waterfalls than deserts and wheat fields. On the other hand, diagnostic objects provide important information and a single object can be enough to categorize a scene [15]. For instance, people are able to infer that a scene is an office merely based on the presence of a computer screen. Taken together, scene statistics and objects allow people to quickly extract the gist of a scene.
Subsequently, this gist representation helps people decide where to move their eyes for more thorough analysis. Eye movements are needed as people can only see sharply within the small area of foveal vision and thus have to sequentially fixate relevant parts of the image [16,17]. Such fixations land on informative areas which typically contain objects, while people rarely fixate uniform background areas like the sky or desert sand [18]. Ample evidence suggests that it is the meaningfulness (i.e., semantic relevance) of image areas that controls where people look, even when the areas are not physically salient [19].
How do people know whether an area is meaningful without already having looked at it? This can largely be attributed to scene context: based on learned knowledge about statistical regularities, people can predict where meaningful objects are likely to be found [20]. Similar to initial gist processing, the contextual guidance of eye movements relies on the two complementary sources of global scene statistics and object-to-object relations. First, physical scene statistics and the resulting global properties determine where people move their eyes [21]. This is because objects are systematically organized along horizontal layers, so that people can expect airplanes to appear in the sky and pedestrians on the ground. A second important source of contextual guidance are object-to-object relations [22] because particular objects systematically co-occur in the real world. On the one hand, some objects serve as anchors for others [23]. For instance, when looking for a laptop, people may initially fixate a table rather than a window sill. On the other hand, subsequent fixations land on semantically related objects even when this relation is not hierarchical [24]. For instance, after fixating a plate, people are more likely to fixate a fork than a chandelier.
The relative importance of global properties and object-to-object relations may depend on the type of scene [15]: global properties are particularly informative for outdoor scenes that differ in spatial layout, while objects are more informative for indoor scenes. Systematic transitions between semantically related objects may lead to a higher predictability of eye movements in indoor scenes. Conversely, eye movements are less deterministic for landscapes, which encourage exploration [25]. These findings indicate that it is worthwhile to consider the type of image when comparing human and CNN attention.
Although human scene viewing is highly efficient, eye movements do not depend only on task-relevant image features. People are also prone to systematic viewing biases. One such source of distraction is the saliency of physical features [26]. There is an ongoing debate whether the influence of saliency can fully be ascribed to meaning, as the two factors are highly correlated [27,28]. However, for current purposes, it suffices to note that sometimes task-irrelevant features can catch the human eye. Perhaps the most prominent example is social stimuli like faces, which reflexively capture attention [29]. Another task-independent influence on eye movements is central fixation bias [30]: people tend to look at the center of an image, even when the relevant contents are located in the periphery. To understand the effects of such systematic viewing biases on comparisons between human and CNN attention maps, we need to consider how CNN process scenes.
2.1.2. How Does CNN Scene Processing Compare to That of Humans?
Convolutional neural networks (CNN) are deep learning models that are optimized for image processing as they take the relations between neighboring pixels into account. In recent years, there has been a moderate development in the field of CNN. According to widely acknowledged benchmarks on the ImageNet dataset for classification tasks, two architectures stand out: ConvNext [31] and RevCol [32]. Both approaches are reported to yield classification accuracy results that are comparable to most advanced image processing models such as Vision Transformers [33] or Swin Transformers [34]. However, the majority of XAI-related publications have relied on the ResNet architecture [35]. Therefore, we decided to also use this older and slightly less performant model to allow for better comparability of our results to previous work.
Despite being inspired by the visual processing in biological brains, standard CNN models do not have selective attention but raster the entire image. This is important when interpreting the attention maps generated by XAI: nonhighlighted areas do not indicate that they were not processed by the CNN but merely that they did not contribute to the classification decision. For the sake of simplicity, we still refer to both human and CNN outputs as attention maps but it should be noted that this does not mean the same thing in both cases.
Moreover, CNN consist of several layers of neurons, with different layers processing different types of information [36]: whereas early layers focus on low-level features like colors and textures, later layers are responsible for high-level concepts like shapes and objects. The information represented in mid-level layers is most similar to the scene representations that humans rely on when categorizing complex scenes [37]. Many common XAI methods, including Grad-CAM [38] that was used in the present study, rely on information from the last convolutional layer. Accordingly, the CNN attention maps generated by these methods mainly reflect high-level concepts and focus on broad areas. This may make them more similar to some types of human attention maps than others, as discussed below.
What scene contents do CNN use to classify scenes? In what ways does this resemble human scene processing and how does it differ? And might CNN in fact be prone to similar biases? Excellent discussions of this comparison can be found elsewhere (e.g., [10,39,40]). Therefore, we will selectively focus on the aspects highlighted in the section on human scene viewing that are central to the present study. That is, we will emphasize the role of contextual guidance and its sources (i.e., global properties and objects) as well as the presence of task-irrelevant biases, while not considering other issues such as the sensitivity to image distortions and adversarial attacks.
Just like humans, CNN strongly rely on scene context and tend to select classes that match this context. However, humans usually benefit from compatible, typical context but are still able to flawlessly categorize objects when the context is atypical. In contrast, atypical context affects the performance of CNN in remarkable ways and can lead to characteristic misclassifications [40,41]: CNN may fail to recognize objects in unexpected locations (e.g., cows at the beach) and may classify nonexisting objects when the context is suggestive (e.g., infer sheep when processing images of hills with green grass). This indicates that CNN sometimes rely on context much more than on the actual objects to be classified. Their heavy use of context mainly depends on global scene statistics. Conversely, CNN have problems with the second form of contextual guidance, namely, object-to-object relations. Accordingly, most computational approaches perform worse when classifying indoor scenes than landscapes [42]. An example of the restricted ability of CNN to deal with object relations pertains to relative object size. Unlike humans, CNN do not miss targets when their size is unusual [43]. However, the flip side is that CNN easily mistake objects for visually similar ones (e.g., confusing brooms and toothbrushes), not taking their implausible size within the scene context into account.
Another dimension for comparison is the role of task-irrelevant biases. First, it seems like CNN attend to the saliency of image features in general (e.g., edges, luminance or colors), not just the class-defining object [9]. However, the mechanisms behind this impact of saliency are likely to differ between humans and CNN. For humans, saliency effects can largely be attributed to their strong correlation with meaning [27]. It is unlikely that CNN also extract such meaning and they may even rely on salient image areas that have nothing to do with the actual class. Thus, the areas attended by CNN may not make sense to humans [44,45]. Many of these divergences can be ascribed to “excessive invariance” [46]: CNN learn whatever shortcut is sufficient for classification, which may or may not match the important scene characteristics according to human standards [40].
Given these similarities and differences in scene processing between humans and CNN, it can be expected that their measurable outputs, namely attention maps, might also differ. The following section will summarize the available research on comparing human and CNN attention maps, extract the factors that affect this comparison, assess the insights that previous studies provide about these factors and specify a research gap that has been ignored up to now.
2.2. Comparing Human and CNN Attention Maps
2.2.1. Overview of Findings
Typically, the similarity between human and CNN attention maps is quite low [10,47,48,49,50]. Human attention tends to be more selective and focused on specific areas, while CNN attention is more diffuse and distributed [50,51]. Some studies found that CNN put more weight on context than humans [9,11]. For instance, CNN attention maps may highlight the mere presence of body parts (e.g., fingers or lips) to classify skin diseases [45]. Accordingly, the areas attended by humans are more discriminative and diagnostic [8].
Aside from these general observations, human–CNN similarity depends on technological factors. First, it varies with the network [9,10,11,52]. For instance, similarity is higher for deeper networks with more layers [9] and for networks that process information more like humans, for instance via biologically plausible receptive fields [10] or human-inspired attention mechanisms [47,53]. A second technological influence on human–CNN similarity is the XAI method used to elicit CNN attention maps [8,49,51,54]. This is not surprising, given the immense variety in the outputs of different XAI methods: some highlight edges while others highlight broad regions and some provide pixelated or patch-like segments while others provide smooth and gradual heatmaps. Finally, the similarity may also depend on an interaction of neural network and XAI method [55]: a particular network may appear more similar to humans than another network when explained by one XAI method but less similar to humans when explained by another XAI method.
In sum, previous studies have provided a rather nuanced picture of the technological influences on human–CNN similarity. Conversely, they have rarely investigated any human-related influences or factors that affect human attention maps. In the present study, we investigated two of these factors: the tasks used to elicit human attention maps and the images to be categorized. Before specifying our research questions, we will give an impression of the variability in these factors across previous studies.
2.2.2. Influence of Tasks
We use the term “task” to refer to the procedures of eliciting human attention maps. These procedures differ between studies in two nested ways: how directly they assess attention and how this assessment is implemented in specific cognitive activities. Concerning the first distinction, a rather direct assessment approach is to track people’s eye movements during scene categorization, while a less direct approach is to let people manually select the image areas they consider relevant. Within these two general approaches, previous studies have used various cognitive activities: different categorization procedures or different means of manual selection. The following section is organized by the general assessment approaches and reviews the variety of specific activities within them.
Eye movements. Eye tracking is often considered the gold standard for eliciting human attention maps and thus most studies have applied this method [8,10,48,49,50,51,53,54,56,57]. In these studies, people’s eye movements were tracked while they performed a wide variety of cognitive activities that differed on several dimensions. One such dimension is the amount of experimental control. On the one hand, there have been unrestricted tasks such as free verbal descriptions during routine radiological image reading [48,53] or driving in natural environments [50]. On the other hand, there have been highly controlled tasks such as performing saccades to briefly presented images [10]. In between these extremes, various categorization procedures have been used such as verbal labelling [49,56], keypress responses to choose between categories [8,52,57] or textual explanations of why the image matches a category label [51]. A second dimension on which previous tasks differed is the degree to which they encouraged people to focus their eyes on a specific area or to broadly explore the image. Some tasks required attention to small details, such as the fine-grained classification of birds [8,52] or the explicit description of features responsible for classification [51]. Other tasks diverted eye movements more broadly, such as naming as many objects as possible [49] or reading radiological images [48,53]. A third dimension pertains to restrictions of viewing time. This ranged from extremely short times (e.g., 150 ms) that only permit one fixation [10] to medium times (e.g., 3 s) that allow for a brief inspection [8,49,56] up to unlimited time that enables people to thoroughly investigate the image [48,50,51,53,57].
However, not only the variability of tasks but also the method of eye tracking per se must be evaluated critically. First, eye movements convey some information that is not relevant for scene categorization due to systematic viewing biases. Second, they fail to convey other information that actually is relevant because basic scene categorization can proceed without any need for eye movements. Moreover, attention maps generated from eye movements reflect people’s search processes (instead of their decision as CNN attention maps do) and thus fixations may land on areas where the target might be located (based on contextual constraints) but actually is not: good guesses that upon closer inspection turned out to be wrong [20]. These tendencies might cast doubts on the suitability of eye movements to indicate which image areas people need for categorization. Thus, it is worthwhile to contrast them with other means of eliciting attention maps, which do not suffer from the same problems.
Manual selection. Compared to eye tracking studies, the number of studies that elicited human attention maps via manual selection is smaller [9,11,45,47,55,58]. At the same time, their diversity is even larger. Manual selection studies differ in how people defined the areas relevant for categorization and in their degrees of freedom. One type of task is to define the outlines of relevant areas, either by drawing polygons [45] or by lassoing them [58]. Such procedures provide a binary value (0/1) for each participant and image and gradual variations in attention maps only emerge from the aggregation of several participants. Conversely, another method immediately provides gradual relevance estimates for each participant [47]: participants viewed blurred images and had to deblur relevant areas by repetitive rubbing with their mouse cursor. This enabled a slight deblurring of areas that were only coarsely searched and a complete deblurring of areas that, upon closer inspection, turned out to be actually relevant. For one, this procedure provides a close analogy to eye movements, which also combine a quick ambient “where” processing of the layout and a subsequent focal “what” analysis of object details [59]. Finally, one study elicited human attention maps by asking participants to order predefined image segments according to their relevance for classification [9]. Another version of the same principle is to click on relevant image areas with the mouse to make them visible for a partner [11].
An important dimension that differentiates between these manual selection tasks is the likelihood of including scene context. First, including context can be encouraged by means of deblurring, where context processing is an integral part of the elicitation procedure [47]. Second, including context can be up to participants when they are free to select whatever areas they want [45]. Third, it can be discouraged when segment ordering by relevance pushes participants to start with all parts belonging to the category-defining object [9,11]. Finally, it can be prevented entirely when only the image parts inside an object segmentation mask are available for selection [55,58].
Aside from the specific implementation, manual selection per se comes with characteristic advantages and disadvantages. These are complementary to those of eye tracking: manual selection is a highly conscious, intentional activity and thus may not adequately reflect the information humans actually use for categorization. On the one hand, they might conceive of their task as selecting the image areas that define an object instead of the image context they actually need [9]. However, the opposite effect is also possible: humans may select more than they actually need for categorization, especially when the category is defined by large proportions of the image (e.g., for landscapes). Thus, they may select all areas of equal importance, even when in fact they need much less information. Taken together, humans might not be well aware of their inner processes of categorization and thus may not even know what information they are attending to.
Comparing tasks. Despite the striking diversity of tasks used in previous studies, their impacts on human–CNN similarity have not been systematically investigated. A few studies assessed the impacts of task characteristics on human attention but did not relate these results to CNN attention. First, Yang et al. [51] compared two eye tracking procedures: free viewing versus explaining why an image matches its label. Free viewing led to distributed eye movements that often targeted irrelevant objects, while explanation induced a focus on key features. Second, Das et al. [47] used manual deblurring and varied the information available to participants (e.g., full image, model prediction). A medium amount of information produced attention maps that could most easily be interpreted by new participants. No previous studies have assessed how task variations affect the similarity between humans and CNN; thus, we can only speculate about that. Figure 1 presents a continuum of intentionality on which different elicitation tasks can be placed. Eye movement tasks are located at the low intentionality end of the continuum whereas manual selection tasks are located at the high end. Presumably, tasks at the low end reflect attentional processes more directly but also produce more false positive information. Conversely, tasks at the high end can specify the category as imagined by humans but also produce false negatives and redundant information.
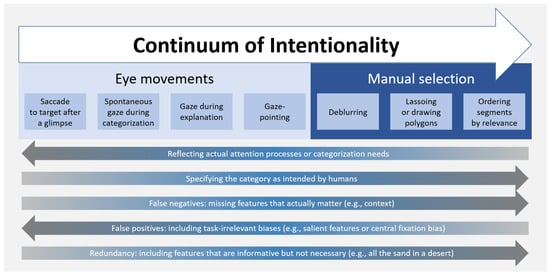
Figure 1.
Continuum of intentionality on which different tasks to elicit human attention maps can be located. The arrows represent different dimensions that can increase or decrease with intentionality. The direction and darkness of the arrows marks the direction of increase.
2.2.3. Influence of Image Type
A second major source of variation between previous studies stems from the images they used for classification. Dimensions of variation include image complexity, ambiguity of the areas relevant for classification, structural similarity of the images and relevance of specific image details. The following section will discuss some of these differences and review studies that compared different image types more or less explicitly.
Differences in image types. A first dimension of variation is image complexity. Some studies used simple images with only one salient object (e.g., [10,58]), while others used complex scenes with multiple objects (e.g., [9,47,49]). Again, others used images that can only be interpreted by experts such as medical images [45,48,53,54,57]. Second, images varied in the ambiguity of areas relevant for categorization. Presumably, it is rather straightforward to select relevant areas when the image only contains one salient object. This is likely to result in a higher similarity between humans and CNN. Conversely, it is more ambiguous which areas define landscapes. For instance, for deserts, it seems impossible to unequivocally select the most relevant patches of sand. Sometimes, image complexity and selection ambiguity may diverge, for instance when the category is clearly defined by a specific object in a highly complex scene [9,47]. Third, the similarity of images within one and the same study varied. For instance, a high structural similarity is characteristic for human faces [56] or medical images [48,52,54,57]: while most of the image is identical across trials, specific details differentiate between categories. In contrast, for natural scenes, each image may have a completely different layout. A fourth, related dimension is whether the category distinction depends on a small specific detail, for instance during fine-grained classification of similar bird species [8,52]. Such images do not need to be structurally similar but still prompt humans to only focus on the most discriminative areas. Given this enormous variability in the images to be categorized, it is problematic that most previous studies did not make the characteristics of their images sufficiently explicit.
Comparing image types. Based on the human scene viewing literature, it seems likely that human–CNN similarity depends on image type. A few isolated observations support this assumption, although most of them only reflect qualitative post hoc reports. On the one hand, influences of image type can emerge when some images are more prone than others to unintended shortcuts used by CNN. For instance, while classifying skin diseases, images with particular body parts yielded low similarity because the CNN looked at the mere presence of lips, hair or fingernails instead of the actual skin condition [45]. Moreover, higher similarity was observed when salient, clearly discernible image areas were task-relevant. First, abnormal chest X-rays yielded higher similarity than normal ones, presumably because they contained areas of interest that attracted the attention of both humans and CNN [53]. Similarly, images of animate objects yielded higher similarity than images of inanimate objects, perhaps because they drew attention to faces [10]. Taken together, task and image characteristics are likely to affect human attention maps and thereby change the similarity between humans and CNN. However, the available research only provides insufficient information about these influences.
2.3. Present Study
The present study investigated how human–CNN similarity depends on the task used to elicit human attention maps and the type of image to be categorized. To this end, we conducted an experiment in which humans had to assign scene images to one of six categories via keypress responses. In different parts of the experiment, we varied the intentionality of the task, using two types of eye tracking and manual selection. Within all three tasks, we varied the type of image, manipulating whether the categories mainly depended on objects, object-to-object relations or global scene properties. We compared the resulting human attention maps to CNN attention maps generated by a common XAI method (Grad-CAM, [38]). Henceforth, we will refer to our attention maps via the name of the specific elicitation method (e.g., spontaneous gaze, Grad-CAM) instead of the agent whose attention is elicited (e.g., human, CNN) or the general elicitation approach (e.g., eye tracking, XAI). We aim to investigate how similarity depends on task characteristics, image characteristics and their interaction.
2.3.1. How Does Similarity Depend on the Task Used to Elicit Human Attention Maps?
Our tasks represented three points on a continuum of intentionality (see Figure 1). On the low end, we simply tracked participants’ spontaneous gaze during categorization. The aim of this task was to obtain fixations on areas that participants actually used, not confounded by participants being unaware of their true information needs. At the same time, this task comes with three risks. First, it might produce only few fixations because eye movements are not needed for rapid gist perception. If participants do move their eyes, this leads to the second risk, namely that fixations might mainly reflect response selection processes (i.e., remembering the key mapping). In the best case, participants might look at the category-defining areas while selecting their response. In the worst case, it might lead to the third risk, namely that eye movements reflect task-irrelevant biases. In sum, attention maps generated via spontaneous gaze might provide little information about the areas actually needed for categorization.
Given these risks, attention maps can be elicited by moving to the other end of the continuum of intentionality: manual selection. This was implemented in a task we will call drawing: participants used their mouse to draw a polygon around the most relevant area. This avoids the risks of spontaneous gaze but comes with the risk of participants not being aware of their inner processes. This could take two forms. First, participants might select the whole area that defines a category (e.g., all the sand in a desert). While this choice is valid given that natural scenes are defined by global properties, it might include areas that people would never actually attend to. Second, the opposite risk is for participants to select arbitrary areas (e.g., a small patch of desert sand). Presumably, these areas would be different for each participant, providing little generalizable information.
Considering the complementary risks of spontaneous gaze and drawing, we introduced a third task to combine the benefits and mitigate the costs: gaze-pointing. We instructed participants to intentionally fixate the areas most relevant for categorization. This task was inspired by two previous findings. First, tracking participants’ eyes while they explained why an image matched a category label led them to focus on key features [51]. Second, gaze-pointing caused eye movements to be more focused on relevant parts of a scene than free viewing [60]. Gaze-pointing still is likely to include fixations on task-irrelevant areas but might compensate for this by putting additional weight on task-relevant areas that participants would not spontaneously look at (e.g., desert sand). From a practical perspective, gaze-pointing can tell us whether attention maps benefit from additional instruction or whether spontaneous gaze is sufficient to elicit useful attention maps.
Concerning the similarity of human attention maps to CNN, different outcomes are conceivable. On the one hand, if our concerns about spontaneous gaze and drawing are warranted, this should lead to higher similarity with gaze-pointing than the two other tasks. On the other hand, if the concerns about one or both tasks are unwarranted, we might find different results, depending on which task actually is problematic. However, we also expected these effects to be highly dependent on image type, which is why we consider the interaction to be most informative.
2.3.2. How Does Similarity Depend on the Image to Be Categorized?
Our image types aimed to capture relevant distinctions from the psychological literature on scene viewing. For each image type, we used two separate but similar categories to make our task sufficiently difficult. Our first image type, which we will refer to as objects (i.e., lighthouse, windmill), only required the identification of a single diagnostic object to infer the category. This object was embedded in a natural scene context, which certainly facilitates categorization but is not strictly necessary. Our second image type comprised two indoor scenes (i.e., office, dining room). Here, the category can be inferred from several diagnostic objects and their relations, whereas global properties are similar across categories. To this end, we selected two categories that include chairs and tables, which typically are the most salient objects in indoor scenes [21]. Finally, our third image type was landscapes (i.e., desert, wheat field), with the scene category mainly depending on global properties but not on diagnostic objects or their relations.
We hypothesized that human–CNN similarity would be largest for objects as they provide a single key feature. Furthermore, we expected medium similarity for indoor scenes due to a strong guidance of eye movements by semantic relations between objects. Finally, we expected the lowest similarity for landscapes, assuming eye movements to be widely distributed across the image. However, as indicated above, we were most interested in the interaction between task and image type.
2.3.3. How Do Task and Image Type Interact?
We hypothesized that any influences of task would strongly depend on image type. First, for objects, we expected human–CNN similarity to be consistently high across all three tasks with no clear differences between them. As the categories were defined by a locally restricted, salient and meaningful object, we assumed this object to attract human attention, both by focusing their gaze and constraining their manual selections. Thus, the risks of using eye movements should be negligible (i.e., low influence of task-irrelevant biases) and the relevant areas should be easy to select manually (i.e., simply drawing a polygon around the object).
Second, for landscapes, we expected human–CNN similarity to be low across all three tasks, again with no differences between them. You probably cannot mark specific areas in any coherent manner for large, uniform areas of sand or grain, which should lead to a high variability of human attention maps in all tasks. Thus, not even the more intentional forms of selection (i.e., gaze-pointing, drawing) are likely to produce consistent results. Drawings might fall between two strategies, with some participants selecting large proportions of the scene, some selecting arbitrary patches and some selecting anything in between. For the two eye movement tasks, we expected participants to widely spread their gaze across the image. However, due to the powerful influence of scene guidance, eye movements were expected to be somewhat more systematic than drawings, perhaps even leading to higher similarity with CNN, which also rely global scene statistics.
Finally, we did expect task differences for indoor scenes. Due to the risks described above, spontaneous gaze and drawing might be less similar to CNN, while gaze-pointing might lead to comparably high similarity. This is because we expected indoor scenes to result in a pattern somewhere in between objects and landscapes. Similar to landscape images, the broad distribution of scene-defining contents might make it hard to select relevant areas. Similar to object images, object-based scene guidance might direct participants’ gaze to particular indoor scene objects. However, the benefit should be higher for gaze-pointing as it is assumed to compensate for systematic viewing biases. Taken together, we expected the influence of task to be strongest for indoor scenes.
3. Methods
3.1. Data Availability
All images, human participant data and source code (CNN, XAI, attention maps, comparison metrics) are made available via the Open Science Framework (https://osf.io/k9t5f/) (accessed on 18 March 2024). Within this repository, the minimal dataset is to be found here: https://osf.io/rtf3u (accessed on 18 March 2024). The source code is additionally available on GitHub (https://github.com/cknoll/Humans-vs.-CNN-Effects-of-task-and-image-type) (accessed on 18 March 2024).
3.2. Participants
Twenty-eight members of the TUD Dresden University of Technology participant pool (ORSEE, [61]) took part in the experiment in exchange for course credit or a payment of EUR 8 per hour. Due to occasional hardware problems, the eye tracker computer failed to store the eye movement files of three participants. Thus, the final sample consisted of 25 participants (16 female, 9 male) with an age range of 20 to 64 years (M = 32.4, SD = 10.9). Only participants who were fluent in German and had normal vision were included. The research was approved by the Ethics Committee at the TUD Dresden University of Technology, participants provided informed consent and all procedures followed the principles of the Declaration of Helsinki.
3.3. Apparatus and Stimuli
3.3.1. Lab Setup and Eye Tracking
The experiment took place in a lab room at TUD. Eye movements were tracked monocularly at 1000 Hz using the EyeLink 1000 infrared eye tracking system (SR Research Ltd., Ottawa, ON, Canada) with a chin rest and a viewing distance of 93 cm. Stimuli were presented on a 24″ LCD display with a resolution of 1920 by 1080 pixels at a refresh rate of 60 Hz. A Cedrus pad was used for keypress responses and a standard computer mouse was used to draw polygons around relevant image areas.
3.3.2. Images
Images were taken from the Places365 dataset [62], which provides a wide variety of images from 365 different classes. We chose this dataset because it offers a wide variety of different scene types (i.e., objects, indoor scenes, landscapes) compared to the heavily object-focused ImageNet dataset [63]. The complexity of its natural scenes was important to us for three reasons. First, we needed a dataset that allowed us to investigate the distinction between images that rely on diagnostic objects versus object-to-object-relations versus global properties. Second, we wanted to increase the likelihood of being able to obtain eye movements at all, which would have been even more uncertain if we had used simpler images. Third, Places365 provides images at a much higher and consistent spatial resolution than other datasets like ImageNet, and in this way enabled us to present images in a format that is large enough to observe subtle differences in fixation locations.
We used the whole dataset for training the CNN but only a subset of 102 images for the human experiment. Suitable images were selected, center-cropped and resized to a square format of 1024 × 1024 pixels. These images were then presented at the center of the screen in front of a white background. We manually went through the images to ensure that the relevant areas still were in full view and replaced images where this was not the case. In total, 102 images were selected; 60 of them for the main experiment and 42 for practice.
For the main experiment, we selected 20 images for each of our three image types. Within each image type, we used two categories and thus each category consisted of 10 exemplars (see Figure 2 for examples). To make categorization more challenging, these two categories were highly similar in terms of their scene statistics and global properties (e.g., openness, temperature). Other than that, we aimed for a high variability in the images for exploratory purposes. Accordingly, images differed in whether they included salient, category-irrelevant objects that might attract eye movements and had no fixed ratio of the area covered by potentially category-defining versus less relevant contents.
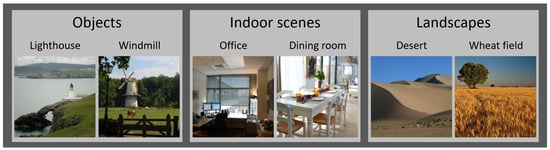
Figure 2.
Stimulus examples for all three image types and the two corresponding categories.
For the image type objects, all scenes included one clearly discernible object of the respective category (i.e., lighthouse, windmill) and thus categories were unambiguously defined by local object information. While the objects were embedded in natural contexts, these contexts could be more or less informative. For instance, only some of our lighthouses were presented in front of a coastline. Some images also contained other, irrelevant objects (e.g., ships or cars). For indoor scenes, the images presented an arrangement of objects in a room with a specific function (i.e., office, dining room). All images included chairs and tables and three offices also included a person. For landscapes, nature scenes with large, relatively uniform areas were used (i.e., desert, wheat field). Some landscapes also contained salient objects (e.g., agricultural machinery, houses).
Besides these images, the following additional stimulus screens were used in the experiment. First, at the start of the experiment participants saw a screen on which they had to input their demographic data (i.e., age and gender). Second, before each block, instruction screens summarized the respective task. However, the main instruction was provided in a video before the experiment. Third, in the first practice block, verbal category labels (instead of images) were presented centrally on a white background in black font (Tahoma, 30 pt). Finally, in the practice blocks, a feedback screen informed participants about the correctness of their response. In case of an error, a schematic image of the Cedrus pad was shown that linked the category labels to the respective keys to remind participants of the correct key assignment. All materials were provided in German language.
3.4. Procedure
Throughout the experiment, participants had to assign images to six categories via keypress responses. The specifics of this procedure depended on the respective task (see below). In a within-participants design, we varied the two factors task (spontaneous gaze, gaze-pointing, drawing) and image type (objects, indoor scenes, landscapes). The tasks varied between consecutive blocks in a fixed order and image type varied randomly between trials. The same 60 images were used in all three blocks.
A session started with participants receiving a brief summary of the procedure and providing informed consent. They were then shown the instruction video and the eye tracker was calibrated. This was followed by two practice blocks (42 trials each), in which participants learned the key mapping and received feedback on the correctness of their responses. During the first practice block, they had to categorize words that corresponded to one of the six categories and, in the second practice block, they had to categorize images. They also received feedback about their response and, in case of an error, they were reminded of the correct key assignment. An overview of the main experiment’s procedure is provided in Figure 3. It consisted of three blocks (60 trials each, corresponding to the 60 images presented in random order). The blocks corresponded to the three tasks and always appeared in the same order. In the first block (i.e., spontaneous gaze), participants merely had to categorize the image by pressing a key. In the second block (i.e., gaze-pointing), participants had to categorize the image as well but were asked to intentionally look at those areas of the image that were most relevant for their decision. In the third block (i.e., drawing), participants had to first categorize the image again and, after their keypress, they had to draw a polygon around the relevant area with their mouse. Each mouse click defined a polygon point and, after setting the last point, participants could connect the last point to the first one by pressing the lower left key of the Cedrus pad.

Figure 3.
Procedure of the main experiment.
The basic procedure of a trial was identical in each block, with the exception of the additional drawing procedure in the last block. A trial started with a drift correction and participants had to fixate it while pressing the lower left key of the Cedrus pad to proceed to the image screen. The image then remained visible until participants pressed a key to indicate their category choice. The key assignment was randomly determined for each participant and participants were asked to keep their middle fingers, index fingers and thumbs on the six keys. In the main experiment, participants no longer received correctness feedback. Taken together, the experiment took about 45 min.
3.5. CNN and XAI
3.5.1. CNN Model
The CNN used in the present study was a ResNet-152 [35]. This architecture was chosen because it is the one most commonly used in previous investigations of human–CNN similarity (e.g., [8,9,10,47,51,52,54]), allowing for meaningful comparisons to previous research. The ResNet-152 consists of 152 consecutive layers, which are connected in a special structure. The basic idea is to iteratively apply convolutional filters to perform feature extraction and thus increase the information density in every layer. This is mostly done using bottleneck blocks, which consist of three convolutional layers. The input and output of each block are connected via so-called residual connections. These residual connections are used to address the vanishing gradient problem, which can disrupt the training process for CNN that consist of many layers.
The input consists of 224 × 224 × 3 tensors (i.e., three-dimensional matrices), representing the pixel values in the RGB image. Through the application of the convolutional layers, the image is successively transformed into a collection of feature maps, which are matrices of activation values. The output of the convolutional part is 2048 feature maps of size 14 × 14, which are condensed to 2048 single scalar activation values via average pooling. On these values, a fully connected layer with linear weights is applied. This so-called classification head outputs a scalar score for each of the 365 classes. Finally, a softmax function is used, which assigns a value between 0 and 100 to each class based on the respective score. This allows for an interpretation of the output as a percentage of the CNN’s certainty that the image belongs to a particular class. The overall structure has approximately 58 × 106 free parameters (i.e., weights), which allows for a relatively fast training compared to more sophisticated CNN.
The network was trained with all images of the dataset (i.e., all 365 classes) for 10 epochs with the goal of minimizing the classification error and it achieved a Top5-accuracy of 85%. The training followed the standard procedure described by He et al. [35]: The weights are initialized with random values. Subsequently, images with known class values are fed into the net and the difference between the actual and the desired output is backpropagated to the weights so that the weights are changed according to a cost function. This optimization process for the weights is repeated until overall classification performance converges. The problem of overfitting the CNN to the training images is addressed by validating the performance on test images that are not used in the training process. The model source code can be found in our OSF repository.
To apply this ResNet structure to our 60 selected images with a resolution of 1024 × 1024 pixels, these images were downsampled to 224 × 224 in order to match the dimension of the input layer. Note that, for the training process, a total of 1.825 million nonsquare images with varying resolution from the Places365 dataset were used. To make these images compatible with the input layer, transformations such as resizing and random-cropping were applied, as described by He et al. [35].
3.5.2. XAI Method
The XAI method used in the present study was Grad-CAM [38], which is the method used most often in previous comparisons of humans and CNN. The acronym expands to “Gradient-weighted Class Activation Mapping”. Grad-CAM is applicable to a wide range of CNN architectures without requiring adaptations of the internal structure. Furthermore, it is relatively straightforward to implement and results in low execution times. Technical details are provided in the section on attention map generation. Using spatial information obtained from the last convolutional layer, Grad-CAM yields an attention map, highlighting important areas of the input image. For the present study, highlights were generated for the respective target class, not the class that was deemed most likely by the CNN. For instance, in case the CNN misclassified a lighthouse for an oil rig, we still used the highlights for lighthouse.
3.6. Data Analysis
3.6.1. Attention Map Generation
To generate human attention maps, the data (i.e., fixations or polygons) were summed over all 25 participants prior to map generation. We compared two types of attention maps between humans and CNN: binary masks of a fixed size and gradual density maps. To define our binary masks, the same basic approach was used for all four types of attention maps. That is, we used the gradual density maps as a basis and set a cut-off that only kept those 5% of the area visible that received the most weight, while the rest was hidden. In this way, all attention maps had the same size, while only their shape and position varied. The threshold of 5% was chosen for two reasons. First, previous work has shown that areas as small as 5% best differentiate between human and CNN attention, whereas for larger areas of about 20%, maps get much less distinguishable [8]. Second, for object images (i.e., lighthouses, windmills), human eye movements were usually restricted to a rather small area, despite being summed over all participants, with area sizes ranging from 5.3 to 17.6% and an average of 11.0%. Thus, using a higher threshold than 5% would have required uncovering areas for some images that were never selected by any participant. However, to better understand how broadly participants actually spread their attention across the image in different task and image conditions, we additionally compared the sizes and variability of maps that uncovered all areas ever attended. The following sections will describe the specifics of area definition for different types of attention maps.
Eye movement attention maps. To generate our eye movement attention maps, we excluded all fixations outside the image, the first fixation (i.e., the one that started during drift correction), fixations with durations of less than 180 ms [64] and all fixations from trials with response times that deviated more than 2.5 SD from the average response time of 2106 ms (i.e., longer than 7629 ms). For the remaining data, the following procedure was used to generate fixation maps (for similar approaches see [8,53]). Around each fixation, we considered an area of 2 degrees of visual angle (58 pixels), which corresponds to foveal vision. Within this area, we applied a Gaussian kernel that caused the weight to decrease from the center to the outside. This kernel was scaled so that the weight was 1 at the center of the fixation and 1/58 at a distance of 58 pixels from the center (i.e., linear distance-weighting). Furthermore, each kernel was multiplicatively weighted by the fixation duration measured in milliseconds. The final attention map was generated by adding up the weighted kernels of all fixations. The resulting map was then normalized to the interval [0, 1] to simplify visualization. Note that we decided not to normalize the data for individual participants. That is, the areas only depended on fixation duration, meaning that participants with more or longer fixations had higher impact. This is because we saw no theoretical reason to discount the fixations of participants who scanned the image more thoroughly. However, we also performed exploratory analyses using a normalized procedure (i.e., each participant contributing the same weight) but found that this did not have any noteworthy impacts on the results.
Drawing attention maps. When defining the attended areas based on human drawings, we noticed some missing data due to technical problems (i.e., polygon coordinates were not recorded). This happened 20 times in total and thus removed 1.3% of the data from the analysis. Other than that, we did not exclude any drawings, regardless of how many polygon points participants defined or how long it took them. To obtain the attention maps, we started with a matrix of the same resolution as the image with all values set to 0. If an area was inside the drawn polygon for a participant, the value in the matrix was increased by 1. Adding up all polygons then produced our attention map. Unlike the other attention maps, this procedure resulted in maps with hard edges, making it unclear which pixels should be used if we wanted to limit the mask size to exactly 5% of the image. The final attention map for the drawings was thus obtained after smoothing the prior map. This was carried out via average pooling using a 3 × 3 kernel.
Grad-CAM attention maps. To generate CNN attention maps, Grad-CAM uses the gradients of any target class, flowing into the final convolutional layer to produce a coarse localization map that highlights the areas in the image that were important for predicting the class. For a given CNN and a selected class, the Grad-CAM algorithm generates an attention map, a so-called class-discriminative localization map (CDLM) for each input image. This is carried out by examining the activation flow from the last convolutional layer to the output (in other words: how the activation values influence the numerical score of the selected class). The result of the last convolutional layer can be interpreted as a collection of K feature maps, where in our case K = 2048. The last convolutional layer is chosen as it is expected “to have the best compromise between high-level semantics and detailed spatial information” ([38], p. 4). In a first step, the gradient (i.e., the relative change in the result when changing the input) of the selected class with respect to each “pixel” in each feature map is calculated. These matrices are then averaged over the pixel dimension to obtain K so-called “importance weights” alpha_k. In a second step, each feature map is weighted by these alpha_k. Any negative values in the maps are set to 0 (via so-called ReLU nonlinearity), focusing the map only on areas with a positive impact on the class decision. This results in K-weighted feature maps, which can be represented as an F × F × K tensor where F denotes the feature map resolution. As a final step, the pixel-wise average of those maps is taken (i.e., along the last axis of the F × F × K tensor) to obtain the desired CDLM. Naturally, the CDLM has the same resolution (F × F) as the output of the last convolutional layer, which is typically much lower than that of the original image, in our case 14 × 14. To apply the CDLM to our input images, bilinear upsampling was used, resulting in an attention map with the same resolution as the original image (in our case 1024 × 1024). Such an attention map contains relevance values between 0 and 1 for every pixel in the original image and could be visualized as a heatmap or density map but it can also be transformed into a binary map. This was achieved by choosing the threshold for the relevance score such that only 5% of the pixels (and thus of the total area) was included.
3.6.2. Similarity Calculation
We used two metrics to compute the similarity between attention maps: the Dice score and cross-correlation. The Dice score [65] was used for binary masks and specifies the overlapping area relative to the total attended area. It is calculated by taking two times the area highlighted in both maps to be compared (intersection) and dividing it by the sum of the two individual areas. If the areas have the same size (as it is the case in the present study), the Dice score simplifies to the size of the intersection divided by our chosen area size of 5%. This procedure creates values between 0 and 1, with 0 indicating no overlap and 1 indicating complete overlap. This metric has already been used in previous studies to compare human and CNN attention [45,56]. It is not only easy to compute but also easy to interpret because the numerical value directly corresponds to the share of overlapping area. As all maps are reduced to the same size, it also allows for a straightforward comparison of the overlap in different conditions (e.g., tasks or image types), even when the total attended areas systematically differ between them. However, this simplicity can be considered a limitation as well because comparing binary masks eliminates the rich information available in gradual density maps. Therefore, we additionally compared the gradual maps using cross-correlation (Pearson), which has been deemed one of the most suitable metrics for purposes similar to ours [66]. Pearson’s correlation coefficient treats two given density maps as variables and describes their linear correlation. We calculated the value for two density maps as proposed by Bylinskii et al. [66] by dividing the covariance matrix for both maps by the product of the covariance of each map itself.
3.6.3. Statistical Analyses
Our statistical analyses aimed to compare human–CNN similarity in attention maps between tasks and image types. To this end, we conducted F2 analyses of variance (ANOVAs) with the 60 images as degrees of freedom (20 per image type) instead of using participants as degrees of freedom (F1 ANOVA). This is because the definition of human attention maps made it necessary to sum all fixations and drawings over participants instead of using the areas attended by individual participants. An added benefit of these F2 ANOVAs is that we did not have to average across images but could consider the variance between individual images in our analyses. For ANOVA outcomes, we report the following values: (1) the F value, which corresponds to the ratio of variation between sample means and variation within the samples (i.e., factor variance divided by error variance), (2) the p value, which indicates whether a difference is statistically significant, with p values < 0.05 reflecting significance and (3) partial eta squared (ηp2), which is a measure of the effect size, calculated as the proportion of total variance that is explained by the factor or interaction of factors after excluding variance from other factors. All pairwise comparisons were performed with Bonferroni correction. If the sphericity assumption was violated, a Greenhouse–Geisser correction was applied and the degrees of freedom were adjusted accordingly.
To analyze human–CNN similarity, we performed a mixed-measures F2 ANOVA with the three-level within-images factor human–CNN comparison (spontaneous gaze vs. Grad-CAM, gaze-pointing vs. Grad-CAM, drawing vs. Grad-CAM) and the three-level between-images factor image type (objects, indoor scenes, landscapes). To better understand the results of this human–CNN comparison, we used the same statistical approach to compare the three types of human attention maps to each other. That is, we replaced the factor human–CNN comparison with the factor human–human comparison (spontaneous gaze vs. gaze-pointing, spontaneous gaze vs. drawing, gaze-pointing vs. drawing). Moreover, we compared the total sizes of the areas attended in the three human tasks (i.e., without reducing them to 5%) via a mixed-measures F2 ANOVA with the three-level within-images factor task (spontaneous gaze, gaze-pointing, drawing) and the three-level between-images factor image type (objects, indoor scenes, landscapes). Finally, we performed two control analyses: one that only used the first fixation in the two eye movement tasks and one that split the three-level factor image type into its six constituent image categories. However, for the sake of brevity, we will not report these analyses in detail but only consider their results in the Section 5.
4. Results
To support a better understanding of our results, we first report a number of qualitative observations. We then turn to the statistical analyses that compare the Dice score and cross-correlation of human and CNN maps between tasks and image types. After this, we explore potential reasons for these results by assessing how the human attention maps differed from each other. To this end, we first analyzed their Dice score and cross-correlation and then examined differences in the size of the total areas uncovered. All mean values and standard deviations for the human–CNN comparisons as well as the human–human comparisons of attention maps are provided in Table 1.
4.1. Qualitative Observations
When visually inspecting the human attention maps and their overlaps with Grad-CAM, a number of noteworthy differences became apparent. Examples for some of the points are provided in Figure 4. As the comparison between attention maps was highly dependent on image type, we will structure the following section accordingly.
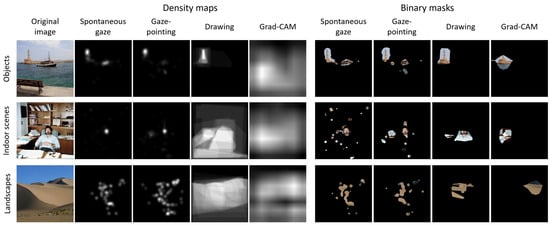
Figure 4.
Example image overlays with attention maps to illustrate our qualitative observations.
For objects, eye movements reflected several phenomena known from the scene viewing literature. For instance, fixations did not only target the category-defining object but also other salient objects (e.g., boats in lighthouse images). Occasionally, Grad-CAM fell victim to the same biases. This typically happened when the context was atypical (e.g., for a lighthouse in an urban area, Grad-CAM focused on a car) but not when it was typical (e.g., for lighthouses by the sea, Grad-CAM did not look at boats). Thus, the resulting low overlap often stemmed from problems in gaze, not Grad-CAM. Accordingly, Grad-CAM overlapped more strongly with drawings, which did not suffer from these biases. However, Grad-CAM also had a problem with object images. First, it tended to look at the lower part of the lighthouse or windmill. In contrast, human eye movements and drawings preferably targeted the upper, more diagnostic part. Second, Grad-CAM even missed the object entirely when the context was highly atypical (e.g., lighthouse in the snow). Finally, human drawings also showed a typical pattern for objects: they did not include much context but focused on the object, sometimes aiming to precisely draw its outlines (e.g., individual rotor leaves of windmills). Thus, participants mainly varied in how carefully they specified the object boundaries but largely agreed in selecting only the object.
For indoor scenes, we observed similar distraction in eye movements. For instance, fixations always landed on people when they were present in offices, while Grad-CAM only looked at a human face once. However, participants also included people in their drawings, suggesting that they actually considered them relevant for categorization. For drawings, participants generally used different strategies. Some selected an individual object (e.g., computer screen), some selected anchor objects (e.g., desk area) and some included almost the entire room. However, this also depended on the specific image category: including the entire scene was more common for offices than dining rooms, where people usually selected the table and the objects on it.
For landscapes, the similarity between eye movements and Grad-CAM was lowest. On the one hand, a few factors were conducive to similarity. For instance, both eye movements and Grad-CAM were sensitive to physically salient features (e.g., object boundaries, horizon), while rarely looking at noninformative areas (e.g., sand). Moreover, both tended to look at objects (e.g., agricultural machinery). On the other hand, the factors that reduced similarity played a larger role. For instance, fixations were biased toward the center even when it was noninformative, while Grad-CAM showed no signs of center bias. Moreover, Grad-CAM usually highlighted one area, while eye movements were widely dispersed across the scene (with the peaks of density maps appearing as blobs in the binary masks). For drawing, there seemed to be two major strategies, with some participants selecting most of the category-defining area (e.g., all desert sand) and some selecting an arbitrary part (e.g., a small patch of sand). However, many participants adopted strategies in between. Similar to indoor scenes, strategies differed between the two categories, with more variation for deserts than wheat fields.
Concerning the comparison between human tasks, we were quite surprised that the two types of eye movement maps rarely differed from each other, or only for individual images. For instance, when irrelevant objects were present, they had a stronger impact on spontaneous gaze, while gaze-pointing seemed to intentionally target nonsalient but category-defining areas. While the eye movement maps were highly similar to each other, both their shapes and dispersion were quite different from drawing but this difference seemed restricted to indoor scenes and landscapes.
4.2. Similarity between Human and CNN Attention Maps
4.2.1. Dice Score
For the Dice score, the 3 (human–CNN comparison: spontaneous gaze vs. Grad-CAM, gaze-pointing vs. Grad-CAM, drawing vs. Grad-CAM) × 3 (image type: objects, indoor scenes, landscapes) ANOVA revealed a main effect of human–CNN comparison, F(1.4,80.9) = 6.438, p = 0.006, ηp2 = 0.101, a main effect of image type, F(2,57) = 23.558, p < 0.001, ηp2 = 0.453 and an interaction between the two factors, F(4,114) = 10.484, p < 0.001, ηp2 = 0.269 (see Figure 5A, red bars). The main effect of human–CNN comparison indicated that the human attention maps that overlapped most with Grad-CAM were those elicited by drawing. That is, Grad-CAM had a higher overlap with drawing than with spontaneous gaze (0.30 vs. 0.24, respectively), p = 0.019, while comparing the overlap between Grad-CAM and drawing to that between Grad-CAM and gaze-pointing (0.26) just missed significance, p = 0.050. Conversely, the two types of eye movement maps did not differ in their overlap with Grad-CAM, p = 0.683. The main effect of the image type indicated that the overlap between human attention maps and Grad-CAM was highest for objects (0.43), followed by indoor scenes (0.26) and landscapes (0.11), all ps < 0.005. Finally, the interaction revealed that the differences between human–CNN comparisons strongly depended on image type. For objects, the overlap with Grad-CAM was most dependent on the human task. Here, Grad-CAM overlapped more with drawing (0.53) than with spontaneous gaze and gaze-pointing (0.40 and 0.37, respectively), both ps < 0.002. Conversely, the two eye movement tasks showed similar overlap with Grad-CAM, p = 0.179. For indoor scenes, spontaneous gaze overlapped least with Grad-CAM (0.20) and this overlap was lower than for gaze-pointing and drawing (0.28 and 0.31, respectively), both ps < 0.011. Finally, for landscapes, all three human tasks showed very little overlap with Grad-CAM (with 0.13, 0.13, and 0.06 for spontaneous gaze, gaze-pointing, and drawing, respectively) and no differences between them were found, all ps > 0.188.
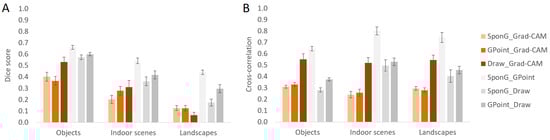
Figure 5.
Comparisons between attention maps depending on image type, for both human–CNN comparisons (red bars) and human–human comparisons (grey bars). (A) Dice score and (B) cross-correlation. SponG = spontaneous gaze, GPoint = gaze-pointing, Draw = drawing. Error bars represent standard errors of the mean.

Table 1.
Means and standard deviations (in parentheses) for all human–CNN comparisons and human–human comparisons, depending on task and image type.
Table 1.
Means and standard deviations (in parentheses) for all human–CNN comparisons and human–human comparisons, depending on task and image type.
| Dice Score | Cross-Correlation | ||||||
|---|---|---|---|---|---|---|---|
| Objects | Indoor Scenes | Landscapes | Objects | Indoor Scenes | Landscapes | ||
| Human–CNN | SponG_Grad-CAM | 0.40 (0.17) | 0.20 (0.16) | 0.13 (0.10) | 0.31 (0.06) | 0.24 (0.13) | 0.30 (0.07) |
| GPoint_Grad-CAM | 0.37 (0.17) | 0.28 (0.17) | 0.13 (0.17) | 0.33 (0.08) | 0.26 (0.14) | 0.28 (0.09) | |
| Draw_Grad-CAM | 0.53 (0.19) | 0.31 (0.27) | 0.06 (0.11) | 0.55 (0.21) | 0.52 (0.21) | 0.55 (0.19) | |
| Human–human | SponG_GPoint | 0.66 (0.08) | 0.54 (0.11) | 0.44 (0.09) | 0.64 (0.09) | 0.80 (0.16) | 0.74 (0.20) |
| SponG_Draw | 0.57 (0.09) | 0.36 (0.17) | 0.17 (0.14) | 0.28 (0.08) | 0.50 (0.22) | 0.40 (0.24) | |
| GPoint_Draw | 0.60 (0.07) | 0.42 (0.16) | 0.30 (0.16) | 0.38 (0.06) | 0.53 (0.15) | 0.46 (0.15) | |
SponG = spontaneous gaze, GPoint = gaze-pointing, Draw = drawing.
4.2.2. Cross-Correlation
For cross-correlations, the ANOVA revealed a main effect of human–CNN comparison, F(1.2,69.2) = 122.978, p < 0.001, ηp2 = 0.683 but no main effect of image type, F(2,57) = 1.235, p = 0.298, ηp2 = 0.042 and no interaction, F(4,114) = 439, p = 0.780, ηp2 = 0.015 (see Figure 5B, red bars). The main effect of human–CNN comparison indicated that Grad-CAM correlated higher with drawing (0.54) than with spontaneous gaze and gaze-pointing (0.28 and 0.29, respectively), both ps < 0.001, while the two types of eye movement maps did not differ in their correlation with Grad-CAM, p > 0.9. As indicated by the lack of an interaction, the same pattern was found for all three image types: higher correlations of Grad-CAM with drawing than with the two eye movement tasks, all ps < 0.001, and similar, low correlations of Grad-CAM with the eye movement tasks, all ps > 0.7.
4.3. Human Attention Maps
4.3.1. Dice Score
Before considering the statistical analysis, an inspection of Figure 5A reveals that the overlaps between human tasks (grey bars, M = 0.45) were consistently higher than the overlaps between humans and CNN (red bars, M = 0.27). This was the case even for landscapes, which had produced very low human–CNN overlap, whereas the two eye movement tasks still overlapped more with each other than Grad-CAM had overlapped with any eye movement task for any image type. The 3 (human–human comparison: spontaneous gaze vs. gaze-pointing, spontaneous gaze vs. drawing, gaze-pointing vs. drawing) × 3 (image type: objects, indoor scenes, landscapes) ANOVA yielded a main effect of human–human comparison, F(1.8,103.0) = 50.139, p < 0.001, ηp2 = 0.468, a main effect of image type, F(2,57) = 54.290, p < 0.001, ηp2 = 0.656 and an interaction, F(4,114) = 4.318, p = 0.004, ηp2 = 0.132. The main effect of human–human comparison indicated that all comparisons between human tasks yielded different degrees of overlap, all ps < 0.001. That is, the two eye movement tasks had the highest overlap (0.55), followed by gaze-pointing vs. drawing (0.44) and then spontaneous gaze vs. drawing (0.37). The main effect of image type indicated that the overlap between human attention maps was highest for objects (0.61), followed by indoor scenes (0.44) and landscapes (0.30), all ps < 0.005. Finally, the interaction indicated that the differences between human–human comparisons depended on image type. However, the direction of these dependencies was opposite to what we had observed for the human–CNN comparison: for objects, the overlap was least (instead of most) dependent on human tasks because all of them were highly similar. Accordingly, the only difference that just passed the significance threshold indicated that spontaneous gaze overlapped more with gaze-pointing (0.66) than with drawing (0.57), p = 0.034. No other differences were found, all ps > 0.2. For indoor scenes, the two eye movement tasks still had a high overlap with each other (0.54), while the overlap between drawing and either spontaneous gaze or gaze pointing (0.36 and 0.42, respectively) was considerably lower, both ps < 0.002. These two latter comparisons did not differ from each other, p = 0.100, indicating that drawing maps were generally quite different from eye movement maps for indoor scenes. Finally, for landscapes, all comparisons between human tasks were significant, all ps < 0.001, with the highest overlap between the two eye movement tasks (0.44), medium overlap between drawing and gaze-pointing (0.30) and very low overlap between drawing and spontaneous gaze (0.17).
4.3.2. Cross-Correlation
The ANOVA revealed a main effect of human–human comparison, F(1.6,90.7) = 227.835, p < 0.001, ηp2 = 0.800, a main effect of image type, F(2,57) = 7.632, p = 0.001, ηp2 = 0.211 but no interaction, F(4,114) = 0.760, p = 0.554, ηp2 = 0.026 (see Figure 5A, grey bars). The main effect of human–human comparison indicated that all comparisons between human tasks yielded different correlations, all ps < 0.001. While the two eye movement tasks had the highest overlap (0.73), the correlation between drawing and gaze-pointing (0.45) also was higher than that between drawing and spontaneous gaze (0.39). The main effect of image type indicated that correlations were lower for objects (0.43) than indoor scenes (0.61), p = 0.001, while landscapes (0.54) yielded correlations that were not significantly different from either of the two other image types, both ps > 0.084. The absence of an interaction indicated that a similar pattern of human–human comparisons was found for all image types, with the two eye movement tasks correlating higher with each other than with drawing, all ps < 0.001. Moreover, drawing showed slightly higher correlations with gaze-pointing than with spontaneous gaze for both objects and landscapes, both ps < 0.035, but not for indoor scenes, p = 0.431.
4.3.3. Size of Attended Areas
Did different tasks lead participants to select smaller or larger image areas and how strongly did this vary between image types and individual images? We compared the total attended areas on each image, summed over all participants (i.e., all areas that were ever selected by any participant). Examples of the smallest and largest attention maps are presented in Figure 6 and an overview of the respective means, standard deviations, minima and maxima is provided in Table 2.
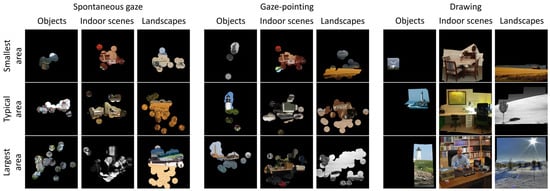
Figure 6.
Area sizes and their variability. The rows represent the smallest (first row) and largest (third row) area for each combination of task and image type, a typical area (second row) represents the area size closest to the mean of the respective combination.
Table 2.
Area sizes as percentage of the total image area, depending on task and image type.
The 3 (task: spontaneous gaze, gaze-pointing, drawing) × 3 (image type: objects, indoor scenes, landscapes) revealed a main effect of task, F(1.1,62.8) = 272.536, p < 0.001, ηp2 = 0.827, a main effect of image type, F(2,57) = 127.075, p < 0.001, ηp2 = 0.817 and an interaction, F(4,114) = 58.741, p < 0.001, ηp2 = 0.673 (see Table 2). The main effect of task indicated that, in total, larger areas were selected via drawing (49.5%) than either spontaneous gaze or gaze-pointing (17.4 and 18.7%, respectively), both ps < 0.001, while the two eye movement tasks did not differ significantly, p = 0.066. The main effect of image type indicated that the areas for objects (11.5%) were smaller than for indoor scenes and landscapes (37.7 and 36.4%), both ps < 0.001, while the two scene-centric image types did not differ, p > 0.9. Finally, the interaction indicated that the task-dependence of area sizes strongly varied with image type. For objects, spontaneous gaze, gaze-pointing and drawing did not differ (11.0, 9.1 and 14.3%, respectively), all ps > 0.190. For indoor scenes, much larger areas were selected via drawing (73.7%) than either via spontaneous gaze or gaze-pointing (18.5 and 20.9%, respectively), both ps < 0.001, while the two eye movement tasks did not differ significantly, p = 0.069. For landscapes, the areas again were much larger for drawing (60.5%) than the two eye movement tasks, p < 0.001, but this time also larger for gaze-pointing (26.2%) than spontaneous gaze (22.6%), p = 0.002.
5. Discussion
When classifying images, humans and CNN do not always attend to the same areas. But how does the similarity between their attention maps depend on factors that shape human attention, such as the intentionality of human tasks, the classification requirements of images and the interaction of tasks and images? To answer these questions, we had participants classify three types of images that reflected important determinants of human scene viewing: classification either relied on diagnostic objects, object-to-object relations or global scene properties (i.e., objects, indoor scenes and landscapes, respectively). We either tracked participants’ eye movements (i.e., spontaneous gaze, gaze-pointing) or their manual selections of relevant image areas (i.e., drawing) and compared the resulting attention maps to those generated by a common XAI method (i.e., Grad-CAM). Similarity was quantified with two metrics (i.e., Dice score, cross-correlation). These metrics produced consistent results regarding the influence of tasks but diverging results regarding the interaction with image type (which was present for Dice scores but absent for cross-correlations). In the following discussion, we will first focus on the Dice score results, which specifically compare the areas that received most attention, and then discuss differences between the two metrics below.
5.1. Overview of Results
Human attention maps were much less similar to CNN attention maps than they were between different human tasks. This fits with the widely reported finding that the similarity between human and CNN attention maps is quite low [10,11,48,49,50]. It also fits with a specific finding that human–human similarity is higher than human–CNN similarity [47]. Thus, in general, our results are in line with previous research. Moreover, human–CNN similarity depended on both human-centered factors investigated in the present study. Concerning the task factor, attention maps derived from drawing were more similar to Grad-CAM than those derived from eye movements, while the specific eye movement task had little impact. Concerning image type, human–CNN similarity in the Dice scores was highest for objects, medium for indoor scenes and low for landscapes. These image-dependent differences match previous findings, namely that human–CNN similarity was higher for abnormal X-rays with a unique relevant area [53] and for animate objects with faces catching human attention [10]. Taken together, the findings indicate that similarity increases when relevant areas are nonambiguous and spatially restricted.
Our most interesting finding concerns the interaction of both factors: image type reversed the direction of task effects. For objects, drawing was much more similar to Grad-CAM than the two eye movement tasks, while for landscapes, drawing was descriptively least similar to Grad-CAM, although the task differences were not significant here. Thus, when human attention maps are generated manually, their similarity to CNN is modulated by the images to be classified, at least when considering the main focus of attention (the image-dependence disappeared for cross-correlations). This image-dependence might lead to the conclusion that manual selection is only suitable when there is an obvious, correct solution (i.e., specific object) but not when selection is up to human preferences. It needs to be noted, though, that the suitability of an elicitation task cannot be inferred from high similarity per se. This would be circular reasoning when the aim is to test similarity rather than generate it. However, suitability can be inferred from the variability and thus arbitrariness of attention maps, which also was much higher for drawing than eye movements for indoor scenes and landscapes. We will return to the practical implications below.
5.2. Comparison of Manual Selection and Eye Movements
Overall, manually generated attention maps were most similar to CNN, much more so than eye movements. Importantly, this cannot be ascribed to a larger size of the drawing maps because for the Dice score analysis, all maps were reduced to 5% of the image area. In this section, we will discuss three potential explanations: the role of context, the specific method of manual selection and the information contents reflected in different types of attention maps.
First, the role of context was highlighted in a previous study that seems to be at odds with our findings. Zhang et al. [9] had attributed the dissimilarity between their manually generated attention maps and CNN to differences in considering relevant scene context. Such context was used by their CNN but neglected by humans. Based on these findings, we had hypothesized eye movements to produce higher human–CNN similarity (at least for gaze-pointing) because eye movements are guided by scene context [20,21,22]. However, this hypothesis was not supported by our data and, at least for objects, the opposite was found. To account for this discrepancy, it should be noted that coarse representations of scene gist can be established without eye movements [12] and even the earliest eye movements already target task-relevant areas [19]. Thus, our prediction might have been somewhat naïve: just because scene context guides eye movements to relevant areas, this does not necessarily mean that people look at this context.
A second reason might be our specific method of manual selection. Participants could freely select image areas by drawing polygons around them, while Zhang et al. [9] had participants order small, predefined image segments by relevance. In consequence, our participants included considerable amounts of context in their drawings. This is also reflected by the large size of manual selections when considering their total area. However, we also observed considerable variation and thus arbitrariness in individual participants’ drawings for indoor scenes and landscapes (see Figure 4, fourth column). This finding aligns with previous research [47,58], suggesting that a high variance in manual selections is not unusual.
A third reason for the higher similarity between drawings and Grad-CAM could be that different types of attention maps provide fundamentally different information. One might argue that the higher human–CNN similarity for drawings is an obvious result because eye movements reflect the path to a classification decision while drawing reflects a high-level end result—similar to Grad-CAM, which relies on the last convolutional layer. In line with this argument, neither drawing nor Grad-CAM were prone to task-irrelevant biases (e.g., central fixation bias, attentional capture by salient distractors). However, given that even the earliest eye movements are highly task-specific [19], our results did not change in a control analysis using attention maps from only the first fixation. Still, our attention maps, aggregated across all participants, reveal that eye movements were more dispersed than drawings (see Figure 4, sixth to eighth column). Thus, drawing might be a closer match to XAI methods, which rely on high-level information from the last convolutional layer. This would make it even more surprising why eye movements are commonly considered the gold standard for comparing CNN to human attention.
5.3. Comparison of the Two Eye Movement Tasks
Why were the two eye movement tasks so similar to each other? A noteworthy finding was that they produced highly similar attention maps and thus overlapped with Grad-CAM to a similar extent. Only for indoor scenes, gaze-pointing was more similar to Grad-CAM than spontaneous gaze, and even this was only the case for the Dice scores. Perhaps participants instructed to look at relevant areas might intentionally fixate several objects when categorization depends on object arrangements, even though a single diagnostic object would be sufficient [15]. Moreover, gaze-pointing might lead them to intentionally fixate more diagnostic but less salient objects (e.g., not only fixating the person in an office but also pointing out a printer). In any case, these differences were minor and thus it seems more important to explain the high similarity between the two eye movement tasks. Two potential explanations concern the similarity of task goals and systematic tendencies in scene viewing.
The first explanation focuses on the similarity of task goals. Spontaneous gaze during categorization is likely to target the same category-defining areas that participants would also point out intentionally because the ultimate categorization requirement remains the same. This could also explain why our results diverged from previous studies on eye movements during free viewing. Such eye movements were more dispersed than when pointing with gaze [60] or when explaining the suitability of category labels [51]. However, free viewing is much less restrictive than categorization. Participants can inspect whatever image areas may seem interesting, whereas in the present study, they still had to select the correct response and thus focus on response-relevant areas.
Additionally, the similarity between our two eye movement tasks might result from systematic tendencies in scene viewing. For one, both were affected by task-irrelevant biases. However, a high similarity between them was also evident for landscapes. Given that landscapes encourage exploratory eye movements [25], we observed a high dispersion of fixations. Interestingly, even these small dispersed areas often coincided between the two eye movement tasks, highlighting the prominent role of scene guidance [20,21,22]. This has practical implications when choosing a task to elicit attention maps. For images without clearly identifiable relevant areas, eye tracking might be a better choice than manual selection, as the selected areas are less arbitrary and thus more likely to produce consistent attention maps. The specific eye movement task seems less relevant. Our results suggest that researchers can simply use spontaneous gaze during categorization as the outcomes hardly differ from those obtained with more gaze-based intentional selection.
5.4. Differences between Similarity Metrics
Why did the two similarity metrics produce different outcomes? When comparing the results obtained with the Dice scores and cross-correlations, the overall effects of task were consistent, whereas their dependence on image type was strikingly different. Only for the Dice score did task effects on human–CNN similarity vary with image type: Grad-CAM was more similar to drawing than to the eye movement tasks for objects but these task differences were largely diminished for indoor scenes and completely disappeared for landscapes. In contrast, when using cross-correlations, Grad-CAM was more similar to drawing than to eye movements regardless of image type.
How can this divergence between the two metrics be explained? At first glance, one might assume that the cross-correlation results are an artefact of attention breadth. In contrast to the Dice scores, cross-correlations do not control for task differences in area size. The areas were large for Grad-CAM and drawing but small for the eye movement tasks. Specifically, the total eye movement areas never exceeded 37% even for indoor scenes and landscapes (see maximum values in Table 2). This means that the majority of each image remained completely unattended (see black parts of the density maps in Figure 4). Conversely, in the drawing task, such unattended areas only amounted to 3 and 6% for indoor scenes and landscapes, respectively. This makes drawing more similar to Grad-CAM, which also assigns at least some relevance to all image areas. This similarity in the mere coverage of image areas would also increase cross-correlations in a nonspecific manner. Thus, the explanation would be that cross-correlations increase with a broad focus of attention (or lack of specificity) and therefore remain high for drawing, while the eye movement tasks produced more specific attention maps (cf. [8]) that necessarily were less correlated with the nonspecific Grad-CAM. In the extreme case, our cross-correlation results would be a mere artefact of (non)specificity.
However, this explanation is refuted by another observation: the cross-correlations between our three human tasks. While the total area sizes became more different between drawing and eye movements for indoor scenes and landscapes (as compared to objects), the cross-correlations between them increased rather than decreased. Thus, differences in attention breadth do not automatically reduce cross-correlations.
Therefore, instead of arguing which metric is more valid, we should consider that they answer different questions. On the one hand, the Dice scores can be used to compare which areas humans and CNN attend to most. In this case, image type has a major impact on the results. On the other hand, cross-correlations can be used to compare how humans and CNN generally deploy their attention across the entire image. In this case, image type does not seem to matter. That said, an advantage of cross-correlations is that they retain more variance. Thus, they are able to detect nuances instead of forcing the selection of specific areas even when the actual attention is widely spread for some image types.
5.5. Particularities of Task Implementation
When discussing task influences on human–CNN similarity, we need to consider a number of problems with our tasks. A first problem is that they were quite arbitrary in some implementation details that are likely to affect the results. For instance, if we had used fewer or more categories, or categories that were more or less similar, this might have changed which areas participants attended to. If participants had needed to choose between only two categories, they would probably have made very few fixations because response selection would have been much easier. Conversely, if they had needed to choose between 20 or 200 categories, our procedure would not have been feasible at all because participants would have been unable to memorize the key mapping. Thus, our tasks do not easily scale to more complex categorization demands. Some of these implementation issues could be solved by minor changes to the procedure, such as performing verbal instead of manual labelling (e.g., [56]) or presenting a category label beforehand and then having participants indicate whether it matches the image or not (e.g., [67,68]).
The available category alternatives can also affect eye movements in other ways. Given the obvious differences between our image types, it presumably was sufficient to scan the image superficially: even just looking at a person in an office will tell you that this is not a desert or lighthouse and probably also not a dining room. Conversely, if there had been several similar categories (e.g., office, home office, reception desk, computer lab, computer store), participants would have been forced to fixate the most informative, discriminative areas. A similar point has been made for human–CNN comparisons that relied on fine-grained classification [8] but, in these images, only a singular feature differentiated between the categories. Thus, an interesting question for future research is how humans and CNN differ in discriminating complex scenes that consist of similar objects. It is questionable, however, whether this can be tested with spatial representations like attention maps because the differences between categories may depend on the relations between objects rather than their mere presence.
Another important task factor is the time available for inspecting the images. We imposed no time constraints, just like most previous studies on human–CNN similarity [48,50,51,53,54,57]. However, this created a large variance in fixation counts as viewing times ranged from less than 1000 ms up to our data inclusion threshold of around 7000 ms. To test how time constraints affected our results, we repeated our analyses with attention maps that only included the first fixation. The impacts on the results were negligible. Overall, overlaps with Grad-CAM were almost identical between maps derived from all fixations versus only the first fixation (spontaneous gaze: 0.24 vs. 0.26, gaze-pointing: 0.26 vs. 0.25). Also, in the interaction with image type, we only observed minor changes. Thus, future studies could constrain viewing time for efficiency purposes.
5.6. Particularities of Images, Image Categories and Image Types
Our image selection was intended to retain the variability of real-world scenes rather than choosing a highly homogenous set of prototypical exemplars. Obviously, this increased the variance in our results but this increase was intended. However, there also were nonintended and yet systematic sources of variance. Recall that each image type consisted of two categories selected for their similarity. While analyzing our data, we noticed that these categories were not always as similar as we had intended them to be. This was most noticeable in the case of indoor scenes: for dining rooms, the results matched those for objects (as attention was focused on the table), while for offices, the results matched those for landscapes (as attention was widely distributed across the room). Such within-image-type differences were also corroborated by additional statistical analyses.
These observations imply that future studies should go beyond a simple conceptualization of image types based on their superordinate category (e.g., indoor scene). But how to select theoretically interesting and practically relevant image types? First, this selection could rely on computations of purely physical image features such as a scene’s distribution of spatial frequencies [13] or its complexity and clutter [25]. Alternatively, selections could rely on human ratings, for instance of global properties [14], object diagnosticity [15] or scene function [69]. Finally, scenes could be selected based on factors known to affect classification difficulty for CNN: complex and varied scenes with different scales, multiple target objects, varied perspectives, partial occlusions and atypical or variable lighting conditions (cf. [41,58]). Future research should investigate which conceptualizations of image types exert the greatest influence on human–CNN similarity.
5.7. Limitations of the Present Study
Each methodological choice comes with its inherent limitations. Beyond the limitations of our tasks and image types (see previous sections), we also need to consider limitations of our stimulus material, the experimental design, the data analysis procedures as well as conceptual limitations.
A first limitation concerns the generalizability of the present findings given our selection of stimuli. We only used six categories and a small set of similar image exemplars within each category. For instance, our objects were long vertical buildings, usually embedded in a natural scene. Given this specificity, can our results be generalized to other objects in other contexts? Actually, our reasoning has never been about all objects merely by virtue of being an object. A close-up view of a flower petal spanning the entire image would also be considered an object. However, this image would actually be more similar to our landscapes in terms of scene structure and thus the resulting attention maps should also be quite dispersed. Therefore, our three image types should not be taken too literally. They should be interpreted in terms of the purpose they fulfil: differentiating between images that can be categorized by means of singular diagnostic objects, object-to-object relations or global scene properties. That is, our conceptualization of image types is based on categorization requirements. Within these requirement-based image types, future studies should investigate whether our results generalize to a larger set of categories and exemplars and critically test the boundaries of such generalization.
A second limitation concerns the effects of our fixed task order, which induced systematic dependencies between tasks. We held task order constant because we wanted to keep spontaneous gaze unconditional on viewing history and minimize the need to scan the image during gaze-pointing. Still, repeated viewing might account for some of our results. For instance, the two eye movement tasks produced highly similar attention maps. Did participants simply revisit the areas they had previously identified? Indeed, studies that repeatedly exposed participants to the same scenes reported similarities in their scan-paths [70,71]. However, similarity in these studies was quite low, although it reliably differed from chance. Other studies found that when people viewed the same scenes repeatedly, they made progressively fewer and longer fixations, shorter saccades and spent less time on meaningful areas [72]. This suggests that our methodological choice to always place gaze-pointing second might confound task effects with preview and practice effects. We are more optimistic that the fixed task order had no relevant impact on drawing. Manual selection is a highly intentional task and participants could take as much time as they wanted. Presumably, it does not matter whether familiarization with an image is spread across three instances of viewing it versus one instance of viewing it longer. Still, this assumption remains untested. Thus, future studies could explicitly control for task order effects, either by varying it systematically or by manipulating tasks between participants.
Third, our metrics used for comparing attention maps deserve a critical evaluation. Dice scores and cross-correlations have complementary benefits and costs, as discussed above. However, there are problems that neither of them can fix. For instance, they do not control for central fixation bias, do not take the spatial distance between selected areas into account and do not differentiate between false positives and false negatives. These issues can be addressed by other metrics [66]. For instance, the Kullback–Leibler Divergence and Similarity penalize false negatives (misses) more than false positives (misdetections). Thus, human–CNN similarity should decrease if the XAI method fails to highlight information that humans considered to be highly relevant. Other metrics specifically deal with central fixation bias, either by penalizing it (Shuffled AUC) or by quantifying the similarity beyond central fixation bias (Information Gain). Thus, human–CNN similarity should decrease if it mainly stems from biases in human scene viewing. Finally, the Earth Mover’s Distance considers how far the areas selected by humans and XAI are spatially removed from each other, allowing for a more fine-grained comparison of the attended areas. Given these complementary capabilities of different metrics, systematically comparing their results could enhance our understanding of the specific factors driving the similarity or dissimilarity between humans and CNN.
Finally, an important conceptual limitation lies in the very nature of attention maps as a purely spatial method. At best, attention maps can tell us where humans or CNN attend, but not how they use the information presented in this area (cf. [45]). Thus, despite a high overlap in the attended areas, humans and CNN might attend to completely different features. For instance, CNN rely on object texture more strongly than on shape, while humans do the reverse [73,74]. Still, the attention maps of humans and CNN would highlight the same object. One way to consider this when comparing humans and CNN is to generate different attention maps for different CNN layers that process different types of information [10,49]. For humans, an analogous indicator of different information processing activities is fixation duration, with longer durations reflecting a higher processing depth [75]. Thus, differentiating between levels of processing both for CNN and humans seems desirable and technically feasible.
5.8. Implications for Practical Application and Perpectives for Future Research
The present findings have several implications for practical application in the field of deep learning. First, a specific practical implication is that our findings may assist researchers in choosing suitable tasks for their comparisons between the attention maps of humans and CNN. In this regard, our results suggest that the choice of an attention elicitation task should depend on contextual constraints. When relevant image areas can be located unambiguously (e.g., for images that focus on particular objects), manual selection is an easy way of producing consistent maps that are free from task-irrelevant viewing biases. However, it is less suitable when the relevance of image areas is up to human preferences and when they might not even be aware of their information needs (e.g., for images that focus on large-scale scenes). In this case, eye tracking may be a better methodological choice as scene guidance makes the resulting maps less arbitrary.
When taking a broader perspective on practical application, a second implication of our findings becomes evident: different human tasks may have different effects when being used to enhance CNN classifications. Several studies suggest that CNN performance can be improved by harmonizing them with human attention maps. This has been shown for attention maps generated from eye movements [8,51] and manual selections [11,76]. However, to the best of our knowledge, no previous study has compared both approaches. The present findings suggest that the choice of tasks to generate human attention maps may lead to systematic differences, which may further depend on image characteristics. Thus, future studies should investigate whether and under what conditions it is better to use eye movements or manual selections to enhance CNN performance.
This question extends to other deep learning architectures besides CNN. For instance, Transformer-based architectures follow a different learning approach, which also affects their similarity to human attention [11,55]. Accordingly, Morrison et al. [55] found that the similarity to human attention was lower for a Vison Transformer (CaiT) than for two CNN-based architectures and a Swin Transformer (but note that these results were strongly affected by the XAI method used). Moreover, Fel et al. [11] reported that a Vision Transformer learned a fundamentally different strategy than humans but at the same time experienced the greatest benefit from being harmonized with human attention maps. An important question for future work is whether these benefits depend on the tasks and images used to elicit human attention maps.
From a psychological perspective, future research should strive for a better understanding of how humans select the areas they consider relevant. For instance, how do attention maps depend on individual differences? This is especially relevant for applications where CNN should not be similar to just any human but to humans with particular characteristics (e.g., domain experts). After all, high similarity might also mean that both humans and CNN are mistaken about the actual relevance of image areas (cf. [45]). To avoid the pitfalls of inferring the suitability of CNN attention maps from their similarity to humans, external criteria are needed, such as whether they are interpretable and support human task performance [68,77,78].
5.9. Conclusions
The present study investigated the role of human factors in determining the similarity between human and CNN attention maps. We found this similarity to depend on the task used to elicit human attention maps, the images to be classified as well as the interaction between tasks and images. In short, manually generated attention maps were most similar to CNN attention, particularly when classification relied on singular objects. For large-scale scenes, this manual similarity advantage vanished with regard to the areas receiving most attention but remained intact for the overall distribution of attention. These findings on the task- and image-dependence of human–CNN similarity may guide future comparisons of attention maps. Moreover, they may inform future research on how to apply human attention to enhance artificial image classification.
Author Contributions
Conceptualization, R.M. and S.S.; methodology, R.M., J.U., M.D., S.W., C.K. and S.S.; software, M.D. and J.U.; validation, R.M. and S.S.; formal analysis, R.M. and J.U.; investigation, M.D.; resources, R.M. and S.S.; data curation, R.M. and J.U.; writing—original draft preparation, R.M.; writing—review and editing, C.K., J.U. and S.S.; visualization, R.M. und J.U.; supervision, R.M., C.K. and S.S.; project administration, R.M.; funding acquisition, R.M. and S.S. All authors have read and agreed to the published version of the manuscript.
Funding
This research was funded by the German Research Foundation (DFG), grant numbers PA 1232/15-1 and TE 257/37-1.
Institutional Review Board Statement
The study was conducted in accordance with the Declaration of Helsinki and approved by the Institutional Review Board (or Ethics Committee) of TUD Dresden University of Technology (protocol code: SR-EK-400092020, date of approval: 22 October 2020).
Informed Consent Statement
Informed consent was obtained from all subjects involved in the study.
Data Availability Statement
All images, human participant data and source code (CNN, XAI, attention maps, comparison metrics) are made available via the Open Science Framework (https://osf.io/k9t5f/). Within this repository, the minimal dataset is to be found here: https://osf.io/rtf3u. The source code is additionally available on GitHub (https://github.com/cknoll/Humans-vs.-CNN-Effects-of-task-and-image-type).
Acknowledgments
We want to thank Marius Thoß for support in generating the stimuli and Christopher Lindenberg for support in programming the CNN. Moreover, we gratefully acknowledge the computing resources provided by the Center for Information Services and High Performance Computing (ZIH) at TUD Dresden University of Technology.
Conflicts of Interest
The authors declare no conflicts of interest.
References
- Buetti-Dinh, A.; Galli, V.; Bellenberg, S.; Ilie, O.; Herold, M.; Christel, S.; Boretska, M.; Pivkin, I.V.; Wilmes, P.; Sand, W.; et al. Deep neural networks outperform human expert’s capacity in characterizing bioleaching bacterial biofilm composition. Biotechnol. Rep. 2019, 22, e00321. [Google Scholar] [CrossRef] [PubMed]
- Kshatri, S.S.; Singh, D. Convolutional Neural Network in medical image analysis: A review. Arch. Comput. Methods Eng. 2023, 30, 2793–2810. [Google Scholar] [CrossRef]
- Munsif, M.; Ullah, M.; Ahmad, B.; Sajjad, M.; Cheikh, F.A. Monitoring neurological disorder patients via deep learning based facial expressions analysis. In IFIP International Conference on Artificial Intelligence Applications and Innovations; Springer International Publishing: Cham, Switzerland, 2022. [Google Scholar]
- Xie, S.; Girshick, R.; Dollár, P.; Tu, Z.; He, K. Aggregated residual transformations for deep neural networks. In Proceedings of the IEEE Conference on Computer Vision and Pattern Recognition, Honolulu, HI, USA, 21–26 July 2017; IEEE: Piscataway, NJ, USA, 2017. [Google Scholar]
- Christoffersen, K.; Woods, D.D. How to make automated systems team players. In Advances in Human Performance and Cognitive Engineering Research; Salas, E., Ed.; Emerald Group Publishing Limited: Bingley, UK, 2002; pp. 1–12. [Google Scholar]
- Klein, G.A.; Woods, D.D.; Bradshaw, J.M.; Hoffman, R.R.; Feltovich, P.J. Ten challenges for making automation a “team player” in joint human-agent activity. IEEE Intell. Syst. 2004, 19, 91–95. [Google Scholar] [CrossRef]
- Nourani, M.; Kabir, S.; Mohseni, S.; Ragan, E.D. The effects of meaningful and meaningless explanations on trust and perceived system accuracy in intelligent systems. In Proceedings of the Seventh AAAI Conference on Human Computation and Crowdsourcing, Stevenson, WA, USA, 28–30 October 2019; Association for the Advancement of Artificial Intelligence (AAAI): Washington, DC, USA, 2019. [Google Scholar]
- Rong, Y.; Xu, W.; Akata, Z.; Kasneci, E. Human attention in fine-grained classification. In Proceedings of the 32nd British Machine Vision Conference, Online, 22–25 November 2021. [Google Scholar]
- Zhang, Z.; Singh, J.; Gadiraju, U.; Anand, A. Dissonance between human and machine understanding. In Proceedings of the ACM on Human Computer Interaction; Association for Computing Machinery: New York, NY, USA, 2019. [Google Scholar]
- van Dyck, L.E.; Kwitt, R.; Denzler, S.J.; Gruber, W.R. Comparing object recognition in humans and Deep Convolutional Neural Networks—An eye tracking study. Front. Neurosci. 2021, 15, 750639. [Google Scholar] [CrossRef] [PubMed]
- Fel, T.; Rodriguez Rodriguez, I.F.; Linsley, D.; Serre, T. Harmonizing the object recognition strategies of deep neural networks with humans. In Proceedings of the 36th Conference on Neural Information Processing Systems, New Orleans, LA, USA, 28 November–9 December 2022. [Google Scholar]
- Oliva, A. Gist of the scene. In Neurobiology of Attention; Itti, L., Rees, G., Tsotos, J.K., Eds.; Elsevier Academic Press: San Diego, CA, USA, 2005; pp. 251–256. [Google Scholar]
- Torralba, A.; Oliva, A. Statistics of natural image categories. Netw. Comput. Neural Syst. 2003, 14, 391–412. [Google Scholar] [CrossRef]
- Greene, M.R.; Oliva, A. Recognition of natural scenes from global properties: Seeing the forest without representing the trees. Cogn. Psychol. 2009, 58, 137–176. [Google Scholar] [CrossRef] [PubMed]
- Wiesmann, S.L.; Võ, M.L.-H. Disentangling diagnostic object properties for human scene categorization. Sci. Rep. 2023, 13, 5912. [Google Scholar] [CrossRef] [PubMed]
- Holmqvist, K.; Nyström, M.; Andersson, R.; Dewhurst, R.; Jarodzka, H.; van de Weijer, J. Eye Tracking: A Comprehensive Guide to Methods and Measures; Oxford University Press: Oxford, UK, 2011. [Google Scholar]
- Findlay, J.M.; Gilchrist, I.D. Active Vision: The Psychology of Looking and Seeing; Oxford University Press: Oxford, UK, 2003. [Google Scholar]
- Henderson, J.M. Human gaze control during real-world scene perception. Trends Cogn. Sci. 2003, 7, 498–504. [Google Scholar] [CrossRef]
- Henderson, J.M.; Malcolm, G.L.; Schandl, C. Searching in the dark: Cognitive relevance drives attention in real-world scenes. Psychon. Bull. Rev. 2009, 16, 850–856. [Google Scholar] [CrossRef]
- Henderson, J.M. Gaze control as prediction. Trends Cogn. Sci. 2017, 21, 15–23. [Google Scholar] [CrossRef]
- Torralba, A.; Oliva, A.; Castelhano, M.S.; Henderson, J.M. Contextual guidance of eye movements and attention in real-world scenes: The role of global features in object search. Psychol. Rev. 2006, 113, 766–786. [Google Scholar] [CrossRef] [PubMed]
- Võ, M.L.-H.; Boettcher, S.E.; Draschkow, D. Reading scenes: How scene grammar guides attention and aids perception in real-world environments. Curr. Opin. Psychol. 2019, 29, 205–210. [Google Scholar] [CrossRef] [PubMed]
- Boettcher, S.E.; Draschkow, D.; Dienhart, E.; Võ, M.L.-H. Anchoring visual search in scenes: Assessing the role of anchor objects on eye movements during visual search. J. Vis. 2018, 18, 11. [Google Scholar] [CrossRef] [PubMed]
- Hwang, A.D.; Wang, H.-C.; Pomplun, M. Semantic guidance of eye movements in real-world scenes. Vis. Res. 2011, 51, 1192–1205. [Google Scholar] [CrossRef]
- Wu, D.W.-L.; Anderson, N.C.; Bischof, W.F.; Kingstone, A. Temporal dynamics of eye movements are related to differences in scene complexity and clutter. J. Vis. 2014, 14, 8. [Google Scholar] [CrossRef]
- Itti, L.; Koch, C. A saliency-based search mechanism for overt and covert shifts of visual attention. Vis. Res. 2000, 40, 1489–1506. [Google Scholar] [CrossRef]
- Henderson, J.M.; Hayes, T.R.; Peacock, C.E.; Rehrig, G. Meaning and attentional guidance in scenes: A review of the meaning map approach. Vision 2019, 3, 19. [Google Scholar] [CrossRef]
- Pedziwiatr, M.A.; Kümmerer, M.; Wallis, T.S.A.; Bethge, M.; Teufel, C. Semantic object-scene inconsistencies affect eye movements, but not in the way predicted by contextualized meaning maps. J. Vis. 2022, 22, 9. [Google Scholar] [CrossRef]
- Rösler, L.; End, A.; Gamer, M. Orienting towards social features in naturalistic scenes is reflexive. PLoS ONE 2017, 12, e0182037. [Google Scholar] [CrossRef] [PubMed]
- Tatler, B.W. The central fixation bias in scene viewing: Selecting an optimal viewing position independently of motor biases and image feature distributions. J. Vis. 2007, 7, 4. [Google Scholar] [CrossRef] [PubMed]
- Liu, Z.; Mao, H.; Wu, C.Y.; Feichtenhofer, C.; Darrell, T.; Xie, S. A ConvNet for the 2020s. In Proceedings of the IEEE/CVF Conference on Computer Vision and Pattern Recognition, New Orleans, LA, USA, 18–24 June 2022; IEEE: Piscataway, NJ, USA, 2022. [Google Scholar]
- Cai, Y.; Zhou, Y.; Han, Q.; Sun, J.; Kong, X.; Li, J.; Zhang, X. Reversible column networks. In Proceedings of the International Conference on Learning Representations, Kigali, Rwanda, 1–5 May 2023. [Google Scholar]
- Dosovitskiy, A.; Beyer, L.; Kolesnikov, A.; Weissenborn, D.; Zhai, X.; Unterthiner, T.; Dehghani, M.; Minderer, M.; Heigold, G.; Gelly, S.; et al. An image is worth 16 × 16 words: Transformers for image recognition at scale. In Proceedings of the Ninth International Conference on Learning Representations, Virtual, 3–7 May 2021. [Google Scholar]
- Liu, Z.; Lin, Y.; Cao, Y.; Hu, H.; Wei, Y.; Zhang, Z.; Lin, S.; Guo, B. Swin transformer: Hierarchical vision transformer using shifted windows. In Proceedings of the IEEE/CVF International Conference on Computer Vision, Montreal, BC, Canada, 11–17 October 2021; IEEE: Piscataway, NJ, USA, 2021. [Google Scholar]
- He, K.; Zhang, X.; Ren, S.; Sun, J. Deep residual learning for image recognition. In Proceedings of the IEEE Conference on Computer Vision and Pattern Recognition, Las Vegas, NV, USA, 27–30 June 2016. [Google Scholar]
- Bau, D.; Zhou, B.; Khosla, A.; Oliva, A.; Torralba, A. Network dissection: Quantifying interpretability of deep visual representations. In Proceedings of the IEEE Conference on Computer Vision and Pattern Recognition, Honolulu, HI, USA, 21–26 July 2017. [Google Scholar]
- Singer, J.J.D.; Karapetian, A.; Hebart, M.N.; Cichy, R.M. The link between visual representations and behavior in human scene perception. Biorxiv Prepr. 2023. [Google Scholar] [CrossRef]
- Selvaraju, R.R.; Cogswell, M.; Das, A.; Vedantam, R.; Parikh, D.; Batra, D. Grad-CAM: Visual explanations from deep networks via gradient-based localization. In Proceedings of the IEEE International Conference on Computer Vision, Venice, Italy, 22–29 October 2017; IEEE: Piscataway, NJ, USA, 2017. [Google Scholar]
- Firestone, C. Performance vs. competence in human–machine comparisons. Proc. Natl. Acad. Sci. USA 2020, 117, 26562–26571. [Google Scholar] [CrossRef]
- Geirhos, R.; Jacobsen, J.H.; Michaelis, C.; Zemel, R.; Brendel, W.; Bethge, M.; Wichmann, F.A. Shortcut learning in deep neural networks. Nat. Mach. Intell. 2020, 2, 665–673. [Google Scholar] [CrossRef]
- Beery, S.; van Horn, G.; Perona, P. Recognition in terra incognita. In Proceedings of the European Conference on Computer Vision, Munich, Germany, 8–14 September 2018; pp. 456–473. [Google Scholar]
- Quattoni, A.; Torralba, A. Recognizing indoor scenes. In Proceedings of the 2009 IEEE Conference on Computer Vision and Pattern Recognition, Miami, FL, USA, 20–25 June 2009; IEEE: Piscataway, NJ, USA, 2009. [Google Scholar]
- Eckstein, M.P.; Koehler, K.; Welbourne, L.E.; Akbas, E. Humans, but not deep neural networks, often miss giant targets in scenes. Curr. Biol. 2017, 27, 2827–2832. [Google Scholar] [CrossRef] [PubMed]
- Meske, C.; Bunde, E. Transparency and trust in human-AI-interaction: The role of model-agnostic explanations in computer vision-based decision support. In Artificial Intelligence in HCI: First International Conference, Copenhagen, Denmark, 19–24 2020; Springer International Publishing: Berlin/Heidelberg, Germany, 2020. [Google Scholar]
- Singh, N.; Lee, K.; Coz, D.; Angermueller, C.; Huang, S.; Loh, A.; Liu, Y. Agreement between saliency maps and human-labeled regions of interest: Applications to skin disease classification. In Proceedings of the IEEE/CVF Conference on Computer Vision and Pattern Recognition Workshops, Virtual Conference, 14–19 June 2020; IEEE Computer Society: Piscataway, NJ, USA, 2020. [Google Scholar]
- Jacobsen, J.-H.; Behrmann, J.; Zemel, R.; Bethge, M. Excessive invariance causes adversarial vulnerability. In Proceedings of the 7th International Conference on Learning Representations, New Orleans, LA, USA, 6–9 May 2019. [Google Scholar]
- Das, A.; Agrawal, H.; Zitnick, L.; Parikh, D.; Batra, D. Human attention in visual question answering: Do humans and deep networks look at the same regions? Comput. Vis. Image Underst. 2017, 163, 90–100. [Google Scholar] [CrossRef]
- Karargyris, A.; Kashyap, S.; Lourentzou, I.; Wu, J.T.; Sharma, A.; Tong, M.; Abedin, S.; Beymer, D.; Mukherjee, V.; Krupinski, E.A.; et al. Creation and validation of a chest X-ray dataset with eye-tracking and report dictation for AI development. Sci. Data 2021, 8, 92. [Google Scholar] [CrossRef] [PubMed]
- Ebrahimpour, M.K.; Falandays, J.B.; Spevack, S.; Noelle, D.C. Do humans look where Deep Convolutional Neural Networks “attend”? In Advances in Visual Computing: 14th International Symposium on Visual Computing, Lake Tahoe, NV, USA, 7–9 October 2019; Springer International Publishing: Cham, Switzerland, 2019. [Google Scholar]
- Hwu, T.; Levy, M.; Skorheim, S.; Huber, D. Matching representations of explainable artificial intelligence and eye gaze for human-machine interaction. arXiv 2021, arXiv:2102.00179. [Google Scholar] [CrossRef]
- Yang, Y.; Zheng, Y.; Deng, D.; Zhang, J.; Huang, Y.; Yang, Y.; Hsiao, J.H.; Cao, C.C. HSI: Human saliency imitator for benchmarking saliency-based model explanations. In Proceedings of the AAAI Conference on Human Computation and Crowdsourcing, Virtual, 6–10 November 2022. [Google Scholar]
- Lai, Q.; Khan, S.; Nie, Y.; Sun, H.; Shen, J.; Shao, L. Understanding more about human and machine attention in deep neural networks. IEEE Trans. Multimed. 2020, 23, 2086–2099. [Google Scholar] [CrossRef]
- Lanfredi, R.B.; Arora, A.; Drew, T.; Schroeder, J.D.; Tasdizen, T. Comparing radiologists’ gaze and saliency maps generated by interpretability methods for chest x-rays. arXiv 2021, arXiv:2112.11716. [Google Scholar] [CrossRef]
- Muddamsetty, S.M.; Jahromi, M.N.; Moeslund, T.B. Expert level evaluations for explainable AI (XAI) methods in the medical domain. In Pattern Recognition. ICPR International Workshops and Challenges; Virtual Event; Springer International Publishing: Cham, Switzerland, 2021. [Google Scholar]
- Morrison, K.; Mehra, A.; Perer, A. Shared interest…sometimes: Understanding the alignment between human perception, vision architectures, and saliency map techniques. In Proceedings of the IEEE/CVF Conference on Computer Vision and Pattern Recognition, Vancouver, BC, Canada, 17–24 June 2023. [Google Scholar]
- Schiller, D.; Huber, T.; Dietz, M.; André, E. Relevance-based data masking: A model-agnostic transfer learning approach for facial expression recognition. Front. Comput. Sci. 2020, 2, 6. [Google Scholar] [CrossRef]
- Trokielewicz, M.; Czajka, A.; Maciejewicz, P. Perception of image features in post-mortem iris recognition: Humans vs machines. In Proceedings of the 2019 IEEE 10th International Conference on Biometrics Theory, Applications and Systems, Tampa, FL, USA, 23–26 September 2019; IEEE: Piscataway, NJ, USA, 2019. [Google Scholar]
- Mohseni, S.; Block, J.E.; Ragan, E.D. Quantitative evaluation of Machine Learning explanations: A human-grounded benchmark. In Proceedings of the 26th International Conference on Intelligent User Interfaces, College Station, TX, USA, 14–17 April 2021; Association for Computing Machinery: New York, NY, USA, 2021. [Google Scholar]
- Unema, P.J.A.; Pannasch, S.; Joos, M.; Velichkovsky, B.M. Time course of information processing during scene perception: The relationship between saccade amplitude and fixation duration. Vis. Cogn. 2005, 12, 473–494. [Google Scholar] [CrossRef]
- Müller, R.; Pannasch, S.; Velichkovsky, B.M. Comparing eye movements for perception and communication: Changes in visual fixation durations and saccadic amplitudes. Percept. 38 ECVP ‘09 Abstr. 2009, 38, 23. [Google Scholar] [CrossRef]
- Greiner, B. Subject pool recruitment procedures: Organizing experiments with ORSEE. J. Econ. Sci. Assoc. 2015, 1, 114–125. [Google Scholar] [CrossRef]
- Zhou, B.; Lapedriza, A.; Khosla, A.; Oliva, A.; Torralba, A. Places: A 10 million image database for scene recognition. IEEE Trans. Pattern Anal. Mach. Intell. 2017, 40, 1452–1464. [Google Scholar] [CrossRef]
- Deng, J.; Dong, W.; Socher, R.; Li, L.J.; Li, K.; Fei-Fei, L. Imagenet: A large-scale hierarchical image database. In Proceedings of the IEEE Conference on Computer Vision and Pattern Recognition, Miami, FL, USA, 20–25 June 2009; IEEE: Piscataway, NJ, USA, 2009. [Google Scholar]
- Velichkovsky, B.M.; Joos, M.; Helmert, J.R.; Pannasch, S. Two visual systems and their eye movements: Evidence from static and dynamic scene perception. In Proceedings of the 27th Annual Meeting of the Cognitive Science Society, Stresa, Italy, 21–23 July 2005. [Google Scholar]
- Dice, L.R. Measures of the amount of ecologic association between species. Ecology 1945, 26, 297–302. [Google Scholar] [CrossRef]
- Bylinskii, Z.; Judd, T.; Oliva, A.; Torralba, A.; Durand, F. What do different evaluation metrics tell us about saliency models? IEEE Trans. Pattern Anal. Mach. Intell. 2019, 41, 740–757. [Google Scholar] [CrossRef]
- Biederman, I.; Mezzanotte, R.J.; Rabinowitz, J.C. Scene perception: Detecting and judging objects undergoing relational violations. Cogn. Psychol. 1982, 14, 143–177. [Google Scholar] [CrossRef]
- Müller, R.; Thoß, M.; Ullrich, J.; Seitz, S.; Knoll, C. Interpretability is in the eye of the beholder: Human versus artificial classification of image segments generated by humans versus XAI. Int. J. Hum.-Comput. Interact. 2024, 1–24. [Google Scholar] [CrossRef]
- Greene, M.R.; Baldassano, C.; Esteva, A.; Beck, D.M.; Fei-Fei, L. Visual scenes are categorized by function. J. Exp. Psychol. Gen. 2016, 145, 82–94. [Google Scholar] [CrossRef] [PubMed]
- Harding, G.; Bloj, M. Real and predicted influence of image manipulations on eye movements during scene recognition. J. Vis. 2010, 10, 8. [Google Scholar] [CrossRef] [PubMed]
- Underwood, G.; Foulsham, T.; Humphrey, K. Saliency and scan patterns in the inspection of real-world scenes: Eye movements during encoding and recognition. Vis. Cogn. 2009, 17, 812–834. [Google Scholar] [CrossRef]
- Lancry-Dayan, O.C.; Kupershmidt, G.; Pertzov, Y. Been there, seen that, done that: Modification of visual exploration across repeated exposures. J. Vis. 2019, 19, 2. [Google Scholar] [CrossRef] [PubMed]
- Geirhos, R.; Rubisch, P.; Michaelis, C.; Bethge, M.; Wichmann, F.A.; Brendel, W. ImageNet-trained CNNs are biased towards texture; increasing shape bias improves accuracy and robustness. In Proceedings of the International Conference on Learning Representations, New Orleans, LA, USA, 6–9 May 2019. [Google Scholar]
- Baker, N.; Lu, H.; Erlikhman, G.; Kellman, P.J. Deep convolutional networks do not classify based on global object shape. PLoS Comput. Biol. 2018, 14, e1006613. [Google Scholar] [CrossRef] [PubMed]
- Velichkovsky, B.M. Heterarchy of cognition: The depths and the highs of a framework for memory research. Memory 2002, 10, 405–419. [Google Scholar] [CrossRef] [PubMed]
- Boyd, A.; Tinsley, P.; Bowyer, K.W.; Czajka, A. CYBORG: Blending human saliency into the loss improves deep learning-based synthetic face detection. In Proceedings of the IEEE/CVF Winter Conference on Applications of Computer Vision, Waikoloa, HI, USA, 3–7 January 2023. [Google Scholar]
- Colin, J.; Fel, T.; Cadène, R.; Serre, T. What I cannot predict, i do not understand: A human-centered evaluation framework for explainability methods. Adv. Neural Inf. Process. Syst. 2022, 35, 2832–2845. [Google Scholar]
- Jin, W.; Fatehi, M.; Guo, R.; Hamarneh, G. Evaluating the clinical utility of artificial intelligence assistance and its explanation on the glioma grading task. Artif. Intell. Med. 2024, 148, 102751. [Google Scholar] [CrossRef]

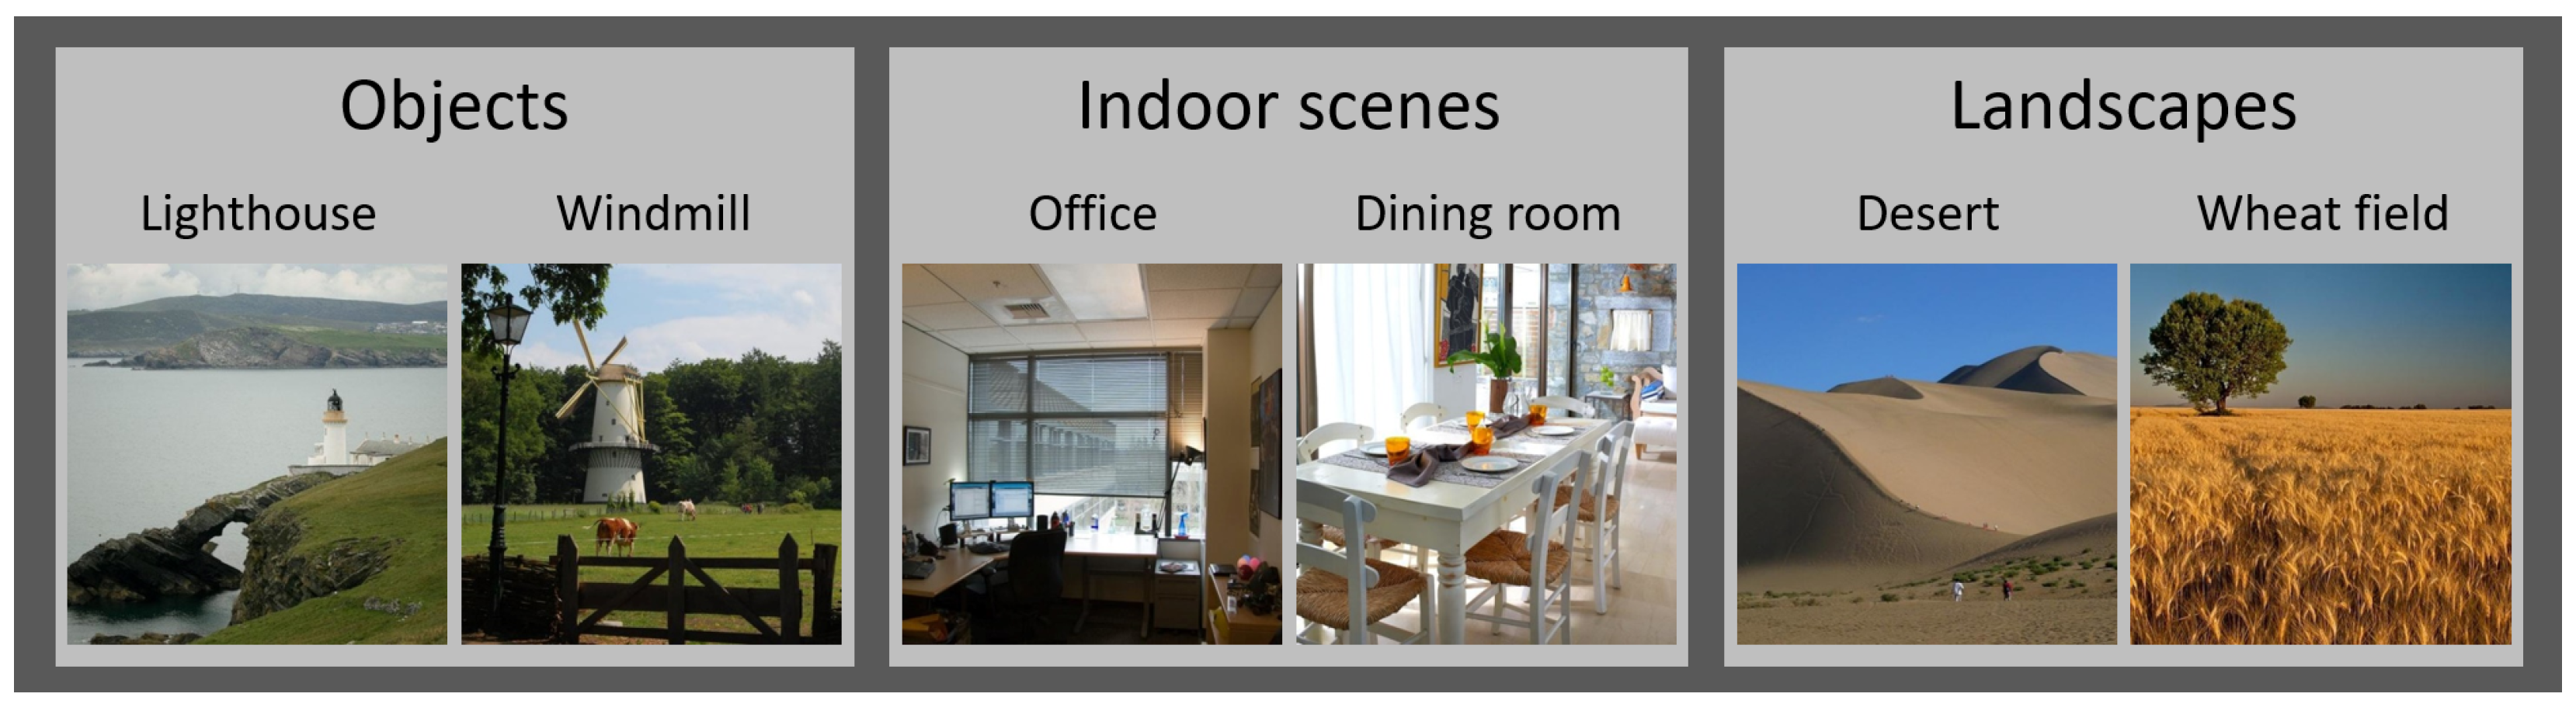
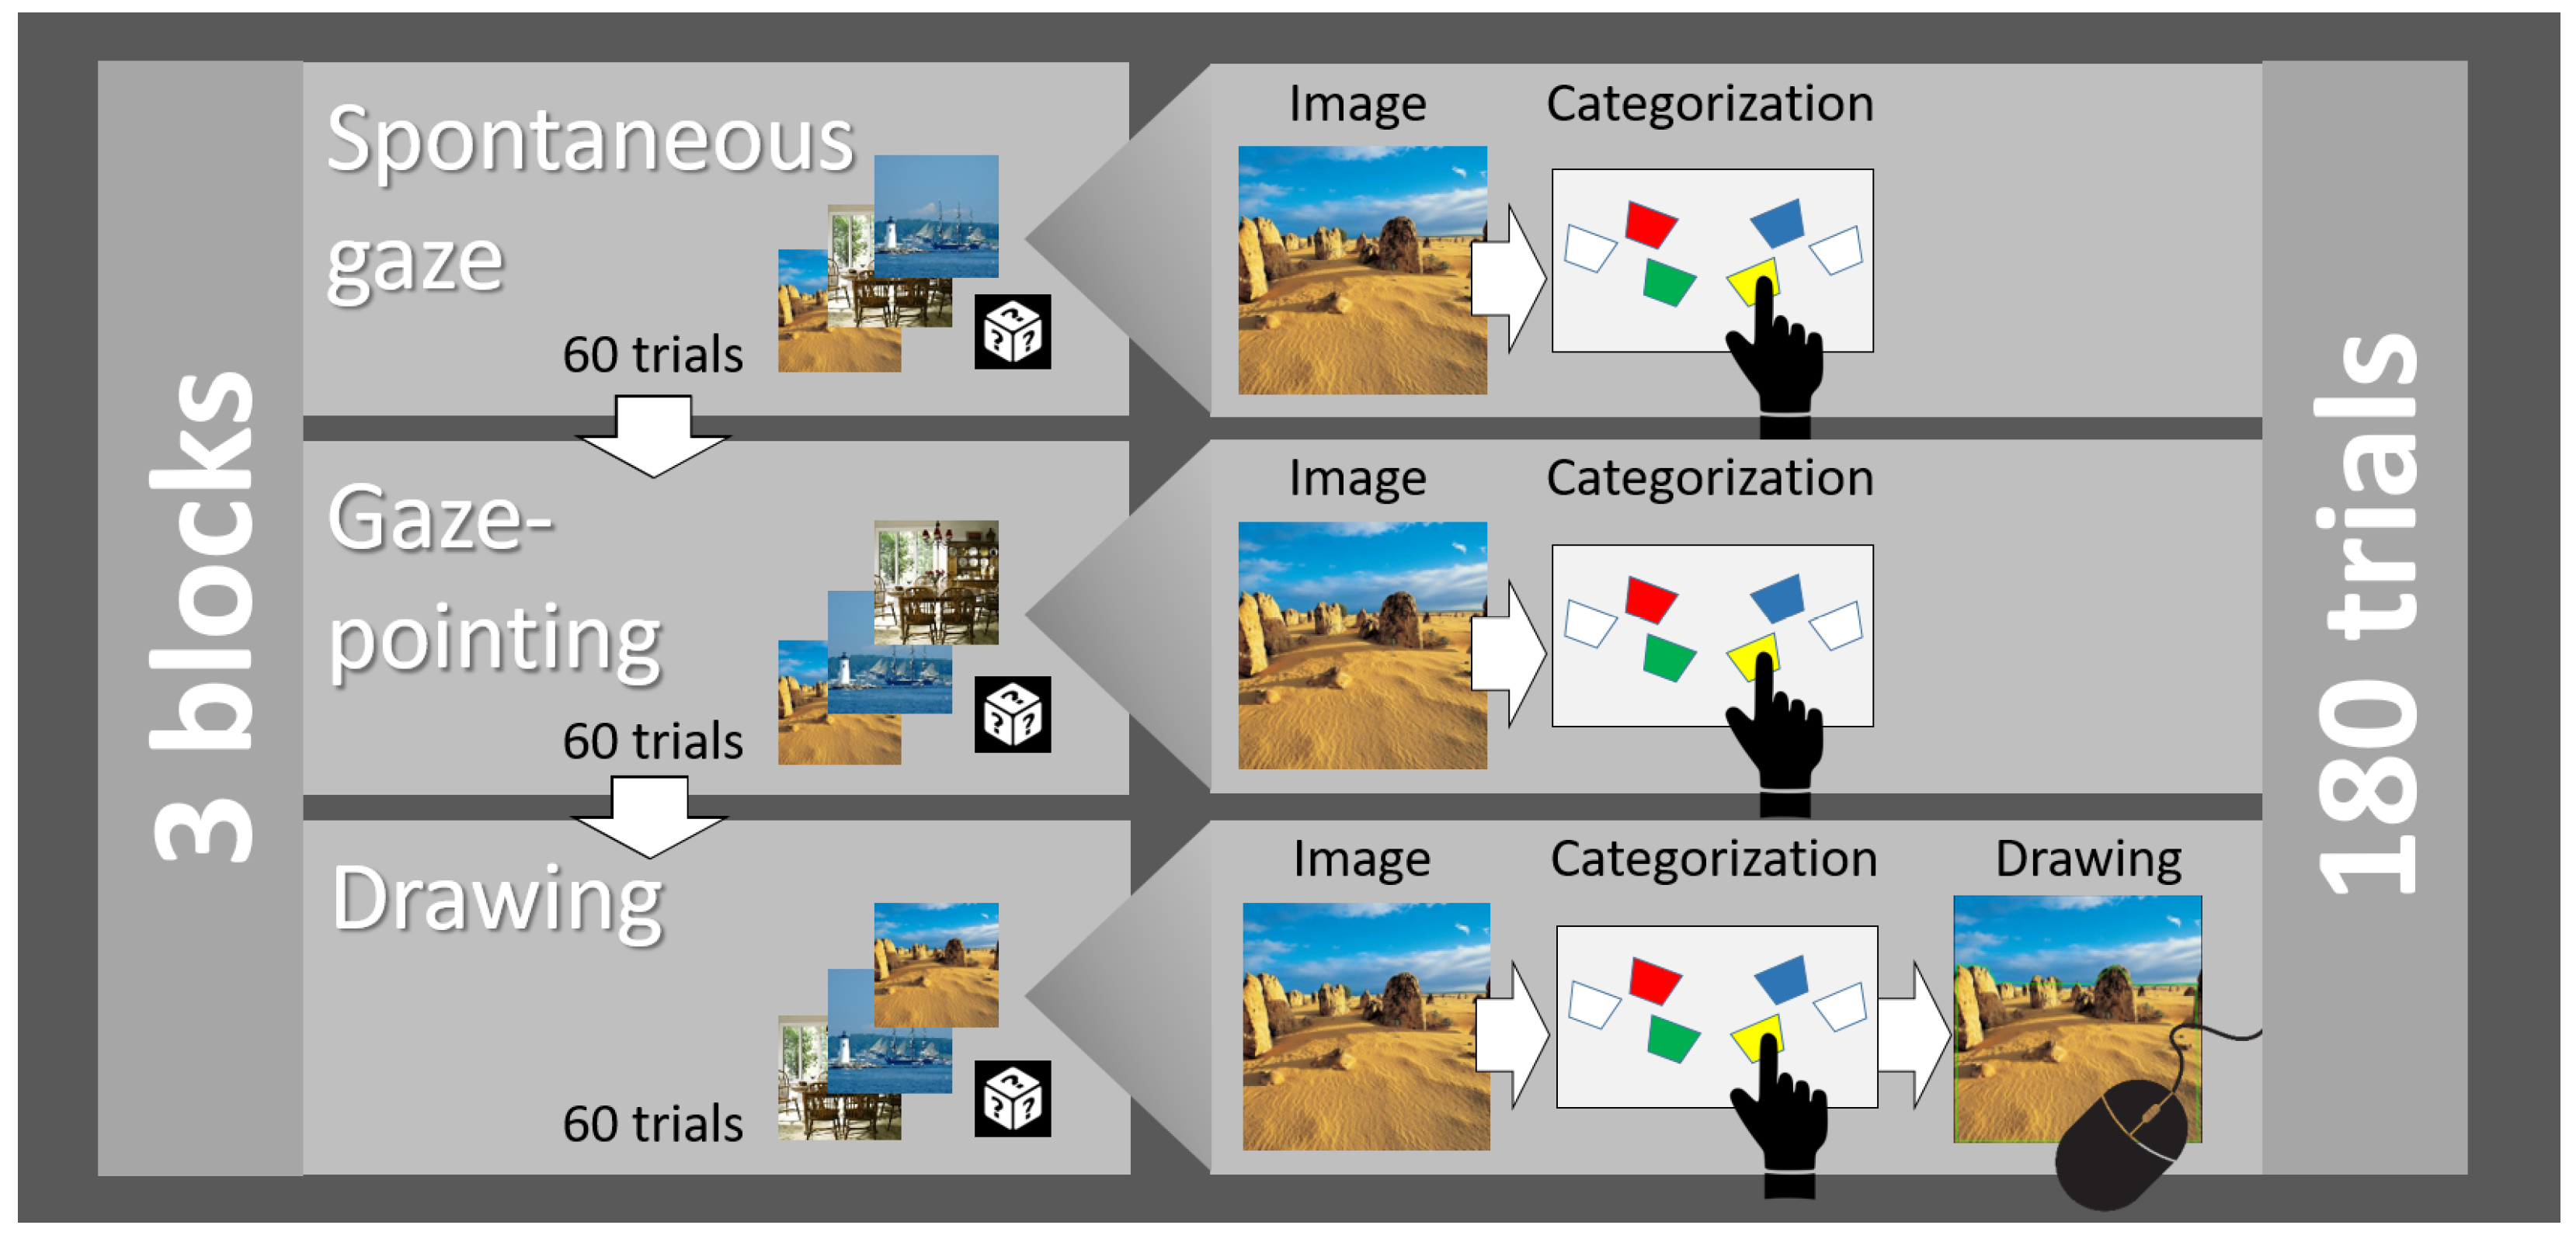
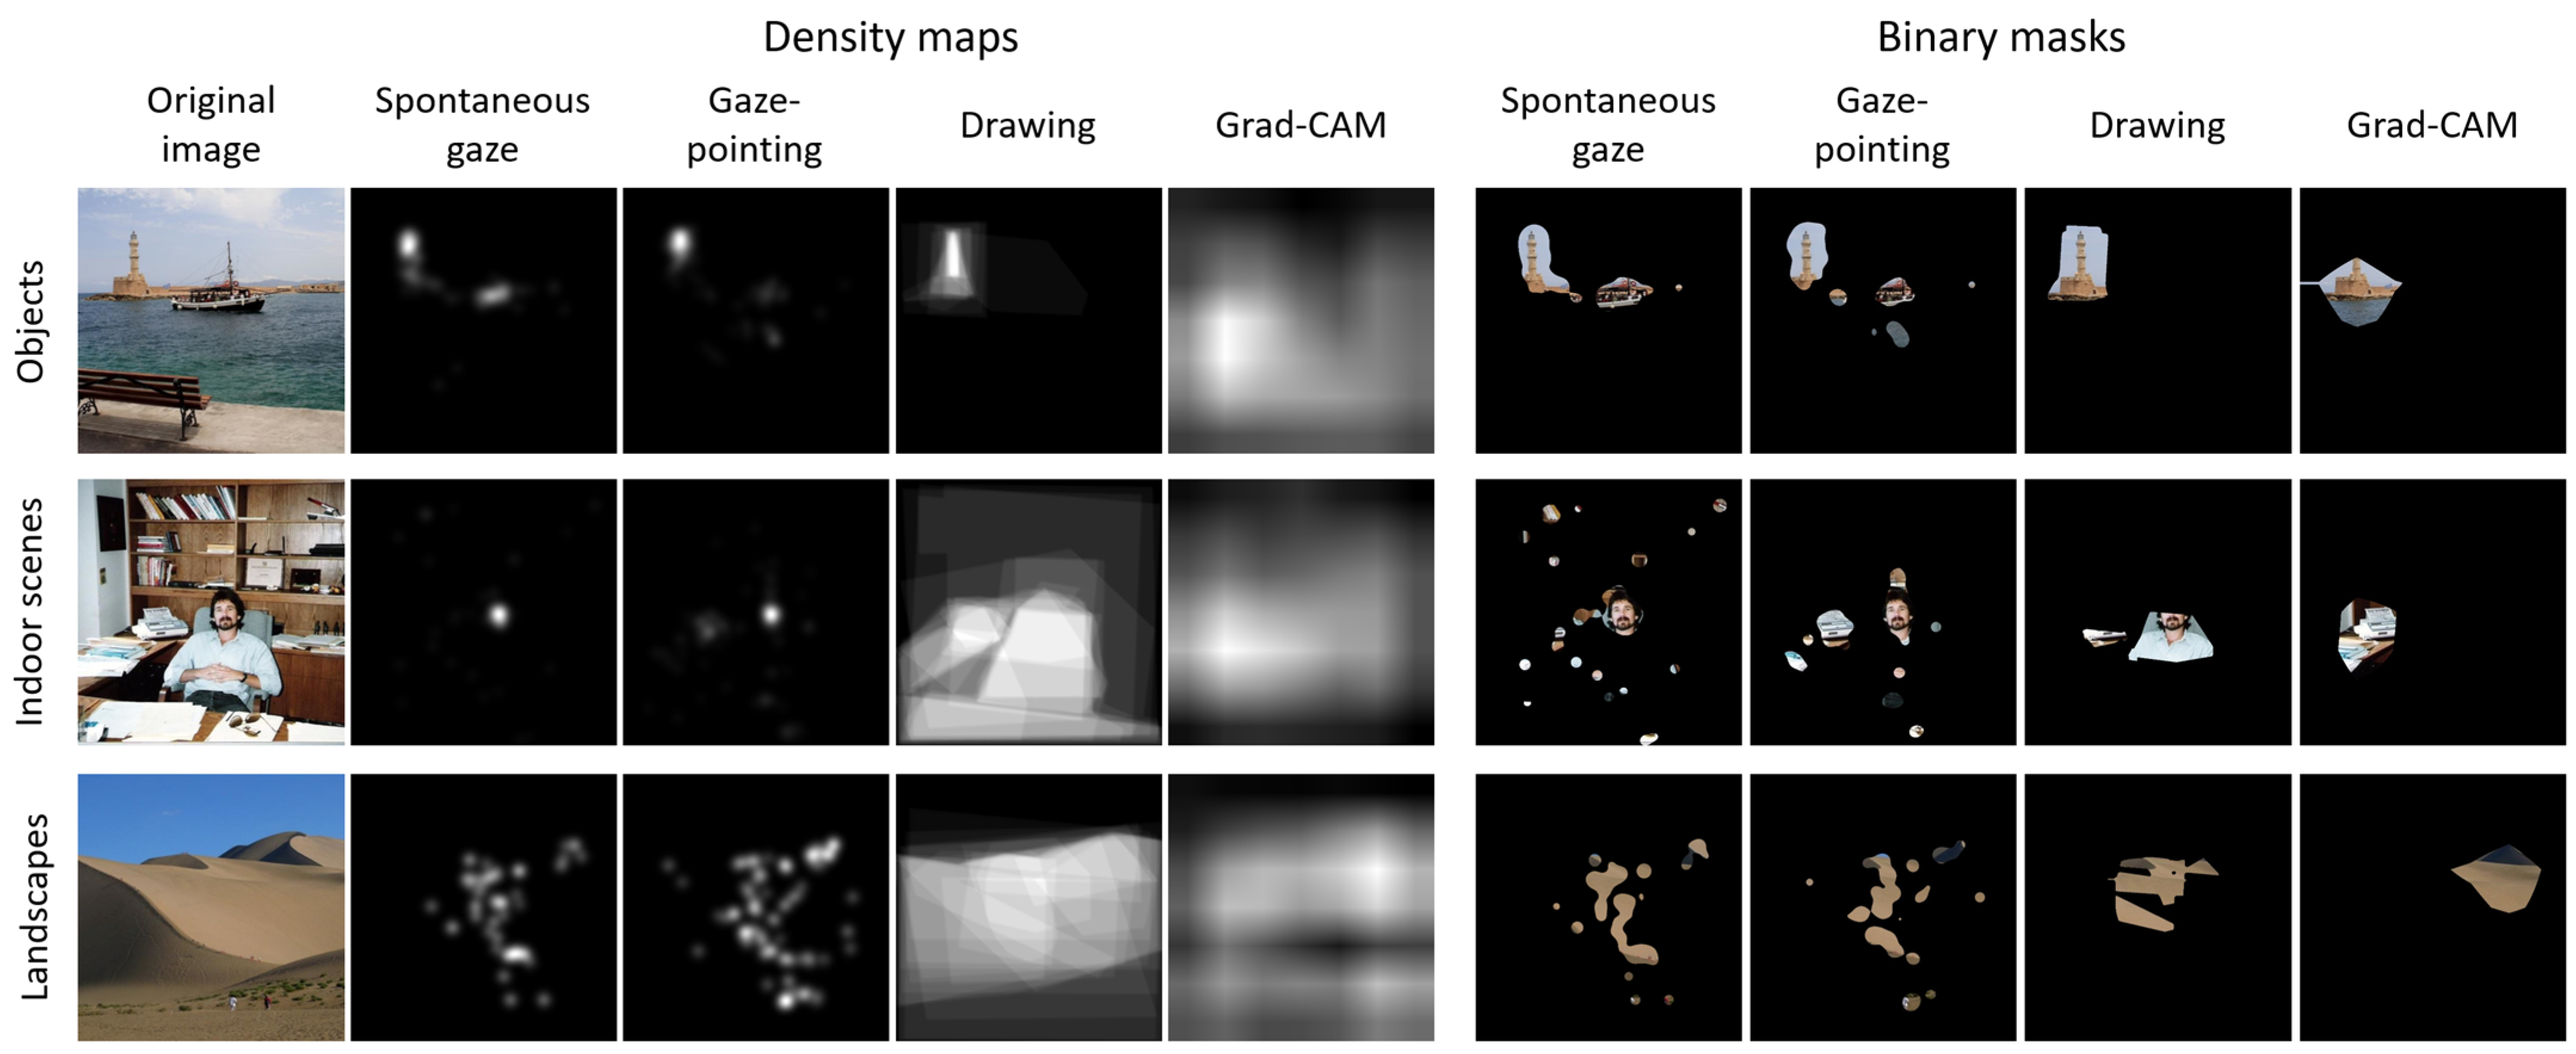

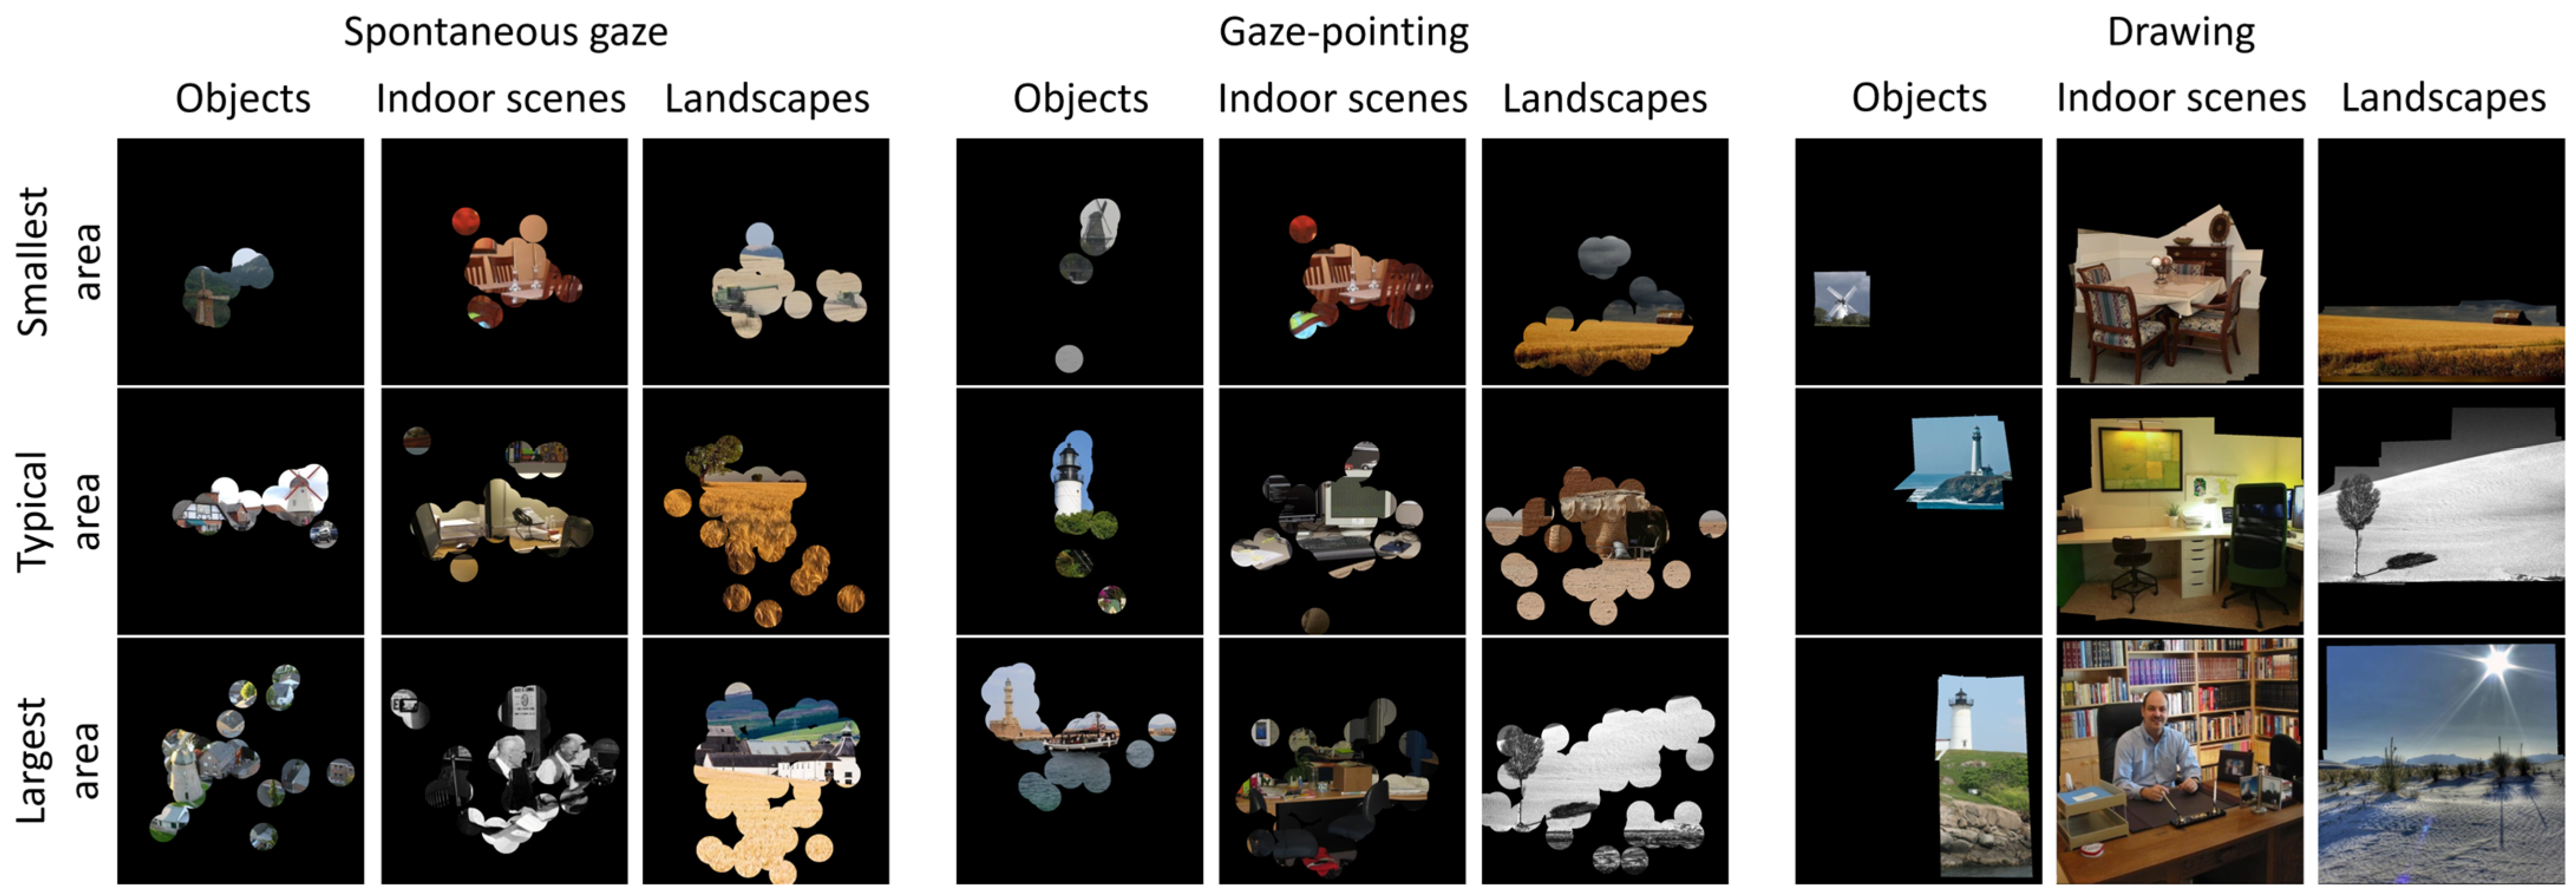
Disclaimer/Publisher’s Note: The statements, opinions and data contained in all publications are solely those of the individual author(s) and contributor(s) and not of MDPI and/or the editor(s). MDPI and/or the editor(s) disclaim responsibility for any injury to people or property resulting from any ideas, methods, instructions or products referred to in the content. |
© 2024 by the authors. Licensee MDPI, Basel, Switzerland. This article is an open access article distributed under the terms and conditions of the Creative Commons Attribution (CC BY) license (https://creativecommons.org/licenses/by/4.0/).