1. Introduction
In the field of advanced ceramics, there is still a demand for materials with high mechanical strength, fracture toughness, hardness, wear resistance, and temperature resistance [
1,
2]. Despite the huge amount of published work on the mechanical and structural properties of ceria-, zirconia-, and alumina-based ceramics, further research is needed. This is due to the necessity of finding new approaches for enhancing the performance characteristics and physical properties of technical ceramics. For example, cation substitution (doping) or the use of different sintering aids are effective ways to adjust the structure and phase composition of ceramics [
3,
4]. Changes in microstructure (grain size, morphology of grains) and phase composition can improve mechanical properties, have an effect on temperature resistance, and significantly vary the electrical properties of technical ceramics [
5].
Partially stabilized zirconia (tetragonal (t) and cubic phases (c), PSZ) or fully stabilized zirconia (only tetragonal phase, FSZ) are some of the most well-studied and used materials for medical, engineering, and scientific applications. Much attention is being paid to different binary oxide systems, such as ZrO
2-Y
2O
3, ZrO
2-MgO, ZrO
2-CaO, and ZrO
2-CeO
2 [
6,
7,
8]. PSZ and FSZ ceramics can be successfully synthesized from these binary systems. Pure ZrO
2 ceramics show a phase transition from a monoclinic (m) to tetragonal phase during heating at 1170 °C (and 950 °C during cooling) with a significant change in the crystal lattice volume [
9]. These martensitic transformations lead to the formation of cracks in ceramic details (or even full breaking during sintering) and decrease the material’s temperature resistance. Y
2O
3, MgO, CaO, and CeO
2 act as tetragonal or cubic phase stabilizers for zirconia-based ceramics and make it possible to sinter complexly shaped ZrO
2 ceramics. The mechanism of suppressing martensitic transformations in the first approximation is connected with the substitution of Zr
4+ cations by Y
3+, Mg
2+, Ca
2+, and Ce
4+ with different Zr
4+ ionic radii [
7]. This substitution hinders the shearing displacement of zirconium cations, so that the transformation from the tetragonal (t) to the monoclinic (m) phase does not take place. Mechanical stress, radiation, and thermal impacts are considered the main factors for inducing the reverse phase transformation from the tetragonal to monoclinic phase in ZrO
2-based ceramics [
7,
10].
The detailed phase equilibrium of the ZrO
2-CeO
2 system was obtained in 1950, and many variants of it were previously reconstructed [
11,
12,
13,
14]. Nevertheless, some inconsistencies in the obtained phase equilibrium data exist, which may be misleading for material scientists. For this reason, further investigation of ZrO
2-CeO
2 ceramics with the application of modern research methods should be conducted. New experimental data about the physical characteristics of zirconia–ceria ceramics is very important in the development of new structural and functional materials [
15]. For example, there is an urgent demand for inert ceramic matrices for nuclear fuels based on zirconia [
16]. Because of the above-mentioned properties of advanced ceramics, zirconia–ceria is suitable for holding the plutonium oxide fuel and resisting thermal and radiation impacts inside a nuclear reactor [
17]. Another way of using zirconia–ceria ceramics is as a functional material for solid oxide fuel cells. A solid oxide fuel cell is the central object of devices that produce electricity from electrochemical reactions where fuel (natural gas, hydrogen) reacts with oxygen. The operating temperature range of such devices is 500–1000 °C, so ceramic materials with high ionic and oxygen conductivity are required [
18]. Finally, zirconia–ceria solid solutions (Ce
xZr
1−xO
2) can be used in heterogeneous catalysis because of their textural and redox properties [
19].
It is very important to investigate the phase composition, microstructural features, and mechanical and electrical properties of oxide ceramics to evaluate their effectiveness in the above-mentioned applications. To achieve this goal, in this work, partially stabilized CeO2 zirconia polycrystalline ceramics were successfully synthesized by the conventional ceramic method with different weight concentrations x of ceria in the range of 0 to 1.0 with a step of 0.05. X-ray diffraction (XRD) and Raman spectroscopy were implemented to provide a precise evaluation of the phase composition and the defects in the crystal structure. Scanning electron microscopy (SEM) was used to study the microstructural characteristics, while the Vickers Hardness Test was chosen to study the mechanical properties of the obtained ceramics. Finally, dielectric spectroscopy was used for dielectric measurements.
2. Materials and Methods
The experimental samples were synthesized using the conventional ceramic solid-state sintering method. Chemically pure powders of zirconium oxide ZrO2 (Sigma Aldrich, high purity, St. Louis, MO, USA) and cerium oxide CeO2 (Sigma Aldrich, high purity, St. Louis, MO, USA) with a size of less than 5 μm were used to prepare the initial blend or charge. The weight of the powder mixture in the initial charge was calculated according to the formula x∙CeO2 + (1 − x)∙ZrO2, where x is the mass concentration of CeO2. A PULVERISETTE 6 classic line planetary mill (Fritsch, Berlin, Germany) was used for the homogenization and dry milling of the initial powders. The process of dry milling was carried out using tungsten carbide grinding bowls and balls at a rotation speed of 250 rpm for 30 min. The milled charge was mixed with an aqueous solution of polyvinyl alcohol to make a molding powder (the residual mass concentration of the polymer was ~1%). The compaction of green pellets was carried out using a hydraulic press with an applied pressure of ~200 MPa in a stainless mold. The resulting green pellets were 12.1 mm in diameter and had a thickness of 0.9–1.1 mm. To obtain dense ceramics, the sintering of green tablets was performed in air. The sintering was performed in a muffle furnace with resistive heaters in the following sequence: heating from room temperature to 400 °C with a heating rate of 10 °C/min → exposure at a temperature of 400 °C for 1 h → heating up to 1500 °C with a heating rate of 10 °C/min → sintering at a temperature of 1500 °C for 5 h → cooling down naturally to room temperature.
The dimensions and masses of the synthesized tablets were measured using a micrometer and high-precision scales. The elemental composition and morphology of cross-sections of the experimental ceramics were determined by using SEM on a Phenom ProX G6 microscope (ThermoFisher Scientific, Eindhoven, The Netherlands) and energy dispersive X-ray spectroscopy (EDX). Backscattered electron images and EDX spectra were obtained with a 15 kV accelerating voltage. The structural parameters and phase composition of the samples were investigated by the XRD method on a D8 Advance Eco diffractometer (Bruker, Germany). The diffraction pattern measurements were carried out in the Bragg–Brentano geometry using CuKα radiation: wavelength λ = 1.5406 Å, scanning rate of 1.8°/min, angular range of 2θ = 20–90°. The samples were also investigated by Raman spectroscopy on an Enspectr M532 spectrometer (Spectr-M LLC, Chernogolovka, Russia) at a laser wavelength of 532 nm. The microhardness of the ceramics was measured by the Vickers method using a diamond indenter with a load of 0.2 kgf on a MIKON microhardness tester (Duroline-M METKON instruments, Bursa, Turkey) for 10 s. The frequency dependences of the capacitance and dielectric loss tangent tan δ were measured using a HIOKI IM3533-01 RLC meter (Hioki E.E Corporation, Singapore) at room temperature. Prior to the dielectric measurements, silver paste contacts were painted to the surface of the tablets on both sides to create a flat capacitor configuration. The calculation of the dielectric permittivity using the measured data was performed with using the formula , where h denotes the thickness of the tablet, S represents the electrode surface area, C signifies the capacitance, and ε0 is the dielectric constant.
3. Results
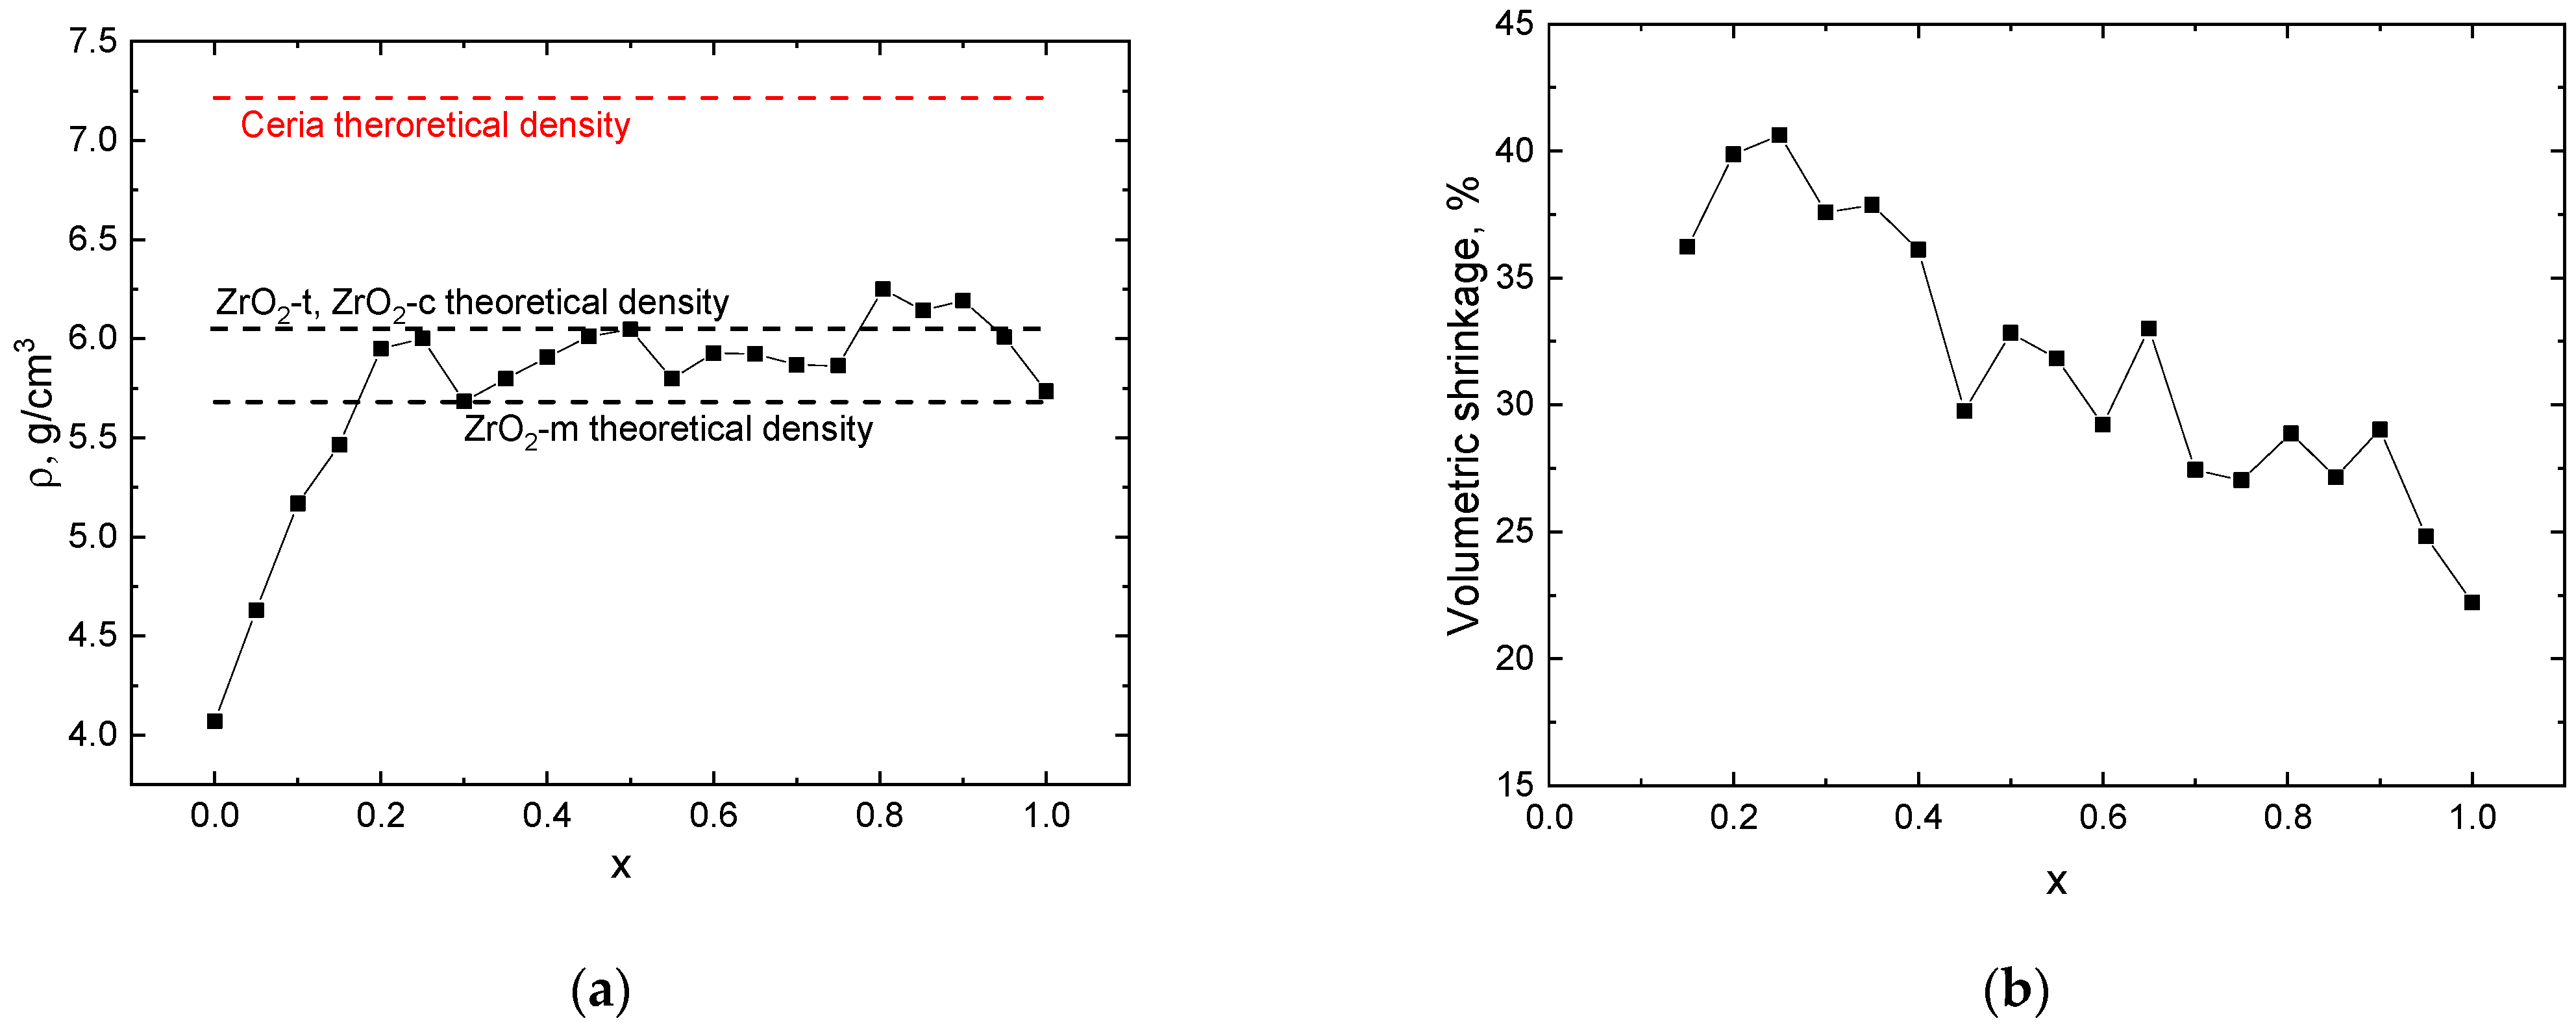
It is known that ceria and zirconia have a high melting temperature (2400 °C and ~2700 °C, respectively), so a sintering temperature of 1500 °C is not sufficient to achieve full theoretical density [
7]. For this reason, to increase the density of the final ceramics, sintering was performed for 5 h. The dependence of the measured apparent density and volumetric shrinkage on the weight fraction of ceria is shown in
Figure 1. The calculated values of apparent density were between the theoretical density of monoclinic zirconia and ceria for x > 0.15 (
Figure 1a). When x < 0.15, the apparent density was lower than both theoretical densities. It was also found out that values of volumetric shrinkage had a decreasing trend with increasing x (
Figure 1b). To clarify these results and investigate the phase composition of the sintered ceramics, the XRD method was used.
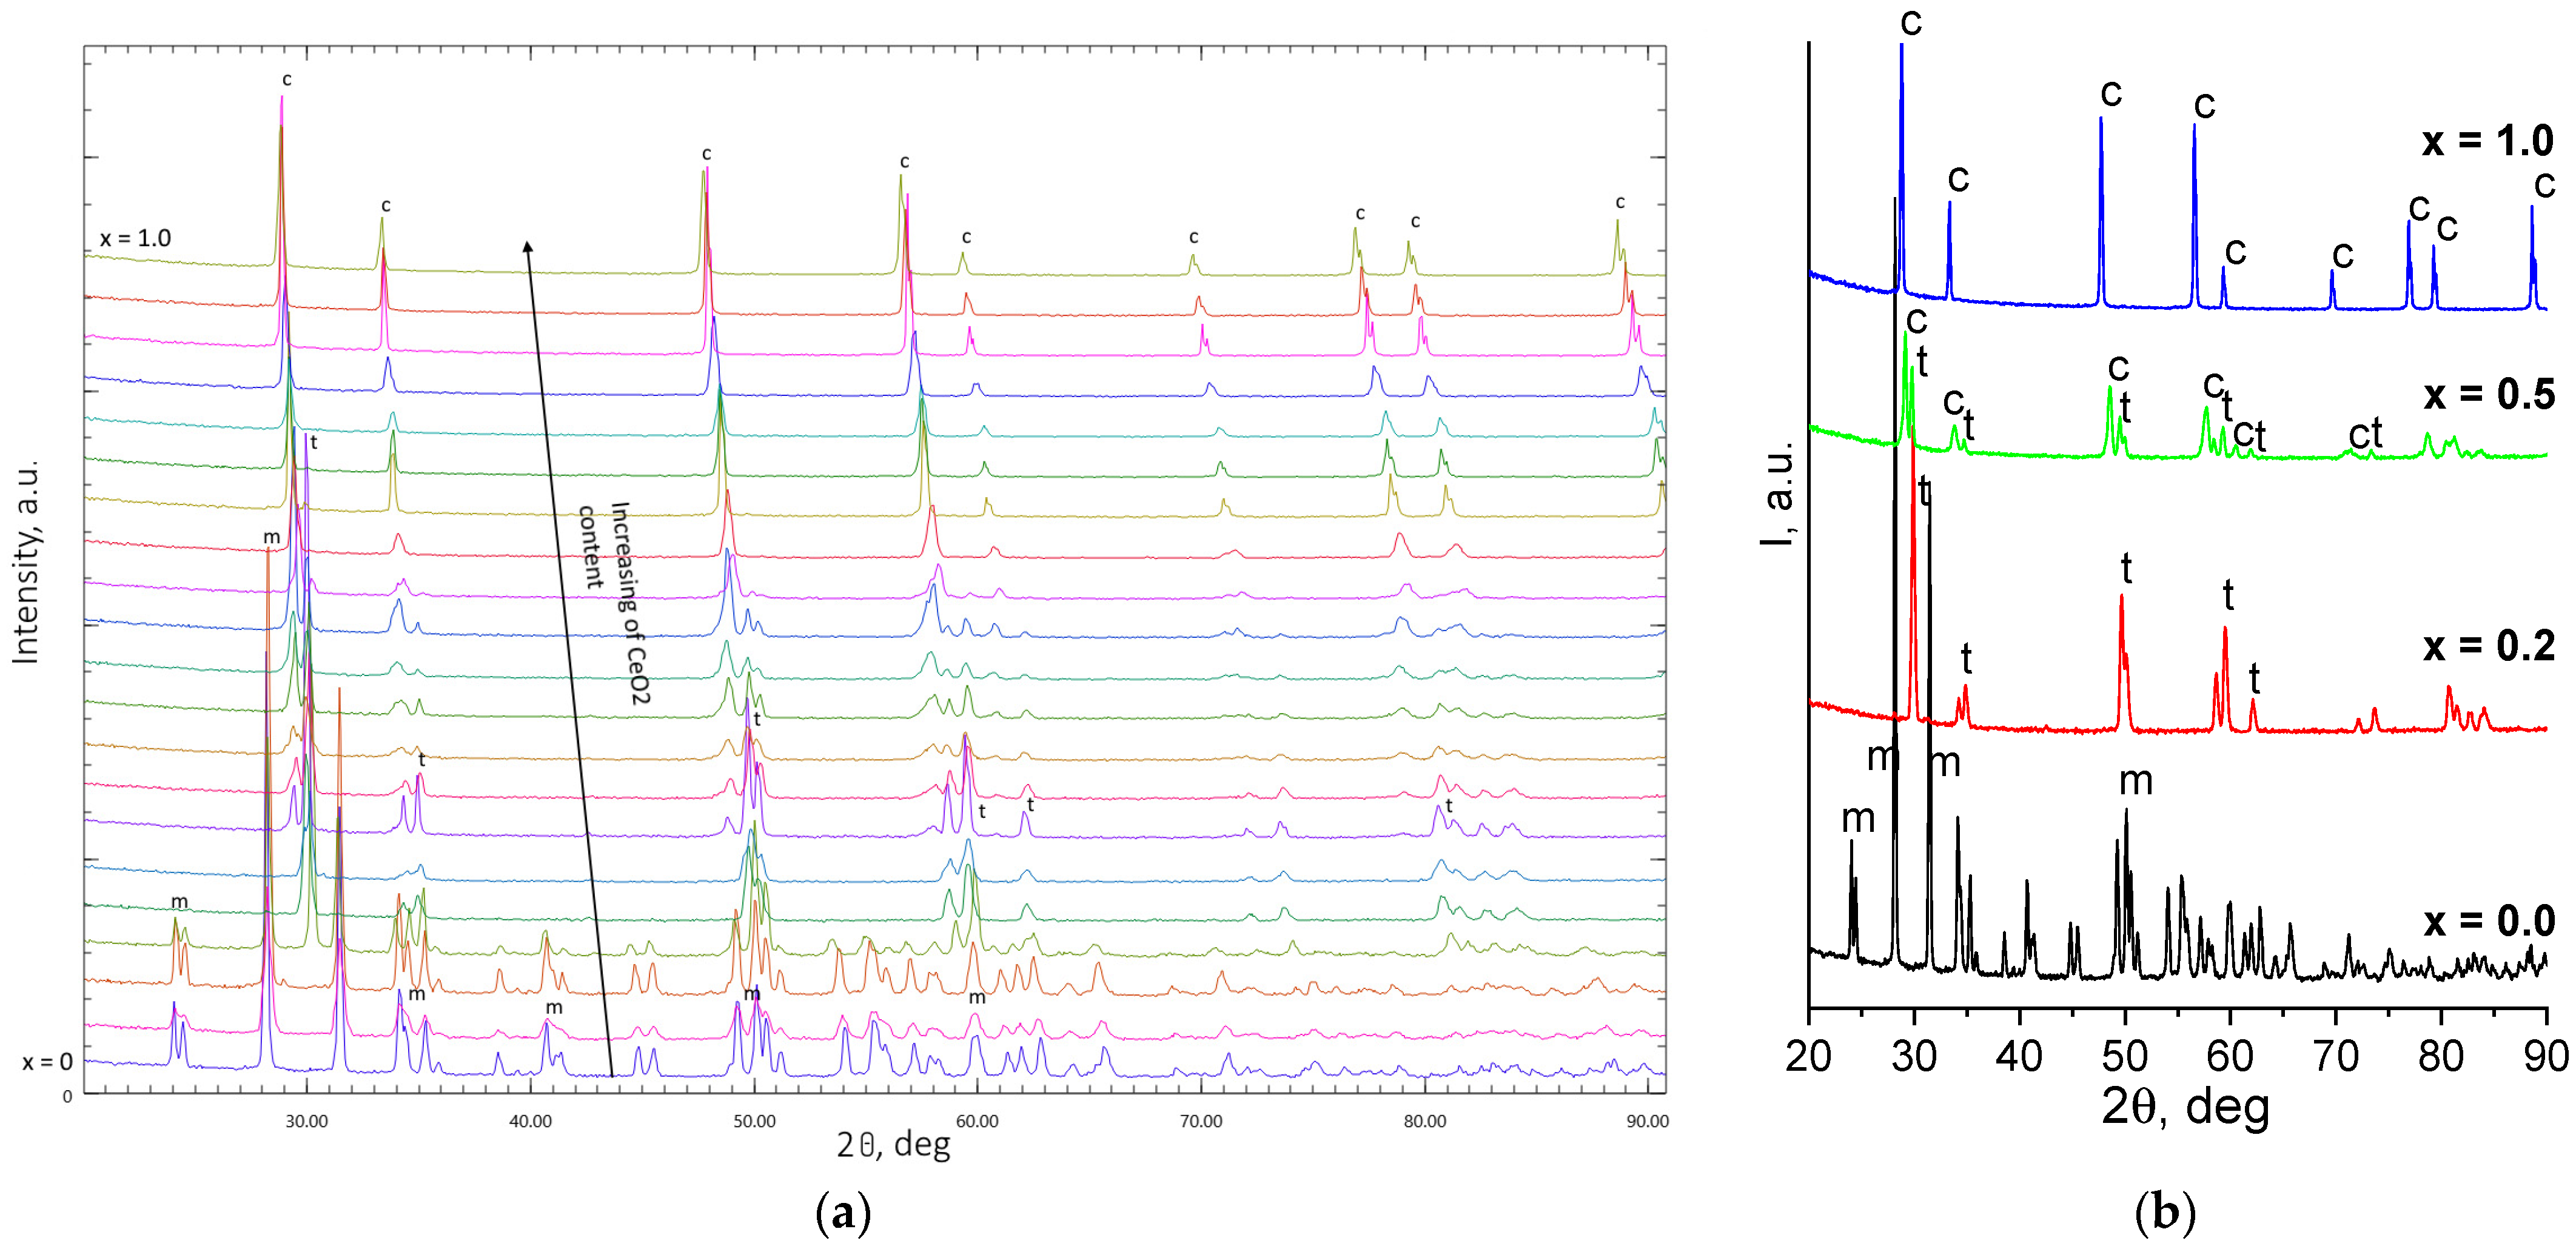
The comparison of the diffraction patterns for all the samples under investigation is shown in
Figure 2a. It can be seen that the set of peaks varied significantly at low concentrations of ceria and high concentrations of zirconia. This is due to the m-phase formation in pure zirconia and c-phase formation in low-doped ceria. After analyzing the peaks, it can be concluded that there are only three possible phases in sintered ceramics. A cubic phase (space group Fm3m), tetragonal phase (space group P42/nmc), and monoclinic phase (space group P21/c) were the observed phases from the XRD patterns of the samples under investigation. For a more detailed demonstration of the observed phases, the XRD patterns of samples with x = 0.0, 0.2, 0.5, and 1.0 are shown in
Figure 2b.
The XRD quantitative and qualitative analyses were conducted using DifracEva 2.1 software (Bruker, Germany) with the help of a PDF crystallographic database, and the results of these analyses are shown in
Table 1. The calculation of the lattice parameters was performed using DifracEva 2.1 and the most suitable PDF card and manually fitting the Bragg peaks positions to the experimental ones. The lattice parameter calculated for the cubic phase of the doped ceria oxide decreased with a decrease in the CeO
2 concentration in the initial charge. When the concentration of x reached 0.6, a significant amount of tetragonal zirconia oxide was formed.
Another interesting observation that can be pointed out is the dependence of the sample porosity and tetragonal phase concentration on the x value. The phase composition was obtained by the corundum number method using DifracEva 2.1 and corundum numbers from the PDF cards. The porosity can be estimated with the formula P = (1 − ρ
app/ρ
XRD)∙100%, where ρ
app is the apparent density and ρ
XRD is the X-ray density. The XRD densities were calculated as a weighted mean value between all constituted phases according to the formula ρ
XRD = ρ
1·c
1 + ρ
2·c
2 + … ρ
n·c
n. As can be seen from
Figure 3, with an increasing amount of tetragonal phase, the was porosity reduced from ~20% to 2.5%. Despite the obtained results, further investigation of the ceramics’ microstructure and grain morphology should be conducted to clarify the mechanisms of densification in the obtained samples.
To justify the interpretation of the XRD pattern analysis, Raman spectroscopy was carried out for all samples. In
Figure 4, the Raman spectra of the obtained ceramics are shown. For the undoped CeO
2, the most pronounced peak at 470 cm
−1 corresponds to the triply degenerate optical phonon mode F
2g. This mode is characteristic of cubic fluorite structures with the space group Fm3m [
20]. With a decrease in x from 1.0 to 0.9, a wide peak at 600 cm
−1 occurred, showing the D
2 band which is indicates defects [
21]. The D1 band is associated with defect species like an oxygen vacancy, which disrupts the Oh symmetry, while the D2 band corresponds to MO
8-type defect species with Oh symmetry, including a dopant cation without any oxygen vacancy. There was another decreasing peak at 130 cm
−1, which was also connected with crystal defects in the CeO
2-ZrO
2 system [
12]. The Raman spectra of samples with x = 0.6 showed tetragonal zirconia peaks, which is in good agreement with the XRD data. In the range of concentration x from 0.4 to 0.15, pronounced peaks of the tetragonal phase can be clearly observed. Two peaks at 140 and 315 cm
−1 and three peaks at 244, 455, and 631 cm
−1 related to the B
1g mode and E
g mode, respectively, were considered the main evidence of tetragonal phase formation in the sintered ceramics [
22]. For the samples with x = 0.15, 0.10, 0.05, and 0.00, their Raman spectra showed 13 active modes including 7 A
g (peaks positions 177, 189, 304, 346, 474, 558, 634 cm
−1) and 6 B
g (peak positions 220, 332, 381, 505, 534, 614 cm
−1). All these modes belong to the monoclinic phase of ZrO
2 [
23].
SEM images of the cross-section of the most representative sample are showed in
Figure 5. In
Figure 5a, a cross-section of the pure zirconia ceramics is shown. Crack formation is associated with the transition t → m during cooling after the sintering process is over [
7]. These features greatly reduce the density and mechanical properties of ceramics and increase porosity (
Figure 1a and
Figure 3a). FSZ ceramics were obtained at concentrations of x = 0.20 and 0.25 with a fine grain size distribution (
Figure 5b). The coexistence of two types of grains (feather-like and polygonal grains) in mixed-phase ceramics is illustrated in
Figure 5c,d.
The EDX spectra collected from all the samples showed that the fracture surface only consisted of Ce, Zr, and O atoms, and the concentrations of zirconium and cerium were generally proportional to the composition of the initial oxide mixture. To demonstrate this, the EDX spectra of some compositions are shown in
Figure 6. The elemental composition of the synthesized ceramics is shown in
Table 2. From
Figure 6 and
Table 2, it can be seen that in Ce-rich ceramics, the atomic concentration of Ce was higher than the atomic concentration of Zr, and vice versa. The calculation of the chemical formulas from the mole fractions of oxides and from the EDX composition data were significantly different. This can be explained by the following reasons: (1) the roughness of the cross-sectional surfaces of the ceramics obstructs the precise detection of all elements; (2) the EDX method of oxygen concentration detection has a high error value; and (3) the analyzed square of the sample can be inhomogeneous (oxygen deficiency and unfinished solid phase reaction). The elemental mapping of the surfaces showed that for ceramics with a pure cubic, tetragonal, or monoclinic phase, the distribution of elements was uniform. In mixed-phase samples with an equal ratio of cubic and tetragonal phases, or with a tetragonal domination, the distribution of elements appeared to not be uniform. For example, the elemental mapping of the surface of the sample with x = 0.55 is shown in
Figure 7.
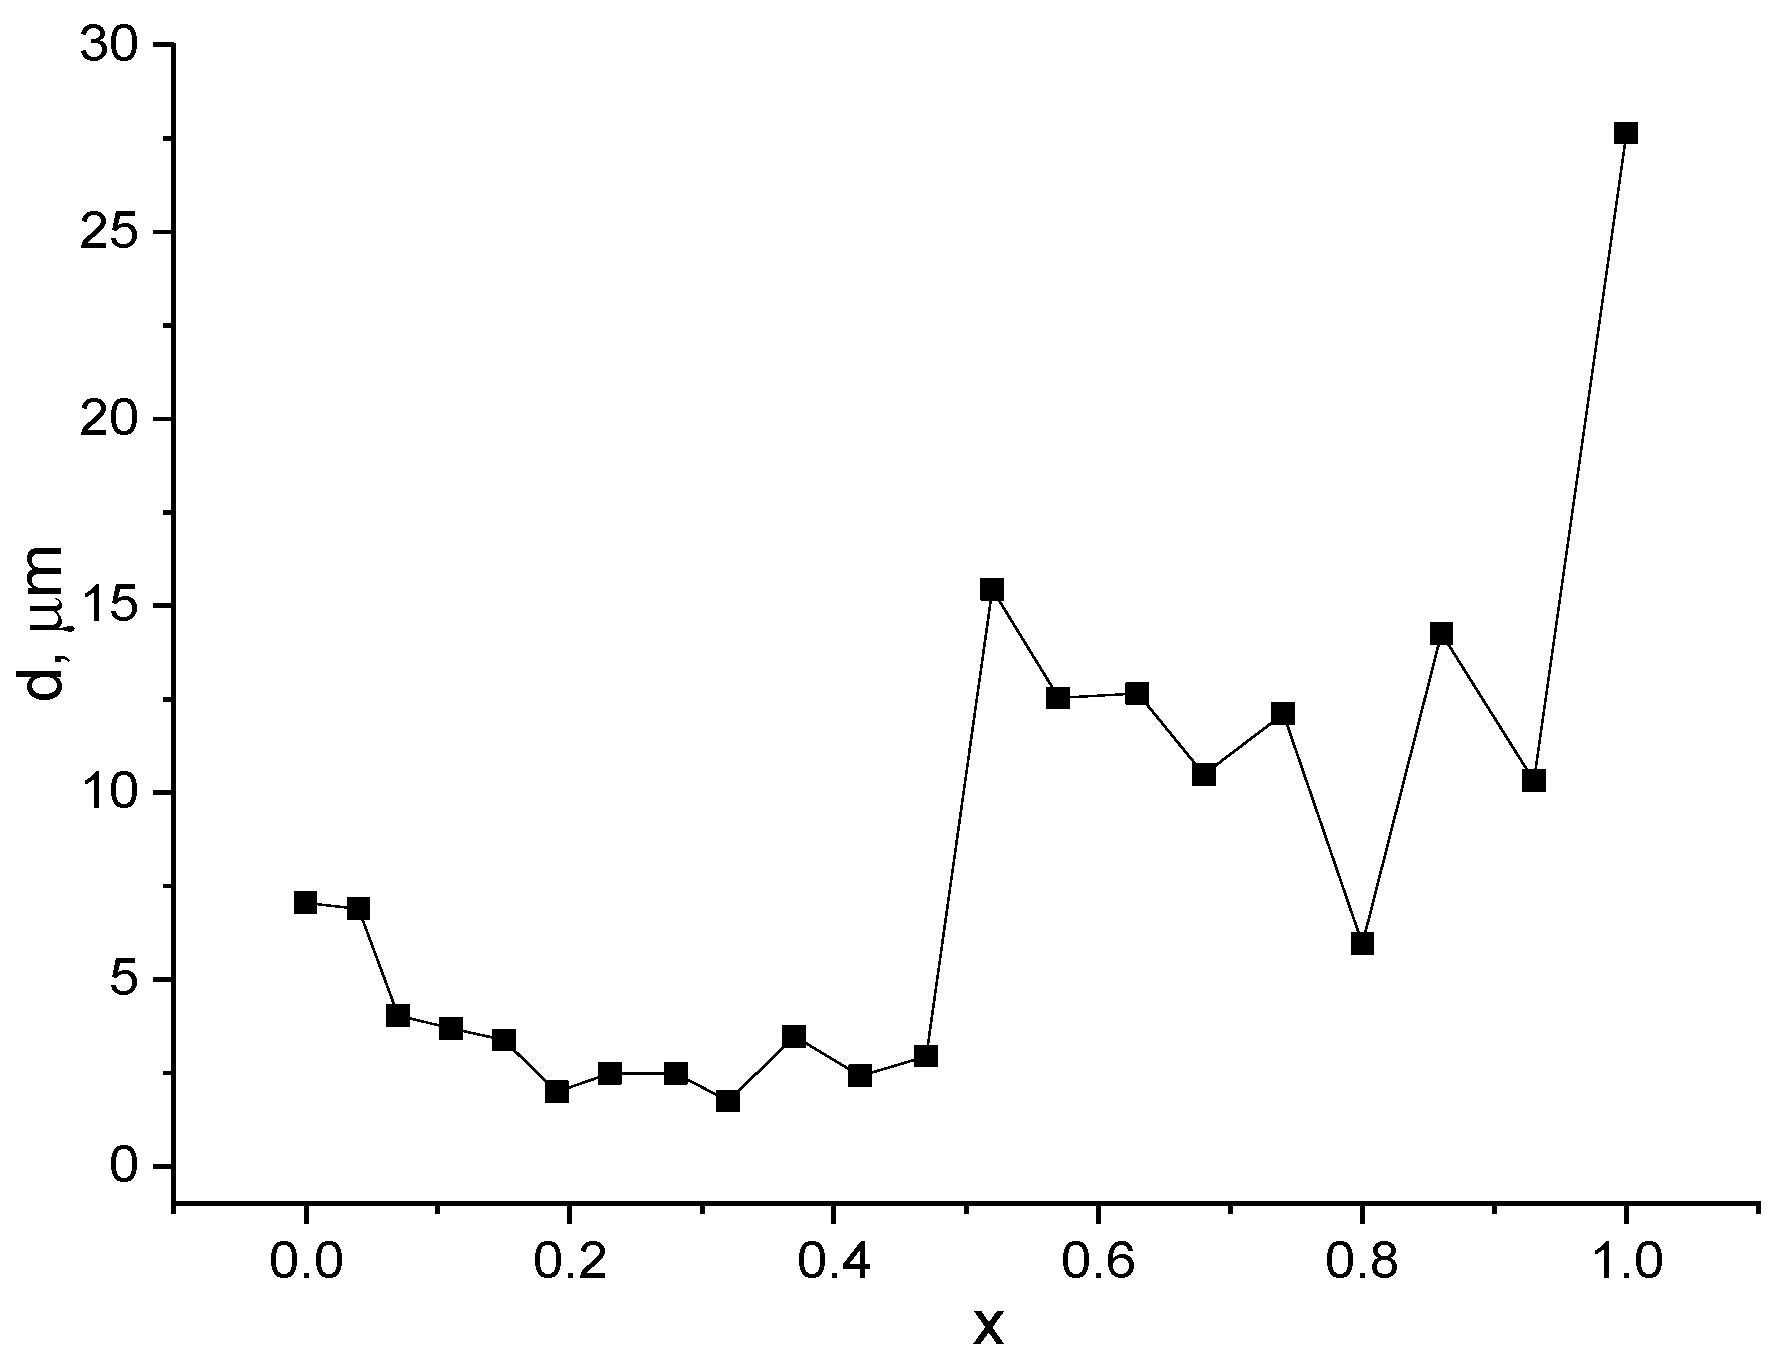
From the obtained SEM images, the average grain size d was calculated for each sample by using the intercept line method and ImageJ 1.54g software [
24]. The results of the calculation are shown in
Figure 8. As can be seen from the graph for the ceramics with high CeO
2 concentrations, the values of d were between 10 and 28 μm. When x decreased, a sharp drop to ~2 μm at a value of x = 0.55 was observed.
The frequency dependences of dielectric permittivity and loss tangent of some samples are shown in
Figure 9. It was observed that for ceramics with a high content of CeO
2 in the initial mixture, their electrical properties (permittivity, tangent loss values) varied greatly for samples with identical compositions. We believe that during the sintering process, some oxygen vacancies can unpredictably occur, leading to a decrease in the valence of the Ce cation from 4+ to 3+. This feature can change the electrical properties because of the increasing conductivity of the electron hopping mechanism (the formation of small polarons) [
25]. For further research, we chose samples with the highest measured AC resistivity for each composition. It can be seen from the graph in
Figure 9a that for high-content CeO
2 ceramics, a low-frequency tail occurred in the ε’(f) spectra.
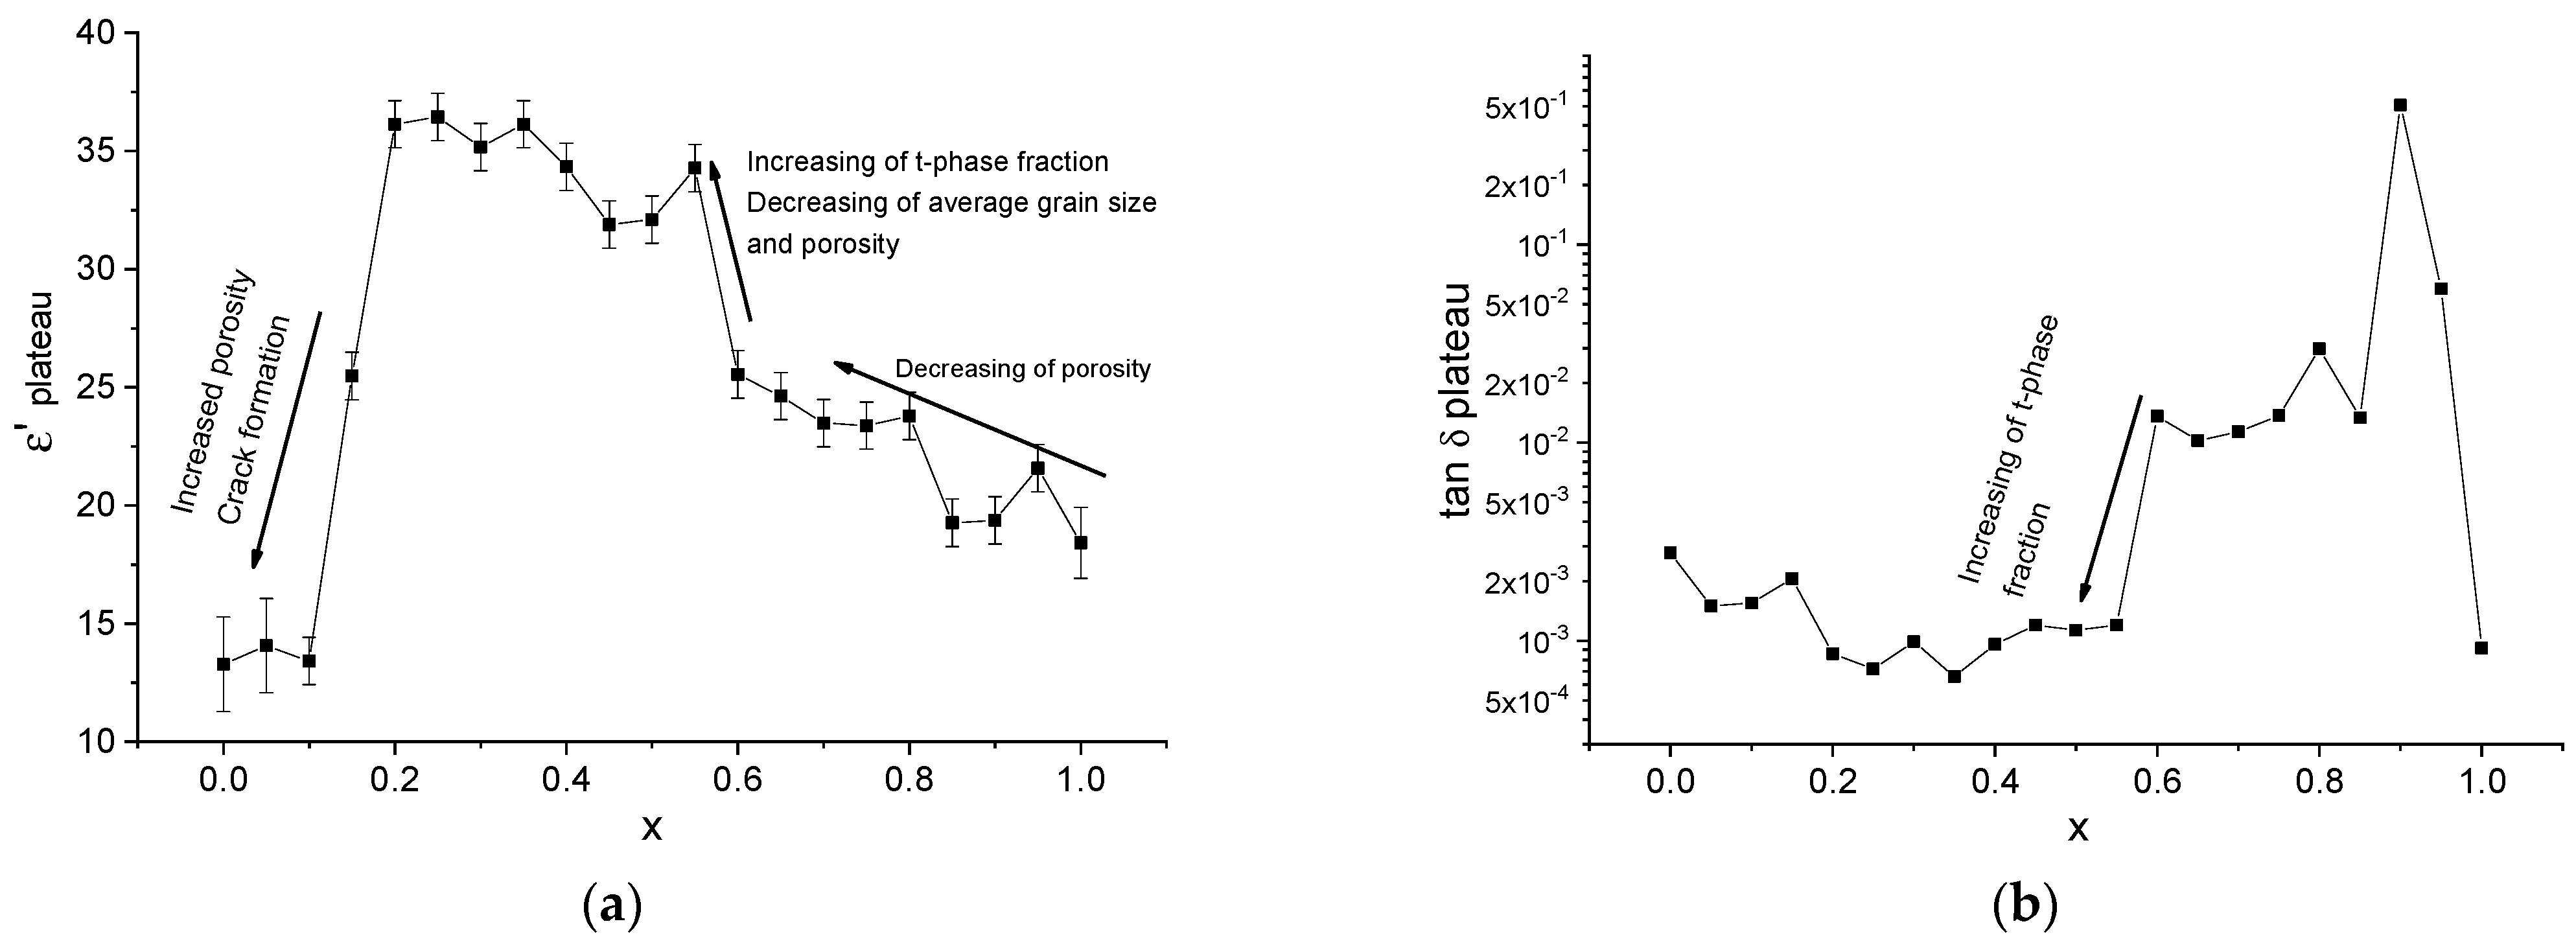
To understand how the composition of sintered ceramics influences their dielectric properties, the dependencies of ε’(x) and tan δ(x) in the plateau region, where changes in the dielectric parameter with frequency are small, were plotted. In the case of conductive samples, the tan δ value used for comparison was taken from the middle of the plateau region, which is shown in
Figure 9b. As can be seen from the graph in
Figure 10a, the dielectric permittivity of zirconia was low because of cracks and its high porosity. From the tan δ (x) dependence (
Figure 10b), it can be seen that a pronounced rise in the loss value in the plateau region occurred when x = 0.6. When the CeO
2 content decreased to close to this concentration, the formation of high-content tetragonal ceramic was observed.
Figure 11a shows the results of the microhardness measurements using the Vickers method at a force of 0.2 kgf for the synthesized ceramics. The microhardness measurements were performed on unpolished surfaces to avoid the influence of tooling on the mechanical properties of the zirconia–ceria ceramics (
Figure 11b).
4. Discussion
The pronounced dependence of shrinkage on ceria content can be explained with phase transitions which occur in the ceramics during sintering. For samples with x = 0–0.15 (
Figure 1), long cracks on the surface of tablets were observed, which indicated the high porosity of these ceramics. The possible reasons for the increasing volumetric shrinkage in high-content ZrO
2 ceramics are significant volume changes during the m → t transition and low porosity [
26].
As it was shown in Results section phase, transitions from monoclinic zirconia and cubic ceria were analyzed by XRD and Raman spectroscopy (
Figure 2 and
Figure 4). Both the XRD technique and Raman spectroscopy indicated the formation of FSZ ceramics with a tetragonal structure at x = 0.2 and 0.25. The range of PSZ zirconia formation also was observed. The main feature of the measured XRD patterns was the shift of peaks in the cubic phase to higher 2θ angles with decreasing x values. This feature indicates a decreasing interplanar distance in the cubic crystal lattice and, consequently, a decreasing lattice parameter. The decreasing of the lattice parameter occurs due to the difference between the Ce
4+ and Zr
4+ ionic radii (0.97 Å vs. 0.84 Å, respectively). When smaller Zr
4+ cations substitute for Ce
4+, the cubic lattice retains its structure but the interplanar distances are reduced, forming a substitutional solid solution. The occurrence of tetragonal phases in the sintered ceramics indicates the limit of substitution and the formation of two-phased c + t ceramics.
The completion of a solid-phase chemical reaction depends on mixture homogeneity, particle size, and the sintering conditions. From a technological point of view, it is very important to achieve certain parameters after sintering which sometimes do not require ideal homogeneity or completion of solid-phase reactions between components. The relatively low temperature of sintering could be the reason for incomplete chemical reactions. This feature can be seen from the phase analysis which was conducted on the XRD patterns. The chemical compositions of the ceria–zirconia ceramics were significantly different from experimental ones. Nevertheless, considering the conditions used in this work, some interesting observations can be pointed out. According to the chemical formulas of phases in the PDF database, the solubility limit of Zr
4+ in the CeO
2 cubic lattice is 0.4–0.5. This limit occurred at a mass concentration of CeO
2 of 0.6. With further decreases in x, tetragonal phases (Zr
0.
88Ce
0.
12)O
2 and (Zr
0.
85Ce
0.
15)O
2 were formed, and for x = 0.25 and 0.2, pure tetragonal zirconia phases were observed. Another thing that can be pointed out from
Table 1 is that for tetragonal phases in mixed-phase ceramics, no significant change in lattice parameters was found. It can be concluded that with a decline in the value of x, different processes and mechanisms of phase formation can be distinguished. The first one was the substitution in cubic ceria of Ce
4+ with Zr
4+, which stopped after reaching the solubility limit when x reached 0.6. Then, the formation of mixed two-phased ceramics (c + t) with increasing concentrations of tetragonal phase can be observed. In this case, the mechanisms of phase substitution of CeO
2 with zirconium and substitution of ZrO
2 with cerium come into play. Increasing the amount of zirconia did not lead to further substitution in the tetragonal lattice, but to an increase in the t-phase amount. Another explanation is, as was mentioned before, pure tetragonal zirconia formation at x = 0.25 and 0.20 (
Figure 3b). In the final process, substituted monoclinic zirconia was formed. All these processes have been well studied, but some explanation needs to be given. As it is known, from phase diagrams, there is a wide range of concentrations where c + t or t phases can be formed, but different studies gave conflicting results. In our study, we provide the refined composition between the m, c, and t phases for the CeO
2-ZrO
2 system, which has been obtained by using charge from micron-sized powders. According to our experiments, the clear boundaries of the m, t, and c phases at room temperature can be distinguished, and the results of [
11,
12] can be elaborated.
The analysis of the cross-sectional SEM images of all of the samples revealed that variations in CeO2 content in the CeO2-ZrO2 system have a great effect on the microstructure and morphology of the sintered ceramics. When the ceramics completely consisted of the cubic phase (pure ceria or doped ceria), it was found that the morphology of the fractured surfaces included large grains with pronounced grain boundaries and intergranular pores. In tetragonal FSZ ceramics, a small-grain, pore-free structure was observed. For mixed-phase samples, the morphology was represented by polygonal grains with a wide size range together with feather-like grains. The SEM micrographs at low x values (domination of the monoclinic zirconia phase) showed that the microstructure of these ceramics contains intergranular cracks and pores.
The behavior of the mean grain size vs. concentration curve can be associated with a phase composition change when a high amount (more than 50%) of the tetragonal phase is formed in mixed-phase samples. For pure CeO
2 and doped CeO
2 ceramics, exaggerated grain growth was possible because of the high concentration of oxygen vacancies. These vacancies can be formed because of the multivalent nature of Ce ions (Ce
3+, Ce
4+) [
25,
27]. To maintain electronic balance in the crystal lattice, some anions should leave the structure during heating. In this case, mass transport during sintering is high because of point defect migration in the crystal lattice. When the zirconia content in the initial charge increases, the process of exaggerated grain growth is located only in cubic phases or totally disappears, resulting in a smaller grain size. It was observed that the tetragonal zirconia phase did not show a tendency to form large grains. A possible reason for this is that CeO
2 acts like a grain growth inhibitor for zirconia. Some papers clearly state that stabilization additives hinder grain growth by accumulating in the grain boundary area [
28,
29]. Nevertheless, this effect is more pronounced in the case of high-content zirconia ceramics because a sharp drop in the average grain size value for doped CeO
2 with ZrO
2 was not observed.
It is known that for small-grain ceramics, the possibility of pore formation is lower because, during sintering, pores can migrate through grain boundaries to the surface [
5]. Also, in large grain-size ceramics, the granular pore concentration could be higher than in small grain-size ceramics. So, the main reason for the low porosity of FSZ ceramics (x = 0.20–0.25) is explained by the formation of a small-grain tetragonal phase. In addition, as previously mentioned, the decrease in volumetric shrinkage may be caused by the growth of large grains.
High ceria content ceramics demonstrate a very pronounced frequency dispersion of permittivity. This feature is described by the Maxwell–Wagner polarization phenomenon, where polarization occurs at the conductive grain/high resistance grain boundary interface [
30]. The spectra become similar to that of Debye relaxation, but with hidden maxima at very low frequencies. The tangent loss frequency dependencies also showed pronounced dispersion throughout the whole measured range. This feature can be explained by the relatively high conductivity of ceramics [
3]. If a metal oxide consists of multivalence cations, its conductivity becomes higher due to the hopping electron mechanism [
31]. Because of the high conduction, the dielectric losses increased, similar to joule losses in conductors.
For ceramics with tetragonal zirconia phase dominance, no pronounced frequency dispersion in the ε’(f) spectra was observed. The dielectric loss frequency spectra showed that there was a small dispersion in the low-frequency region. As can be seen from
Figure 8, the low frequency region of the tan δ (f) curves for samples with x = 0.2–0.5 showed large measurement errors, but in the frequency range of 400–50 000 Hz, the values of the losses became 0.001 or lower. This fact demonstrates the high dielectric quality factor of high-content tetragonal zirconia ceramics.
With the increase in CeO
2 concentration in ZrO
2 (samples with x = 0.00–0.20), the values of the dielectric permittivity increased significantly because of the low porosity and tetragonal phase formation (
Figure 10a). This last feature contributes to the increase in permittivity value because of the smaller lattice volume. According to the Clausius–Mossotti equation, a higher bond iconicity and lower crystal unit cell volume result in increased dielectric permittivity in oxide ceramics [
32]. Also, it is known that substitution of Ce
4+ with Zr
4+ can increase permittivity values [
33,
34,
35,
36]. The fluctuations in permittivity values can be associated with inhomogeneity of the phase composition which occurred because of complete solid-phase reactions. With further increases in x, the value of the dielectric permittivity became lower due to the high porosity and formation of cubic zirconia and ceria phases, which have a higher crystal unit cell volume.
It can be concluded that ceria ceramics doped with Zr4+ exhibited high losses because of the Maxwell–Wagner relaxation mechanism and electron hopping. Low losses in the pure ceria ceramics can be explained by a stable structure with no Ce3+ cation formation.
The mechanical characteristics of the obtained ceramics were analyzed by performing microhardness measurements. The ceramics with a predominance of the cubic phase of fluorite showed lower microhardness values (1.5–2.0 times less than those of ceramics with a tetragonal structure), which are associated with the internal properties of the material. However, an increase in the microhardness value in the concentration range of x = 0.8–1.0 was associated with an increase in density, shrinkage, and a decrease in porosity (
Figure 3a and
Figure 11a). It is known that the formation of pores in ceramics significantly reduces its hardness due to the fact that pores are concentrators of stress propagation, in which, the probability of destruction increases significantly [
37,
38]. A sharp increase in the microhardness value is associated with the formation of the tetragonal ZrO
2-t phase in the ceramic composition. The high hardness of the tetragonal phase is associated with phase transformation hardening, in which, the formation of cracks is accompanied by the t → m transition [
9]. With this strengthening mechanism, it is believed that the compressive stress created by a volumetric expansion of 4-5% in the crack formation zone reduces the intensity of its stress at the tip. In this case, the propagation of the crack stops, which generally increases the impact strength and hardness of the material. From the graph in
Figure 10a, it can be observed that at values of x = 0.3–0.6, the value of microhardness HV0.2 was in the range of 1200–1450 and increased to a maximum of 1500 at x = 0.25, when a completely tetragonal phase was formed in the ceramic. A further decrease in microhardness was associated with an increase in porosity due to the low CeO
2 content in the initial charge. This demonstrates that stabilization of the t-phase during cooling is impossible and macrocracks form in the samples due to the t → m transition. Also, it is worth noting that the synthesized tetragonal ZrO
2-CeO
2 ceramics did not form cracks after indentation. The example of the indentation mark in the sample with x = 0.25 in
Figure 11b clearly shows the absence of crack formation after mechanical load. This indicates a high fracture toughness for the resulting ceramics.
From the obtained results, it can be seen that the synthesized ZrO2-CeO2 ceramics exhibited good mechanical properties, which resulted from the high content of the t-phase. Both zirconia and ceria have a small neutron cross-sections and good thermal conductivity. These features are highly in demand for oxides, which can be used as a matrix for dispersive nuclear fuels. The significant change in tan δ values with increasing x indicates a change in ionic and electron conductivity σ. It is known that in dielectric materials, tan δ ~ σ/(f∙ε), which means that ceramics with a higher loss value possess a higher ionic conductivity. This fact can be very important in the design of materials for oxide fuel cells, where oxygen ion conductivity is a key factor for cell operation. Further research on radiation resistance and high thermal ionic conductivity should be performed to clearly define the applicability of the obtained ceramics in dispersive fuels or oxide fuel cells, but even at this point, the results of the work are promising.


 ,
, 


