Abstract
To investigate the dynamic response of fractured rock under cyclic loading and unloading, a WHY-300/10 microcomputer-controlled electro-hydraulic servo universal testing machine was used to conduct uniaxial cyclic loading and unloading tests. Simultaneously, acoustic emission (AE) and a CCD high-speed camera were employed to monitor the fracturing characteristics of sandstone. The mechanical properties, energy evolution, AE characteristics, and deformation of 45° sandstone were analyzed. The results indicate that as the load cycle level increases, both the elastic modulus and deformation modulus exhibit a “parabolic” increase, with a rapid rise initially and a slower rate of increase later. The damping ratio generally shows a decreasing trend but tends to rise near the peak load. The total energy, elastic energy, dissipated energy, damping energy, and damage energy all follow exponential function increases with the load level. The b-value fluctuates significantly during the stable crack propagation phase, unstable crack propagation phase, and peak phase. When the FR (Felicity ratio > 1), the rock is relatively stable; when the FR (Felicity ratio < 1), the rock gradually extends towards an unstable state. The Felicity ratio can be used as a predictive tool for the precursors of rock failure. Shear fractures dominate during the compaction and peak phases, while tensile fractures dominate during the crack propagation phase, ultimately leading to a failure characterized by tensile fracture. High-speed camera observations revealed that deformation first occurs at the tips of the prefabricated cracks and gradually spreads and deflects toward the ends of the sandstone. This study provides theoretical support for exploring the mechanical behavior and mechanisms of fractured rock under cyclic loading and unloading, and it has significant practical implications.
1. Introduction
Mining cavern excavation and support, large-scale rock slope excavation and support, and the repeated passage of vehicles through bridges and tunnels are all rock engineering activities that are subjected to cyclic and repetitive loads [1,2,3]. This type of cyclic loading can lead to fatigue damage and even fracture in structures, and unlike uniaxial compressive loads, it has a more severe impact on material deformation and failure. Therefore, it is necessary to conduct an in-depth analysis of the deformation and failure response processes of rocks under cyclic loading and unloading [4,5].
Currently, many scholars primarily use indoor experiments to study the mechanical properties of rocks under cyclic loading and unloading. Li, X. et al. [6] conducted cyclic loading and unloading three-point bending tests on granite notched beams to analyze the fracture characteristics of granite. The study found that the fracture toughness of granite under cyclic loading and unloading is lower than that under static loading. Zhou, J. et al. [7] performed uniaxial cyclic loading and unloading tests on brittle rocks, and the results showed that the Poisson’s ratio of brittle rocks gradually increases, while the elastic modulus increases after the first cycle and then slowly decreases. Once the crack propagation stage is reached, the degree of damage increases rapidly. Li, J. et al. [8] found that the axial deformation of sandstone under uniaxial cyclic loading and unloading presents three stages: initially, the strain is very small but grows rapidly; in the stable stage, the strain grows gradually; and in the failure stage, the strain increases rapidly. The hysteresis loop density of these three stages shows a sparse-dense-sparse pattern, and the shape of individual hysteresis loops follows a fat-thin-fat development trend. Shi, Z. et al. [9], Erarslan, N. et al. [10,11], and Fan, J. [12], based on the LURR (Load-Unload-Reloading) theory, studied the mechanical properties and mechanism evolution of sandstone under different loading and unloading conditions (MCT, FCT), suggesting that under the FCT stress path, the macroscopic structure of the specimen is dominated by large particles and the friction dislocation phenomena between particles are weakened. Currently, for cyclic loading and unloading tests, most scholars use acoustic emission (AE) and digital image correlation (DIC) technologies to monitor the entire change process of rocks under loading. Meng, Q. et al. [13] and Zhao, K. et al. [14] studied the Kaiser and Felicity effects of AE activity and discussed the impact of a significant increase in AE events on these effects. The research found that when the Felicity ratio is less than 1, AE activity is intense and the rock is in an unstable state, which is known as the Felicity effect. Conversely, when the Felicity ratio is greater than 1, the rock is in a stable state, and this phenomenon is called the Kaiser effect. This point can be used as a precursor for predicting rock failure. Tang, J. et al. [15] found that under cyclic loading and unloading, the AE characteristics of rock fracture show a clear Kaiser effect, and the Felicity effect is significantly observed when the loading force reaches 70% of the peak value. The b-value is commonly used, based on AE, to predict the precursors of rock failure, and a significant increase or decrease in the b-value suggests that the rock may have a large number of cracks or is about to become unstable and fail [16,17,18]. Under low stress conditions, b-value activity is weak and almost imperceptible, while under high stress states, b-value activity is intense. The b-value method is more effective than the Felicity effect in predicting rock failure [19,20]. AE is used to classify and calculate the proportion of crack types. Wang, Y. et al. [21] combined real-time AE monitoring and computed tomography (CT) to study the anisotropic crack propagation and classification of crack types in laminated marble. Lv, H. et al. [22] and Xie, H. et al. [23] believe that the proportion and number of crack types are greatly affected by the strength of the rock and verified the feasibility of the RA-AF qualitative evaluation model for the evolution of rock fracture types under cyclic loading. The evolution of rock damage under cyclic loading and unloading is often difficult to express, and the energy dissipation theory is further used to reveal the damage evolution mechanism under cyclic loading and unloading. Wang, Z. et al. [24] compared the energy dissipation of graded cyclic loading and unloading and variable lower limit cyclic loading. The study found that the elastic energy, dissipated energy, and total energy of the rock are positively correlated with the number of cycles, and under the variable lower limit cyclic loading and unloading path, rock failure is more severe. Gong, F. et al. [25] established a brittle rock damage variable defined by the ratio of dissipated strain energy to the total strain energy and derived new damage variable characteristics, including the compression energy dissipation coefficient and strain energy parameters. Li, J. et al. [26] found that the dissipated energy shows a fast-stable-fast-slow-fast growth trend, while the elastic energy index shows a trend of significant increase-stable-increase-decrease. Meng, Q. et al. [27] found that the energy density of the rock increases nonlinearly with the increase in axial stress, gradually increasing first and then rapidly increasing.
From the current research status on the strength characteristics of rocks under cyclic loading and unloading, as mentioned above, it is evident that studying the deterioration mechanisms of rocks under cyclic loading and unloading is a highly significant topic [28,29]. Currently, the mechanical characteristics of rock are primarily assessed through uniaxial compression tests, while there is a lack of research on cyclic loading and unloading tests for rock. Many scholars focus solely on analyzing the mechanical properties of rock, with less attention given to the precursors of rock failure and deformation monitoring analysis. This experiment employs AE (acoustic emission) and DIC (digital image correlation) to monitor the changes in AE signals and deformation of the rock under loading from multiple perspectives and analyzes from various angles, including the b-value of acoustic emissions and the Felicity effect. This study, integrating acoustic emission (AE), digital image correlation (DIC) techniques, rock mechanics, and fracture damage mechanics theories, primarily focuses on conducting uniaxial compressive strength tests under cyclic loading and unloading for sandstone with a 45° fracture inclination. The findings aim to provide guidance for related geotechnical and engineering construction projects. Cyclic loading and unloading tests can assess the mechanical behavior of sandstone in a simulated underground mining process, including its strength, deformation characteristics, and failure modes. The use of AE (acoustic emission) monitoring allows for a deeper understanding of the precursors of rock failure, and high-speed cameras are employed to further monitor the deformation of the rock. The cyclic loading and unloading tests provide response data for sandstone under different stress paths, which can be used to guide the design of mine support structures, such as selecting the appropriate type, size, and layout of support. Moreover, cyclic loading and unloading tests can help to identify potential signs of rock failure, providing a scientific basis for mine safety management and risk assessment.
2. Test Equipment and Test Methods
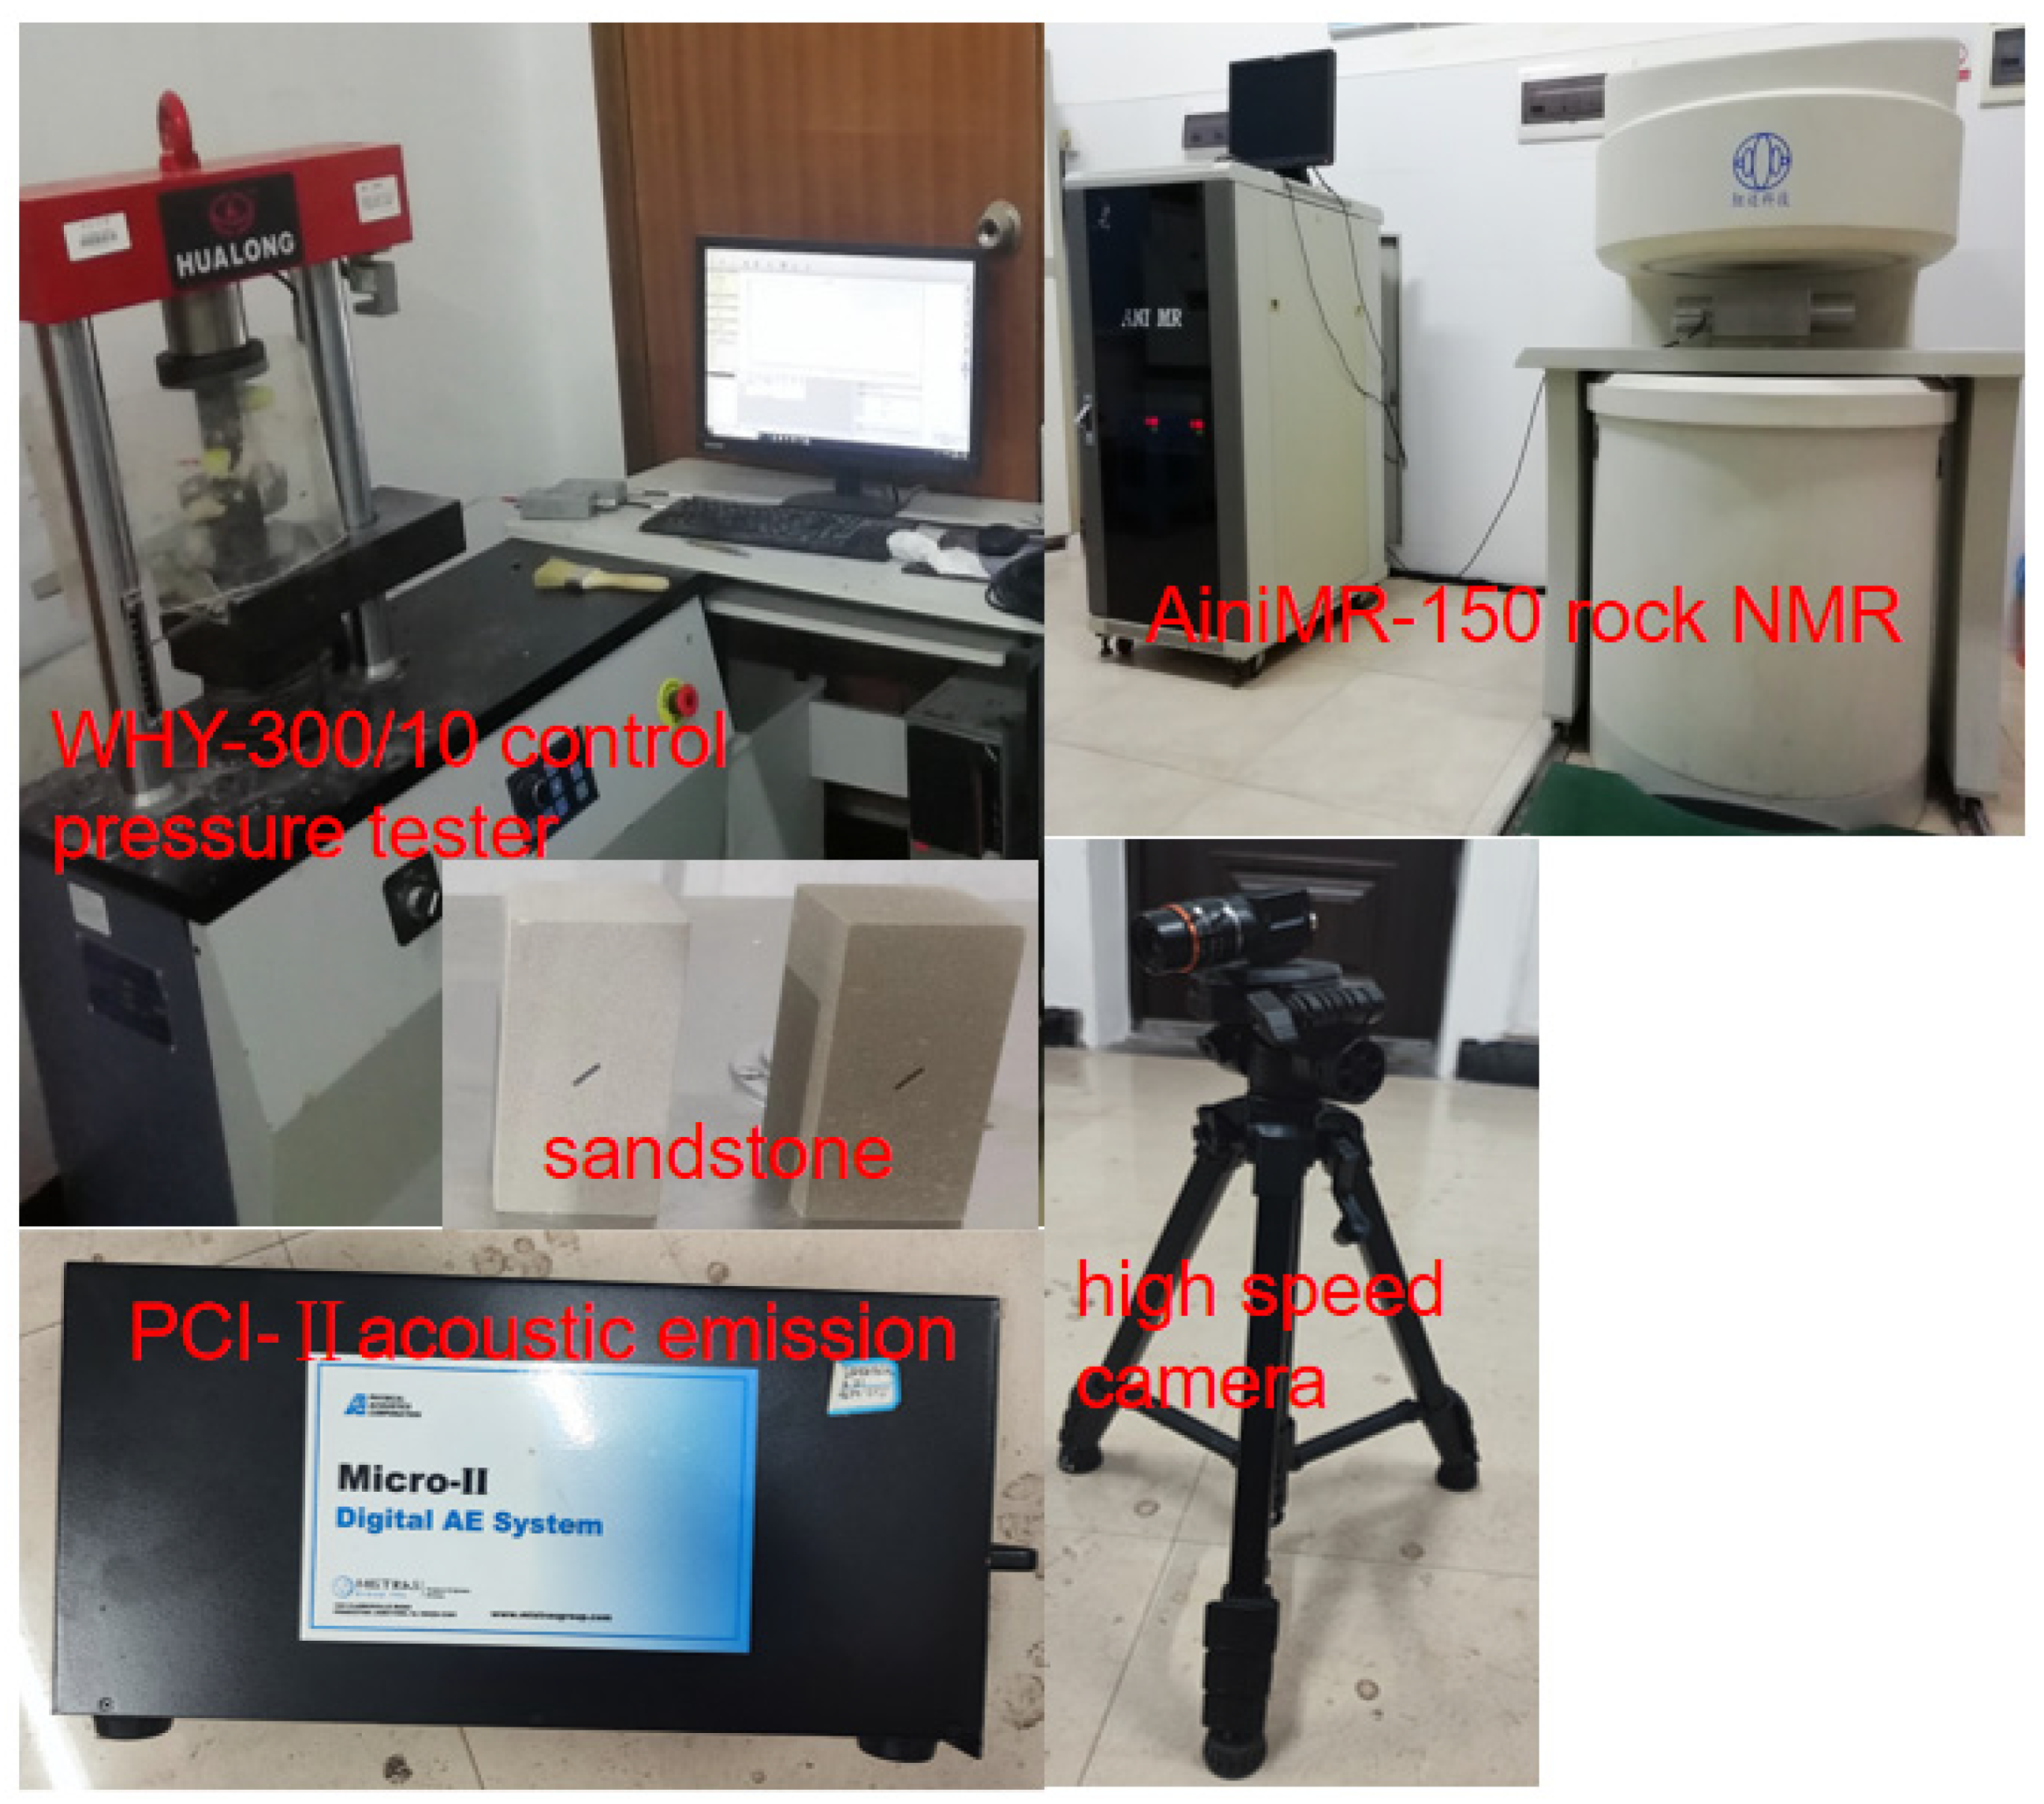
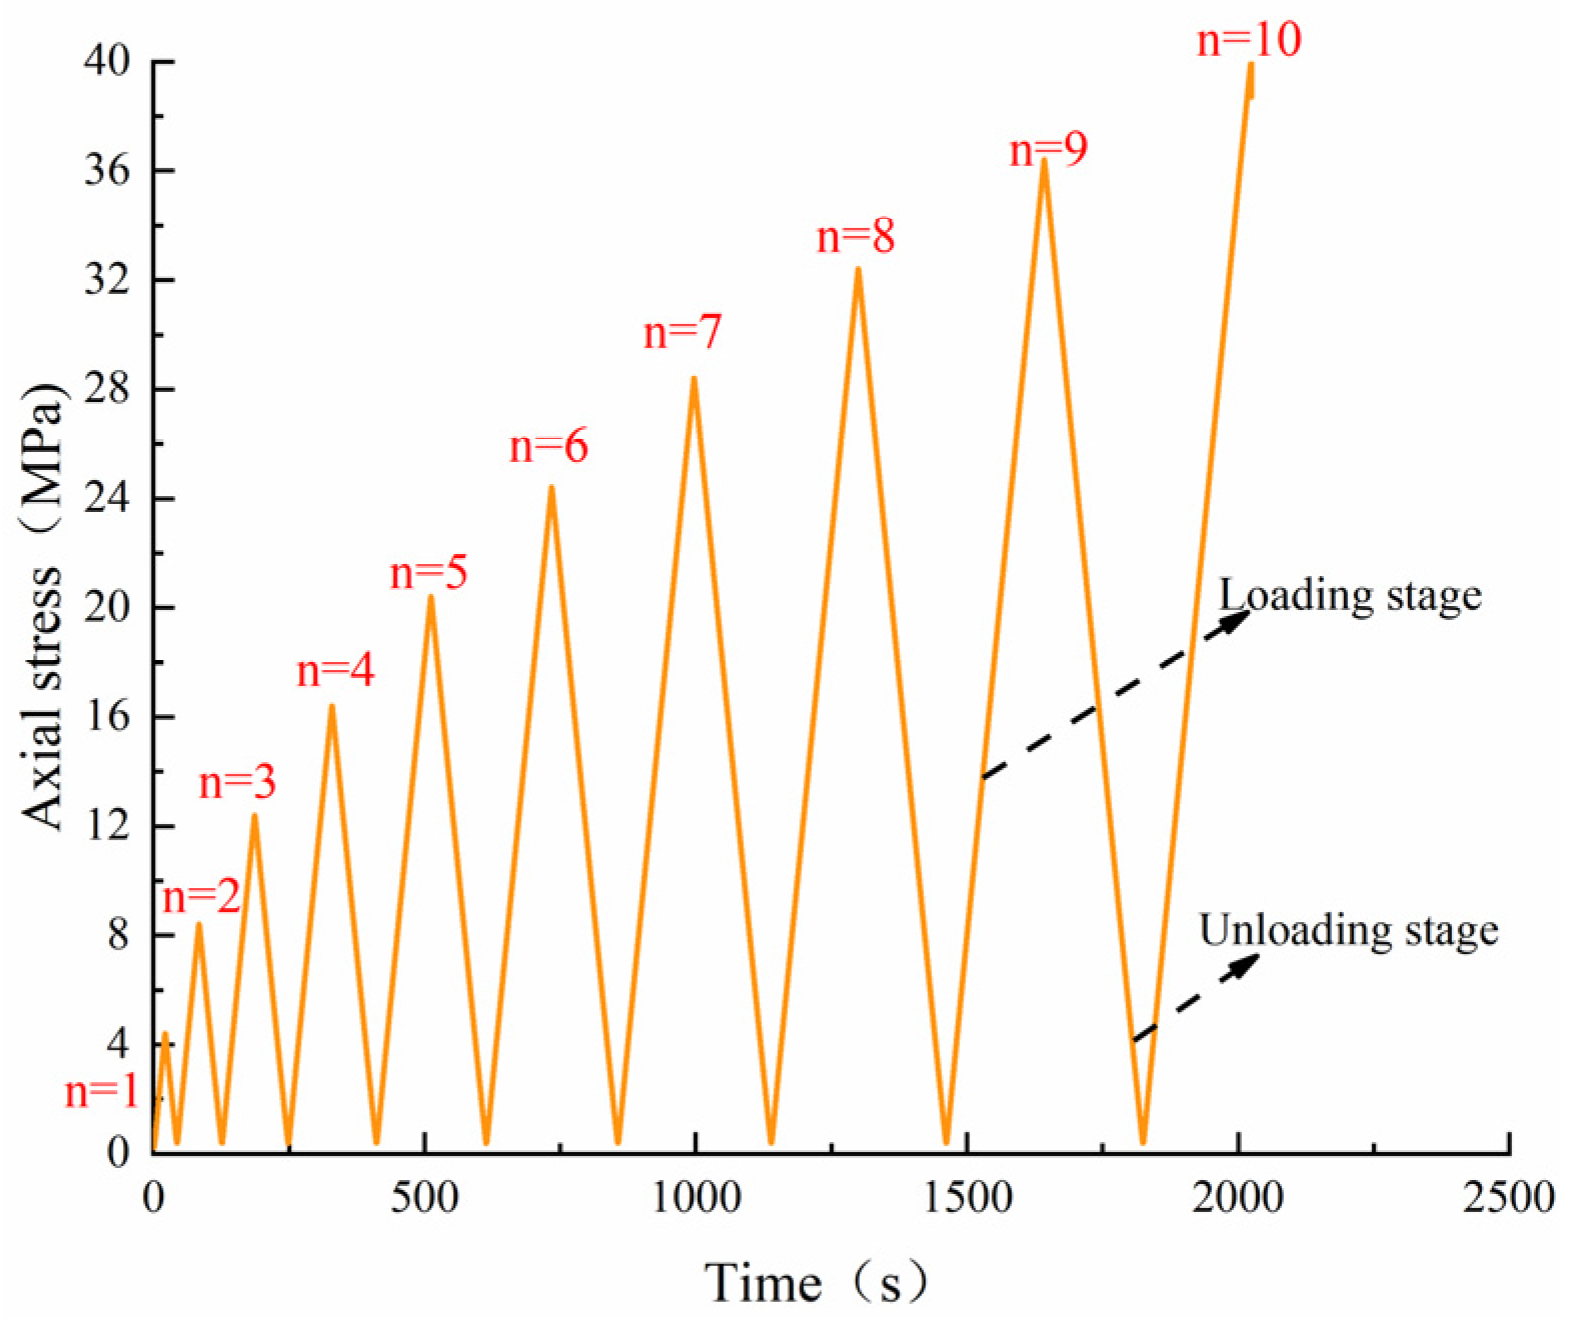
The use of square samples with a high-speed camera allows for better monitoring of sandstone deformation, as monitoring with circular samples does not effectively capture the formation of a two-dimensional planar deformation map. The study selected sandstone from a specific mine, which was processed into cubic specimens measuring 50 mm × 50 mm × 100 mm. A prefabricated fracture was created in the center of each specimen, with a length of 10 mm, a width of 2 mm, and an inclination angle of 45°. Rock porosity was measured using a rock AniMR-150 nuclear magnetic resonance (NMR) meter. The cyclic loading and unloading tests were conducted using a WHY-300/10 microcomputer-controlled electro-hydraulic servo universal testing machine. During the tests, the PCI-II Acoustic Emission (AE) system and a high-speed camera were used for monitoring. The experimental equipment is shown in Figure 1. The AE threshold was set at 40 dB, and the CCD camera could capture images at a maximum rate of 20 frames per second. The tests were controlled by force, with a loading rate of 0.5 kN/s. The loading sequence was as follows: 0 kN → 11 kN → 1 kN → 21 kN → 1 kN → 31 kN → 1 kN…, as depicted in Figure 2.

Figure 1.
Test flow chart.

Figure 2.
Schematic diagram of loading method.
3. Mechanical Parameters and Energy Evolution Characteristics
3.1. Mechanical Characteristics
The AniMR-150 nuclear magnetic resonance (NMR) meter was used to measure the porosity of sandstone. By detecting different NMR signals, it is possible to directly reflect the changes in the rock’s pore structure. The transverse relaxation rate (also known as the spin–spin or relaxation) in nuclear magnetic resonance can be expressed by the following formula:
where is the rock pore size; is the surface relaxation strength; is the transverse relaxation time (ms); is the pore surface area; is the pore volume; and is the core pore shape factor, which is usually constant and related to the pore shape.
Let . In this paper, , then Equation (1) becomes Equation (2) [30]:
In conjunction with the relevant literature, the pore size of sandstone can be divided into three intervals: microporous (), mesoporous () and macroporous () [30,31,32]. Based on Formula (2), it can be deduced that the transverse relaxation time spectrum ranges from 0 to 10 ms for microporous, from 10 to 100 ms for mesoporous, and above 100 ms for macroporous.
The data derived from the NMR instrument is shown in Figure 3. Figure 3a shows that the spectrum exhibits a three-peak pattern, where the first peak represents macroporous; the second peak represents mesoporous; and the third peak represents microporous. Between the relaxation times of 0 to 10 ms, the cumulative pore fraction rises slowly in the macroporous region. Between 10 to 100 ms, the curve rises more sharply and at a faster rate. In the relaxation time range of 100 to 10,000 ms, the curve rises slowly and eventually approaches a constant value, which represents the porosity of the sandstone. Figure 3b indicates the porosity of macroporous, mesoporous, and microporous pores, the total porosity, and the proportion of each type of pore. From the figure, it can be seen that the proportion of large pores is 0.451%, that of mesopores is 1.696%, that of micropores is 1.233%, and the total porosity is 3.38%. The mesoporous pores have the highest quantity and account for the largest proportion, representing 50.18% of the total porosity. Therefore, the sandstone contains the most mesoporous pores and the fewest macroporous pores.
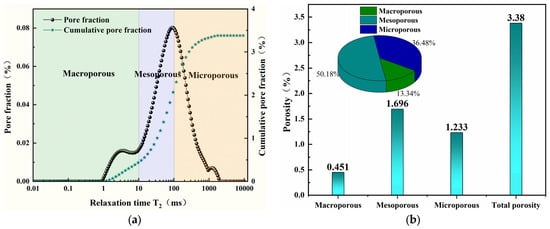
Figure 3.
Porosity analysis. (a) spectrum; (b) Pore category.
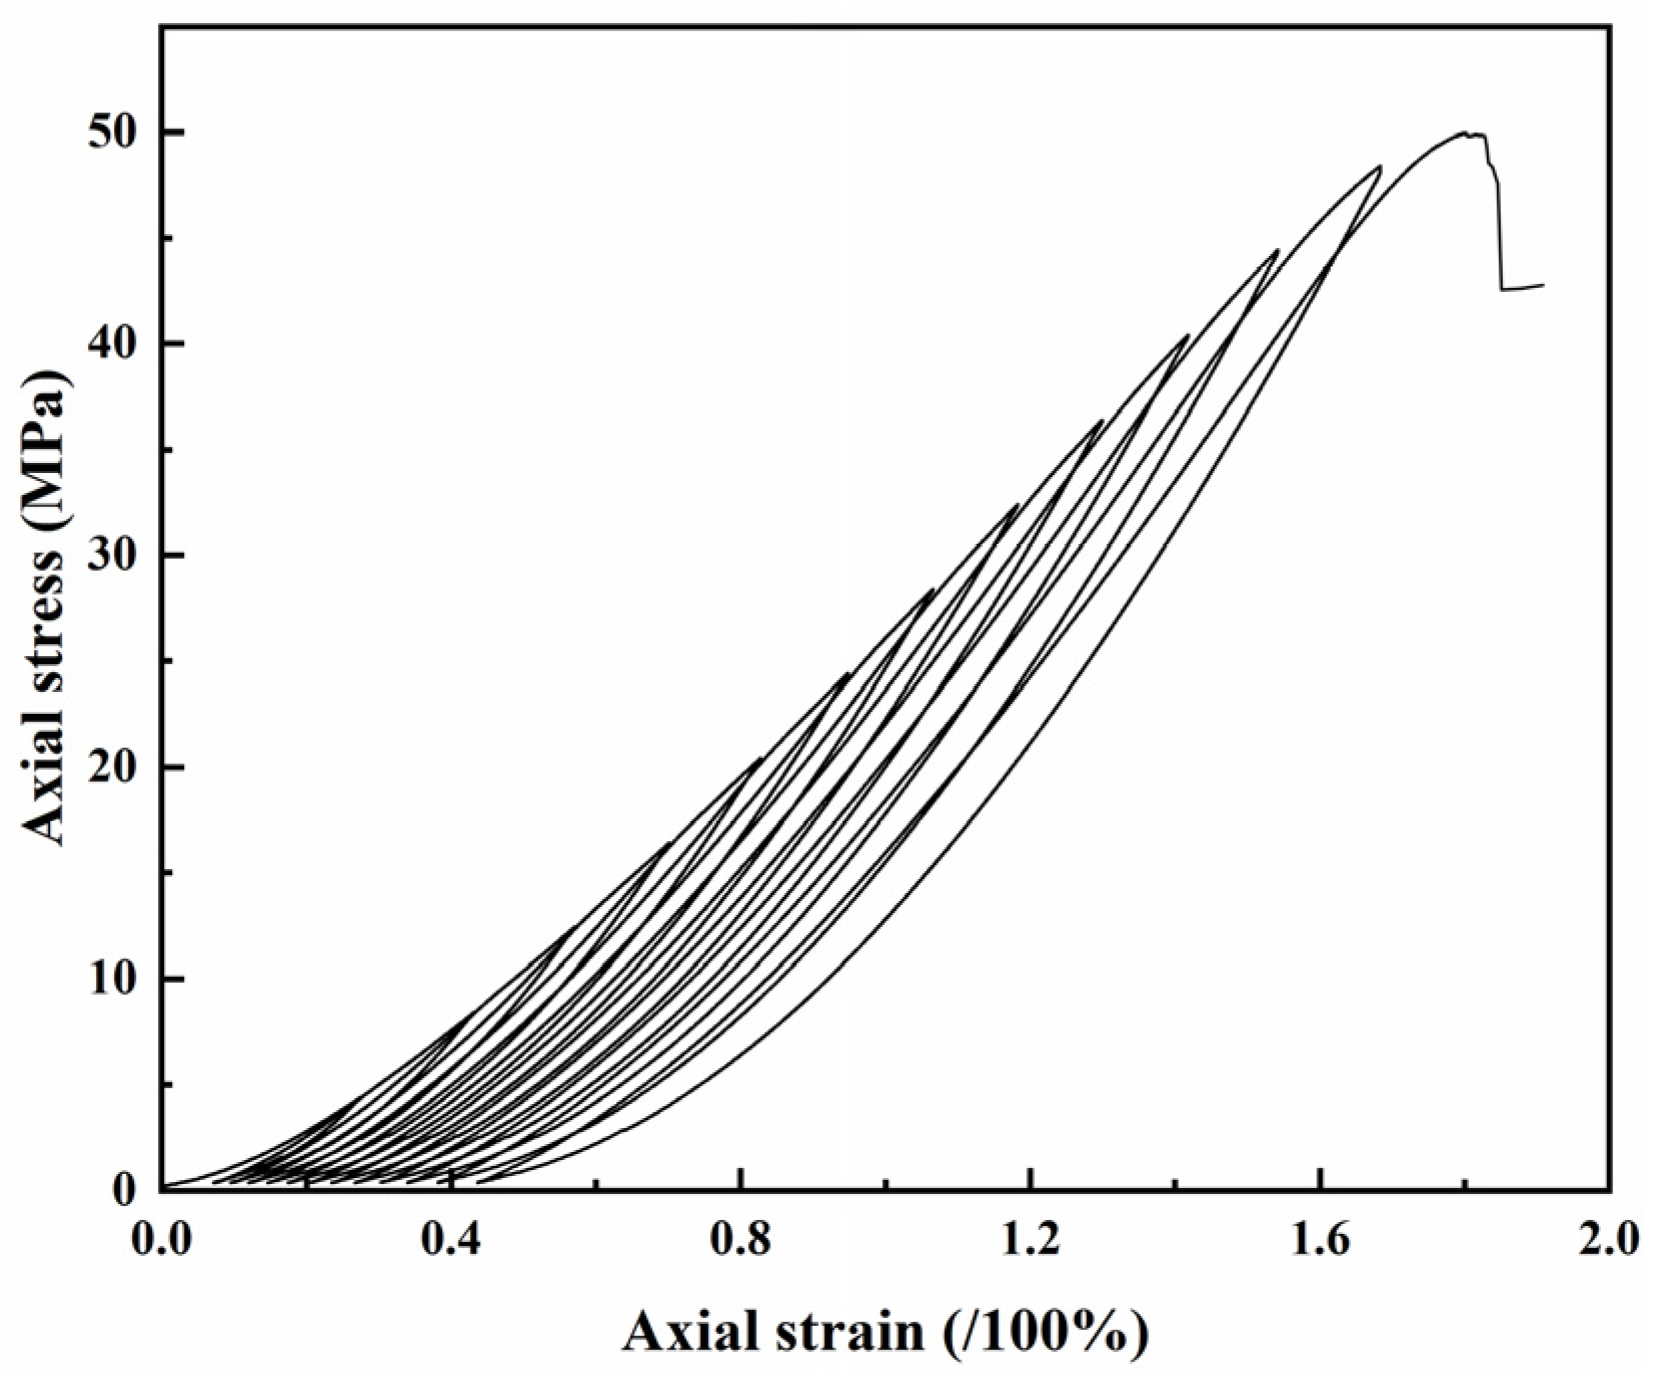
Figure 4 presents the stress–strain curve of the sandstone. The initial part of the curve is relatively dense, and as the loading progresses, the curve becomes more dispersed, exhibiting an overall pattern of “dense-sparse” variation. The research found that in the later stages of loading, the curve significantly deviates from the historical stress–strain curve. This deviation is attributed to the cumulative damage caused by fatigue loading, which leads to an increase in internal structural damage within the sandstone [33,34].
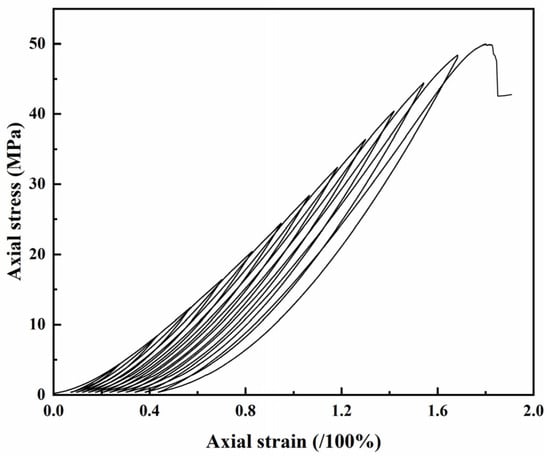
Figure 4.
Stress–strain curve.
Under cyclic loading and unloading, the stress–strain curve exhibits hysteresis loops, which reflect the damage and energy dissipation of the rock. To further analyze the mechanical properties of sandstone under cyclic loading and unloading, the hysteresis loop curve is used to calculate the elastic modulus, deformation modulus, and damping ratio, as follows:
where is the total strain in each stage; is the elastic strain in each stage; and is the plastic strain in each stage.
where is the elastic modulus at each stage; is the deformation modulus at each stage; and and are the maximum and minimum stresses at each stage, respectively.
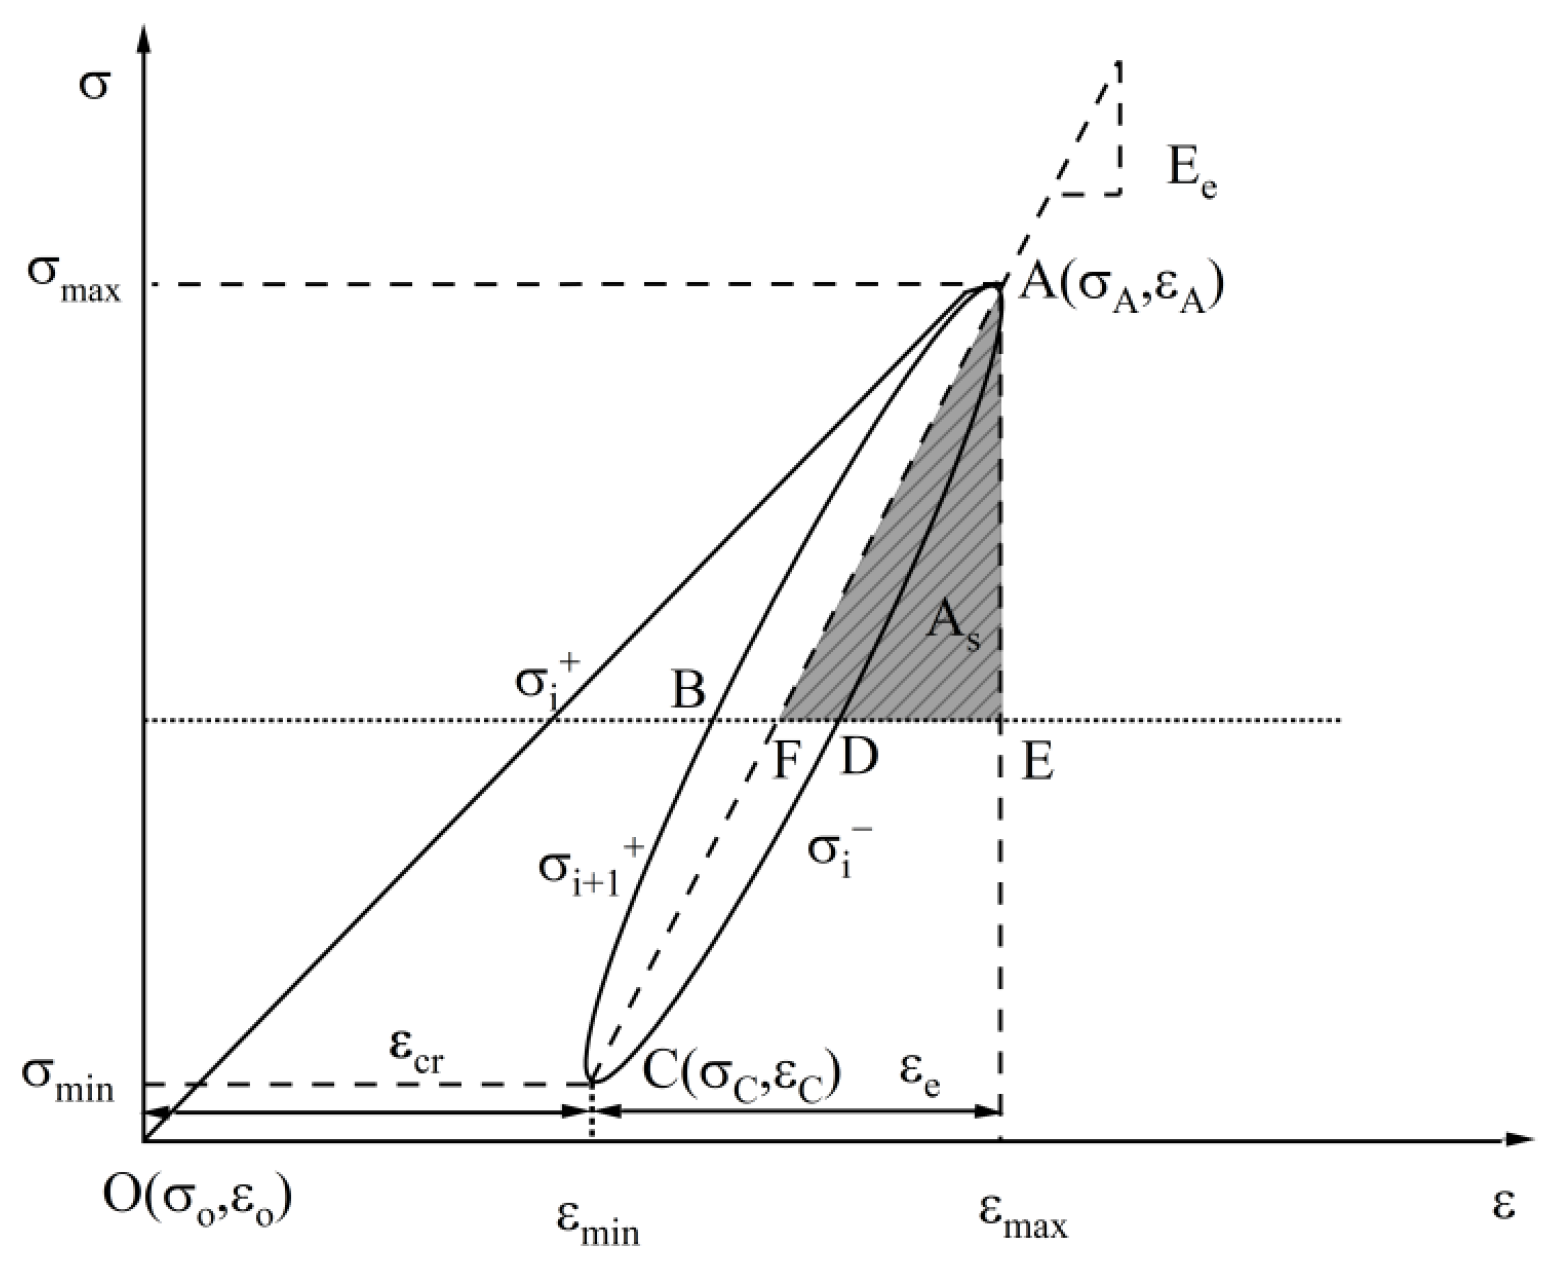
Figure 5 presents the stress–strain hysteresis curve, and the elastic modulus, deformation modulus, and damping ratio were calculated, respectively. Where is the damping ratio; is the area of the hysteresis circle ABCD (kJ/m3); and is the area of the triangle AEF (kJ/m3).
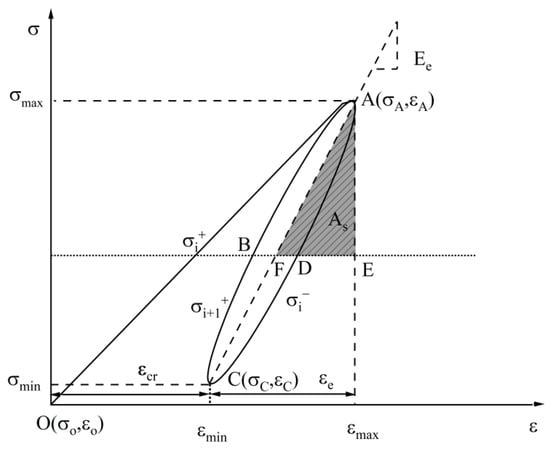
Figure 5.
Schematic diagram of hysteresis loop.
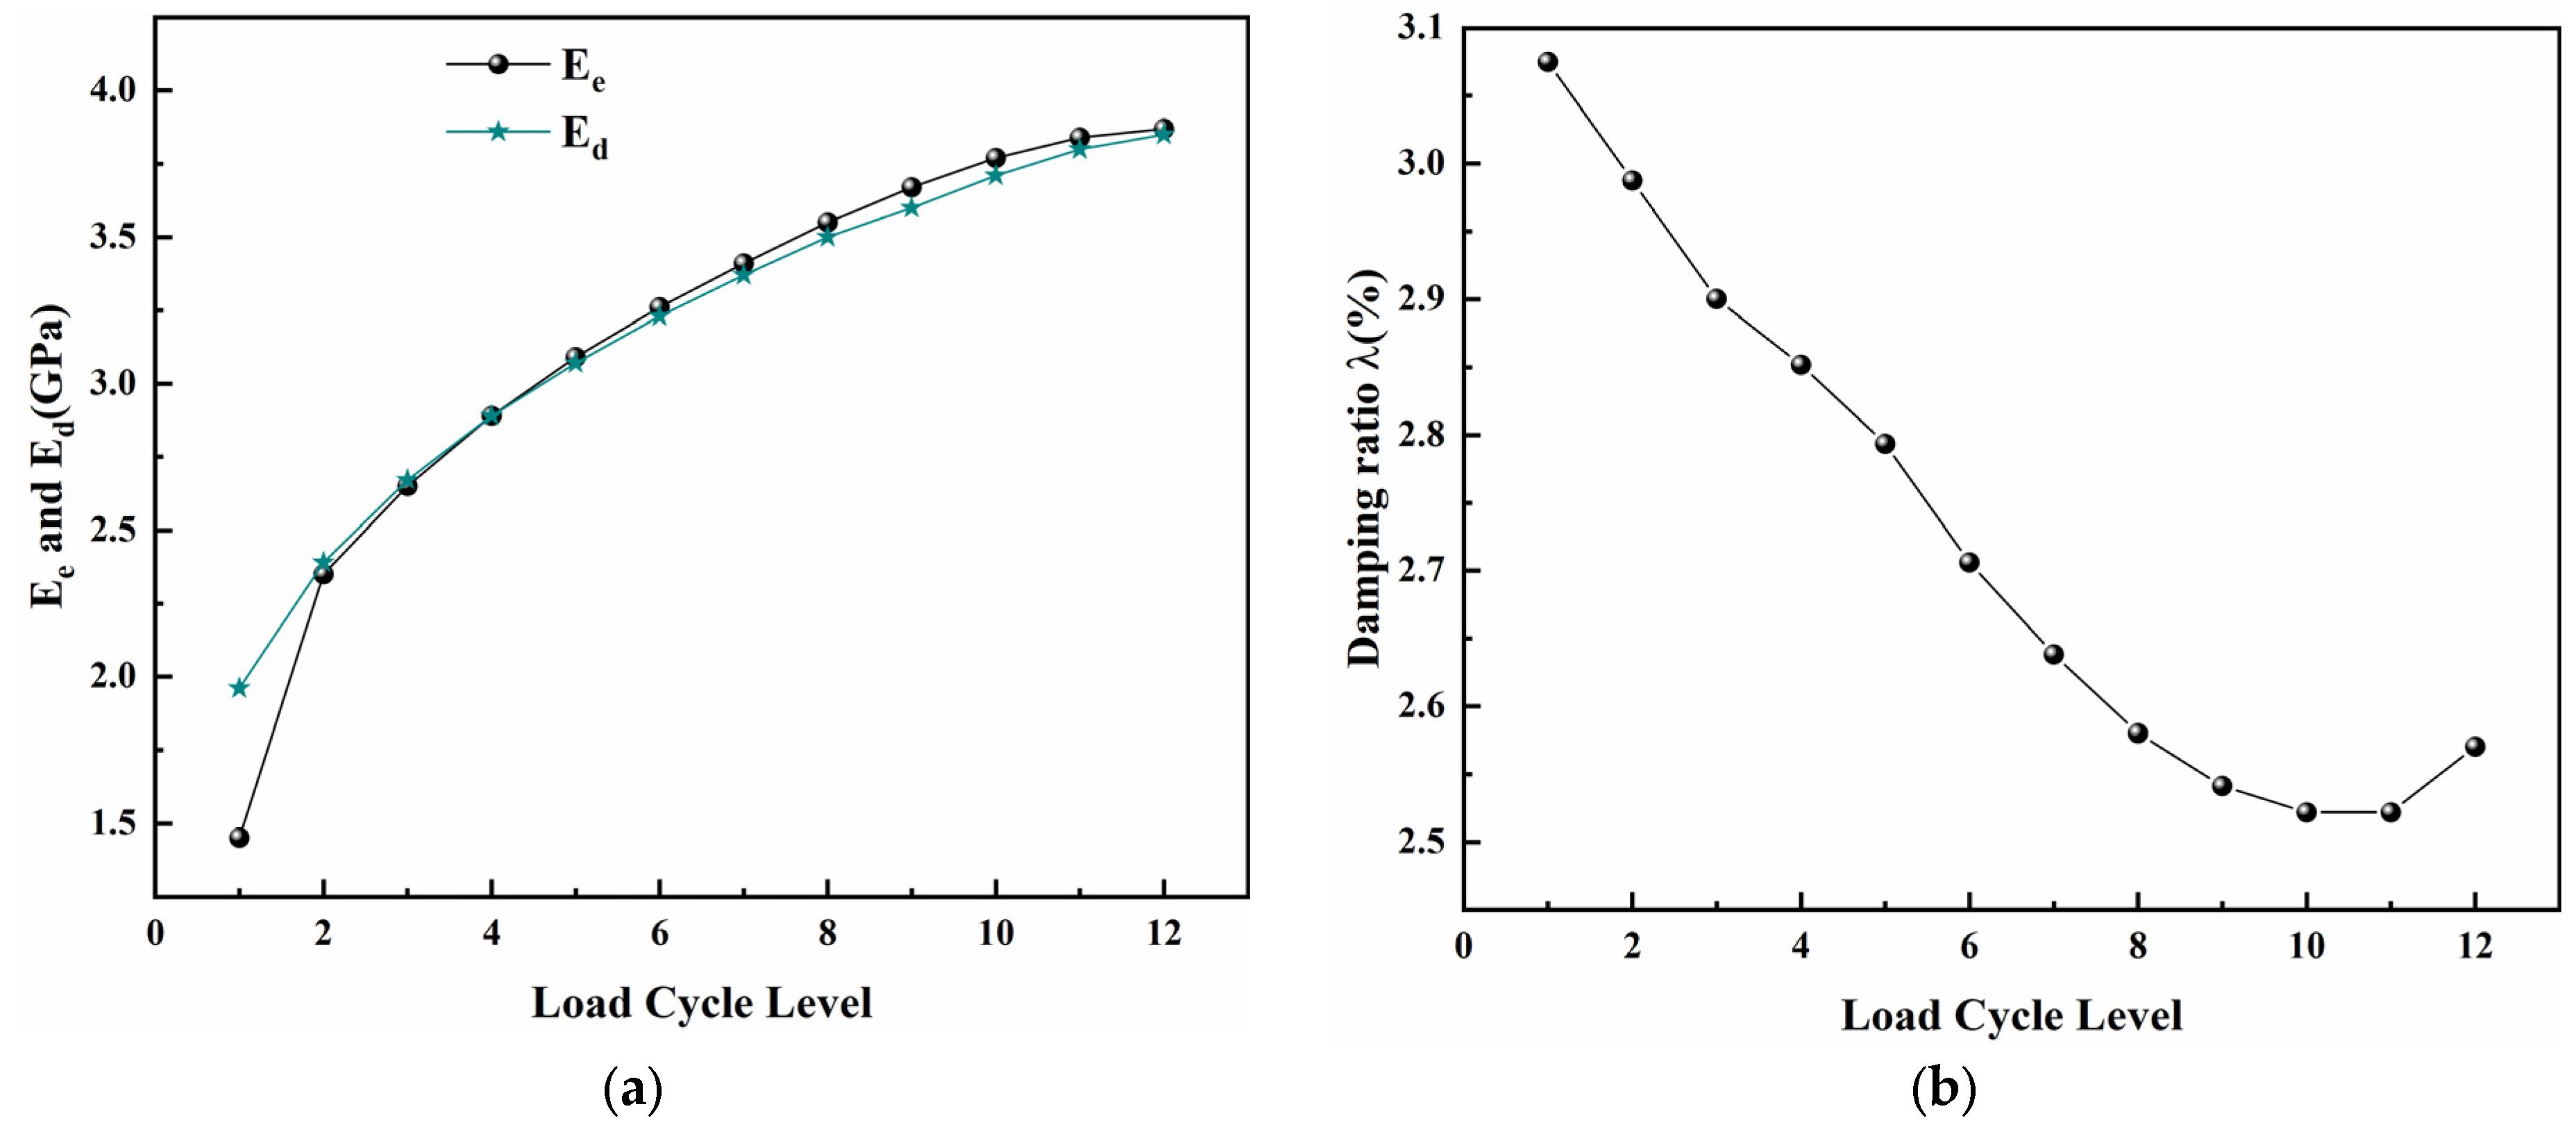
Figure 6 presents the changes in the deformation modulus, elastic modulus, and damping ratio with the increase in loading cycle level. It can be seen from the figure that as the loading cycle level increases, both the elastic modulus and deformation modulus show a “parabolic” increase, with a rapid increase at the initial stage and a slower rate of increase later on, and the difference between the elastic modulus and deformation modulus is relatively small. This is because as the load size increases step by step, the bearing capacity of the sandstone is continuously weakened, and its ability to rebound from deformation is also gradually reduced. The damping ratio reflects the characteristics of damped vibrations under cyclic loading [35,36]. With the increase in loading cycle level, the damping ratio overall shows a gradual decrease with a tendency to rise near the peak, and it fluctuates within the range of 2.5% to 3.0%. This is mainly because as the loading cycle level increases, damage in the sandstone accumulates gradually, and elastic deformation accumulates as well. When entering the crack propagation phase, plastic deformation becomes dominant, causing a rising trend in the damping ratio in the later stages.
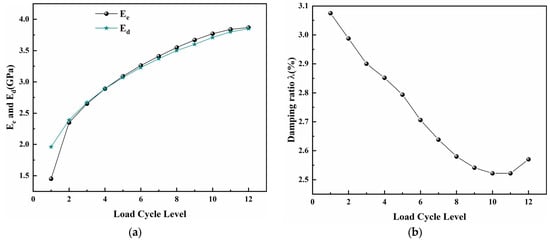
Figure 6.
, , and changes with load cycle level. (a) and ; (b) .
3.2. Characterization of Energy Evolution
The deformation and failure of rocks under loading are primarily due to the release of energy. Assuming that the specimen is in a closed system with no energy dissipation and no energy exchange conditions with the external environment, according to the first law of thermodynamics, the work done by the external force is equal to the total energy released [37,38,39]:
In the above equation, , and represent the total energy, elastic strain energy, and dissipated energy for the -th loading cycle, respectively; and represent the stress during the loading phase and the stress during the unloading phase, respectively; and , and correspond to the abscissa coordinates of points O, A, and C in Figure 5, respectively. The dissipated energy generated by cyclic loading and unloading is further divided into damping energy and plastic damage energy . The damping energy is primarily the energy consumed by the hysteresis loop to overcome the viscosity of the rock, while the damage energy is associated with the initiation and development of microcracks within the rock, leading to plastic deformation, which is the dissipated energy minus the damping energy [40,41]:
where is the i-th loading cycle’s damage energy.
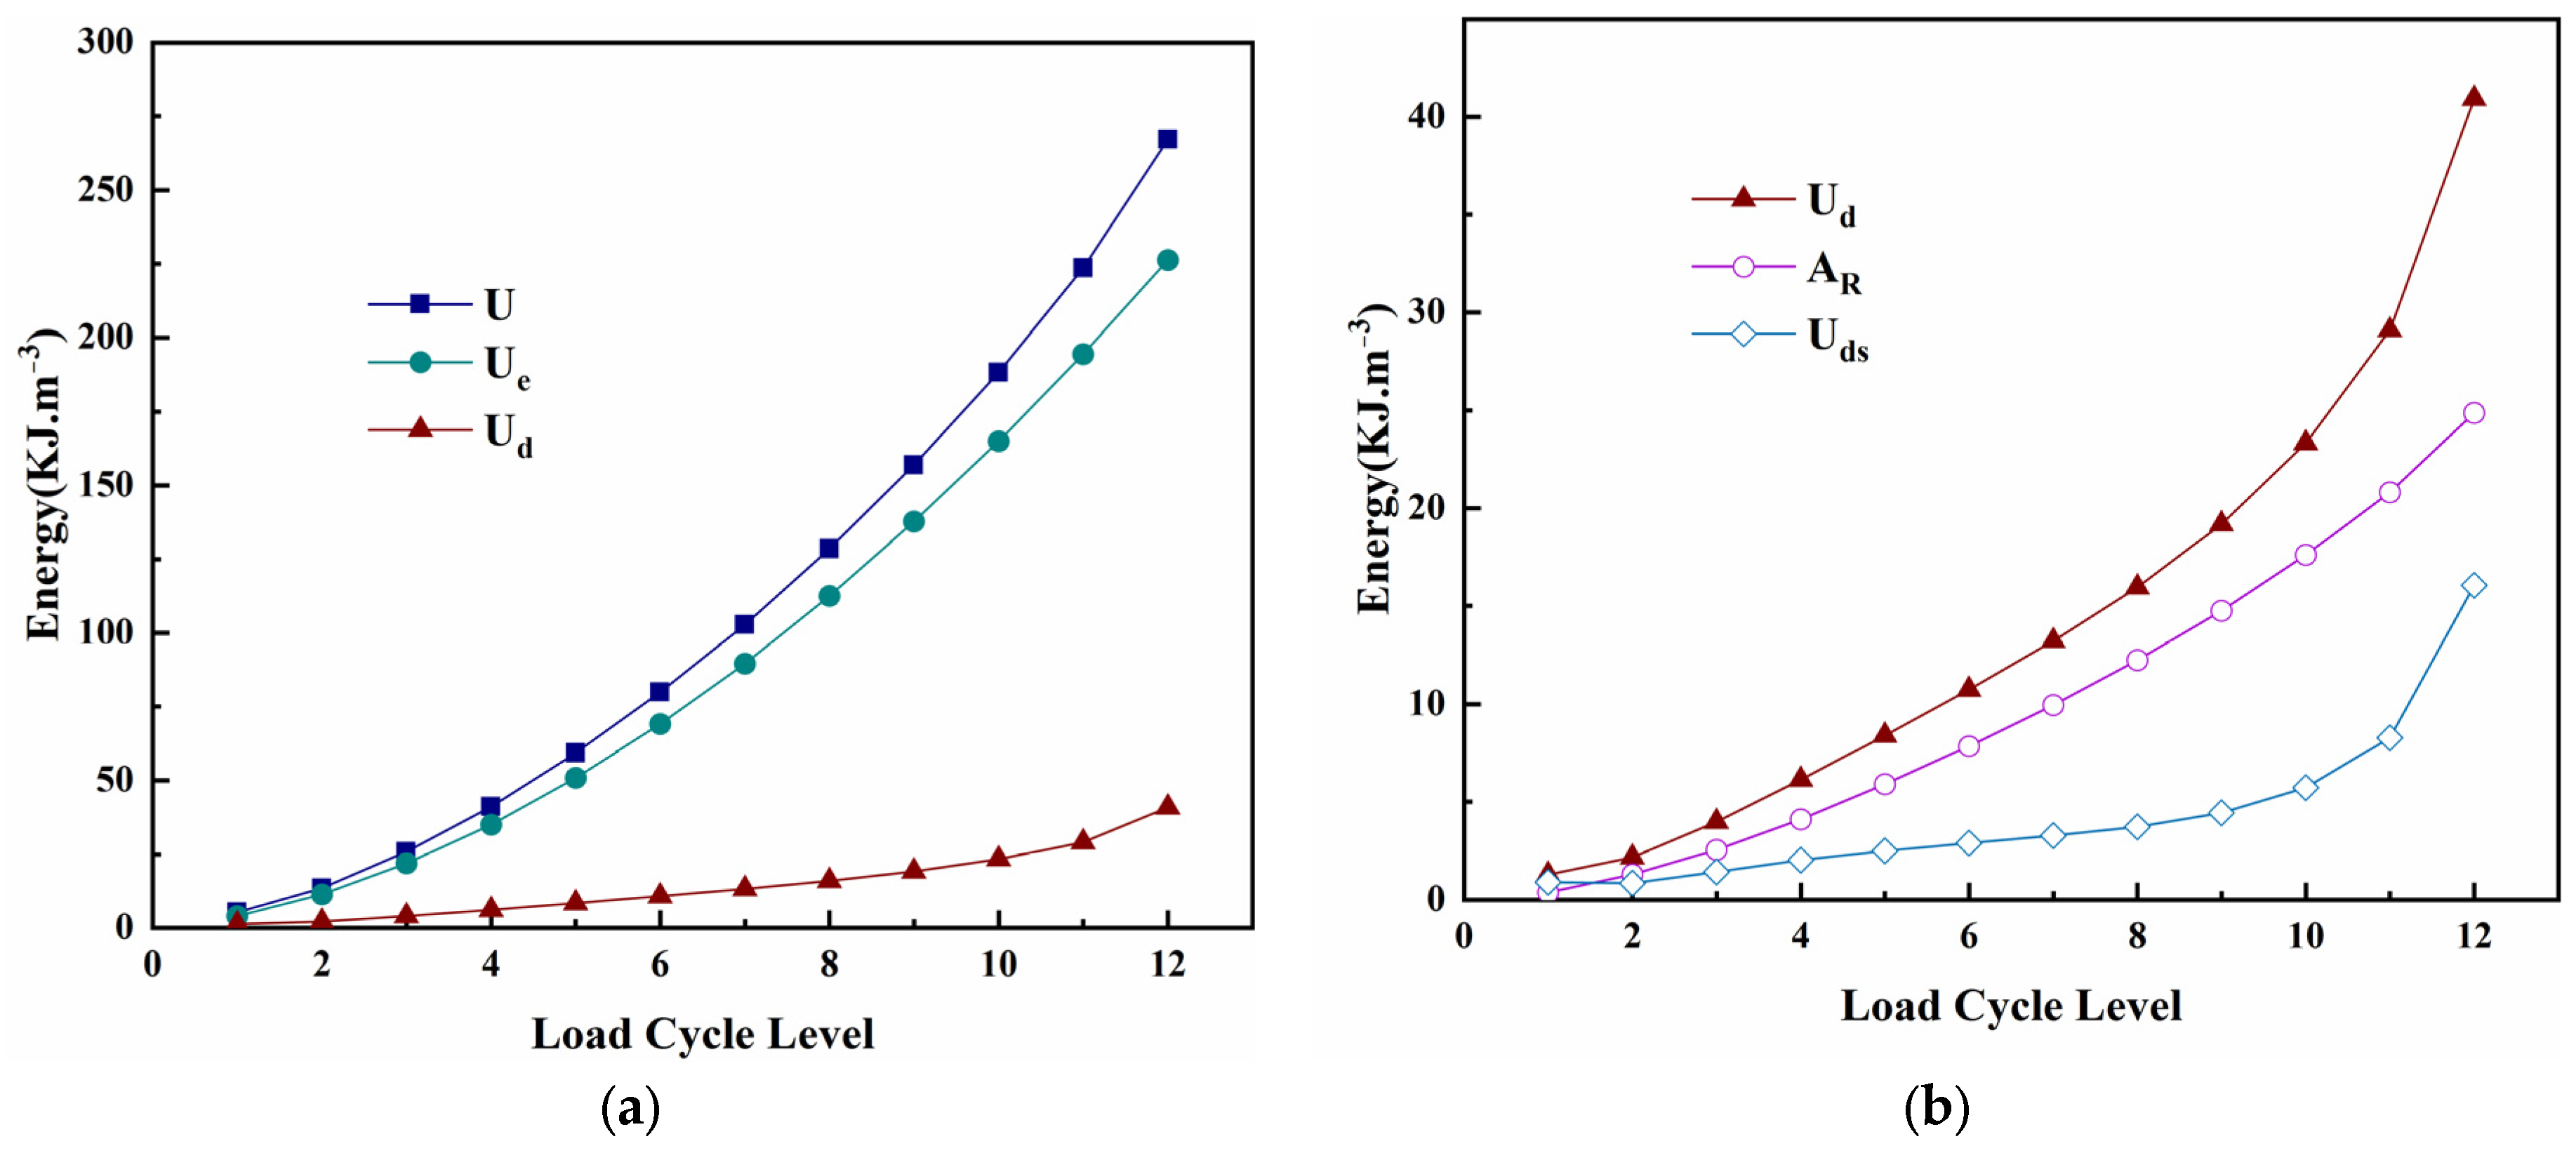
Figure 7 shows the variation in total energy, elastic energy, dissipated energy, damping energy, and damage energy with the increase in loading level. At the initial stage of loading, the overall energy change is relatively small, mainly due to the compaction of the original pores, which results in a smaller release of energy. As the loading level gradually increases, each part of the energy gradually rises, and the rate of increase accelerates. Near the peak (in the final loading stage), the elastic energy stored within the sandstone is suddenly released and converted into forms such as thermal energy, frictional energy, and energy for fracture damage, leading to a sudden and rapid increase in dissipated energy during the final loading stage. Research has also found that the damage energy increases sharply in the final loading stage, further indicating that the stored energy is released in large quantities during the final stage of destruction. The damping energy does not exhibit a significant mutation during the destruction stage, maintaining an upward trend [42,43].
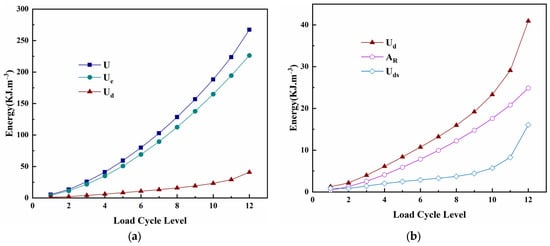
Figure 7.
, , , , changed with load cycle level. (a) , ; (b) .
The dissipation energy release gradually increases at each level, so the dissipation energy release is used to reflect the cumulative damage within the rock, and the damage variable is calculated as in Equation (12):
where is the dissipated energy released per stage; is the dissipated energy released by the whole process; and is the number of load rating stages.
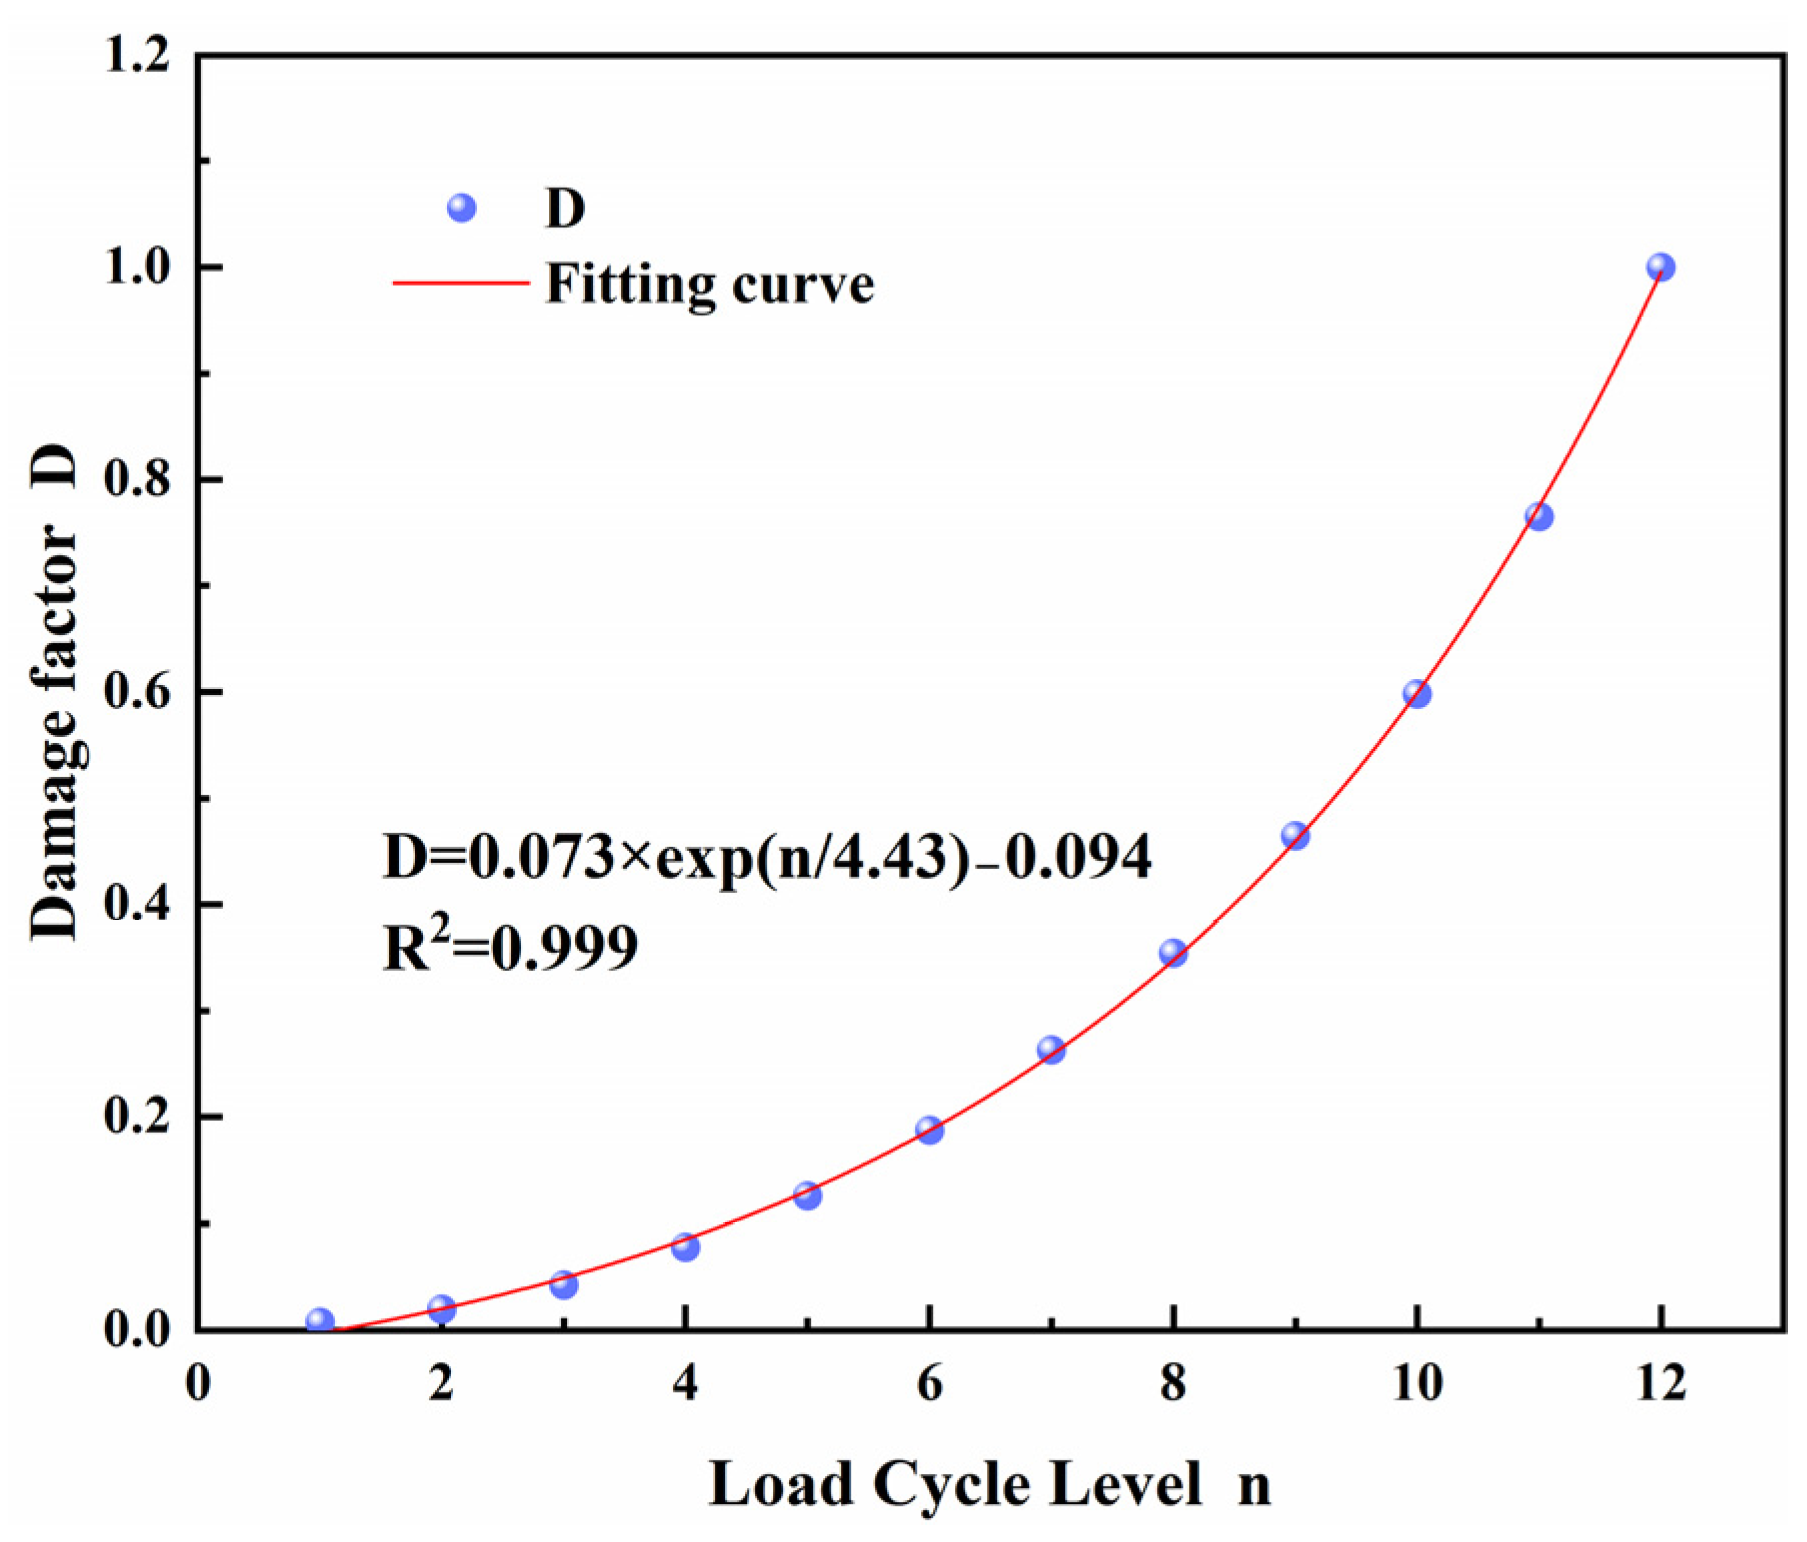
From Figure 8, it can be observed that as the loading cycle level gradually increases, the damage factor follows an exponential growth pattern, which further indicates that the damage caused by cyclic loading and unloading is a process that accumulates over time. Under low load conditions, the damage factor rises slowly, while it increases rapidly as it approaches the failure curve. This is primarily because, during this stage, microcracks extensively initiate, propagate, and connect, eventually forming macroscopic fractures. This leads to a significant release of energy to the surroundings, resulting in a gradual increase in dissipated energy.
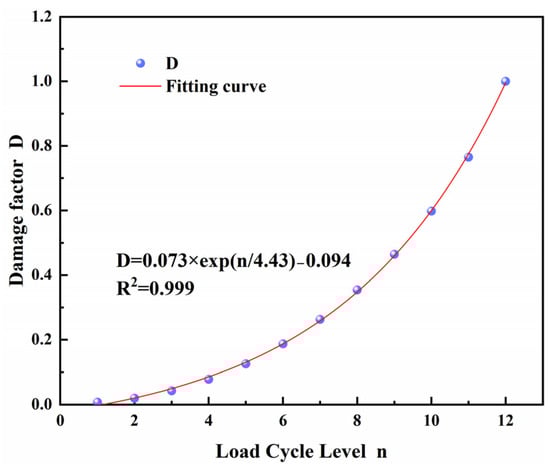
Figure 8.
Damage factor.
In order to further investigate the variation in dissipative and elastic energies as a percentage of the whole process, it is calculated by the following equations:
where and denote the ratio of elastic and dissipative energy to total energy, respectively.
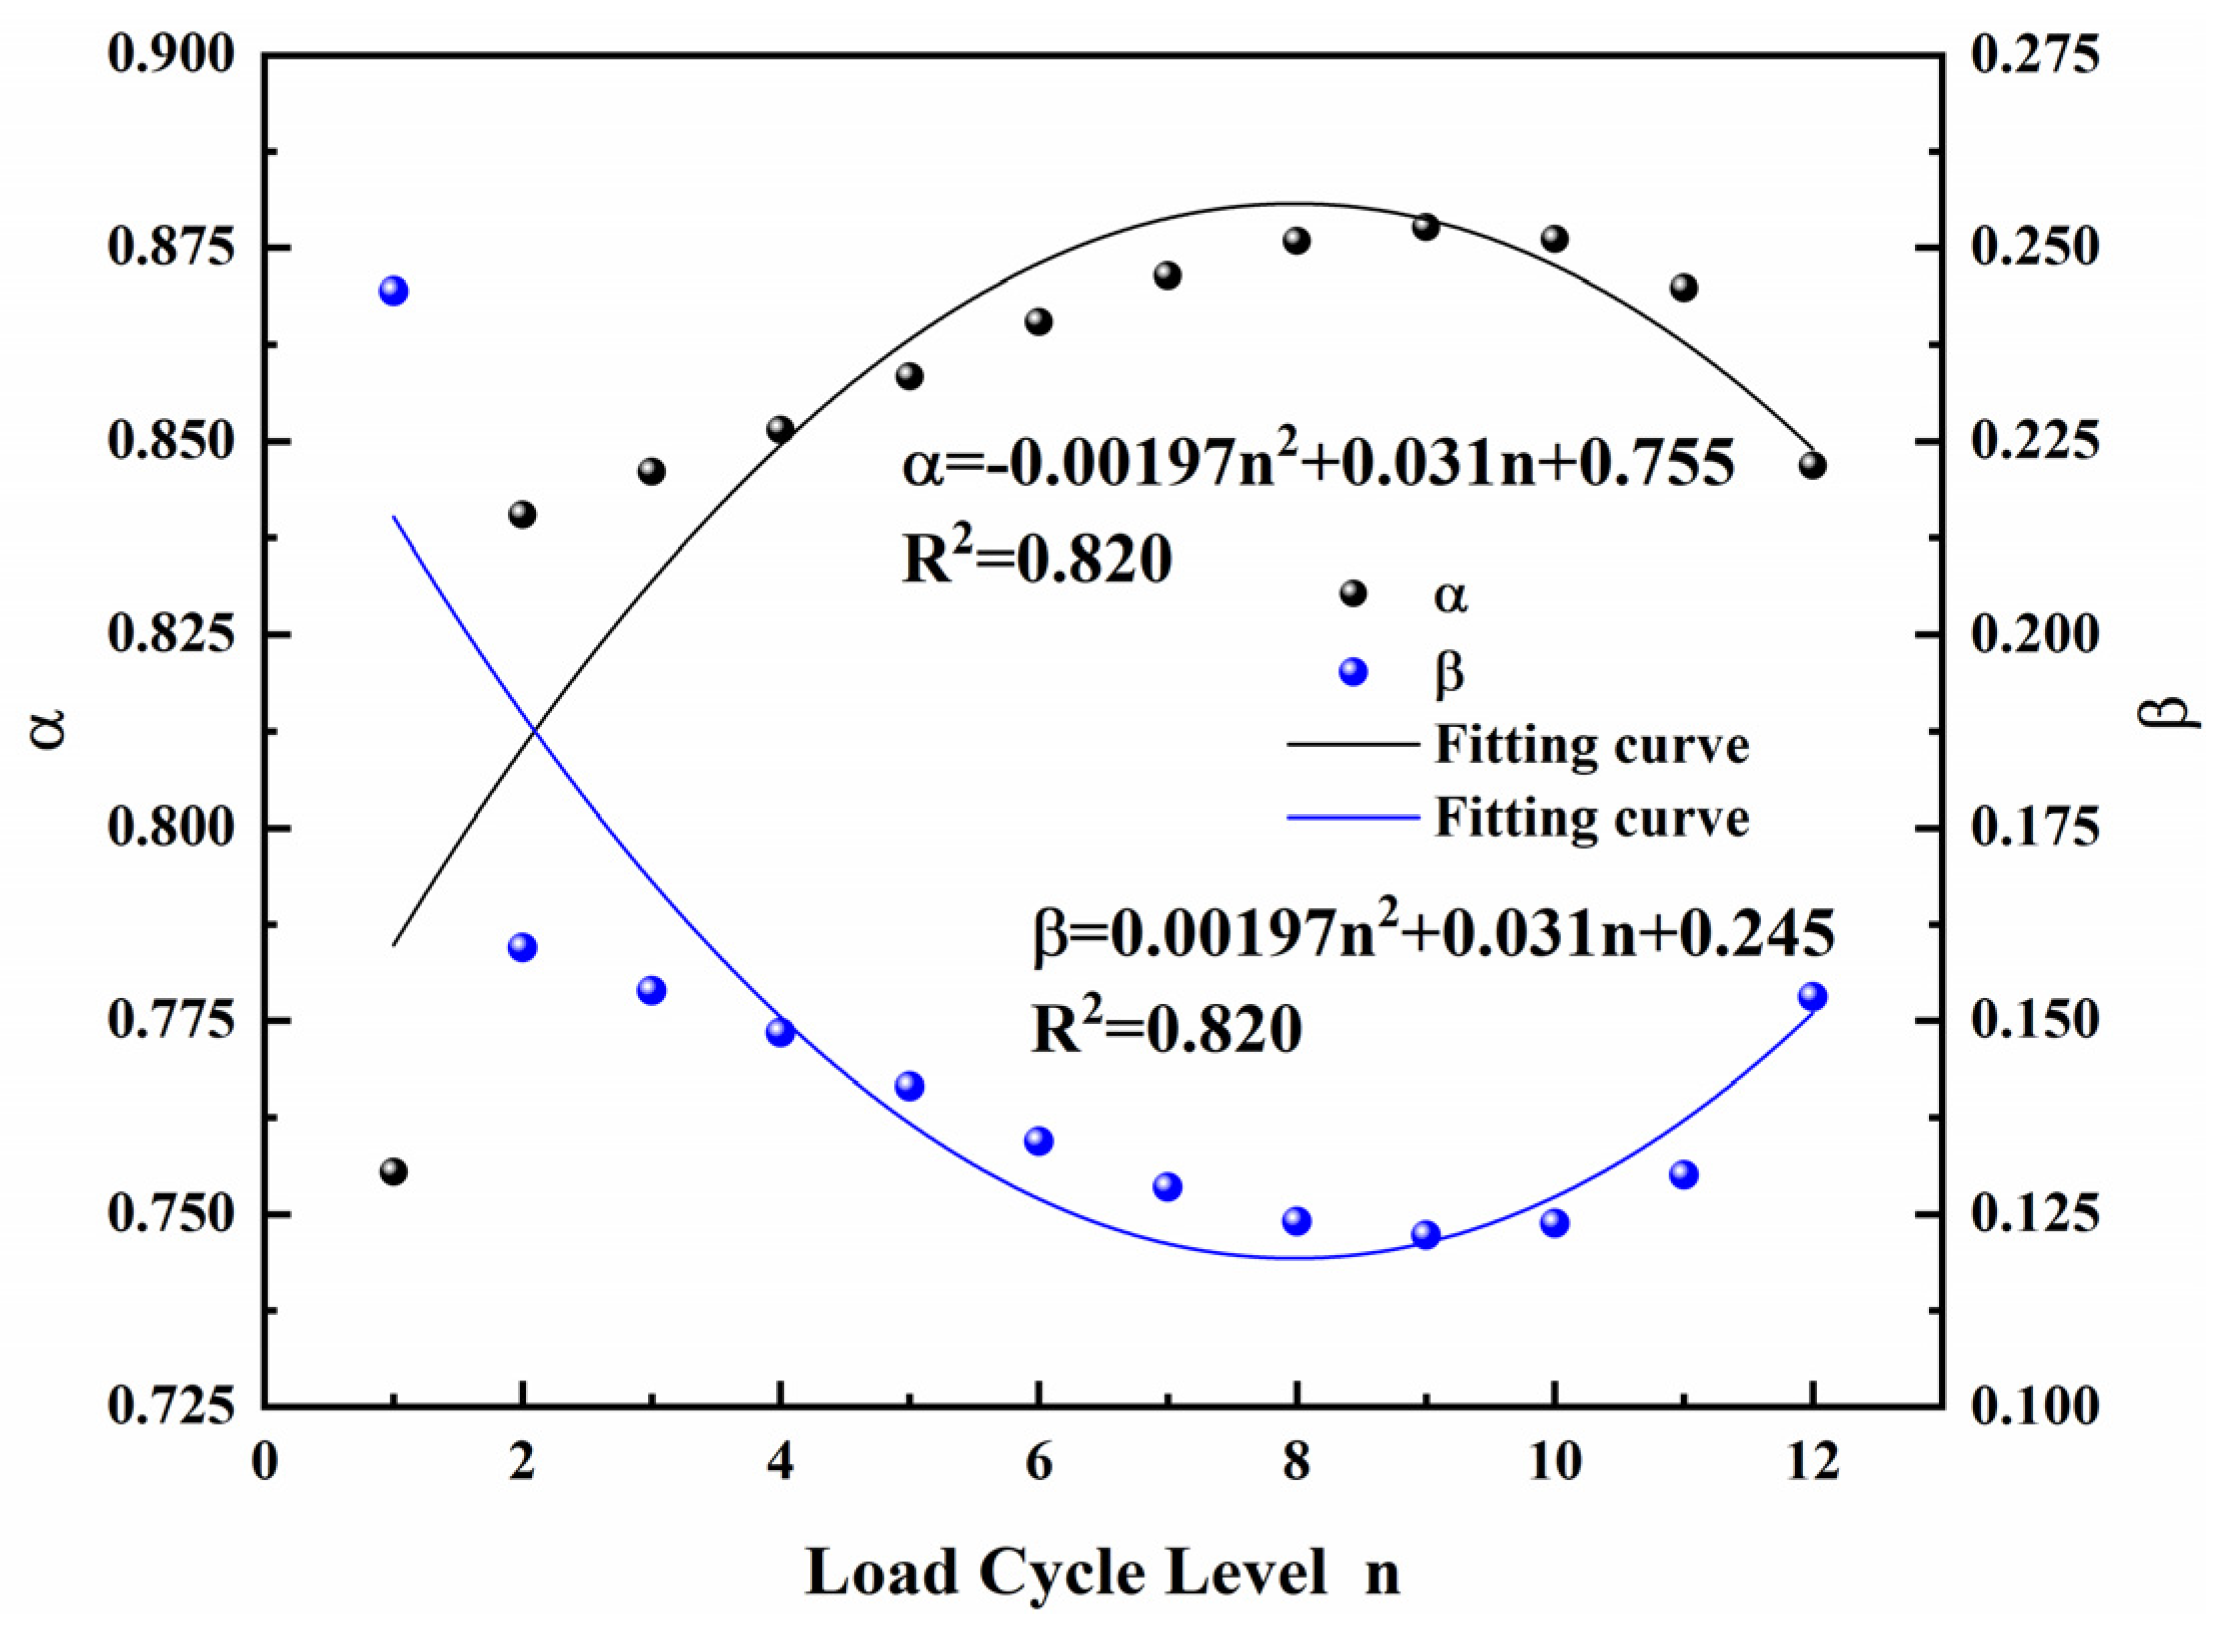
From Figure 9, it can be seen that the proportion of elastic energy, represented by α, exhibits a “quadratic parabola” pattern of initially increasing and then decreasing with the increase in loading cycle level, while the proportion of dissipated energy behaves in the exact opposite manner. During the initial loading, energy is primarily stored as elastic energy within the sandstone. Starting from the 8th loading cycle level, the proportion of elastic energy begins to decrease, while the proportion of dissipated energy does the opposite. The main reason for this is the initiation, propagation, and connection of sandstone cracks, as well as friction between internal particles, leading to a conversion of elastic energy into dissipated energy, and thus an increase in the proportion of dissipated energy. Consequently, when the load exceeds approximately 65% of the peak load, there is a change in the dominant form of energy [44].
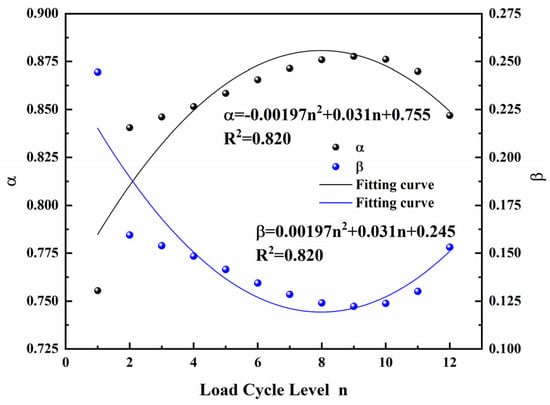
Figure 9.
Energy proportion.
4. Acoustic Emission Characterization
4.1. Acoustic Emission Characterization Parameters
Acoustic emission (AE) typically monitors the response of materials under stress, where due to the inhomogeneity of their microstructure and the presence of defects, there is a transition from an unstable high-energy state to a lower energy state. This transition is often manifested in the form of deformation and crack formation. When a specimen is subjected to external forces, the morphology of internal microcracks changes and generates elastic waves. These waves propagate to the surface of the specimen, where acoustic emission sensors fixed on the surface can detect the surface changes of the specimen. The acoustic emission is then manifested in forms such as the number of ring counts or energy [45,46].
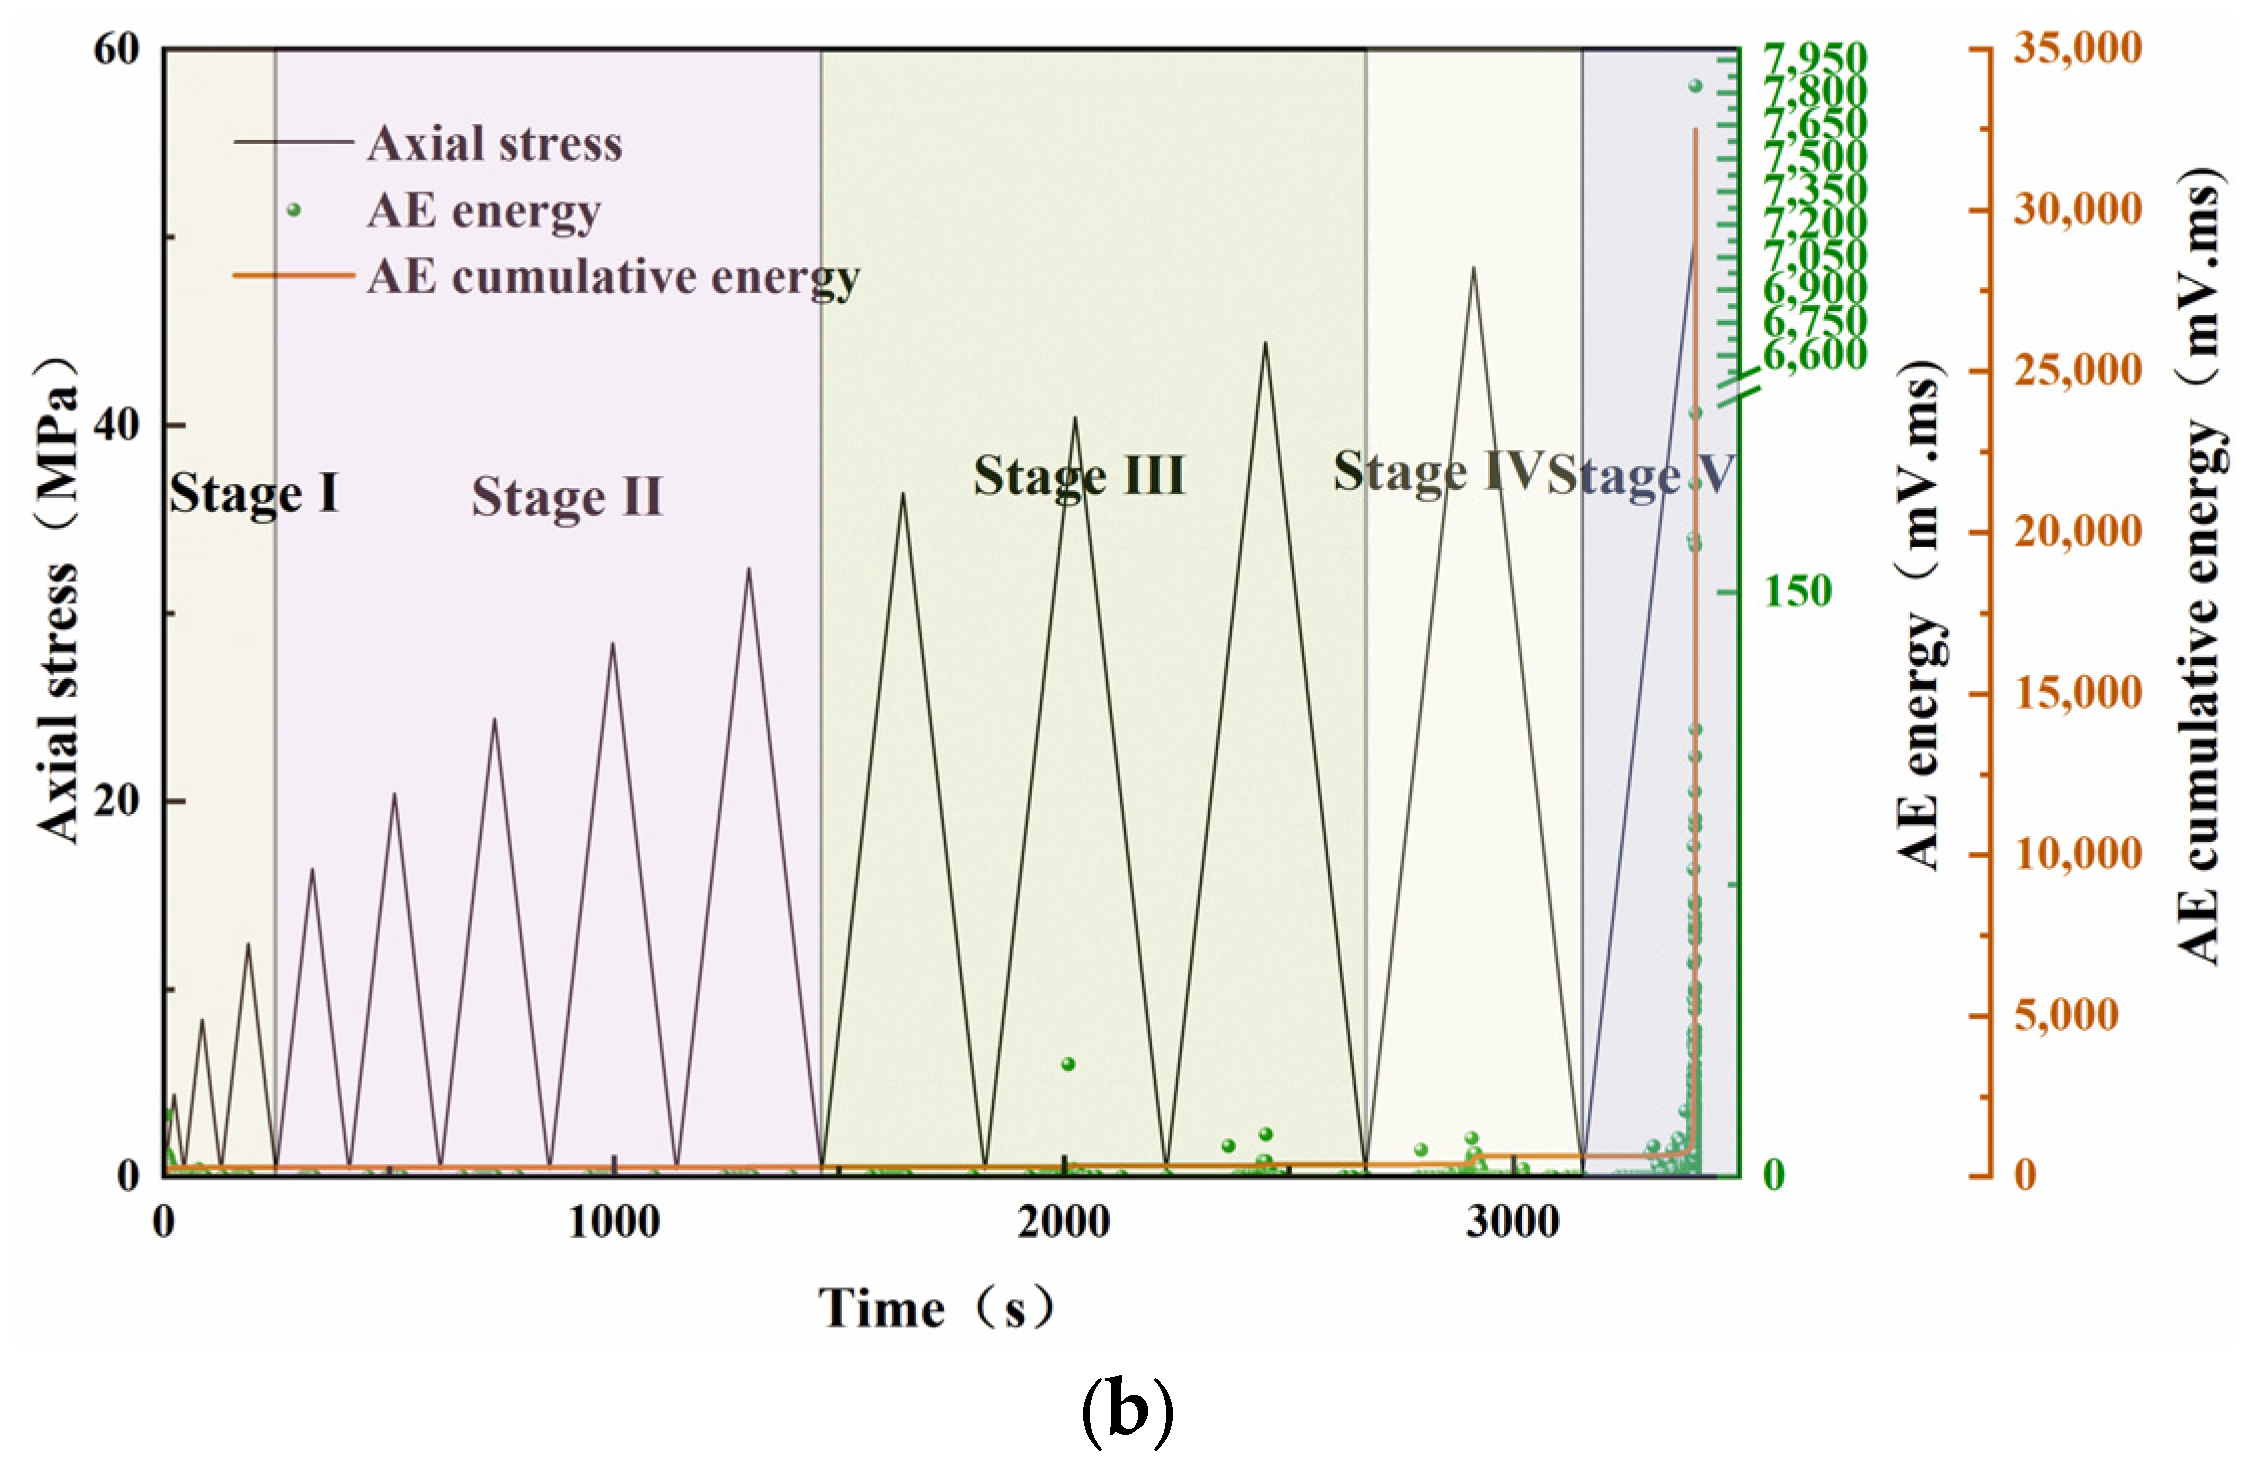
Figure 10 illustrates the changes in acoustic emission (AE) ring counts, cumulative ring counts, energy, and cumulative energy over time. The stages I to V represent the compaction of original pores, the elastic stage, the stable crack propagation stage, the unstable crack propagation stage, and the peak stage, respectively.
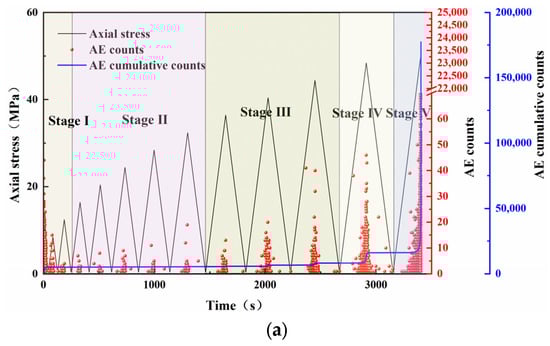

Figure 10.
Acoustic emission characterization parameters. (a) AE counts; (b) AE energy.
Compaction of original pores stage: There is a trend of increasing AE ring counts, mainly due to the compaction of original pores, which slightly alters the internal structure, resulting in a small increase in AE ring counts.
Elastic stage: AE ring counts develop steadily with faint signals, while there are almost no changes in the cumulative AE ring counts, AE energy, and cumulative AE energy. No damage is generated during this stage.
Stable crack propagation stage: AE ring counts begin to show increases in signals, and the cumulative AE ring counts rise slightly, with faint signals in AE energy.
Unstable crack propagation stage: Both AE ring counts and cumulative AE ring counts rise significantly, and the AE energy signals also become stronger. This indicates that a large number of microcracks are generated within the sandstone, and macroscopic tensile cracks are observed at the tips of pre-existing fractures on the sandstone surface.
Peak stage: There are substantial increases in AE ring counts and AE energy, reaching the highest point, while the cumulative AE ring counts and cumulative AE energy surge to their maximum in an instant. This stage is characterized by the most intense acoustic emission activity and the strongest signal strength, indicating that the sandstone is about to fail. Research has found that under low stress conditions, no AE signals are generated during the unloading stage, while under high stress conditions, AE signals are produced during the unloading stage.
4.2. Characterization of Rock Damage Precursors
Many scholars have adopted the b-value of acoustic emission (AE) to study the precursors of rock failure, believing that researching the b-value can help to profoundly understand the mechanisms of rock failure and has significant practical importance for the prevention of instability and failure in rock engineering [47,48]. It is calculated as follows:
where is the average magnitude; is the minimum magnitude; and is a constant approximately equal to 2.72.
The magnitude/20 is generally used in place of the magnitude, modifying the above equation to [49,50]:
where is the acoustic emission amplitude; ) is the cumulative frequency of amplitude acoustic emission events; is an empirical constant; and is the acoustic emission b-value.
The acoustic emission b-value of Equation (14) was modified according to the literature [51] to:
where is the average amplitude; and is the minimum amplitude.
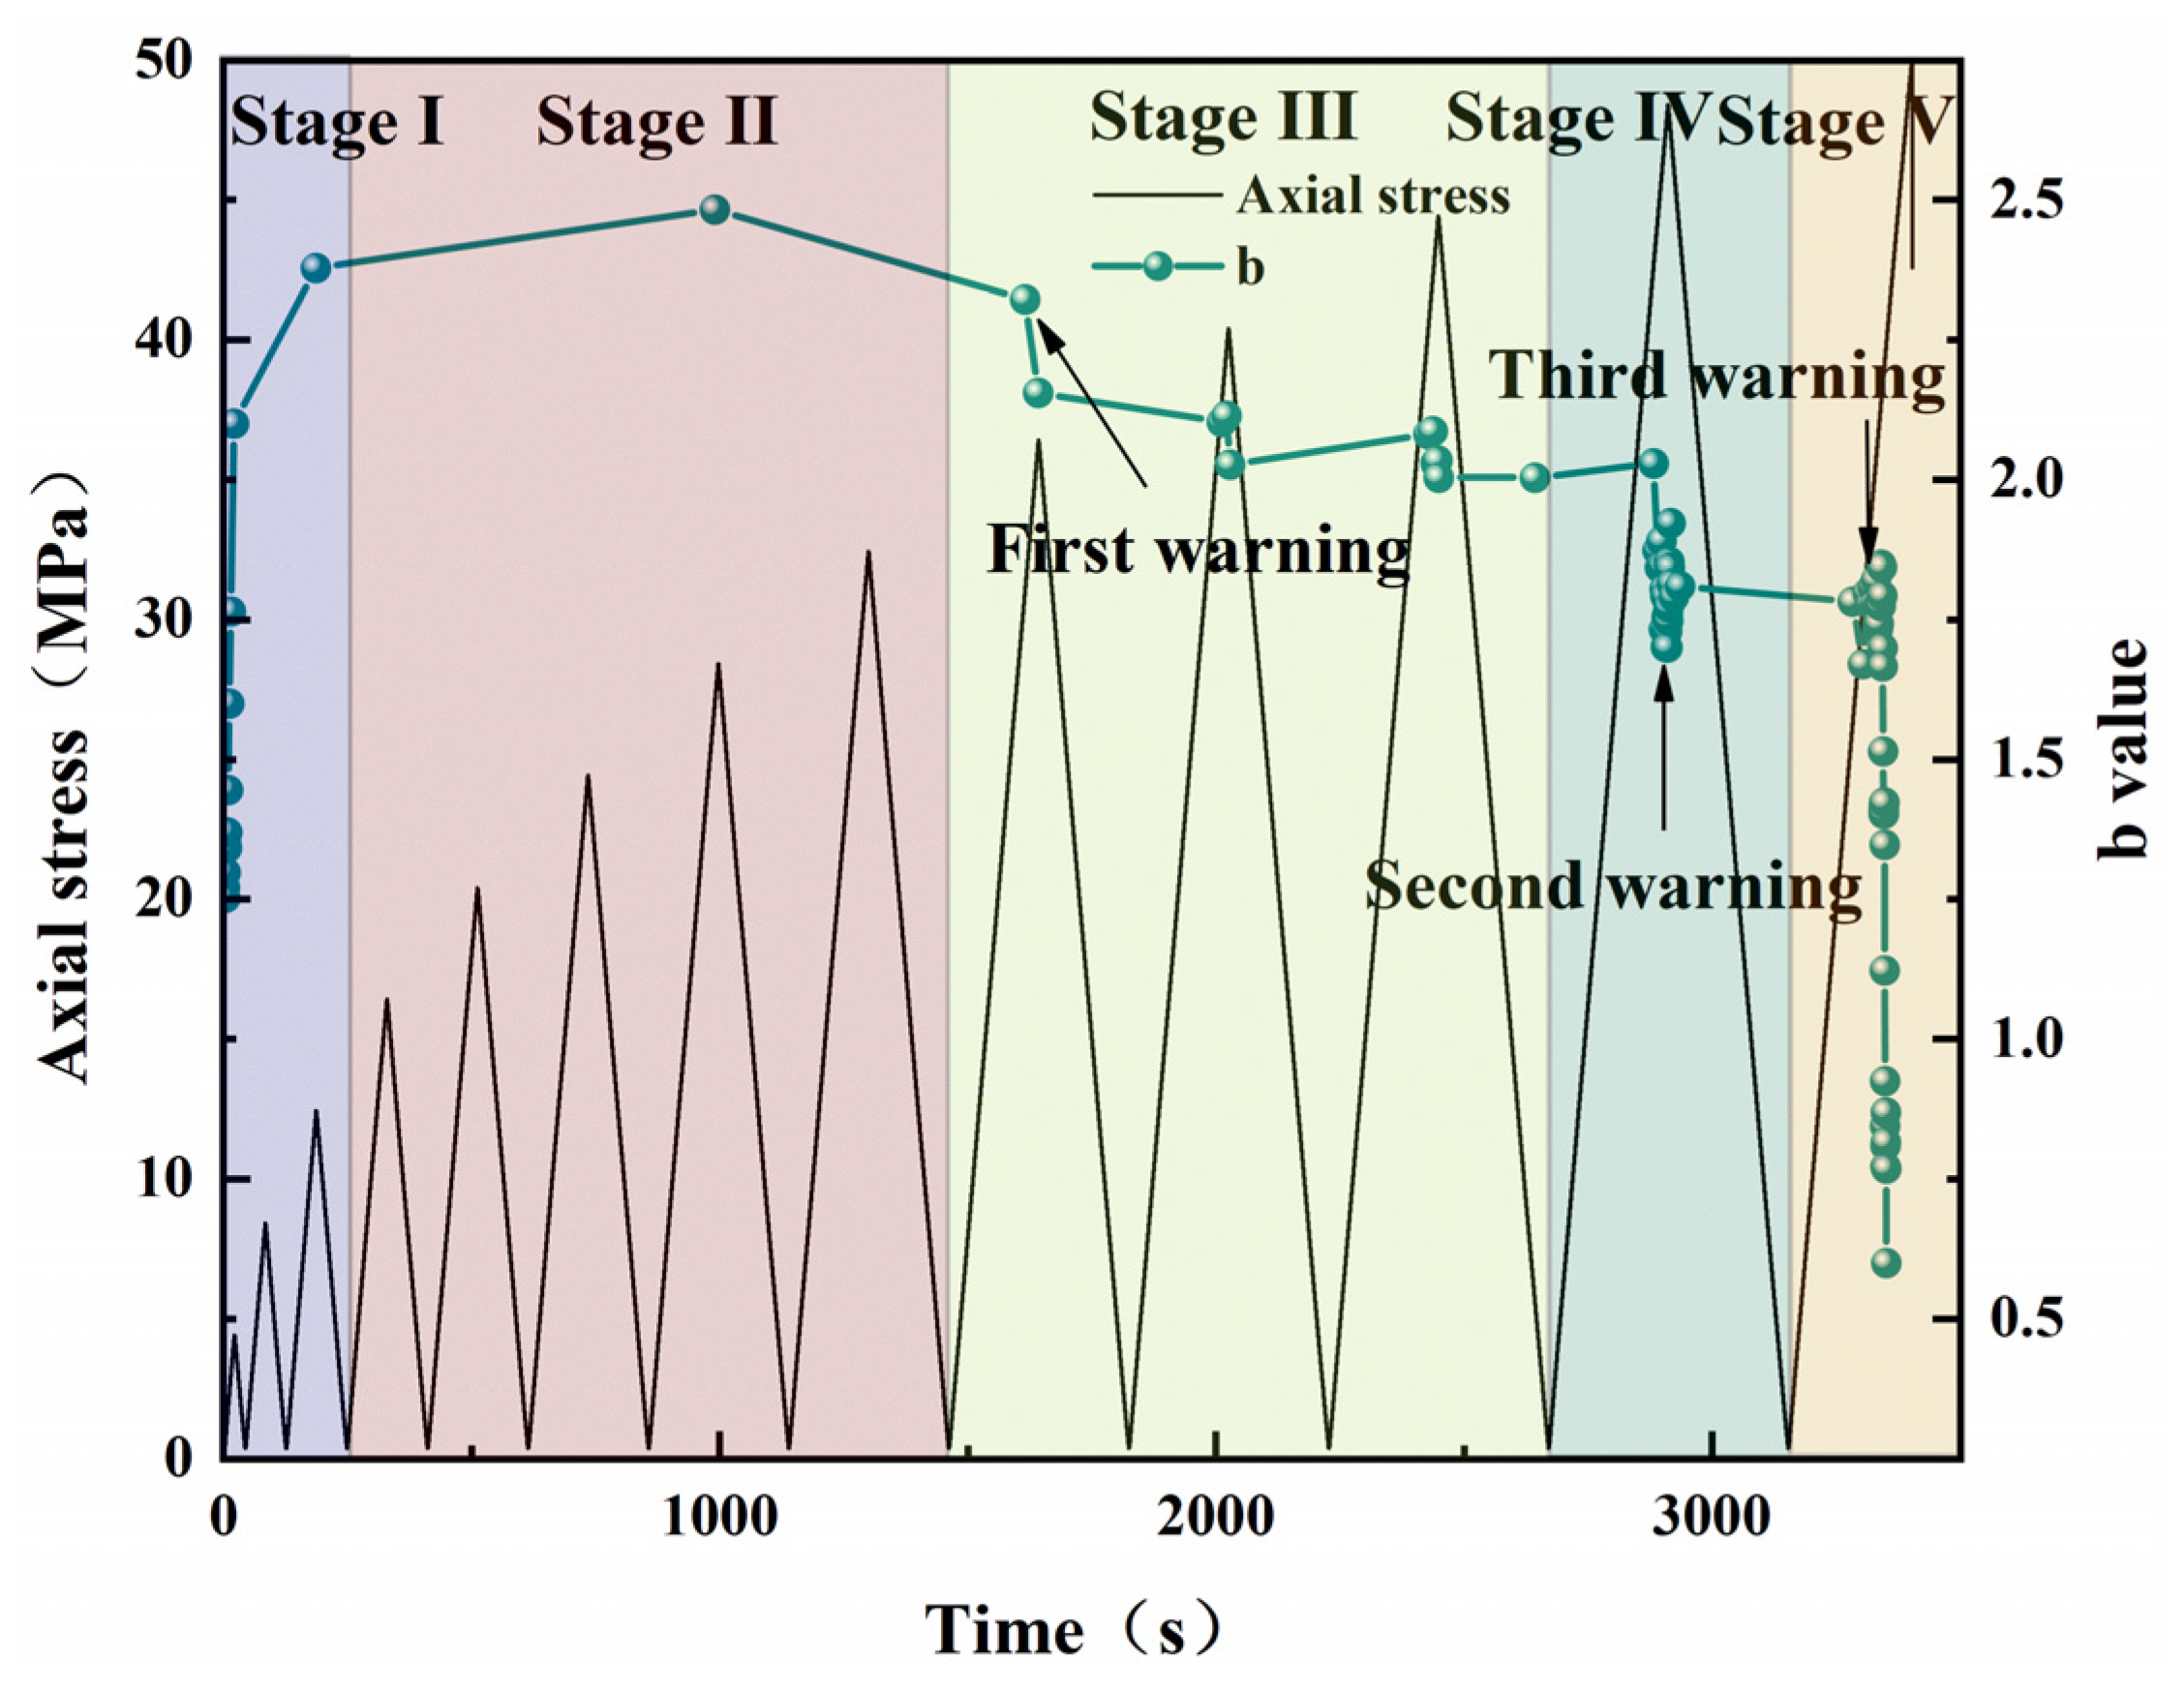
Figure 11 shows the variation in the b-value over time. From the figure, we can observe the following: Compaction of original cracks stage: The b-value shows a short-term increase, mainly due to the compaction of original microcracks, which generates minor fluctuations. Elastic stage: The b-value remains almost stable with no significant fluctuations, indicating a steady development. Unstable crack propagation stage: As the stage progresses, the b-value starts to fluctuate, signaling the initiation of microcracks within the sandstone and the first warning sign. With the continued increase in load, the sandstone enters the unstable crack propagation stage. In this stage, the b-value experiences a sudden and larger fluctuation than at the first warning point, suggesting the formation of larger micro-fractures within the sandstone. At the peak stage, the b-value increases dramatically, indicating the appearance of a large number of macro-cracks on the 45° sandstone surface, which are rapidly expanding. This suggests that the sandstone is about to fail, marking the third warning point. From these observations, it is noted that the first warning point is not very obvious, the second warning point is accompanied by a faint rockburst sound during the experiment, and the third warning point already implies an impending failure, which occurs rapidly. Therefore, the author believes that the second warning point should be considered as the best predictive point for the precursor of 45° sandstone failure to prevent instability in rock engineering.
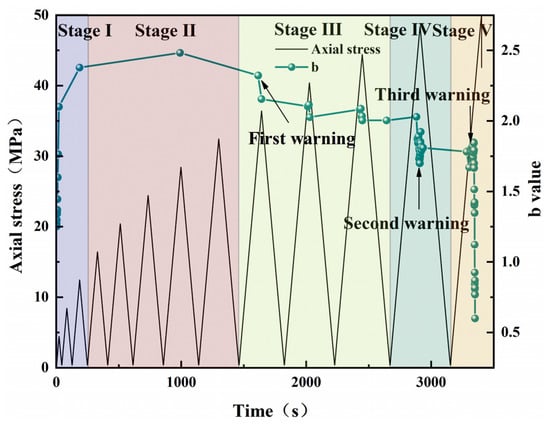
Figure 11.
AE b as a function of time.
The Felicity effect refers to the phenomenon where acoustic emission (AE) activity significantly increases during the cyclic loading process when the load experienced by the specimen is less than the maximum load it has previously endured. The Felicity effect characterizes a kind of irreversibility in the AE process and is defined as:
In the formula, represents the Felicity ratio for the i-th cycle; is the highest load level previously experienced; is the load level at which effective acoustic emission is resumed during the ()-th loading process. However, there is no unified standard for identifying effective acoustic emission due to limited research findings. To ensure a consistent analysis of the experimental data, this study adopts the guidelines recommended by the Composites Acoustic Emission Monitoring Committee (CARP) in the United States, which is that acoustic emission is considered effective when it exceeds 20 ring counts as the load increases by 10% [13,14].
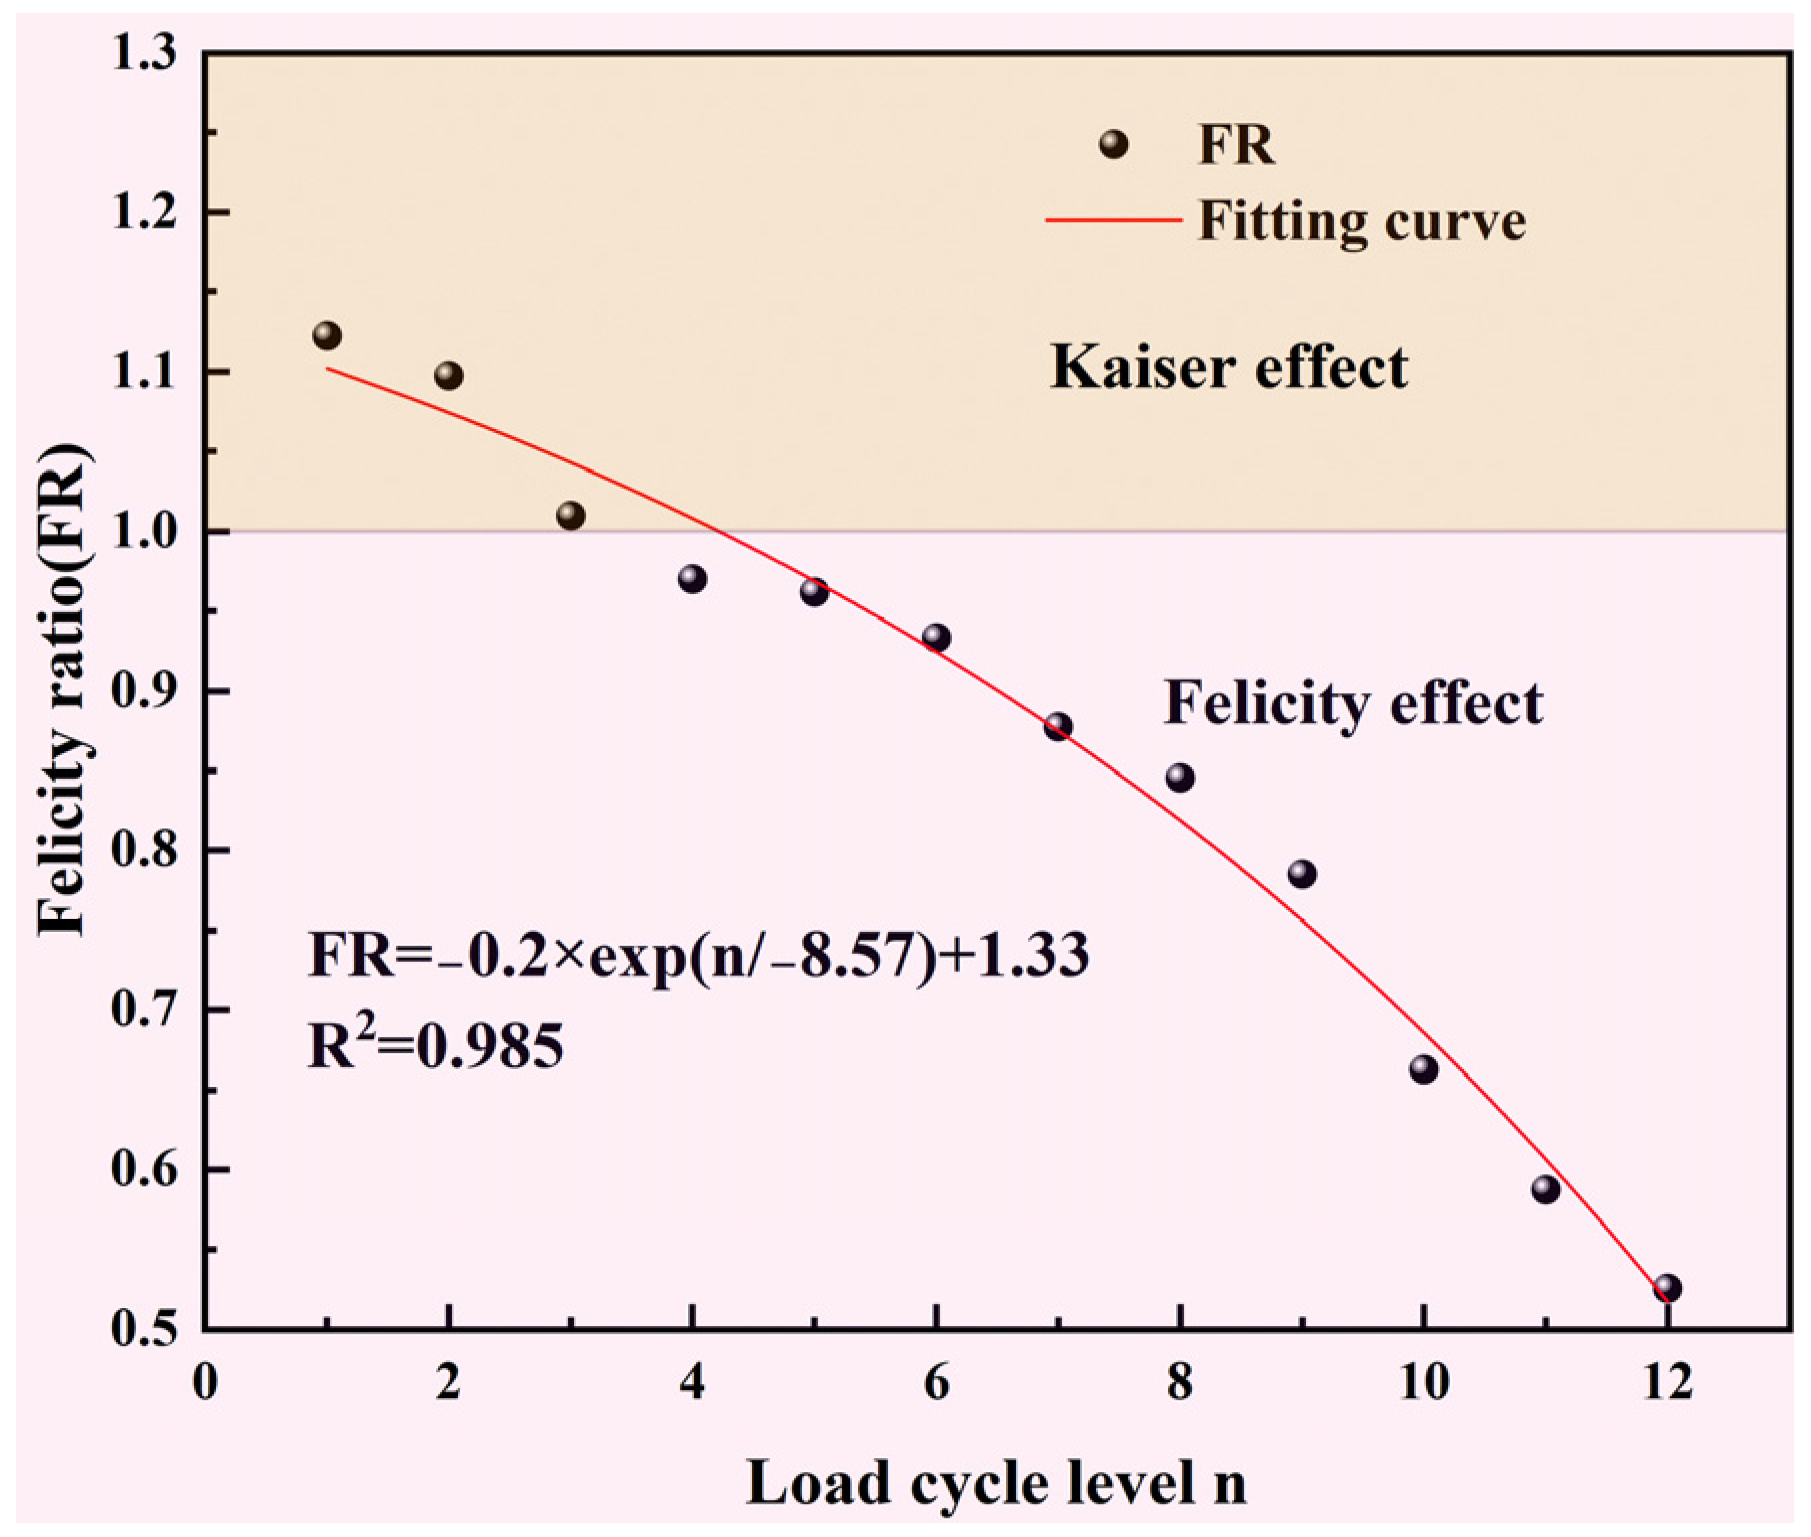
Figure 12 shows that the value decreases with the increase in load cycle level, and the rate of decrease accelerates over time. The Kaiser effect occurs when the , implying that the sandstone is in a stable state with no severe internal damage. When the , the Felicity effect appears, and the sandstone gradually moves toward an unstable state as the stress increases. The experiment found that when the FR value is less than 0.7, macroscopic cracks appear on the surface of the sandstone, and these cracks rapidly extend as the value decreases. Consequently, the Felicity ratio can be used as a predictive tool for the precursors of rock failure.
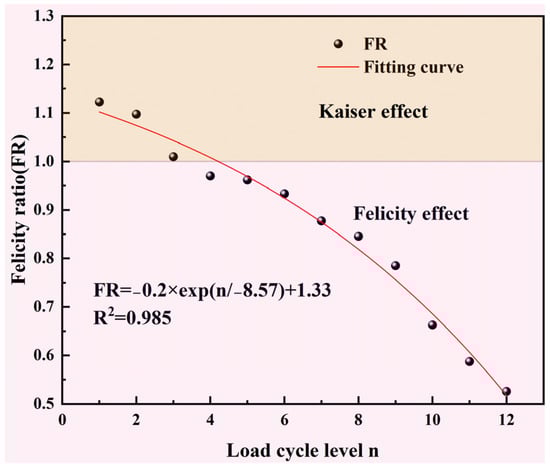
Figure 12.
Relationship between load cycle rating and FR value.
4.3. Spatio-Temporal Evolution of Acoustic Emission Rupture Instability
as important parameters of acoustic emission, are often used to describe the crack pattern classification, and the cut line directly affects the division of the crack category. According to the relevant research, the cut line is taken as . They are given by:
where , and denote the acoustic emission rise time, upper emission duration, and acoustic emission ring number, respectively.
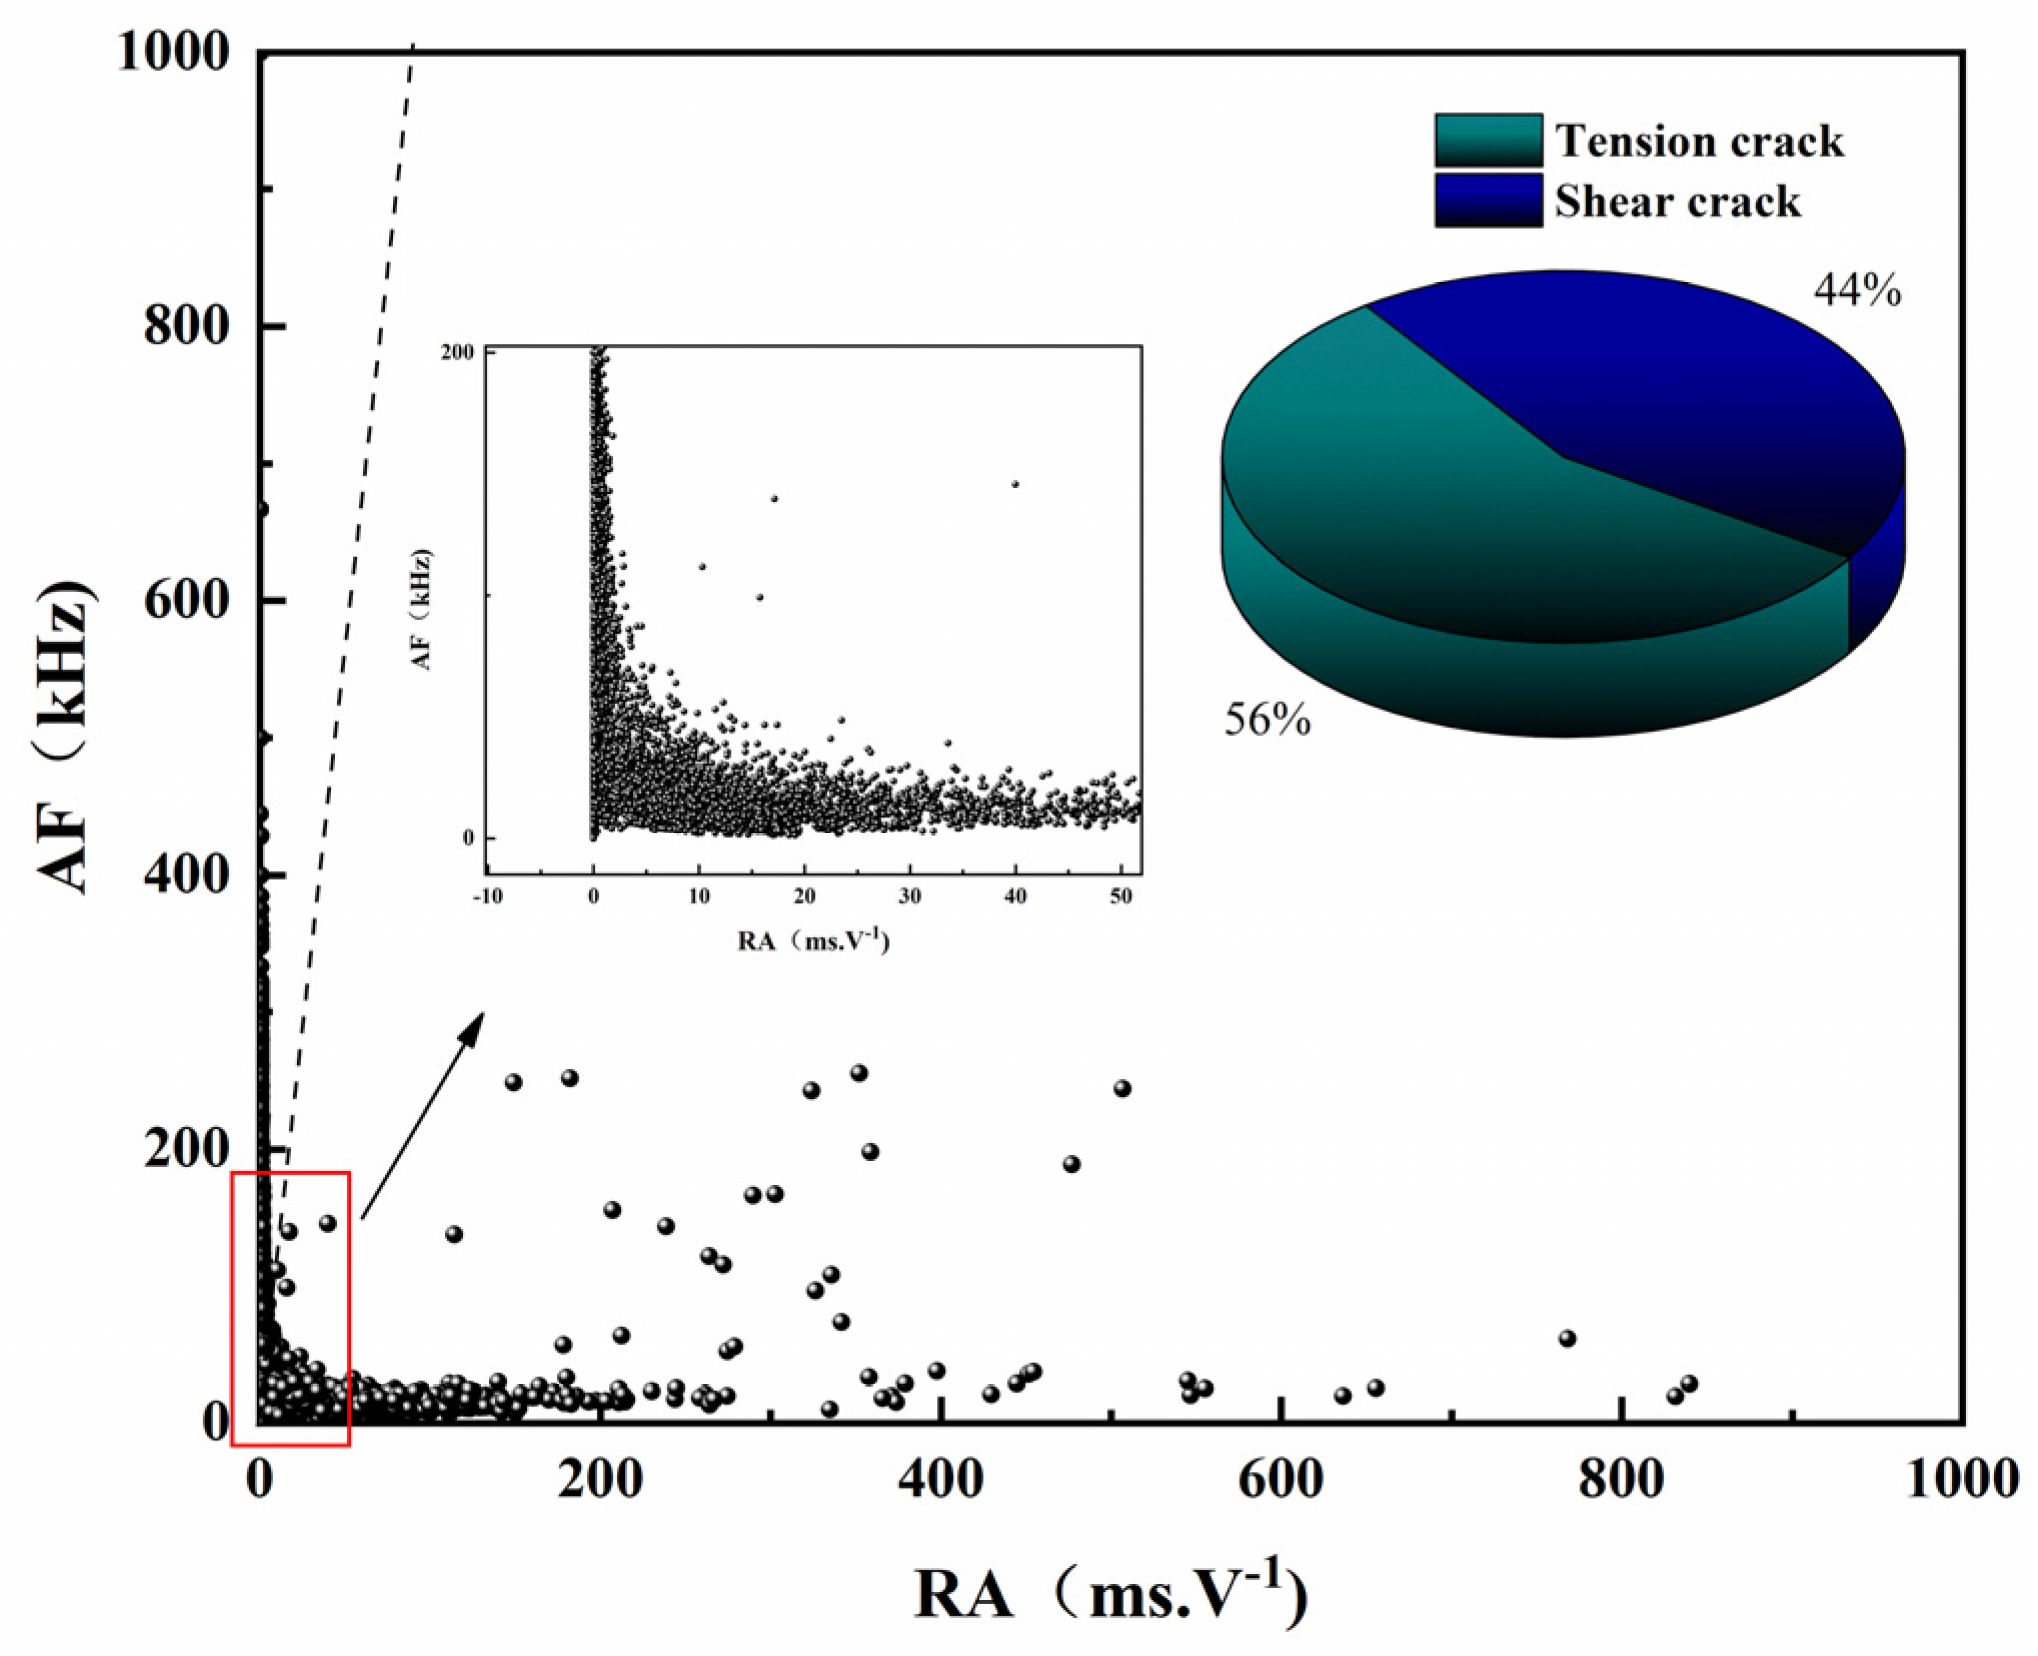
By applying Equations (19) and (20), and are calculated, with and denoting shear fractures and tensile fractures, respectively. Figure 13 presents the proportion of different types of cracks formed during the entire loading process of sandstone. Calculations reveal that shear cracks account for 44% of the total, while tensile cracks make up 56%. This indicates that more tensile cracks are generated during the entire loading process of sandstone, and the primary mode of failure is tensile rupture.

Figure 13.
Percentage of cracks. (AF denotes tensile cracking; RA denotes shear cracking).
Acoustic emission (AE) amplitude and AE energy can both reflect the degree of rock damage to a certain extent. Relevant studies have shown that there is a characteristic power law relationship between AE amplitude and energy. Referring to the calculation method of the Richter scale for earthquakes, the AE energy level can be taken as:
In the formula, represents the acoustic emission energy.
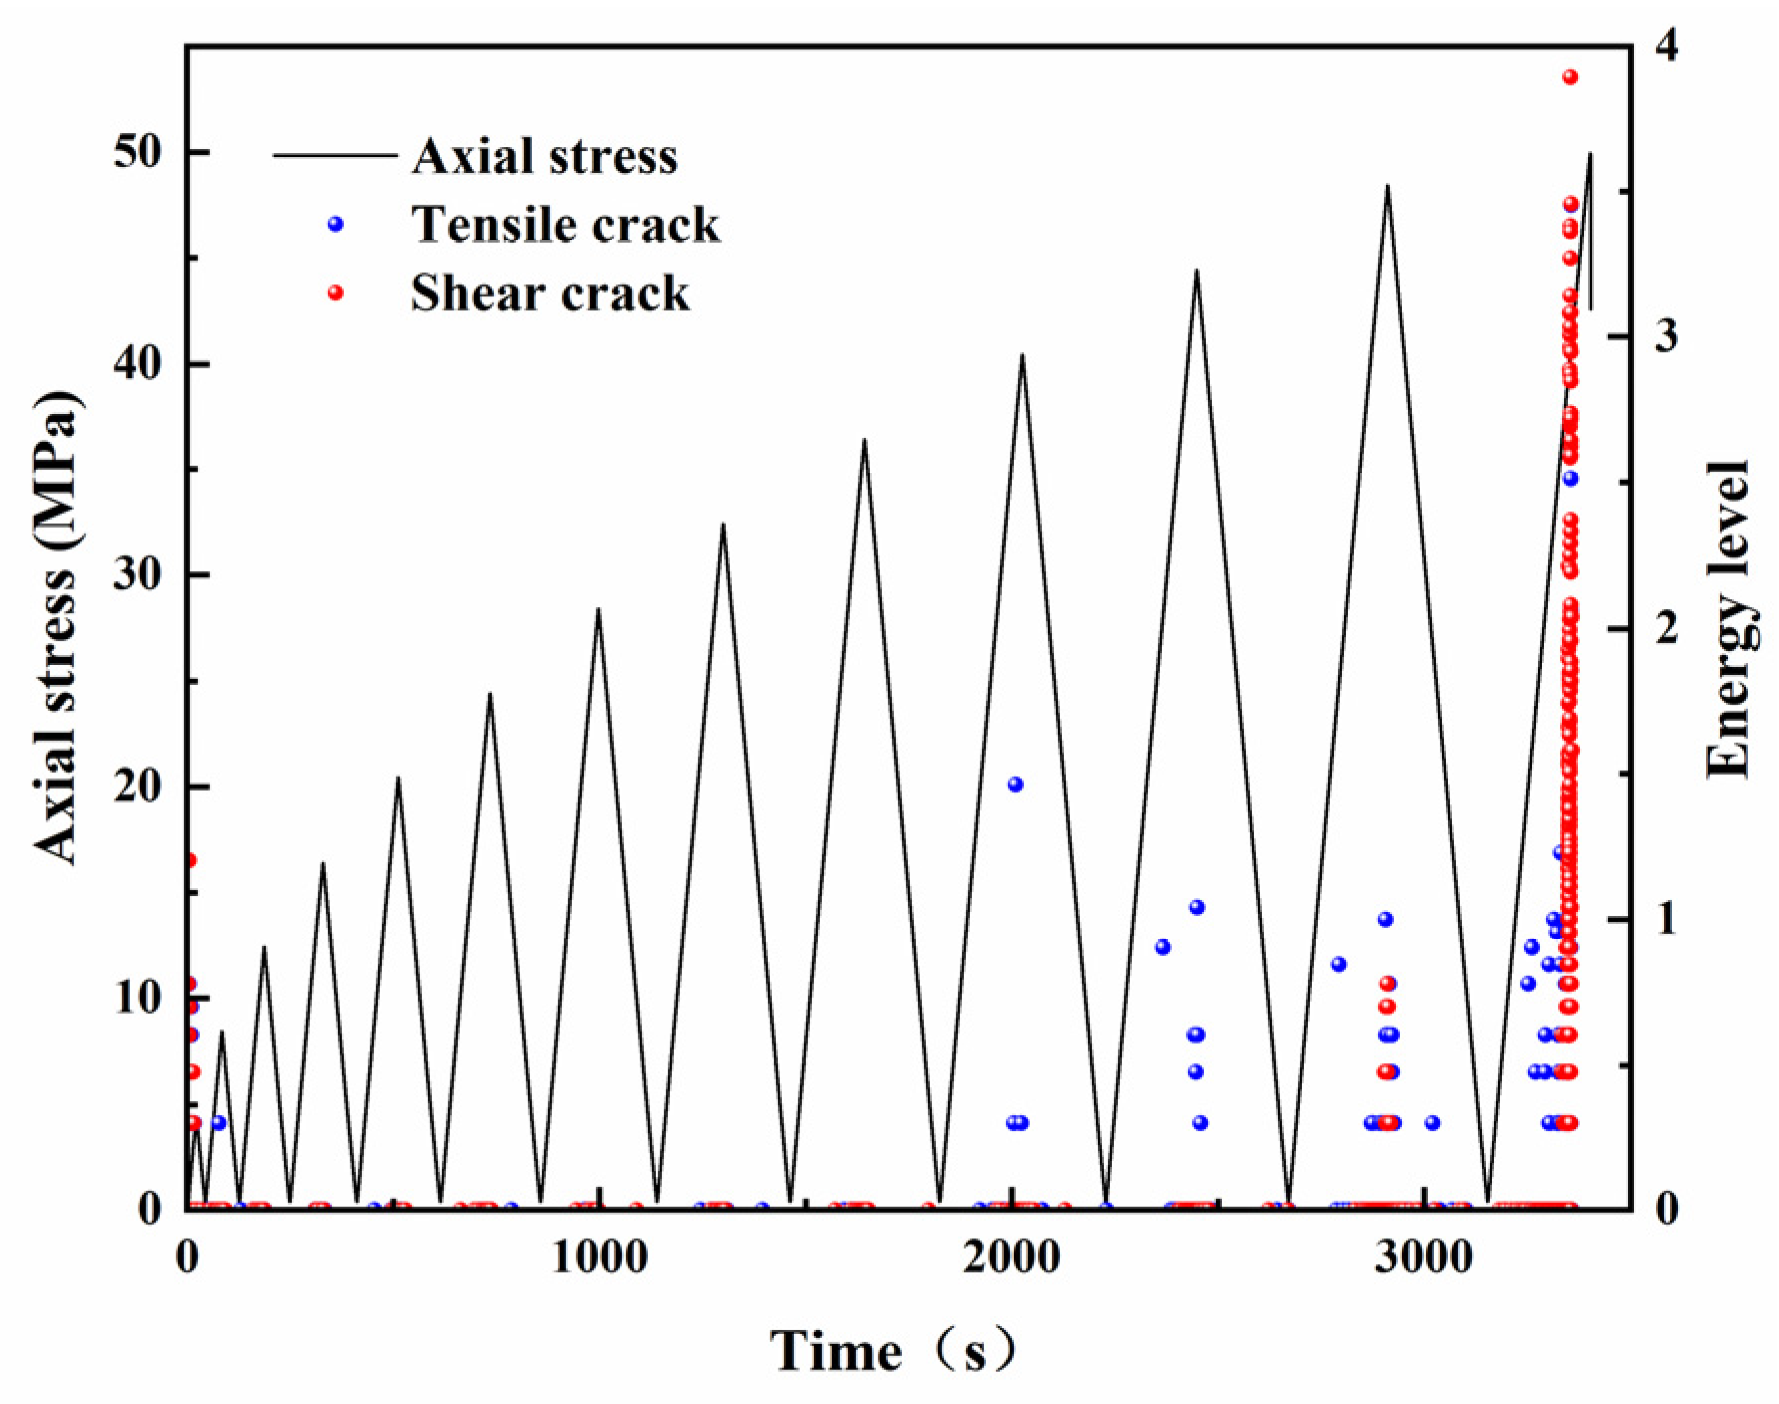
Figure 14 illustrates the changes in energy levels of shear and tensile cracks during the failure process of sandstone. From the figure, it can be observed that during the compaction stage of pre-existing microcracks, the energy level of shear cracks shows a certain upward trend, while the energy level of tensile cracks has almost no signal, indicating that shear cracks dominate during the compaction stage. As the material enters the linear elastic stage, there are no signals for either tensile or shear crack energy levels, suggesting no damage occurs in this phase. When entering the stable crack propagation stage, the energy level of tensile cracks begins to show signals, with some points reaching an energy level of 1.5, while the energy level of shear cracks is almost zero, indicating that tensile cracks dominate in this stage. In the unstable crack propagation stage, shear crack energy levels start to show signals but are lower compared to tensile crack energy levels, so tensile cracks still dominate. Upon reaching the peak stage, the energy level of shear cracks increases dramatically, with the highest level reaching 4, while the energy level of tensile cracks is lower and the number of signals is also lower. Concurrently, experiments have found that multiple shear fracture surfaces occur at the moment of failure, with shear cracks dominating. From these observations, it is found that before failure, the energy level is almost below 2, but at the time of failure, the energy level reaches 4. Therefore, this phenomenon can be used as a precursor to rock failure.
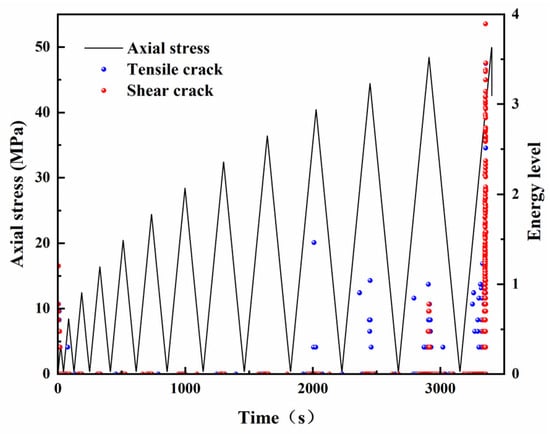
Figure 14.
Characterization of the temporal evolution of sandstone rupture.
5. Deformation and Fracture Analysis
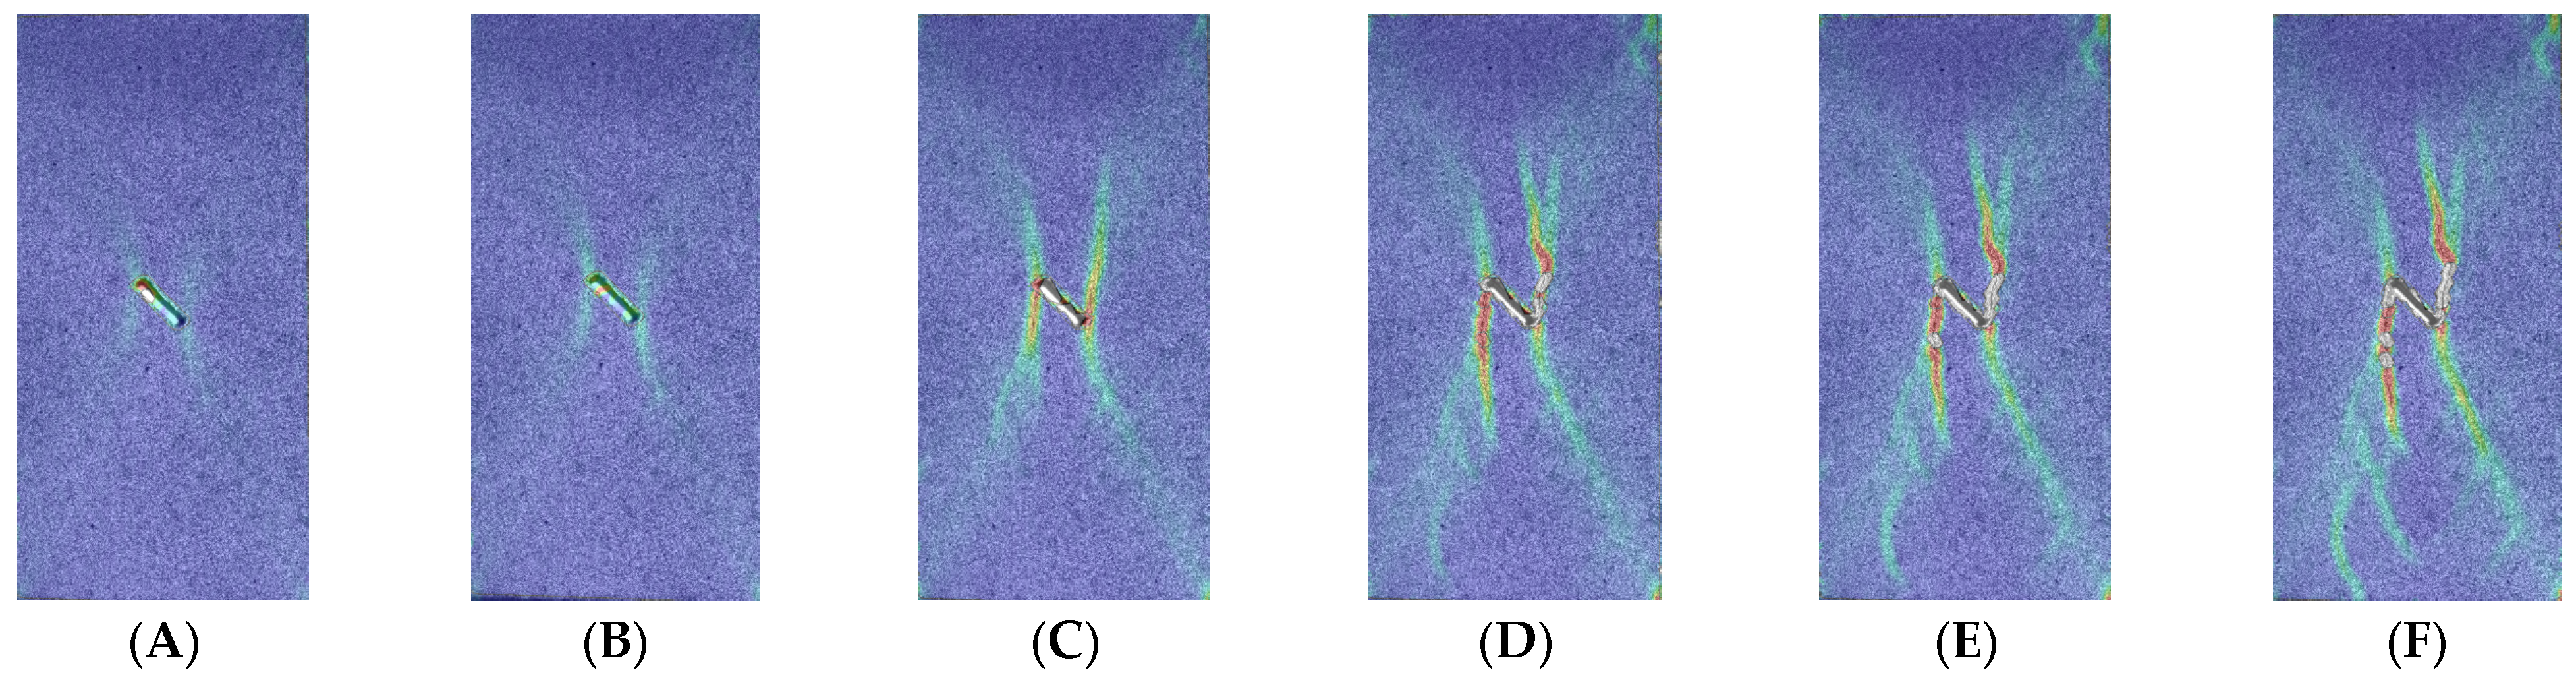
Monitoring the deformation of 45° sandstone during the loading process was conducted using a CCD camera, and the deformation field on the surface of the sandstone was later calculated using software. The results can be seen in Figure 15. The deformation is primarily concentrated in the final loading stage, hence six monitoring points from the last loading curve were selected for analysis.
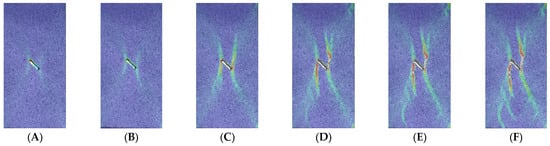
Figure 15.
Sandstone deformation cloud map.
From Figure 15, it can be observed that, at point A, there are small deformations at the four directions of the tips of the pre-existing crack. As the load increases to point B, the deformation increases, with the deformation primarily concentrated at the tips of the pre-existing crack. At point C, the deformation further increases, and wing cracks are generated at the tips of the pre-existing crack.
When approaching the peak load at points D, E, and F, significant deformations become apparent. The deformation develops from the tips of the pre-existing crack toward the microcracks that have initiated. The upper tip of the pre-existing crack deforms downward, while the lower tip deforms upward. Only two macroscopic microcracks develop, and there is also a trend for the lower tip of the pre-existing crack to extend downward. Macroscopic cracks initiate multiple directional deformations at different locations and exhibit gradual spreading, branching, and deflection toward the ends [52].
Under prolonged cyclic loading, rocks may exhibit stress relaxation and creep phenomena, i.e., a decrease in stress with time at a constant strain or an increase in strain with time at a constant stress. Microcracks within the rock may expand and join, leading to damage accumulation and thus affecting the deformation response.
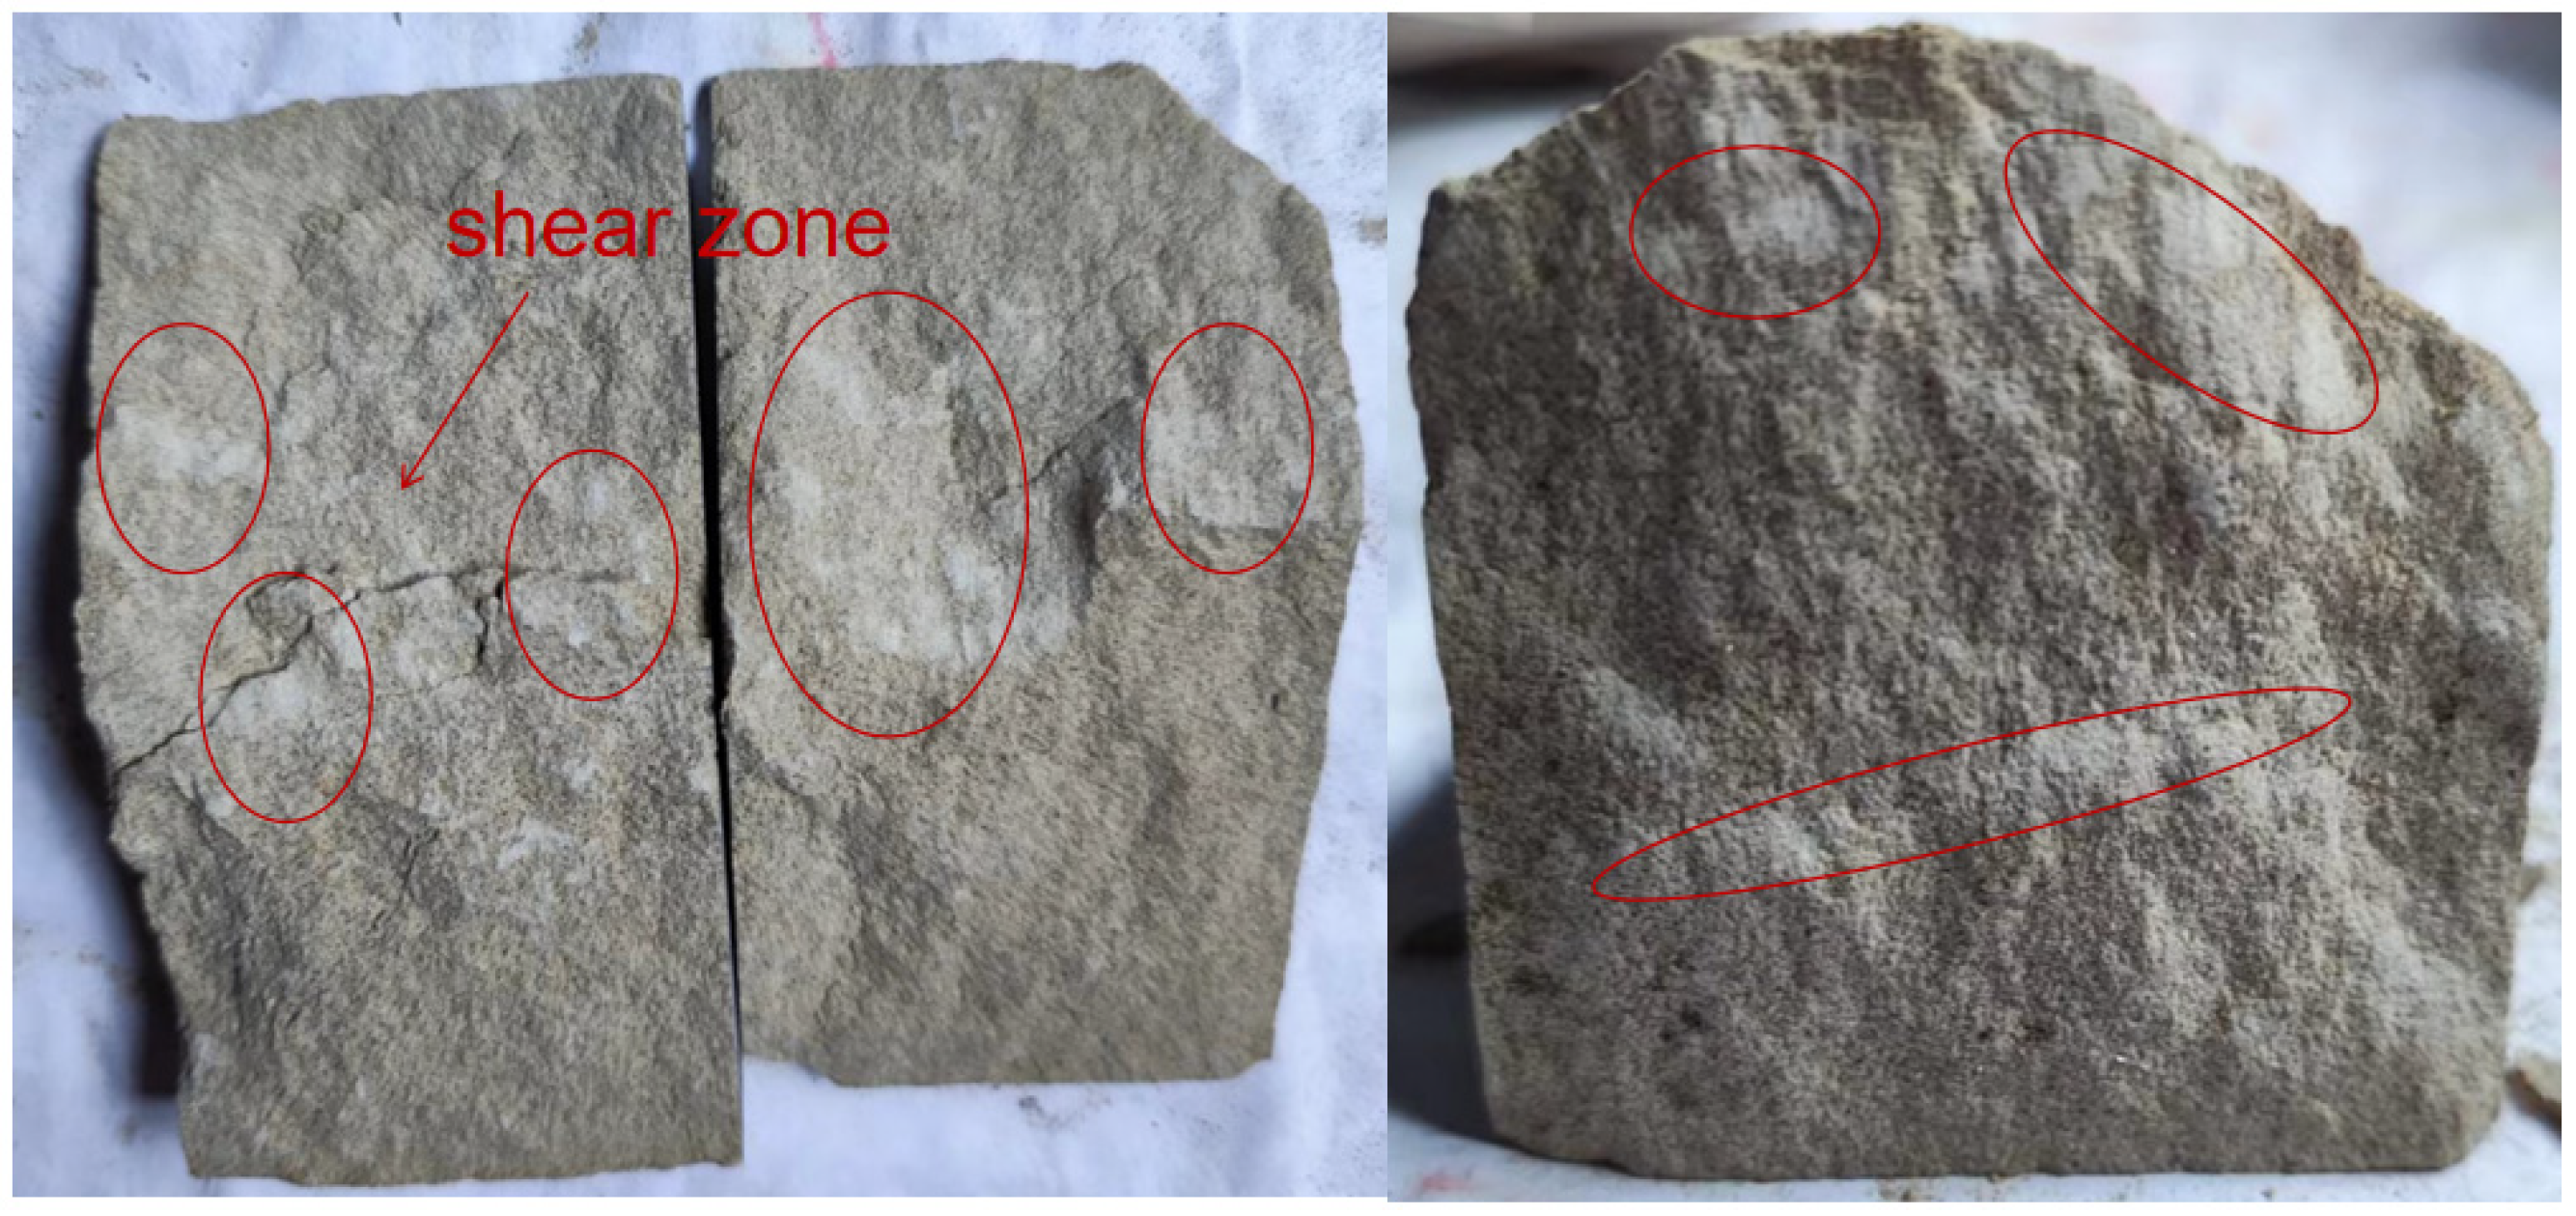
Figure 16 presents the failure surface of 45° sandstone. The red areas in the figure indicate regions where shear failure has occurred, while the remaining areas are primarily characterized by tensile failure. The shear regions are concentrated in the middle of the sandstone, and the tensile failure regions are mainly at the ends of the sandstone. The research also found that the area of the shear region is relatively smaller compared to the tensile region, further indicating that the failure of sandstone is mainly dominated by tensile failure with a greater number of tensile cracks generated internally. Additionally, it was observed that a distinct shear fracture surface appears at the moment the sandstone reaches its peak load, with shear cracks primarily forming at the instant of failure.

Figure 16.
Sandstone damage cross-section.
6. Conclusions
This study conducted cyclic loading and unloading tests on sandstone with a 45° pre-existing fracture, using acoustic emission (AE) and high-speed cameras to monitor the changes in the sandstone. The following conclusions were drawn from the mechanical parameters, energy, AE precursors of failure, AE fracture instability, and local deformation characteristics of the sandstone:
- (1)
- As the cyclic load level increases, both the elastic modulus and deformation modulus exhibit a “parabolic” increase, with a rapid increase at the beginning and a slower rate of increase later on. The damping ratio shows an overall decreasing trend but increases near the peak load, fluctuating between 2.5% and 3.0%.
- (2)
- Based on the dissipation energy theory, it was found that the total energy, elastic energy, dissipation energy, damping energy, and damage energy all follow exponential function increases with the load level. Moreover, there are sudden increases in dissipation energy and damage energy during the final loading and unloading stage. Additionally, the proportion of elastic energy increases first and then decreases following a “quadratic parabolic” pattern with the cyclic load level, while the proportion of dissipation energy shows the opposite trend.
- (3)
- The number of AE hits and AE energy show sudden increases during the peak stage. By calculating the b-value, three early warning points were identified during the stable crack propagation stage, unstable crack propagation stage, and peak stage. The second warning point is the best predictor for rock instability and failure. When the , the rock is relatively stable; when the , the rock gradually moves toward an unstable state. The Felicity ratio can be used as a predictive tool for rock failure.
- (4)
- Shear cracks dominate during the compaction stage and peak stage, with a sudden increase in shear crack energy level at the peak point, while tensile cracks dominate during the crack propagation stage. Through calculations, it was found that tensile cracks account for 56%, which is higher than shear cracks, indicating tensile failure. Additionally, the CCD high-speed camera revealed that deformation first occurs at the tips of the pre-existing cracks and gradually spreads and deflects toward the ends of the sandstone.
- (5)
- Through cyclic loading and unloading tests, engineers can optimize design parameters, enhance the fatigue resistance of structures, reduce maintenance costs, and extend service life. This has a positive impact on the efficient use of resources and the reduction of waste production, aligning with the principles of sustainable development. Moreover, it aids in the development and evaluation of new materials and technologies, such as high-performance concrete and composite materials, which may offer better fatigue resistance and lower environmental impact, thereby promoting energy conservation and emission reduction.
Author Contributions
Conceptualization, K.S. and X.X.; methodology, K.S. and X.X.; software, K.S.; validation, K.S., X.X. and Y.S.; formal analysis, K.S.; investigation, K.S. and Y.S.; resources, K.S. and X.X.; writing—original draft preparation, K.S.; writing—review and editing, X.X.; supervision, X.X.; project administration, X.X. All authors have read and agreed to the published version of the manuscript.
Funding
This research was funded by Guangxi Key Research and Development Program No. AB18294004.
Institutional Review Board Statement
Not applicable.
Informed Consent Statement
Not applicable.
Data Availability Statement
The data presented in this study are available upon request from the corresponding author. If any researcher is in need of the data and codes, Email: 215512076@csu.edu.cn.
Conflicts of Interest
The authors declare no conflicts of interest.
References
- Xiao, F.; Jiang, D.Y.; Wu, F.; Zou, Q.L.; Chen, J.; Chen, B.; Sun, Z.G. Effects of prior cyclic loading damage on failure characteristics of sandstone under true-triaxial unloading conditions. Int. J. Rock Mech. Min. Sci. 2020, 132, 104379. [Google Scholar] [CrossRef]
- Hou, W.T.; Ma, D.; Li, Q.; Zhang, J.X.; Liu, Y.; Zhou, C.Y. Mechanical and hydraulic properties of fault rocks under multi-stage cyclic loading and unloading. Int. J. Coal Sci. Technol. 2023, 10, 54. [Google Scholar] [CrossRef]
- Meng, Q.B.; Zhang, M.W.; Han, L.J.; Pu, H.; Nie, T.Y. Effects of Acoustic Emission and Energy Evolution of Rock Specimens Under the Uniaxial Cyclic Loading and Unloading Compression. Rock Mech. Rock Eng. 2016, 49, 3873–3886. [Google Scholar] [CrossRef]
- Wang, Y.; Tang, P.F.; Han, J.Q.; Li, P. Energy-driven fracture and instability of deeply buried rock under triaxial alternative fatigue loads and multistage unloading conditions: Prior fatigue damage effect. Int. J. Fatigue 2023, 168, 107410. [Google Scholar] [CrossRef]
- Chen, J.; Du, C.; Jiang, D.Y.; Fan, J.Y.; He, Y. The mechanical properties of rock salt under cyclic loading-unloading experiments. Geomech. Eng. 2016, 10, 325–334. [Google Scholar] [CrossRef]
- Li, X.J.; He, P.J.; Tang, J.H.; Chen, X.D. Experimental and numerical studies on fracture characteristics of notched granite beams under cyclic loading and unloading. J. Strain Anal. Eng. Des. 2021, 56, 3–17. [Google Scholar] [CrossRef]
- Zhou, J.W.; Yang, X.G.; Fu, W.X.; Xu, J.; Li, H.T.; Zhou, H.W.; Liu, J.F. Experimental test the and fracture damage mechanical characteristics of brittle rock under uniaxial cycle loading and unloading conditions. Chin. J. Rock Mech. Eng. 2010, 29, 1172–1183. [Google Scholar]
- Li, J.T.; Xiao, F.; Ma, Y.P. Deformation damage and energy evolution of red sandstone under uniaxial cyclic loading and unloading. J. Hunan Univ. Nat. Sci. 2020, 47, 139–146. [Google Scholar]
- Shi, Z.M.; Li, J.T.; Wang, J. Research on the fracture mode and damage evolution model of sandstone containing pre-existing crack under different stress paths. Eng. Fract. Mech. 2022, 264, 108299. [Google Scholar] [CrossRef]
- Erarslan, N.; Williams, D.J. Investigating the Effect of Cyclic Loading on the Indirect Tensile Strength of Rocks. Rock Mech. Rock Eng. 2012, 45, 327–340. [Google Scholar] [CrossRef]
- Erarslan, N.; Williams, D.J. Mixed-Mode Fracturing of Rocks Under Static and Cyclic Loading. Rock Mech. Rock Eng. 2013, 46, 1035–1052. [Google Scholar] [CrossRef]
- Fan, J.; Jiang, D.; Liu, W.; Wu, F.; Chen, J.; Daemen, J.J.K. Discontinuous fatigue of salt rock with low-stress intervals. Int. J. Rock Mech. Min. Sci. Géoméch. Abstr. 2019, 115, 77–86. [Google Scholar] [CrossRef]
- Meng, Q.B.; Zhang, M.W.; Han, L.J.; Pu, H.; Chen, Y.L. Acoustic Emission Characteristics of Red Sandstone Specimens Under Uniaxial Cyclic Loading and Unloading Compression. Rock Mech. Rock Eng. 2018, 51, 969–988. [Google Scholar] [CrossRef]
- Zhao, K.; Zhang, L.; Yang, D.X.; Jin, J.F.; Zeng, P.; Wang, X.; Ran, S.H.; Deng, D.M. Cyclic impact damage and water saturation effects on mechanical properties and Kaiser effect of red sandstone under uniaxial cyclic loading and unloading compression. Rock Mech. Rock Eng. 2024, 57, 181–195. [Google Scholar] [CrossRef]
- Tang, J.H.; Chen, X.D.; Dai, F.; Wei, M.D. Experimental investigation of fracture damage of notched granite beams under cyclic loading using DIC and AE techniques. Fatigue Fract. Eng. Mater. Struct. 2020, 43, 1583–1596. [Google Scholar] [CrossRef]
- Gao, M.T.; Yan, H.Y.; Duan, H.Q.; Xiong, S. Experimental Study on Coal Specimens Subjected to Uniaxial Cyclic Loading and Unloading. Appl. Sci. 2022, 12, 11810. [Google Scholar] [CrossRef]
- Shen, R.X.; Chen, T.Q.; Li, T.X.; Li, H.R.; Fan, W.J.; Hou, Z.H.; Zhang, X. Study on the effect of the lower limit of cyclic stress on the mechanical properties and acoustic emission of sandstone under cyclic loading and unloading. Theor. Appl. Fract. Mech. 2020, 108, 102661. [Google Scholar] [CrossRef]
- Shi, Z.M.; Li, J.T.; Wang, J. Effect of creep load on fatigue behavior and acoustic emission characteristics of sandstone containing pre-existing crack during fatigue loading. Theor. Appl. Fract. Mech. 2022, 119, 103296. [Google Scholar] [CrossRef]
- Xie, Y.C.; Hou, M.Z.; Li, C.B. Anisotropic characteristics of acoustic emission and the corresponding multifractal spectrum during progressive failure of shale under cyclic loading. Int. J. Rock Mech. Min. Sci. 2023, 165, 105364. [Google Scholar] [CrossRef]
- Song, X.P.; Huang, Y.C.; Wang, S.; Yu, H.G.; Hao, Y.X. Macro-mesoscopic mechanical properties and damage progression of cemented tailings backfill under cyclic static load disturbance. Compos. Struct. 2023, 322, 117433. [Google Scholar] [CrossRef]
- Wang, Y.; Meng, H.J.; Long, D.Y. Experimental investigation of fatigue crack propagation in interbedded marble under multilevel cyclic uniaxial compressive loads. Fatigue Fract. Eng. Mater. Struct. 2020, 44, 933–951. [Google Scholar] [CrossRef]
- Lv, H.; Peng, K.; Shang, X.Y.; Wang, Y.Q.; Liu, Z.P. Experimental research on the mechanical and acoustic emission properties of layered sandstone during tensile failure. Theor. Appl. Fract. Mech. 2022, 118, 103225. [Google Scholar] [CrossRef]
- Xie, H.X.; Li, X.H.; Shan, C.H.; Xia, Z.; Yu, L.Q. Study on the Damage Mechanism and Energy Evolution Characteristics of Water-Bearing Coal Samples Under Cyclic Loading. Rock Mech. Rock Eng. 2022, 56, 1367–1385. [Google Scholar] [CrossRef]
- Wang, Z.S.; Yang, Y.; Xu, Y.; Xin, C.H.; Liang, P.F.; Guo, N. Analysis of Energy Evolution and Acoustic Emission Characteristics of Rocks under Cyclic Loading and Unloading. Appl. Sci. 2023, 13, 10453. [Google Scholar] [CrossRef]
- Gong, F.Q.; Zhang, P.L.; Du, K. A Novel Staged Cyclic Damage Constitutive Model for Brittle Rock Based on Linear Energy Dissipation Law: Modelling and Validation. Rock Mech. Rock Eng. 2022, 55, 6249–6262. [Google Scholar] [CrossRef]
- Li, J.L.; Hong, L.; Zhou, K.P.; Xia, C.C.; Zhu, Y.L. Influence of Loading Rate on the Energy Evolution Characteristics of Rocks under Cyclic Loading and Unloading. Energies 2020, 13, 4003. [Google Scholar] [CrossRef]
- Meng, Q.B.; Liu, J.F.; Pu, H.; Huang, B.X.; Zhang, Z.Z.; Wu, J.Y. Effects of cyclic loading and unloading rates on the energy evolution of rocks with different lithology. Geomech. Energy Environ. 2023, 34, 100455. [Google Scholar] [CrossRef]
- Liu, D.W.; Jiang, S.L.; Tang, Y. Mechanical Properties of Metasandstone under Uniaxial Graded Cyclic Loading and Unloading. Appl. Sci. 2022, 12, 6310. [Google Scholar] [CrossRef]
- Niu, S.L.; Ge, S.S.; Yang, D.F.; Dang, Y.H.; Yu, J.; Zhang, S. Mechanical properties and energy mechanism of saturated sandstones. J. Cent. South Univ. 2018, 25, 1447–1463. [Google Scholar] [CrossRef]
- Li, J.L.; Zhu, L.Y.; Zhou, K.P.; Liu, H.W.; Cao, S.P. Damage characteristics of sandstone pore structure under freeze-cycles. Rock Soil Mech. 2019, 40, 3524–3532. [Google Scholar]
- He, Y.D.; Mao, Z.Q.; Xiao, L.Z.; Zhang, Y.Z. A new method for obtain capillary pressure curves by using NMR T2 distribution. J. Jilin Univ. 2005, 35, 177–181. [Google Scholar]
- Yan, J.P.; Wen, D.N.; Li, Z.Z.; Geng, B.; Cai, J.G.; Ling, Q.; Yun, Y. The Quantitative evaluation method of low permeable sandstone pore structure based on nuclear magnetic resonance(NMR) logging. Chin. J. Geophys. 2016, 59, 1543–1552. [Google Scholar]
- Wang, H. Mechanical Properties and Fatigue Constitutive Model of Argillaceous Quartz Siltstone under Cyclic Loading; University of Science and Technology Beijing: Beijing, China, 2023. [Google Scholar]
- Li, X.W.; Yao, Z.S.; Huang, X.W.; Liu, Z.X.; Zhao, X.; Mu, K.H. Investigation of deformation and failure characteristics and energy evolution of sandstone cyclic loading and unloading. Rock Soil Mech. 2021, 42, 1693–1704. [Google Scholar]
- He, M.M.; Li, N.; Chen, Y.S.; Zhu, C.H. Damping ratio and damping coefficient of rock under different cyclic loading conditions. Rock Soil Mech. 2017, 38, 2531–2538. [Google Scholar]
- Liu, H.X.; Bie, P.F.; Li, X.; Wei, Y.S.; Wang, M.X. Mechanical properties and energy dissipation characteristics of phyllite under triaxial multi-stage cyclic loading and unloading conditions. Rock Soil Mech. 2022, 43, 265–274+281. [Google Scholar]
- Li, C.; Mo, P.Q.; Li, S.C. Stability analysis of energy dissipation mechanisms in rocks surrounding circular opening. Appl. Math. Model. 2024, 127, 327–342. [Google Scholar] [CrossRef]
- Gao, F.; Cao, S.P.; Zhou, K.P.; Lin, Y.; Zhou, L.Y. Damage characteristics and energy-dissipation mechanism of frozen-thawed sandstone subjected to loading. Cold Reg. Sci. Techol. 2020, 169, 102920. [Google Scholar] [CrossRef]
- Zhu, X.H.; Liu, W.J. The rock fragmentation mechanism and plastic energy dissipation analysis of rock indentation. Geomech. Eng. 2018, 16, 195–204. [Google Scholar]
- Liu, Z.Y.; Dong, X.; Zhang, X.Y. Experimental study on mechanical properties of bedding coal and rock under graded cyclic loading. Chin. J. Rock Mech. Eng. 2021, 40, 2593–2602. [Google Scholar]
- Huang, H.; Huang, K.; Zhang, X.C.; Han, L.W. Hysteresis and damping effect of cemented sand and gravel materials under cyclic loading. J. Build. Mater. 2018, 21, 739–748. [Google Scholar]
- Xiao, J.Q.; Feng, X.T.; Ding, D.X.; Xia, F.L. Study of hysteresis and damping effects of rock subjected to constant amplitude cyclic loading. Chin. J. Rock Mech. Eng. 2010, 29, 1677–1683. [Google Scholar]
- Luo, Y.; Gong, H.L.; Xu, K.; Pei, C.H.; Wei, X.Q.; Li, X.P. Progressive failure characteristics and energy accumulation of granite with a pre-fabricated fracture during conventional triaxial loading. Theor. Appl. Fract. Mech. 2022, 118, 103219. [Google Scholar] [CrossRef]
- Wang, Z.L.; Li, S.Y.; Wang, J.G.; Xiong, F.; Xie, L.X. Mechanical behavior, mesoscopic properties and energy evolution of deeply buried marble during triaxial loading. Int. J. Damage Mech. 2022, 31, 1592–1612. [Google Scholar] [CrossRef]
- Zhang, Z.P.; Zhang, R.; Xie, H.P.; Liu, J.F.; Were, P. Differences in the acoustic emission characteristics of rock salt compared with granite and marble during the damage evolution process. Environ. Earth Sci. 2015, 73, 6987–6999. [Google Scholar] [CrossRef]
- Zhang, Y.; Chen, G.Q.; Wang, Z.F.; Liu, D. Fracture Evolution Analysis of Rock Bridges in Hard Rock with Nonparallel Joints in True Triaxial Stress States. Rock Mech. Rock Eng. 2022, 56, 997–1023. [Google Scholar] [CrossRef]
- Bi, J.; Zhao, Y.; Wu, Z.J.; Li, J.S.; Wang, C.L. Research on crack classification method and failure precursor index based on RA-AF value of brittle rock. Theor. Appl. Fract. Mech. 2024, 129, 104179. [Google Scholar] [CrossRef]
- Chen, Y.; Yang, J.F.; Li, M.H.; Zhou, L.; Guo, B.H.; Zuo, J.P. Effects of roughness on shear properties and acoustic emission characteristics of bonded Rock-Concrete interfaces. Constr. Build. Mater. 2023, 398, 132405. [Google Scholar] [CrossRef]
- Sagasta, F.; Zitto, M.E.; Piotrkowski, R.; Benavent-Climent, A.; Surare, E.; Gallego, A. Acoustic emission energy b-value for local damage evaluation in reinforced concrete structures subjected to seismic loadings. Mech. Syst. Signal Process. 2018, 102, 262–277. [Google Scholar] [CrossRef]
- Rao, M.V.M.S.; Lakshmi, K.J.P. Analysis of b-value and improved b-value of acoustic emissions accompanying rock fracture. Curr. Sci. 2005, 89, 1577–1582. [Google Scholar]
- Dong, L.; Zhang, L.Y. Error Analysis of b-value of Acoustic Emission for Rock Fracture. J. Yangtze River Sci. Res. Inst. 2018, 21, 739–748. [Google Scholar]
- Shi, Z.M.; Li, J.T.; Wang, J.; Chen, J.C. Fracture behavior and damage evolution model of sandstone containing a single pre-existing flaw under discontinuous fatigue loading. Int. J. Damage Mech. 2023, 32, 3–27. [Google Scholar] [CrossRef]


Disclaimer/Publisher’s Note: The statements, opinions and data contained in all publications are solely those of the individual author(s) and contributor(s) and not of MDPI and/or the editor(s). MDPI and/or the editor(s) disclaim responsibility for any injury to people or property resulting from any ideas, methods, instructions or products referred to in the content. |
© 2024 by the authors. Licensee MDPI, Basel, Switzerland. This article is an open access article distributed under the terms and conditions of the Creative Commons Attribution (CC BY) license (https://creativecommons.org/licenses/by/4.0/).